10/11/16
1
Presentation to Executive Appropriations Committee
October 18, 2016
Utah Department of Corrections
Utah Correctional Population Overview
• Utah’s incarcerated population
• Offenders supervised in the community by AP&P
• Jail Contracting Population
• 2017 Jail Contracting Rate
10/11/16
2
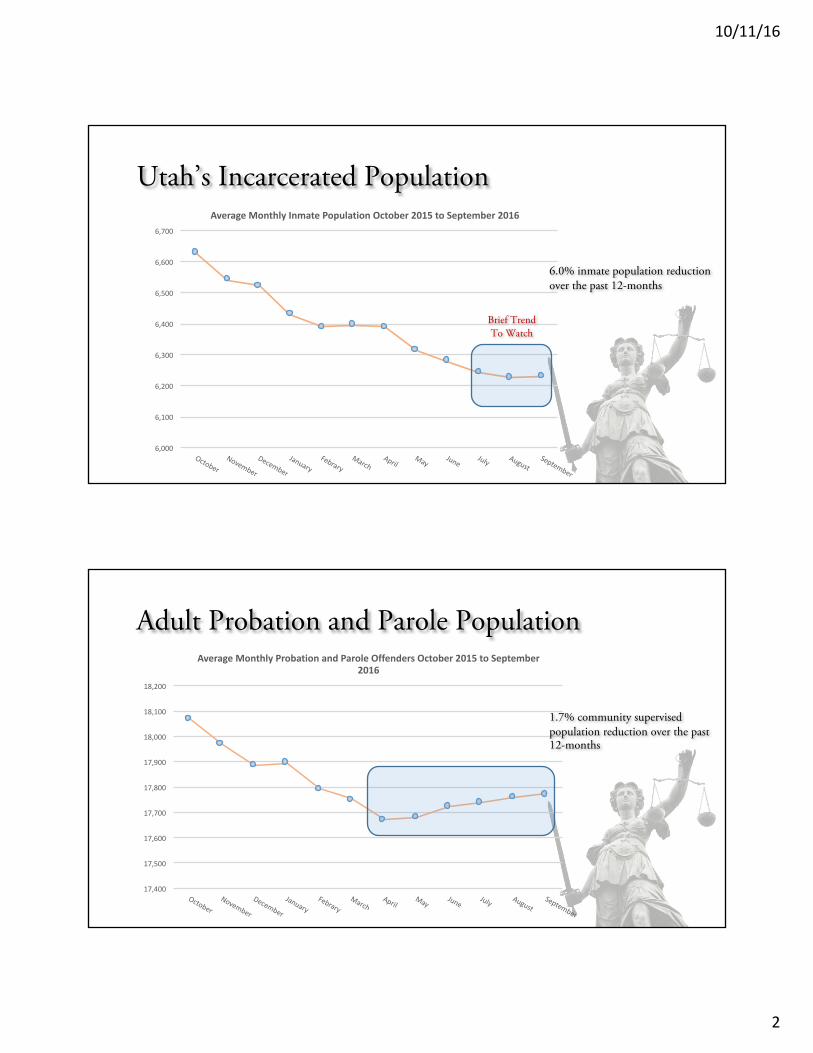
Utah’s Incarcerated Population
6,000
6,100
6,200
6,300
6,400
6,500
6,600
6,700
AverageMonthlyInmatePopulationOctober2015toSeptember2016
6.0% inmate population reduction over the past 12-months
Brief TrendTo Watch
Adult Probation and Parole Population
17,400
17,500
17,600
17,700
17,800
17,900
18,000
18,100
18,200
AverageMonthlyProbationandParoleOffendersOctober2015toSeptember2016
1.7% community supervised population reduction over the past 12-months
10/11/16
3
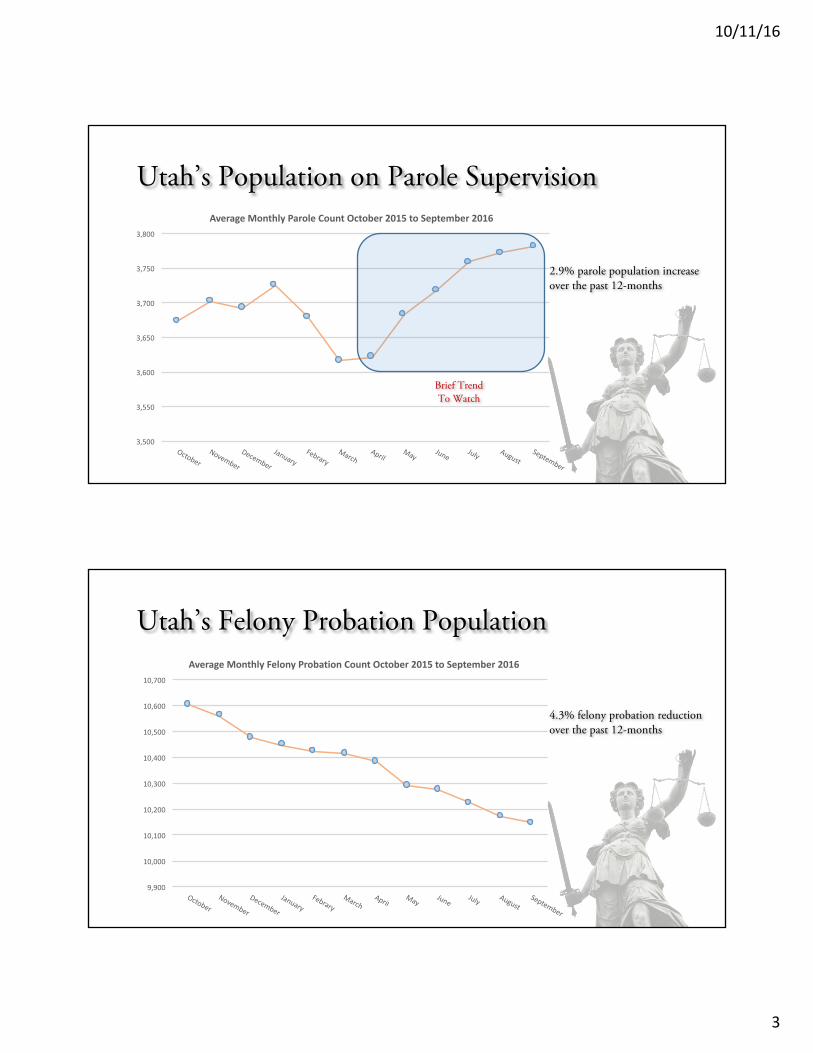
Utah’s Population on Parole Supervision
3,500
3,550
3,600
3,650
3,700
3,750
3,800
AverageMonthlyParoleCountOctober2015toSeptember2016
2.9% parole population increase over the past 12-months
Brief TrendTo Watch
Utah’s Felony Probation Population
9,900
10,000
10,100
10,200
10,300
10,400
10,500
10,600
10,700
AverageMonthlyFelonyProbationCountOctober2015toSeptember2016
4.3% felony probation reduction over the past 12-months

10/11/16
4
Utah’s Class A Misdemeanor Probationers
2,100
2,150
2,200
2,250
2,300
2,350
2,400
2,450
2,500
2,550
AverageMonthlyClassAProbationCountOctober2015toSeptember2016 10.8% Class A Misdemeanant
increase over the past 12-months
54% of the reduction in felony probationers are off-set by the increase in Class A Misdemeanants
Jail Contracting Population
600
800
1,000
1,200
1,400
1,600
1,800
AverageJailContractingFY2010toFY2016

10/11/16
5
FY2018 Jail Contracting Rate
• Statute, 64-13e-105 outlines the process for establishing the final state daily incarceration rate. It includes a 3-year average of the most recent three years.
• The rate paid for contract beds that do not provide programming is set at 73% of the final state daily incarceration rate.
• The rate paid for contract beds that do provide programming is set at 86% of the final state daily incarceration rate.
FY2018 Jail Contracting Rate
• The following dollar amounts are the critical numbers for establishing the new rate moving in to 2018
• FY14 Cost Per Day = $81.30• FY15 Cost Per Day = $83.79• FY16 Cost Per Day = $93.39
• Average Calculation
• $81.30 + $83.79 + 93.39 / 3 years = $86.16(which becomes the final state daily incarceration rate)
10/11/16
6
FY2018 Jail Contracting Rate
• Contract beds with no programming services are paid 73% of the final state daily incarceration rate
• $86.16 x 0.73 (73%) = $62.90 per bed day
• Contract beds with programming services are paid 86% of the final state daily incarceration rate
• $86.16 x 0.86 (86%) = $74.10 per bed day
Questions