Using the UK reference population Avalon 3 Cadenzaas a platform to compare breeding strategies in eliteWestern European bread wheat
Juan Ma • Luzie U. Wingen • Simon Orford •
Paul Fenwick • Jiankang Wang • Simon Griffiths
Received: 9 May 2014 / Accepted: 15 September 2014
� The Author(s) 2015. This article is published with open access at Springerlink.com
Abstract Wheat breeders select for qualitative and
quantitative traits, the latter often detected as quanti-
tative trait loci (QTL). It is, however, a long procedure
from QTL discovery to the successful introduction of
favourable alleles into new elite varieties and finally
into farmers’ crops. As a proof of principle for this
process, QTL for grain yield (GY), yield components,
plant height (PH), ear emergence (EM), solid stem (SS)
and yellow rust resistance (Yr) were identified in
segregating UK bread wheat reference population,
Avalon 9 Cadenza. Among the 163 detected QTL
were several not reported before: 17 for GY, the major
GY QTL on 2D; a major SS QTL on 3B; and Yr6 on 7B.
Common QTL were identified on ten chromosomes,
most interestingly, grain number (GN) was found to be
associated with Rht-D1b; and GY and GN with a
potential new allele of Rht8. The interaction of other
QTL with GY and yield components was discussed in
the context of designing a UK breeding target geno-
type. Desirable characteristics would be: similar PH
and EM to Avalon; Rht-D1b and Vrn-A1b alleles; high
TGW and GN; long and wide grains; a large root
system, resistance to diseases; and maximum GY. The
potential of the identified QTL maximising transgres-
sive segregation to produce a high-yielding and
resilient genotype was demonstrated by simulation.
Moreover, simulating breeding strategies with F2
enrichment revealed that the F2–DH procedure was
superior to the RIL and the modified SSD procedure to
achieve that genotype. The proposed strategies of
parent selection and breeding methodology can be used
as guidance for marker-assisted wheat breeding.
Keywords Phenotype prediction � Simulation �QTL
linkage � Pleiotropy � Breeding by design
Abbreviations
GY Grain yield
TGW Thousand grain weight
GN Grain number
GRW Grain width
GRL Grain length
EM Ear emergence
PH Plant height
Electronic supplementary material The online version ofthis article (doi:10.1007/s11032-015-0268-7) contains supple-mentary material, which is available to authorized users.
J. Ma � J. Wang
Institute of Crop Science, The National Key Facility for
Crop Gene Resources and Genetic Improvement, and
CIMMYT China, Chinese Academy of Agricultural
Sciences, No. 12 Zhongguancun South Street,
Beijing 100081, China
J. Ma � L. U. Wingen � S. Orford � S. Griffiths (&)
John Innes Centre, Norwich Research Park,
Norwich NR4 7UH, UK
e-mail: [email protected]
P. Fenwick
Limagrain UK Limited, Rothwell, Market Rasen,
Lincolnshire LN7 6DT, UK
123
Mol Breeding (2015) 35:70
DOI 10.1007/s11032-015-0268-7
SS Solid stem
TRL Total root length
TRSA Total root surface area
SDW Shoot dry weight
Yr Yellow rust resistance
QTL Quantitative trait loci
MAS Marker-assisted selection
PVE Phenotypic variance explanation
QEI QTL-by-environment interaction
Introduction
Wheat breeders select simultaneously for qualitative
traits controlled by one or a small number of major
genes and quantitative traits controlled by multiple
genes which may be detected as quantitative trait loci
(QTL). There are many complex choices to be made,
from the selection of the best parents for a cross
through to selection strategies that result in combining
multiple desired alleles into a single target genotype,
all at minimum cost to the breeding programme. It is
therefore a lengthy procedure from gene discovery to
superior varieties in farmers’ fields. Grain yield (GY)
improvement is the main objective in wheat breeding
programmes. On the whole, GY improvement is
achieved by selecting and crossing high yielding lines.
In the UK, an increase of yields from 3 t/ha in 1950s to
7.4 t/ha in 2013 have been achieved, largely through
this approach (http://archive.defra.gov.uk/foodfarm/
landmanage/climate/documents/climate-ag.pdf; https://
www.gov.uk/government/publications/agriculture-in-
the-united-kingdom-2013). However, the on-farm GY
is below the potential shown under perfect conditions,
where GY of more than 10 t/ha are possible. In order
to create more resilient varieties, which perform better
under on-farm conditions, more diverse breeding tar-
gets are needed, which will need more genetic input in
order to achieve them. The UK reference population
Avalon 9 Cadenza was developed as a tool for the
genetic improvement of wheat, as part of the Wheat
Genetic Improvement Network (WGIN) (http://www.
wgin.org.uk/). The Avalon 9 Cadenza segregating
population represents a broad spectrum of elite UK
winter germplasm produced in different UK wheat
breeding programmes. The population has been
widely used to assess multiple traits via QTL analysis
such as: grain size and shape (Gegas et al. 2010), plant
height (PH) (Griffiths et al. 2012), flowering time
(Griffiths et al. 2009), root system (Bai et al. 2013) and
mosaic disease (Bass et al. 2006). The usefulness of
this population is enhanced by the continuous im-
provement of the genetic map, which has now devel-
oped into a very high density map (Allen et al. 2011;
Wang et al. 2014).
GY is a complex trait and is determined by yield
component traits. At the top level, GY is the product of
thousand grain weight (TGW) and grain number (GN).
On the next level, TGW is composed of grain size and
grain width (GRW). Large grain size has been an
important trait selected during domestication and
wheat breeding (Pozzi et al. 2004), but it is GN that
is most strongly associated with genetic gains in GY
(Peltonen-Sainio et al. 2007). GN is determined by GN
per ear and ear per square metre. There is a trade-off
between the increase in GN and the reduction in TGW
(Acreche and Slafer 2006). However, Sinclair and
Jamieson (2006) proposed that it is not GN that
determines GY in wheat, but that GN is the conse-
quence of GY. Fischer (2008) considered that TGW
and GN are linked only by the fact that GN determines
post-anthesis sink size, with possible negative conse-
quences for TGW if source is scarce. Furthermore, the
potential TGW can be influenced by events as early as
1 week before anthesis but also by later events, as
grains can abort after fertilisation (Duggan and Fowler
2006). This leaves possibilities for simultaneous
adjustment of GN and grain size to future conditions
as signalled by conditions around flowering (Fischer
2008). Even so, in order to increase GY potential,
while avoiding the negative relationship between
TGW and GN, it is useful to study trade-offs between
yield components through QTL analysis. Marker-
assisted selection (MAS) for improvement both in
TGW and GN might provide a means to maximise
both traits.
GRW and grain length (GRL) are the major
components of TGW (Breseghello and Sorrells 2006;
Gegas et al. 2010; Okamoto et al. 2013). In particular,
Calderini et al. (2013) proposed that GRL is a key
driver of TGW determination. Therefore, increasing
either or both traits could be a wheat breeding target,
though so far GRL seems to be more responsive trait.
To achieve high yields in the farmers’ fields, more
than just high yield potential, which is determined by
the yield component traits, is needed. Adaptive plant
architecture, such as ideal PH would be another
70 Page 2 of 18 Mol Breeding (2015) 35:70
123
important component. Moreover, flowering time
variation allows wheat cultivars to be adapted to
target environments, and thus to perform more
productively. Again, as with the yield components,
trade-offs between traits may hinder the efforts to
breed ideal genotypes. For example, common QTL for
PH and ear emergence (EM) link early EM with
increased height in the Avalon 9 Cadenza population
(Griffiths et al. 2012). To produce genotypes with
early EM but medium height, potential trade-offs at
these common loci will need to be carefully assessed.
High yield in UK is also dependent on early autumn
drilling, so a successful UK wheat variety needs to be
winter type.
Wheat varieties with greater resilience and produc-
tivity under water-limited growth conditions are also
highly desirable. The plant architecture trait solid stem
(SS) has positive phenotypic correlation with GY
resilience under water stress (Saint Pierre et al. 2010)
and is also known for conferring resistance to wheat
stem sawfly (Houshmand et al. 2003, 2007) and
lodging tolerance (Berry et al. 2007). Breeding SS
varieties could thus effectively reduce yield losses
under stressful environmental conditions.
Conscious selection for root system architecture
has not been a prominent target in winter wheat
breeding programmes. However, larger root systems
contribute to increasing soil exploration and under-
ground water and nutrient acquisition, as well as
facilitating plant adaptation to water-limited environ-
ments where the wheat plant relies largely on seasonal
rainfall (Palta et al. 2011). A number of seedling root
trait QTL in Avalon 9 Cadenza were reported by Bai
et al. (2013). Common QTL for roots and PH were
found on 2D and 4D, the direction of additive effects
was different at both loci, linking height-increasing
effects to reduced root surface or length (Bai et al.
2013). Moreover, a connection between the known
semi-dwarfing genes Rht-B1, Rht-D1, Rht-8 and Rht12
and root proliferation has been found (Bai et al. 2013).
The trade-offs between selection for alleles for
optimal medium PH and their possible adverse effect
on the size of the root system need to be taken care of.
The dense fibrous root system is a difficult trait to be
selected for directly by breeders (Nagel et al. 2009).
Therefore, MAS for root trait QTL promises to help
breeders select these traits more easily.
GY losses due to plant diseases are an increasing
problem in many crops including wheat. Disease
resistance genes may play an important part in GY
protection, but this field is too large to fully cover it
here. With the focus on Avalon 9 Cadenza only, the
resistance loci identified to the best of our knowledge
in this population are mentioned. Yellow rust, caused
by Puccinia striiformis f. sp. tritici, is one of the most
damaging diseases for Northern European wheat.
Breeding resistant cultivars is an economical and
environmentally acceptable approach to control yel-
low rust. The identification of resistance genes and
closely linked molecular makers for MAS is therefore
of great interest. Mosaic disease, caused by soil-borne
cereal mosaic virus (SBCMV), is another serious
constraint to winter wheat production in Europe
(Clover et al. 2001). Cadenza carries the resistance
allele at locus, Sbm1-5D, and available markers for
this disease have been identified (Bass et al. 2006;
Perovic et al. 2009), which could be used to select the
favourable allele via MAS.
Up to now, a large number of QTL for GY, yield
component traits such as GRW, GRL and TGW, and
disease resistance in wheat have been published
(Zhang et al. 2010; Rustgi et al. 2013; Bansal et al.
2014). However, the identified QTL have not been
routinely assessed and included in breeding pro-
grammes. More specifically, a detailed understanding
is needed on how molecular markers can be best
utilised to improve a complex trait. With the increasing
availability of molecular markers and the increased
affordability of genotyping, more and more breeding
researches are dedicated to the exploitation of those
favourable alleles. However, molecular breeding now
faces the problem of integrating QTL findings from
different mapping populations. The QTL method is not
able to account explicitly for segregation of different
allelic combinations among different parents and for
the context dependency of QTL effects. Inconsistency
of QTL findings caused by the context dependency of
QTL effects is due to QTL-by-genetic background
interaction and QTL-by-environment interaction
(QEI). The context-dependency issues of QTL effects
lead to questions about the generalizability of QTL
findings. This means that the usefulness for MAS may
be restricted to cases where target genotype had been
determined separately for each population and the QTL
detection experiments had sampled representative
environments (Sebastian et al. 2010). Fortunately,
molecular marker technology has become cheaper and
faster. Gains per breeding cycle are thus not necessarily
Mol Breeding (2015) 35:70 Page 3 of 18 70
123
greater with MAS than with phenotypic selection, but
the use of molecular markers can increase the genetic
gain per year and per unit cost (Bernardo 2008).
Genetic gain per unit cost and time rather than gain per
cycle should be considered when MAS is applied in
plant breeding. Examples of QTL that have been
successfully used in wheat breeding by MAS include
resistance and grain quality alleles (Anderson et al.
2008; Tyagi et al. 2014). Considering the cost and low
accuracy associated with phenotypic selection, MAS
has potential to improve breeding for complex traits,
even if limited to a specific genetic and environmental
context (Sebastian et al. 2010).
Using QTL information for traits of interest,
including flanking markers, allelic variation and
additive effect can enable breeders to design a superior
genotype combining all favourable alleles at all
selected loci (Peleman and van der Voort 2003). This
so-called breeding by design (Peleman and van der
Voort 2003; Wang et al. 2007a, 2011) has the benefit
that traits do not need to be expressed for selection.
MAS can help to accurately select all loci of interest,
which will be particularly useful for traits that are
difficult to select. Simulation software can provide a
new way to evaluate new genotypes in silico, using
multiple alleles, pleiotropy and epistasis models.
Furthermore, it promises to be particularly helpful to
determine the optimal breeding methods to obtain the
target genotype, thus saving breeding time as well as
field trial costs.
Here, we use the UK reference population Aval-
on 9 Cadenza as proof of concept for achieving
systematic genetic gain in elite UK germplasm. Our
objectives were (1) to use a high-density map to
identify QTL for GY, GN, SS and yellow rust
resistance (Yr) gene Yr6, and to remap TGW, GRW,
GRL, PH and EM QTL by multi-environment
analysis and re-identify Yr7; (2) to study trade-offs
between GY with other traits; (3) to predict the
performance of GY, PH and EM for some perfect
genotypes generated by simulation under different
environments; (4) to design a superior genotype
comprising all or if not most favourable alleles based
on QTL identified here and published QTL and
genes (root traits, Sbm1 and Vrn-A1b), and to
compare the efficiency of three breeding procedures
involving MAS in terms of genetic gain and number
of target lines retained from one breeding cycle
through simulation.
Materials and methods
Plant materials
The UK reference segregating population, consisting of
201 doubled haploid (DH) wheat genotypes derived
from an Avalon 9 Cadenza cross, developed by Clare
Ellerbrook, Liz Sayers, and the late Tony Worland (John
Innes Centre), was used in this study. The population
and parents Avalon and Cadenza were grown in Church
Farm, Norwich, UK, from 2005 to 2008 (Griffiths et al.
2009, 2012) and all phenotypic scores, except yellow
rust scores, were taken on these trials. PH and EM
measurements were described by Griffiths et al. (2009,
2012). The observed values of EM were adjusted to
percentage of the mean for better comparison between
years. GY was recorded per plot in all years. Morpho-
metric measurements for TGW, GRW and GRL were
conducted in 2007 and 2008 (Gegas et al. 2010). GN was
calculated from GY and TGW. SS was determined in
2005 and 2006 as percentage of fill of the total stem cross
section from measurements of width and wall thickness
11 cm below the collar, using digital callipers. Ten
stems were sampled in 2005 and five in 2006, choosing
plants randomly from one of the replicate plots. Two sets
of 10-day-old seedlings were inoculated separately with
two different yellow rust isolates that were either
avirulent on Yr6 and Yr7 {Race 04-44 (WYV 1, 2, 3, 4, 9,
CV, Ox/Rob)} or just Yr6 {Race 03-7 (WYV 1, 2, 3, 4,
7)}. The plants were grown in a cool glasshouse during
the early spring and scored for reaction type 3 weeks
later using the 0–4 scale proposed by Stakman et al.
(1962). The seedling root traits, total root length (TRL)
and total root surface area (TRSA) were measured by
digital image analysis software of the scanned images of
intact root systems of 11-day-old seedlings (two leaf
stage) (Bai et al. 2013). Following scanning, the
seedling shoot dry weight (SDW) was determined (Bai
et al. 2013). Broad-sense heritability values for GY, PH
and EM were calculated by the ANOVA tool of software
QTL IciMapping version 3.3 (http://www.isbreeding.
net/). The broad-sense heritability values for GY, PH
and EM were 0.37, 0.46 and 0.77, respectively.
Linkage map construction and QTL mapping
Function BIN of software QTL IciMapping version
3.3 was used to delete redundant markers and markers
with a missing rate higher than 8 % from the 4,021
70 Page 4 of 18 Mol Breeding (2015) 35:70
123
markers of the Avalon 9 Cadenza genotype scores
(available at http://www.cerealsdb.uk.net). The ge-
netic map was developed using the MAP functionality
of QTL IciMapping.
A total of 862 loci, comprising 758 SNPs, 66 SSRs,
22 DArTs and 16 perfect markers, were mapped. The
map covered 3,240 cM with an average marker
interval of 3.76 cM (Fig. S1).
Multi-environment QTL analysis for GY, yield
components, PH, EM and SS was performed by
inclusive composite interval mapping (ICIM) (Li
et al. 2007) using the MET functionality in the QTL
IciMapping software package. In the first step, the
probability for entering variables (PIN) was set to
0.0001 and the probability for removing variables
(POUT) was set to 0.0002 to select significant
markers; the phenotype on marker type model built
from the first step of stepwise regression was then
used to control the background genetic variation in
the second step of QTL interval mapping. A LOD
threshold of 3.0 was used to define significant QTL.
Also, a LOD threshold at 3.0 was used to identify
significant QTL-by-environment effects. Any QTL
with phenotypic variance explanation (PVE) higher
than 10.0 % was defined as a major QTL. Single-
QTL analysis for Yr, GY, PH and EM was
performed in QTL IciMapping using the BIP
functionality. The parameters PIN and POUT were
the same as for MET, and also a threshold LOD of
3.0 was used to identify a QTL. Additive effects
from single-QTL analyses for GY, PH and EM were
used for phenotypic prediction of simulated geno-
types in the 4 years 2005–2008.
QTL used for the UK target genotype
QTL for PH, EM and GY, yield component traits,
SS and Yr detected in this paper together with
favourable Sbm1 (Bass et al. 2006) and Vrn-A1b
(Yan et al. 2004) alleles were used to design a target
genotype. Additionally, four Avalon 9 Cadenza
QTL for TRL, TRSA and SDW (Bai et al. 2013)
were included in the model. Intended characteristics
of the UK target genotype were: similar PH and EM
to Avalon, Rht-D1b and Vrn-A1b alleles, high TGW,
high GN, long and wide grains, a large root system,
resistance to yellow rust and mosaic disease and a
maximum GY.
Simulation experimental design
QU-GENE is a simulation platform for quantitative
analysis of genetic models (Podlich and Cooper 1998).
Two different models were simulated by QU-GENE.
The first model aimed to predict GY, PH and EM
performances of new DH lines based on QTL additive
effects. In this model, two scenarios were simulated:
scenario 1 where QTL were not linked; and scenario 2
in which some QTL linkages (one on 2D for GY and
PH, and one on 3A for PH and EM) were present,
meaning that QTL had pleiotropic effects. The second
model was used to compare the efficiency of three
breeding methods to achieve the designed target
genotype.
QuLine, an integrated genetic and breeding simula-
tion tool based on the QU-GENE platform, is capable
of simulating most breeding methods to develop
inbred lines (Wang et al. 2003, 2007a, b; Li et al.
2013). The genotypes of Avalon and Cadenza were
used to simulate very large DH populations derived
from F1 that contained all possible allele combinations
of 14 loci for GY, PH and EM. The frequencies of
exemplary genotypes were as calculated, nine of them
ideal and the other five rare.
The three simulated breeding strategies were: F2–
DH, RIL and modified SSD strategy (Fig. 1). In the
F2–DH strategy, DH lines were generated from F2. In
the modified SSD strategy, three seeds from each plant
were harvested and bulked. F2 enrichment by MAS
was applied in all three strategies to increase the
frequency of target genotypes. In the modified SSD
strategy, the pedigree method was used in F2 gen-
eration. Seeds from selected plants were bulked after
F2 in the RIL strategy. All seeds were bulked for other
generations. The final selection of homozygous target
genotype using MAS was conducted in F2–DH or in F6
generation of the RIL and modified SSD strategy.
Each breeding strategy was run 1,000 times. The
average number of target genotypes was calculated as
a mean of each simulated selection experiment.
Time required for three breeding strategies
We assumed that it took 1 year to develop DH lines
from pollen. For the three strategies, the selected
plants were grown in the glasshouse, which allowed
growing two generations in 1 year. Under UK field
conditions, only one wheat generation is grown per
Mol Breeding (2015) 35:70 Page 5 of 18 70
123
year. Therefore, RIL and modified SSD strategies took
3 years to complete one breeding cycle, and F2–DH
took 2 years. One breeding cycle was considered in
the simulation. A breeding cycle begins with crossing
and ends with the generation when selected advanced
lines are returned to the crossing block as new parents
(Wang et al. 2003). Assuming F is the fitness of a
population before selection and that TGl and TGh are
the genotypic values of the two extreme target
genotypes, then the fitness adjusted by target geno-
types (Fad) is
Fad ¼F � TGl
TGh � TGl
� 100:
The genetic gain per cycle was calculated by the
difference on fitness adjusted by target genotype
before and after a breeding cycle for GY (Wang et al.
2003). Years in one cycle were used to determine the
genetic gain per year. Genetic gains per cycle and per
year presented in this study were the means across
1,000 simulation runs.
Results
QTL detection
A total of 163 QTL were identified in the Aval-
on 9 Cadenza population mainly by multi-environ-
ment QTL analysis; among them, 17 QTL were for
GY, 47 QTL for yield component traits, 53 QTL for
PH, 33 QTL for EM, five QTL for SS and eight QTL
for Yr.
F6
F2 Enrichment
F2-DH
RIL
Three seeds were bulked each plant
Modified SSD
Generation
F1
P1 P2
MAS
MAS MAS
MAS
F2-DH
MAS
F2
F3
F4
F5
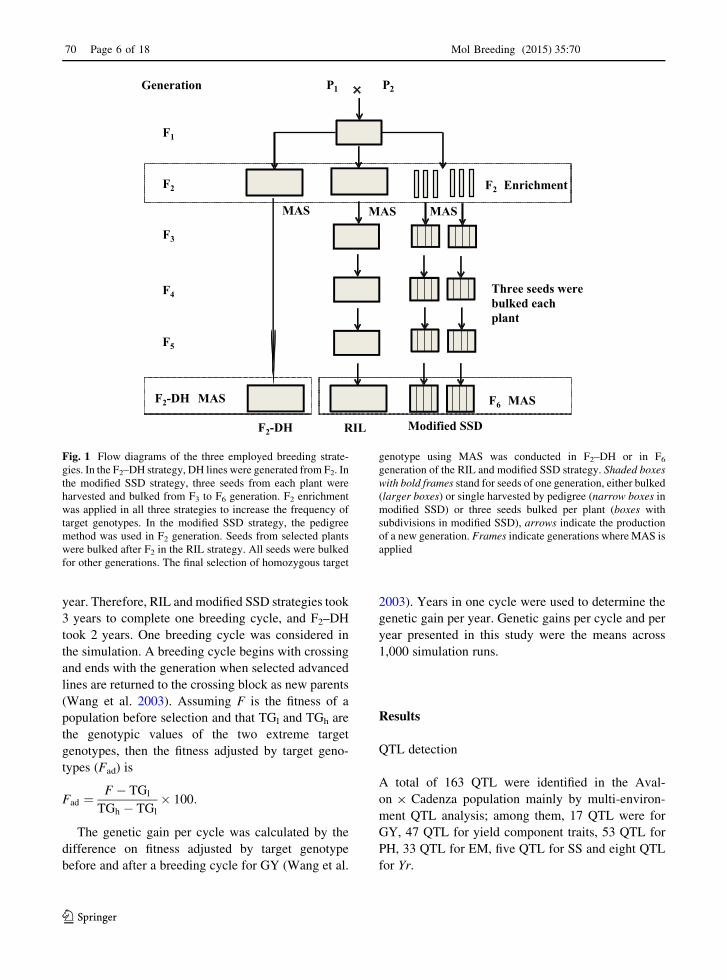
Fig. 1 Flow diagrams of the three employed breeding strate-
gies. In the F2–DH strategy, DH lines were generated from F2. In
the modified SSD strategy, three seeds from each plant were
harvested and bulked from F3 to F6 generation. F2 enrichment
was applied in all three strategies to increase the frequency of
target genotypes. In the modified SSD strategy, the pedigree
method was used in F2 generation. Seeds from selected plants
were bulked after F2 in the RIL strategy. All seeds were bulked
for other generations. The final selection of homozygous target
genotype using MAS was conducted in F2–DH or in F6
generation of the RIL and modified SSD strategy. Shaded boxes
with bold frames stand for seeds of one generation, either bulked
(larger boxes) or single harvested by pedigree (narrow boxes in
modified SSD) or three seeds bulked per plant (boxes with
subdivisions in modified SSD), arrows indicate the production
of a new generation. Frames indicate generations where MAS is
applied
70 Page 6 of 18 Mol Breeding (2015) 35:70
123
GY and yield component traits
A total of 17 QTL for GY were mapped on chromo-
somes 1A, 1D (two QTL), 2A (two QTL), 2B, 2D (two
QTL), 3A (two QTL), 3B (two QTL), 4A, 4B (two
QTL), 4D and 5D (Table S1). These QTL explained
1.22–14.53 % of the variation in the individual traits.
The QTL qGY-psr-2D.1 had the highest additive effect
value and PVE. The Cadenza allele had a positive
additive effect of 0.37 t/ha on yield. It also showed
significant QEI explaining 4.08 % of phenotypic
variation. The QTL qGY-psr-3B.2 might be another
allele of the 3BS GY QTL described by Maccaferri
et al. (2008) on 3BS of durum wheat.
For TGW, 11 loci were detected on chromosomes
1D, 2A, 3B, 4B (two QTL), 4D, 5A (two QTL), 5B
and 6A (two QTL) (Table S2). These QTL
accounted for 1.76–10.78 % of the phenotypic
variation with the additive effects in absolute size
ranging from 0.63 to 1.72 g. The major QTL was
located on 5A with the allele from Cadenza having
the largest additive effect. Two QTL on 5A and 6A
showed significant QEI, explaining 0.68–2.21 % of
the phenotypic variation.
For GN, 11 loci were detected on chromosomes 1A,
1D, 2A, 2D, 3A, 4A, 4D, 5A (two QTL), 6A and 7A,
and accounted for phenotypic variation ranging from
2.47 to 11.24 % (Table S3). The additive effects
ranged from 400.7 to 856.47 g/m2. The QTL detected
on 2D contributed the largest additive effect and PVE.
For GRW, nine loci were found on chromosomes
1D, 3D, 4B (two QTL), 4D, 5A (two QTL) and 6A
(two QTL) (Table S4). The QTL explained phenotypic
variation for GRW ranging from 2.36 to 9.97 %. Two
QTL with large additive effect were located on 5A and
6A, with Avalon carrying GRW increasing alleles.
Two QTL showed significant QEI, explaining
0.56–2.45 % of phenotypic variation.
For GRL, 16 loci were mapped on chromosomes
2A, 2D, 3A, 3B, 4A, 4B (two QTL), 5A (two QTL), 5B
(three QTL), 6A, 6B, 7A and 7D, explaining pheno-
typic variation from 1.59 to 24.89 % (Table S5). The
major QTL on chromosome 5A with the GRL
increasing Cadenza allele with an additive effect of
0.15 cm accounted for the maximum percentage of the
phenotypic variation for grain length. One QTL on 5B
showed a significant QEI with a phenotypic variation
of 1.09 %.
PH and EM
Six QTL for PH on chromosomes 2A, 2D, 3A, 3B, 4D
and 5A together explained 67.11 % of the phenotypic
variation; among them, three QTL on 2D, 3A and 4D
explained over 15 % of the total variation, and PH
increasing alleles of these QTL coming from Cadenza
having additive effects between 4.42 and 4.92 cm
(Table S6). As previously reported, the gibberellin
insensitive semi-dwarfing gene Rht-D1 underlies
qPH-psr-4D, Avalon carrying the height-reducing
allele Rht-D1b (Griffiths et al. 2012). The QTL on
2D may potentially carry a new allele of Rh8 (Griffiths
et al. 2012). Most QTL for PH were clustered on
chromosomes 1B, 2A, 3B, 4B, 5A 5B, 6A and 6B.
QTL for PH that showed significant QEI were all
located on chromosome 6A.
The major QTL for EM were mapped on 1B, 1D,
3A, 5A and 6A, jointly explaining 31.09 % of the
phenotypic variation (Table S7). Most of EM QTL
was grouped in clusters of more than three QTL on 1B,
3B, 4A, 5B and 6B. The QTL qEM-psr-1D.1 with the
largest additive effect, with late EM coming from
Avalon, accounted for 9.21 % of the phenotypic
variation. A total of eight QTL for EM located on
1D, 3A, 4A, 4D, 6A and 7A showed significant QEI,
explaining 0.37–5.28 % of the total variation.
Common QTL for PH and EM were found on
chromosomes 3A, 3B and 6A, consistent with previ-
ous reports using Meta-QTL analysis (Griffiths et al.
2012). Additionally, five further common QTL for PH
and EM, one on 4A, three on 5B and one on 6B were
detected. The direction of additive effects for all
common QTL was the same except for the 3B QTL,
one of the three 5B QTL and the 6A QTL, and these
latter loci conferred larger PH and early EM.
SS
Five QTL for SS were mapped on linkage groups 1B
(two QTL), 3B, 5B and 7A, explaining phenotypic
variation from 0.85 to 78.27 % (Table S8). Cadenza
carried positive alleles for these QTL, except for the
5B QTL. The major QTL on 3B with an additive effect
of 20.29 % straw fill contributed 78.27 % to the
phenotypic variation for SS. The major QTL detected
on chromosome 3B shared a common flanking marker
(BS00071108) with the 3B PH QTL. The major QTL
Mol Breeding (2015) 35:70 Page 7 of 18 70
123
also showed a significant QEI with a contribution of
1.46 %.
Yr
For yellow rust resistance, four QTL were found for an
isolate avirulent on Yr6 (Race 03-7) located on
chromosomes 2B, 2D, 6A and 7B; and four QTL with
an isolate avirulent on Yr7 (Race 04-44), located on
chromosomes 2B, 3B, 6A and 7B (Table S9).
Individual QTL giving resistance against Race 03-7
explained from 4.59 to 45.68 % of the phenotypic
variation with the absolute value of additive effects
varying from 0.57 to 1.78, with the major QTL on 7B
(Yr6), explaining most of the variation. Individual
QTL giving resistance against Race 04-44 explained
from 5.04 to 51.09 % of the phenotypic variation with
the absolute value of additive effects varying from
0.51 to 1.62, with the major QTL on 2B (Yr7),
explaining most of the variation. The two major QTL
alleles increasing yellow rust resistance came from
Cadenza. The majority of favourable QTL alleles
came from Cadenza except one QTL on 2B for Race
03-7 resistance and one on 3B for Race 04-44
resistance.
Comparison of the Avalon 9 Cadenza population
and simulated populations
Populations of simulated DH (SDH) lines were
created, and three QTL for GY (qGY-psr-2D.1, qGY-
psr-3A.2 and qGY-psr-3B.2) (Table S1), six QTL for
PH (qPH-psr-2A.1, qPH-psr-2D, qPH-psr-3A, qPH-
psr-3B.1, qPH-psr-4D and qPH-psr-5A.1) (Table S6),
together with five QTL for EM (qEM-psr-1B.2, qEM-
psr-1D.1, qEM-psr-3A, qEM-psr-5A and qEM-psr-
6A.1) (Table S7) were used to predict phenotypes PH,
EM and GY of the simulated individuals. Because of
the co-location of QTL on chromosomes 2D and 3A,
two scenarios were simulated: scenario 1, all QTL
were considered independent; scenario 2, the linkage
or pleiotropy of qPH-psr-2D and qGY-psr-2D.1, and
qPH-psr-3A and qEM-psr-3A was assumed. The
simulations were compared to the performance of
the real Avalon 9 Cadenza population.
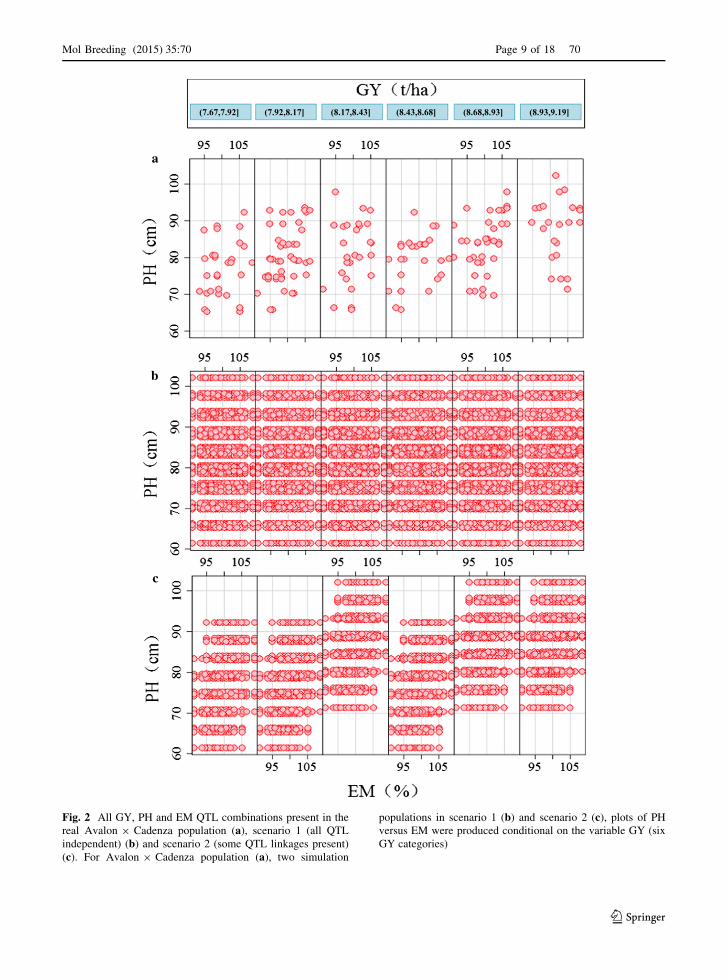
In the Avalon 9 Cadenza population, observed
PHs showed a different distribution in different yield
categories. The maximum PH increased when GY
increased if the first three categories from 7.67 to
8.43 t/ha are regarded (see Fig. 2a). Interestingly,
maximum PH was lower in the next yield category of
8.43–8.68 t/ha and increased again as GY increased to
maximum values (Fig. 2a). Individuals with near
maximum yield were all over 70 cm tall. In a
simulated population of 200,000 individuals with no
selection, all possible PH, EM and GY combination
were found in scenario 1 where there were no linked
QTL (Fig. 2b). Many DH lines with very low PH but
with the maximum GY were present. The frequencies
of these individuals ranged from 0.0025 to 0.009 %
(Fig. S2). The frequency of tall individuals with high
yield was slightly higher, ranging from 0.0025 to
0.011 % (Fig. S3). For scenario 2, a population of
50,000 sufficed to contain all possible combinations.
However, the different height categories did not
contain the full phenotypic range as in scenario 1,
e.g. short plants were not found in the highest GY
category (Fig. 2c). The frequency of tall plants with
high yield varied from 0.016 to 0.038 % higher than in
scenario 1 (Fig. S4). The population in scenario 2 had a
very similar trend to the real population. Using the
simulated population from scenario 2 the phenotypic
effect of a QTL linkage was revealed by this simplified
model. Due to the linkage or pleiotropy of the 2D GY
and PH QTL, plants did not achieve the full height
range in all the different GY categories. The EM range
was also limited because of the linkage or pleiotropy
of the 3A PH and EM QTL. For example, no
individuals with late EM achieved a height of
70–80 cm; also, individuals with early EM did not
grow to a height of over 92 cm (Fig. 2c).
Predicted performance of a target genotype
in simulated populations
For the aim of breeding a wheat variety for UK
environment, the following characteristics were as-
sumed for a target genotype: it should carry Rht-D1b,
show a similar PH and EM as Avalon, and carry a
combination of all the favourable GY QTL for a high
yield. In both simulation scenarios, the standard
deviation for PH ranged from 2.18 cm to 4.90 cm,
when the phenotype was predicted for the four
example environments 2005–2008. The absolute
height difference in the 4 years was \10 cm. The
standard deviation for EM varied from 1.05 to 5.75 %.
All plants were close to the predicted EM phenotype,
based on MET QTL, in all 4 years. Nine SDH lines
70 Page 8 of 18 Mol Breeding (2015) 35:70
123
(7.67,7.92] (7.92,8.17] (8.17,8.43] (8.43,8.68] (8.68,8.93] (8.93,9.19]
a
b
c
Fig. 2 All GY, PH and EM QTL combinations present in the
real Avalon 9 Cadenza population (a), scenario 1 (all QTL
independent) (b) and scenario 2 (some QTL linkages present)
(c). For Avalon 9 Cadenza population (a), two simulation
populations in scenario 1 (b) and scenario 2 (c), plots of PH
versus EM were produced conditional on the variable GY (six
GY categories)
Mol Breeding (2015) 35:70 Page 9 of 18 70
123
with the ideal genotype from the two scenarios are
listed in Table S11 as an example. For scenario 2,
SDH2, SDH5 and SDH8 were not found due to the
linkage or pleiotropy of the QTL on 3A for PH and
EM. The frequency of these nine ideal SDH lines was
low and ranged from 0.004 to 0.0096 % in scenario 1,
while the frequency for the six lines present in scenario
2 ranged from 0.022 to 0.034 % (Fig. S5). In terms of
yield, all these individuals would have performed well
in three of the four example years, but not in 2006.
Target genotype design using identified QTL
information
Breeders aim to produce wheat varieties that achieve
a high and stable yield. Adaptation to local environ-
ments is a prerequisite for a high-yielding variety.
However, yield is the result of the performance of
many traits, such as plant morphology, flowering
time, yield components, root morphology and disease
resistance. For resilience to a variety of possibly
occurring stressful conditions, an ambitious target
genotype would include QTL for traits that confer
stress resistance. Using available QTL for the
Avalon 9 Cadenza population, a better target geno-
type would have favourable alleles for the following
traits: apart from GY, PH and EM, large TGW, high
GN, long and wide grains, large root system, winter
type alleles (particularly Vrn-A1b) and resistances to
mosaic disease and yellow rust. A summary of
selected QTL and genes for the ambitious target
genotype is shown in Table 1. All selected QTL were
major QTL or QTL with large additive effects. The
pleiotropic effects or linkage underlying the QTL in
the Avalon 9 Cadenza population were taken into
account.
The following more detailed considerations were
made for the target genotype design: to obtain high
GY, the favourable genotype should carry the Cadenza
allele of the 2D and 3A yield QTL and the Avalon
allele of the 3B yield QTL. The 2D Cadenza allele also
had a height effect of 4.92-cm increase as linkage or
pleiotropy was considered. Moreover, the Avalon
allele of qPH-psr-2A.1 introduced would increase
yield by 0.21 t/ha. Avalon carried the height-reducing
Rht-D1b gene (Griffiths et al. 2012), which was
commonly known to also increase GY (Miralles and
Slafer 1995; Flintham et al. 1997). In our results,
however, Rht-D1b was linked to GN improvement but
not GY. This result could only be explained by a
decreasing TGW QTL allele at this locus. The present
TGW QTL on 4D was, however, 22 cM apart, which
would seem too far away to be the missing locus. Due
to low heritability or genetic background effects, the
missing QTL was either not detected or appears
misplaced and thus could not or not fully be used for
the target genotype. The favourable additive effects of
5A and 6A QTL for TGW, GN and GRW were
opposed to those of EM at those locations. The
Cadenza allele of the 5A QTL for EM was chosen to
increase GN, while the Avalon allele of the 6A QTL
for EM was chosen to increase TGW and GRW. This
selection would shorten the time to EM and thus
needed to be counter balanced with other EM QTL.
All alleles increasing the root system were selected,
and most of them were conferred by Cadenza, except
qTRL-6A. In terms of SS, a filled stem was taken to be
advantageous for biomass increase and lodging resis-
tance. Therefore, for QTL on 3B, the positive allele
from Cadenza was chosen for the target genotype,
resulting in a height reduction of 2.4 cm. To achieve a
winter type genotype, which allowed for early autumn
drilling favourable under UK conditions, the recessive
Vrn-A1b allele, carried by Avalon was selected.
Finally, Cadenza alleles for the mosaic disease
resistance loci Sbm1 on 5D and the major resistance
alleles Yr6 and Yr7 were selected.
Parent selection and efficiency of three breeding
strategies
To breed the high-yielding target genotype, the initial
strategy would be to start with DH lines that carry the
three high-yielding QTL alleles. However, given the
DH present in the Avalon 9 Cadenza population, for
many of the other selected loci, only the unfavourable
alleles would have been available in otherwise suitable
parents. Because of that, a different crossing strategy
had to be used. Three different initial crosses were
tested. For the first cross, DH109 was used as the high-
yielding parent and DH160 as the second parent, these
parents were chosen according to the complementary
allelic state at all selected loci for achieving the target
genotype (see Table 1). For the other two crosses
(DH61 9 DH182 and DH27 9 DH61), none of the
parents carried all favourable GY alleles, but between
the parents all favourable alleles were present. Thus,
theoretically, the target genotype should be among the
70 Page 10 of 18 Mol Breeding (2015) 35:70
123
progeny of crosses DH109 9 DH160, DH61 9
DH182 or DH27 9 DH61 if enough progenies were
produced; however, there were 16, 13 or 15 target loci
still segregating in these crosses, respectively. Direct
selection of all homozygous target genotype using
molecular markers seemed impractical if realistic
population sizes smaller than 10,000 were assumed.
The strategy of F2 enrichment, aimed at reducing
population size and increasing the number of target
genotypes (Bonnett et al. 2005; Wang et al. 2007b),
was thus applied (Table 2). For cross DH61 9
DH182, on average, 9.64 target genotypes were
obtained from a population of size 2,000 in the F2–
DH strategy, using MAS for F2 enrichment; 6.22 target
genotypes were obtained with the RIL strategy for the
same population size when MAS was conducted in F6
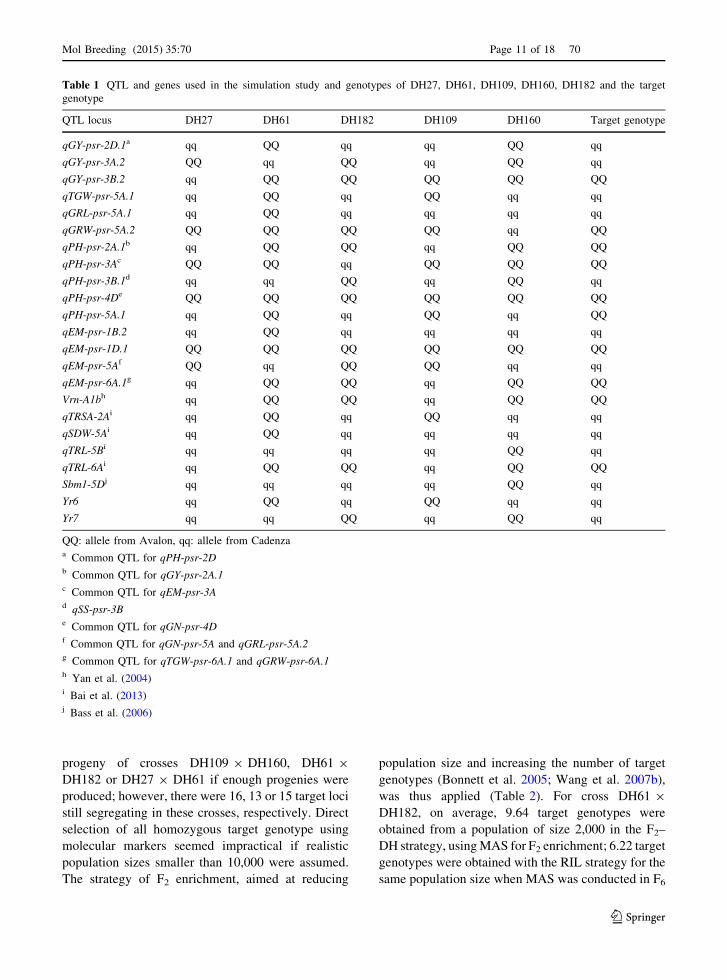
Table 1 QTL and genes used in the simulation study and genotypes of DH27, DH61, DH109, DH160, DH182 and the target
genotype
QTL locus DH27 DH61 DH182 DH109 DH160 Target genotype
qGY-psr-2D.1a qq QQ qq qq QQ qq
qGY-psr-3A.2 QQ qq QQ qq QQ qq
qGY-psr-3B.2 qq QQ QQ QQ QQ QQ
qTGW-psr-5A.1 qq QQ qq QQ qq qq
qGRL-psr-5A.1 qq QQ qq qq qq qq
qGRW-psr-5A.2 QQ QQ QQ QQ qq QQ
qPH-psr-2A.1b qq QQ QQ qq QQ QQ
qPH-psr-3Ac QQ QQ qq QQ QQ QQ
qPH-psr-3B.1d qq qq QQ qq QQ qq
qPH-psr-4De QQ QQ QQ QQ QQ QQ
qPH-psr-5A.1 qq QQ qq QQ qq QQ
qEM-psr-1B.2 qq QQ qq qq qq qq
qEM-psr-1D.1 QQ QQ QQ QQ QQ QQ
qEM-psr-5Af QQ qq QQ QQ qq qq
qEM-psr-6A.1g qq QQ QQ qq QQ QQ
Vrn-A1bh qq QQ QQ qq QQ QQ
qTRSA-2Ai qq QQ qq QQ qq qq
qSDW-5Ai qq QQ qq qq qq qq
qTRL-5Bi qq qq qq qq QQ qq
qTRL-6Ai qq QQ QQ qq QQ QQ
Sbm1-5Dj qq qq qq qq QQ qq
Yr6 qq QQ qq QQ qq qq
Yr7 qq qq QQ qq QQ qq
QQ: allele from Avalon, qq: allele from Cadenzaa Common QTL for qPH-psr-2Db Common QTL for qGY-psr-2A.1c Common QTL for qEM-psr-3Ad qSS-psr-3Be Common QTL for qGN-psr-4Df Common QTL for qGN-psr-5A and qGRL-psr-5A.2g Common QTL for qTGW-psr-6A.1 and qGRW-psr-6A.1h Yan et al. (2004)i Bai et al. (2013)j Bass et al. (2006)
Mol Breeding (2015) 35:70 Page 11 of 18 70
123
generation after F2 enrichment. For cross DH27 9
DH61, 6.45 and 3.82 target lines were achieve with
F2–DH and RIL strategy, respectively, when a larger
population size of 3,000 was used in F2, DH and F6
generations. When segregating loci were as many as
16, as was the case in cross DH109 9 DH160, a
population size of 5,000 was needed to generate 7.09
and 4.57 target genotypes for F2–DH and RIL
strategies, respectively. Only 2.27 target genotypes
could be obtained using the modified SSD strategy for
cross DH61 9 DH182 in spite of the large population
sizes (10,000). Moreover, the modified SSD strategy
did not produce a single target genotype from crosses
DH27 9 DH61 and DH109 9 DH160.
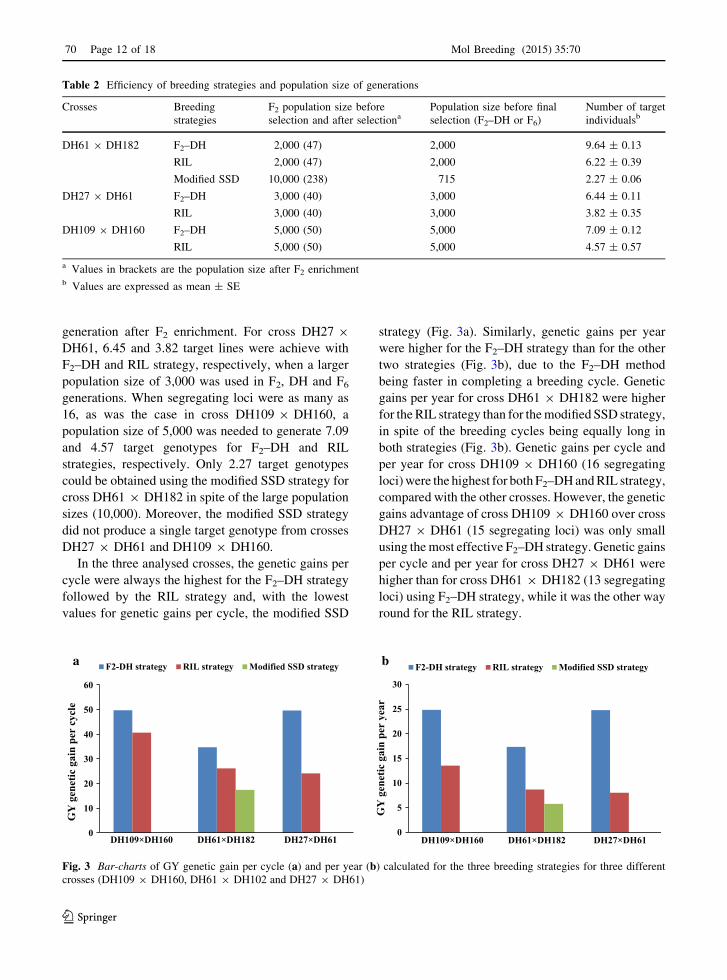
In the three analysed crosses, the genetic gains per
cycle were always the highest for the F2–DH strategy
followed by the RIL strategy and, with the lowest
values for genetic gains per cycle, the modified SSD
strategy (Fig. 3a). Similarly, genetic gains per year
were higher for the F2–DH strategy than for the other
two strategies (Fig. 3b), due to the F2–DH method
being faster in completing a breeding cycle. Genetic
gains per year for cross DH61 9 DH182 were higher
for the RIL strategy than for the modified SSD strategy,
in spite of the breeding cycles being equally long in
both strategies (Fig. 3b). Genetic gains per cycle and
per year for cross DH109 9 DH160 (16 segregating
loci) were the highest for both F2–DH and RIL strategy,
compared with the other crosses. However, the genetic
gains advantage of cross DH109 9 DH160 over cross
DH27 9 DH61 (15 segregating loci) was only small
using the most effective F2–DH strategy. Genetic gains
per cycle and per year for cross DH27 9 DH61 were
higher than for cross DH61 9 DH182 (13 segregating
loci) using F2–DH strategy, while it was the other way
round for the RIL strategy.
Table 2 Efficiency of breeding strategies and population size of generations
Crosses Breeding
strategies
F2 population size before
selection and after selectionaPopulation size before final
selection (F2–DH or F6)
Number of target
individualsb
DH61 9 DH182 F2–DH 2,000 (47) 2,000 9.64 ± 0.13
RIL 2,000 (47) 2,000 6.22 ± 0.39
Modified SSD 10,000 (238) 715 2.27 ± 0.06
DH27 9 DH61 F2–DH 3,000 (40) 3,000 6.44 ± 0.11
RIL 3,000 (40) 3,000 3.82 ± 0.35
DH109 9 DH160 F2–DH 5,000 (50) 5,000 7.09 ± 0.12
RIL 5,000 (50) 5,000 4.57 ± 0.57
a Values in brackets are the population size after F2 enrichmentb Values are expressed as mean ± SE
0
10
20
30
40
50
60
DH109×DH160 DH61×DH182 DH27×DH61
GY
gen
etic
gai
n pe
r cy
cle
F2-DH strategy RIL strategy Modified SSD strategy
0
5
10
15
20
25
30
DH109×DH160 DH61×DH182 DH27×DH61
GY
gen
etic
gai
n pe
r ye
ar
F2-DH strategy RIL strategy Modified SSD strategya b
Fig. 3 Bar-charts of GY genetic gain per cycle (a) and per year (b) calculated for the three breeding strategies for three different
crosses (DH109 9 DH160, DH61 9 DH102 and DH27 9 DH61)
70 Page 12 of 18 Mol Breeding (2015) 35:70
123
Discussion
QTL for GY, yield components, PH, EM, SS and Yr
were first identified (GY, SS and Yr) or re-identified in
the Avalon 9 Cadenza population, most of them as
MET QTL and used to suggest an ideal genotype,
carrying as many favourable alleles for a UK breeding
programme as possible.
Common QTL for GY with other traits
Previous studies have revealed clusters of QTL for
GY, yield components and other yield-related traits.
Such clusters were found on chromosomes 1B, 2A,
2D, 3B, 3A, 4A, 4B, 4D, 5A and 6A (Gegas et al. 2010;
Zhang et al. 2010; Rustgi et al. 2013). In the
Avalon 9 Cadenza population, one main cluster was
found on chromosome 4B with 12 QTL, affecting GY,
TGW, GRW, GRL, PH and EM. Other clusters were
located on 5A with 12 QTL controlling TGW, GN,
GRW, GRL, PH and EM, and 6A with 14 QTL
controlling TGW, GN, GRW, GRL, PH, EM and Yr
(Yr6 and Yr7).
The analysis of common QTL is an important tool
to elucidate genetic relationship among traits. In this
study, the common QTL between any of the named
traits were mapped to chromosomes 1A, 1D, 2A, 2D,
3A, 3B, 4B, 4D, 5A and 6A (Fig. S6). Common QTL
for GY and yield component traits were only found for
GY and GN on 1A and 2D (Fig. S6). GY increase on
1A and 2D was most likely driven by an increase in
GN, as the QTL for GN was found at a very close
position with the same flanking markers as the GY
QTL on 1A and 2D. No common QTL for GY and
TGW was found in this population, although such
common QTL are reported in other populations
(Simmonds et al. 2014). This could mean that the
selection for GN loci in the Avalon 9 Cadenza
population would improve GY by avoiding a trade-
off between TGW and GN. The locus for GY on 1D
was also associated with the EM QTL with the largest
effect, suggesting the allele for late EM would
increase yield. Moreover, a linkage or pleiotropy
between GY and EM was present on chromosome 3A,
again linking late flowering to increased yield at this
locus. One common QTL for GY and EM, and one for
GN and EM were located on chromosomes 3B and 5A,
respectively, linking GY per se or GN increase with
earlier EM. Moreover, the two 6A QTL for TGW and
GRW also controlled EM, suggesting that the allele
for earlier EM could result in a potential GY increase
via the yield component GRW. This connection, that
GY may be increased by early EM, was in line with the
findings of Kuchel et al. (2007). Hence, there was no
simple relationship between EM QTL and yield in our
trials. For common QTL for EM with GY and GY
components, manipulation of those EM loci would
lead to GY increase by a total of 0.37 t/ha, GN
increase by 589.87 g/m2, and TGW increase by
1.62 g. From a breeding perspective, the effect of
the chromosome regions associated with early EM on
GY and GY components was very intriguing. Earli-
ness had presumably been manipulated either directly
or passively by breeders to match the timing of EM in
wheat varieties with their target environments (Kuchel
et al. 2006). EM primary influence on GY was not
mediated through earliness, but rather through their
alternative pleiotropic effects on GY (Kuchel et al.
2007).
Three common QTL for GY and PH were mapped
on chromosomes 2A, 2D and 3A. The three loci
displayed in alleles conferring tallness and increasing
yield the same direction of additive effects. Interest-
ingly, the QTL for GN on 4D shared one common
marker (BS00107639) with the semi-dwarfing gene
Rht-D1b and both were mapped to a similar location. It
is thus likely that Rht-D1b underlies the 4D QTL for
GN. Avalon carried the semi-dwarfing allele Rht-D1b
and also the positive allele for GN. This confirmed that
at a given genetic locus, the effect of height increase
was not necessarily linked to yield increase, thereby
demonstrating that a larger biomass, driven by PH,
does not necessarily increase GY via carbohydrate
remobilised into the grain. The 5A QTL for GN
possibly co-locates with a PH QTL. If this is a
common QTL, the height-reducing allele would also
confer a higher GN.
Six common QTL for TGW and GRW were found
on chromosomes 1D, 4B, 4D and 6A, with QTL
clusters on 4B (two QTL) and 6A (two QTL). The
positive alleles of these common QTL came from
Cadenza also sharing the same effect direction,
indicating that at these loci TGW are mainly driven
by GRW. This was consistent with the positive
correlation coefficient between TGW and GRW
(0.82–0.90 in 2007 and 2008). The common QTL on
4B also was found by Gegas et al. (2010) using single-
QTL analysis, and further common QTL were
Mol Breeding (2015) 35:70 Page 13 of 18 70
123
detected on chromosomes 2B, 3B, 5A and 6B for the
two traits in different wheat populations (Gegas et al.
2010; Ramya et al. 2010). One QTL on 4B (at 30 cM)
for TGW and GRW possibly also influenced PH. The
Cadenza allele had a positive effect on PH, TGW and
GRW, suggesting that height and yield improvement
are linked at this locus. No common QTL for TGW,
GRW and GRL was found in this study. However, one
common QTL for GRL and GN with opposing effects
was found on 5A (at 120 cM). Interestingly, Gegas
et al. (2010) also found a common QTL on 5A (at
25.1 cM) but for TGW and GRL. This suggests that
TGW effects at this locus may be negatively correlated
with GN.
The major QTL on 3B for SS was co-located with a
PH QTL, and opposing directions of effects meant that
the positive allele for SS led to a decrease in crop
height. A 3B SS QTL has been reported as associated
with sawfly cutting resistance in durum wheat
(Houshmand et al. 2003, 2007). Kumar et al. (2007)
discovered a SS QTL on 3B, located in close
proximity to a yield QTL. However, no association
between the major SS locus on 3B and GY was
discovered in our study. Another major QTL for SS on
3D (Lanning et al. 2006) did not segregate in the
Avalon 9 Cadenza population. Both loci could be
useful for developing new SS genotypes using MAS,
but for this study, we only used loci segregating in the
Avalon 9 Cadenza population.
As reported by Li and Niu (2007), Yr6 was mapped
on chromosome 7B, which is rich in rust resistance
genes such as Yr2, Lr14 and Sr17, and two powdery
mildew resistance genes Pm5 and Pm47. Yr7 was
mapped on chromosome 2B, consistent with a previ-
ous report by Yao et al. (2006). A number of Yr loci,
such as Yr5, Yr27, Yr31, YrV23 and YrSp (Luo et al.
2009), were also mapped in this genomic region. The
nearest markers for Yr6 and Yr7 discovered here,
gwm577 and wmc175A, respectively, with distances
under 0.4 cM to the respective resistance genes, show
potential to be effectively used in MAS to increase the
number of resistance loci in a target genotype.
However, rust resistance genes may only be of value
for a limited duration of time as the pathogens mutate
quickly (Hovmoller 2007) and have frequently over-
come resistance genes used in commercial wheat
varieties. The new appearance of the yellow rust race
‘‘Warrior’’ in 2011 is such a case. Warrior has hit a
wide number of commercial wheat varieties such as
Kielder, Solstice, Santiago, in spite of them carrying
so far functional resistance alleles. Warrior seems to
be able to overcome a higher than usual number of
resistance genes. A long-term solution for the problem
would be the identification of durable rust resistance
alleles and their utilisation in wheat breeding pro-
grammes. Meanwhile, the duration and efficiency of
the rust resistance of a wheat cultivar can be improved
by pyramiding multiple race-specific resistance genes
(Khan et al. 2005). The effectiveness of this strategy
might need to be evaluated in the light of the current
‘‘Warrior’’ race crisis.
Criterion for designing a target genotype
In this study, a total of 23 loci were used to design an
ideal genotype well adapted to UK conditions. The
aim was not only a higher yielding genotype under
ideal conditions, but to breed for a more resilient
genotype, which would still perform well in less
favourable years under more stressful conditions,
which, to the best of our knowledge, is currently not
the case in most breeding programmes. As such,
putative ‘‘resilient loci’’ SS, root trait and disease
resistance QTL were included in the target genotype.
We restricted the employment of loci to QTL identi-
fied in the Avalon 9 Cadenza population.
For QTL or genes with no pleiotropic effects or
linkage, such as qEM-psr-1B.1, the decision whether
the target genotype should receive the allele from
Avalon or from Cadenza is easily made by choosing
the allele with the positive effect. Likewise, if
favourable alleles of QTL with pleiotropic effects or
linkage came from the same parent, they were also
easily assigned to the target genotype. This was the
case for the common QTL for TGW and GRW, where
the allele choice was the same for both traits.
However, conflicting trends made the decision which
allele to introduce difficult. For example, a common
QTL for GN and GRL was located on 5A (at 121 or
122 cM), with the Cadenza allele increasing GN but
not GRL. As GN is usually more important for GY
improvement than GRL (Peltonen-Sainio et al. 2007),
the Cadenza allele should be introduced for an
increase in GY. However, if the breeding effort was
aimed at end-use quality, a change in grain size might
be of interest as milling quality and final flour quality
are influenced by grain size (Breseghello and Sorrells
2006). In such a case, it might be favourable to
70 Page 14 of 18 Mol Breeding (2015) 35:70
123
influence grain length and to introduce the Avalon
allele. Therefore, decisions on how to deal with trade-
offs at common QTL may, to large extent, rely on the
aim of a particular wheat breeding programme.
Breeding resilient cultivars to address the yield gap
Actual yields may vary for a number of reasons such as
soil qualities and changing weather patterns, resulting
in sub-optimal utilisation of resources. As a conse-
quence, the prediction software revealed that a geno-
type designed mainly for high yield would have not
performed very well in one of the four example
environments. It is acknowledged that the frequently
observed ‘‘yield gap’’ in farmers’ fields could be
addressed through optimising agronomic practices and
breeding more resilient cultivars, such as improve-
ment of root traits and SS for drought stress resistance.
Context-dependency issue in MAS
The lack of consistency of QTL effects across
different populations (QTL-by-genetic background)
and across environments (QEI) has limited the use of
QTL in MAS breeding. In this study, a majority of
QTL used for target genotype design were hopefully
stable as they were detected by multi-environment
QTL analysis and also by single-QTL analysis. All
selected PH loci were detected in all 4 years; all EM
loci at least in 1 year; the major GY QTL in 4 years;
and all yield components and SS loci except GRW
were all detected in 2 years. Employing stable QTL
could limit the impact of environment context depen-
dency of the marker/trait associations. We used the
stable PH and EM QTL to predict the performance of
genotypes in four example years and found quite a
good accuracy of the prediction. However, for com-
plex traits such as yield, the prediction in one of the
example years was not accurate. Even in a single local
environment, yield measurements were confounded
with many sources of non-genetic variation such as
plot size, soil properties and disease pressure. This
makes it particularly difficult, time consuming and
expensive to identify progenies with maximum yield
potential across a sample of environments represen-
tative of the target population environments in a given
breeding programme. For these reasons, it is highly
desirable to identify genetic markers that are diagnos-
tic of yield potential so that superior progenies can be
selected via MAS before or during the early stages of
field test. In such cases, MAS would still be a useful
tool to improve complex traits even if restricted to a
specific genetic and environment context (Sebastian
et al. 2010).
Future prospects
The present study was laid out as a proof of principle to
investigate the potential of ‘‘breeding by design’’.
Pleiotropic effects of QTL or linkages between QTL,
as found in real germplasm, have been taken into
account in the genotype design. Results indicated that
breeding for a high-performing wheat variety can be
done efficiently with a number of potential GY-related
loci using genotypic information. The parent selection
and selection methods described here could provide a
guide for applied marker-assisted wheat breeding. For
example, compared with two other simulated crossing
schemes, starting with a cross between DH61 and
DH182 would result in more target genotypes using a
smaller population size which would be of advantage
for the breeder. Meanwhile, breeding questions like
‘‘how many plants are needed to achieve at least one
target genotype’’ and ‘‘which selection method is more
advantageous’’ could be answered by simulation
software before the real breeding work is started. In
the case of the breeding strategies explored here, and if
the cost of DH production is irrelevant, the F2–DH
strategy gave a clear advantage over the RIL and
modified SSD strategy in that a much lower population
number was needed to produce target genotypes and
more gains per year were obtained. ‘‘Breeding by
design’’ with the aid of simulation software provides a
cost-effective way to efficiently use a vast amount of
genetic data and information available to breeders.
The breeding target presented here was a genotype
adapted to a British or very similar environment. The
selection of QTL could easily be different if breeding
for a different environment, e.g. Southern Europe, was
the goal. However, the knowledge of favourable traits
and QTL for the adaptation to the chosen environment
is, of course, a prerequisite. Genomic selection is an
alternative to breeding via MAS and has been
successfully applied in maize breeding (Massman
et al. 2013). Findings by Poland et al. (2012) indicate
that the prediction accuracies are sufficiently high to
merit implementation of genomic selection in wheat
applied breeding programmes. However, as long as
Mol Breeding (2015) 35:70 Page 15 of 18 70
123
large-scale genotyping is still expensive and limited to
expert laboratories, the MAS approach may be the
better approach for many breeders. Any advantage of
genomic selection over a well-designed MAS strategy
as presented here will have to be demonstrated in
future applications.
In order to verify the simulation result, the
suggested crosses and breeding strategies for the
Avalon 9 Cadenza population will be conducted and
compared to the results presented here. This compar-
ison between simulation and real crossing experiments
will reveal the accuracy of the simulations. Moreover,
the current study focused on a single population in
order to use a well-defined example to develop a
realistic idea of what is possible. In general, breeding
aims to introduce alleles from diverse germplasm into
elite lines by MAS to improve GY potential. Similar
strategies as laid out here will apply, based on
functional polymorphism underlying the QTL de-
scribed. However, it will be more difficult to estimate
effects in different populations due to linkage equi-
librium and a lack of diagnostic molecular markers.
Hopefully, future simulation studies and breeding
efforts will benefit from an increasing availability of
validation data and positive outcomes from positional
cloning projects in bread wheat for favourable QTL
and genes. The development of molecular markers for
functional polymorphism is the ultimate goal in
successfully applying MAS.
Acknowledgments This work was supported by the Natural
Science Foundation of China (Project No. 31271798),
HarvestPlus Challenge Program of CGIAR and
OptiChina.Open Access This article is distributed under the
terms of the Creative Commons Attribution License which
permits any use, distribution, and reproduction in any medium,
provided the original author(s) and the source are credited.
References
Acreche MM, Slafer GA (2006) Grain weight response to in-
creases in number of grains in wheat in a Mediterranean
area. Field Crops Res 98:52–59
Allen AM, Barker GL, Berry ST, Coghill JA, Gwilliam R, Kirby
S, Robinson P, Brenchley RC, D’Amore R, McKenzie R,
Waite D, Bevan M, Hall N, Edwards KJ (2011) Transcript-
specific, single-nucleotide polymorphism discovery and
linkage analysis in hexaploid bread wheat (Triticum Aes-
tivum L.). Plant Biotechnol J 9:1086–1099
Anderson JA, Chao S, Liu S (2008) Molecular breeding using a
major QTL for Fusarium head blight resistance in wheat.
Crop Sci 47(S3):S112–S119
Bai C, Liang Y, Hawkesford MJ (2013) Identification of QTLs
associated with seedling root traits and their correlation
with plant height in wheat. J Exp Bot 64:1745–1753
Bansal UK, Kazi AG, Singh B, Hare RA, Bariana HS (2014)
Mapping of durable stripe rust resistance in a durum wheat
cultivar Wollaroi. Mol Breed 33:51–59
Bass C, Hendley R, Adams MJ, Hammond-Kosack KE,
Kanyuka K (2006) The Sbm1 locus conferring resistance to
soil-borne cereal mosaic virus maps to a gene-rich region
on 5DL in wheat. Genome 49:1140–1148
Bernardo R (2008) Molecular markers and selection for com-
plex traits in plants: learning from the last 20 years. Crop
Sci 48:1649–1664
Berry PM, Sylvester-Bradley R, Berry S (2007) Ideotype for
lodging resistant wheat. Euphytica 154:165–179
Bonnett DG, Rebetzke GJ, Spielmeyer W (2005) Strategies for
efficient implementation of molecular markers in wheat
breeding. Mol Breed 15:75–85
Breseghello F, Sorrells ME (2006) Association mapping of
kernel size and milling quality in wheat (Triticum aestivum
L.) cultivars. Genetics 172:1165–1177
Calderini D, Quintero A, Hasan A, Wingen L, Griffiths S, Gir-
ousse C, Le Gouis J (2013) Improving grain filling and
potential grain size. In: Proceedings of the international
workshop of the wheat yield consortium, vol 3. CENEB,
CIMMYT. Cd. Obregon, Sonora (Mexico), 5–7 Mar 2013.
CIMMYT, p 39
Clover GRG, Ratti C, Henry CM (2001) Molecular charac-
terization and detection of European isolates of soil-borne
wheat mosaic virus. Plant Pathol 50:761–767
Duggan BL, Fowler DB (2006) Yield structure and kernel po-
tential of winter wheat on the Canadian prairies. Crop Sci
46:1479–1487
Fischer RA (2008) The importance of grain or kernel number in
wheat: a reply to Sinclair and Jamieson. Field Crops Res
105:15–21
Flintham JE, Borner A, Worland AJ, Gale MD (1997) Opti-
mising grain yield: effects of Rht (Gibberllin-insensitive)
dwarfing genes. J Agric Sci 128:11–25
Gegas VC, Nazari A, Griffiths S, Simmonds J, Fish L, Orford S,
Sayers L, Doonan JH, Snape JW (2010) A genetic frame-
work for grain size and shape variation in wheat. Plant Cell
22:1046–1056
Griffiths S, Simmonds J, Leverington M, Wang Y, Fish L,
Sayers L, Alibert L, Orford S, Wingen L, Herry L, Faure S,
Laurie D, Bilham L, Snape J (2009) Meta-QTL analysis of
the genetic control of ear emergence in elite European
winter wheat germplasm. Theor Appl Genet 119:383–395
Griffiths S, Simmonds J, Leverington M, Wang Y, Fish L, Sayers
L, Alibert L, Orford S, Wingen L, Snape J (2012) Meta-QTL
analysis of the genetic control of crop height in elite European
winter wheat germplasm. Mol Breed 29:159–171
Houshmand S, Knox RE, Clarke FR, Clarke JM (2003) Mi-
crosatellite markers associated with sawfly cutting in du-
rum wheat. In: Pogna NE, Romano M, Pogna EA, Galterio
70 Page 16 of 18 Mol Breeding (2015) 35:70
123
G (eds), The 10th international wheat genetic symposium,
Paestum, Italy, pp 1151–1153
Houshmand S, Knox RE, Clarke FR, Clarke JM (2007) Mi-
crosatellite markers flanking a stem solidness gene on
chromosome 3BL in durum wheat. Mol Breed 20:261–270
Hovmoller MS (2007) Sources of seedling and adult plant re-
sistance to Puccinia striiformis f. sp. tritici in European
wheats. Plant Breed 126:225–233
Khan RR, Bariana HS, Dholakia BB, Naik SV, Lagu MD,
Rathjen AJ, Gupta VS (2005) Molecular mapping of stem
and leaf rust resistance in wheat. Theor Appl Genet
111:846–850
Kuchel H, Hollamby G, Langridge P, Williams K, Jefferies SP
(2006) Identification of genetic loci associated with ear-
emergence in bread wheat. Theor Appl Genet 113:1103–
1112
Kuchel H, Williams KJ, Langridge P, Eagles HA, Jefferies SP
(2007) Genetic dissection of grain yield in bread wheat.
I. QTL analysis. Theor Appl Genet 115:1029–1041
Kumar N, Kulwal PL, Balyan HS, Gupta PK (2007) QTL mapping
for yield and yield contributing traits in two mapping
populations of bread wheat. Mol Breed 19:163–177
Lanning SP, Fox P, Elser J, Martin JM, Blake NK, Talbert LE
(2006) Microsatellite markers associated with a secondary
stem solidness locus in wheat. Crop Sci 46:1701–1703
Li Y, Niu Y (2007) Identification of molecular markers for
wheat stripe rust resistance gene Yr6. Acta Agric Boreali-
Sin 22:189–192
Li H, Ye G, Wang J (2007) A modified algorithm for the im-
provement of composite interval mapping. Genetics 175:
361–374
Li H, Singh RP, Braun HJ, Pfeiffer WH, Wang J (2013) Doubled
Haploids versus conventional breeding in CIMMYT wheat
breeding programs. Crop Sci 53:74–83
Luo P, Hu X, Zhang H, Ren Z (2009) Genes for resistance to
stripe rust on chromosome 2B and their application in
wheat breeding. Prog Nat Sci 19:9–15
Maccaferri M, Sanguineti MC, Corneti S, Ortega JL, Salem MB,
Bort J, DeAmbrogio E, Garcıa del Moral LF, Demontis A,
El-Ahmed A, Maalouf F, Machlab H, Martos V, Moragues
M, Motawaj J, Nachit M, Nserallah N, Ouabbou H, Royo
C, Slama A, Tuberosa R (2008) Quantitative trait loci for
grain yield and adaptation of durum wheat (Triticum durum
Desf) across a wide range of water availability. Genetics
178:489–511
Massman JM, Jung HJG, Bernardo R (2013) Genomewide se-
lection versus marker-assisted recurrent selection to im-
prove grain yield and stover-quality traits for cellulosic
ethanol in maize. Crop Sci 53:58–66
Miralles DJ, Slafer GA (1995) Yield, biomass and yield com-
ponents in dwarf, semi-dwarf and tall isogenic lines of
spring wheat under recommended and late sowing dates.
Plant Breed 114:392–396
Nagel KA, Kastenholz B, Jahnke S, Van Dusschoten D, Aach T,
Muhlich M, Schurr U (2009) Temperature responses of
roots: impact on growth, root system architecture and im-
plications for phenotyping. Funct Plant Biol 36:947–959
Okamoto Y, Nguyen AT, Yoshioka M, Iehisa JC, Takumi S
(2013) Identification of quantitative trait loci controlling
grain size and shape in the D genome of synthetic hex-
aploid wheat lines. Breed Sci 63:423
Palta JA, Chen X, Milroy SP, Rebetzke GJ, Dreccer MF, Watt M
(2011) Large root systems: are they useful in adapting
wheat to dry environments? Funct Plant Biol 38:347–354
Peleman JD, van der Voort JR (2003) Breeding by design.
Trends Plant Sci 8:330–334
Peltonen-Sainio P, Kangas A, Salo Y, Jauhiainen L (2007) Grain
number dominates grain weight in temperate cereal yield
determination: evidence based on 30 years of multi-loca-
tion trials. Field Crops Res 100:179–188
Perovic D, Forster J, Devaux P, Hariri D, Guilleroux M, Kanyuka
K, Lyons R, Weyen J, Feuerhelm D, Kastirr U, Sourdille P,
Roder M, Ordon F (2009) Mapping and diagnostic marker
development for soil-borne cereal mosaic virus resistance
in bread wheat. Mol Breed 23:641–653
Podlich DW, Cooper M (1998) QU-GENE: a platform for
quantitative analysis of genetic models. Bioinformatics
14:632–653
Poland J, Endelman J, Dawson J, Rutkoski J, Wu S, Manes Y,
Dreisigacker S, Crossa J, Sanchez-Villeda H, Sorrells M,
Jannink JL (2012) Genomic selection in wheat breeding using
genotyping-by-sequencing. Plant Genome 5:103–113
Pozzi C, Rossini L, Vecchietti A, Salamini F (2004) Gene and
genome changes during domestication of cereals. In: Gupta
PK, Varshney RK (eds) Cereal genomics. Kluwer, Dor-
drecht, pp 585–634
Ramya P, Chaubal A, Kulkarni K, Gupta L, Kadoo N, Dhaliwal
HS, Gupt V (2010) QTL mapping of 1000-kernel weight,
kernel length, and kernel width in bread wheat (Triticum
aestivum L.). J Appl Genet 51:421–429
Rustgi S, Shafqat MN, Kumar N, Baenziger PS, Ali ML,
Dweikat I, Campbell BT, Gill KS (2013) Genetic dissec-
tion of yield and its component traits using high-density
composite map of wheat chromosome 3A: bridging gaps
between QTLs and underlying genes. PLoS One 8:e70526
Saint Pierre C, Trethowan R, Reynolds M (2010) Stem solidness
and its relationship to water-soluble carbohydrates: asso-
ciation with wheat yield under water deficit. Funct Plant
Biol 37:166–174
Sebastian SA, Streit LG, Stephens PA, Thompson JA, Hedges
BR, Fabrizius MA, Soper JF, Schmidt DH, Kallem RL,
Hinds MA, Feng L, Hoeck JA (2010) Context-specific
marker-assisted selection for improved grain yield in elite
soybean populations. Crop Sci 50:1196–1206
Simmonds J, Scott S, Leverington-Waite M, Turner AS, Brinton
J, Korzun V, Snape S, Uauy C (2014) Identification andindependent validation of a stable yield and thousand grain
weight QTL on chromosome 6A of hexaploid wheat (Tri-
ticum aestivum L.). BMC Plant Biol 14:191
Sinclair TR, Jamieson PD (2006) Grain number, wheat yield,
and bottling beer: an analysis. Field Crops Res 98:60–67
Stakman EC, Stewart DM, Loegering WQ (1962) Identification
of physiological races of Puccinia graminis var. tritici.
USDA Agric Res Serv Bull E 617:1–53
Tyagi S, Mir RR, Kaur H, Chhuneja P, Ramesh B, Balyan HS,
Gupta PK (2014) Marker-assisted pyramiding of eight
QTLs/genes for seven different traits in common wheat
(Triticum aestivum L.). Mol Breed 34:167–175
Wang J, Van Ginkel M, Podlich D, Ye G, Trethowan R, Pfeiffer
W, DeLacyc IH, Cooperb M, Rajaram S (2003) Compar-
ison of two breeding strategies by computer simulation.
Crop Sci 43:1764–1773
Mol Breeding (2015) 35:70 Page 17 of 18 70
123
Wang J, Wan X, Li H, Pfeiffer WH, Crouch J, Wan J (2007a)
Application of identified QTL-marker associations in rice
quality improvement through a design-breeding approach.
Theor Appl Genet 115:87–100
Wang J, Chapman SC, Bonnett DG, Rebetzke GJ, Crouch J
(2007b) Application of population genetic theory and
simulation models to efficiently pyramid multiple genes
via marker-assisted selection. Crop Sci 47:582–588
Wang J, Li H, Zhang X, Yin C, Li Y, Ma Y, Li X, Qiu L, Wan J
(2011) Molecular design breeding in crops in China. Acta
Agron Sin 37:191–201
Wang S, Wong D, Forrest K, Allen A, Chao S, Huang BE,
Maccaferri M, Salvi S, Milner SG, Cattivelli L, Mas-
trangelo AM, Whan A, Stephen S, Barker G, Wieseke R,
Plieske J, International Wheat Genome Sequencing Con-
sortium, Lillemo M, Mather D, Appels R, Dolferus R,
Brown-Guedira G, Korol A, Akhunova AR, Feuillet C,
Salse J, Morgante M, Pozniak C, Luo MC, Dvorak J,
Morell M, Dubcovsky J, Ganal M, Tuberosa R, Lawley C,
Mikoulitch I, Cavanagh C, Edwards KJ, Hayden M,
Akhunov E (2014) Characterization of polyploid wheat
genomic diversity using a high-density 90 000 single nu-
cleotide polymorphism array. Plant Biotechnol J. doi:10.
1111/pbi.12183
Yan L, Helguera M, Kato K, Fukuyama S, Sherman J, Dub-
covsky J (2004) Allelic variation at the VRN-1 promoter
region in polyploid wheat. Theor Appl Genet 109:
1677–1686
Yao ZJ, Lin RM, Xu SC, Li ZF, Wan AM, Ma ZY (2006) The
molecular tagging of the yellow rust resistance gene Yr7 in
wheat transferred from differential host Lee using mi-
crosatellite markers. Sci Agric Sin 39:1146–1152 (in
Chinese)
Zhang LY, Liu DC, Guo XL, Yang WL, Sun JZ, Wang DW,
Zhang A (2010) Genomic distribution of quantitative trait
loci for yield and yield-related traits in common wheat.
J Integr Plant Biol 52:996–1007
70 Page 18 of 18 Mol Breeding (2015) 35:70
123