Usiminas Presentation
2Q12

Clique para
editar o texto
mestre
Usiminas and its
Business Units
Financial
Highlights
Market
Overview
2
Agenda

Total 1,527 million tons
3 Source: World Steel
683.3
107.6 86.2 72.2 68.7 68.5 44.3 35.3 35.2 34.1
China Japan USA India Russia South Korea
Germany Ukraine Brazil Turkey
Production per Company – 2011
97.2 44.4 43.3
39.1 37.7
33.4 31.9 30.0 29.9 29.8
9.5
6.8
Arcelor Mittal
Hebei Group
Baosteel
Posco
Wuhan Group
Nippon Steel
Shagang Group
Shougang Group
JFE
Ansteel Group
36º - Techint Group
51º - Usiminas
World Production - 2011

Capacity of Crude Steel
1,988 million tons
Excess of Capacity
461 million tons
Production
1,527 million tons
Production of Crude Steel
1,527 million tons
Excess of production
149 million tons
Consumption
1,378 million tons
World - 2011
4
World Production and capacity of crude steel

78
61 68
76 83
61 57 72
35 28 29
15
21 14
12 9
17 21
18
26 41 39
7 18 18 13 9
22 22 10
39 31 32
2000 2001 2002 2003 2004 2005 2006 2007 2008 2009 2010
Steel Iron Ore Coal
5 Source: Mckinsey
Profit distribution on the steel production chain – %
Value Transfer on the Steel Chain

Production – million tons
6 Source: IABR / INDA
Inventories in the Distribution Network Flat Steel Imports – thousand tons
Apparent Consumption – million tons
3.5 3.7 3.84.1 4.0
3.7 3.8 3.73.3 3.2
3.8 3.9
3Q09 4Q09 1Q10 2Q10 3Q10 4Q10 1Q11 2Q11 3Q11 4Q11 1Q12 2Q12
2.72.9
3.43.9
3.33.1 3.1 3.3 3.2 3.0
3.5 3.5
3Q09 4Q09 1Q10 2Q10 3Q10 4Q10 1Q11 2Q11 3Q11 4Q11 1Q12 2Q12
0.8 0.8 0.81.0
1.2 1.2 1.2 1.21.1 1.0 1.0 1.0
2.4 2.6 2.4
3.2
3.9 4.1
3.23.6
3.0 2.9 2.8 2.8
3Q09 4Q09 1Q10 2Q10 3Q10 4Q10 1Q11 2Q11 3Q11 4Q11 1Q12 2Q12
Thousand tons Monthly basis
315 283
667
790 823 865
416 415
570500 520
413
3Q09 4Q09 1Q10 2Q10 3Q10 4Q10 1Q11 2Q11 3Q11 4Q11 1Q12 2Q12
Flat Steel
Brazilian Market
416
347
306 298
333 356 364
476
292 297
158 169 158
143 145 141
240 228 229
129
167
216 199
164 168
122 126
184
Source: Usiminas - Sistema Aliceweb - MDIC/Secex
Average 2011: 177
thousand tons Average1H11: 161
thousand tons
7
(thousand tons)
Importation

2,822 3,051 3,075
3,382 3,406 3,455 3,591
2007 2008 2009 2010 2011 2012p 2013p
Brazilian Production of vehicles
+8% +1% +10% +1% +1%
+4%
2,186 2,445
2,652 2,855 2,775 2,897 3,024
2007 2008 2009 2010 2011 2012p 2013p
Nacional Sales
+12% +9% +8% 4% 4%
277 375
489
660
858 945
1,040
2007 2008 2009 2010 2011 2012p 2013p
Export Sales
+35% +30% +35%
+30% +10%
+10% -3%
Source: 2007 a 2011 – Anfavea; 2012 e 2013: Projeções Usiminas – Planejamento Comercial, março 2012 8
Brazil’s Production and Sale of vehicles

Investments in industry in 2012: R$17.1 billion
Investments in infrastructure in 2012: R$105.3 billion
Investments in housing during the period of 2011/2014 : R$279 billion
9
MEDIUM AND LONG TERM PROJECTS
2012-2016
~ US$ 237 Bi
2012
~ R$ 761 millions
2012
~ R$ 230 millions
Source: Valor Economico, PAC’s website, Petrobras’s website,Portal da Copa – Governo Federal
2012
~ R$ 25,6 Bi
2012
~ R$ 11.1 Bi
4.5 million tons of steel
2.7 long
1.8 flat
1.5 million tons of steel
0.9 long
0.6 flat
Benefit from the Brazilian positive outlook
Domestic Market

10
Clique para
editar o texto
mestre
Usiminas and its
Business Units
Financial
Highlights
Market
Overview
Agenda

Foundation
of Usiminas
Operation
Start Up
Privatization
Usiminas:1991
Cosipa: 1993
Listing on
Latibex
Aquisition of J.
Mendes iron ore
mines
Aquisition of
Zamprogna
Soluções
Usiminas,
con-solidation
of the
companies Rio
Negro, Dufer,
Fasal and
Zamprogna
and industrial
units Usial and
Usicort
Single CNPJ:
Cosipa is
incorporated
by Usiminas
Creation of Mineração Usiminas
Port Agreement
Mineração Usiminas and
MMX
Selling of
Ternium shares
Joint Mining
and
Cooperation
Agreement
with MMX, MBL
and Ferrous
Negociation
with J. Mendes
concluded
Acquisition of
Litigation Area
1956
1991
2005
2008
2009
2010
2011
2012
Entrance of Ternium/ Tenaris
in Usiminas’ Control Group
New shareholders
agreement singned among Niippon Group,
Ternium / Tenaris and Usiminas Pension Fund
until 2031
11
Time Line

12
Mining
Steel
Steel processing
Capital Goods
Strategically Located

13
Auto Industries
Cold Rolled and
Galvanized (EG and HDG)
Ship-Building
Heavy Plates
Pipelines
Heavy Plates and Hot
Rolled
Pressure Vessels
Heavy Plates
Agricultural
Machines
Heavy Plates and Hot
Rolled
Civil Construction
Heavy Plates, Cold and Hot
Rolled and Galvanized (EG
and HDG)
Autoparts
Hot Rolled
Household
Appliances
Cold Rolled and
Galvanized (EG and
HDG)
Everyday Steel Application

14
Voting Capital – ON
Control Group:
63.86% of Voting
Capital
Total Capital 1,013,786,190
49.84% 50.16%
ON PN
PN 508,525,506 ON 505,260,684
10 Board of Directors Members:
- Controling Shareholders: Ternium / Tenaris (3), Nippon Group (3), Usiminas Pension Fund (1) and
Employees Representative (1)
- Minority Shareholders : Previ (1) and Geração Futuro Funds (1)
Nippon Group29.45%
Ternium / Tenaris
27.66%
Usiminas Pension Fund
6.75%
Free Float36.14%
Shareholder Composition

15
Mining
Steel
Steel Processing Capital Goods
UPST
REA
M
DO
WN
ST
REA
M
* Controled by Usiminas ** Results accounted through equity income
Ipatinga
Automotiva Usiminas *
Metform and Codeme
stake **
Cubatão
Unigal Usiminas * Mineração Usiminas *
Soluções Usiminas * Usiminas Mecânica *
Complete solution of products and services
through the value chain

Total amount for 2012
R$ 2.0 billion
Strategic focus on enhancing competitiveness of current operations
Ongoing Projects
Galvanizing
Line
550,000 tons
(Unigal)
Hot Strip Mill
2.3 million tons
(Usiminas
Cubatão)
Mining
Production
Reach total
capacity of
12 million
tons in 2013.
In operation
2Q11
Foundry
24,000 tons
(Usiminas
Mecânica)
4Q11 1Q12 Energy self
sufficiency
Reach total
capacity of
around 500MW
Hot Run
16
Pickling line
III (Cubatão)
Revamping of
Coke Plant II
(Ipatinga)
Investments

17
Income Statement per Business Units - Non Audited (R$ million)
Note: All transactions among the business units are made at market price. MRS results are accounted through equity on Equity
Income.
R$ million
2Q12 1Q12 2Q12 1Q12 2Q12 1Q12 2Q12 1Q12 2Q12 1Q12 2Q12 1Q12
Net Revenue 213 239 3,097 2,573 533 497 205 251 (821) (674) 3,225 2,886
Domestic Market 143 217 2,348 2,234 522 491 203 251 (811) (654) 2,405 2,539
Export Market 70 22 749 339 11 6 2 0 (10) (20) 820 347
COGS (73) (100) (3,057) (2,574) (495) (447) (225) (258) 783 666 (3,067) (2,713)
Gross Profit 140 139 39 0 37 49 (19) (7) (39) (8) 158 173
Operating Income (Expenses) (49) (36) (43) (100) (50) (51) (17) (23) 0 1 (159) (209)
EBIT 91 103 (4) (100) (13) (2) (36) (30) (39) (7) (1) (36)
EBITDA 100 111 201 100 0 11 (29) (25) (40) (7) 232 190
EBITDA Margin 47% 46% 6% 4% 0% 2% -14% -10% - - 7% 7%
Mining SteelSteel
Processing
Capital
GoodsAdjustment Consolidated
(quarter)
Results Accounted by Business Unit

18
Income Statement per Business Units - Non Audited (R$ million)
Note: All transactions among the business units are made at market price. MRS results are accounted through equity on Equity
Income.
R$ million
1H12 1H11 1H12 1H11 1H12 1H11 1H12 1H11 1H12 1H11 1H12 1H11
Net Revenue 452 479 5,670 5,485 1,029 1,102 456 681 1,497 (1,658) 6,111 6,089
Domestic Market 361 390 4,582 4,701 1,012 1,079 454 651 (1,465) (1,657) 4,944 5,194
Export Market 91 89 1,088 784 17 23 2 0 (30) 0 1,168 896
COGS (173) (123) (5,631) (5,312) (943) (993) (483) (604) 1,450 1,662 (5,780) (5,370)
Gross Profit 279 357 39 173 87 109 (27) 77 (46) 3 332 719
Operating Income (Expenses) (85) (52) (143) (131) (101) (105) (40) (51) 1 3 (368) (336)
EBIT 195 305 (104) 42 (15) 4 (66) 26 (47) 6 (37) 383
EBITDA 211 319 301 306 11 35 (54) (39) (47) 3 422 702
EBITDA Margin 47% 67% 5% 6% 1% 3% -12% 6% - - 7% 12%
Mining SteelSteel
Processing
Capital
GoodsAdjustment Consolidated
(semester)
Results Accounted by Business Unit

Cubatão
Ipatinga
19 19
Steel

Installed Nominal Capacity : 9.5 million tons / year
Slabs Hot Coils Cold Coils Heavy Plates Slab Caster EG HDG
1,950,000tons
Optmized
Rolling
Capacity
2,000,000tons 1,900,000tons 1,020,000tons 350,000tons
Cubatão Plant - 1,200,000tons - 4,400,000tons* 1,000,000tons 4,500,000tons
3,700,000tons Nominal
Capacity 8,000,000tons 2,000,000tons 9,500,000tons 1,050,000tons 360,000tons
-
Ipatinga Plant 1,050,000tons 360,000tons 2,500,000tons 3,600,000tons 1,000,000tons 5,000,000tons
20
Galvanized
* HCR mill # 2 under ramp up.
Usiminas has a full range of flat steel products
Flat Steel Production

21
Sales – thousand tons
Segments Breakdown of
Sales – 2Q12
1,406 1,512
1,888
1,583
1,340
1,343 1,162 1,136
1,246 1,327
240
243 204
266
561
2Q11 3Q11 4Q11 1Q12 2Q12
Mercado Interno Mercado Externo
18%14%
4%
8%
7%
6%
26%
7%
9%
Auto Parts
Auto industries
Rolled Machinery
Small Diameter Tubes
Civil Construction/Shapes
Household Appliances
Distribuitors
Industrial Equipment
Other
Usiminas is focused on the domestic market with a product range to supply different
sectors
Domestic Market

22
US$/ton
R$ /ton
101 119
227
291236
299
420
111158
47 37 52
2002 2003 2004 2005 2006 2007 2008 2009 2010 2011 1Q12 2Q12
294 367
664 709
513 581
771
221 277
78 66 107
2002 2003 2004 2005 2006 2007 2008 2009 2010 2011 1Q12 2Q12
US$ /R$ 1.6737 1.7683 2.0455
Ebitda (millions) / ton

23
1,690
1,660
1,763
1,821
1,702
1,619
1Q11 2Q11 3Q11 4Q11 1Q12 2Q12
COGS (R$ millions) / ton

24
Belo Horizonte Itabira
IPATINGA
São
Paulo
ITAÚNA
Vitória
TUBARÃO
Port
ITAGUAÍ Port
CUBATÃO
Port
24
Mining and Logistics

25
Tubarão Port Itaguaí Port
(Ingá)
MODAL
Mineração
Usiminas
EFVM
Existing Routes
CUBATÃO Plant / Port
New Routes
TCS / TSA
Trammel
Sepetiba Port
Exports Exports Exports
40 Km
60 Km
IPATINGA Mill
Logistics

4 mining sites, acquired from J. Mendes Group in
Feb/2008
Reserves of 2.6 billion tons
Located in Serra Azul-MG, one of the richest iron
ore sites in Brazil
2Q12: production of 1.5 million tons
MRS: 20% of voting shares and part of the
Control Group
Land in Itaguaí-RJ, acquired in 2008
Production – MM ton:
3.8
5.5 6.8 6.3
3.4
2008 2009 2010 2011 1H12
26
Mining and Logistics
Current status

US$ 6.4 billion Mineração Usiminas S.A Estimated Market Value
Acquisition by Sumitomo Corporation of
30% of Mineração Usiminas S.A., through
the subscription of new shares, up to the
total amount of US$ 1.9 billion.
70.0%
30.0%
27
Mining and Logistics
Strategic partnership

28
Iron Ore Production Capacity – million tons by the end of the year
2 2 2 2 2
5 6 6 4 4
2 6
23
7 8 10
12
29
2010 2011 2012 2013
Friable Project : ongoing
Estimated Capex of R$800 million Compact Project:
under detailing phase
Expansion Plan
Mining

29
MMX Port and Joint Mining Agreements
MBL Joint Mining Agreement
New mine acquired from Mineração Ouro Negro (former
litigation area)
Conclusion of the negotiation with J. Mendes
Right of way agreement with Ferrous
Agreements
Mining

30
MBL
Arcelor Mittal
Ferrous (Santanense)
Comisa Emicon
MMX
Ferrous
MUSA Pau de Vinho
MUSA East
Minerita
MUSA Central
MUSA West
Itatiaiuçu
Igarapé São Joaquim De Bicas
Mineração Usiminas mining operation is highlighted in yellow.
Mineração Usiminas
Serra Azul

31 31
Itaguaí Port

32
Camaçari
Cachoeirinha
Porto Alegre
Campo Limpo Paulista
São Paulo Guarulhos
Taubaté
Recife
Serra
Betim
Santa Luzia
Soluções Usiminas
Steel Processing

33
11 industrial units in MG, SP, RS, ES and PE.
Processing capacity of 2 million tons/year.
2Q12 Net Revenues of R$443 million
Leadership:
Is the leader in the steel distribution
sector since 2010, according to INDA.
Soluções Usiminas
Steel Processing

Automotiva Usiminas
34
Clients 500
km
1.000
km
1.500
km
Pouso Alegre Unit
Steel Processing

35
Pouso Alegre – MG
– Close to major auto makers.
– Full service company.
2Q12 Net Revenues of R$73 million
Major Clients:
Ford, Mercedes Benz, Fiat, Volkswagen,
Volvo, General Motors, International Trucks,
Honda Toyota, PSA Peugeot Citroën, Scania.
35
Automotiva Usiminas
Steel Processing

36
Capital Goods

Ipatinga – MG
It is one of the largest capital goods’ company in the
country.
2Q12 Net Revenues of R$205 million
Market Sectors:
– Industrial Assembly
– Structures / Metal Bridges and Blanks
– Industrial Equipment
– Industrial Erection
– Foundry and Railcars
Highlights:
– Supply of 30 thousand tons of blanks for wind towers of
Gestamp Wind Steel.
37
Usiminas Mecânica
Capital Goods

38
Ship Panel
3rd Bridge in Brasília
Ship Blocks Plant Design
Usiminas Mecânica
Capital Goods – some of its projects

Clique para
editar o texto
mestre
Usiminas and its
Business Units
Financial
Highlights
Market
Overview
39
Agenda

40
EBITDA – R$ Million
Sales – thousand tons (steel products)
Net Revenues – R$ Million
Crude Steel Production – thousand tons
1,583 1,512
1,888
2Q11 1Q12 2Q12
365
190 232
2Q11 1Q12 2Q12
3,026
2,886
3,225
2Q11 1Q12 2Q12
1,858
1,672
1,845
2Q11 1Q12 2Q12
2Q12 Consolidated Results
Highlights

41
954 1,344
1,547
2,429
3,072
5,624 5,525
4,368
5,003
6,008
1,485
2,650
1,264
422
40%
34%
32%
37% 35%
46% 42%
35% 36%
38%
14%
20%
11%
7%
1999 2000 2001 2002 2003 2004 2005 2006 2007 2008 2009 2010 2011 1H12
Ebitda (R$) Ebitda Margin
Ebitda / Ebitda Margin
(annualy)
42 *IFRS
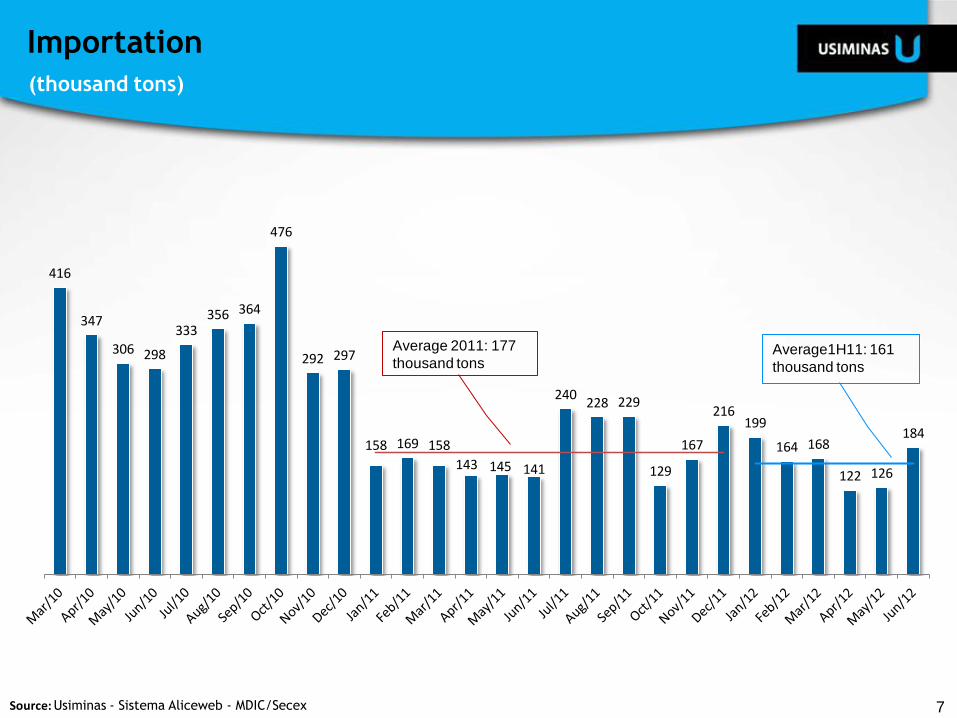
337 365
343
218
190
232
11% 12%
12%
8%
7% 7%
0%
2%
4%
6%
8%
10%
12%
14%
100
150
200
250
300
350
400
450
500
1Q11 2Q11 3Q11 4Q11 1Q12 2Q12
EBITDA Ebitda Margin
Ebitda / Ebitda Margin
(quarterly)
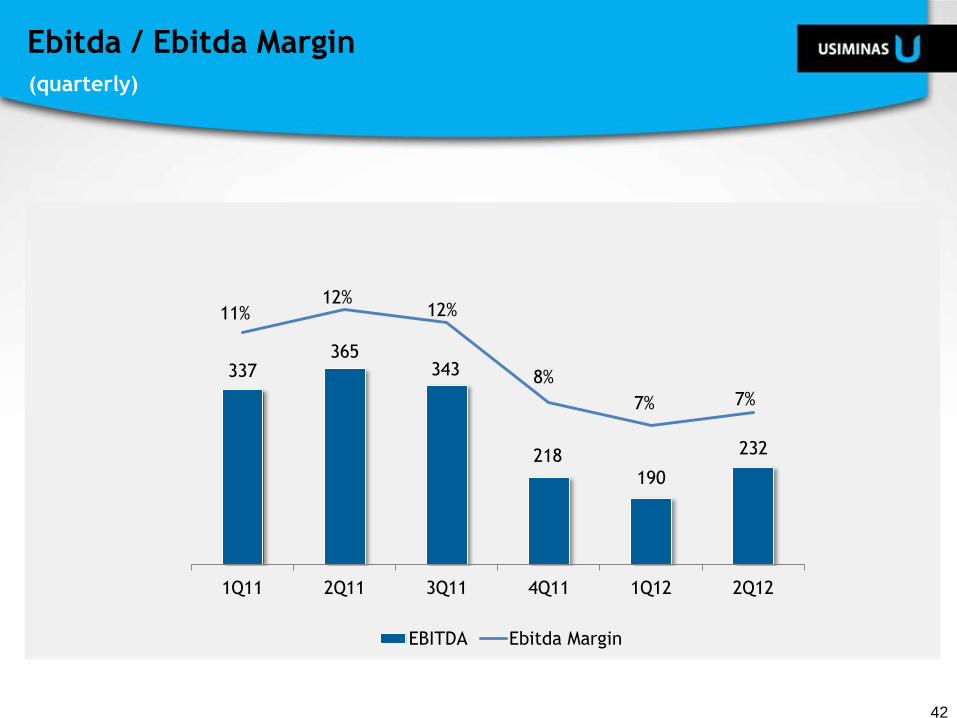
50 100
350
800
2,100 1,100
2011 2012
Steel Mine Others
2,500
2,000
129%
-48%
43
Capex
(R$ million)

44
2,501
288
864 922 905 735 416 302 33 155
2,343
227
1,048 628 486 723
267
1,023
2 2
Cash 2012 2013 2014 2015 2016 2017 2018 2019 2020 on
Local Currency Foreign Currency
515
4,844
1,912
1,550 1,458
683
1,325
157 35
1,391
Duration: R$: 40 months US$: 44 months
Debt Profile
(R$ million)

45
4.3 3.8
3.1 2.9
3.3
4.1
4.9
3.6
2.3 2.8
3.4
3.9 3.9 4.2
0.8 1.0 1.3 1.9 1.7 1.5 1.6 1.4
1.0 1.6
2.5 3.1
3.6 4.2
1Q09 2Q09 3Q08 4Q09 1Q10 2Q10 3Q10 4Q10 1Q11 2Q11 3Q11 4Q11 1Q12 2Q12
Net Debt (R$ bi) Net Debt/EBITDA (x)
Leverage – Consolidated Basis

5.31
5.16
4.97
4.73
4.27
3.79
1Q11 2Q11 3Q11 4Q11 1Q12 2Q12
-9,7%
-11,2%
-20% = -R$938 Mi
46
Working Capital - Consolidated
(R$ billion)

128 111 113
115
79 97
242
189
210
Quarter Average 2011 1Q12 2Q12
General and Administrative Selling Total SG&A
47
SG&A - Consolidated
(R$ million)
48
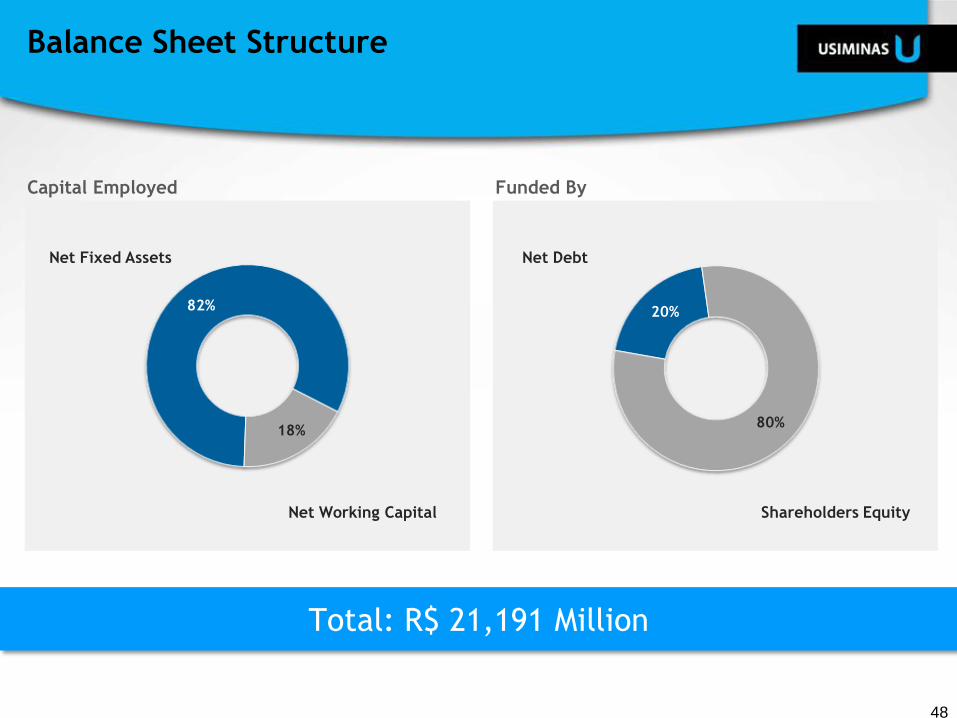
Capital Employed Funded By
Total: R$ 21,191 Million
82%
18%
20%
80%
Net Working Capital
Net Fixed Assets
Shareholders Equity
Net Debt
Balance Sheet Structure

Cristina Morgan C. Drumond Head of IR
[email protected] Phone: 55-31-3499.8772
Fax: 55-31-3499.9357
www.usiminas.com/ri
ADR
Level I
Luciana Valadares dos Santos [email protected]
Phone: 55-31-3499.8619
Leonardo Karam Rosa [email protected]
Phone: 55-31-3499.8056
Diogo Dias Gonçalves [email protected]
Phone: 55-31-3499.8710
Declarations relative to business perspectives of the Company, operating and
financial results and projections, and references to the growth of the
Company, constitute mere forecasts and were based on Management’s
expectations in relation to future performance. These expectations are highly
dependent on market behavior, on Brazil’s economic situation, on the
industry and on international markets, and are therefore subject to change.