Utah State University Utah State University
DigitalCommons@USU DigitalCommons@USU
All Graduate Theses and Dissertations Graduate Studies
5-2006
Use of Natural Antioxidants to Control Oxidative Rancidity in Use of Natural Antioxidants to Control Oxidative Rancidity in
Cooked Meats Cooked Meats
Mihir Vasavada Utah State University
Follow this and additional works at: https://digitalcommons.usu.edu/etd
Part of the Food Chemistry Commons
Recommended Citation Recommended Citation Vasavada, Mihir, "Use of Natural Antioxidants to Control Oxidative Rancidity in Cooked Meats" (2006). All Graduate Theses and Dissertations. 5528. https://digitalcommons.usu.edu/etd/5528
This Dissertation is brought to you for free and open access by the Graduate Studies at DigitalCommons@USU. It has been accepted for inclusion in All Graduate Theses and Dissertations by an authorized administrator of DigitalCommons@USU. For more information, please contact [email protected].
USE OF NATURAL ANTIOXIDANTS TO CONTROL OXIDATIVE RANCIDITY IN
COOKED MEATS
by
Mihir Vasavada
A dissertation submitted in partial fulfillment of the requirements for the degree
of
DOCTOR OF PHILOSOPHY
m
Nutrition and Food Sciences
UTAH STATE UNIVERSITY Logan, Utah
2006
Copyright © Mihir Vasavada 2006
All Rights Reserved
11
ABSTRACT
Use of Natural Antioxidants to Control Oxidative Rancidity in Cooked Meats
by
Mihir Vasavada, Doctor of Philosophy
Utah State University, 2006
Major Professor: Dr. Daren P . Cornforth Department: Nutrition and Food Sciences
The research in this dissertation focused on determining antioxidant effects of
various natural antioxidants in cooked meat systems. Milk mineral (MM), spices, and
raisin paste were used in cooked meat systems to verify their potential antioxidant
properties .
111
The MM study determined the antioxidant activity of 1.5% MM added to uncured
cooked beef meatballs, and possible additive effects of MM in combination with 20-ppm
or 40-ppm sodium nitrate in cooked beef sausages . There was no additive inhibition of
lipid oxidation in samples containing 20-ppm or 40-ppm sodium nitrite plus 1.5% MM.
Cooked meat yield was not different between control meatballs and those containing
MM. As expected, treatments containing nitrite had higher redness (a*) values than
samples without nitrite. The MM at 1.5% was a very effective antioxidant as compared to
controls.
The Garam Masala (GM) study determined the antioxidant effects and sensory
attributes of the individual spices in an Indian spice blend GM in cooked ground beef,
lV
and possible additive antioxidant effects between Type I and Type II antioxidants. All
spices had antioxidant effects on cooked ground beef, compared to controls without
spices, with cloves being the most effective. All spices at their lowest effective
recommended level effectively lowered the perception of rancid odor and rancid flavor in
cooked ground beef as compared to control samples. As expected, most spices also
imparted distinctive flavors to the cooked ground beef. Type II antioxidants (iron binding
phosphate compounds) were more effective than individual Type I antioxidants (spices
and butylated hydroxytoluene; BHT) in cooked ground beef. There was a positive
additive antioxidant effect seen with rosemary + MM and rosemary + sodium
tripolyphosphate (STPP) treatments as compared to individual rosemary treatment. There
was no additive antioxidant effect observed for other combinations of spices with
phosphate antioxidants.
The raisin study was done to determine the antioxidant activity of raisin paste
added to cooked ground beef, pork, and chicken. Thiobarbituric acid (TBA) values were
measured using the distillation method, on the distillates, to avoid interference from sugar
in the raisins. Beef, pork, and chicken flavor intensity, rancid flavor intensity, and raisin
flavor intensity were evaluated by a trained sensory panel (n = 6). Addition of 2% raisin
paste effectively inhibited rancid flavor development for 14 days after cooking in cooked
ground beef, pork, and chicken. Sugar added at levels equivalent to that contributed by
the raisins inhibited rancidity, probably due to antioxidant effects of Maillard browning
products, suggesting that the antioxidant effect of raisins was due to their sugar content.
(216 pages)
V
ACKNOWLEDGMENTS
I wish to extend sincere and heartfelt thanks and gratitude to my major professor
and mentor, Dr. Daren P. Cornforth . Without his continuous encouragement , guidance,
and assistance, completion of this degree would not have been possible. I would also like
to thank my committee members, Dr. Deloy Hendricks, Dr. Donald McMahon, Dr. Marie
Walsh , and Dr. Steven Aust, for all their help and technical guidance during this work.
I wish to thank my labmates and friends Karin Allen, Saum ya Dwivedi, A vanthi
Vissa, Preetha J ayasingh, and Liza John, Jeff Wu, and Paul Joseph for all their help and
support during my stay in Logan. I would also like to thank all my other friends in Logan
for their support and love over these years. I gratefully acknowledge financial support
received from the Agricultural Experiment Station at Utah State University, Dairy
Manag ement Incorporated, Glanbia Foods, and the California Raisin Board during the
course of this project.
I wish to thank my brother Amit for his love and support through the years.
Finally I would like to thank my parents, Mr . Narendra Vasavada and Mrs. Kalpana
Vasavada , for teaching me the importance of knowledge and for their encouragement and
support throughout my career.
Mihir Vasavada
VI
CONTENTS
Page
ABSTRACT ....................................................................................................................... iii
ACKNOWLEDGMENTS ................................................................................................... V
LIST OF TABLES······························································· ............................................... X
LIST OF FIGURES ........................ ......... ................... ...... ...... ......... ............................. ... xiv
LIST OF SYMBOLS, NOTATIONS, AND DEFINITIONS .......................................... xvi
CHAPTER
1. INTRODUCTION AND OBJECTIVES ................................................................. 1
Hypothesis .......... .......... .............................................................................. ....... . l References .......................................................................................................... 6
2. LITERATURE REVIEW ....... .................... ...... ................ ......... ............ .................. 9
Lipid Oxidation ........................ ........................... ......... .............. ........... .......... ... 9
Lipid oxidation in meat products ............................................................... 12 The role of lipids in development of WOF ................................................ 13 Influence of heating and grinding ....................... ........... ............................ 14 Role of Iron in lipid oxidation ................................................................... 15 Factors affecting lipid oxidation ................................................................ 19 Tests to determine lipid oxidation .............................................................. 19
Food Antioxidants ............................................................................................ 20
Type I antioxidants ............... ..................................................................... 20 Mechanism of action of some common Type I antioxidants ..................... 23 Maillard reaction products .......................................................... ............... 25 Antioxidant effect of spices used in Garam Masala spice blend ............... 25
Black pepper .............................. ....... .................. ................................. 26 Caraway ............................................................................................... 26 Cardamom ............................. ............................................................. .. 26 Chili ........... ........... ....... ......................... ......................... .................. ..... 27 Cinnamon ............................................................................................. 27
Vll
Cloves .................................................................................................. 27 Coriander. ....................... ........................................... ........................... 28 Cumin ................................ ....................... ................................. ........... 29 Fennel .................................................... ........................................... .... 29 Ginger .................................................. ................................................ 30 Nutmeg ....................................................................... .......................... 31 Salt .............................................................. ......................................... 31 Star anise .............................. ...................................... ........................ .. 32
Raisins as antioxidants in meat.. ........................... ..................................... 33 Type II antioxidants .......... .......................................................... ............... 34 Sodium tripolyphosphate as a Type II antioxidant .................................... 34 Nitrites and nitrates .................................................................................... 36 Phytic acid ................................................ .................................... .............. 37 Milk mineral. ............. ........................................................... ...................... 38 Spices as possible Type II antioxidants ................................................ .... .38
Reference s .................... ..................................... ................ ......... ...................... 39
3. EVALUATION OF MILK MINERAL ANTIOXIDANT ACTIVITY IN BEEF MEATBALLS AND NITRITE - CURED SAUSAGE ........................................ 60
Abstract .................................... ....................... ............. .......... ......................... . 60 lntroduction ..................................................................................................... . 61 Materials and Methods ................................... ....................... ........................... 62
Experimental design and statistics ..................................................... ........ 62 Sample preparation ................... ...................................... ........................... 63 Cooked yield .................................................... ..................... ..................... 64 Hunter color measurement ............................................ ......................... .... 64 TBA value .............................. .......... ........ ............................................ ...... 65
Results and Discussion ....................... ....................... .......... ............................ 66 Conclusion ............ ..................... ......................... .................. ........... ................ 70 References .............................. ......................... .................. ...................... ......... 71
4. EVALUATION OF GARAM MASALA SPICES AND PHOSPHATES AS ANTIOXIDANTS IN COOKED GROUND BEEF .......................................... .... 74
Abstract ......................................................... ............................... .................. .. 74 Introduction ........ ............................ ........................................ .......... ................ 7 5 Materials and Methods .................. ................. ................................ .................. 78
Comparison of TBA values during storage .................. .................. ........... 78
Vlll
Sensory evaluation ..................................................................................... 80 Comparison of Type I and Type II antioxidant effectiveness .................... 82 Statistical analysis ...................................................................................... 83
Results and Discussion .................................................................................... 84
Comparison of TBA values during storage ............ .... ............................... 84 Sensory evaluation results ......................... .............. ......... ........ .................. 87 Comparison of Type I and Type II antioxidant effectiveness ...... .......... .... 91
Conclusion .......................................... ......... ................ ................................. ... 93 References ............ ....................................... .............. ........ ....... ............... ......... 94
5. EVALUATION OF ANTIOXIDANT EFFECTS OF RAISIN PASTE IN COOKED GROUND BEEF, PORK , AND CHICKEN ...... ............... ...... ............. 98
Abstract .............. ....................... ......... ........ ......... ............. .............. ............. ..... 98 Introduction .......... ............ ............. ........... ......................... ........... .......... .......... 99 Materials and Methods ...................................... ....... .............. ........................ 101
Sample preparation ................................ .............. .................................... 101 TBA test ................. ............ .......... ....... ..... .................. .......... ....... ............. 102 Sensory evalutation ......... .............. ........... .......... .......... ........................... . 102 Hunter color measurements ....................................... .......... .................... 103 Experimental design ............................................. ................. .............. ..... 104
Results .................. .................................. ........ .......... ......... .......... ................ ... 104
TBA value ......................... ....................... ....... ............. ........... ................. 105 Sensory evaluation ............. ............. .................. ....... ..... ........ ..... .............. 109
Discussion ...................................................................................................... 114 Conclusion ............................. ........................................................................ 115 References ............. .................... ................... ............. ........ .......... ..... .............. 116
6. OVERALL SUMMARY ............................................................... ...................... 121
References .............. ............... ....... ..................... ............. ...................... ....... ... 123
APPENDICES .......... .................................................... ....................................... ............ 124
APPENDIX A. CHINESE 5- SPICE PAPER .......... ........................................ ........ 125
lX
EVALUATION OF ANTIOXIDANT EFFECTS AND SENSORY ATTRIBUTES OF CHINESE 5 - SPICE INGREDIENTS IN COOKED GROUND BEEF ....... ................................................................................... ........ 126
Abstract ................................................. ......................................................... 126 Introduction ....................................................... ................ .................. ....... .... 127 Materials and Methods .............................................. ...... ............... ............ .... 129
Experiment 1 -TBA assay ...................................... ................. .......... ..... 129 Experiment 2 - Sensory evaluation .................... ........ ....... ........... ....... .... 130 Experiment 3 - Aerobic plate count .......... .................................. ............ 130 Sample preparation ........................ ................................. ......................... 131 TBA value ......... ................................. ..................... ................................. 131 Sensory evaluation ................................ ................. ......... ............... .... ...... 132
Results and Discussion .......................... ............ ............................................ 134
Experiment 1 - TBA assay of cooked ground beef with individual spices ........ .................................................................................... ............ 134 Experiment 2 - Sensory evaluation ............ .................. ......... .................. 141 Experiment 3 -Aerobic plate count ................................ ................ ........ 144
Conclusions .......................... ........ .................................................................. 145 References ................................. ........................................... ...... .............. ...... 145
APPENDIX B. DATA FOR CHAPTER 3 ................................................................ 150 APPENDIX C. DATA FOR CHAPTER 4 ................................................................ 159 APPENDIX D. DATA FOR CHAPTER 5 .................. .............................................. 176 APPENDIX E ........... ............ ............. ...... ................................... ............................... 192 CURRICULUM VITAE ................................................................... ........ ................. 197
X
LIST OF TABLES
Table Page
1. Composition of milk mineral ....................................................................................... 63
2. Formulation of beef meatballs and beef sausage ......................................................... 64
3. Summary of significance (P < 0.05) as determined by analysis of variance (ANOV A) ...................... ................................................................................ 66
4. Pooled means for treatment main effects, storage time main effects, and their interactions on Hunter color L*, a* and b* valuesa ..................................................... 67
5. Mean TBA± standard deviation values pooled over storage time, for the 2- way interaction of treatment x spice level (0, 0.1, 0.5, or 1.0% of raw meat wt) ............... . 85
6. Mean trained panel sensory scores and thiobarbituric acid (TBA) values of spice-treated, cooked ground beef crumbles after 15 d storage at 2°C ................................. 88
7. Treatment main effects on TBA values, pooled over time and sampling method, for cooked ground beef treated with Type I or Type II antioxidants, and their combinations ................................................................................................................ 93
8. Interaction effects of treatment x storage time on TBA values (n = 6) of cooked ground beef formulated with raisin paste or glucose ............................................. .... 106
9. Interaction effects of treatment x storage time on TBA values (n = 6) of cooked ground pork formulated with raisin paste or glucose ............................... .................. 107
10. Interaction effects of treatment x storage time on TBA values (n = 6) of cooked ground beef formulated with raisin paste or glucose ................................................. 108
11. Effect of raisin level on Hunter color values of cooked ground chicken ................... 113
Al. Summary of significance (P < 0.05) as determined by analysis of variance (ANOVA) .................................................................................................... 134
A2. Mean thiobarbituric acid (TBA) values 3 for cooked ground beef formulated with the individual s~ices of Chinese 5-spice, at use levels of 0.1 %, 0.5%, and 1.0% of raw meat weight ........... .................................................................................................... 136
A3. Mean trained panel sensory scores and thiobarbituric acid (TBA) values of spice-treated, cooked ground beef crumbles after 15 d storage at 2°C ............................... 143
Xl
A4. Correlation coefficients (r) among mean trained panel sensory scores and thiobarbituric acid (TBA) values of spice-treated, cooked ground beef crumbles after 15 d storage at 2°C ......................................................... ................................... 144
B 1. Main effects of treatment and storage time on TBA values of cooked meatballs and nitrite-cured sausage ....................................................... ............................. .............. 151
B2. Effect of treatment x replicate x storage time interaction on TBA value of cooked meatballs and nitrite-cured sausages ................................... ......... .................. ............ 152
B3. Effect of treatment x replicate x storage time on Hunter color values of cooked meatballs and nitrite-cured sausage ............ ............................................................ ... 154
B4. Data showing effect of treatment effect on cooked yield of meatballs with and without added milk mineral ........... .............. ............................. ............ ................ ..... 156
BS. ANOV A table for milk mineral cooked yield data ....................... .............. .............. 157
B6. ANOV A table for milk mineral color data ............... ......................... ........................ 157
B7. ANOVA table for milk mineral TBA value data ........... ........................................... 158
C 1. Summary of significance (P < 0.05) of treatment ( each individual spice), storage time (1, 8, 15 d), spice levels (0, 0.1, 0.5, or 1.0% of meat weight), and their interactions on TBA values of cooked ground beef during refrigerated storage .............. ......... .... 160
C2. Correlation coefficients among mean trained panel sensory scores and thiobarbituric acid (TBA) values of spice-treated, cooked ground beef crumbles after 15 d storage at 2°c .................................... ......................................................................................... 168
C3. Data for calculation of correlation coefficients between TBA value and sensory scores for various spices of Garam Masala spice blend ............................................ 169
C4. Summary of significance (p < 0.05) of treatment (Type I or Type II antioxidants and their combinations), storage time (1, 8, 15 d), sampling method (method 1 or 2), and their various interactions on TBA values of cooked ground beef during refrigerated storage, as determined by analysis of variance (ANOV A) ........................................ 170
CS. Main effects of sampling method and storage time on TBA values of cooked ground beef added with various Type I and Type II antioxidants ......................................... 171
C6. Treatment x storage time interaction effects on TBA value of cooked ground beef added with various Type I and Type II antioxidants ................................................. 172
C7. ANO VA table for Garam Masala TBA value data .......... .......................... .............. . 174
XU
C8. ANOV A table for Garam Masala sensory data ................................. ........................ 174
C9. ANOVA table for Type I and Type II antioxidants additive effect data ................... 175
D 1. Mean TBA values for treatment and storage time main effects in cooked ground beef .................................................. .......................................................................... 177
D2. Mean TBA values for treatment and storage time main effects in cooked ground pork ................ ....................................... .............................................. ...................... 178
D3. Mean TBA values for treatment and storage time main effects in cooked ground chicken .............. ......................................................................................................... 179
D4. Mean sensory panel scores for storage time main effect in different cooked meats .................................................. ....... ............... ................................................. 180
D5. Interaction effects of treatment x storage time on sensory scores 1 (n = 18) of cooked ground beef formulated with raisin paste or glucose ...... ...... ........ .......... ................... 181
D6. Interaction effects of treatment x storage time on sensory scores 1 (n = 18) of cooked ground pork formulated with raisin paste or glucose ................................................. 182
D7. Interaction effects of treatment x storage time on sensory scores 1 (n = 18) of cooked ground chicken formulated with raisin paste or glucose ........................................ ... 183
D8. Data for determining correlation coefficients between mean TBA values and sensory scores in cooked ground beef ........... ................... ................................. ...................... 184
D9. Data for determining correlation coefficients between mean TBA values and sensory scores in cooked ground pork .................................................................................... 185
DIO. Data for determining correlations coefficient between mean TBA values and sensory scores in cooked ground chicken .................................................................. 186
D 11. Data for Hunter color values of cooked ground chicken ......................................... 187
Dl2. ANOVA table for beef raisin TBA data ................................................................. 188
D13. ANOVA table for pork raisin TBA data ...................... .................................. ......... 188
D14. ANOVA table for chicken raisin TBA data ............................................................ 189
D15. ANOVA table for beef raisin sensory data ............................................................. 189
xiii
D16. ANOVA table for pork raisin sensory data ........................... ................................. .190
D 17. ANOV A table for chicken raisin sensory data ................................ ............... ......... 191
D18. ANOVA table for chicken raisin color data ............................................................ 191
XIV
LIST OF FIGURES
Figure Page
1. Schematic diagram for muscle food lipid oxidation ..... .................. ............................. 12
2. Mean thiobarbituric acid (TBA) values+ standard error of the mean (SEM) for treatment X storage time interactions (1 , 8, or 15 d storage at 2°C) ............................ 69
3. Comparison of mean TBA values after 15 d storage for cooked ground beef formulated with spices used in Garam Masala, at their recommended levels ...... ....... 86
4. Mean flavor intensity scores pooled over storage time for cooked ground beef with added raisins or glucose. Value s are means pooled over storage time (1, 4, 7, 14 d at 2°C) ............................................................................................................................ 1 iO
5. Mean flavor intensity scores pooled over storage time for cooked ground pork with added raisins or glucose. Values are means pooled over storage time (1, 4, 7, 14 d at 2°C) ............................................................................................................................ 111
6. Mean flavor intensity scores pooled over storage time for cooked ground chicken with added raisins or glucose. Values are means pooled over storage time (1, 4, 7, 14 d at 2 °C) ........................................... ........................ ............ ................................. ..... 112
Al. Effect of cinnamon concentration (0, 0.1 , 0.5, or 1.0% of meat wt.) on thiobarbituric acid values of cooked ground beef during refrigerated storage ....... .......................... 137
A2. Effect of clove concentration (0, 0.1, 0.5 , or 1.0% of meat wt.) on thiobarbituric acid values of cooked ground beef during refrigerated storage ......................................... 138
A3. Effect of fennel concentration (0, 0.1, 0.5, or 1.0% of meat wt.) on thiobarbituric acid values of cooked ground beef during refrigerated storage ............... .......................... 138
A4. Effect of pepper concentration (0, 0.1, 0.5 , or 1.0% of meat wt.) on thiobarbituric acid values of cooked ground beef during refrigerated storage ................................. 139
AS. Effect of star anise concentration (0, 0.1, 0.5, or 1.0% of meat wt.) on thiobarbituric acid values of cooked ground beef during refrigerated storage ................................. 139
A6. Effect of Chinese 5 - spice concentration (0, 0.1, 0.5, or 1.0% of meat wt.) on thiobarbituric acid values of cooked ground beef during refrigerated storage ........ .. 140
Cl. Effect of black pepper concentration (0, 0 .1, 0.5, or 1.0% of meat wt.) on thiobarbituric acid values of cooked ground beef during refrigerated storage .......... 161
xv C2. Effect of caraway concentration (0, 0.1, 0.5, or 1.0% of meat wt.) on thiobarbituric
acid values of cooked ground beef during refrigerated storage ................................. 161
C3. Effect of cardamom concentration (0, 0.1, 0.5, or 1.0% of meat wt.) on thiobarbituric acid values of cooked ground beef during refrigerated storage ................................. 162
C4. Effect of chili powder concentration (0, 0.1, 0.5, or 1.0% of meat wt.) on thiobarbituric acid values of cooked ground beef during refrigerated storage .......... 162
CS. Effect of cinnamon concentration (0, 0.1, 0.5, or 1.0% of meat wt.) on thiobarbituric acid values of cooked ground beef during refrigerated storage ........................... ...... 163
C6. Effect of clove concentration (0, 0.1, 0.5, or 1.0% of meat wt.) on thiobarbituric acid values of cooked ground beef during refrigerated storage ......................................... 163
C7. Effect of coriander concentration (0, 0.1, 0.5, or 1.0% of meat wt.) on thiobarbituric acid values of cooked ground beef during refrigerated storage ........ ...... ....... ........... . 164
C8. Effect of cumin concentration (0, 0.1, 0.5, or 1.0% of meat wt.) on thiobarbituric acid values of cooked ground beef during refrigerated storage ................. ........................ 164
C9 . Effect of fennel concentration (0, 0.1, 0.5, or 1.0% of meat wt.) on thiobarbituric acid values of cooked ground beef during refrigerated storage ............................. ............ 165
CIO. Effect of ginger concentration (0, 0.1, 0.5, or 1.0% of meat wt.) on thiobarbituric acid values of cooked ground beef during refrigerated storage ....... ........ ..... ........ ..... 165
Cl 1. Effect of nutmeg concentration (0, 0.1, 0.5, or 1.0% of meat wt.) on thiobarbituric acid values of cooked ground beef during refrigerated storage .................. ............... 166
C12. Effect of retail Garam Masala concentration (0, 0.1, 0.5, or 1.0% of meat wt.) on thiobarbituric acid values of cooked ground beef during refrigerated storage .......... 166
C13. Effect of salt concentration (0, 0.1, 0.5, or 1.0% of meat wt.) on thiobarbituric acid values of cooked ground beef during refrigerated storage ......................................... 167
C14. Effect of star anise concentration (0, 0.1, 0.5, or 1.0% of meat wt.) on thiobarbituric acid values of cooked ground beef during refrigerated storage ................................. 167
ANOVA
BHA
BHT
C
CIE
Ctrl
CFU
d
DPPH
GAE
GM
LSD
MM
MDA
MRP
NaN02
Nit
ORAC
PG
PUFA
LIST OF SYMBOLS, NOTATIONS, AND DEFINITIONS
Abbreviation Key
Analysis of variance
Butylated hydroxyanisole
Butylated hydroxytoluene
Celsius
Commission Internationale De L'Eclairage
Control
Colony forming units
Day
1,1-diphenyl-2-picrylhydrazyl
Gallic acid equivalents
Garam Masala
Least significant difference
Milk mineral
Malonaldehyde
Maillard reaction products
Sodium nitrite
Nitrite
Oxygen radical absorbance capacity
Propyl gallate
Polyunsaturated fatty acids
XVI
RBC
RM
STPP
TBA
TEARS
TBHQ
TE
USDA
WOF
Rancid beef control
Rosemary
Sodium tripolyphosphate
Thiobarbituric acid
Thiobarbituric acid reactive substances
Tertiary butylated hydroxyquinone
Trolox equivalents
United States Department of Agriculture
Warmed-over flavor
xvii
CHAPTER 1
INTRODUCTION AND OBJECTIVES
Lipid oxidation is one of the major processes occurring during food deterioration.
It is of great economic concern to the food industry because it leads to the development
of various off-flavors and off-odors in oils and fat-containing foods. The development of
rancid off-flavors renders these foods less acceptable and decreases their nutritional
quality.
Spices have been used for many years for various applications in the food
industry. It is assumed that the spices mask, rather than prevent rancid off-flavor. In the
U.S.A ., butylated hyrdroxyanisole (BHA), BHT, STPP, and nitrite are the main additives
used to control lipid oxidation in cooked meats. Nitrite is the main "cure" ingredient for
cured cooked meats such as ham, bacon and cured sausges. For uncured cooked meats
BHA, BHT, or STPP are the main antioxidants.
Hypothesis
My hypothesis is that there are a number of alternative antioxidants (MM,
individual spices of GM and raisin paste) that have equal or greater antioxidant effects
compared to BHT or STPP in cooked ground meats. I also hypothesize that the Type II
iron chelating antioxidants (MM, STPP, nitrites) will have greater antioxidant effects in
an iron-rich system (cooked meats) than oxygen-radical scavenging Type I antioxidants,
such as BHT or rosemary extract.
Preventing spoilage will always remain of great interest to the meat industry. The
main problem concerned with the chemical deterioration in meats is the oxidative
2 spoilage resulting due to the reaction of oxygen and lipids, and formation of free
radicals. Oxidative deterioration of meats occurs rapidly after cooking meats. Oxidation
of unsaturated fatty acids in cooked meats during storage and reheating results in stale or
rancid flavors known as warmed-over flavor (WOF) (Sato and Hegarty 1971). The
development of WOF is an undesirable sensory characteristic reminiscent of the smell of
paint or wet cardboard (St. Angelo and others 1988).
Lipid oxidation occurs to a great extent in ground beef stored in a high oxygen
atmosphere (Jayasingh and others 2002). Lipid oxidation in meats prior to cooking
affects the flavor and color of meat products (McMillin 1996). After cooking, lipid
oxidation mainly involves the greater availability of oxidation promoters, due to the
release of non-heme iron, and of phospholipids from disrupted cell membranes
(Younathan 1985).
The increased demand for convenience foods and the evolving markets for
precooked meats call for more options to prevent lipid oxidation in meat products after
cooking . The WOF problem of cooked meat has assumed much greater significance in
recent years due to a rapid increase in fast food service facilities, requiring the use of
large quantities of precooked or partially cooked meats or meat products. In these
facilities, cooked meat may be kept warm for a variable time prior to serving, which can
cause it to have off-flavors.
Antioxidants are substances that can delay onset, or slow the rate of oxidation.
There are two kinds of antioxidants, natural and synthesized. The main lipid-soluble
antioxidants currently used in foods are monohydric or polyhydric phenols with various
aromatic substitutions . The choice of an antioxidant in a food system depends on factors
3 such as potency of an antioxidant in a particular application, ease of incorporation in the
food, carry-through characteristics, sensitivity to pH, tendency to discolor or produce off
flavors, availability, and cost (Nawar 1996). For maximum efficiency, primary
antioxidants such as BHA, BHT, propyl gallate (PG), and tertiary butylhydroquinone
(TBHQ) are often used in combination with other phenolic antioxidants or with various
metal sequestering agents.
Antioxidants are considered food additives and their use is subject to regulation
under the Federal Food Drug and Cosmetic Act. Antioxidants for food products are also
regulated under the Meat Inspection Act, the Poultry Inspection Act, and various state
laws. In most instances the total concentration of authorized antioxidants, added singly or
in combination, must not exceed 0.02% by weight based on the fat content of food
(Nawar 1996).
The general public concern with the safety of chemical additives has stimulated a
continuing search for new antioxidants that may occur naturally in food or may form
inadvertently during processing . Compounds with antioxidant properties have been found
in spices, oil seeds, citrus pulp and peel, cocoa shells, oats, soybean, hydrolyzed plants,
animal and microbial proteins, and in products that have been heated and/ or have
undergone non-enzymatic browning.
Generally lipid oxidation is faster in cooked meat than in raw meat (Tichivangana
and Morrissey 1985). The greater propensity for WOF in cooked and comminuted
products is due to release of non-heme iron during cooking and grinding (!gene and
others 1979). Recently, it has been reported that dried MM, the dried permeate of ultra
filtered whey, has antioxidant properties in cooked meats, apparently due to iron-
4 chelation by colloidal phosphate (Cornforth and West 2002). Cooked ground pork
required 2% MM to maintain TBA number< 1.0 during storage at 2°C while samples
with 1 % MM maintained a TBA number< 2.0 (Cornforth and West 2002). Jayasingh and
Cornforth (2003) compared the antioxidative activity of 0.5% to 2.0% MM with that of
BHT and STPP in raw and cooked pork mince during frozen (-20°C) or cold (2°C)
storage. Cooked samples with MM or STPP had significantly lower TBA values than
were observed for the treatment with BHT. Nitrites and nitrates function as antioxidants
by binding to heme iron, which upon reduction forms NO-heme complexes that stabilize
the heme group during cooking. The non-heme iron released by cooking is the primary
prooxidant in cooked meats (Igene and others 1979). Thus, the first objective of this
dissertation was to evaluate possible additive antioxidant effects of MM and sodium
nitrite to reduce TBA values of cooked beef samples during storage at 2°C for 15 d.
According to the American Spice Trade Association (ASTA 2001) U.S.
consumption of spices exceeds 1 billion lb/ year. The U.S. per capita consumption has
continued to grow from 2.1 lb in 1980 to approximately 3.6 lb in 2000. Spices such as
cloves, cinnamon, black pepper, turmeric, ginger, garlic, and onions exhibit antioxidant
properties in different food systems (Y ounathan and others 1980; Al-J alay and others
1987; Jurdi-Haldeman and others 1987). Spices have antioxidant properties due to the
presence of compounds such as flavanoids, terpenoids, lignans, and polyphenolics (Craig
1999).
Antioxidative effects have been investigated for dried and ethanolic extracts of
spices (marjoram, wild marjoram, caraway, peppermint, clove, nutmeg, curry powder,
cinnamon, sage, basil, thyme , and ginger) on the oxidative stability of fresh minced
5 chicken meat, and fresh and microwave cooked pork patties pretreated with NaCl, and
subjected to either refrigerated or frozen storage (4°C and -18°C, respectively).
Application of dried spices to chicken meat inhibited lipid oxidation in frozen samples,
and dried marjoram, wild marjoram and caraway had the highest antioxidative activity
(Abd-El -Alim and others 1999). Although the individual components of Garam Masala
have been shown to have antioxidant activity in model systems, my second objective was
to determine the optimum level of each spice for antioxidant properties in cooked ground
beef and to carry out sensory evaluation on cooked ground beef containing spices at their
recommended level. Tests were also conducted to determine which antioxidant type (I or
II) was most effective in cooked meat products and to evaluate possible additive
antioxidnat effects of Type I (cinnamon, clove, BHT, ground rosemary) and Type II
(MM, STPP) antioxidants used together in cooked ground beef.
Raisins are recognized as a good source of dietary antioxidants. According to the
USDA, raisins are second only to prunes in the ability to resist oxidation as measured by
the oxygen radical absorbance capacity (ORAC) test. Grapes and raisins have been
shown to contain various antioxidant compounds, including bioflavanoids (Shalashvili
and others 2002) proanthocyanidins (Foster 1997; Murga and others 2000), catechin
monomers (Katalinic 1999), procyanidin dimers (Yamakoshi and others 2002) and other
polyphenolic antioxidants (Meyer and others 1997; Frankel 1999). Bower and others
(2003) have reported that beef jerky formulated to contain 15% (w/w) raisin puree
produced conditions inhibitory to pathogenic bacteria by decreasing the pH to 5.4 and
water activity to 0.64, and increasing the antioxidant activity by> 600%. Although
raisins contain antioxidant compounds, their possible antioxidant effectiveness in cooked
6 ground meat systems has not been previously studied. Thus, the final objective of this
dissertation was to evaluate the possible antioxidant effects of raisin paste on TBA values
and trained panel rancidity scores in cooked ground beef, pork, and chicken.
References
Abd-El-Alim SSL, Lugasi A, Hovari J, Dworschak E. 1999. Culinary herbs inhibit lipid
oxidation in raw and cooked minced meat patties during storage. J Sci Food Agric
79(2):277-85.
Al-Jalay B, Blank G, McConnell B, Al-Khayat M. 1987. Antioxidant activity of selected
spices used in fermented meat sausage. J Food Protect 50:25-7.
ASTA. 2001. Statistics report. Am Spice Trade Assn, Washington, D.C.
Bower CK, Schilke KF, Daeschel MA. 2003. Antimicrobial properties of raisins in beef
jerky preservation. J Food Sci 68(4):1484-9.
Cornforth DP, West EM. 2002. Evaluation of the antioxidant effects of dried milk
mineral in cooked beef, pork, and turkey. J Food Sci 67(2):615-8.
Craig JW. 1999. Health promoting properties of common herbs. Am Clin Nutr 70:491S-
9S.
Foster S. 1997. Grapeseed extract. Health-Foods Business 43(4):42-3.
Frankel EN. 1999. Food antioxidants and phytochemicals: present and future. Euro J
Lipid Sci Tech 101(12):450-5.
Jgene JO, King JA, Pearson AM, Gray JI. 1979. Influence of heme pigments, nitrite, and
non-heme iron on the development of warmed-over flavor (WOF) in cooked
meat. J Agric Food Chem 27:838-42.
7 Jayasingh P, Cornforth DP, Brennand CP, Carpenter CE, Whittier DR. 2002. Sensory
evaluation of ground beef stored in high-oxygen modified atmospheric packaging.
J Food Sci 67(9):3493-6.
Jayasingh P, Cornforth DP. 2003. Comparison of antioxidant effects of milk mineral,
butylated hydroxytoluene and sodium tripolyphosphate in raw and cooked ground
pork. Meat Sci 66(1) :83-9.
Jurdi-Haldeman D, MacNeil JH, Yared DM. 1987. Antioxidant activity of onion and
garlic juices in stored cooked ground lamb. J Food Protect 50:411-3 .
Katalinic V. 1999. Grape catechins-natural antioxidants. J Wine Res 10(1):15-23.
McMillin KW. 1996. Initiation of oxidative processes in muscle foods. Proceedings of
American Meat Science Association; 49th Annual Reciprocal Meat Conference;
Brigham Young University, Provo, Ut., p 53-63.
Meyer AS, Ock SY, Pearson DA, Waterhouse AL, Frankel EN. 1997. Inhibition of
human low-density lipoprotein oxidation in relation to composition of phenolic
antioxidants in grapes (Vitis Vinifera). J Agric Food Chem 45(5): 1638-43.
Murga R, Luiz R, Beltran S, Cabezas JL. 2000. Extraction of natural complex phenols
and tannins from grape seeds by using supercritical mixtures of carbon dioxide
and alcohol. J Agric Food Chem 48(8):3408-12.
Nawar WW. 1996. Lipids. In: Fennema OR, editor. Food Chem. 3rd ed. New York:
Marcel Dekker Inc. p 225-319.
Sato K, Hegarty GR. 1971. Warmed-over flavor in cooked meats. J Food Sci 36:1098-
102.
Shalashvili A, Zambakhidze N, Ugrekhelidze D, Parlar H, Leupold G, Kvesitadze G,
Simonishvili S. 2002. Antioxidant activity of grape bioflavonoids and some
flavonoid standards. Adv Food Sci 24(1):24-9.
St. Angelo AJ, Vercellotti JR, Dupuy HP, Spanier AM. 1988. Assessment of beef flavor
quality. A multidisciplinary approach. Food Technol 42 (6): 133-8.
Tichivangana JZ, Morrissey PA. 1985. Myoglobin and inorganic metals as proxidants in
raw and cooked muscles system. Meat Sci 15:107-16.
Yamakoshi J, Saito M, Kataoka S, Tokutake S. 2002. Procyanidin - rich extract from
grape seeds prevents cataract formation in hereditary cataractous (ICR / f) rats. J
Agric Food Chem 50(17):4983-8.
Younathan MT, Marjan ZM, Arshad FB. 1980. Oxidative rancidity in stored ground
turkey and beef. J Food Sci 45:274-5.
Y ounathan MT. 1985. Causes and prevention of warmed-over flavor. In Proceedings of
American Meat Science Association; 3gth Ann Recip Meat Conf; Louisiana State
University, Baton Rouge, La. p 74-80.
8
CHAPTER2
LITERATURE REVIEW
9
The physical and chemical changes in muscle foods during the conversion of
muscle to meat and post-mortem storage and utilization may alter the quality, amount,
nutritional value, healthfulness, and safety of meat. Changes in product or external
conditions during storage, result in deterioration of quality, including discoloration ,
development of off-flavors, loss of nutrients, textural changes, and progression of
spoilage and/ or pathogenicity (Skibsted and others 1994). Metabolic reactions resulting
from biological membrane disruption (Stanley 1991 ), and biochemical oxidative
processes (Xiong and Decker 1995) are major influences on deteriorative changes.
Muscle foods are susceptible to oxidative activity because of their lipid, protein, pigment,
vitamin and carbohydrate composition (Kanner 1994). Lipid oxidation has also been
shown to be one of the major causes of quality deterioration of processed meat, imposing
an adverse effect on flavor, color, and texture as well as nutritional value (Byrne 2000).
Lipid Oxidation
The muscle food components that are most influenced by oxidative processes
included unsaturated fatty acids in lipids, amino acids in proteins, heme groups in
pigments, and the structural elements of vitamins with conjugated double bonds. There
are many free radical forms of atomic species with one or more unpaired electrons that
are involved in oxidation reactions, including, hydrogen atoms (H• ), tricholoromethyl
(CCb•) from liver metabolism of CC14, superoxide (0 2• ), hydroxyl (OH•), thiyl (RS•)
10 with unpaired electrons residing on sulfur, peroxyl (R0 2• ), alkoxyl (RO•), and oxides
of nitrogen (NO• , N02•), (Foote 1985; Kanner 1994; Halliwell and others 1995; Thomas
1995). These radicals come in contact with other non-radical molecules in the biological
systems, and generate new radicals through reactions of addition, reduction or electron
donation , oxidation by electron acceptance, or oxidation by hydrogen atom transfer
(Halliwell and others 1995). These reactive radicals may initiate free-radical chain
reactions, such as lipid peroxidation , pigment discoloration, or interactions between lipids
and heme pigments (Foote 1985; Kanner and others 1987; Frankel 1991; Thomas 1995) .
The perhydroxyl and hydroxyl radicals , ferryl iron (IV), and lipid free radicals are
the primary activators for participation of oxygen and metal compounds in one-electron
reduction processes (Kanner 1994). Johnson and others (1992) have reviewed the several
important reactions between the iron in myoglobin and oxygen derivatives and mentioned
the Fenton reaction (Fe+2 + H20 2 "7 Fe+3 +Off+ OH•), superoxide reaction (Fe+3 +
0 2•- 7 Fe+2 + 0 2), and Haber-Weiss reaction (H202 + 0 2•- 7 Off+ OH•+ 0 2) to be
the main reactions involved.
Lipid peroxidation occurs in unsaturated fatty acids in lipid depots and in
phospholipids in membranes through enzymatic and nonenzymatic autocatalytic
mechanisms (Rhee 1988; Stanley 1991). The enzymatic reactions in several animal
tissues occur due to the presence of enzymes such as lipoxygenase, peroxidase and
microsomal enzymes, which catalyze insertion of oxygen into polyunsaturated fatty acids
with unconjugated dienes (Kanner and Kinsella 1983a, b; Hsieh and Kinsella 1989;
Stanley 1991). Phospholipases hydrolyze phospholipids to create conditions less
11 favorable for chain propagation, by releasing free fatty acids from the membrane
surface (Shewfelt and others 1981).
The nonenzymic autocatalytic pathway of free-radical chain reaction for lipid
peroxidation is categorized into initiation, propogation and termination phases (Kanner
and others 1987; Hamilton 1989; Shahidi 1994). Lipid oxidation is terminated when free
radicals combine to give stable, non-propagating reactions or by reduction of a donor that
cannon propagate.
Oxygen usually exists in the stable triplet state, but when oxygen is exposed to
light or heat, it may convert to a singlet, excited state. In this excited state, oxygen
abstracts hydrogen atoms from the carbon adjacent to the fatty acid double bonds,
producing free (R •) radicals (Nawar 1996). The role of iron-oxygen complexes has been
reviewed by Morrissey and others (1998) as follows:
RH + HO• 7 R • + H20
Peroxyl radical is then formed when the fatty acyl radical reacts with oxygen;
R• +027 ROO•
The ROO• is highly reactive with other unsaturated fatty acids, thus propagating the
chain reaction as follows:
ROO• + RH 7 ROOH + R•
Morrissey and others (1998) reviewed that the lipid peroxides (ROOH) further react with
Fe2+ or Cu+ to give peroxide free radicals (ROO•) and alkyl radicals (RO•) as follows:
Fe2+ + ROOH _____ Fast ___ 7 Fe3+ +RO•+ Off
Fe3+ + ROOH _____ Fast ___ 7 Fe2+ + ROO• + H+
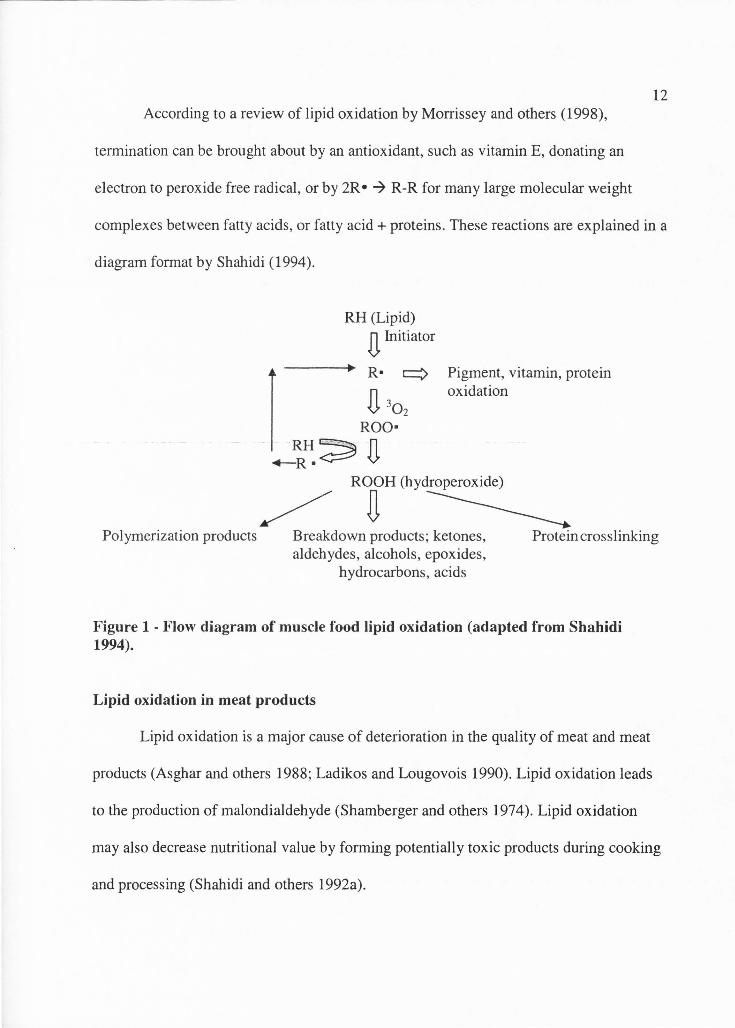
12 According to a review of lipid oxidation by Morrissey and others (1998),
termination can be brought about by an antioxidant, such as vitamin E, donating an
electron to peroxide free radical , or by 2R • 7 R-R for many large molecular weight
complexe s between fatty acids , or fatty acid+ proteins. These reactions are explained in a
diagram format by Shahidi (1994).
RH (Lipid) n Initiator
R• q
n 30 2 ROO•
Pigment, vitamin , protein oxidation
.__~~~ n ROOH (hydroperoxide)
/ ij -------------. Polymerization product s Breakdown products ; ketones, Protein crosslinking
aldehydes , alcohols , epoxide s, hydrocarbon s, acids
Figure 1 - Flow diagram of muscle food lipid oxidation (adapted from Shahidi 1994).
Lipid oxidation in meat products
Lipid oxidation is a major cause of deterioration in the quality of meat and meat
products (Asghar and others 1988; Ladikos and Lougovois 1990). Lipid oxidation leads
to the production of malondialdehyde (Shamberger and others 1974 ). Lipid oxidation
may also decrease nutritional value by forming potentially toxic products during cooking
and processing (Shahidi and others 1992a).
13 The factors affecting lipid peroxidation in animal tissues include species,
anatomical location, diet, environmental temperature, sex, age, phospholipids content,
and body composition (Gray and Pearson 1987). Processing factors that influence rate of
lipid peroxidation include composition of raw materials, time post-mortem, heating,
comminution or particle size reduction, and added ingredients such as salt, spices, and
antioxidants (Kanner 1994).
The role of lipids in the development of WOF
The development of WOF in cooked meat is generally regarded to be the result of
oxidation of tissue lipids (Ruenger and others 1978), with phospholipids being implicated
as the lipid component most readily susceptible to oxidation in cooked meat (Younathan
and Watts 1960). The phospholipids generally contain more poly unsaturated fatty acids
(PUFAs), which are very labile (Lea 1957). Igene and Pearson (1979) have provided
convincing evidence that total phospholipids are principally responsible for the
development of WOF in cooked beef and poultry. The triglycerides are much less
susceptible to oxidation than the phospholipids (Love and Pearson 1971), and hence the
triglycerides appear to exert only a minor influence on development of WOF. The rate
and degree of oxidative degradation has been directly related to the degree of
unsaturation of the lipids present (Igene and Pearson 1979; Tichivangana and Morrissey
1985) and degree of oxygen exposure (O'Grady and others 2000; Jayasingh and others
2002). Oxidation of unsaturated fatty acids in cooked meats during storage and reheating,
results in stale or rancid flavors known as WOF (Sato and Hegarty 1971). The heme
pigment content in conjunction with catalase activity may provide an indication of lipid
oxidation potential in raw meat, with PUFA amounts being a major determinant in
inter-species oxidation rate differences (Rhee and others 1996).
Influence of heating and grinding
14
Any process causing disruption of the muscle membrane system, such as grinding
or cooking, results in exposure of the labile lipid components to oxygen and thus
accelerates development of oxidative rancidity (Pearson and others 1977). Saturated fats
are relatively stable at the temperatures used in conventional canning operations, but
unsaturated fats deteriorate, under the conditions of oxygen and heat, to form a large
number of volatile compounds, which give rise to both desirable and undesirable flavors
(Pitcher 1993). Drying (dehydration) brings food component molecules into close
proximity, thereby increasing the likelihood that they will interact (Homer 1993). Also,
the removal of water from a food material increases its physical accessibility to
atmospheric oxygen through micro-capillaries that open up through the center of the
material, and as a result greatly increases exposure to atmospheric oxygen.
Lipid oxidation is generally faster in cooked meats as compared to raw meat
(Tichivangana and Morrissey 1985). Cooked meat develops rancid flavor more rapidly
than uncooked meat during refrigerated storage, resulting in WOF (Tims and Watts
1958). Heating accelerates development of oxidized flavor (rancidity) in meat and meat
products (Younathan and Watts 1960). According to Yamauchi (1972a, b), the
development of rancidity is most rapid in meat that is heated at 70°C for 1 h, and the
TBA value of cooked meat decreases as the cooking temperature increases above 80°C.
Huang and Greene (1978) confirmed that meat subjected to high temperatures and I or
15 long periods of heating developed lower TBA numbers than similar samples subjected
to lower temperatures for shorter periods of time. They postulated that antioxidant
substances produced during the browning reaction exert TBA-retarding activity, which
progresses as the meat is heated. Cooked (71 °C) ground pork patties could be kept warm
for 60 min at 71 °C without significantly increasing TBA number (Jayasingh and
Cornforth 2003). According to Hamm (1966), the Maillard reaction in meats begins at
about 90°C and increases with further increases in temperatures and heating times.
Catalase , which is present in uncooked meat and destroyed by heating, inactivates
hydrogen peroxide and could provide an explanation for the more rapid development of
lipid oxidation in cooked than in raw muscle foods (Hare! and Kanner 1985a).
Sato and Hegarty (1971) have reported a very rapid increase in TBA values, and
hence of WOF, for raw meats 1 h after grinding and exposure to air at room temperature .
They suggested that any catalysts of lipid oxidation present in the muscle system are
brought into contact with the oxidation-susceptible lipids and contribute to the rapid
development of WOF.
Role of iron in lipid oxidation
Iron is a trace element of considerable concern due to its role as a prooxidant in
lipid oxidation in meat and meat products. Nawar (1996) has reviewed that the presence
of iron catalyzes lipid oxidation. The oxidation of biomolecules has been shown to occur
significantly only in the presence of catalytic metals, such as copper and iron (Miller and
others 1990). Many different iron complexes, including low molecular weight
compounds , heme compounds, and storage forms such as ferritin and hemosiderin are
16 found in meat (Hazell 1982; Stryer 1988). Han and others (1995) have reviewed that
all forms of iron present in beef contribute to development of lipid oxidation. There are
reports that heme and non-heme iron catalyze oxidation in both raw and cooked meat
systems (Liu and Watts 1970). However, the concept that the greater propensity of WOF
in cooked and comminuted products is due to the release of non-heme iron during
cooking and grinding (!gene and others 1979), makes the most sense.
Non-heme iron has been identified as a prooxidant in cooked meat, with little
oxidative activity of myoglobin (Love and Pearson 1974). Sato and Hegarty (1971)
reported that non-heme iron was the active catalyst in cooked meats. The heme iron
content decreases in ground beef with cooking and during storage. Cooking destroys the
porphyrin rings of heme pigments resulting in non-heme iron release from heme
pigments (Buchowski and others 1988; Lee and others 1998). Lee and others (1998) also
showed an inverse relationship between heme iron content and TBA number of cooked
beef, supporting the view that non-heme iron in cooked meat is responsible for catalyzing
lipid peroxidation resulting in WOF. Both final temperature and rate of heating influence
release of non-heme iron from meat pigment extracts . Slow heating results in release of
more non-heme iron than fast heating. Since cooking of meat generally involves slow
heating, this may help explain the propensity of precooked meat for lipid oxidation, with
release of non-heme iron during cooking catalyzing oxidation (Chen and others 1984). It
is believed that microwaved meat suffers less from WOF then meat cooked by the slower
conventional methods of cooking (Schriker and Miller 1983).
Robinson (1924) suggested that iron porphyrins cause oxidative deterioration of
PUF As. Heme compounds have been shown to accelerate lipid oxidc1.tion (Pearson and
17 others 1977). Younathan and Watts (1959) proposed that only ferric forms of heme
compound pigments are effective catalysts and this suggestion was supported by
Fishwick (1970) and Verma and others (1985). Recent work by Hare! and Kanner
(1985a, b) and Rhee (1988) suggested that ferric heme pigments work as effective
catalysts only in presence of hydrogen peroxide. Rate of peroxidation accelerated several
hundred fold when isolated sarcosomal fraction from turkey dark meat metmyoglobin
and hydrogen peroxide were evaluated together.
Rhee (1988) explained that the combined catalytic effect was partially due to
release of iron from heme by hydrogen peroxide. However, Harrel and Kanner (1985b)
claim that hydrogen peroxide leads to formation of an activated heme (ferry!) complex
with iron in the quadrivalent state which initiates lipid peroxidation.
Heme proteins like hemoglobin and myoglobin convert to met (+3) and ferry}
( +4) oxidation states during storage, which also promote lipid oxidation (Barron and
others 1997). Concentration of copper, iron and heme increases with storage, and
accelerates oxidation (Decker and Hultin 1990). Heating results in more non-heme iron,
and treatment with heat and hydrogen peroxide destroys the iron-porphyrin complex in
ground beef extracts (Schricker and Miller 1983).
Although the non-heme iron storage protein ferritin is the second most abundant
iron-containing compound in the adult human (Granick 1958), the amount in meat is
generally low because most of the ferritin is located in the liver, spleen and bone marrow
(Moore 1973). In another study, it has been shown that iron was released from ferritin by
both cysteine and ascorbate at the pH found in muscle foods (5.5 to 6.9), and the rate of
Fe release from ferritin was influenced by temperature, ferritin and reducing agent
18 concentration . Physiological concentration of ferritin -catalysed lipid oxidation in-vitro,
and heating ferritin increased the rate of lipid oxidation. Thus, ferritin could be involved
in the development of off-flavor in both cooked and uncooked muscle foods (Decker and
Welch 1990).
Another study suggests that the iron source that is important in the catalysis of
lipid oxidation is the Fe2+ ion. Neither the iron bound to transferrin or ferritin nor the
central iron component in heme pigments had significant effects on the oxidation of
lipids in the oil emulsion system (Kim and others 1996). These results may be useful in
the development of strategies to prevent lipid oxidation in meat (Kim and others 1996).
Iron sources identified as important in catalysis of lipid oxidation were Fe2+ and Fe3+
ions, whereas hemoglobin was a very weak catalyst (Kim and others 1998).
In another study by Han and others (1995), it was shown that heating increased
TBA and peroxide values in both cooked and uncooked muscle food systems . All forms
of iron catalysed lipid oxidation in aqueous systems, with greatest oxidation by heme and
low molecular weight iron fractions. Oxidation in lipid extracts was not increa~ed by
ferritin, FeCh or FeCl3, but haem iron was the major oxidation catalyst. Lipid stability
decreased with addition of any iron forms inherent in beef or with increased heating,
which helps the understanding of the rapid oxidation of meat during refrigerated storage
or after cooking .
19 Factors affecting lipid oxidation
The rate of lipid oxidation is dependent on the oxygen concentration at low
concentrations of oxygen (Nawar 1985). The rate of lipid oxidation has been shown to
increase with an increase in temperature (Nawar 1985). Rate of lipid oxidation is directly
proportional to the surface area exposed to the air and so comminution or disruption of
muscle tissues increases rate of lipid oxidation . Lipid oxidation increases in foods with
lower water activity (aw< 0.1), and decreases when water activity reaches aw= 0.3. This
effect is due to the reduced catalytic activity of metal catalysts and by quenching of free
radicals. At water activity of 0.55 to 0.85 the rate of lipid oxidation increases due to
mobilization of catalysts and oxygen (Nawar 1985).
Tests to determine lipid oxidation
The thiobarbituric acid (TBA) test is the most frequently used method for
assessing lipid oxidation in meat. Sensory panelists describe the extent of lipid oxidation
in terms of rancid odor or taste. Tarladgis and others ( 1960) found that TBA numbers
(mg TBA reactive substances I kg tissue) were highly correlated with trained sensory
panel scores for rancid odor in ground pork. The TBA number at which a rancid odor
was first perceived was between 0.5 to 1.0. This "threshold" has served as a guide for
interpreting TBA test results. According to Greene and Cumuze (1981) the range of
oxidized flavor detection for inexperienced panelists was within a range of TBA numbers
similar to the previously determined threshold level for trained panelists. Consumer
panelists not only detect rancid flavor in cooked pork samples with TBA values > 1.0, but
also preferred samples with TBA values < 0.4 (Jayasingh and Cornforth 2003).
20 Food Antioxidants
The use of antioxidants retards the rate of lipid oxidation by minimizing
formation or propagation of free radicals . Food antioxidants can be classified into Type I
or Type II antioxidants and also as natural or synthetic antioxidants. Natural antioxidants
include retinoids (vitamin A) and tocopherols (vitamin E) found in many animals and
plants; ascorbic acid (vitamin C) found in citrus fruits and many vegetables, and
betacarotene , found in deep green vegetables . Spices (cloves , cinnamon , black pepper,
turmeric) ginger , garlic and onions exhibit antioxidant properties in different food
systems (Younathan and others 1980; Al-Jalay and others 1987; Jurdi-Haldeman and
others 1987). The total antioxidant capacity of ground cinnamon and ground cloves has
been reported to be as high as 2675 and 3144 umol TE (trolox equivalent s)/ g sample.
Wu and others (2004) showed that these values are the highest among various food,
vegetables, spices, and other foods as measured by the oxygen absorbance capacity
(ORAC) test. Grape seed and green tea extracts possess antioxidant properties (Rababah
and others 2004) . Some of the commonly used antioxidants are a- tocopherol, ascorbic
acid, BHA and BHT. The criterion for choosing an antioxidant depends upon the kind of
food, the potency of the antioxidant , storage temperature of the food, and the fat content.
Type I antioxidants
Type I antioxidants can terminate the free-radical chain reaction of lipid oxidation
by donating hydrogen or electrons to free radicals and convert them to more stable
products. They may also function by addition reactions with lipid radicals, forming lipid
antioxidant complexes. These include vitamin C, vitamin E, BHA , BHT, TBHQ, and PG.
21 Many of the naturally occurring phenolic compounds like flavonoids, eugenol, vanillin
and rosemary antioxidant are classified as Type I antioxidants. Their antioxidant role has
been suggested to be due to the presence of phenolic compounds (Houlihan and others
1985). Phenolic compounds from plants also possess antioxidant activity (Pokorny 1991;
Shahidi 2000). Such activity has been mainly attributed to flavonoids and ascorbic acid in
citrus fruits (hesperidin, neohesperidin, and eriocitrin) and to carnosol and rosmarinic
acid in rosemary (Schwarz and others 2001).
All tocopherols contain contain a phenolic structure which scavenges lipid and
oxygen radicals throught the formation of tocopheryl quinone radical whose energy is 2
to 3 times lower than most fatty acid radicals (Buettner 1993). Formation of the lower
energy tocopheryl quinine radical minimizes the chance that the free radical can further
promote lipid oxidation. Compounds such as ascorbic acid and reduced glutathione, can
reduce the tocopheryl radical, thus regenerating its antioxidant activity (Parker 1989).
The major antioxidant mechanism of carotenoids is through their ability to
interact with singlet oxygen, thus not allowing the singlet oxygen to form lipid peroxides
(Olson 1993). Carotenoids can also inhibit oxidation reactions by accepting or donating
electrons (Bradley and Min 1992).
Synthetic phenolic antioxidants such as BHT are used to improve the stability of
lipids in food products. McCarthy and others (2001) reported a significant antioxidant
effect of BHT/BHA in cooked pork patties when added at a level of 0.01 % of meat
weight, which is about 7-fold more BHT than allowed by USDA (0.01 % by fat weight;
DeHoll 1981). They are quite volatile and easily decompose at high temperatures. BHT
22 was shown to inhibit the propagation step of chain of lipid oxidation by its action as a
radical scavenger (Fujisawa and others 2004).
Consumer concern about the safety of synthetic food additives has led to renewed
interest in natural products (Andres and Duxbury 1990). Rosemary, a natural
antioxidant, has been reported to contain certain components (rosemanol,
rosmariquinone, rosmaridiphenol, camosol), which may be as effective as BHT as an
antioxidant (Houlihan and others 1984, 1985; Nakatani and Intani 1984). Such
compounds in rosemary extracts have been shown to exhibit antioxidant properties equal
to or slightly less than BHT (Wu and others 1982; Houlihan and others 1985). Rosemary
extracts at concentrations ranging from 0.02% to 0.05% of total weight, have been
reported to inhibit lipid oxidation in beef (Wu and others 1994 ), pork (Decker and others
1993), and chicken (Lai and others 1991). Water soluble rosemary extracts at 500 ppm,
have been shown to significantly decrease thiobarbituric acid reactive substances
(TBARS) formation and to preserve red color in cooked turkey, up to 7 d refrigerated
storage (Yu and others 2002). Rosemary extract has been shown to maintain sensory
quality in processed pork products for up to 10 d refrigerated storage (Nissen and others
2004) . However, results from our laboratory have shown that ground rosemary at 0.4% to
0.8% was very effective in significantly delaying onset of rancidity as compared to BHT
(up to 0.02% of meat weight), and rosemary oil (up to 0.2% of meat weight) in cooked,
ground pork (Vasavada and Cornforth 2003 ). The phenolic compounds present in
rosemary break free radical chain reactions by hydrogen atom donation.
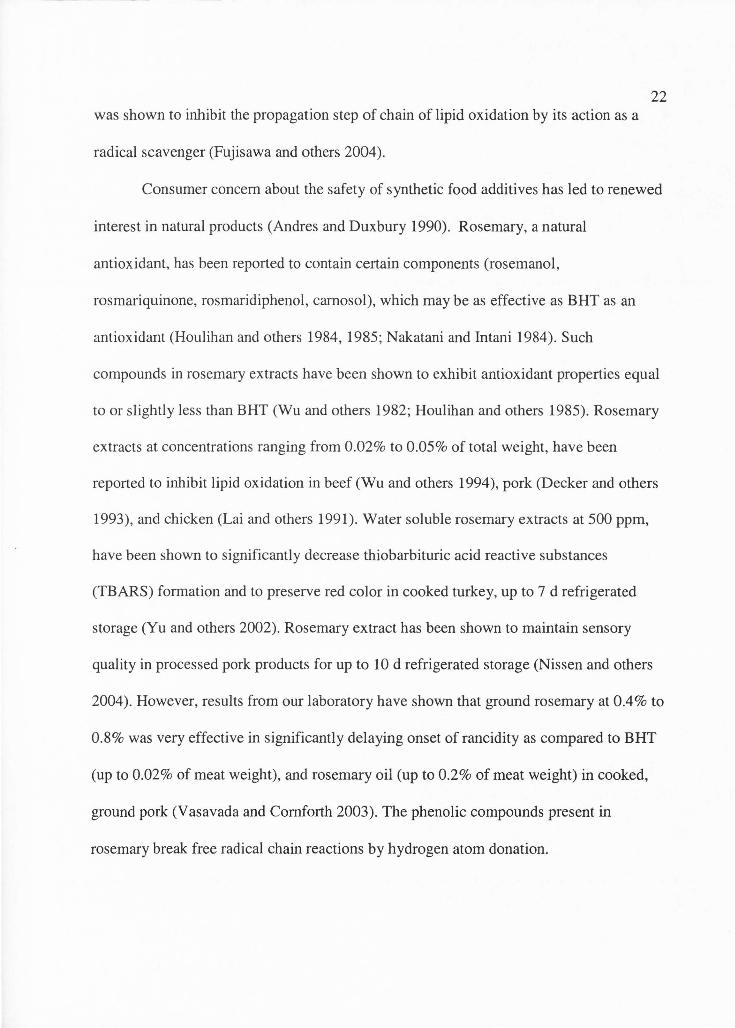
23 Mechanism of action of some common Type I antioxidants
Cinnamic aldehyde is a Type I antioxidant that can donate a hydrogen atom (H•)
to an alkoxy free radical (ROO•) to form semi-stable hydroperoxides (ROOH), thus
slowing the propagation step of lipid oxidation, as shown in the reaction sequence below .
The hydrogen atom (H•) could be abstracted from 3 possible locations on the cinnamic
aldehyde, at sites adjacent to double bonds , since hydrogen abstraction takes place easily
from carbons adjacent to the double bonds. After donating the hydrogen atom, the
unpaired electron on cinnamic aldehyde is stabilized by resonance delocalization on the
benzene ring.
ROO• + 0-CH=CHCHO 7 ROOH + 0-c•=CHCHO
Eugenol , which is the main component of cloves , has been shown to inhibit lipid
oxidation by 2 steps . Firstly, it interferes with the chain reactions by trapping the active
oxygen, and secondly, it is metabolized to a dimer form (dieugenol), and this dimeric
form inhibits lipid peroxidation at the level of propogation of free radical chain reaction
(Ogata and others 2000).
Eugenol
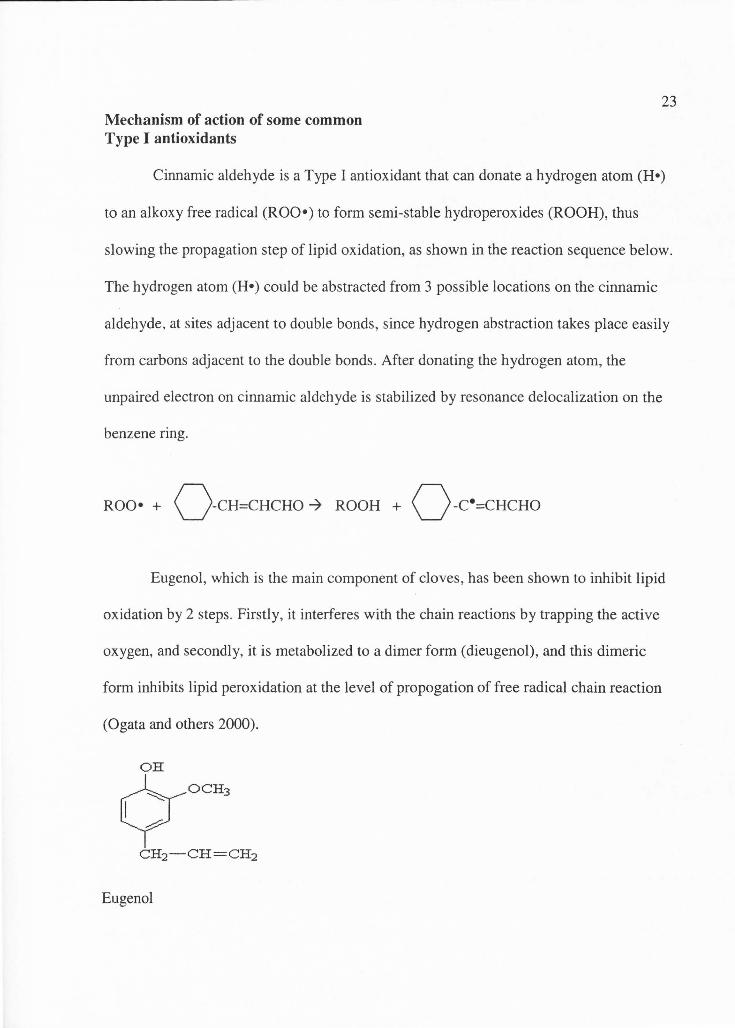
24 Vitamin E (below) has been tested as an antioxidant in ground beef. Addition
of vitamin E or vitamin C to ground beef improves lipid and color stability. Addition of
both vitamin E and vitamin C showed greater pigment and lipid stability than vitamin E
or C alone (Mitsumoto and others 1991). Vitamin Eis a Type I antioxidant that inhibits
lipid oxidation by donating a hydrogen atom from its phenol hydroxyl group producing
stable radical intermediates due to resonance delocalization.
OH
CH3
Vitamin E ( a,-tocoptierol)
Ascorbate (vitamin C) is also a Type I antioxidant, capable of donating hydrogen
atoms from positions 2 and 3 of the lactone ring. Ascorbate acts either as an antioxidant
or pro-oxidant depending on concentration of lipid hydroperoxides, and lower molecular
weight metals (Kanner and Mendel 1977; Yamamoto and others 1987). Ascorbate is
capable of inhibiting lipid oxidation by inactivating free radicals and by regenerating a -
tocopherol. Ascorbates can also act as pro-oxidants by reducing iron to its catalytic
ferrous form . Hence, ascorbates should be used in combination with metal chelators to
have antioxidant effects. Ascorbyl-palmitate has been shown to inhibit lipid oxidation in
turkey (Calvert and Decker 1992).
Maillard reaction products
Cooking can cause the formation of antioxidants in food. Retorting treatment of
meats has been shown to increase oxidative stability compared to less severe heat
treatments (Sato and others 1973; Einerson and Reineccius 1978). The low molecular
weight , water-soluble antioxidants in severely cooked meats were suggested to be
Maillard reaction products (MRP), which are formed from amines and carbonyls at
elevated temperature s. These MRP have been shown to be antioxidants (Yen and Hsieh
1995), by acting as reducing agents and free radical scavengers .
Antioxidant effect of spices used in Garam Masala spice blend
The Garam Masala spice blend has 13 different ingredients in varying levels.
25
These include black pepper , caraway, cardamom, chili, cinnamon, clove, coriander,
cumin , fennel, ginger, nutmeg, salt, and star anise. The approximate composition includes
black pepper (10%), cardamom (30%), cinnamon (5%), cloves (5%), nutmeg (5%),
coriander (25% ), cumin (20% ), and caraway, chili, fennel, ginger, salt, and star anise in
variable proportions.
The total phenolic content of ground cinnamon and ground cloves was reported to
be 157 and 113 mg GAE (gallic acid equivalents)/ g (Wu and others 2004). Both these
spices are components of the Chinese 5-spice blend and Garam Masala blend . This high
concentration of phenolics in ground cinnamon and ground cloves is responsible for high
antioxidant activity of these spices.
26 Black Pepper (Piper nigrum)
Jun and others (2000) reported that black pepper is found to be effective at 0.33%
in providing desirable sensory properties to chicken feet Uokpyun, a traditional Korean
gel-type delicacy). Black pepper derived from peppercorn has a sharp , woody,
penetrating aroma and is hot and biting to taste because of its oleoresin content. Piperine
is the active antioxidant compound present in black pepper (Badmaev and others 2000) .
Black pepper and piperine have been shown to reduce high fat diet induced oxidative
stress in Wistar rats, as measured TEARS, conjugated dienes, and activities of superoxide
dismutase, catalase, glutathione peroxidase , glutathione S-transferase , and reduced
glutathione (Vijayakumar and others 2004) .
Caraway (Carum carvi)
Black caraway oil has been shown to have marked chelating activity against Fe2+
and also reduced lipid oxidation in human low density lipoproteins and TEARS (Yu and
others 2005). Dried caraway has been shown to have high antioxidant activity, along with
its ethanolic extract, in chicken meat (Abd-El-Alim and others 1999).
Cardamom (Elletoria cardamomum)
Investigation of antioxidant compounds in cardamom showed the presence of
protocatechualdehyde, protocatechuic acid, 1,7-bis (3,4-dihydroxyphenyl) hepta-4E,6E
dien-3-one, and 2,3,7-trihydroxy-5-(3,4-dihydroxy-E-styryl)-6,7,8,9-tetrahydro-5H
benzocycloheptene (Kikuzaki and others 2001), with protocatechualdehyde and 1,7-bis
(3,4-dihydroxyphenyl) hepta-4E,6E-dien-3-one having more antioxidant activity than
alpha-tocopherol and L-ascorbic acid. Cardamom has been shown to increase oxidative
stability of lipids in cookies, with the sensory threshold for cardamom being 1.0%
(Badei AZM and others 2002).
Chili (Capsicum annuum)
27
Peppers get their heat from a compound called capsaicin, a pungent ingredient of
hot chili pepper that has been shown to protect against experimentally-induced
mutagenesis and tumorigenesis, and to also induce apoptosis in various immortalized or
malignant cell lines (Surh 1999). The majority of the naturally occurring phenolics retain
antioxidative and anti-inflammatory properties , which appear to contribute to their
chemopreventive or chemoprotective activity (Surh 1999).
Cinnamon (Cinnamonum verum)
Cinnamon has cinnamic aldehyde that gives it a distinct odor and flavor.
Cinnamon essential oil has been found to have great antioxidant activity in Chinese-style
sausage (Yong and others 1998). Cinnamon has been shown to be a better superoxide
radical scavenger than mint , anise, BHA, ginger and BHT (Murcia and others 2004).
Cinnamon has been shown to have a high concentration of antioxidants (> 7 5 mmol /
100g) (Dragland and others 2003).
Clove (Syzygium aromaticum)
Cloves had a strong antioxidant effect and gave good stability and effectively
retarded flavor deterioration in frozen stored fish mince, at 0.05% for 28 wk, and 0.1 %
for 50 wk (Joseph and others 1992). Addition of clove powder (0.20% w/w) significantly
reduced oxidative rancidity (measured as TBARS), and improved acceptability of oysters
28 for 278 d, as compared to 235 d and 237 d for BHT-treated and untreated samples,
respectively (Abraham and others 1994 ). Clove oil is about 90% eugenol (Dorman and
others 2000). Antioxidative activity of clove buds is partly due to the presence of aroma
compounds such as eugenol and eugenyl acetate (Lee and Shibamoto 2001) . Eugenol has
been shown to act as an antioxidant on oleogenous foods (Farag and others 1989a) . The
activities of eugenol (200 ppm) and isoeugenol (200 ppm) in inhibiting malonaldehyde
formation in cooked ground pork have been shown to be between 95-99% (Shahidi and
others 1992b ). These activities were higher than those of ascorbic acid, a-tocopherol and
BHT (Shahidi and others 1992b ). Activity of BHT, a known synthetic antioxidant, was
88% at 200 ppm level of addition to meat (Shahidi and others 1992). Clove and MRP
have been shown to be very effective in arresting the build-up of secondary oxidation
products, formed during refrigerator storage of cooked meat, and also affect the extent of
release of non-heme iron during cooking of meat, which is believed to be the primary
catalyst accelerating lipid oxidation (Jayathilakan and others 1997).
Coriander (Coriandrum sativum)
Supplementation of a high-fat, cholesterol-containing diet with 10% coriander
seeds has been shown to protect tissues by preventing formation of unwanted free
radicals in groups of female Sprague-Dawley rats (Chithra and Leelamma 1999).
Coriander extract has been shown to demonstrate antioxidative activity alone and in
synergism with BHT (Melo and others 2003). Linalool is the main antioxidative
compound in coriander (Reddy and Lokesh 1992). The essential oil content of the dried
fruit ranges from 0.5 to 1 % and the oil contains d-linalool, camphor, d-pinene, camphene,
29 pinene, sabinene , myrcene, terpinene, limonene, and other constituents (Simon and
others 1984 ). Linalool has been shown to have antioxidant properties, much the same as
vitamin E and lipoic acid, to prevent lipid peroxidation in guinea pig brains (Celik and
Ozkaya 2002) by limiting damage from oxidation reaction in unsaturated fatty acids.
Cumin (Cuminum cyminum)
Extracts of plants like cumin, clove , cinnamon and rosemary, originally having
high levels of phenolic compounds, have been shown to exhibit strong H-donating
activity and are effective scavengers of hydrogen peroxide and superoxide radicals
(Lugasi and others 1995). Cumin aldehyde is the principal contributor in aroma and
flavor and antioxidant properties (Reddy and Lokesh 1992). Addition of 2% Acer rubrum
L_. var. trilobum (a cumin-like spice) has been shown to improve the hygienic quality of
koefte , especially when made with low-fat beef , and gave a storage life of about 6 days
when stored at 7°C (Kivanc and Akguel 1991).
Fennel (Foeniculum vulgare)
Fennel has a slight sweet or licorice aromatic flavor similar to star anise but less
intense. Foeniculum vulgare oils have been shown to have antioxidant properties
comparable to a-tocopherol and BHT, as evaluated by TBARS assay and spectroscopic
detection of hydroperoxy-dienes from linoleic acid in a micellar system (Ruberto and
others 2000). Aqueous and ethanolic fennel seed extracts have been shown to display
strong antioxidative activity, reducing power, and scavenging and metal chelating
activities in comparison to standard antioxidants such as BHA, BHT and a -tocopherol
(Oktay and others 2003). Eight antioxidant compounds (3-caffeoylquinic acid, 4-
30 caffeoylquinic acid, 1, 5-0-dicaffeoylquinic acid, rosmarinic acid, eriodictyol- 7-0-
rutinoside, quercetin-3-0-galactoside, kaempferol-3-0-rutinoside and kaempferol-3-0-
glucoside) have been isolated and identified in fennel by Parejo and others (2004). A
study of the antioxidative activities, including the radical scavenging effects, inhibition of
hydrogen peroxide, and Fe2+ ion-chelating activity for fennel samples showed antioxidant
activity for fennel as a radical scavenger in the experiment using the 1,1-dipehnyl-2-
picryl-hydrazyl (DPPH) radical, and towards hydrogen peroxide at 0.2 g /ml
concentration. The Fe2+ ion-chelating activities of the samples were shown to be greater
than 70% (El and others 2003).
Ginger (Zingiber officinale)
Ginger is an effective tenderizing, antioxidative and antimicrobial agent used in
meat and meat products . The antioxidative potential of the volatile oil fraction has been
shown to be due to diverse groups of phenols (Naveena and Mendiratta 2001). Ginger
extract at the level of 3% can improve the sensory quality and shelf life of mutton chunks
(Mendiratta and others 2000).
Kim and Lee (1995) showed that ginger extract was effective in retarding the
development of rancidity in precooked beef for a 47-d period and it was directly related
to ginger concentration. Addition of freeze-dried ginger and fenugreek extracts to ground
beef patties at 500 ppm has been shown to be effective in retarding odor generation, TBA
increases and oxidative colour change (Mansour and Khalil 2000). Gingerol-related
compounds and diarylheptanoids are the main antioxidant compounds seen in ginger
(Nakatani 2003). About 5 antioxidants have been identified as 4, 6, 8, and 10-gingerol,
and 6-shogaol on the basis of their molecular weight as determined by LC-MS and by
using DPPH free radicals it has been found that 6-gingerol is more efficient than BHT
(Cho and others 2001). Zingerone is also an antioxidant compound found in ginger
(Reddy and Lokesh 1992).
Nutmeg (Myristicafragrans Routt)
31
Nutmeg has been shown to contain about 10% essential oil, which is primarily
composed of terpene hydrocarbons (pinenes , camphene, p-cymene , sabinene,
phellandrene , terpinene , limonene and myrcene, together 60 to 90% ), terpene derivatives
(linalool , geraniol and terpineol, together 5 to 15%) and phenylpropanes (myristicine,
elemicine and safrol, together 2 to 20%) (Nakatani 2003). Addition of 2.5% nutmeg in a
model salad dressing formula was found to have a slight antioxidant effect (McKee and
others 1993). y-terpinene, a monoterpene hydrocarbon present in nutmeg essential oils ,
has been shown to retard the peroxidation of linoleic acid. The retardation of linoleic acid
peroxidation by y-terpinene has been found to be due to rapid chain termination via a
very fast cross-reaction between hydroperoxyl radicals and linoleylperoxyl radicals (Foti
and Ingold 2003).
Salt
There have been contradictory findings related to salt content in meat and its
possible role as an antioxidant or a pro-oxidant. Lipid oxidation monitored during
refrigerated and frozen storage of raw and cooked turkey breast or thigh muscle by the
TBA test, indicated that the most significant prooxidant effect was caused by salt + Cu2+
+ Fe2+, followed by salt+ Fe3+ or Cu2
+ alone (Salih and others 1989). Steaks with no salt
32 (pooled across antioxidant levels) were shown to have lower TBA values than steaks
with any salt type (NaCl, KCl or a 65% NaCl + 35% KCl combination) after 85 d storage
or either level of salt after 155 d storage at 0.375% or 0.750% salt level. Steaks with
either level of added salt resulted in higher ratings for juiciness, saltiness and overall
palatability than steaks with no added salt (Wheeler and others 1990). In ground pork, 0%
to 2% NaCl showed an increase in TBARS concentration with increasing NaCl
concentration . Peroxide values did not increase during storage of pork with 0% and 0.5%
NaCl , but increased 22.5 times and 44 times with 1 % and 2% NaCl, respectively (Lee
and others 1997). In dry smoked beef the pH of the meat was shown to increase with
increasing salt concentration, and in general the addition of salt significantly increased
the degree of oxidation, while smoking produced antioxidant activity (P < 0.05) (Dzudie
and others 2003). Phosphate buffer (25mM NaH2P04 / Na2HP04), high final pH (7.0) of
surimi pellet, and the presence of salt (O.lM NaCl) were all inhibitory to both protein and
lipid oxidation during storage of shelf-stable surimi (Subramanian and others 1996). In
dry-cured Longissmus Dorsi meat, glutathione peroxidase activity and TBARS levels
were shown to be significantly lower (P < 0.05) in samples produced with the salt and it
is believed that salt acts as an enzyme inhibitor and antioxidant (Sarraga and others
2002).
Star Anise (Pimpinella anisum)
Star anise has carminative, stomachic, stimulant and diuretic properties. Anethole
is the main compound present in star anise (Curtis and others 1996). In Chinese
marinated pork shanks (with star anise as an ingredient in the marinade), antioxidant
33 effects were seen in the marinated pork shanks as compared to the controls (Wang and
others 1997). Anethole has been also shown to have anti-inflammatory and antifungal
activities (Karapinar and Aktug 1987; Curtis and others 1996). Star anise has been shown
to have potent antimicrobial property due to the presence of anethole (De and others
2002).
Raisins as antioxidants in meat
Raisins have been recognized as a good source of dietary antioxidants. According
to the USDA , raisins are second only to prunes in the ability to resist oxidation as
measured by the ORAC test (http://www.ars.usda .gov/is/pr/1999/990208.htm) . The total
antioxidant capacity of raisins is about 90-100 times lower than those seen for dried
cinnamon and clove powder. Grapes and raisins have been shown to contain various
antioxidant compounds, including bioflavanoids (Shalashvili and others 2002),
proanthocyanidins (Foster 1997; Murga and others 2000), catechin monomers (Katalinic
1999), procyanidin dimers (Yamakoshi and others 2002) and other polyphenolic
antioxidants (Meyer and others 1997; Frankel 1999).
Antioxidative activity of beef jerky containing 15% w/w of raisin puree and
measured by the ferric reducing antioxidant potential assay, was shown to increase by
> 600% as compared to control samples. The product received favorable sensory ratings
for appearance, texture and flavor, comparable to the non-raisin control (Bower and
others 2003). In a study by Karakaya and others (2001), the highest total phenolic
contents in beverages (on the basis of individual servings) were found in black tea,
instant coffee, coke, and red wine, while highest phenolic contents in solid foods were
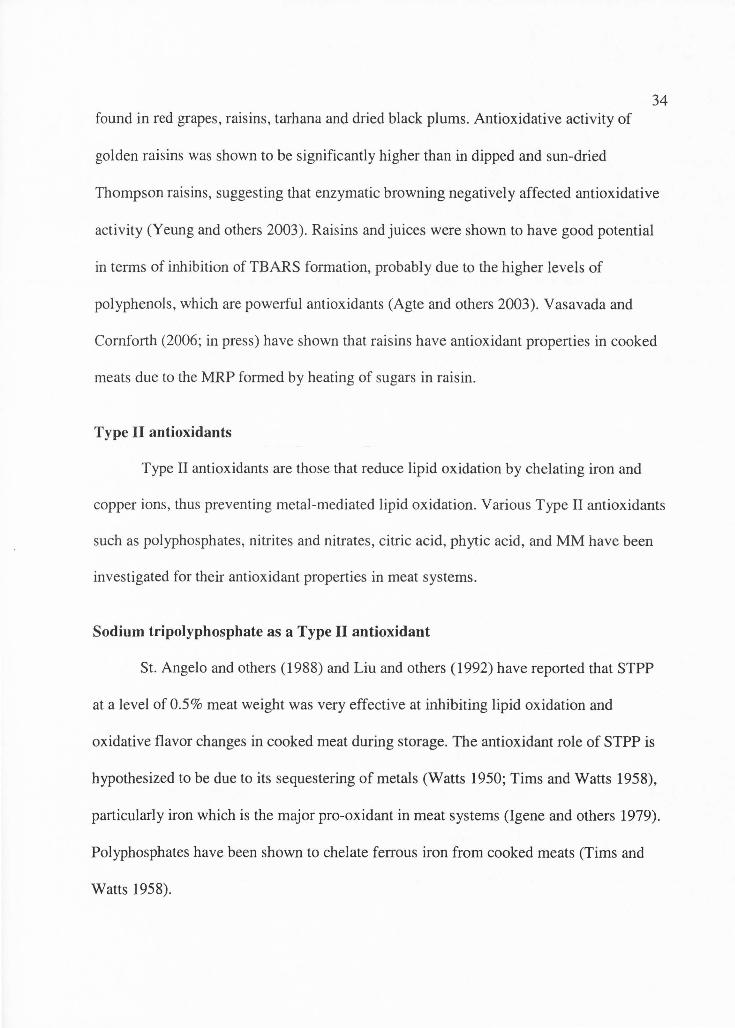
34 found in red grapes, raisins, tarhana and dried black plums. Antioxidative activity of
golden raisins was shown to be significantly higher than in dipped and sun-dried
Thompson raisins, suggesting that enzymatic browning negatively affected antioxidative
activity (Yeung and others 2003). Raisins and juices were shown to have good potential
in terms of inhibition of TBARS formation, probably due to the higher levels of
polyphenols, which are powerful antioxidants (Agte and others 2003). Vasavada and
Cornforth (2006; in press) have shown that raisins have antioxidant properties in cooked
meats due to the MRP formed by heating of sugars in raisin.
Type II antioxidants
Type II antioxidants are those that reduce lipid oxidation by chelating iron and
copper ions, thus preventing metal-mediated lipid oxidation. Various Type II antioxidants
such as polyphosphates, nitrites and nitrates, citric acid, phytic acid, and MM have been
investigated for their antioxidant properties in meat systems.
Sodium tripolyphosphate as a Type II antioxidant
St. Angelo and others (1988) and Liu and others (1992) have reported that STPP
at a level of 0.5% meat weight was very effective at inhibiting lipid oxidation and
oxidative flavor changes in cooked meat during storage. The antioxidant role of STPP is
hypothesized to be due to its sequestering of metals (Watts 1950; Tims and Watts 1958),
particularly iron which is the major pro-oxidant in meat systems (lgene and others 1979).
Polyphosphates have been shown to chelate ferrous iron from cooked meats (Tims and
Watts 1958).
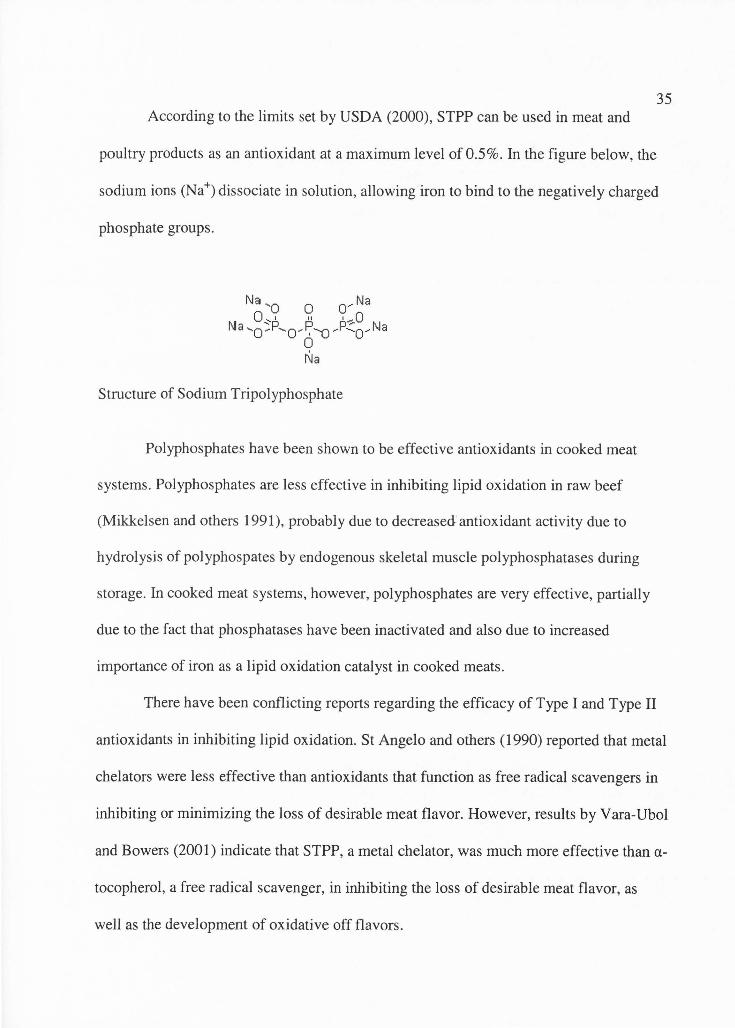
35 According to the limits set by USDA (2000), STPP can be used in meat and
poultry products as an antioxidant at a maximum level of 0.5%. In the figure below, the
sodium ions (Na+) dissociate in solution, allowing iron to bind to the negatively charged
phosphate groups.
Structure of Sodium Tripolyphosphate
Polyphosphates have been shown to be effective antioxidants in cooked meat
systems. Polyphosphates are less effective in inhibiting lipid oxidation in raw beef
(Mikkelsen and others 1991 ), probably due to decreased antioxidant activity due to
hydrolysis of polyphospates by endogenous skeletal muscle polyphosphatases during
storage. In cooked meat systems, however, polyphosphates are very effective, partially
due to the fact that phosphatases have been inactivated and also due to increased
importance of iron as a lipid oxidation catalyst in cooked meats.
There have been conflicting reports regarding the efficacy of Type I and Type II
antioxidants in inhibiting lipid oxidation. St Angelo and others (1990) reported that metal
chelators were less effective than antioxidants that function as free radical scavengers in
inhibiting or minimizing the loss of desirable meat flavor. However, results by Vara-Ubol
and Bowers (2001) indicate that STPP, a metal chelator, was much more effective than a
tocopherol, a free radical scavenger, in inhibiting the loss of desirable meat flavor, as
well as the development of oxidative off flavors.
36 Liu and others (1992) reported that when STPP was used in combination with
rosemary oleoresin in cooked restructured pork steaks most of the antioxidant action was
from STPP. Sodium tripolyphosphate alone at 0.3% level was as effective as 0.5% level in
reducing oxidative flavor changes of cooked pork during storage. Stale aroma and flavor
were almost non-existent in cooked pork containing 0.3% or 0.5% STPP when evaluated by
trained taste panelists even after 4 d storage at 4°C (Vara-Ubol and Bowers 2001) .
Nitrites and nitrates
Nitrites and nitrates function as antioxidants by converting heme proteins to
inactive nitric oxide forms (Igene and others 1985), by chelating free iron (Kanner and
others 1984), by stabilizing lipid membranes (Freybler and others 1993) and by forming
nitrosated heme compounds which possess antioxidant activity (Morrissey and
Tichivangana 1985). USDA regulations limit the addition of sodium nitrite in cured
meats to 156 ppm. Sodium nitrate has been shown to reduce the oxidation rate, measured
by TBARS and peroxide values, in a meat model system composed of minced pork and
fat (Parolari 2000). Rosemary extract and sodium nitrite have been shown to lower
TBARS values, independent of radiation dose or storage time in bologna processed from
ground turkey meat (Fan and others 2004 ). Nitrite / nitrate / ascorbic acid blend ( 100 ppm
I 200 ppm/ 500 ppm, respectively) has been shown to be equally effective to spices such
as paprika and garlic, in reducing lipid oxidation in ground, dry, ripened pork sausage
(Aguirrezabal and others 2000).
Volatile N-nitrosamines in foods, such as meat products, have been reported to
cause cancer. When the breakdown products of N-nitrosodimethylamine and N-
37 nitrosopyrrolidine after 5 kGy irradiation in distilled water were reacted in an in vitro
representation of the human stomach, they both were reformed , but only in the presence
of sodium nitrite (Ahn and others 2002). Links have been observed between the high
incidence of stomach cancer in China and Japan and the intake of certain fish products
and pickled/fermented vegetable products; N-nitroso -N-methylurea has been suggested to
be a potential causative agent (Sen and others 2001). Incorporation of 200 to 2000 ppm of
ascorbic acid in the fish sauce and other foods, prior to nitrosation, inhibited such NMU
formation appreciably (Sen and others 2001) . NMU formation could occur in fish sauce
from the high-risk area for stomach cancer and in the fish sauce spiked human gastric
juice during nitrosation under simulated gastric conditions (Deng and others 1998).
Phytic acid
Phytic acid is a naturally occurring Type II antioxidant found in high
concentrations in barley, wheat and wild rice (Empson and others 1991). Phytic acid has
greater antioxidant effects than carosine in cooked beef samples (Lee and others 1998).
Sodium phytate, sodium pyrophosphate and STPP all lowered metmyoglobin formation
in raw beef samples , but sodium phytate was most inhibitory to lipid oxidation (Lee and
others 1998). Phytic acid more effectively inhibits lipid peroxidation in beef homogenates
than other antioxidants, such as ascorbate, BHT and EDT A, by removing myoglobin
derived iron from negatively charged phospholipids, thus preventing their autoxidation
and off-flavor fom1ation (Lee and Hendricks 1995).
38 Milk mineral
Whey is another natural food antioxidant (Colbert and Decker 1991; Browdy and
Harris 1997), due to the presence of protein sulfhydryl groups with reducing abilities and
also due to iron chelation by whey proteins (Tong and others 2000). Milk mineral is
another phosphate-based Type II antioxidant and is used as a natural calcium source. It is
the dried permeate of ultra filtered whey and contains 13% by weight phosphorus on dry
weight basis (Cornforth and West 2002). Milk mineral (1.5%) was effective for
maintenance of low TBA numbers ( < 1.0) of cooked, ground pork for 14 d refrigerated
storage (Jayasingh and Cornforth 2003). Cooked ground beef and pork have been shown
to require 2.0% milk mineral to maintain TBARS values< 1.0 after 14 d of storage,
compared to 1 % MM for ground turkey (Cornforth and West 2002). Among MM
components (phosphate, calcium and citrate), polyphosphates most effectively
maintained low TBARS levels during storage . Results suggest that milk mineral chelates
soluble Fe to colloidal calcium phosphate particles, thus removing Fe as a catalyst for
lipid oxidation (Cornforth and West 2002).
Spices as possible Type II antioxidants
Eugenol compounds have been shown to inhibit low-density lipoprotein oxidation
by forming complexes with reduced metals. Potent inhibitory effects of isoeugenol may
be related to the decreased formation of perferryl ion on the iron-oxygen chelate complex
as the initiating factor of lipid peroxidation, by keeping iron in a reduced state. Inhibition
of lipid oxidation by eugenol compounds is due to the suppression of free radical cascade
39 of lipid peroxidation in low-density lipoproteins by reducing copper iron (Ito and
others 2005).
Consumer concerns regarding synthetic antioxidants have contributed to the
increased use of natural antioxidants. BHA has toxic effects including liver swelling and
it influences the liver enzyme activities (Halladay and others 1980). Usage of synthetic
antioxidants has been a safety concern (Wurtzen and others 1986; Farag and others
1989b). However, the use of synthetic antioxidants such as BHA/ !?HT still continues in
the food industry.
My research focuses on the use of some natural antioxidants like various spices,
MM, and raisin paste in cooked meats, to control lipid oxidation. The effectiveness of
these natural antioxidants in cooked meats can be a viable alternative to the use of
synthetic antioxidants in the meat industry in future.
References
Abd-El-Alim SSL, Lugasi A, Hovari J, Dworschak E. 1999. Culinary herbs inhibit lipid
oxidation in raw and cooked minced meat patties during storage. J Sci Food Agric
79(2):277-85.
Abraham JT, Balasundari S, Indra JG, Jeyachandran P. 1994. Influence of antioxidants
on the sensory quality and oxidative rancidity of frozen edible oyster. J Food Sci
Tech, India, 31(2):168-70.
Agte VV, Tarwadi KV, Patil SG. 2003. Studies on micronutrient and antioxidant
potential of grapes available in India for their nutraceutical value. J Food Sci Tech
40(1):106-8.
40 Aguirrezabal MM, Mateo J, Dominguez MC, Zumalacarregui JM. 2000. The effect of
paprika, garlic and salt on rancidity in dry sausages. Meat Sci 54(1):77-81.
Ahn HJ, Jae HK, Hong SY , Cher! HL, Myung WB. 2002. Irradiation effects on kinetics
and nitrosation of volatile N-nitrosamine in different solvent systems. Food Sci
Biotech 11(1):62-5.
Al-Jalay B, Blank G, McConnell B, Al-Khayat M. 1987. Antioxidant activity of selected
spices used in fermented meat sausage. J Food Protect 50:25-7.
Andres C, Duxbury DD. 1990. Antioxidant: past, present and future. Food Proc 51:100-3.
Asghar A, Gray JI, Buckley DJ, Pearson AM, Booren AM . 1988. Perspective on warmed
-over flavor. Food Technol 42(6) : 102-8.
Badei AZM, El-Akel ATM, Faheid SMM, Mahmoud BSM. 2002. Application of some
spices in flavoring and preservation of cookies, I. Antioxidant properties of
cardamom, cinnamon and clove. Deutsche Lebensmittel Rundschau 98(5): 176-83.
Badmaev VY, Majeed M, Prakash L. 2000. Piperine derived from black pepper increases
the plasma levels of coenzyme QlO following oral supplementation. J Nutr
Biochem 11(2):109-113.
Barron CP, Skibsted LH, Anderson HJ. 1997. Prooxidative activity of myoglobin species
in linoleic acid emulsions. J Agric Food Chem 45: 1704-10.
Bower CK, Schilke KF, Daeschel MA. 2003. Antimicrobial properties of raisins in beef
jerky preservation. J Food Sci 68( 4 ): 1484-9.
Bradley DG, Min DB. 1992. Singlet oxygen oxidation of foods. Crit Rev Food Sci Nutr
31:211-36.
41 Browdy AA, Harris ND. 1997. Whey improves oxidative stability of soybean oil. J
Food Sci 62 (2): 348-50, 376.
Buchowsky MS, Mahoney AW, Carpenter CE, Cornforth DP. 1988. Cooking and the
distribution of total and heme iron between meat and broth . J Food Sci 53:43-5.
Buettner GR. 1993. The pecking order of free radicals and antioxidants: Lipid
peroxidation, a-tocopherol and ascorbate. Arch Biochem Biophys 2:535-43.
Byrne DV. 2000. Sensory characterization studies on warmed-over flavor in meat. DPhil
thesis. Copenhagen, Denmark: The Royal Veterinary and Agricultural University.
Calvert JT, Decker EA. 1992. Inhibition of lipid oxidation by combinations of carnosine
and various antioxidants in ground turkey. J Food Qual 15:423-33.
Celik S, Ozkaya A. 2002. Effects of intraperitoneally administered lipoic acid, vitamin E,
and linalool on the level of total lipid and fatty acids in guinea pig brain with
oxidative stress induced by H20 2 . J Biochem Mo! Biol 35(6):547-52.
Chen CC, Pearson AM, Gary JI, Fooladi MH, Ku PK. 1984. Some factors influencing the
nonheme iron content of meat and its implications in oxidation . J Food Sci
49:581-4.
Chithra V, Leelamma S. 1999. Coriandrum sativum changes the levels of lipid peroxides
and activity of antioxidant enzymes in experimental animals. Indian J Biochem
Biophys 36(1):59-61.
Cho KJ, Jin WK, In LC, Jung BK, Young SH. 2001. Isolation, identification and
determination of antioxidant in ginger (Zingiber officinale) rhizome. Agric Chem
Biotech 44(1):12-5.
42 Colbert LB, Decker EA. 1991. Antioxidant activity of an ultrafiltration permeate from
acid whey. J Food Sci 56(5):1248-50.
Cornforth DP, West EM. 2002. Evaluation of the antioxidant effects of dried milk
mineral in cooked beef, pork, and turkey. J Food Sci 67(2):615-8.
Curtis OF, Shetty K, Cassagnol G, Peleg M. 1996. Comparison of the inhibitory and
lethal effects of synthetic versions of plant metabolites (anethol, carvacrol,
eugenol and thymol) on food spoilage yeast (Debaromyces hansenii). Food
Biotech 10:55-73.
De M, De AK, Sen P, Banerjee AB. 2002. Antimicrobial properties of star anise (lllicium
verum Hook f). Phytother Res 16:94-5.
Decker EA, Hultin HO. 1990. Some factors influencing the catalysis of lipid oxidation in
mackerel ordinary muscle. J Food Sci 55:947-50, 953.
Decker EA, Welch B. 1990. Role of ferritin as lipid oxidation catalyst in muscle food. J
Agric Food Chem 38(3):674-7.
Decker EA, Crum AD, Chan WKM, Mei L, Calvert JT. 1993. The ability of carnosine, a
skeletal muscle dipeptide, to inhibit lipid oxidation in meats. Proceedings of
International Conference of Meat Science and Technology, Calgary, Canada.
DeHoll JC. 1981. Encyclopaedia of labeling meat and poultry products. 5th ed. St. Louis,
MO: Meat Plant Magazine. 117 p.
Deng D, Tong L, Hong M, Ruming W, Liankun G, Jing Z. 1998. Characterization of N
(nitrosomethyl) urea in nitrosated fermented fish products. J Agric Food Chem
46(1):202-5.
43 Dorman HJD, Figueiredo AC, Barroso JG, Deans SG. 2000. In vitro evaluation of
antioxidant activity of essential oils and their components. Flav Fragrance J 15(1):
12-16.
Dragland S, Senoo H, Wake K, Holte K, Blomhoff R. 2003. Several culinary and
medicinal herbs are important sources of dietary antioxidants. J Nutr 133(5): 1286-
90.
Dzudie T, Bouba M, Mbofung CM, Scher J. 2003. Effect of salt dose on the quality of
dry smoked beef. Italian J Food Sci 15(3): 433-40.
Einerson MA, Reineccius GA. 1978. Characterization of antioxidants responsible for
inhibition of warmed-over flavor in retorted turkey. J Food Proc Preser 2: I.
El D, Attia AA, Hannfy MM. 2003. Effect of anise (Pimpinella anisum), ginger (Zingiber
officinale Roscoe) and fennel (Foeniculum vulgare) and their mixture of
performance of broilers. Archiv fuer Gefluegelkunde 67(2):92-96.
Empson KL, Labuza TP, Graf E. 1991. Phytic acid as a food antioxidant. J Food Sci
56:560-3.
Fan X, Sommers CH, Sokorai KJB. 2004. Ionizing radiation and antioxidants affect
volatile sulfur compounds, lipid oxidation, and color of ready-to-eat turkey
bologna. J Agric Food Chem 52(11):3509-15.
Farag RS, Badei A, El-Baroty GSA. 1989a. Influence of thyme and clove essential oils
on cottonseed oil oxidation. J Am Oil Chem Soc 566:800-04 .
Farag RS, Daw ZY, Higazy A, Rashed FM. 1989b. Effect of some antioxidants on the
growth of different fungi in a synthetic media. Chem Mickobiol Technol Lebensm
12:81-5.
44 Fishwick MJ. 1970. Freeze-dried turkey muscle II- Role of haem pigments as catalysts
in autoxidation of lipid constituents. J Sci Food Agric 21: 160-3.
Foote CS. 1985. Chemistry of reactive oxygen species. In: Richardson T, Finley JW,
editors. Chemical changes in food during processing. New York: Van Nostrand
Reinhold Company. p 17-32.
Foster S. 1997. Grapeseed extract. Health-Foods Business 43(4) :42-3.
Foti MC, Ingold KU. 2003 . Mechanism of inhibition of lipid peroxidation by gamma
terpinene , an unusual and potentially useful hydrocarbon antioxidant. J Agric
Food Chem 51(9):2758-65.
Frankel EN. 1991. Review recent advances in lipid oxidation. J Sci Food Agric 54:495-
511.
Frankel EN. 1999. Food antioxidants and phytochemicals: present and future. Euro J
Lipid Sci Tech 101(12):450-5.
Freybler LA, Gray JI, Asghar A, Booren AM, Pearson AM, Buckley DJ. 1993. Nitrite
stabilization of lipids in cured pork. Meat Sci 33:85-96.
Fujisawa S, Kadoma Y, Yokoe I. 2004. Radical scavenging activity of BHT and its
metabolites. Chem Phys Lipids 130(2): 189-95.
Granick S. 1958. Iron metabolism in animals and plants. In: Lamb CA, Bentley OG,
Beattie JH, editors. Trace Elements. New York: Academic Press Inc. p 365.
Gray JI, Pearson AM. 1987. Rancidity and warmed-over flavor. In: Pearson AM, Dutson
TR, editors. Advances in Meat Res, Vol. 3. Restructured meat and poultry
products . New York: AVI, Van Nostrand Reinhold. p 221-269.
45 Greene BE, Cumuze TH. 1981. Relationship between TBA numbers and inexperienced
panelists' assessment of oxidized flavor in cooked beef. J Food Sci 47:52-54, 58.
Halladay SC, Ryerson BA, Smith CR, Brown JP, Parkinson TM. 1980. Comparison of
effects of dietary administration of butylated hydroxytoluene or a polymeric
antioxidant on the hepatic and intestinal cytochrome P-450 mixed-function
oxygenase system of rats. Food Cosm Toxicol 18(6):569-74.
Halliwell B, Nurcia MA, Chirico S, Aruoma OI. 1995. Free radicals and antioxidants in
food and in vivo: What they do and how they work. Crit Rev Food Sci Nutr 35:7-
20.
Hamilton RJ. 1989. The chemistry of rancidity in foods. In: Allen JC , Hamilton RJ,
editors. Rancidity of foods . 2nd ed. London: Elsevier Applied Sci. p 1-21.
Hamm R. 1966. Heating of muscle systems. In: Briskey EJ, Cerssens RG , Trautman JC,
editors. The physiology and biochemistry of muscle as a food. Madison,
Wisconsin: Univ Wisc Press . p 363 .
Han D, McMillan KW, Godber JS, Bidner TD, Younathan MT, Hart LT. 1995. Lipid
stability of beef model systems with heating and iron fractions. J Food Sci
60(3 ): 599-603 .
Harel S, Kanner J. 1985a. Hydrogen peroxide generation in ground muscle tissues. J
Agric Food Chem 33: 1186-8.
Harel S, Kanner J. 1985b. Muscle membranal lipid peroxidation initiated by hydrogen
peroxide-activated metmyoglobin. J Agric Food Chem 33:1188-92.
Hazell T. 1982. Iron and zinc compounds in the muscle meats of beef, lamb, pork and
chicken. J Sci Food Agric 33:1049-56.
46 Horner WFA. 1993. Encyclopaedia of food science, food technology, and nutrition .
New York: Academic Press. p 1485.
Houlihan CM, Ho CT, Chang SS. 1984. Elucidation of the chemical structure of a novel
antioxidant , rosmaridiphenol, isolated from rosemary. J Am Oil Chem Soc 61:
1036-9.
Houlihan CM, Ho CT, Chang SS. 1985. The structure of rosmariquinone: A new
antioxidant isolated from Rosmarinus officinalis. J Am Oil Chem Soc 62: 96-98 .
Hsieh RJ, Kinsella JE. 1989. Oxidation of polyunsaturated fatty acids : Mechanisms ,
products and inhibition with emphasis on fish. Adv Food Nutr Res 33:233 .
U.S. Department of Agriculture. 1999. High-ORAC foods may slow aging. Available
from : http://www.ars.usda.gov/is/pr/1999/990208.htm.
Huang WH, Greene BE. 1978. Effect of cooking method on TBA numbers of stored beef.
J Food Sci 43: 1201-3.
!gene JO, Pearson AM. 1979. Role of phospholipids and triglycerides in warmed-over
flavor development in meat systems. J Food Sci 44: 1285-90 .
lgene JO, King JA, Pearson AM , Gray JI. 1979. Influence of heme pigments, nitrite, and
non-heme iron on the development of warmed over flavor (WOF) in cooked
meats. J Agric Food Chem 27: 838-42.
!gene JO, Yamauchi K, Pearson AM, Gray JI, Aust SD. 1985. Mechanisms by which
nitrite inhibits the development of warmed-over flavor (WOF) in cured meat.
Food Chem 18:1-18.
Ito M, Murakami K, Yoshino M. 2005. Antioxidant action of eugenol compounds: role of
metal ion in the inhibition of lipid peroxidation. Food Chem Toxicol 43(3):461-6.
47 Jayasingh P, Cornforth DP, Brennand CP, Carpenter CE, Whittier DR. 2002. Sensory
evaluation of ground beef stored in high-oxygen modified atmospheric packaging.
J Food Sci 67(9):3493-6 .
Jayasingh P, Cornforth DP. 2003. Comparison of antioxidant effects of milk mineral,
butylated hydroxytoluene and sodium tripolyphosphate in raw and cooked ground
pork. Meat Sci 66(1) :83-9.
Jayathilakan K, Vasundhara TS, Kumudavally KV. 1997. Effect of spices and Maillard
reaction products on rancidity development in precooked refrigerated meat. J
Food Sci Tech, India, 34(2):128-31.
Johnson MA, Fischer JG, Kays SE. 1992. Is copper an antioxidant nutrient? Crit Rev
Food Sci Nutr 32:1-31.
Joseph J, George C, Perigreen PA. 1992. Effect of spices on improving the stability of
frozen stored fish mince. Fishery Tech 29(1) :30-34.
Jun M, Sang SO, Kwang OK. 2000. Effects of levels of flavoring materials on the
sensory properties of chicken feet jokpyun (Korean traditional gel type food).
Korean J Food Sci Tech 32(6):1306-12.
Jurdi-Haldeman D, MacNeil JH, Yared DM. 1987. Antioxidant activity of onion and
garlic juices in stored cooked ground lamb. J Food Protect 50:411-3.
Kanner J. 1994. Oxidative processes in meat and meat products: quality implications.
Meat Sci 36:169-89.
Kanner J, Mendel H. 1977. Prooxidant and antioxidant effect of ascorbic acid and metal
salts in beta carotene-linoleate model system. J Food Sci 42(3):60-4.
48 Kanner J, Kinsella JE. 1983a. Initiation of lipid peroxidation by a peroxidase, -
hydrogen peroxide/ halide system. Lipids 18:204-10.
Kanner J, Kinsella JE . 1983b. Lipid deterioration initiated by phagocyte cells in muscle
foods: a-carotene destruction by a myeloperoxidase-hydrogen peroxide-halide
system. J Agric Food Chem 31:370-6.
Kanner J, Harel S, Shagalovich J, Berman S. 1984. Antioxidative effect of nitrite in cured
meat products: nitric oxide-iron complexes of low molecular weight. J Agric Food
Chem 32:512 .
Kanner J, German JB, Kinsella JE. 1987. Initiation of lipid peroxidation in biological
systems. CRC Crit Rev Food Sci Nutr 25:31-64.
Karakaya S, El SN, Tas AA. 2001. Antioxidant activity of some foods containing
phenolic compounds. Intl J Food Sci Nutr 52(6):501-8.
Karapinar M, Aktug SE. 1987. Inhibition of food borne pathogens by thymol, eugenol,
menthol and anethol. Intl J Food Micro 4:161-6.
Katalinic V. 1999. Grape catechins-natural antioxidants. J Wine Res 10(1):15-23.
Kikuzaki H, Kawai Y, Nakatani N. 2001. 1,1-Diphenyl-2-picrylhydrazyl radical
scavenging active compounds from greater cardamom (Amomum subulatum
Roxb.). J NutrSci Vitaminology47(2):167-71.
Kim KJ, Lee YB. 1995. Effect of ginger rhizome extract on tenderness and shelf life of
precooked lean beef. J Korean Soc Food Sci 11(2):119-121.
Kim SM, Dong UA, Sam KS. 1996. Effect of free iron, heme pigments, and iron storage
proteins on the oxidation of lipids in oil emulsion. Foods Biotech 5(3):215-219.
49 Kim SM, Cho YS, Lee SH, Kim DG, Sung SK. 1998. Effect of ascorbic acid and
oxygen species on iron-related lipid oxidation in meat homogenate. Korean J
Animal Sci 40(1):89-96.
Kivanc M, Akguel A. 1991. Effect of Laser trilobum spice on natural microflora of
koefte, a Turkish ground meat product. Nahrung 35(2):149-154.
Ladikos D, Lougovois V. 1990. Lipid oxidation in muscle foods. Food Chem 35:295-
314.
Lai SM, Gray JI, Smith DM, Booren AM, Crackel RL, Buckley DJ. 1991. Effects of
oleoresin rosemary , tertiary butylhydroquinone and sodium tripolyphosphate on
the development of oxidative rancidityin restructured chicken nuggets. J Food Sci
56 (3): 616-20.
Lea CH. 1957. Deterioration reactions involving phospholipids and lipoproteins. J Sci
Food Agric 8:1-13.
Lee BJ, Hendricks DG. 1995. Phytic acid protective effect against beef round muscle
lipid peroxidation. J Food Sci 60(2):241-4.
Lee BJ, Hendricks DG, Cornforth DP. 1998. Antioxidant effects of camosine and phytic
acid in a model beef system. J Food Sci 63(3):394-8.
Lee KG, Shibamoto T. 2001. Antioxidant property of aroma extract isolated from clove
buds (Syzygium aromaticum (L.) Merr. et Perry). Food Chem 74(4):443-8.
Lee SK, Mei L,Decker EA. 1997. Influence of Sodium Chloride on Antioxidant Enzyme
Activity and Lipid Oxidation in Frozen Ground Pork. Meat Sci 46:349-55.
Liu H, Watts BM. 1970. Catalysts of lipid peroxidation in meats. 3. Catalysts of oxidative
rancidity in meats. J Food Sci 35:596-8.
Liu HF, Booren AM, Gray JI, Crackel RL. 1992. Antioxidant efficacy of oleoresin
rosemary and sodium tripolyphosphate in restructured pork steaks. J Food Sci
57(4):803-6.
50
Love JD, Pearson AM. 1971. Lipid oxidation in meat and meat products - a review . J Am
Oil Chem Soc 48:547-9.
Love JD, Pearson AM. 1974. Metmyoglobin and non-heme iron as prooxidants in cooked
meat. J Agric Food Chem 22(6): 1032-4.
Lugasi A, Dworschak E, Hovari J. 1995. Characterization of scavenging activity of
natural polyphenols by chemiluminescence technique. Proceedings of European
Food Chemistry Conference, Vienna , Austria: Fed Euro Chem Soc VIII. p 639-
43).
Mansour EH, Khalil AH. 2000. Evaluation of antioxidant activity of some plant extracts
and their application to ground beef patties. Food Chem 69(2): 135-41.
McCarthy TL, Kerry JP, Kerry JF, Lynch PB, Buckley Di. 2001. Evaluation of the
antioxidant potential of natural food / plant extracts as compared with synthetic
antioxidants and vitamin E in raw and cooked pork patties. Meat Sci 58(1):45-52.
McKee LH, Thompson LD, Harden ML. 1993. Effect of three grinding methods on some
properties of nutmeg. Lebens Wissen und Technol 26(2):121-5.
Melo EDA, Mancini FJ, Guerra NB, Maciel GR. 2003. Antioxidant activity of coriander
extracts (Coriandrum sativum L.). Ciencia e Tecnolde Alimentos, 23:195-9.
Mendiratta SK, Anjaneyulu ASR, Lakshmanan V, Naveena BM, Bisht GS. 2000.
Tenderizing and antioxidant effect of ginger extract on sheep meat. J Food Sci
Tech, India, 37(6):651-5.
51 Meyer AS, Ock SY, Pearson DA, Waterhouse AL, Frankel EN. 1997. J Agric Food
Chem 45(5):1638-43.
Mikkelsen A, Bertelsen G, Skibsted LH. 1991. Polyphosphates as antioxidants in frozen
beef patties. Lipid oxidation and color quality during retail display. Z Lebensm
Unters Forsch 192:309-18.
Miller DM , Buettner GR , Aust SD. 1990. Transition metals as catalysts of "autoxidation"
reactions. Free Radical Bio Med 8:95-108.
Mitsumoto M, Faustman C, Cassens RG, Arnold RN, Schaefer DM, Scheller KK. 1991.
Vitamins E and C improve pigment and lipid stability in ground beef . J Food Sci
56:-194-7. -
Moore CV. 1973. Iron. In: Goodhart RS, Schils ME, editors. Modem Nutrition in Health
and Disease. 5th ed. Philadelphia, PA: Lea & Febiger. p 297-302.
Morri ssey PA, Tichivangana JZ . 1985. The antioxidant activity of nitrite and
nitrosomyoglobin in cooked meat. Meat Sci 14: 175-90 .
Morrissey PA, Sheeshy PJA, Galvin K, Kerry JP, Buckley DJ . 1998. Lipid stability in
meat and meat products. Meat Sci 49:73-86.
Murcia MA, Egea I, Romojaro F, Parras P, Jimenez AM, Martinez-Tome M. 2004.
Antioxidant evaluation in dessert spices compared with common food additives. J
Agri Food Chem 52(7):1872-81.
Murga R, Luiz R, Beltran S, Cabezas JL. 2000. Extraction of natural complex phenols
and tannins from grape seeds by using supercritical mixtures of carbon dioxide
and alcohol. J Agric Food Chem 48(8):3408-12.
Nakatani N, Inatani R. 1984. Two antioxidant diterpenes from rosemary (Rosmarinus
officinalis L.) and a new revised structure for rosmanol. Agric Biol Chem 48:
2081-5.
Nakatani N. 2003. Biologically functional constituents of spices and herbs. J Japanese
Soc Nutr Food Sci 56(6):389-95.
Naveena BM, Mendiratta SK. 2001. Ginger as a tenderizing, antioxidant and
antimicrobial agent for meat and meat products. Indian Food Ind 20(6):47-9.
Nawar WW. 1985. Lipids. In: Fennema OR, editor. Food Chem. 2nd ed. New York:
Marcel Dekker Inc. p 139-234.
Nawar WW . 1996. Lipids. In: Fennema OR, editor. Food Chem. 3rd ed. New York:
Marcel Dekker Inc. p 225-319.
52
Nissen LR, Byrne DV, Bertelsen G, Skibsted LH. 2004. The antioxidative activity of
plant extracts in cooked pork patties as evaluated by descriptive sensory profiling
and chemical analysis . Meat Sci 68:485-95 .
Ogata M, Hoshi M, Urano S, Endo T. 2000. Antioxidant activity of eugenol and related
monomeric and dimeric compounds. Chem Pharm Bull 48(10)1467-9.
O'Grady MN, Monahan FJ, Burke RM, Allen P. 2000. The effect of oxygen level and
exogenous a.-tocopherol on the oxidative stability of minced beef in modified
atmosphere packs. Meat Sci 55:39-45.
Oktay M, Gulcin I, Kufrevioglu 01. 2003. Determination of in vitro antioxidant activity
of fennel (Foeniculum vulgare) seed extracts. Lebens Wissen und Technol
36(2):263- 71.
53 Olson JA. 1993. Vitamin A and carotenoids as antioxidants in a physiological context.
J Nutr Sci Vitaminol 39:S57-65.
Parejo J, Viladomat F, Bastida J, Schmeda-Hischmann G, Burillo J, Codina C. 2004.
Bioguided isolation and identification of the nonvolatile antioxidant compounds
from fennel (Foeniculum vulgare Mill.) waste. J Agri Food Chem 52(7): 1890-7.
Parker RS. 1989. Dietary and biochemical aspects of Vitamin E. Adv Food Nutr Res
33:157-232.
Parolari G. 2000. Oxidation of meat mixes as affected by pro- and anti-oxidants: a model
system study. Industria Conserve 75(3):271-80.
Pearson AM, Love JB, Shorland PB. 1977. "Warmed-over" flavor in meat, poultry and
fish. Adv Food Res 23:1-74.
Pitcher RJ. 1993. Encyclopaedia of Food Science, Food Technology, and Nutrition. New
York: Academic Press . 649 p.
Pokorny J. 1991. Natural antioxidants for food use. Trends Food Sci Technol Sept:223-6.
Rababah TM, Hettiarachchy NS, Horax R. 2004. Total Phenolics and Antioxidant
Activities of Fenugreek, Green Tea, Black Tea, Grape Seed, Ginger, Rosemary,
Gotu Kola, and Ginkgo Extracts, Vitamin E, and tert-Butylhydroquinone. J Agric
Food Chem 52(16):5183-6.
Reddy AC, Lokesh BR. 1992. Studies on spice principles as antioxidants in the inhibition
of lipid peroxidation ofrat liver microsomes. Mol Cell Biochem 111(1-2):117-24.
Rhee KS. 1988. Enzymic and nonenzymic catalysis of lipid oxidation in muscle foods.
Food Technol 42(6):127-32.
54 Rhee KS, Anderson LM, Sams AR. 1996. Lipid oxidation potential of beef, chicken,
and pork. J Food Sci 61(1):8-12.
Robinson ME. 1924. Haemoglobin and methaemoglobin as oxidative catalysts. Biochem
J 18:255-64.
Ruberto G, Baratta MT, Deans SG, Dorman HJD. 2000. Antioxidant and antimicrobial
activity of Foeniculum vulgare and Crithmum maritimum essential oils. Planta
Medica 66(8):687 -93.
Ruenger EL, Reineccius GA, Thompson DR. 1978. Flavor compounds related to the
warmed-over flavor of turkey. J Food Sci 43: 1199-1201.
Salih AM, Price JF, Smith DM, Dawson LE. 1989. Lipid oxidation in turkey meat as
influenced by salt, metal cations and antioxidants. J Food Qual 12(1):71-83.
Sarraga C, Carreras I, Garcia RJA. 2002. Influence of meat quality and NaCl percentage
on glutathione peroxidase activity and values for acid-reactive substances of raw
and dry-cured Longissimus dorsi. Meat Sci 62(4):503-7.
Sato K, Hegarty GR. 1971. Warmed over flavor in cooked meats. J Food Sci 36:1098-
102.
Sato K, Hegarty GR, Herring HK. 1973. The inhibition of warmed-over flavor in cooked
meats. J Food Sci 38:398.
Schricker BR, Miller DD. 1983. Effects of cooking and chemical treatment on heme and
nonheme iron in meat. J Food Sci 48: 1340-44.
Schwarz K, Bertelsen G, Nissen LR, Gardner PT, Heinonen MI, Hopia A. 2001.
Investigation of plant extracts for the protection of processed foods against lipid
oxidation . Comparison of antioxidant assays based on radical scavenging, lipid
55 oxidation and analysis of the principal antioxidant compounds . Euro Food Res
Technol 212:319-28.
Sen NP, Seaman SW, Baddoo PA, Burgess C, Weber D. 2001. Formation of N-nitroso
N-methylurea in various samples of smoked/ dried fish, fish sauce , seafoods, and
ethnic fermented / pickled vegetables following incubation with nitrite under
acidic conditions. J Agric Food Chem 49(4):2096-103.
Shahidi F, Janitha PK, Wanasundara PD. 1992a. Phenolic antioxidants. Crit Rev Food
Sci Nutr 32:67-103.
Shahidi F, Wanasundara PD, Hong C. 1992b . Antioxidant activity of phenolic
compounds in meat model systems. In: Ho CT, editor. Phenolic Compounds in
Food and Their Effects on Health I-Analysis, Occurrence, and Chemistry .
Washington, DC : American Chemical Society. p 214-22.
Shahidi F. 1994. Assessment of lipid oxidation and off-flavor development in meat and
meat products. In: Shahidi F, editor. Flavor of Meat and Meat Products. London:
Blackie Academic and Professional. p 24 7-66.
Shahidi F. 2000 . Natural phenolic antioxidants and their food applications. Lipid Technol
12:80-4.
Shalashvili A, Zambakhidze N, Ugrekhelidze D, Parlar H, Leupold G, Kvesitadze G,
Simonishvili S. 2002. Antioxidant activity of grape bioflavonoids and some
flavonoid standards. Adv Food Sci 24(1) :24-9.
Shamberger RJ, Andreone TL, Willis CE. 1974. Antioxidants in cancer. 4. Initiating
activity of malonaldehyde as carcinogen. J Natl Caner Inst 53:1771-73.
56 Shewfelt RL, McDonald RE, Hultin HO. 1981. Effect of phospholipids hydrolysis on
lipid oxidation in flounder muscle microsomes. J Food Sci 46: 1297-1301.
Simon JE, Chadwick AF, Craker LE. 1984. The scientific literature on selected herbs,
and aromatic and medicinal plants of the temperate zone. Herbs: an indexed
bibliography. Hamden, Connecticut: Archon Books. 770 p.
Skibsted LH, Bertelsen G, Qvist S. 1994. Quality changes during storage of meat and
slightly preserved meat products. Intl Cong Meat Sci Technol Proc 40:S-II.MPl.
St. Angelo AJ, Vercellotti JR, Dupuy HP, Spanier AM. 1988. Assessment of beef flavor
quality. A multidisciplinary approach. Food Technol 42 (6): 133-8.
St. Angelo AJ, Crippen KL, Dupuy HP, James CJr. 1990. Chemical and sensory studies
of antioxidant treated beef. J Food Sci 55(6):1501-05, 1539.
Stanley DW. 1991. Biological membrane deterioration and associated quality losses in
food tissues. Crit Rev Food Sci Nutr 30:487-553.
Stryer L. 1988. Biochemistry . 3rd ed. New York: W. H. Freeman and Company. 1089 p.
Subramanian S, Y ouling LX, Decker EA. 1996. Inhibition of protein and lipid oxidation
in beef heart surirni-like material by antioxidants and combinations of pH, NaCl,
and buffer type in the washing media. J Agric Food Chern 44(1): 119-25.
Surh Y. 1999. Molecular mechanisms of chernopreventive effects of selected dietary and
medicinal phenolic substances. Mutat Res 428(1-2):305-27.
Tarladgis BG, Watts BM, Younathan MT, Dugan L. 1960. A distillation method for the
quantitative determination of rnalonaldehyde in rancid foods. J Arn Oil Chem Soc
37:44-8.
---- -- ---- ------ ----- ---------
57 Thomas MJ. 1995. The role of free radicals and antioxidants. How do we know that
they are working? Crit Rev Food Sci Nutr 35:21-39.
Tichivangana JZ, Morrissey PA. 1985. Myoglobin and inorganic metals as proxidants
in raw and cooked muscles system. Meat Sci 15:107-16.
Tims MJ, Watts BM. 1958. Protection of cooked meats with phosphates. Food Technol
12:240-243.
Tong LM, Sasaki S, McClements DJ, Decker EA. 2000. Mechanisms of the antioxidant
activity of a high molecular weight fraction of whey. J Agric Food Chem 48(5):
1473-8.
Vara-Ubol S, Bowers JA. 2001. Effect of alpha-tocopherol, beta-carotene , and sodium
tripolyphosphate on lipid oxidation of refrigerated, cooked ground turkey and
ground pork. J Food Sci 66(5), 662-667 ..
Vasavada MN, Cornforth DP . 2003. 56th Reciprocal meat science conference. Michigan,
USA.
Verma MM, Paranjape V, Ledward DA. 1985. Lipid and haemoprotein oxidation in meat
emulsions. Meat Sci 14:91-104.
Vijayakumar RS, Surya D, Nalini N. 2004. Antioxidant efficacy of black pepper (Piper
nigrum L.) and piperine in rats with high fat diet induced oxidative stress. Redox
report 9:105-10.
Wang TY, Ming TC, Deng CL, Shiu LG. 1997. Effects of procedure, spice, herb and
anka rice on the quality of Chinese marinated and spiced pork shank. J Chinese
Soc Anim Sci 26(2):211-22.
Watts BM. 1950. Polyphosphates as synergistic antioxidants . J Am Oil Chem Soc 27:48.
58 Wheeler TL, Seideman SC, Davis GW, Rolan TL. 1990. Effect of chloride salts and
antioxidants on sensory and storage traits of restructured beef steaks. J Food Sci
55(5): 1274-7.
Wu TW , Lee MH , Ho CT, Chang SS. 1982. Elucidation of the chemical structures of
natural antioxidants isolated from rosemary. J Am Oil Chem Soc 59:339-45.
Wu K, Zhang W , Addis PB, Epley RJ , Salih AM , Lehrfeld J. 1994 . Antioxidant
properties of wild rice. J Agric Food Chem 42 :34-7.
Wu X, Beecher GR , Holden JM, Haytowitz DB, Gebhardt SE, Prior RL. 2004. Lipophilic
and hydrophilic antioxidant capacities of common foods in the United States. J
Agric Food -Chem 52:4026-37.
Wurtzen G, Olsen P, Poulson E. 1986. The antioxidant butylated hydroxyltoluene (BHT).
A review of its toxicology and assessment of its safety in use. Food Sci Technol
18:12-8 .
Xiong YL, Decker EA. 1995. Alterations of muscle protein functionality by oxidative
and antioxidative processes . J Muscle Foods 6: 139-60.
Yamakoshi J, Saito M, Kataoka S, Tokutake S. 2002 . Procyanidin - rich extract from
grape seeds prevents cataract formation in hereditary cataractous (ICR I f) rats. J
Agric Food Chem 50(17):4983-8.
Yamamoto K, Takahashi M , Niki E. 1987. Role of iron and ascorbic acid in the oxidation
of methyl linoleate micelles. Chem Lett 6: 1149-52.
Yamauchi K. 1972a. Effect of heat treatment on the development of oxidative rancidity
in meat and its isolated tissue faction. Bull Fae Agric, Miyazaki University.
19:147.
59 Yamauchi K. 1972b. Antioxidant in over-heated meat. Miyazaki Daigaku Nogakuba
Kenlcyn Hokokn 19:402.
Yen GC, Hsieh PP. 1995. Antioxidative activity and scavenging effects on active oxygen
of xylose-lysine Maillard reaction products . J Sci Food Agric 67:415-20.
Yeung CK, Glahn RP, Wu X , Liu RH, Miller DD . 2003. In vitro iron bioavailability and
antioxidant activity of raisins. J Food Sci 68(2):701-5 .
Yong YR , Ming TC, Deng CL. 1998. A study of antioxidative and antibacterial effects of
different spices in Chinese-style sausage. J Chinese Soc of Anim Sci 27(1):117-
28.
Younathan MT, Watts BM. 1959. Relationship of meat pigments to lipid oxidation . Food
Res 24:728-34.
Younathan MT, Watts BM . 1960. Oxidation of tissue lipids in cooked pork. Food Res
25:538-43.
Younathan MT, Marjan ZM, Arshad FB. 1980. Oxidative rancidity in stored ground
turkey and beef. J Food Sci 45:274-5.
Yu L, Scanlin L, Wilson J, Schmidt G. 2002 . Rosemary extracts as inhibitors of lipid
oxidation and color change in cooked turkey products during refrigerated storage.
J Food Sci 67(2):582-5.
Yu LL, Zhou KK, Parry L. 2005. Antioxidant properties of cold-pressed black caraway,
carrot, cranberry, and hemp seed oils. Food Chem 91(4):723-9.
CHAPTER3
EVALUATION OF MILK MINERAL ANTIOXIDANT ACTIVITY IN BEEF
MEATBALLS AND NITRITE-CURED SAUSAGE
Abstract
60
The objectives of this study were to determine the antioxidant activity of 1.5%
milk mineral (MM) added to uncured cooked beef meatballs and to evaluate possible
additive antioxidant effects of MM in combination with 20 or 40-ppm sodium nitrite in
beef sausages. All treatments were also formulated with 1.5% salt and 10% added water.
Thiobarbituric acid (TBA) values and Hunter color values were determined at 1 d, 8 d,
and 15 d of storage at 2°C. Meatball cooked yield was also measured and was not
different (P < 0.05) between control meatballs and those containing MM . As expected,
treatments containing nitrite had higher redness (Commission Internationale de
l'Eclairage; CIE a*) than samples without nitrite. Redness values increased with storage
time in sausages containing 40-ppm nitrite. However, redness values decreased (P < 0.05)
during storage of control meatballs, associated with increased lipid oxidation (higher
TBA values). Lipid oxidation was lower (P < 0.05) in samples containing 1.5% MM with
TBA values < 1.2 after 15 d storage compared with 6.1 for control samples. There was no
additive inhibition of lipid oxidation in samples containing 20 or 40-ppm sodium nitrite
plus 1.5% MM. Milk mineral alone at 1.5% of meat weight was sufficient for inhibition
of lipid oxidation in cooked beef samples.
Reprinted from Vasavada MN, Cornforth DP. 2005. Evaluation of milk mineral antioxidant activity in beef meatballs and nitrite-cured sausage. J Food Sci 70(4):C250-3.
61 Introduction
Lipid oxidation is a major cause of deterioration in the quality of meat and meat
products (Asghar and others 1988; Ladikos and Lougovois 1990). Lipid oxidation leads
to production of malonaldehyde, a potent mutagen and / or carcinogen (Shamberger and
others 1974). Lipid oxidation is faster in heated meat than in raw meat tissues
(Tichivangana and Morrissey 1985). The rate and degree of oxidative degradation has
been directly related to the degree of unsaturation of the lipids present (Igene and Pearson
1979; Tichivangana and Morrissey 1985) and degree of oxygen exposure (O'Grady and
others 2000; Jayasingh and others 2002). Oxidation of unsaturated lipids in cooked meats
during storage and reheating results in stale or rancid flavors known as warmed-over
flavor (WOF) (Sato and Hegarty 1971).
The greater propensity of WOF in cooked and comminuted products is due to the
release of non-heme iron during cooking and grinding (Igene and others 1979).
Unsaturated lipids, especially those of the membrane phospholipids fraction, are the
compounds undergoing autoxidation (Y ounathan and Watts 1960; !gene and Pearson
1979). The development of WOF in cooked meat is generally accepted to be the result of
autoxidation of tissue lipids (Younathan and Watts 1960; Ruenger and others 1978).
Cooked meat develops rancid flavor more rapidly than uncooked meat during
refrigerated storage, resulting in WOF (Tims and Watts 1958). The thiobarbituric acid
test (TBA) is the most frequently used test to assess lipid oxidation in meat. Sensory
panelists describe the extent of lipid oxidation in terms of rancid odor or taste. Tarladgis
and others ( 1960) found that TBA numbers (milligrams of TBA reactive substances /
62 kilogram of tissue) were highly correlated with trained sensory panel scores for rancid
odor in ground pork. The TBA number at which a rancid odor was first perceived was
between 0.5 and 1.0. This "threshold" has served as a guide for interpreting TBA test
results. According to Greene and Cumuze (1981) the range of oxidized flavor detection
for inexperienced panelists was within a range of TBA numbers similar to the previously
determined threshold level for trained panelists.
Nitrites and nitrates function as antioxidants by binding to heme iron, which upon
reduction form NO-heme complexes that stabilize the heme group during cooking. The
ionic iron released by cooking is the primary prooxidant in cooked meats (Igene and
others 1979). Milk mineral (MM) is the mineral fraction of skim milk . It works as an
antioxidant in cooked meats by iron-chelation to colloidal calcium phosphate (Cornforth
and West 2002) . The objective of this study was to evaluate possible additive effects of
MM and sodium nitrite to reduce TBA values of cooked beef samples during storage at
2°c for 15 d.
Materials and Methods
Experimental design and statistics
The study was a factorial design with 4 treatments (control, 1.5% MM, 1.5% MM
+ 20 ppm sodium nitrite, 1.5% MM+ 40 ppm sodium nitrite), 3 cooked meat storage
times (1, 8, and 15 d), and 3 replicates of the experiment. The treatment means were
calculated by analysis of variance (ANOV A) using ST A TISTICA ™ software (Statsoft
Inc., Tulsa, Okla., U.S.A.). Significant differences among means were determined by
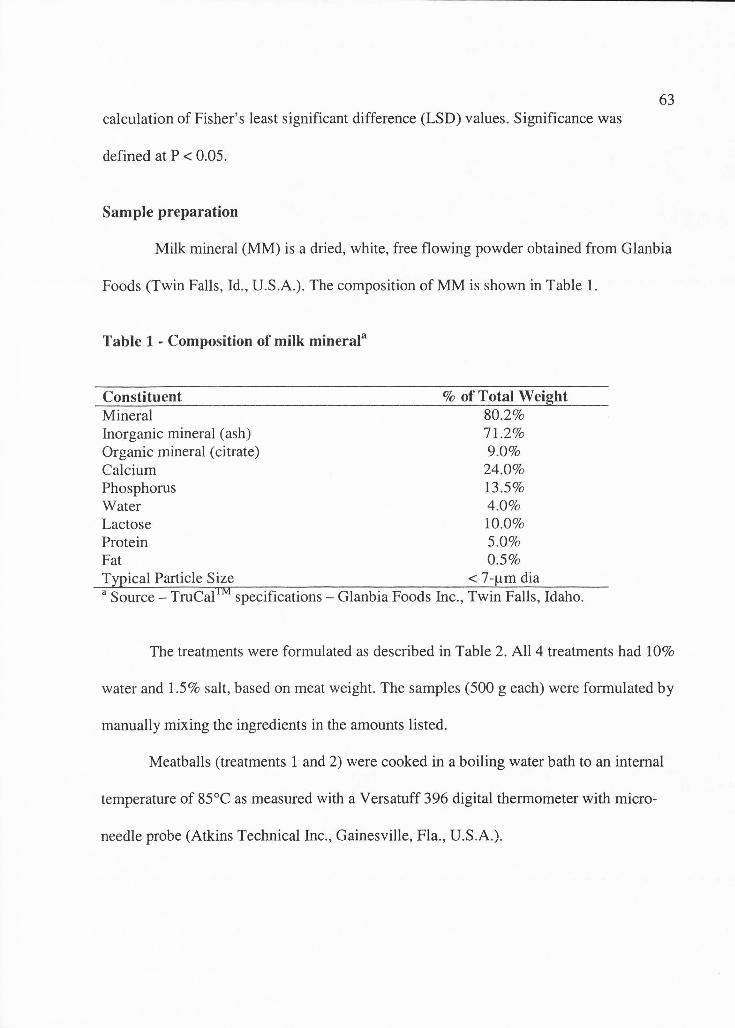
calculation of Fisher's least significant difference (LSD) values. Significance was
defined at P < 0.05.
Sample preparation
63
Milk mineral (MM) is a dried, white, free flowing powder obtained from Glanbia
Foods (Twin Falls, Id., U.S.A.). The composition of MM is shown in Table 1.
Table 1 - Composition of milk mineral3
Constituent Mineral Inorganic mineral (ash) Organic mineral (citrate) Calcium Phosphorus Water Lactose Protein Fat
% of Total Weight 80.2% 71.2% 9.0%
24.0% 13.5% 4.0% 10.0% 5.0% 0.5%
Typical Particle Size < 7-µm dia a Source - TruCal IM specifications - Glanbia Foods Inc., Twin Falls, Idaho.
The treatments were formulated as described in Table 2. All 4 treatments had 10%
water and 1.5% salt, based on meat weight. The samples (500 g each) were formulated by
manually mixing the ingredients in the amounts listed.
Meatballs (treatments 1 and 2) were cooked in a boiling water bath to an internal
temperature of 85°C as measured with a Versatuff 396 digital thermometer with micro
needle probe (Atkins Technical Inc., Gainesville, Fla., U.S.A.).
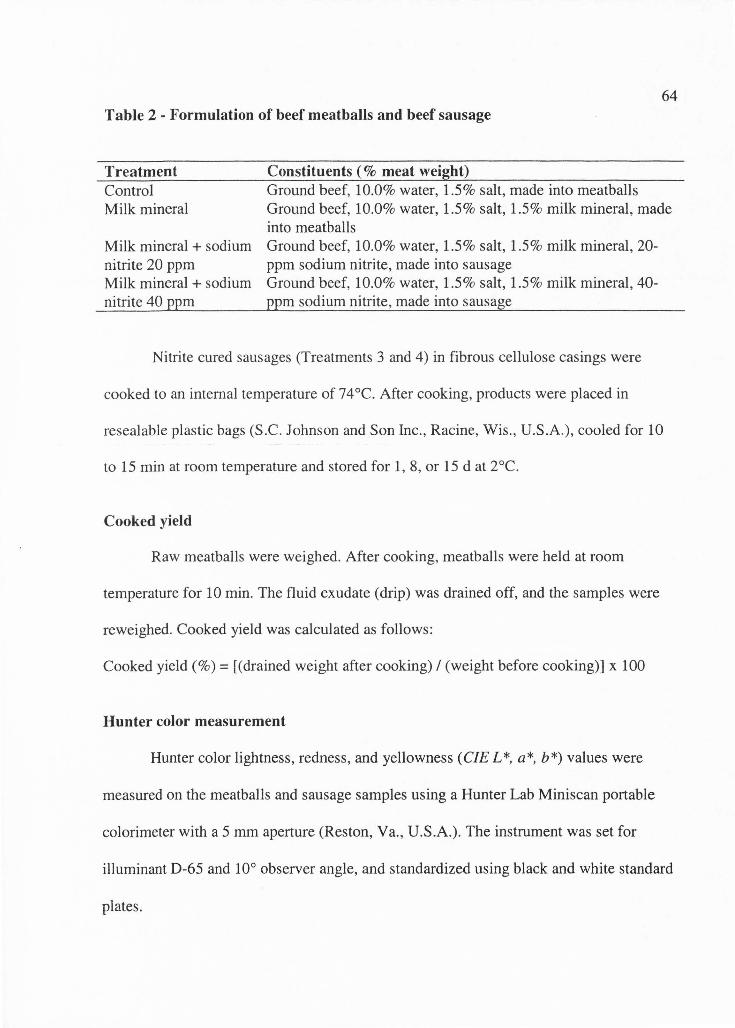
64 Table 2 - Formulation of beef meatballs and beef sausage
Treatment Constituents ( % meat weight) Control Milk mineral
Ground beef , 10.0% water, 1.5% salt, made into meatballs Ground beef, 10.0% water, 1.5% salt, 1.5% milk mineral, made into meatballs
Milk mineral + sodium nitrite 20 ppm Milk mineral+ sodium nitrite 40 ppm
Ground beef, 10.0% water, 1.5% salt, 1.5% milk mineral, 20-ppm sodium nitrite, made into sausage Ground beef, 10.0% water , 1.5% salt, 1.5% milk mineral, 40-ppm sodium nitrite , made into sausage
Nitrite cured sausages (Treatments 3 and 4) in fibrous cellulose casings were
cooked to an internal temperature of 74°C. After cooking, products were placed in
resealable plastic bags (S.C. Johnson and Son Inc., Racine , Wis ., U.S.A.) , cooled for 10
to 15 min at room temperature and stored for 1, 8, or 15 d at 2°C.
Cooked yield
Raw meatball s were weighed. After cooking, meatballs were held at room
temperature for 10 min. The fluid exudate (drip) was drained off, and the samples were
reweighed . Cooked yield was calculated as follows:
Cooked yield(%)= [(drained weight after cooking)/ (weight before cooking)] x 100
Hunter color measurement
Hunter color lightness, redness, and yellowness (CIEL*, a*, b*) values were
measured on the meatballs and sausage samples using a Hunter Lab Miniscan portable
colorimeter with a 5 mm aperture (Reston, Va., U.S.A.) . The instrument was set for
illuminant D-65 and 10° observer angle, and standardized using black and white standard
plates.
TBA value
Thiobarbituric acid reactive substances (TBARS) assay was performed as
described by Buege and Aust (1978). Duplicate meat samples (0.5 g) for all the
treatments were mixed with 2.5 mL of stock solution containing 0.375% TBA (Sigma
Chem. Co., St. Louis, Mo., U.S .A.), 15% TCA (Mallinkrodt Baker, Inc., Paris, Ky.,
U.S .A.) and 0.25 N HCl.
The mixture was heated for 10 min in a boiling water bath to develop a pink
color. It was then cooled in tap water and centrifuged (Sorvall Instruments, Model RC
SC, DuPont, Wilmington, Del. , U.S.A.) at 6000 rpm for 10 min. The absorbance of the
supernatant was measured spectrophotometrically (Spectronic 21D, Milton Roy,
Rochester, N.Y., U.S.A.) at 532 nm against a blank that contained all the other reagents
of the test minus the meat.
The malonaldehyde (MDA) concentration was calculated using an extinction
coefficient of 156000 M-1 cm-1 (Sinnhuber and Yu 1958). The MDA concentration was
then converted to TBA number (milligrams of MDA / kilogram of meat sample) using
the following equation:
65
TBA no. (mg/ kg)= Sample A532 x (1 M TBA Chromagen / 156000) x [(1 mole/ L) / M]
x (0.003 L / 0.5 g meat) x (72.07 g MDA / mole MDA) x (1000 g / Kg) (1)
or
TBA nr (ppm) = Sample As32 x 2.77 (2)
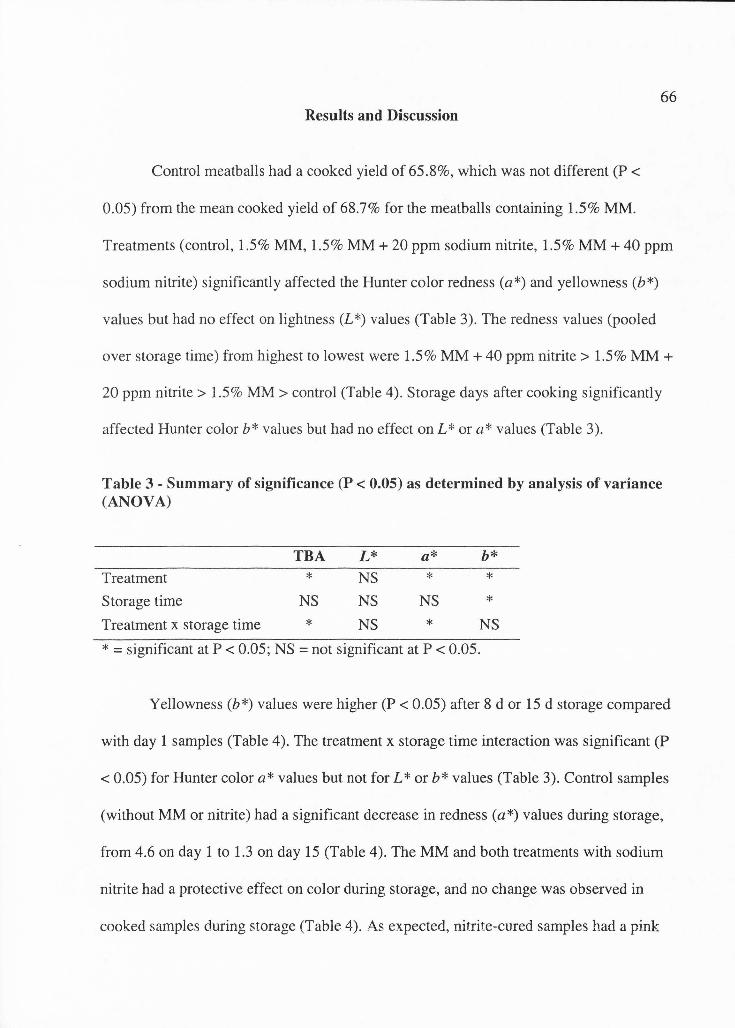
66 Results and Discussion
Control meatballs had a cooked yield of 65.8%, which was not different (P <
0.05) from the mean cooked yield of 68.7% for the meatballs containing 1.5% MM.
Treatments (control, 1.5% MM, 1.5% MM+ 20 ppm sodium nitrite, 1.5% MM+ 40 ppm
sodium nitrite) significantly affected the Hunter color redness (a*) and yellowness (b*)
values but had no effect on lightness (L*) values (Table 3). The redness values (pooled
over storage time) from highest to lowest were 1.5% MM+ 40 ppm nitrite> 1.5% MM+
20 ppm nitrite> 1.5% MM> control (Table 4). Storage days after cooking significantly
affected Hunter color b * values but had no effect on L * or a * values (Table 3) .
Table 3 - Summary of significance (P < 0.05) as determined by analysis of variance (ANOVA)
Treatment
Storage time
TBA
*
NS
L*
NS
NS
a* *
NS
b*
* *
Treatment x storage time * NS * NS
* = significant at P < 0.05; NS = not significant at P < 0.05.
Yellowness (b*) values were higher (P < 0.05) after 8 d or 15 d storage compared
with day 1 samples (Table 4). The treatment x storage time interaction was significant (P
< 0.05) for Hunter color a* values but not for L* orb* values (Table 3). Control samples
(without MM or nitrite) had a significant decrease in redness (a*) values during storage,
from 4.6 on day 1 to 1.3 on day 15 (Table 4). The MM and both treatments with sodium
nitrite had a protective effect on color during storage, and no change was observed in
cooked samples during storage (Table 4). As expected, nitrite-cured samples had a pink
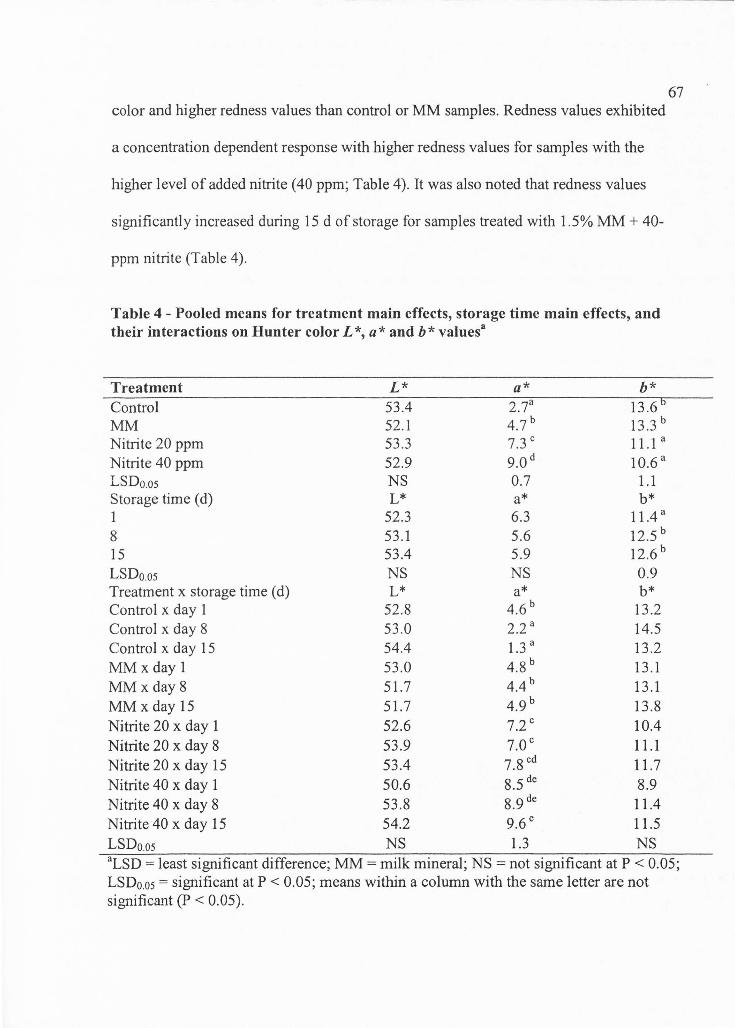
color and higher redness values than control or MM samples . Redness values exhibited
a concentration dependent response with higher redness values for samples with the
higher level of added nitrite (40 ppm; Table 4). It was also noted that redness values
significantly increased during 15 d of storage for samples treated with 1.5% MM + 40-
ppm nitrite (Table 4).
Table 4 - Pooled means for treatment main effects, storage time main effects, and their interactions on Hunter color L *, a* and b * values a
Treatment Control MM
L* 53.4 52.1
a* 2.7a 4.7b
b* 13.6 13.3 b
Nitrite 20 ppm 11.1 a 53.3 7.3 C
Nitrite 40 ppm 10.6 a 52.9 9.0d LSDo.os 1.1 NS 0.7 Storage time (d) b* L* a* 1 11.4 a 52.3 6.3 8 53.1 5.6 12.5 b 15 53.4 5.9 12.6b LSDo.os NS NS 0.9 Treatment x storage time (d) L* a* b* Control x day 1 52.8 4.6 b 13.2 Control x day 8 53.0 2.2 a 14.5 Control x day 15 54.4 1.3 a 13.2 MMxdayl 53.0 4.8b 13.1 MM x day 8 51.7 4.4 b 13.1 MM x day 15 51.7 4.9 b 13.8 Nitrite 20 x day 1 52.6 7 .2 c 10.4 Nitrite20xday8 53.9 7.0c 11.1 Nitrite20xday15 53.4 7.8cd 11.7 Nitrite 40 x day 1 50.6 8.5 de 8.9 Nitrite 40 x day 8 53.8 8.9 de 11.4 Nitrite40xdayl5 54.2 9.6e 11.5 LSDo.os NS 1.3 NS
67
aLSD = least significant difference; MM= milk mineral; NS = not significant at P < 0.05; LSD0.05 = significant at P < 0.05; means within a column with the same letter are not significant (P < 0.05).
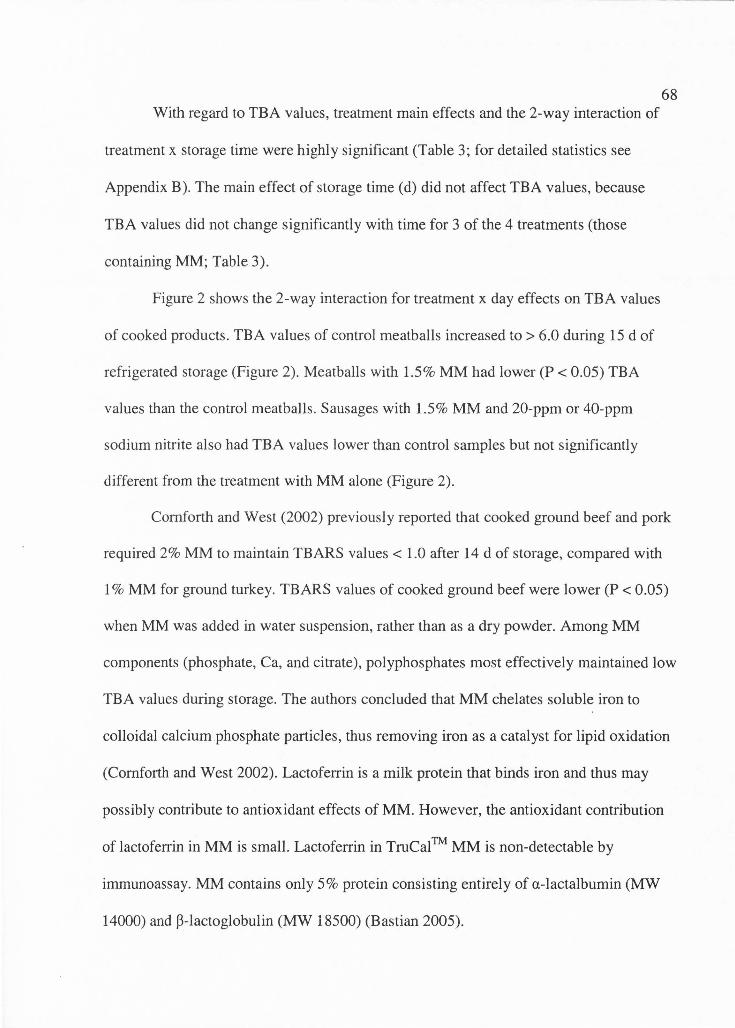
With regard to TBA values, treatment main effects and the 2-way interaction of
treatment x storage time were highly significant (Table 3; for detailed statistics see
Appendix B). The main effect of storage time (d) did not affect TBA values, because
TBA values did not change significantly with time for 3 of the 4 treatments (those
containing MM; Table 3).
Figure 2 shows the 2-way interaction for treatment x day effects on TBA values
of cooked products. TBA values of control meatballs increased to> 6.0 during 15 d of
refrigerated storage (Figure 2). Meatballs with 1.5% MM had lower (P < 0.05) TBA
values than the control meatballs . Sausages with 1.5% MM and 20-ppm or 40-ppm
sodium nitrite also had TBA values lower than control samples but not significantly
different from the treatment with MM alone (Figure 2).
68
Cornforth and West (2002) previously reported that cooked ground beef and pork
required 2% MM to maintain TBARS values< 1.0 after 14 d of storage, compared with
1 % MM for ground turkey. TBARS values of cooked ground beef were lower (P < 0.05)
when MM was added in water suspension, rather than as a dry powder. Among MM
components (phosphate, Ca, and citrate), polyphosphates most effectively maintained low
TBA values during storage. The authors concluded that MM chelates soluble iron to
colloidal calcium .phosphate particles, thus removing iron as a catalyst for lipid oxidation
(Cornforth and West 2002). Lactoferrin is a milk protein that binds iron and thus may
possibly contribute to antioxidant effects of MM. However, the antioxidant contribution
of lactoferrin in MM is small. Lactoferrin in TruCal™ MM is non-detectable by
immunoassay . MM contains only 5% protein consisting entirely of a-lactalbumin (MW
14000) and P-lactoglobulin (MW 18500) (Bastian 2005).
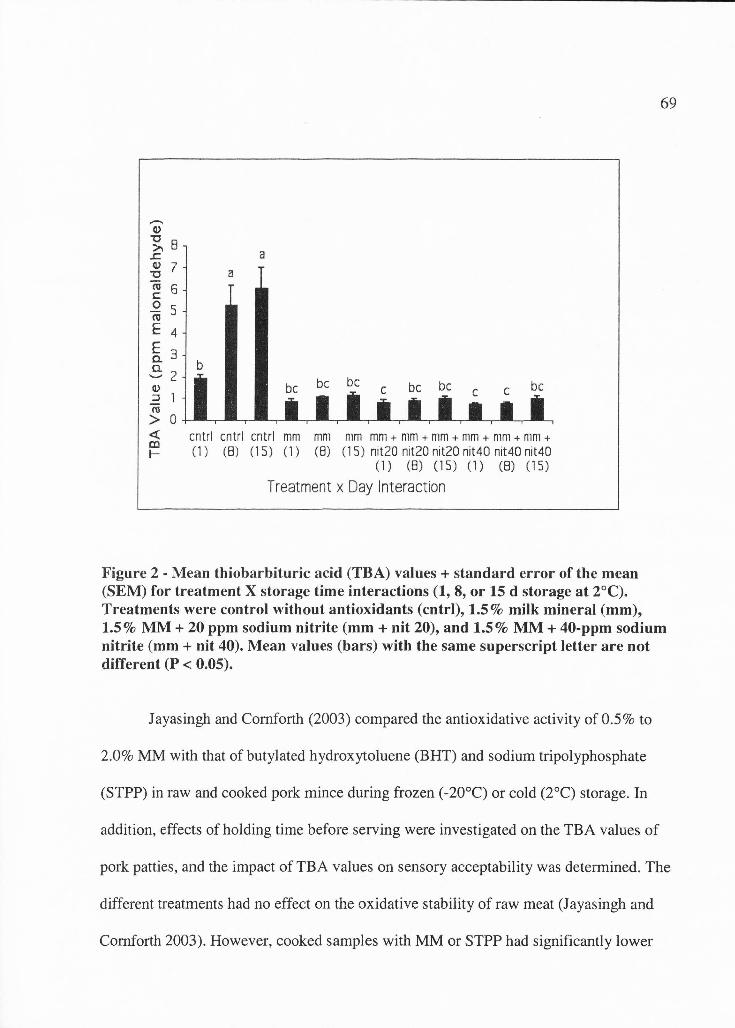
ro 6 C: 0 5 ro E 4
~ 3
~2 ~ :J 1 ro > 0 ~ co I-
a a
b be be be be
entrl cntrl cntrl mm mm mm mm + mm + mm + mm + mm + mm + (1) (B) (15) (1) (B) (15) nit20 nit20 nit20 nit40 nit40 nit40
(1) (B) (15) Cl) (B) (15)
Treatment x Day Interaction
69
Figure 2 - Mean thiobarbituric acid (TBA) values + standard error of the mean (SEM) for treatment X storage time interactions (1, 8, or 15 d storage at 2°C). Treatments were control without antioxidants (cntrl), 1.5% milk mineral (mm), 1.5% MM+ 20 ppm sodium nitrite (mm+ nit 20), and 1.5% MM+ 40-ppm sodium nitrite (mm + nit 40). Mean values (bars) with the same superscript letter are not different (P < 0.05).
Jayasingh and Cornforth (2003) compared the antioxidative activity of 0.5% to
2.0% MM with that of butylated hydroxytoluene (BHT) and sodium tripolyphosphate
(STPP) in raw and cooked pork mince during frozen (-20°C) or cold (2°C) storage . In
addition, effects of holding time before serving were investigated on the TBA values of
pork patties, and the impact of TBA values on sensory acceptability was determined. The
different treatments had no effect on the oxidative stability of raw meat (Jayasingh and
Cornforth 2003). However, cooked samples with MM or STPP had significantly lower
70 TBA values than were observed for the treatment with BHT. TBA values of cooked
patties did not significantly increase during Oto 60 min of holding time, but TBA values
were significantly higher after 90 or 120 min. Sensory panelists preferred patties with
TBA values < 0.5, compared with patties with TBA values > 1.4 (J ayasingh and
Cornforth 2003).
In the United States, sausages are typically formulated with 156 ppm sodium
nitrite. However, cured pink color development occurs with as little as 14 ppm sodium
nitrite in beef rounds or 4 ppm in pork shoulder cuts (Heaton and others 2000). The
USDA-FSIS permits nitrite levels as low as 40 ppm in bacon, in combination with sugar
and starter cultures, so that fermentation occurs (USDA 1999). Inhibition of Clostridium
botulinum is achieved by product acidification during fermentation.
In the present study, sausages with 20 ppm or 40 ppm sodium nitrite were both
pink, but pink color was most intense in sausages with 40 ppm nitrite after 15 d of
storage. There were no additional antioxidant effects of 1.5% MM with sodium nitrite on
TBA values during storage of beef sausages. MM ( 1.5%) alone was sufficient to maintain
low TBA values during storage. Addition of 20 ppm or 40 ppm nitrite to samples
containing 1.5% MM did not decrease the TBA values during storage, compared with
samples with MM alone.
Conclusions
Milk mineral (1.5%) was very effective for inhibition of oxidation in cooked
meatballs during 15 d of refrigerated storage. Thus, MM has potential application as an
antioxidant for addition to ground meatballs before cooking. Addition of 20 ppm or 40
ppm sodium nitrite to sausages containing 1.5% MM did not result in lower TBA
values. Thus, there was no additional antioxidant effect between 1.5% MM and sodium
nitrite for improving oxidative stability of cooked beef sausages.
References
Asghar A, Gray JI, Buckley DJ, Pearson AM, Booren AM . 1988. Perspective on
warmed-over flavor. Food Technol 42 :102-8.
Bastian E. 2005 . Personal communication. Twin Falls , Idaho; Glanbia Foods .
71
Buege JA, Aust SD. 1978. Microsomal lipid peroxidation. Meth Enzymol 52:302 -4.
Cornforth DP, West EM. 2002 . Evaluation of antioxidant effects of dried milk mineral in
cooked beef, pork and turkey . J Food Sci 67:615-8.
Greene BE, Cumuze TH. 1981. Relationship between TBA numbers and inexperienced
panelists ' assessment of oxidized flavor in cooked beef. J Food Sci 47 :52-4, 58.
Heaton KM, Cornforth DP, Moiseev IV, Egbert WR, Carpenter CE. 2000. Minimum
sodium nitrite levels for pinking of various cooked meats as related to use of
direct or indirect-dried soy isolates in poultry rolls . Meat Sci 55:321-9.
Igene JO, King JA, Pearson AM, Gray JI. 1979. Influence of heme pigments, nitrite, and
non-heme iron on the development of warmed-over flavor (WOF) in cooked
meat. J Agric Food Chem 27:838-42.
Igene JO, Pearson AM. 1979. Role of phospholipids and triglycerides in warmed-over
flavor development in meat systems. J Food Sci 44: 1285-90.
72 Jayasingh P, Cornforth DP . 2003. Comparison of antioxidant effects of milk mineral,
butylated hydroxytoluene and sodium tripolyphosphate in raw and cooked ground
pork . Meat Sci 66:83-9.
Jayasingh P, Cornforth DP, Brennand CP, Carpenter CE, Whittier DR. 2002. Sensory
evaluation of ground beef stored in high-oxygen modified atmosphere packaging.
J Food Sci 67:3493-6.
Ladikos D, Lougovoi s V . 1990. Lipid oxidation in muscle foods. Food Chem 35:295-
314.
O'Grady MN, Monahan FJ, Burke RM , Allen P. 2000 . The effect of oxygen level and
exogenous alpha-tocopherol on the oxidative stability of minced beef in modified
atmospheric packs . Meat Sci 55:39-45.
Ruenger EL, Reineccius GA, Thompson DR. 1978. Flavor compounds related to the
warmed-over flavor of turkey . J Food Sci 43: 1198-200.
Sato K, Hegarty GR. 1971. Warmed-over flavor in cooked meats. J Food Sci 36:1098-
102.
Shamberger RJ , Andreone TL, Willis CE. 1974. Antioxidants in cancer, 4. Initiating
activity of malonaldehyde as carcinogen. J Nat Cancer Inst 53:1771-3.
Sinnhuber RO, Yu TC. 1958. 2-Thiobarbituric acid method for the measurement of
rancidity in fishery products. II. The quantitative determination of malonaldehyde.
Food Technol 12:9-12.
Tarladgis BG, Watts BM, Younathan MT, Dugan L. 1960. A distillation method for the
quantitative determination of malonaldehyde in rancid foods . J Am Oil Chem Soc
37:44-8.
73 Tichivangana JZ, Morrissey PA. 1985. Myoglobin and inorganic metals as
proxidants in raw and cooked muscles system. Meat Sci 15:107-16.
Tims MJ, Watts BM. 1958. Protection of cooked meats with phosphates. Food Technol
12:240-3.
[USDA] U.S. Dept of Agriculture. 1999. Animals and animal products. Ch 3 Food safety
and inspection service, U.S. Dept of Agric. Part 318. Entry into official
establishments: re-inspection and preparation of products . Code of Federal
Regulations . Title 9. 9CFR318 .7, 2:242-58.
Younathan MT, Watts BM. 1960. Oxidation of tissue lipids in cooked pork . Food Res
25:538-43. -
CHAPTER4
EVALUATION OF GARAM MASALA SPICES AND PHOSPHATES AS
ANTIOXIDANTS IN COOKED GROUND BEEF
Abstract
74
This study determined antioxidant effects and sensory attributes of individual
ingredients (black pepper, caraway, cardamom, chili powder, cinnamon, cloves,
coriander, cumin, fennel, ginger, nutmeg, salt, star anise) in an Indian spice blend (Garam
Masala), in cooked ground beef. Thiobarbituric acid (TBA) values were measured as an
indicator of rancidity for cooked samples on 1, 8, or 15 d refrigerated storage. Cooked
samples were evaluated by a trained panel (n = 13) for intensity of rancid odor/ flavor,
beef flavor, and spice flavor and correlated with TBA values of same day samples. We
also investigated possible additive effects between spice antioxidants and iron binding
(Type II) antioxidants on lipid oxidation by measuring TBA values. All spices had
antioxidant effects on cooked ground beef, compared to controls. Among spices, cloves
were the most effective in controlling lipid oxidation, with TBA values of 0.75, after 15 d
refrigerated storage. All spices at their recommended levels lowered rancid odor and
flavor in cooked ground beef, compared to controls. As expected, most spices also
imparted distinctive flavors to cooked ground beef. There was a positive correlation
(0.77) between TBA values on 15 d and rancid odor/ flavor. Type II antioxidants (such
as iron-binding phosphate compounds) were more effective than individual Type I
antioxidants (such as spices and butylated hydroxytoluene), for maintenance of low TBA
values in cooked ground beef during storage . Additive effects were observed ,.vith
rosemary+ milk mineral or sodium tripolyphosphate (STPP), compared to rosemary
alone.
Introduction
75
According to the American Spice Trade Association, a spice is "any dried plant
product used primarily for seasoning purposes." This includes herbs, spice seeds, roots,
spice blends and other plant-based elements. Spices such as cloves, cinnamon, black
pepper, turmeric, ginger, garlic and onions exhibit antioxidant properties in different food
systems (Younathan and others 1980; Al-Jalay and others 1987; Jurdi-Haldeman and
others 1987). Antioxidative effects of dried and ethanolic extracts of spices (marjoram,
wild marjoram, caraway, peppermint, clove, nutmeg, curry powder, cinnamon, sage,
basil, thyme, and ginger) on the oxidative stability of fresh minced chicken meat, and
fresh and microwave cooked pork patties pretreated with NaCl, and subjected to either
refrigerated or frozen storage ( 4 and -l 8°C, respectively) have been investigated, and
results show that application of dried spices to chicken meat inhibited lipid oxidation in
frozen samples, with dried marjoram, wild marjoram and caraway having the highest
antioxidative activity (Abd-El-Alim and others 1999).
Retail Garam Masala spice blends have up to 13 different ingredients including
black pepper, caraway, cardamom, chili, cinnamon, cloves, coriander, cumin, fennel,
ginger, nutmeg, salt, and star anise in varying levels. One example composition includes
black pepper (10%), cardamom (30%), cinnamon (5%), cloves (5%), coriander (25%),
cumin (20%), and nutmeg (5%; http://www.labellecuisine.com).
76 Previous work has identified numerous antioxidant compounds in the various
spices of Garam Masala. Black pepper (Piper nigrum) has piperine as the active
antioxidant compound (Badmaev and others 2000) . Caraway (Carum carvi) has been
shown to have high antioxidant activity in cooked, frozen chicken meat (Abd-El-Alim
and others 1999). The ethyl acetate-soluble fraction of cardamom ( Elletoria
cardamomum) has been shown to have a high radical-scavenging activity against 1,1-
diphenyl-2-picrylhydrazyl (DPPH) (Kikuzaki and others 2001). Chili peppers (Capsicum
annuum) contain capsaicin (trans-8-methyl-N-vanillyl-6-nonenamide), which is an
antioxidant (Surh 1999). Antioxidant activity in fresh chili peppers has also been
attributed to presence of ascorbic acid, flavonoids, and phenolic acids (Jimenez and
others 2003). However, ascorbic acid content is undoubtedly lower in dried chili powder
compared to fresh fruit. Cinnamon (Cinnamonum verum) contains cinnamic aldehyde,
which gives it a distinct flavor and odor. Cinnamon was a better superoxide radical
scavenger than mint, anise, BHA, ginger and BHT (Murcia and others 2004). Cloves
(Syzygium aromaticum) have been shown to have antioxidant activity partly due to the
presence of aroma compounds such as eugenol and eugenyl acetate (Lee and Shibamoto
2001). Cloves have the strongest antioxidative activity among Chinese 5-spice
ingredients, in cooked ground beef during refrigerated storage (Dwivedi and others
2006).
Linalool is the main antioxidative compound in coriander (Coriandrum sativum)
(Reddy and Lokesh 1992). Coriander extract demonstrates antioxidative activity alone
and in synergism with BHT and thus an aqueous extract of coriander has potential for use
as an antioxidant preparation in foods (Melo and others 2003). Cumin (Cuminum
77 cynicum) has cumin aldehyde as the principal contributor to aroma, flavor, and
antioxidant properties (Reddy and Lokesh 1992). Extracts of plants like cumin having
high levels of phenolic compounds exhibited strong H-donating activity and are effective
scavengers of hydrogen peroxide and superoxide radicals (Lugasi and others 1995).
Fennel ( Foeniculum vulgare) has been shown to have in-vitro antioxidant activity (Oktay
and others 2003). The antioxidant compounds in fennel include 3-caffeoylquinic acid,
rosamirinic acid, and quercetin-3-0-galactoside (Parejo and others 2004). Ginger
(Zingiber officinale) has been shown to have gingerol-related compounds and
diarylheptanoids as the main antioxidant fractions (Nakatani 2003). Nutmeg (Myristica
fragrans Routt) contains about 10% essential oil, which is primarily composed of terpene
hydrocarbons (pinenes, camphene, p-cymene, sabinene, phellandrene, terpinene,
limonene and myrcene; 60 to 90% ), terpene derivatives (linalool, geraniol and terpineol;
5 to 15%) and phenylpropanes (myristicine, elemicine and safrol; 2 to 20%; Nakatani
2003). These compounds are responsible for the antioxidant properties of nutmeg.
Salt has been shown to have both pro-oxidant and antioxidant effects in meat
products. TBA values increased with increasing salt concentration (0-2%) in frozen
ground pork during 10 wk storage (Lee and others 1997). On the other hand, phosphate
buffer (25mM NaH2P04/Na2HP04), high final pH (7.0) of surimi pellet, and the
presence of salt (O.lM NaCl) all inhibited both protein and lipid oxidation during storage.
(Subramanian and others 1996). Salaeh and Muangwong (2001) have found that
protocatechuic acid had more antioxidant activity than BHT in the 1,1-diphenyl-2-
picrylhydrazyl (DPPH) radical scavenging assay, and could be used as a marker for
radical scavenging activity of star anise (Illicium Verum).
78 Although the individual components of Garam Masala have been shown to
have antioxidant activity in model systems, our first objective was to compare individual
spices of Garam Masala spice blend for their antioxidant effect in cooked ground beef.
Sensory evaluation was also done on cooked ground beef containing the Garam Masala
individual spices . Finally, tests were also conducted to evaluate possible additive effects
of Type I antioxidants (cinnamon, clove, BHT, ground rosemary), and Type II iron
chelating antioxidants (milk mineral, STPP), when used together in cooked ground beef.
Materials and Methods
Comparison of TBA values during storage
To compare TBA values during storage, a factorial design was used with 14
ground beef treatments (black pepper, caraway, cardamom, chili powder, cinnamon,
cloves, coriander, cumin, fennel, ginger, nutmeg, retail Garam Masala, salt and star
anise), at four levels (0, 0.1, 0.5, or 1.0 % ofraw meat weight), 3 storage times (1, 8, or
15 d), and 3 replicates of the entire experiment. Thiobarbituric acid values (duplicates for
each sample) were measured as an indicator ofrancidity at 1, 8, or 15 d storage of cooked
ground beef crumbles at 2°C. The lowest effective (recommended) spice level among the
levels tested in this study (0.1, 0.5, or 1 %), for each individual spice was determined as
the lowest spice concentration that resulted in TBA values significantly lower than the
controls (0% spice), or other spice levels.
Ground cardamom, cinnamon, chili powder, cloves, cumin, fennel, star anise,
ginger (McCormick & Co. Inc., Hunt Valley, Md., U.S.A.), ground black pepper (Inter
American Foods Inc., Cincinnati, Oh., U.S.A.), ground coriander (Spice Islands Trading
79 Co., San Francisco, Calif., U.S.A.), ground nutmeg (Pacific Foods, Kent, Wa., U.S.A.),
ground caraway (Philips Foods Inc., San Francisco, Calif., U.S.A.), non-iodized salt
(Morton Intl. Inc., Chicago, Ill., U.S.A.), retail Garam Masala blend (MDH Garam
Masala blend, Mahashian Di Hatti Ltd, New Delhi, India), and lean ground beef chuck
(20% fat) were purchased locally. Each spice was manually mixed with ground beef (100
g I treatment) at 0.1, 0.5, and 1.0% levels. Mixed samples were thoroughly cooked at
163°C for 5 min on a Teflon coated electric skillet (West Bend Co, West Bend , Wis.,
U.S.A.), with intermittent stirring to avoid burning. Cooking was done to achieve a final
internal temperature of 82°C to 85°C, as measured using a VersaTuff Plus 396 digital
thermometer (Atkins Technical, Inc, Gainesville, Fla ., U.S.A.) with a thin probe for fast
response. Portions (10 g) of cooked beef crumbles were placed in ziploc bags, and
temperature of the crumbles was measured. The cooked ground beef crumbles were
placed in re-sealable plastic ziploc bags (S.C. Johnson and Son, Inc., Racine, Wis.,
U.S.A.), cooled for 10 to 15 min at room temperature and stored for 1, 8 or 15 d at 2°C.
Thiobarbituric acid values were measured in duplicate at 1, 8 or 15 don the cooked
samples as an indicator of oxidative rancidity. For each ingredient spice the experiment
was replicated 3 times. Duplicate sample analysis was performed. Duplicates were not
averaged prior to data entry. Thus, there were 6 observations per treatment (3 replicates x
2 duplicates = 6 observations per treatment).
The thiobarbituric acid assay was performed as described by Buege and Aust
(1978). Duplicate samples (0.5 g) for all treatments were mixed with 2.5 ml of stock
solution containing 0.375% TBA (Sigma Chemical Co., St. Louis, Mo., U.S.A.), 15%
TCA (Mallinckrodt Baker Inc., Paris, Ky., U.S.A.) and 0.25 N HCI. The mixture was
80 heated for 10 min in a boiling water bath to develop a pink color, cooled in tap water
and then centrifuged (Sorvall Instruments, Model RC SC, DuPont, Wilmington, Del.,
U.S.A.) at 6000 rpm for 10 min . The absorbance of the supernatant was measured
spectrophotometrically (Spectronic 21D, Milton Roy, Rochester, N.Y., U.S.A.) at 532 nm
against a blank that contained all the reagents except the meat. The malonaldehyde
(MDA) concentration was calculated using an extinction coefficient of 156,000 I mole/
cm for the pink TBA-MDA pigment (Sinnhuber and Yu 1958). The absorbance values
were converted to ppm malonaldehyde by using the following equations:
1) TBA# (mg/ kg)= Sample A532 x (1 M TBA Chromagen / 156,000) x ((1 mole/ L) /
M] x (0.003 L / 0.5 g meat) x (72 .07 g MDA / mole MDA) x (1000 g / Kg), or
2) TBA# (ppm)= Sample A532 x 2.77 (where MDA = malonaldehyde).
Sensory evaluation
Cooked beef samples made with spices at their lowest effective levels determined
previously were evaluated for intensity of rancid odor, rancid flavor, beef flavor and
spice flavor. A total of 19 treatments were evaluated with 0.1 % level for cinnamon,
cloves, retail Garam Masala, and salt; 0.5% level for black pepper, chili powder,
coriander, cumin, fennel, ginger , nutmeg and star anise; 1.0% level for caraway and
cardamom; fresh control, 15 d rancid control, 1.5% milk mineral (dried, white, free
flowing powder, consisting primarily of colloidal calcium phosphate particles; Cornforth
and West 2002), 0.4% ground rosemary , and 0.5% level for STPP control. The rancid
control was cooked ground beef without added spices and held 15 d at 2°C. The fresh
control was cooked ground beef without spices, prepared on the day of the panel. Trained
81 panelists (n = 13) evaluated samples after 15 d of storage at 2°C. TBA values were
measured in duplicate on the samples that were served to the panelists on the same day as
the panel evaluation (15 d storage time). Duplicates were not averaged prior to data entry.
Thus, for TBA values, there were 6 observations per treatment (3 replicates x 2 duplicates
= 6 observations per treatment). Spice treatments and 3 control samples were cooked,
packaged and stored as previously described.
All panelists had previous sensory panel experience with cooked beef products.
The panelists were trained in two sessions. In the first session, panelists were familiarized
with the 5-point intensity scale and its usage. Panelists were also familiarized with
cooked beef flavor (both fresh and rancid samples) and cooked ground beef with each
individual added spice and Garam Masala spice blend at low (0.1 %) and high (1.0%)
spice concentrations. Group discussion was conducted regarding sample attributes. In the
second session, panelists again evaluated the same samples. The most consistent panelists
(n = 13) were included in the final sensory panel.
The 16 treatment samples at recommended concentrations as determined
previously, and 3 controls of cooked beef crumbles were evaluated in 5 sessions. A set of
6 or 7 samples (6 g each) were served to each panelist in each session, consisting of 3 or
4 spice-treated samples and 3 controls. Samples were coded and microwave re-heated for
25 s to attain a temperature of 80°C to 85°C immediately before serving. Samples were
evaluated in individual booths under red lights. The serving order was randomized to
avoid positional bias. Panelists were asked to evaluate samples for intensity of rancid
odor, rancid flavor, beef flavor, and spice flavor on a 5- point scale, where 1 = no flavor
or odor, 2 = slightly intense, 3 = moderately intense, 4 = very intense, a.11d 5 == extremely
intense flavor or odor. Panelists were also asked to provide additional qualitative
comments for each sample. Before evaluating the next sample, ballot instructions
specified that the previous sample be expectorated into cups provided for that purpose.
Panelists were instructed to rinse their mouths with tap water. Unsalted crackers were
also provided to cleanse the palate.
Comparison of Type I and Type II antioxidant effectiveness
Four Type I antioxidants (ground cinnamon 0.5%, ground cloves 0.1 %, ground
rosemary 0.4%, and BHT 0.01 % of meat weight) and two Type II antioxidants (1.5%
milk mineral, Cornforth and West 2002; 0.5% sodium tripolyphosphate, USDA
82
maximum) and various combinations of each at half their lowest effective levels, were
evaluated for antioxidant effects after 1, 8, or 15 d refrigerated storage at 2°C. The
effective levels for cinnamon (0.5%) and cloves (0.1 %) were obtained by previous work
(Dwivedi and others 2006). The effective level for ground rosemary (0.4%) was found by
preliminary experiments in this lab. A total of 17 treatments were evaluated as follows:
control, BHT 0.01 % of meat weight, cinnamon 0.5%, cloves 0.1 %, rosemary 0.4%, MM
1.5%, STPP 0.5%, BHT 0.005% + MM 0.75%, cinnamon 0.25% + MM 0.75%, cloves
0.05% + MM 0.75%, rosemary 0.2% + MM 0.75%, BHT 0.005% + STPP 0.25%,
cinnamon 0.25% + STPP 0.25%, cloves 0.05% + STPP 0.25%, rosemary 0.2% + STPP
0.25%, BHT 0.005% + cinnamon 0.25% + cloves 0.05% + rosemary 0.2%, and MM
0.75% + STPP 0.25%.
All 17 treatments were prepared by mixing the various levels of Type I and Type
II antioxidants in 300 g ground beef: Mixed samples were thoroughly cooked at 163cc
83 for 5 min on a grill, with stirring to avoid burning. Cooking was done to achieve a final
internal temperature of 82°C to 85°C, as measured using a Versa Tuff Plus 396 digital
thermometer (Atkins Technical, Inc, Gainesville, Fla. , U.S.A.) with a thin probe for fast
response. The cooked ground beef crumbles were placed in re-sealable plastic bags,
cooled for 10 to 15 min at room temperature and stored for 1, 8, or 15 d at 2°C. Two
sampling method s were compared for their effects on TBA values of cooked samples
during storage . In method 1, samples were obtained 3 times (1, 8, or 15 d) from the same
bag (100 g ground beef per treatment) . In method 2, sample bags (100 g each) were
prepared separately for sampling after storage at 1, 8, or 15 d. Comparison of TBA values
between method 1 and 2 allowed determination of the possible higher TBA values in
method one, from the repeated opening and closing of the same bag during 15 d storage.
Thiobarbituric acid (TBA) values were measured in duplicate at 1, 8, or 15 don the
cooked samples as an indicator of oxidative rancidity. The entire experiment was
replicated 3 times. Duplicate sample analysis was performed.
Statistical analysis
Mean TBA values for various spices of Garam Masala spice blend were
calculated and compared by analysis of variance using the proc GLM function in SAS
version 9.0 (SAS Institute Inc., Cary, N.C., U.S.A.). Statistical significance was
identified at the 95% confidence level, and post hoc means comparisons were made based
on P-values obtained using the Tukey-Kramer adjustment. Treatment means for sensory
values and TBA values were also calculated using the SAS program. Correlation
coefficients were calculated among sensory panel scores and TBA values. Significance
84 was defined at P < 0.001 for correlation coefficients. To compare type I and type II
antioxidant effectiveness, treatment means were calculated by ANOV A using Statistica ™
software (Statsoft Inc, Tulsa, Okla., U.S .A.). Significant differences among means were
determined by calculation of Fisher's least significant difference (LSD) values.
Significance was defined at P < 0.05 for ANOV A and LSD values.
Results and Discussion
Comparison of TBA values during storage
The main effects of spice treatment, storage time (1, 8, or 15 d), spice level (0,
0.1, 0.5, or 1.0%), the two-way interactions between spice treatment* storage time, spice
treatment * spice level, and spice treatment * spice level were all significant at P < 0.05.
The three-way interaction between spice treatment * storage time * spice level was not
significant at P < 0.05.
Table 5 shows the spice treatment * spice level interaction mean for TBA values
for various individual spices of Garam Masala and for the retail Garam Masala spice
blend. The 5 spices of Chinese 5-spice (black pepper, cinnamon, cloves, fennel, and star
anise) are also ingredients of the Garam Masala spice blend. In Table 5, the mean TBA
values for cooked ground beef+ individual Chinese 5-spice ingredients were the same as
recently published from this laboratory (Dwivedi and others 2006; Appendix A). These
values are included here in order to statistically compare all 13 ingredients of Garam
Masala. For cinnamon, cloves, and retail Garam Masala, the lowest effective level was
0.1 % (Table 5). For each spice treatment, the lowest effective spice level among levels
tested in this study (0.1, 0.5, or 1 %) was defined as the lowest spice concentration that
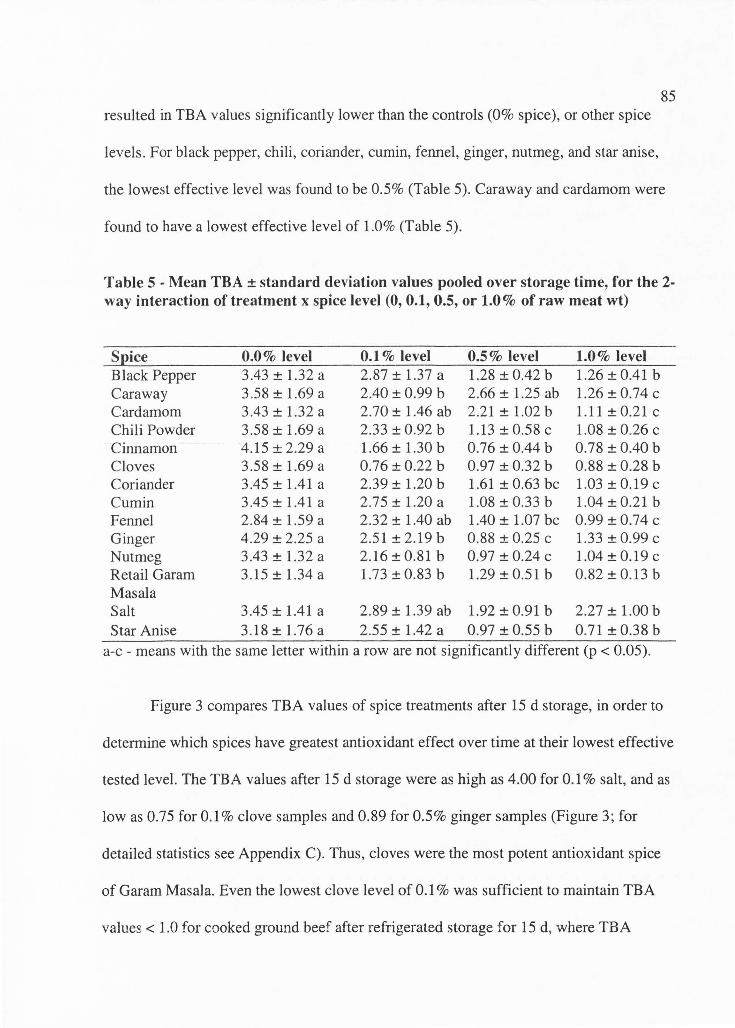
85 resulted in TBA values significantly lower than the controls (0% spice), or other spice
levels. For black pepper, chili, coriander, cumin, fennel, ginger, nutmeg, and star anise,
the lowest effective level was found to be 0.5% (Table 5). Caraway and cardamom were
found to have a lowest effective level of 1.0% (Table 5).
Table 5 - Mean TBA ± standard deviation values pooled over storage time, for the 2-way interaction of treatment x spice level (0, 0.1, 0.5, or 1.0% of raw meat wt)
Spice 0.0% level 0.1 % level 0.5% level 1.0% level Black Pepper 3.43 ± 1.32 a 2.87 ± 1.37 a 1.28 ± 0.42 b 1.26 ± 0.41 b Caraway 3.58 ± 1.69 a 2.40 ± 0.99 b 2.66 ± 1.25 ab 1.26 ± 0.74 C
Cardamom 3.43 ± 1.32 a 2.70 ± 1.46 ab 2.21 ± 1.02 b 1.11 ± 0.21 C
Chili Powder 3.58 ± 1.69 a 2.33 ± 0.92 b 1.13 ±0.58 C 1.08 ± 0.26 C
Cinnamon 4.15 ± 2.29 a 1.66 ± 1.30 b 0.76 ± 0.44 b 0.78 ± 0.40 b Cloves 3.58 ± 1.69 a 0.76 ± 0.22 b 0.97 ± 0.32 b 0.88 ± 0.28 b Coriander 3.45 ± 1.41 a 2.39 ± 1.20 b 1.61 ± 0.63 be 1.03 ± 0.19 C
Cumin 3.45 ± 1.41 a 2.75 ± 1.20 a 1.08 ± 0.33 b 1.04 ± 0.21 b Fennel 2.84 ± 1.59 a 2.32 ± 1.40 ab 1.40 ± 1.07 be 0.99 ± 0.74 C
Ginger 4.29 ± 2.25 a 2.51 ±2.19b 0.88 ± 0.25 C 1.33 ± 0.99 C
Nutmeg 3.43 ± 1.32 a 2.16 ± 0.81 b 0.97 ± 0.24 C 1.04 ± 0.19 C
Retail Garam 3.15 ± 1.34 a 1.73 ± 0.83 b 1.29 ± 0.51 b 0.82 ± 0.13 b Masala Salt 3.45 ± 1.41 a 2.89 ± 1.39 ab 1.92 ± 0.91 b 2.27 ± 1.00 b Star Anise 3.18 ± 1.76 a 2.55 ± 1.42 a 0.97 ± 0.55 b 0.71 ± 0.38 b
a-c - means with the same letter within a row are not significantly different (p < 0.05) .
Figure 3 compares TBA values of spice treatments after 15 d storage, in order to
determine which spices have greatest antioxidant effect over time at their lowest effective
tested level. The TBA values after 15 d storage were as high as 4.00 for 0.1 % salt, and as
low as 0.75 for 0.1 % clove samples and 0.89 for 0.5% ginger samples (Figure 3; for
detailed statistics see Appendix C). Thus, cloves were the most potent antioxidant spice
of Garam Masala. Even the lowest clove level of 0.1 % was sufficient to maintain TBA
values< 1.0 for cooked ground beef after refrigerated storage for 15 d, where TBA
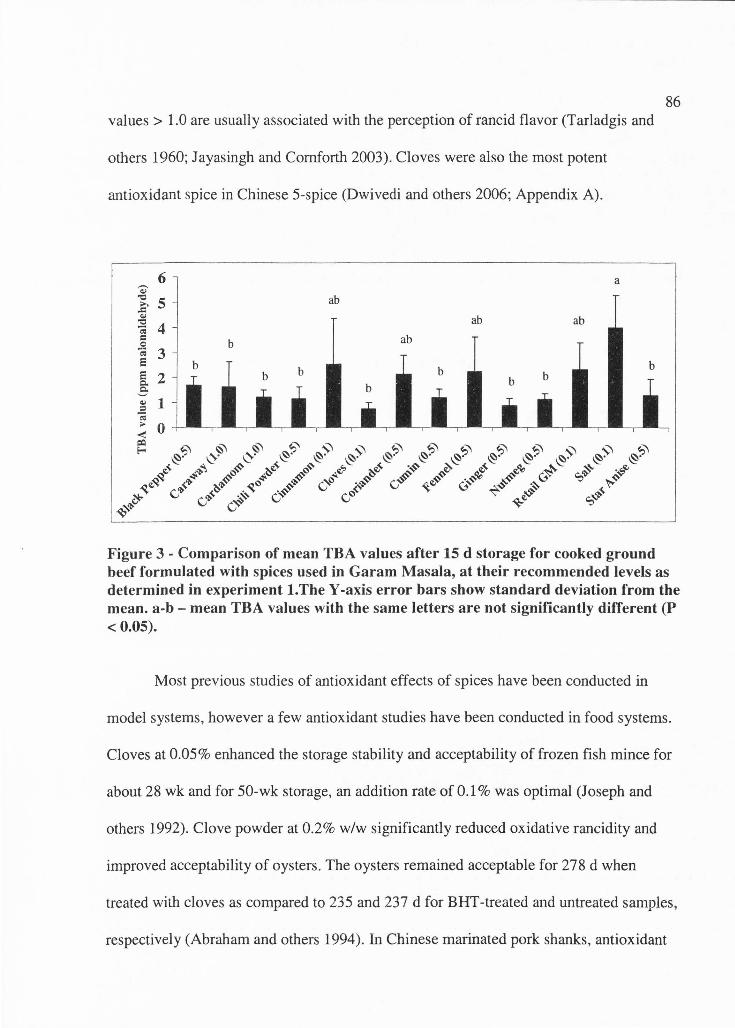
values> 1.0 are usually associated with the perception of rancid flavor (Tarladgis and
others 1960; Jayasingh and Cornforth 2003). Cloves were also the most potent
antioxidant spice in Chinese 5-spice (Dwivedi and others 2006; Appendix A).
86
Figure 3 - Comparison of mean TBA values after 15 d storage for cooked ground beef formulated with spices used in Garam Masala, at their recommended levels as determined in experiment 1. The Y-axis error bars show standard deviation from the mean. a-b - mean TBA values with the same letters are not significantly different (P < 0.05).
Most previous studies of antioxidant effects of spices have been conducted in
model systems , however a few antioxidant studies have been conducted in food systems.
Cloves at 0.05% enhanced the storage stability and acceptability of frozen fish mince for
about 28 wk and for 50-wk storage, an addition rate of 0.1 % was optimal (Joseph and
others 1992). Clove powder at 0.2% w/w significantly reduced oxidative rancidity and
improved acceptability of oysters . The oysters remained acceptable for 278 d when
treated with cloves as compared to 235 and 237 d for BHT-treated and untreated samples,
respectively (Abraham and others 1994). In Chinese marinated pork shanks , antioxidant
87 effects were observed compared to controls, and attributed to star anise as a marinade
ingredient (Wang and others 1997). Ground black pepper oleoresin extracted by
supercritical carbon dioxide was more effective in reducing lipid oxidation of cooked
ground pork than oleoresin extracted by conventional methods (Tiprisukond and others
1998). Cinnamon essential oil has been shown to have great antioxidant activity in
Chinese-style sausages (Ying and others 1998).
In the present study, 0.5% ginger also maintained TBA values< 1.0 for 15 d
refrigerated storage. In agreement with this finding , ginger extract (3%) has been
effectively used for improving the sensory quality and shelf life of cooked mutton chunks
(Mendiratta and others 2000). Fresh pork treated with 5% ginger extract in combination
with lactic acid (1 % ), liquorice (1 % ), acetic acid (1 % ) and garlic extract ( 4%) has been
shown to maintain freshness for 144 h as compared to control pork that remained fresh
for 24 to 48 h (Zhang and others 1996).
Sensory evaluation results
Trained panel sensory evaluation was done for cooked ground beef with
individual Garam Masala spices at their previously determined recommended levels
(Figure 3) compared to various control samples, after 15 d refrigerated storage. Table 6
shows the rancid odor/ flavor scores for all treatments. The 15-d rancid control sample
(without added spices) and the salt sample had the highest scores for rancid odor (3.3 and
2.7 respectively; Table 6), where a score of 3.0 indicates moderately intense rancid odor.
These 2 samples were significantly higher than others for rancid odor intensity (Table 6).
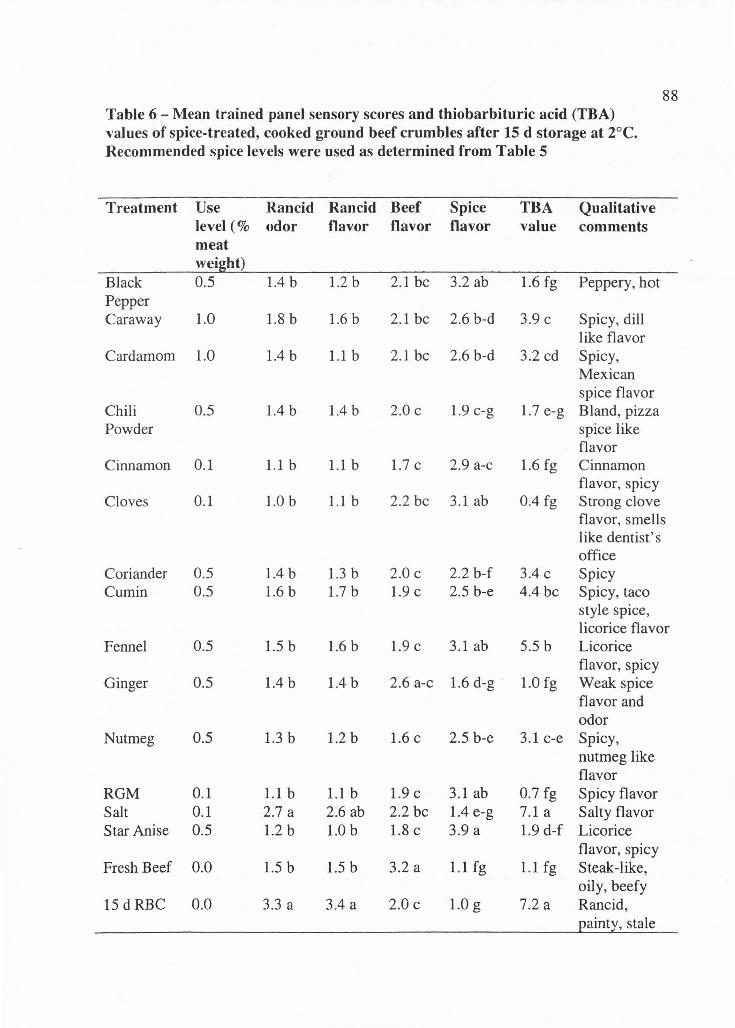
Table 6 - Mean trained panel sensory scores and thiobarbituric acid (TBA) values of spice-treated, cooked ground beef crumbles after 15 d storage at 2°C. Recommended spice levels were used as determined from Table 5
Treatment Use Rancid Rancid Beef Spice TBA Qualitative level(% odor flavor flavor flavor value comments meat weight)
Black 0.5 1.4 b 1.2 b 2.1 be 3.2 ab 1.6 fg Peppery, hot Pepper Caraway 1.0 1.8 b 1.6 b 2.1 be 2.6 b-d 3.9 C Spicy, dill
like flavor Cardamom 1.0 1.4 b I.lb 2.1 be 2.6 b-d 3.2 cd Spicy,
Mexican spice flavor
Chili 0.5 1.4 b 1.4 b 2.0 C 1.9 c-g 1.7 e-g Bland, pizza Powder spice like
flavor Cinnamon 0.1 1.1 b I.lb 1.7 C 2.9 a-c 1.6 fg Cinnamon
flavor, spicy Cloves 0.1 1.0 b 1.1 b 2.2 be 3.1 ab 0.4 fg Strong clove
88
flavor , smells like dentist ' s office
Coriander 0.5 1.4 b 1.3 b 2.0 C 2.2 b-f 3.4 C Spicy Cumin 0.5 1.6 b 1.7 b 1.9 C 2.5 b-e 4.4 be Spicy, taco
style spice, licorice flavor
Fennel 0.5 1.5 b 1.6 b 1.9 C 3.1 ab 5.5 b Licorice flavor, spicy
Ginger 0.5 1.4 b 1.4 b 2.6 a-c 1.6 d-g · 1.0 fg Weak spice flavor and odor
Nutmeg 0.5 1.3 b 1.2 b 1.6 C 2.5 b-e 3.1 c-e Spicy, nutmeg like flavor
RGM 0.1 1.1 b I.lb 1.9 C 3.1 ab 0.7 fg Spicy flavor Salt 0.1 2.7 a 2.6 ab 2.2 be 1.4 e-g 7.1 a Salty flavor Star Anise 0.5 1.2 b 1.0b 1.8 C 3.9 a 1.9 d-f Licorice
flavor, spicy Fresh Beef 0.0 1.5 b 1.5 b 3.2 a 1.1 fg 1.1 fg Steak-like,
oily, beefy 15 d RBC 0.0 3.3 a 3.4 a 2.0 C l.Og 7.2 a Rancid,
:eainty, stale
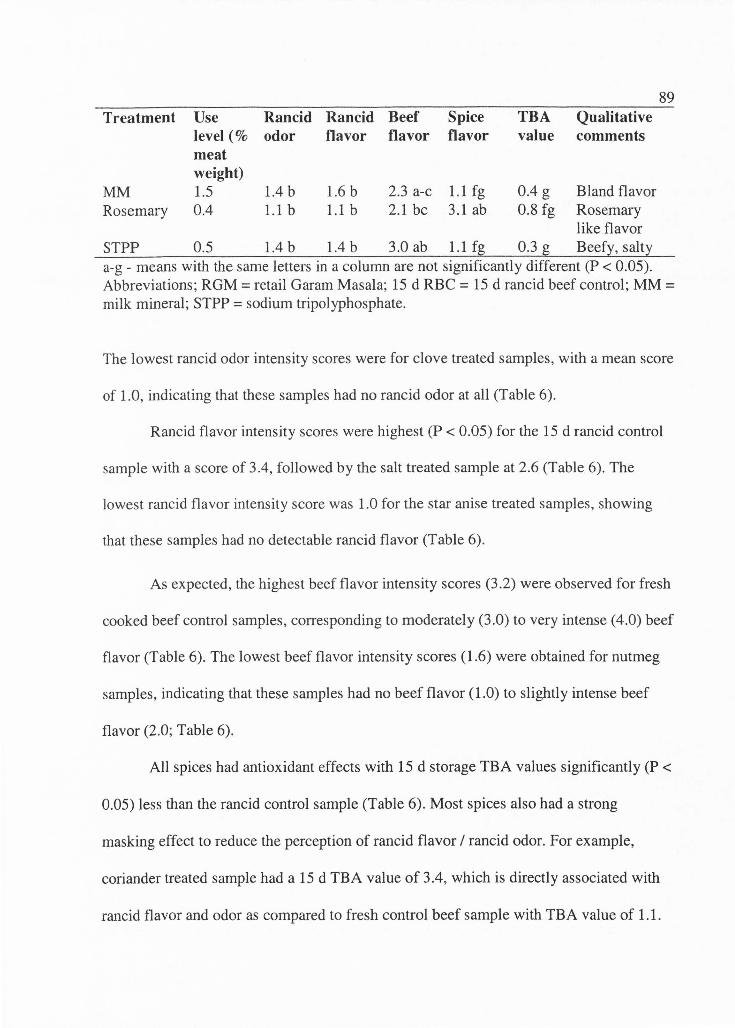
Treatment Use Rancid Rancid Beef
MM Rosemary
level ( % odor flavor flavor meat weight) 1.5 0.4
1.4 b 1.1 b
1.6 b 1.1 b
2.3 a-c 2.1 be
Spice flavor
1.1 fg 3.1 ab
TBA value
0.4 g
Qualitative comments
Bland flavor 0.8 fg Rosemary
89
like flavor STPP 0.5 1.4 b 1 .4 b 3.0 ab 1.1 fg 0.3 g Beefy, salty a-g - means with the same letters in a column are not significantly different (P < 0.05). Abbreviations; RGM = retail Garam Masala; 15 d RBC = 15 d rancid beef control; MM= milk mineral; STPP = sodium tripolyphosphate.
The lowest rancid odor intensity scores were for clove treated samples , with a mean score
of 1.0 , indicating that these samples had no rancid odor at all (Table 6).
Rancid flavor intensity scores were highest (P < 0.05) for the 15 d rancid control
sample with a score of 3.4, followed by the salt treated sample at 2.6 (Table 6). The
lowest rancid flavor intensity score was 1.0 for the star anise treated samples, showing
that these samples had no detectable rancid flavor (Table 6).
As expected, the highest beef flavor intensity scores (3.2) were observed for fresh
cooked beef control samples, corresponding to moderately (3.0) to very intense (4.0) beef
flavor (Table 6). The lowest beef flavor intensity scores (1.6) were obtained for nutmeg
samples, indicating that these samples had no beef flavor (1.0) to slightly intense beef
flavor (2.0; Table 6).
All spices had antioxidant effects with 15 d storage TBA values significantly (P <
0.05) less than the rancid control sample (Table 6). Most spices also had a strong
masking effect to reduce the perception of rancid flavor / rancid odor. For example,
coriander treated sample had a 15 d TBA value of 3.4, which is directly associated with
rancid flavor and odor as compared to fresh control beef sample with TBA value of 1. 1.
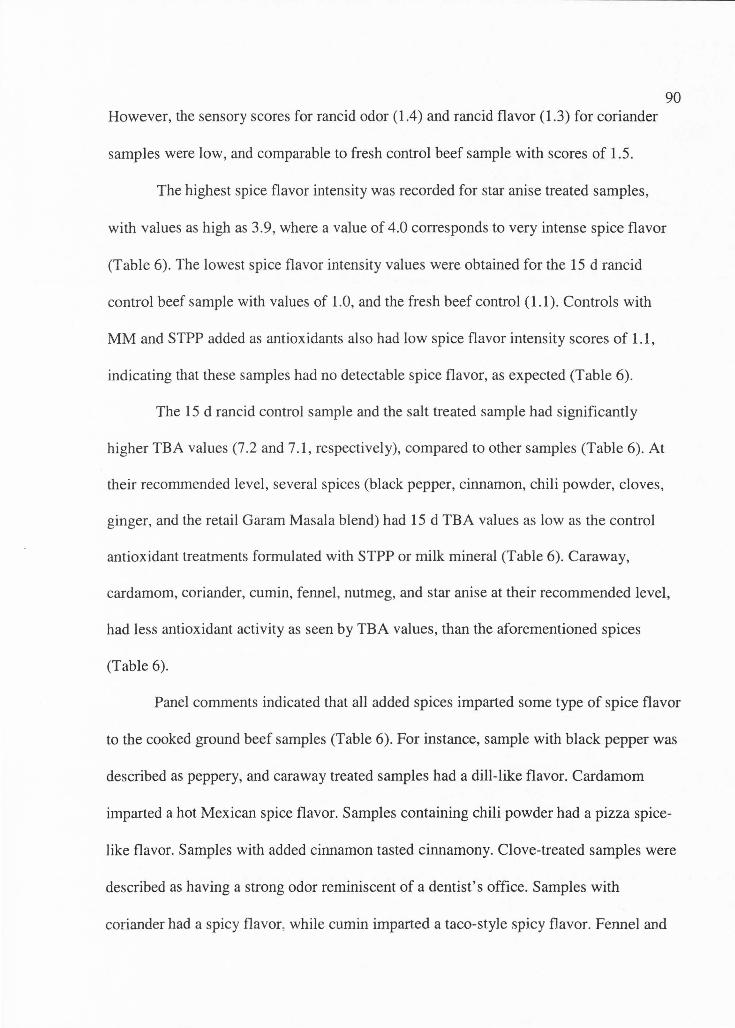
90 However, the sensory scores for rancid odor (1.4) and rancid flavor (1.3) for coriander
samples were low, and comparable to fresh control beef sample with scores of 1.5.
The highest spice flavor intensity was recorded for star anise treated samples ,
with values as high as 3.9, where a value of 4.0 corresponds to very intense spice flavor
(Table 6). The lowest spice flavor intensity values were obtained for the 15 d rancid
control beef sample with values of 1.0, and the fresh beef control (1.1). Controls with
MM and STPP added as antioxidants also had low spice flavor intensity scores of 1.1,
indicating that these samples had no detectable spice flavor, as expected (Table 6) .
The 15 d rancid control sample and the salt treated sample had significantly
higher TBA values (7 .2 and 7 .1, respectively), compared to other samples (Table 6). At
their recommended level, several spices (black pepper, cinnamon, chili powder, cloves,
ginger, and the retail Garam Masala blend) had 15 d TBA values as low as the control
antioxidant treatments formulated with STPP or milk mineral (Table 6). Caraway,
cardamom, coriander, cumin, fennel, nutmeg, and star anise at their recommended level,
had less antioxidant activity as seen by TBA values, than the aforementioned spices
(Table 6).
Panel comments indicated that all added spices imparted some type of spice flavor
to the cooked ground beef samples (Table 6). For instance, sample with black pepper was
described as peppery, and caraway treated samples had a dill-like flavor. Cardamom
imparted a hot Mexican spice flavor. Samples containing chili powder had a pizza spice
like flavor. Samples with added cinnamon tasted cinnamony. Clove-treated samples were
described as having a strong odor reminiscent of a dentist's office. Samples with
coriander had a spicy flavor , while cumin imparted a taco-style spicy flavor. Fennel and
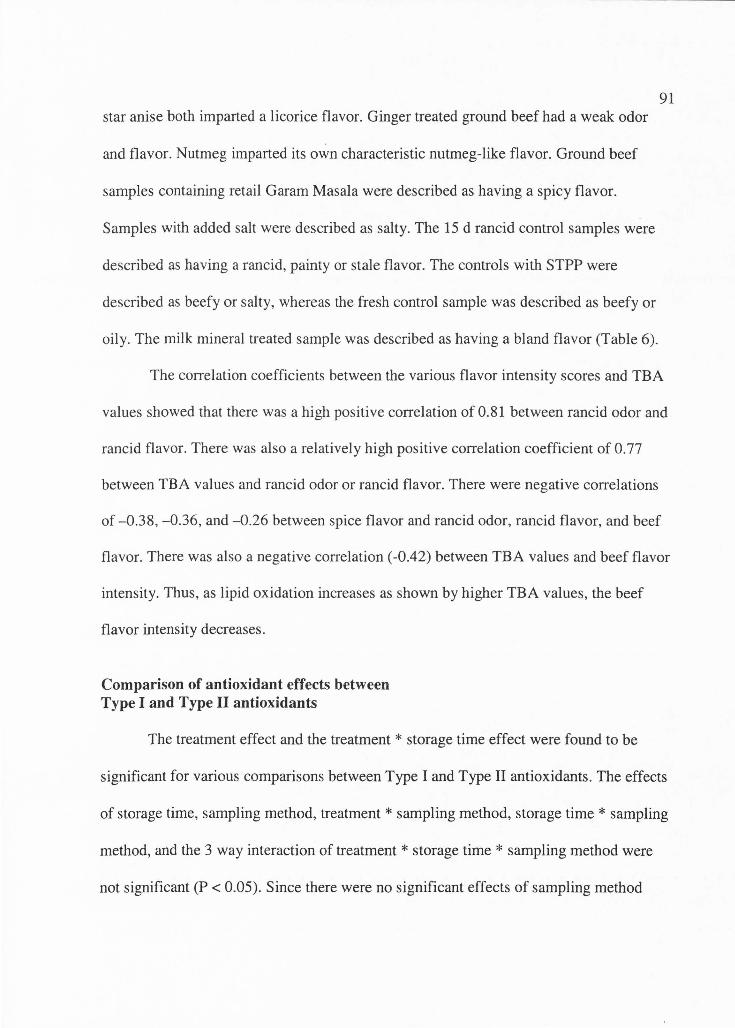
91 star anise both imparted a licorice flavor. Ginger treated ground beef had a weak odor
and flavor. Nutmeg imparted its own characteristic nutmeg-like flavor. Ground beef
samples containing retail Garam Masala were described as having a spicy flavor.
Samples with added salt were described as salty. The 15 d rancid control samples were
described as having a rancid, painty or stale flavor. The controls with STPP were
described as beefy or salty, whereas the fresh control sample was described as beefy or
oily. The milk mineral treated sample was described as having a bland flavor (Table 6).
The correlation coefficients between the various flavor intensity scores and TBA
values showed that there was a high positive correlation of 0.81 between rancid odor and
rancid flavor. There was also a relatively high positive correlation coefficient of 0.77
between TBA values and rancid odor or rancid flavor. There were negative correlations
of -0.38, -0.36, and -0.26 between spice flavor and rancid odor, rancid flavor, and beef
flavor. There was also a negative correlation (-0.42) between TBA values and beef flavor
intensity. Thus , as lipid oxidation increases as shown by higher TBA values, the beef
flavor intensity decreases.
Comparison of antioxidant effects between Type I and Type II antioxidants
The treatment effect and the treatment * storage time effect were found to be
significant for various comparisons between Type I and Type II antioxidants. The effects
of storage time, sampling method, treatment * sampling method, storage time * sampling
method, and the 3 way interaction of treatment * storage time * sampling method were
not significant (P < 0.05). Since there were no significant effects of sampling method
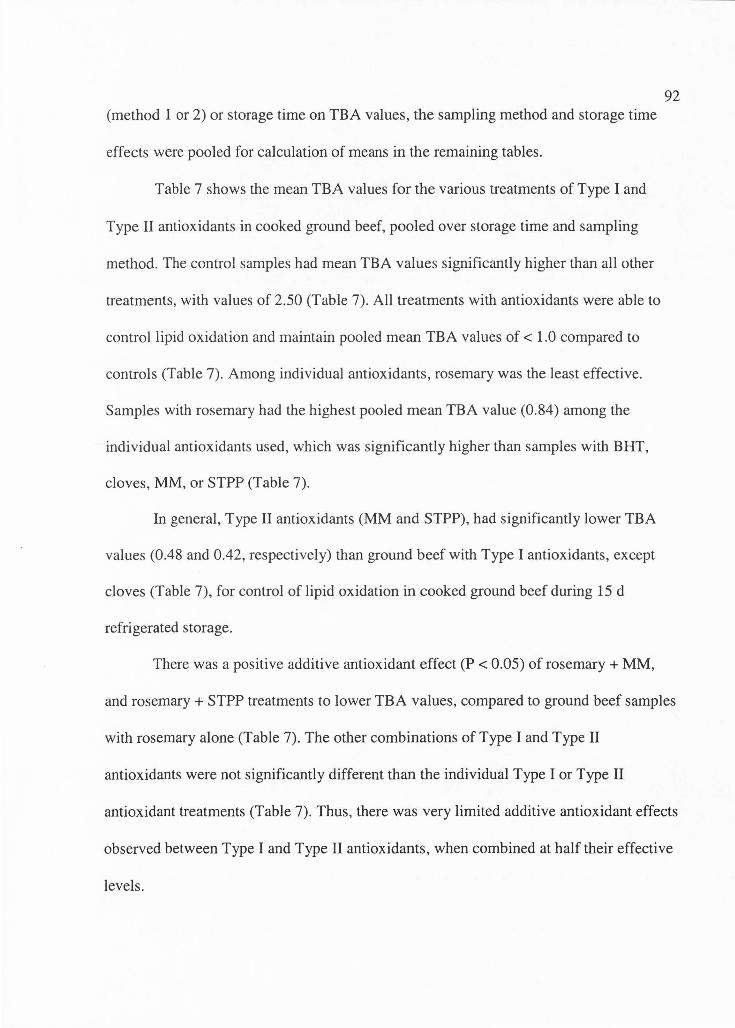
92 (method 1 or 2) or storage time on TBA values, the sampling method and storage time
effects were pooled for calculation of means in the remaining tables.
Table 7 shows the mean TBA values for the various treatments of Type I and
Type II antioxidants in cooked ground beef, pooled over storage time and sampling
method. The control samples had mean TBA values significantly higher than all other
treatments, with values of 2.50 (Table 7). All treatments with antioxidants were able to
control lipid oxidation and maintain pooled mean TBA values of< 1.0 compared to
controls (Table 7). Among individual antioxidants , rosemary was the least effective.
Samples with rosemary had the highest pooled mean TBA value (0.84) among the
individual antioxidants used, which was significantly higher than samples with BHT,
cloves, MM, or STPP (Table 7).
In general, Type II antioxidants (MM and STPP), had significantly lower TBA
values (0.48 and 0.42, respectively) than ground beef with Type I antioxidants, except
cloves (Table 7), for control of lipid oxidation in cooked ground beef during 15 d
refrigerated storage.
There was a positive additive antioxidant effect (P < 0.05) of rosemary + MM,
and rosemary + STPP treatments to lower TBA values, compared to ground beef samples
with rosemary alone (Table 7). The other combinations of Type I and Type II
antioxidants were not significantly different than the individual Type I or Type II
antioxidant treatments (Table 7). Thus, there was very limited additive antioxidant effects
observed between Type I and Type II antioxidants, when combined at half their effective
levels.
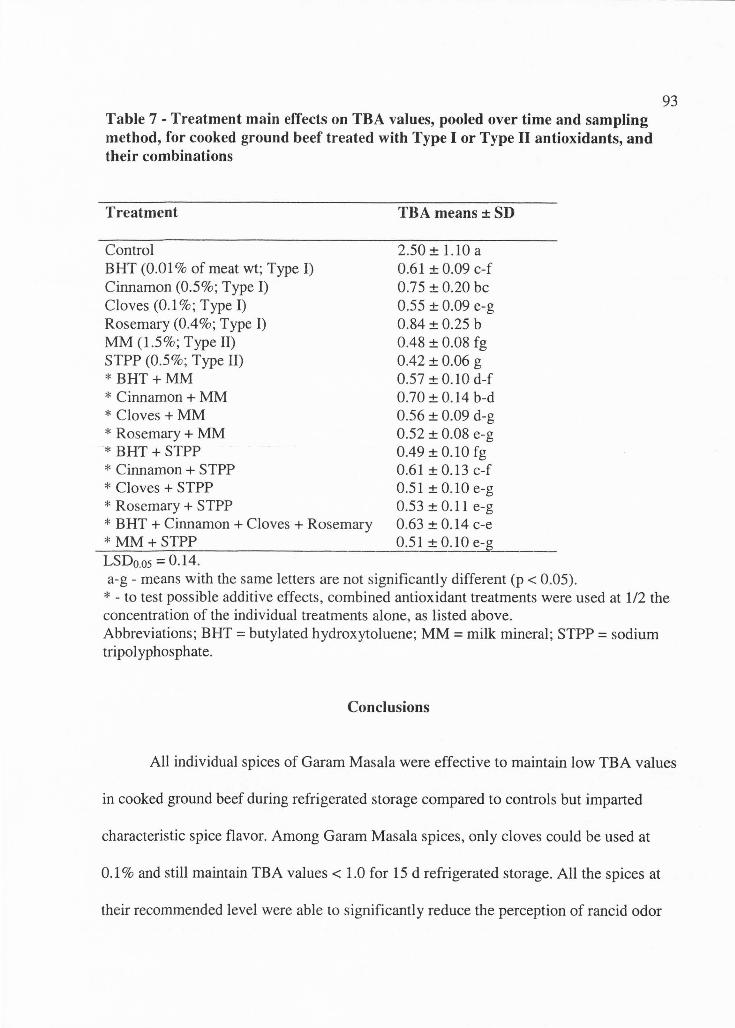
Table 7 - Treatment main effects on TBA values, pooled over time and sampling method, for cooked ground beef treated with Type I or Type II antioxidants, and their combinations
Treatment
Control BHT (0.01 % of meat wt; Type I) Cinnamon (0.5%; Type I) Cloves (0.1 %; Type I) Rosemary (0.4%; Type I) MM (1.5%; Type II) STPP (0.5% ; Type II) * BHT+MM * Cinnamon + MM * Cloves+ MM * Rosemary + MM * BHT + STPP * Cinnamon + STPP * Cloves + STPP * Rosemary + STPP * BHT + Cinnamon + Cloves + Rosemary * MM+STPP LSDo.os = 0.14.
TBA means ± SD
2.50 ± 1.10 a 0.61 ± 0.09 c-f 0.75 ± 0.20 be 0 .55 ± 0.09 e-g 0.84 ± 0.25 b 0.48 ± 0.08 fg 0.42 ± 0.06 g 0.57 ± 0 .10 d-f 0.70 ± 0.14 b-d 0 .56 ± 0.09 d-g 0 .52 ± 0.08 e-g 0.49 ± 0.10 fg 0.61 ± 0.13 c-f 0 .51 ± 0.10 e-g 0.53 ± 0.11 e-g 0 .63 ± 0.14 c-e 0 .51 ± 0 .10 e-g
a-g - means with the same letters are not significantly different (p < 0.05).
93
* - to test possible additive effects, combined antioxidant treatments were used at 1/2 the concentration of the individual treatments alone, as listed above. Abbreviations; BHT = butylated hydroxytoluene ; MM= milk mineral; STPP = sodium tripolyphosphate.
Conclusions
All individual spices of Garam Masala were effective to maintain low TBA values
in cooked ground beef during refrigerated storage compared to controls but imparted
characteristic spice flavor. Among Garam Masala spices, only cloves could be used at
0.1 % and still maintain TBA values< 1.0 for 15 d refrigerated storage. All the spices at
their recommended level were able to significantly reduce the perception of rancid odor
94 and rancid flavor, as compared to 15 d rancid control samples. When used individually
at their lowest effective levels, Type II antioxidants (MM and STPP) worked
significantly better than all Type I antioxidants except cloves, for control of lipid
oxidation in cooked ground beef during refrigerated storage. At lower use levels, there
was an additive effect of rosemary+ MM or STPP, for maintaining low TBA values
during refrigerated storage of cooked ground beef.
References
Abd-EI-Alim SSL, Lugasi A, Hovari J, Dworschak E. 1999. Culinary herbs inhibit lipid
oxidation in raw and cooked minced meat patties during storage. J Sci Food and
Agric 79(2):277-85.
Abraham JT, Balasundari S, Indra JG, Jeyachandran P. 1994. Influence of antioxidants
on the sensory quality and oxidative rancidity of frozen edible oyster. J Food Sci
and Technol , India, 31(2) : 168-70.
AI-Jalay B, Blank G, McConnell B, Al-Khayat M. 1987. Antioxidant activity of selected
spices used in fermented meat sausage. J Food Prot 50:25-7.
Badmaev VV, Majeed M, Prakash L. 2000. Piperine derived from black pepper increases
the plasma levels of coenzyme QlO following oral supplementation. J Nutr
Biochem 11(2):109-13.
Buege JA, Aust SD. 1978. Microsomal lipid peroxidation. Meth enzymol 52:302-4.
Cornforth DP, West EM. 2002. Evaluation of the antioxidant effects of dried milk
mineral in cooked beef , pork, and poultry. J Food Sci 67(2):615-618.
95 Dwivedi S, Vasavada MN, Cornforth DP. 2006. Evaluation of antioxidant effects and
sensory attributes of Chinese 5-spice ingredients in cooked ground beef. J Food
Sci 71:12-7.
Jayasingh P, Cornforth DP. 2003. Comparison of antioxidant effects of milk mineral,
butylated hydroxytoluene and sodium tripolyphosphate in raw and cooked ground
pork. Meat Sci 66:83-9.
Jimenez A, Romojaro F, Gomez JM, Llanos MR, Sevilla F. 2003. Antioxidant systems
and their relationship with the response of pepper fruits to storage at 20°C. J
Agric Food Chem 51(21) :6293-9.
Joseph J, George C, Perigreen PA. 1992. Effect of spices on improving the stability of
frozen stored fish mince . Fishery Tech 29(1):30 -4.
Jurdi-Haldeman D, MacNeil JH, Yared DM. 1987. Antioxidant activity of onion and
garlic juices in stored cooked ground lamb . J Food Prot 50:411-3.
Kikuzaki H, Kawai Y, Nakatani N. 2001. 1,1-Diphenyl-2-picrylhydrazyl radical
scavenging active compounds from greater cardamom (Amomum subulatum
Roxb.). J Nutr Sci Vitamin 47(2): 167-71.
Labelle Cuisine. Garam Masala composition . Available from: www.labellecuisine.com.
Lee KG, Shibamoto T. 2001. Antioxidant property of aroma extract isolated from clove
buds (Syzygium aromaticum (L.) Merr. et Perry). Food Chem 74(4):443-8.
Lee SK, Mei L, Decker E. 1997. Influence of Na Cl on antioxidant enzyme activity and
lipid oxidation in frozen ground pork. Meat Sci 46(4):349-355.
Lugasi A, Dworschak E, Hovari J . 1995. Characterization of scavenging activity of
natural polyphenols by chemiluminescence technique. Proceedings of European
96 Food Chemistry Conference, Vienna, Austria: Fed Euro Chem Soc VIII. p 639-
43).
Melo EDA , Mancini FJ, Guerra NB, Maciel GR. 2003. Antioxidant activity of coriander
extracts (Coriandrum sativum L.). Ciencia e Tecnologia de Alimentos, 23:195-9 .
Mendiratta SK, Anjaneyulu ASR, Lakshmanan V, Naveena BM, Bisht GS. 2000.
Tenderizing and antioxidant effect of ginger extract on sheep meat. J Food Sci
and Tech, India, 37(6):651-5.
Murcia MA, Egea I, Romojaro F, Parras P, Jimenez AM , Martinez-Tome M. 2004.
Antioxidant evaluation in dessert spices compared with common food additives . J
Agric Food Chem 52(7):1872-81.
Nakatani N. 2003. Biologically functional constituents of spices and herbs. J Japanese
Soc Nutr Food Sci 56(6):389-95 .
Oktay M, Gulcin I, Kufrevioglu OI. 2003. Determination of in vitro antioxidant activity
of fennel (Foeniculum vulgare) seed extracts. Lebens Wissen und Technol
36(2):263-71.
Pareja J, Viladomat F, Bastida J, Schmeda-Hischmann G, Burillo J, Codina C. 2004.
Bioguided isolation and identification of the nonvolatile antioxidant compounds
from fennel (Foeniculum vulgare Mill.) waste. J Agric Food Chem 52(7):1890-7.
Reddy AC, Lokesh BR. 1992. Studies on spice principles as antioxidants in the inhibition
of lipid peroxidation of rat liver microsomes. Mol Cell Biochem 111(1-2): 117-24.
Salaeh S, Muangwong S. 2001. Free radical scavenging activity of star anise (Illicium
verum). Songklanakarin J Sci Technol 23(4): 527-36.
97 Sinnhuber RO, Yu TC. 1958. 2-Thiobarbituric acid method for the measurement of
rancidity in fishery products. II. The quantitative determination of malonaldehyde.
Food Technol 12(1):9-12.
Subramanian S, Y ouling LX, Decker EA . 1996. Inhibition of protein and lipid oxidation
in beef heart surimi-like material by antioxidants and combinations of pH, NaCl,
and buffer type in the washing media . J Agric Food Chem 44(1): 119-25.
Surh Y. 1999. Molecular mechanisms of chemopreventive effects of selected dietary and
medicinal phenolic substances. Mutat Res 428(1-2):305-27 .
Tarladgis BG, Watts BM, Younathan MT , Dugan L. 1960. A distillation method for the
quantitative determination of malonaldehyde in rancid foods . J Amer Oil Chem
Soc 37:44-48 .
Tipsrisukond N, Fernando LN, Clarke AD. 1998. Antioxidant effect s of essential oil and
oleoresin of black pepper from supercritical carbon dioxide extractions in ground
pork. J Agric Food Chem 46(10):4329-33.
Wang TY, Ming TC, Deng CL, Shiu LG . 1997. Effects of procedure, spice, herb and
anka rice on the quality of Chinese marinated and spiced pork shank. J Chin Soc
Anim Sci 26(2):211-22 .
Ying RY, Ming TC, Deng CL. 1998. A study of antioxidative and antibacterial effects of
different spices in Chinese-style sausage . J Chin Soc Anim Sci 27(1): 117-28 .
Younathan.MT, Marjan ZM, Arshad FB. 1980. Oxidative rancidity in stored ground
turkey and beef. J Food Sci 45:274-75.
Zhang YM, Jia JG, Zhou ZQ, Yan RQ, Wang H. 1996. Development of preservatives for
fresh pork. Meat Hyg (8): 1-4.
98 CHAPTERS
EVALUATION OF ANTIOXIDANT EFFECTS OF RAISIN PASTE IN COOKED
GROUND BEEF, PORK AND CHICKEN
Abstract
The objective of this study was to evaluate the possible antioxidant activity of
raisin paste added to raw ground beef, pork or chicken before cooking to 163°C. Samples
were held at 2°C for up to 14 days. Thiobarbituric acid values were measured using a
distillation method, to avoid yellow color interference found in "wet" TBA methods.
Sample meat flavor intensity, rancid flavor intensity and raisin flavor intensity were
evaluated by a trained panel (n = 6). Addition of raisin paste lowered (P < 0.05) TBA
values and decreased panel scores for rancid flavor scores of all meat samples in a
concentration dependent responsive manner. Highest antioxidant effects were obtained
with a minimum of 1.5%, 2.0%, or 2.0% raisin paste in cooked ground beef, pork or
chicken, respectively. There was a high correlation (0.93, 0.94, or 0.94) between TBA
values and sensory rancid flavor scores in beef, pork and chicken samples, respectively.
Addition of a reducing sugar (glucose) was nearly as effective as raisins for
maintenance of low TBA values and rancid flavor scores, probably due to antioxidant
effects of Maillard browning products. There was no detectable raisin flavor in cooked
ground beef samples with added raisins.
Reprinted from Vasavada MN, Cornforth DP. 2006 . Evaluation of antioxidant effects of raisin paste in cooked ground beef, pork, and chicken. J Food Sci 71(4):
99 However, all meats with added glucose had a higher raisin flavor intensity
score than controls, indicating that panelists associated sweetness with raisin flavor.
Maillard browning (sample darkening) was evident after cooking of ground chicken with
either raisins or glucose.
Introduction
Lipid oxidation is a major cause of deterioration in the quality of meat and meat
products (Asghar and others 1988; Ladikos and Lougovois 1990). Lipid oxidation leads
to production of malonaldehyde, a mutagen and/or carcinogen (Shamberger and others
1974). Lipid oxidation is faster in heated meat than in raw meat tissues (Tichivangana
and Morrissey 1985; Tims and Watts 1958). The rate and degree of oxidative degradation
has been directly related to the degree of unsaturation of the lipids present (lgene and
Pearson 1979; Tichivangana and Morrissey 1985) and degree of oxygen exposure
(Jayasingh and others 2002; O'Grady and others 2000) . Oxidation of unsaturated fatty
acids in cooked meats during storage and reheating, results in stale or rancid flavors
known as warmed-over flavor (Sato and Hegarty 1971).
The greater propensity of warmed-over flavor (WOF) in cooked and comminuted
products is due to the release of non-heme iron during cooking and grinding (lgene and
others 1979). Unsaturated lipids , especially those of the membrane phospholipids
fraction, are the compounds undergoing oxidation (lgene and Pearson 1979; Y ounathan
and Watts 1960).
The thiobarbituric acid (TBA) test is the most frequently used test to assess lipid
oxidation in meat. Sensory panel ists describe the extent of lipid oxidation in terms of
100 rancid odor or taste. Tarladgis and others (1960) found that TBA numbers (mg TBA
reactive substances I Kg tissue) were highly correlated with trained sensory panel scores
for rancid odor in ground pork. The TBA number at which a rancid odor was first
perceived was between 0.5 and 1.0. This "threshold" has served as a guide for
interpreting TBA test results (Tarladgis and others 1960).
Raisins are recognized as a good source of dietary antioxidants. According to the
USDA, raisins are second only to prunes in the ability to prevent oxidation as measured
by the oxygen radical absorbance capacity (ORAC) test. Grapes and raisins have been
shown to contain various antioxidant compounds , including bioflavanoids (Shalashvili
and others 2002), proanthocyanidins (Foster 1997; Murga and others 2000) , catechin
monomers (Katalinic 1999), procyanidin dimers (Yamakoshi and others 2002) and other
polyphenolic antioxidants (Meyer and others 1997; Frankel 1999).
There has been one previous study evaluating raisins as antioxidants in meat
systems. Bower and others (2003) reported that beef jerky formulated to contain 15%
(w/w) raisin puree produced conditions inhibitory to pathogenic bacteria by decreasing
the pH to 5.4 and water activity to 0.64. Antioxidant activity of the beef jerky was
increased by> 600%.
Although raisins contain antioxidant compounds, their possible antioxidant
effectiveness in cooked ground meat systems has not been previously studied. Thus, the
objective of this study was to evaluate the possible antioxidant effects of raisin paste on
TBA values and trained panel rancidity scores in cooked ground beef, pork and chicken.
101 Materials and Methods
Sample preparation
Ground beef (15% fat), lean ground pork shoulder (20% fat), chicken breasts and
whole dark raisins were purchased from local supermarkets. Raisin paste was prepared by
blending 60 g raisin with 20 ml distilled water for 1 min in an Osterizer blender
(Sunbeam Products, Inc. Boca Raton, Fla., U.S.A.). The raisin paste was manually mixed
with ground beef (400 g) at 0.5%, 1.0%, 1.5%, and 2.0% of meat weight respectively.
The raisin paste was manually mixed with ground pork (400 g) or ground chicken (400 g)
at 1.0%, 2.0%, 3.0%, and 4.0% of meat weight, respectively. Control samples containing
no raisins were also prepared. Total sugar content of retail seedless raisins was 59.2% by
weight, with a standard deviation of 7.9 (USDA 2006). At 99.9% confidence level, the
total sugar content was 48.2 to 70.2% (Hayter 1996). Thus, for later calculations of raisin
sugar content, the highest value (70.2%) was used. Glucose and fructose are the two
predominant sugars found in raisins (Pilandro and Wrolstad 1992). D-glucose undergoes
the browning reaction faster than does D-fructose (BeMiller and Whistler 1996). For all 3
meats, a comparison treatment was prepared consisting of beef, pork, or chicken with
glucose added at a level approximately equivalent to the sugar content of the highest level
of added raisins (2.0% raisins in beef; 4.0% raisins in pork or chicken). Thus, the beef+
glucose treatments were formulated to contain 1.45% glucose, and the pork or chicken+
glucose treatments contained 2.9% glucose. Based on preliminary experiments, 2.0%
raisins were sufficient to obtain antioxidant effects in cooked ground beef. However,
higher levels (4.0% added raisins) were evaluated in cooked ground pork or chicken,
102 because these meats have higher poly-unsaturated fatty acid content (Paul and
Southgate 1978), and thus might require higher levels of raisins for antioxidant effects.
The ground meat samples were thoroughly cooked to well done state on a grill at
a temperature setting of 163°C. A small amount of water was added during cooking to
prevent sticking and charring. After cooking, the ground meats were divided into 4 equal
portions, placed in resealable plastic bags and cooled for 10 min at room temperature.
Bags were then sealed and stored at 2°C for 1, 4, 7, or 14 d.
TBA test
Thiobarbituric acid reactive substances (TBARS) values were measured on
duplicate 10 g samples at each storage period (1, 4, 7, or 14 d) using a distillation method
(Tarladgis and others 1960; Koniecko 1979). Samples (10 g) were blended in a mixer
with 47 .5 ml distilled water and then the blender rinsed with 50 ml of water. Then, 2.5 ml
of HCl ( 1 :2 solution) was added, and the mixture was distilled through a condensing
assembly to collect 50 ml of distillate. Five ml of the distillate was mixed with 5 ml TBA
solution, boiled for 35 min, and duplicate absorbance readings were taken at 538 nm in a
UV spectrophotometer. The absorbance values were multiplied by a factor of 7 .8 to
obtain TBA values (Koniecko 1979).
Sensory evaluation
A trained panel (n = 6) evaluated cooked samples at 1, 4, 7, and 14 d of
refrigerated storage. Panelists were selected based on their sensitivity and reproducibility
for detection of rancid samples (TBA Value > 1.5) in preliminary tests. All panelists had
previous sensory panel experience with cooked beef products. The panelists were trained
103 in two sessions. In the first session, panelists were familiarized with the 5-point
intensity scale and its usage. Panelists were also familiarized with cooked beef, pork or
chicken flavors (fresh and rancid samples) and samples with added raisins at low (0.5%)
and high ( 4%) raisin levels. Group discussions were conducted regarding sample
attributes. In the second session, panelists again evaluated the same samples. The most
consistent panelists (n = 6) were included in the final sensory panel.
At each panel session, panelists were served a total of 6 samples (6 g per sample),
including the 4 raisin samples, the control without raisins, and the glucose treated sample.
Samples were coded and microwave reheated for 25 s to attain a temperature of 80°C to
85°C immediately before serving. Samples were evaluated in individual booths. The
serving order was randomized to avoid positional bias.
The panelists evaluated cooked samples for cooked beef, pork or chicken flavor
intensity, rancid flavor intensity and raisin flavor intensity on a scale of 1 to 5; where 1 =
no detectable flavor, 2 = slightly intense flavor, 3 = moderately intense flavor, 4 = very
intense flavor, and 5 = extremely intense flavor, respectively. Before evaluating the next
sample, ballot instructions specified that the previous sample be expectorated into cups
provided for that purpose. Panelists were instructed to rinse their mouth with tap water.
Unsalted crackers were also provided to cleanse the palate.
Hunter color measurements
The L* (lightness), a* (redness) and b* (yellowness) values were measured for
cooked ground chicken samples after 1 d of storage, using a Hunter lab Miniscan portable
colorimeter (Reston, Va., U.S.A.) standardized using a white and black standard tile. In
104 preliminary tests, there was very little visual darkening of ground beef or pork after
cooking, and therefore Hunter color measurements were not done on cooked ground beef
or pork samples.
Experimental design
For beef, pork and chicken the TBA values and the sensory evaluation
experiments were done in 3 separate replicates . The experiment was a completely
randomized block design with 6 treatments (control, 1.45% glucose , 0.5%, 1.0%, 1.5%,
or 2.0% raisin in ground beef; control, 2.9% glucose , 1.0%, 2.0%, 3.0%, or 4.0% raisin in
ground pork and chicken), 4 storage times (1, 4, 7, and 14 d at 2°C) and 3 replicates of
the whole experiment. Treatment means were calculated by analysis of variance
(ANOVA) using StatisticaTM software (Statsoft Inc, Tulsa, Okla., U.S .A.). The error
term was calculated to account for difference s among blocks (replicates). Significant
differences among means were determined by calculation of Fisher's least significance
difference (LSD) values. Significance was accepted at P < 0.05.
Results
The main effects of raisin level (0 to 4%), storage time (1 to 14 d) and their
interaction significantly (P < 0.05) affected TBA values of cooked ground beef, pork and
chicken during refrigerated storage. Raisin level also significantly (P < 0.05) affected
beef flavor intensity, rancid flavor intensity and raisin flavor intensity of cooked ground
beef, pork and chicken. The main effect of storage time (1, 4, 7, or 14 d) significantly (P
< 0.05) affected cooked ground beef flavor and rancid flavor intensity in cooked ground
105 beef. However, storage time had no significant (P < 0.05) effect on pork or chicken
flavor intensity or rancid flavor intensity . The interaction of raisin level and storage time
significantly (P < 0.05) affected rancid flavor intensity of cooked ground beef but not in
cooked ground pork or chicken . The raisin level and storage time interaction did not
affect beef flavor , pork flavor, chicken flavor, or raisin flavor in any of the meats.
Thiobarbituric acid value
TBA values of control cooked ground beef samples reached as high as 6.81 after
14 d storage at 2°C (Table 8). Addition of 0.5%, 1.0%, 1.5%, or 2.0% raisins
significantly decreased TBA values to 3.34, 2.05, 1.48, and 0.98, respectively, after 14 d
refrigerated storage (Table 8). Also after 14-d refrigerated storage, TBA values of cooked
ground beef with 1.5% or 2.0% raisins were significantly lower than beef samples with
0.5% or 1.0% raisin (Table 8). In cooked ground beef, 1.45% glucose ( equivalent to
glucose content of 2.0% raisin level) was as effective as 1.5% or 2.0% raisin level for
maintaining low TBA values (1.52) after 14 d refrigerated storage (Table 8).
In cooked ground pork samples, TBA values were also much higher in control
samples than samples with added raisins or glucose, with values up to 15.43 after 14 d
refrigerated storage (Table 9). TBA values were 7.09, 3.49, 3.01, and 2.30 for cooked
ground pork with 1.0%, 2.0%, 3.0%, or 4.0% added raisins, respectively, after 14 d
storage (Table 9). TBA values after 14 d storage for cooked ground pork with 2.0% to
4.0% added raisins were significantly lower than 1.0% level of added raisins (Table 9).
Samples with 2.9% added glucose had TBA values (4.43) similar to samples with 2.0%
to 4.0% added raisins after 14 d refrigerated storage (Table 9).
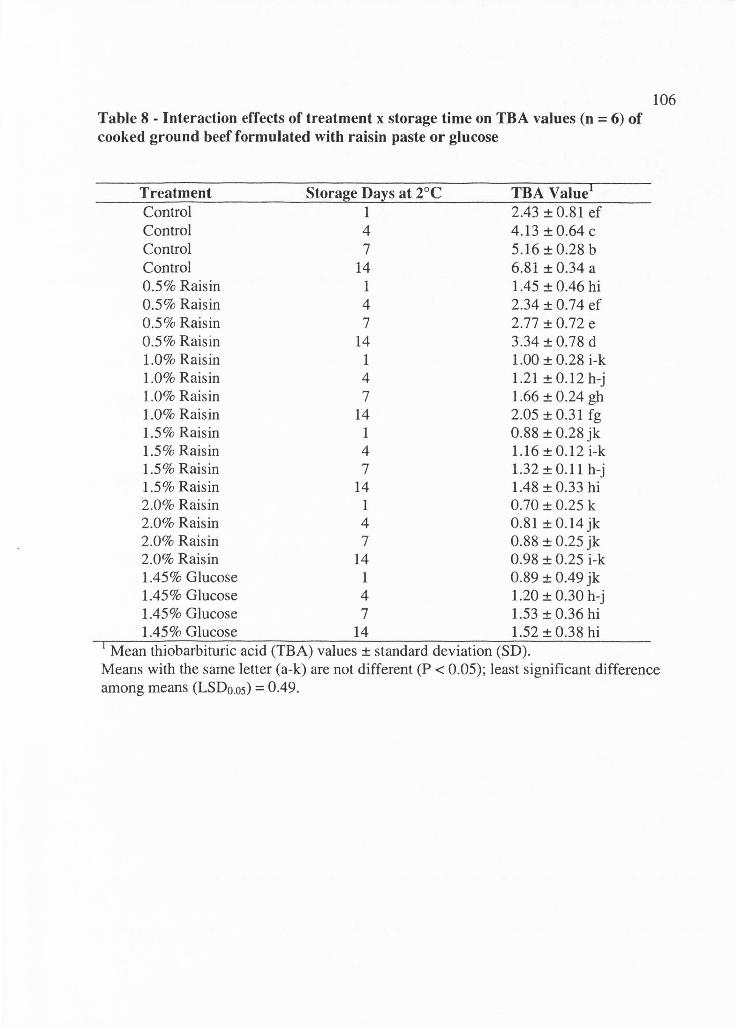
Table 8 - Interaction effects of treatment x storage time on TBA values (n = 6) of cooked ground beef formulated with raisin paste or glucose
Treatment Storage Days at 2°C TBA Value1
Control 1 2.43 ± 0.81 ef Control 4 4.13 ± 0.64 C
Control 7 5.16 ± 0.28 b Control 14 6.81 ± 0.34 a 0.5% Raisin 1 1 .45 ± 0.46 hi 0.5% Raisin 4 2.34 ± 0.74 ef 0.5% Raisin 7 2.77 ± 0.72 e 0.5% Raisin 14 3.34 ± 0.78 d 1.0% Raisin 1 1.00 ± 0.28 i-k 1.0% Raisin 4 1.21 ± 0.12 h-j 1.0% Raisin 7 1.66 ± 0.24 gh 1.0% Raisin 14 2.05 ± 0.31 fg 1.5% Raisin 1 0.88 ± 0.28 jk l.5%Raisin 4 l.16±0.12i-k 1.5% Raisin 7 1.32 ± 0.11 h-j 1.5% Raisin 14 1.48 ± 0.33 hi 2.0% Raisin 1 0.70 ± 0.25 k 2.0% Raisin 4 0.81 ± 0.14 jk 2.0% Raisin 7 0.88 ± 0.25 jk 2.0% Raisin 14 0.98 ± 0.25 i-k 1.45% Glucose 1 0.89 ± 0.49 jk 1.45% Glucose 4 1.20 ± 0.30 h-j 1.45% Glucose 7 1.53 ± 0.36 hi 1.45% Glucose 14 1.52 ± 0.38 hi
1 Mean thiobarbituric acid (TBA) values ± standard deviation (SD).
106
Means with the same letter (a-k) are not different (P < 0.05); least significant difference among means (LSDo.os) = 0.49.
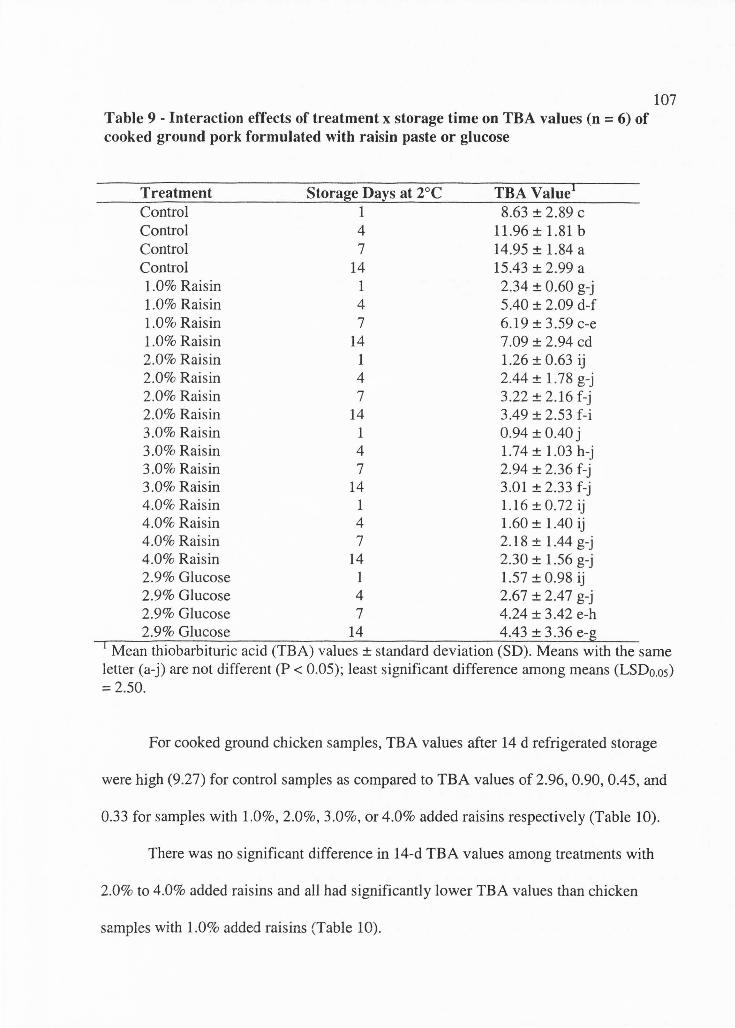
Table 9 - Interaction effects of treatment x storage time on TBA values (n = 6) of cooked ground pork formulated with raisin paste or glucose
Treatment Storage Days at 2°C TBA Value 1
Control 1 8.63 ± 2.89 c Control 4 11.96 ± 1.81 b Control 7 14.95 ± 1.84 a Control 14 15.43 ± 2.99 a 1.0% Raisin 1 2.34 ± 0.60 g-j 1.0% Raisin 4 5.40 ± 2.09 d-f 1.0% Raisin 7 6.19 ± 3.59 c-e 1.0% Raisin 14 7.09 ± 2.94 cd 2.0% Raisin 1 1.26 ± 0.63 ij 2.0% Raisin 4 2.44 ± 1.78 g-j 2.0% Raisin 7 3.22 ± 2.16 f-j 2.0% Raisin 14 3.49 ± 2.53 f-i 3.0% Raisin 1 0.94 ± 0.40 j 3.0% Raisin 4 1.74 ± 1.03 h-j 3.0% Raisin 7 2.94 ± 2.36 f-j 3.0% Raisin 14 3.01 ± 2.33 f-j 4.0% Raisin 1 1.16 ± 0.72 ij 4.0% Raisin 4 1.60 ± 1 .40 ij 4.0% Raisin 7 2.18 ± 1.44 g-j 4.0% Raisin 14 2.30 ± 1.56 g-j 2.9% Glucose 1 1.57 ± 0.98 ij 2.9% Glucose 4 2.67 ± 2.47 g-j 2.9% Glucose 7 4.24 ± 3.42 e-h
107
2.9% Glucose 14 4.43 ± 3.36 e-g 1 Mean thiobarbituric acid (TBA) values ± standard deviation (SD). Means with the same letter (a-j) are not different (P < 0.05); least significant difference among means (LSDo.os) = 2.50.
For cooked ground chicken samples, TBA values after 14 d refrigerated storage
were high (9.27) for control samples as compared to TBA values of 2.96, 0.90, 0.45, and
0.33 for samples with 1.0%, 2.0%, 3.0%, or 4.0% added raisins respectively (Table 10).
There was no significant difference in 14-d TBA values among treatments with
2.0% to 4.0% added raisins and all had significantly lower TBA values than chicken
samples with 1.0% added raisins (Table 10).
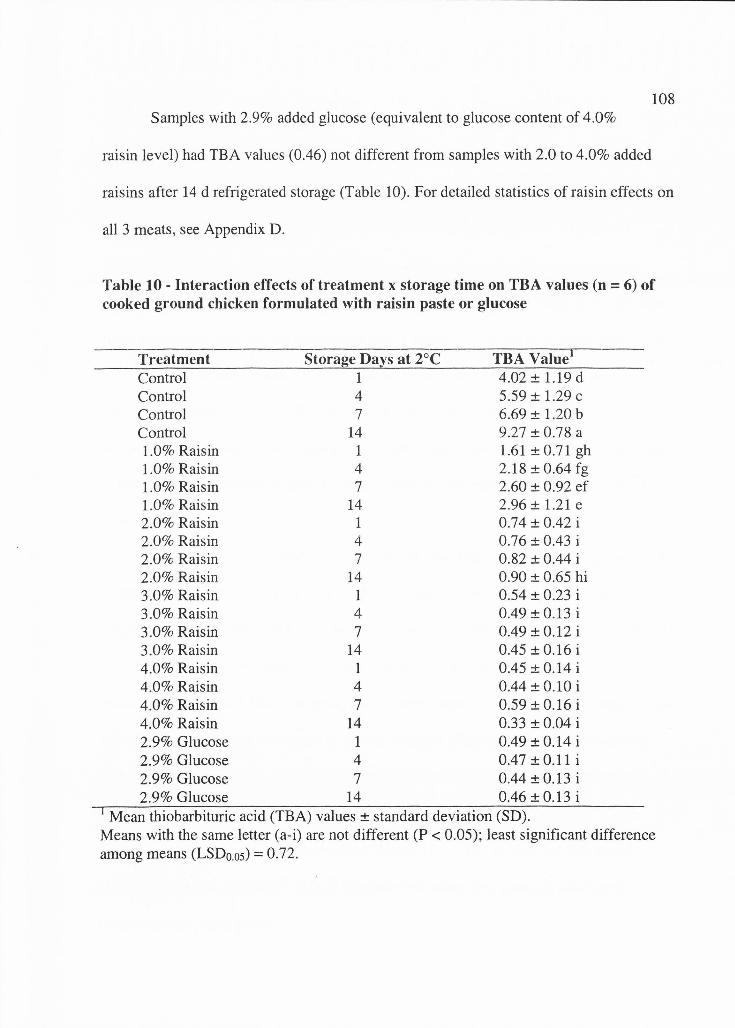
108 Samples with 2.9% added glucose (equivalent to glucose content of 4.0%
raisin level) had TBA values (0.46) not different from samples with 2.0 to 4.0% added
raisins after 14 d refrigerated storage (Table 10). For detailed statistics of raisin effects on
all 3 meats, see Appendix D.
Table 10 - Interaction effects of treatment x storage time on TBA values (n = 6) of cooked ground chicken formulated with raisin paste or glucose
Treatment Control Control Control
Storage Days at 2°C 1 4 7
TBA Value 1
4.02 ± 1.19 d 5.59 ± 1.29 C
6.69 ± 1.20 b Control 14 9.27 ± 0.78 a 1.0% Raisin 1 1.61 ± 0.71 gh 1.0% Raisin 4 2.18 ± 0.64 fg 1.0% Raisin 7 2.60 ± 0.92 ef 1.0% Raisin 14 2.96 ± 1.21 e 2.0% Raisin 1 0.74 ± 0.42 i 2.0% Raisin 4 0.76 ± 0.43 i 2.0% Raisin 7 0.82 ± 0.44 i 2.0% Raisin 14 0.90 ± 0.65 hi 3.0% Raisin 1 0.54 ± 0.23 i 3.0% Raisin 4 0.49 ± 0.13 i 3.0% Raisin 7 0.49 ± 0.12 i 3.0% Raisin 14 0.45 ± 0.16 i 4.0% Raisin 1 0.45 ± 0.14 i 4 .0% Raisin 4 0.44 ± 0.10 i 4.0% Raisin 7 0.59 ± 0.16 i 4.0% Raisin 14 0.33 ± 0.04 i 2.9% Glucose 1 0.49 ± 0.14 i 2.9% Glucose 4 0.47 ± 0.11 i 2.9% Glucose 7 0.44 ± 0.13 i 2.9% Glucose 14 0.46 ± 0.13 i
1 Mean thiobarbituric acid (TBA) values ± standard deviation (SD). Means with the same letter (a-i) are not different (P < 0.05); least significant difference among means (LSDo.os) = 0.72.
109 Sensory evaluation
Cooked ground beef without added raisins (control) had pooled mean rancid
flavor intensity score of 3.40, where, 3.0 = moderately intense and 4.0 = very intense
rancid flavor (Figure 4). Samples with 1.5% or 2.0% added raisins or 1.45% added
glucose had significantly lower (P < 0.05) rancid flavor intensity scores than control
samples or samples with 0.5% added raisins (Figure 4 ). Beef flavor intensity scores were
lowest in control samples and were significantly higher (P < 0.05) in samples with 1.0%
to 2.0% added raisins (Figure 4 ). There was no detectable raisin flavor in cooked ground
beef samples with 0.5% to 1.5% added raisins. However, ground beef with 2.0% raisins
or 1.45% added glucose had a significantly higher raisin flavor intensity score compared
to samples without raisins (Figure 4). Thus, panelists apparently associated sweetness
with raisin flavor.
The cooked ground pork sensory scores showed that, as with cooked ground beef,
samples with added raisins or glucose had lower rancid flavor scores than controls
(Figure 5). Samples with 2.0% to 4.0% added raisins or 2.9% added glucose had lower (P
< 0.05) rancid flavor intensity scores than control samples or samples with 1.0% added
raisins (Figure 5). Pork flavor intensity scores were higher (P < 0.05) for all samples with
added raisins or glucose, compared to control samples (Figure 5). Cooked ground pork
samples with 4.0% added raisins had higher raisin flavor scores than all other samples,
with a mean score of 2.29, where a score of 2.0 was associated with a slightly intense
raisin flavor. Raisin flavor scores were also higher (P < 0.05) in samples with added
glucose, compared to controls (Figure 5), again indicating that panelists associated
sweetness with raisin flavor.
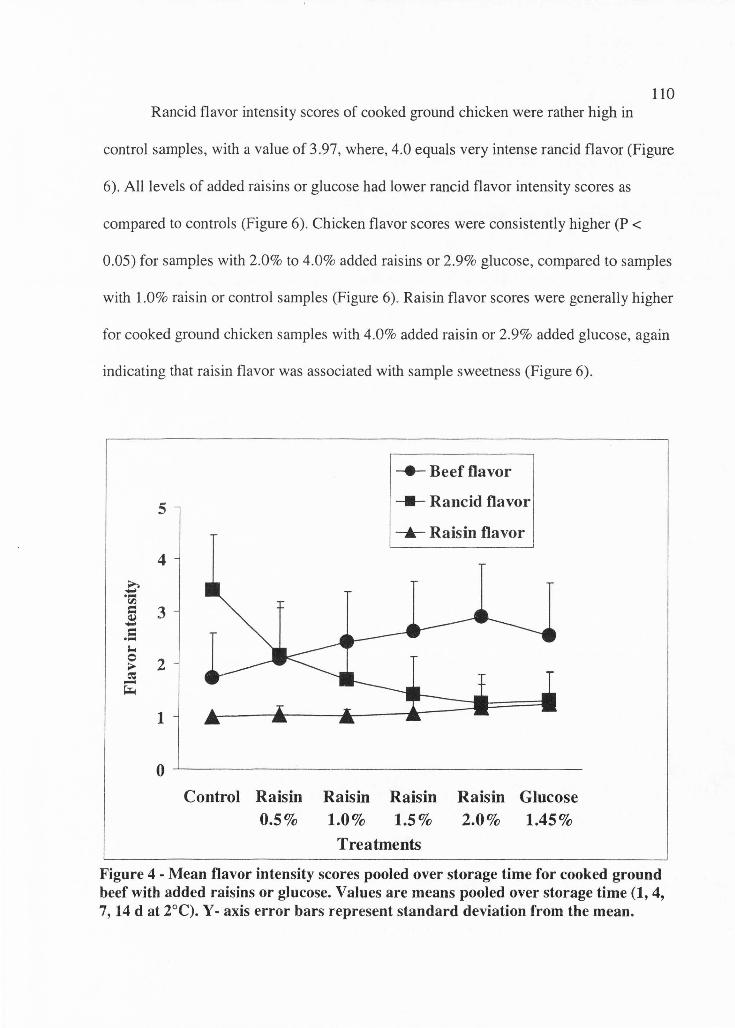
110 Rancid flavor intensity scores of cooked ground chicken were rather high in
control samples, with a value of 3 .97, where, 4.0 equals very intense rancid flavor (Figure
6). All levels of added raisins or glucose had lower rancid flavor intensity scores as
compared to controls (Figure 6). Chicken flavor scores were consistently higher (P <
0.05) for samples with 2.0% to 4.0% added raisins or 2.9% glucose, compared to samples
with 1.0% raisin or control samples (Figure 6). Raisin flavor scores were generally higher
for cooked ground chicken samples with 4.0% added raisin or 2.9% added glucose, again
indicating that raisin flavor was associated with sample sweetness (Figure 6).
.... -·-r;r.i
5 -= ·-I,,. 0 ;;. e,:: -~
-e- Beef flavor
5 -a- Rancid flavor
--.- Raisin flavor
4
3
2
1
0 ~--- - ------------
Control Raisin 0.5%
Raisin Raisin 1.0% 1.5%
Treatments
Raisin Glucose 2.0% 1.45%
Figure 4 - Mean flavor intensity scores pooled over storage time for cooked ground beef with added raisins or glucose. Values are means pooled over storage time (1, 4, 7, 14 d at 2°C). Y-axis error bars represent standard deviation from the mean.
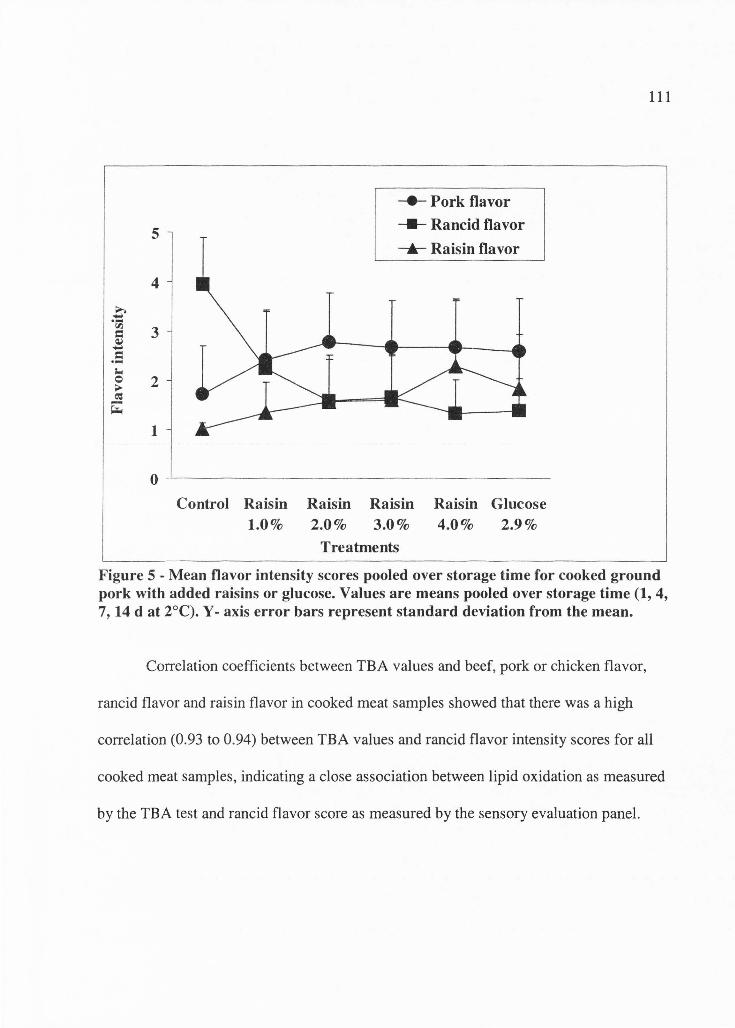
111
--e--Pork flavor
5 --- Rancid flavor
---.- Raisin flavor
4
.G> .... <IJ
B 3 C ....
2
1
o ~---------------------ControI Raisin Raisin Raisin Raisin Glucose
1.0% 2.0% 3.0% 4.0% 2.9%
Treatments
Figure 5 - Mean flavor intensity scores pooled over storage time for cooked ground pork with added raisins or glucose. Values are means pooled over storage time (1, 4, 7, 14 d at 2°C). Y- axis error bars represent standard deviation from the mean.
Correlation coefficient s between TBA values and beef, pork or chicken flavor,
rancid flavor and raisin flavor in cooked meat samples showed that there was a high
correlation (0.93 to 0.94) between TBA values and rancid flavor intensity scores for all
cooked meat samples, indicating a close association between lipid oxidation as measured
by the TBA test and rancid flavor score as measured by the sensory evaluation panel.
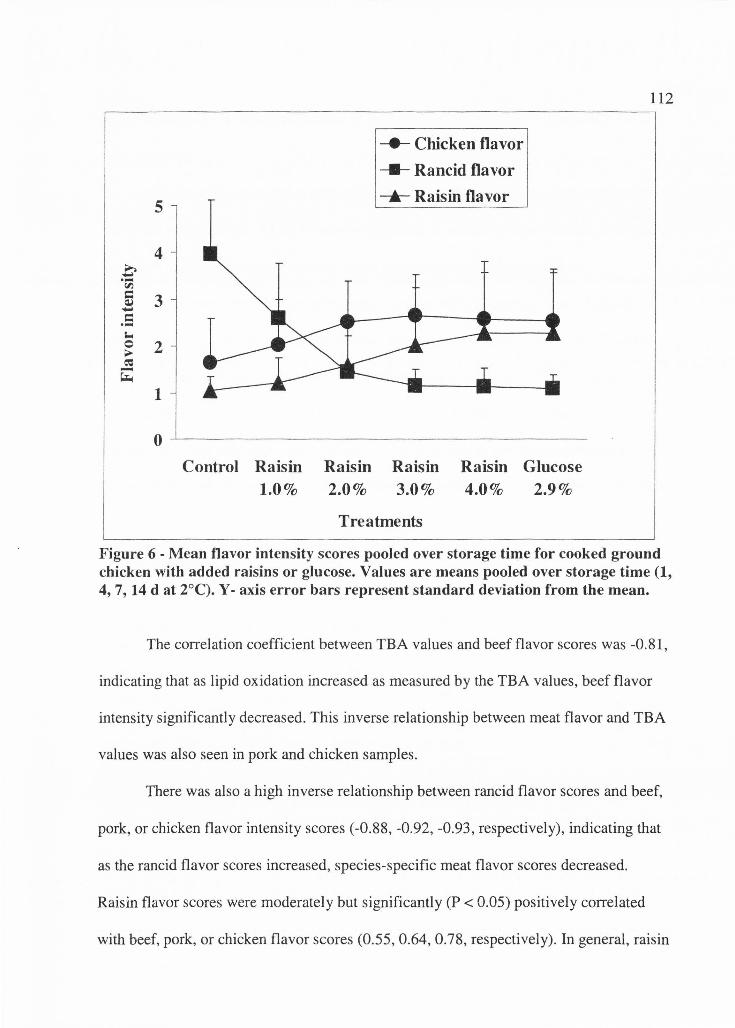
5
4 ..... .... ... tll C 3 ~ .... C ... s.. 0 2 ;;.. ~ -~
1
0
Control Raisin 1.0%
---e-Chicken flavor
-a- Rancid flavor
_._ Raisin flavor
Raisin Raisin Raisin Glucose 2.0% 3.0% 4.0% 2.9%
Treatments
112
Figure 6 - Mean flavor intensity scores pooled over storage time for cooked ground chicken with added raisins or glucose. Values are means pooled over storage time (1, 4, 7, 14 d at 2°C). Y-axis error bars represent standard deviation from the mean.
The correlation coefficient between TBA values and beef flavor scores was -0.81,
indicating that as lipid oxidation increased as measured by the TBA values, beef flavor
intensity significantly decreased. This inverse relationship between meat flavor and TBA
values was also seen in pork and chicken samples.
There was also a high inverse relationship between rancid flavor scores and beef,
pork, or chicken flavor intensity scores (-0.88, -0.92, -0.93, respectively), indicating that
as the rancid flavor scores increased, species-specific meat flavor scores decreased.
Raisin flavor scores were moderately but significantly (P < 0.05) positively correlated
with beef, pork, or chicken flavor scores (0.55, 0.64, 0.78, respectively). In general, raisin
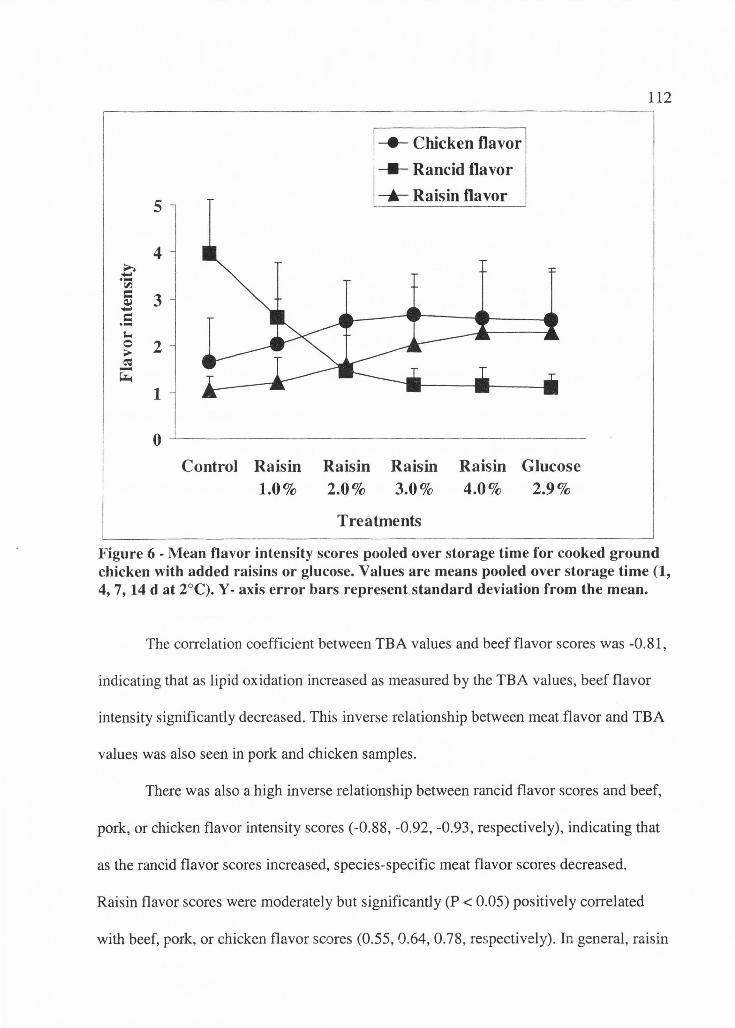
,c, ·-~ C Q) .... C ·-r.. 0 .... ~ -~
5
4
3
2
1
0
Control Raisin 1.0%
112
----- Chicken flavor
-a- Rancid flavor
-A- Raisin flavor
Raisin Raisin Raisin Glucose 2.0% 3.0% 4.0% 2.9%
Treatments
Figure 6 - Mean flavor intensity scores pooled over storage time for cooked ground chicken with added raisins or glucose. Values are means pooled over storage time (1, 4, 7, 14 d at 2°C). Y-axis error bars represent standard deviation from the mean.
The correlation coefficient between TBA values and beef flavor scores was -0.81,
indicating that as lipid oxidation increased as measured by the TBA values, beef flavor
intensity significantly decreased. This inverse relationship between meat flavor and TBA
values was also seen in pork and chicken samples.
There was also a high inverse relationship between rancid flavor scores and beef,
pork, or chicken flavor intensity scores (-0.88, -0.92, -0.93, respectively), indicating that
as the rancid flavor scores increased, species-specific meat flavor scores decreased.
Raisin flavor scores were moderately but significantly (P < 0.05) positively correlated
with beef, pork, or chicken flavor scores (0.55, 0.64, 0.78, respectively). In general, raisin
114 Discussion
In preliminary experiments, addition of TBA reagent to cooked meat samples
containing raisins resulted in development of a yellow rather than a pink chromagen.
Other investigators have also reported the development of a yellow interfering
chromagen when TBA reagent was added to samples containing sugars or aldehydes
(Almandos and others 1986; Guzman-Chozas and others 1997; Sun and others 2001;
Jardine and others 2002). Havens and others (1996) measured the absorbance of the
yellow chromagen at 450 nm as a measure of lipid oxidation in freeze-dried ground beef
patties. The yellow chromagen develops when TBA reagent is added to the meat sample
in "wet" TBA methods (Witte and others 1970; Buege and Aust 1978). However, the
development of a yellow chromagen in samples containing carbohydrates can be avoided
using the distillation method of Tarladgis and others ( 1960), since the volatile TBA
reactive substances can be separated from the less volatile sugar aldehydes by distillation.
Thus, the Tarladgis distillation method was used in this study.
In the present study, addition of raisins to cooked ground meats resulted in lower
TBA values of cooked ground meats during refrigerated storage, compared to control
samples. Although, raisins contain a number of polyphenolic antioxidant compounds,
added sugar (glucose) was nearly as effective as raisins for maintaining low TBA values
during refrigerated storage. Similar results have been reported for addition of honey to
chopped turkey meat (Antony and others 2002). Antony and others further reported that
Maillard reaction products had antioxidant effects in turkey meat. The proposed
mechanisms for antioxidant activity of Maillard reaction products include hydroperoxide
115 reduction, inactivation of free radicals formed during oxidative degradation of
unsaturated fatty acids (Wijewickreme and Kitts 1997; Wijewickreme and others 1999),
oxygen scavenging (Yen and Hsieh 1995) and chelating heavy metal ions (Wijewickreme
and others 1997). Thus, the antioxidant effects of raisins in cooked ground meats were
primarily due to the formation of Maillard reaction products during the heating of sugars
with the amino groups of proteins, peptides, and / or free amino compounds in meats.
Conclusions
Compared to control samples, addition of raisin paste lowered (P < 0.05) TBA
values and decreased the panel scores for rancid flavor of cooked ground beef, pork, and
chicken in a concentration dependent responsive manner. In cooked ground beef, 1.5% to
2.0% raisin paste was more effective than 0.5% to 1.0% raisin paste. For pork, 2.0% to
4.0% raisin paste was more effective than the 1.0% raisin level. For chicken, 2.0% to
4.0% raisin paste was more effective than the 1.0% raisin levels for reducing panel rancid
flavor scores and TBA values.
There was a high correlation between the TBA values and the sensory rancid
flavor scores in all meat samples. Addition of sugar (glucose) was nearly as effective as
raisins for maintenance oflow TBA values and rancid flavor scores of cooked ground
beef, pork, and chicken, probably due to antioxidant effects of Maillard browning
products formed during heating of sugars and meat proteins. The development of
Maillard browning products was especially evident during cooking of ground chicken
with either raisins or glucose, resulting in a much darker product after cooking.
There was no detectable raisin flavor in cooked ground beef samples with added
raisins. However, for all meats the samples with added glucose had a higher raisin
flavor intensity score than controls without raisins, indicating that panelists associated
sweetness with raisin flavor.
References
Almandos ME, Giannini DH, Ciarlo AS, Boeri RL. 1986. Formaldehyde as an
interference of the 2-thiobarbituric acid test. J Sci Food Agric 37:54-8.
Antony SM, Han IY, Rieck JR, Dawson PL. 2002. Antioxidative effect of Maillard
reaction products added to turkey meat during heating by addition of honey . J
Food Sci 67(5):1719-24.
Asghar A, Gray JI, Buckley DJ, Pearson AM, Booren AM. 1988. Perspective on
warmed-over flavor. Food Techmol 42: 102-8.
BeMiller JN, Whistler RL. 1996. Carbohydrates. In: Fennema OR, editor. Food
Chemistry. 3rd ed. New York: Marcel Dekker p 157-224.
116
Bower CK, Schilke KF, Daeschel MA. 2003. Antimicrobial properties of raisins in beef
jerky preservation. J Food Sci 68( 4 ): 1484-9.
Buege JA, Aust SD. 1978. Microsomal lipid peroxidation. Meth Enzymol 52: 302-4.
Foster S. 1997. Grapeseed extract. Health-Foods Bus 43(4):42-3.
Frankel EN. 1999. Food antioxidants and phytochemicals: present and future. Euro J
Lipid Sci Tech 101(12):450-5.
Guzman-Chozas M, Vicario IM, Guillen-Sans R. 1997. Spectrophotometric profiles of
off-flavor aldehydes by using their reactions with 2-thiobarbituric acid. J Agric
Food Chem 45:2452-7.
Havens AL, Faustman C, Senecal A, Riesen JW. 1996. Use of thiobarbituric acid
reactive substances at 450 nm to measure oxidation in freeze-dried meats
[abstract]. In: IFT Annual Meeting Book of Abstracts; 1996 June 22-26; New
Orleans, La. Chicago, Ill.: Institute of Food Technologists. p 161.
Hayter AJ. 1996. Probability and Statistics (Critical points of the t-distribution). PWS
Publishing Co. p 910.
lgene JO , Pearson AM. 1979. Role of phospholipids and triglycerides in warmed-over
flavor development in meat systems. J Food Sci 44: 1285-90.
117
Igene JO, King JA, Pearson AM, Gray JI. 1979. Influence of heme pigments, nitrite, and
non-heme iron on the development of warmed-over flavor (WOF) in cooked
meat. J Agric Food Chem 27:838-42.
Jardine D, Antolovich M, Prenzler PD, Robards K. 2002. Liquid chromatography-mass
spectroscopy (LC-MS) investigation of the thiobarbituric acid reactive substances
(TBARS) reaction. J Agric Food Chem 50: 1720-4.
Jayasingh P, Cornforth DP, Brennand CP, Carpenter CE, Whittier DR. 2002. Sensory
evaluation of ground beef stored in high-oxygen modified atmosphere packaging.
J Food Sci 67:3493-6.
Katalinic V. 1999. Grape catechins-natural antioxidants. J Wine Res 10(1):15-23.
Koniecko ES. 1979. Handbook for Meat Chemists. Rancidity test (TBA method). Wayne,
New Jersey: A very publishing group. p 53-55.
Ladikos D, Lougovois V. 1990. Lipid oxidation in muscle foods. Food Chem 35:295-
314.
118 Meyer AS, Ock SY, Pearson DA, Waterhouse AL, Frankel EN. 1997. J Agric Food
Chem 45(5):1638-43.
Murga R, Luiz R, Beltran S, Cabezas JL. 2000. Extraction of natural complex phenols
and tannins from grape seeds by using supercritical mixtures of carbon dioxide
and alcohol. J Agric Food Chem 48(8):3408-12.
O'Grady MN, Monahan FJ, Burke RM, Allen P. 2000. The effect of oxygen level and
exogenous alpha-tocopherol on the oxidative stability of minced beef in modified
atmospheric packs. Meat Sci 55:39-45.
Paul AA, Southgate DT. 1978. McCance and Widdowson's The Composition of Foods.
4th ed. London: H.M. Stationery Office.
Pilandro LS, Wrolstad RE. 1992. Compositional profiles of fruit juice concentrates and
sweeteners. Food Chem 44(1):19-27.
Sato K, Hegarty GR. 1971. Warmed-over flavor in cooked meats. J Food Sci 36 :1098-
102.
Shalashvili A, Zambakhidze N, Ugrekhelidze D, Parlar H, Leupold G, Kvesitadze G,
Simonishvili S. 2002. Antioxidant activity of grape bioflavonoids and some
flavonoid standards. Adv Food Sci 24(1):24-9.
Shamberger RJ, Andreone TL, Willis CE. 1974. Antioxidants in cancer, 4. Initiating
activity of malonaldehyde as carcinogen. J Natl Cancer Inst 53: 1771-3.
Sun Q, Faustman C, Senecal A, Wilkinson AL, Furr H. 2001. Aldehyde reactivity with 2-
thiobarbituric acid and TBARS in freeze-dried beef during accelerated storage.
Meat Sci 57:55-60.
119 Tarladgis BG, Watts BM, Younathan MT, Dugan L. 1960. A distillation method for
the quantitative determination of malonaldehyde in rancid foods. J Arn Oil Chern
Soc 37:44-8.
Tichivangana JZ, Morrissey PA. 1985. Myoglobin and inorganic metals as proxidants in
raw and cooked muscles system. Meat Sci 15:107-16.
Tims MJ, Watts BM. 1958. Protection of cooked meats with phosphates. Food Technol
12:240-3.
U.S. Department of Agriculture . 2006. USDA national nutrient database for standard
reference , release 18. Available from www.nal.usda.gov/fnic/foodcornp/Data.
Wijewickreme AN, Kitts DD. 1997. Influence of reaction condition s on the oxidative
behavior of model Maillard reaction products. J Agric Food Chem 45 :4571-6.
Wijewickreme AN, Kitts DD, Durance TD. 1997. Reaction conditions influence the
elementary composition and metal-chelating affinity of non-dialyzable model
Maillard reaction products. J Agric Food Chern 45:4577-83 .
Wijewickreme AN, Krejpcio Z, Kitts DD. 1999. Hydroxyl scavenging activity of
glucose, fructose, and ribose-lysine model Maillard products. J Food Sci 64:457-
61.
Witte VC, Krause GF, Bailey ME. 1970. A new extraction method for determining 2-
thiobarbituric acid values of pork and beef during storage. J Food Sci 35:582-5.
Yamakoshi J, Saito M, Kataoka S, Tokutake S. 2002. Procyanidin - rich extract from
grape seeds prevents cataract formation in hereditary cataractous (ICR / f) rats. J
Agric Food Chern 50(17):4983-8.
120 Yen GC, Hsieh PP. 1995. Antioxidant activity and scavenging effects on active
oxygen of xylose-lysine Maillard reaction products. J Sci Food Agric 67:415-20.
Y ounathan MT, Watts BM. 1960. Oxidation of tissue lipids in cooked pork. Food Res
25:538.
CHAPTER6
OVERALL SUMMARY
121
The research in this dissertation focused on the use of natural additives to control
oxidative rancidity in cooked meats. Twenty-two different natural additives were tested
in various experiments for their ability to control lipid oxidation in different cooked
meats. It was found that all the natural additives tested in cooked meats had antioxidant
effects , and were effective in controlling lipid oxidation to some extent. Some of the
additives such as milk mineral (MM), sodium tripolyphosphate (STPP) and cloves were
highly effective, whereas some other additives were less effective .
The Type II antioxidants such as MM and STPP were observed to be more
effective as compared to the Type I antioxidants such as different spices. The Type I
antioxidants act by slowing the propagation of lipid oxidation, whereas the Type II
antioxidants act to inhibit initiation as well as propagation of lipid oxidation by binding
iron and making it unavailable as a potential catalyst for lipid oxidation.
Milk mineral (1.5%) was found to be very effective in controlling lipid oxidation
in cooked beef meatballs and nitrite-cured sausages. It was found to be as effective as
sodium nitrite (20 or 40 ppm) in controlling lipid oxidation. It also maintained the brown
color of cooked meatballs, as compared to control samples. Thus, MM has potential
application as an antioxidant for addition to ground meatballs before cooking. Also MM
when added to cooked meat systems can be considered a good source of added calcium,
and thus has nutritional importance. It would have great potential as an antioxidant in all
cooked meats where a pink cured color from nitrite addition is undesirable. Milk mineral
122 in the future could have a significant role in replacing nitrite as an effective
antioxidant in the cooked meat industry. Further work can be done to check possible
synergistic effects of MM with various other natural antioxidants in cooked ground beef.
Work can also be done to see antioxidant effects of MM in cooked meats from other
species.
All spices had antioxidant effects in cooked ground beef, as compared to control
samples. Among the various spices of Garam Masala spice blend, cloves were found to
be very effective in controlling lipid oxidation in cooked ground beef. Most spices
imparted distinctive flavors to the cooked ground beef. Also , trained panel sensory
analysis showed that all spices reduced the perception of rancid odor/ rancid flavor by a
masking effect. The U.S. consumption of spices exceeds 1 billion lb/year and the world
market for imported spices is worth over $2.3 billion (AST A 2001 ). With such a wide
spread and improving market for the spice trade, there are endless possibilities of using
spices in various food items and cuisines . This work with spices of Garam Masala spice
blend investigating 13 individual spices shows the potential application of using spices in
cooked meats. There are also possible options of using spices in combination with
various Type II antioxidants like MM or STPP to control lipid oxidation in cooked meats.
Further work can be carried out to check the antioxidant effects of various spices in
various other cooked meats from different species.
Raisin paste worked very well in controlling lipid oxidation in cooked ground
beef, pork, and chicken . Raisin paste reduced thiobarbituric acid (TBA) values and rancid
flavor scores in cooked meats. Raisins are rich in various antioxidant compounds such as
bioflavanoids, proanthocyanidins and other polyphenolic antioxidants. The antioxidant
/
123 effect shown by glucose (added at the same levels as present in raisin) in beef, pork
and chicken, suggested that Maillard browning products might contribute significantly to
the antioxidant activity of raisins in cooked meats. It was also found that the distillation
method for TBA analysis avoids the interference from sugars and prevents formation of a
yellow chromogen. This yellow chromogen formation occurs in "wet" methods where
TBA is directly added to the samples having high sugar content. The possible use of
raisin paste as an antioxidant in cooked meats would provide a tasty alternative for
consumers. Also , the use of glucose in meats would provide a cheap and viable
antioxidant alternative in cooked meats. Further work can be carried out to check the use
of different time-temperature combinations of cooking, to show the effect of Maillard
browning in controlling lipid oxidation in cooked meats.
Thus, the results of this dissertation justify my hypothesis that for cooked ground
meats there are a number of alternative antioxidant treatments (MM, Garam Masala
spices and raisin paste) that have equal or greater antioxidant effects as compared to
butylated hydroxytoluene (BHT) or STPP. The results also justify my hypothesis that the
Type II iron-chelating antioxidants (MM, STPP and nitrites) have greater antioxidant
effects in an iron-rich system (cooked meats) than oxygen radical scavenging Type I
antioxidants (BHT and rosemary extract).
References
AST A. 2001. Statistics report. Am Spice Trade Assn., Washington, D.C.
124
APPENDICES
APPENDIX A
CHINESE 5 - SPICE PAPER
125
126 EVALUATION OF ANTIOXIDANT EFFECTS AND SENSORY
ATTRIBUTES OF CHINESE 5-SPICE INGREDIENTS IN COOKED GROUND
BEEF
Abstract
This study determined antioxidant and sensory characteristics of cinnamon,
cloves, fennel, pepper, and star anise (Chinese 5-spice ingredients) in cooked ground
beef. Total aerobic plate counts were also measured. Mean thiobarbituric acid (TBA)
values were high (3.4 ppm) for control cooked ground beef samples . With 1 % use level,
all spice treatments had lower pooled mean TBA values than controls. At the lowest use
level of 0.1 % of meat weight, all spices except pepper had lower TBA values than
controls. Treatments with 0 .1 % cloves had lower (P < 0.05) TBA values than 0.1 %
levels of other individual spices. Star anise, fennel, pepper, and cinnamon samples at
0.5% use level had lower mean TBA values than controls, but not different from 1.0%
levels, respectively. Thus, the lowest effective spice level for cloves was 0.1 % and 0.5%
for the other spices. There was a high correlation (P < 0.01) between TBA values and
panel scores for rancid odor and flavor (0.83 and 0.78, respectively). Spice flavor was
inversely correlated (P < 0.01) with rancid odor and flavor (-0.57 and -0.61, respectively).
The 5-spice blends did not affect microbial load of cooked samples compared with
controls. In conclusion, all spices and blends had a dual effect, reducing rancid
odor/flavor and imparting a distinctive flavor to cooked ground beef.
Reprinted from Dwivedi S, Vasavada MN, Cornforth D. 2006. Evaluation of antioxidant effects and sensory attributes of Chinese 5 - spice ingredients in cooked ground beef. J Food Sci 71(1):C012-017.
127 Introduction
The Chinese conceptualized the theory of '5 Elements' under which everything in
our surroundings could be categorized into 5 basic elements. Chinese 5-spice is 1
application of the 5 element s theory. It was developed in an attempt to produce a powder
that encompassed the 5 flavor elements ; sweet, salty, sour, pungent, and bitter (Needham
and Wang 1956). The traditional 5-spice mixture includes cinnamon , cloves, fennel,
Szechwan pepper , and star anise . Today , however, Chinese 5-spice may also include
ginger and nutmeg and can be easily obtained in any Asian market.
Lipid oxidation is 1 of the major causes of food deterioration . Lipid oxidation
may also decrease nutritional value by forming potentially toxic products during cooking
and processing (Shahidi and others 1992; Maillard and others 1996). Warmed-over flavor
(WOF) is associated with cooked meat and intensifies during refrigerated storage (Tims
and Watts 1958). Heating temperature affects the extent of lipid oxidation (Keller and
Kinsella 1973). Ferric and ferrous iron ions catalyze the decomposition of lipid peroxides
to more volatile aldehydes and ketones (McDonald and Hultin 1987). Early work showed
that the meat pigment myoglobin had little or no catalytic effect on lipid oxidation in
simple model systems or red meats (Sato and Hegarty 1971; Love and Pearson 1974).
However, more recent work has shown lipid oxidation catalyzed by oxidized myoglobin
species (Reeder and Wilson 2001), hemoglobin in fish muscle (Richards and Hultin
2002), and heme derived from myoglobin oxidation (Baron and Andersen 2002).
Compounds with antioxidant properties have been found in spices, oil seeds,
citrus pulp and peel, and in products that have been heated and / or have undergone non-
128 enzymatic browning. In addition to imparting distinctive flavors, spices contain
antioxidant properties and inhibit rancid flavor development associated with lipid
oxidation (Chipault and others 1952, 1955; Namiki 1990) . Spices such as cloves,
cinnamon , turmeric, black pepper , ginger , garlic, and onions exhibit antioxidant
properties in different food systems (Younathan and others 1980; Al-Jalay and others
1987; Jurdi-Haldeman and others 1987). Spices have antioxidant properties due to the
presence of compounds such as flavanoids, terpenoids, lignans, and polyphenolics (Craig
1999). However , their use may be limited in some foods , due to their characteristic flavor
and aroma . Use of un-sterilized spices and herbs also increases the possibility of bacterial
contamination in high moisture foods (Garcia and others 2001).
Antioxidant compounds have been identified in all 5 components of Chinese 5-
spice. Anise (Pimpinella anisum L.), nutmeg, and licorice all had strong hydroxyl radical
(OH•) scavenging activity in deoxyribose assay (Murcia and others 2004). Fennel
(Foeniculum vulgare) has in vitro antioxidant activity (Oktay and others 2003) . The
antioxidant compounds in fennel include 3-caffeoylquinic acid, rosamirinic acid, and
quercetin-3-0-galactoside (Pareja and others 2004). Cloves (Syzygium aromaticum)
contain eugenol and eugenyl acetate as the major aroma constituents. Both compounds
inhibit hexanal formation (a product of lipid oxidation) in cod liver oil (Lee and
Shibamoto 2001). Antioxidant activity in pepper (Capsicum annum) is due to presence of
ascorbic acid, flavonoids, capasaicinoids, and phenolic acids (Jimenez and others 2003).
Cinnamic aldehyde in cinnamon (Cinnamomum aromaticum) has potential antioxidant
properties. Cinnamon and mint exhibited higher antioxidant properties than anise, ginger,
licorice, nutmeg, or vanilla in a lipid peroxidation assay (Murcia and others 2004). A
129 concentration of 500 µg/ml cinnamon extract inhibited hexanal production by 5%
(Lee and Shibamoto 2002).
Although the components of Chinese 5-spice have been shown to have
antioxidant activity in model systems, our objective was to determine the lowest effective
level of each spice for antioxidant propertie s in cooked ground beef. Sensory evaluation
was also done on cooked ground beef containing various spices at their recommended
(lowest effective) antioxidant level.
Materials and Methods
Experiment 1 - Thiobarbituric acid (TBA) assay
The experiment was a completely randomized block design with 6 ground beef
treatments (cinnamon , cloves, fennel , pepper, star anise, and retail 5-spice blend), at 4
levels (0, 0.1, 0.5, and 1.0 % of meat weight) , 3 storage days (1, 8, and 15 d), and 3
replications of the entire experiment. TBA values (duplicates for each sample) were
measured as an indicator of rancidity at 1, 8, and 15 d storage of cooked ground beef
crumbles at 2°C.
Treatment means were calculated by analysis of variance (ANOV A) using
Statistica ™ software (Statsoft Inc, Tulsa, Okla. , U.S.A.). Significant differences among
means were determined by calculation of Fisher's least significant difference (LSD)
values. Significance was defined at P < 0.05 for ANOV A and LSD values.
The recommended or lowest effective spice level (0.1 %, 0.5%, or 1 %) for each
individual spice was determined as the lowest spice concentration that resulted in TBA
values significantly lower than the controls (0% spice). The 5 spices at their lowest
130 effective levels were mixed to create the low clove 5-spice blend for sensory testing
in experiment 2. The low clove 5-spice blend was created because cloves have strong
flavor and odor that could be a concern with consumers . Thus, it was desirable to evaluate
a blend with a clove proportion lower than 20% (the level if each of the 5 spices were
present in equal proportions).
Experiment 2 - Sensory evaluation
Cooked beef samples made with spices at their lowest effective levels as
described in experiment 1 were evaluated for intensity of cooked beef flavor, rancid
flavor/odor , and spice flavor intensity. A total of 10 treatments were evaluated (0.5%
cinnamon, 0.1 % cloves, 0.5% fennel, 0.5% pepper, 0.5% star anise, 0.5% retail 5-spice
blend , 0.5% optimal 5-spice blend , rancid control, 0.5% sodium tripolyphosphate (STPP)
control, fresh control). The rancid control was cooked ground beef without added spices
and held 15 d at 2°C, allowing time to observe the full extent of oxidation in the controls
compared to spice-treated samples. The fresh control was cooked ground beef without
spices prepared on the day of the panel evaluation. Trained panelists (n = 13) evaluated
samples after 15 d of storage at 2°C. TBA values were measured on the samples that
were served to the panelists. Treatment means were calculated by ANOV A as described
in experiment 1. Correlation coefficients were calculated among sensory scores and TBA
values. Significance was defined at P < 0.01 for correlation coefficients.
Experiment 3 - Aerobic plate count
A 10-g portion of ground beef was mixed with 90 mL of sterile peptone water
(Difeo, Detroit, Mich. , U.S.A.) in a dilution bottle, and plate counts were done on serial
131 dilutions of cooked ground beef samples after 1, 8, or 15 d storage at 2°C, following
standard procedures (Messer and others 1978). Standard methods agar (Difeo) was used
as growth media. Duplicate plates were counted after incubation at 37°C for 48h.
Sample preparation
Ground star anise, fennel , cloves, and cinnamon (McCormick & Co. Inc., Hunt
Valley, Md., U.S.A.), black pepper (Inter-American Foods Inc., Cincinnati, Ohio,
U.S.A.) , and lean ground beef (15% fat) were purchased at a local grocery . Retail
Chinese 5-spice blend (Dynasty , San Francisco, Calif., U.S.A.) was also purchased
locally. In addition to the 5 traditional spices , the retail blend also contained ginger and
licorice. Each spice was manually mixed with ground beef (100 g/ treatment) at 0.1 %,
0.5%, and 1.0% levels. Mixed samples were thoroughly cooked at 163°C for 5 min, to a
final temperature of 82°C to 85°C, as measured using a VersaTuff Plus 396 digital
thermometer (Atkins Technical , Inc, Gainesville, Fla., U.S.A.) with a thin probe for fast
response . The cooked ground beef crumbles were placed in resealable plastic bags,
cooled for 10 to 15 min at room temperature, and stored for 1, 8, or 15 d at 2°C.
Thiobarbituric acid (TBA) values were measured in duplicate at 1, 8, or 15 don the
cooked samples as an indicator of oxidative rancidity. For each ingredient spice, the
experiment was replicated 3 times. Duplicate sample analysis was performed. Thus, there
were 6 observations per treatment.
TBA value
Thiobarbituric acid-reactive substances (TBARS) assay was performed as
described by Buege and Aust (1978). Duplicate samples (0.5 g) for all the treatments
132 were mixed with 2.5 mL of stock solution containing 0.375% TBA (Sigma Chemical
Co., St. Louis, Mo., U.S.A .), 15% TCA (Mallinckrodt Baker Inc., Paris, Ky., U.S.A.),
and 0.25 N HCl. The mixture was heated for 10 min in a boiling water bath (100°C) to
develop a pink color, cooled in tap water, and then centrifuged (Sorvall Instruments,
Model RC 5B, DuPont, Wilmington, Del., U.S.A.) at 4300 x g for 10 min. The
absorbance of the supernatant was measured spectrophotometrically (Spectronic 21D,
Milton Roy, Rochester, N.Y., U.S.A.) at 532 nm against a blank that contained all the
reagents except the meat. The malonaldehyde (MDA) concentration was calculated using
an extinction coefficient of 1.56 x 10⁵/M/cm for the pink TBA-MDA pigment (Sinnhuber
and Yu 1958). The absorbance values were converted to ppm malonaldehyde by using
the following equations:
TBA nr (mg/kg)= Sample A532 x (1 M TBA Chromagen /156000) x [(1 mole/L)/ M] x
(0.003 U 0.5 g meat) x (72.07 g MDNmole MDA) x (1000 g/kg) (1)
TBA nr (ppm)= Sample A532 x 2.77 (where MDA = malonaldehyde) (2)
Sensory evaluation
All panelists had previous sensory panel experience with cooked beef products.
The panelists were trained in 2 sessions. In the 1st session, panelists were familiarized
with the 5-point intensity scale and its usage. Panelists were also familiarized with
cooked beef flavor (both fresh and rancid samples) and cooked ground beef with
individual added spices (cinnamon, cloves, fennel, pepper, and star anise) and Chinese 5-
spice blends at low (0.1 % ) and high (1 % ) spice concentrations. Group discussion was
133 conducted regarding sample attributes. In the 2nd session, panelists again evaluated
the same samples. The most consistent panelists (n = 13) were included in the final panel.
Treatment samples were prepared with spice concentration at lowest effective
levels of 0.5% for cinnamon, fennel, star anise, or black pepper, and 0.1 % for clove (%
raw meat weight) as determined in experiment 1 of this study. The low clove blend was
4.8% by weight cloves and 23.8% each of cinnamon, fennel, pepper, and star anise. Spice
treatments were cooked, packaged, and stored as previously described. Three control
cooked beef samples were also prepared. The controls were (1) fresh, (2) STPP, and (3)
rancid. Fresh control samples were cooked immediately before serving, using lean
ground beef (15% fat) purchased locally on the d of the panel. STPP controls were
formulated with 0.5% STPP, cooked and refrigerated for 15 d. Rancid controls were
cooked samples without STPP or spice and refrigerated for 15 d. TBA values were
measured for all controls and treated samples on the same day as the panel evaluation.
The 7 treatment samples at optimal concentrations and 3 controls of cooked beef
crumbles were evaluated in 3 sessions. A set of 5 or 6 samples (6 g each) was served to
each panelist in each session, consisting of 2 or 3 spice-treated samples and 3 controls.
Samples were coded and microwave reheated for 25 s to attain a temperature of 80°C to
85°C immediately before serving. Samples were evaluated in individual booths under red
lights. The serving order was randomized to avoid positional bias.
Panelists were asked to evaluate samples for intensity of rancid odor, rancid
flavor, beef flavor, and spice flavor on a 5- point scale, where 1 = no flavor or odor, 2 =
slightly intense, 3 = moderately intense, 4 = very intense, and 5 = extremely intense
flavor or odor. Panelists were also asked to provide additional qualitative comments for
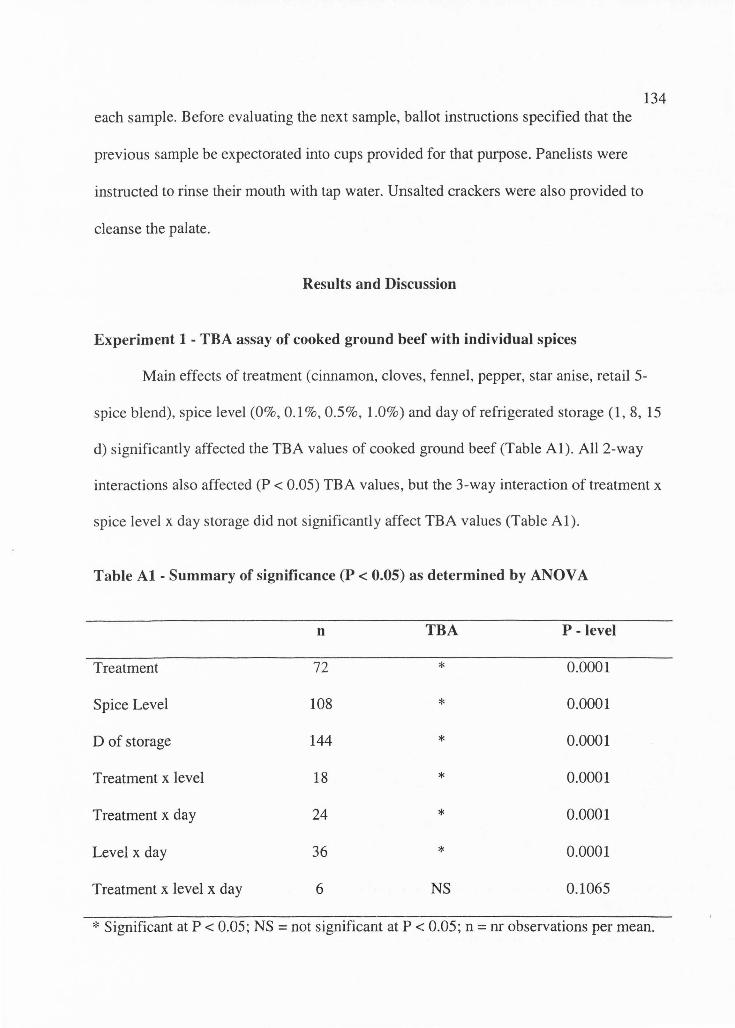
each sample. Before evaluating the next sample, ballot instructions specified that the
previous sample be expectorated into cups provided for that purpose. Panelists were
instructed to rinse their mouth with tap water. Unsalted crackers were also provided to
cleanse the palate.
Results and Discussion
Experiment 1 - TBA assay of cooked ground beef with individual spices
134
Main effects of treatment ( cinnamon, cloves, fennel, pepper, star anise, retail 5-
spice blend), spice level (0%, 0.1 %, 0.5%, 1.0%) and day of refrigerated storage (1 , 8, 15
d) significantly affected the TBA values of cooked ground beef (Table Al). All 2-way
interactions also affected (P < 0.05) TBA values, but the 3-way interaction of treatment x
spice level x day storage did not significantly affect TBA values (Table Al) .
Table Al - Summary of significance (P < 0.05) as determined by ANOV A
n TBA P - level
Treatment 72 * 0.0001
Spice Level 108 * 0.0001
D of storage 144 * 0.0001
Treatment x level 18 * 0.0001
Treatment x day 24 * 0.0001
Level x day 36 * 0.0001
Treatment x level x day 6 NS 0.1065
* Significant at P < 0.05; NS= not significant at P < 0.05; n = nr observations per mean.
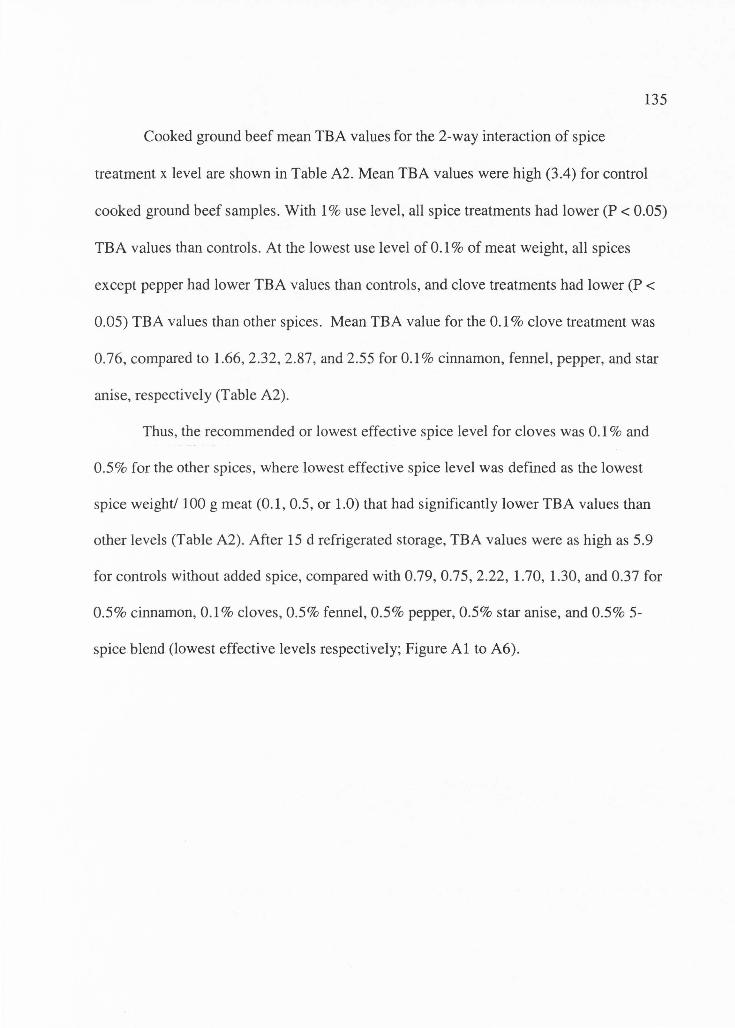
135
Cooked ground beef mean TBA values for the 2-way interaction of spice
treatment x level are shown in Table A2. Mean TBA values were high (3.4) for control
cooked ground beef samples. With 1 % use level, all spice treatments had lower (P < 0.05)
TBA values than controls. At the lowest use level of 0.1 % of meat weight, all spices
except pepper had lower TBA values than controls, and clove treatments had lower (P <
0.05) TBA values than other spices. Mean TBA value for the 0.1 % clove treatment was
0.76, compared to 1.66, 2.32, 2.87, and 2.55 for 0.1 % cinnamon, fennel, pepper, and star
anise, respectively (Table A2).
Thus, the recommended or lowest effective spice level for cloves was 0.1 % and
0.5% for the other spices, where lowest effective spice level was defined as the lowest
spice weight/ 100 g meat (0.1, 0.5, or 1.0) that had significantly lower TBA values than
other levels (Table A2). After 15 d refrigerated storage, TBA values were as high as 5.9
for controls without added spice, compared with 0.79, 0.75, 2.22, 1.70, 1.30, and 0.37 for
0.5% cinnamon, 0.1 % cloves, 0.5% fennel, 0.5% pepper, 0.5% star anise, and 0.5% 5-
spice blend (lowest effective levels respectively; Figure Al to A6).
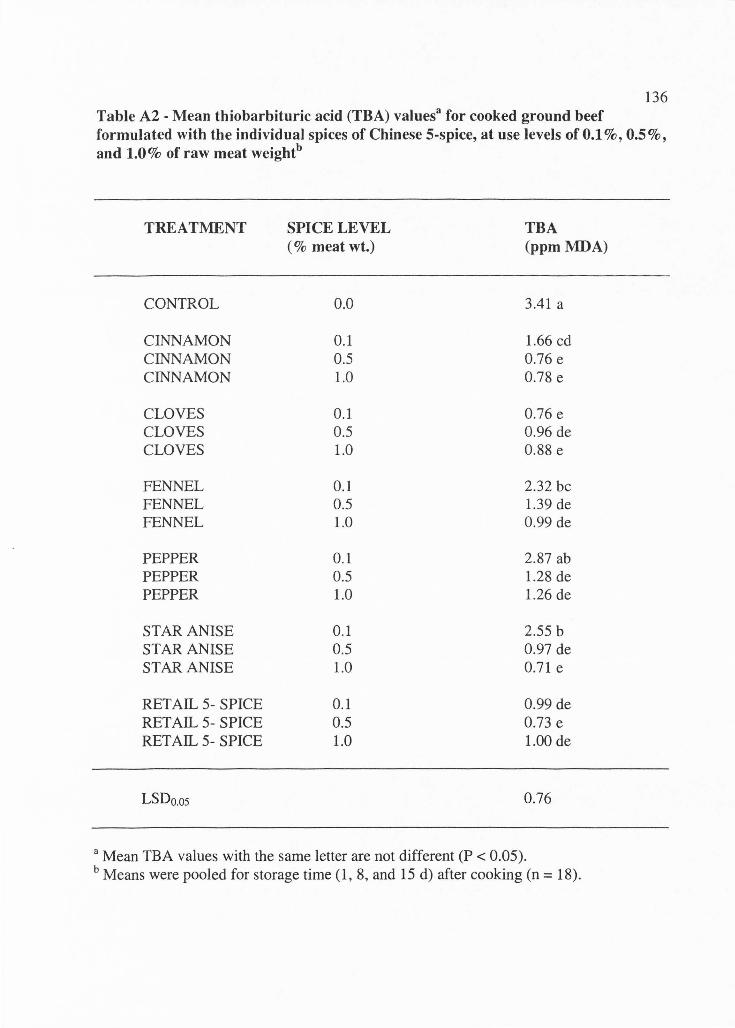
136 Table A2 - Mean thiobarbituric acid (TBA) values 3 for cooked ground beef formulated with the individual spices of Chinese 5-spice, at use levels of 0.1 % , 0.5 % , and 1.0% of raw meat weightb
TREATMENT
CONTROL
CINNAMON CINNAMON CINNAMON
CLOVES CLOVES CLOVES
FENNEL FENNEL FENNEL
PEPPER PEPPER PEPPER
STAR ANISE STAR ANISE STAR ANISE
RETAIL 5- SPICE RETAIL 5- SPICE RETAIL 5- SPICE
LSDo.os
SPICE LEVEL (% meat wt.)
0.0
0.1 0.5 1.0
0.1 0.5 1.0
0.1 0.5 1.0
0.1 0.5 1.0
0.1 0.5 1.0
0.1 0.5 1.0
TBA (ppm MDA)
3.41 a
1.66 cd 0.76 e 0.78 e
0.76 e 0.96 de 0.88 e
2.32 be 1.39 de 0.99 de
2.87 ab 1.28 de 1.26 de
2.55 b 0.97 de 0.71 e
0.99 de 0.73 e 1.00de
0.76
a Mean TBA values with the same letter are not different (P < 0.05). b Means were pooled for storage time (1, 8, and 15 d) after cooking (n = 18).
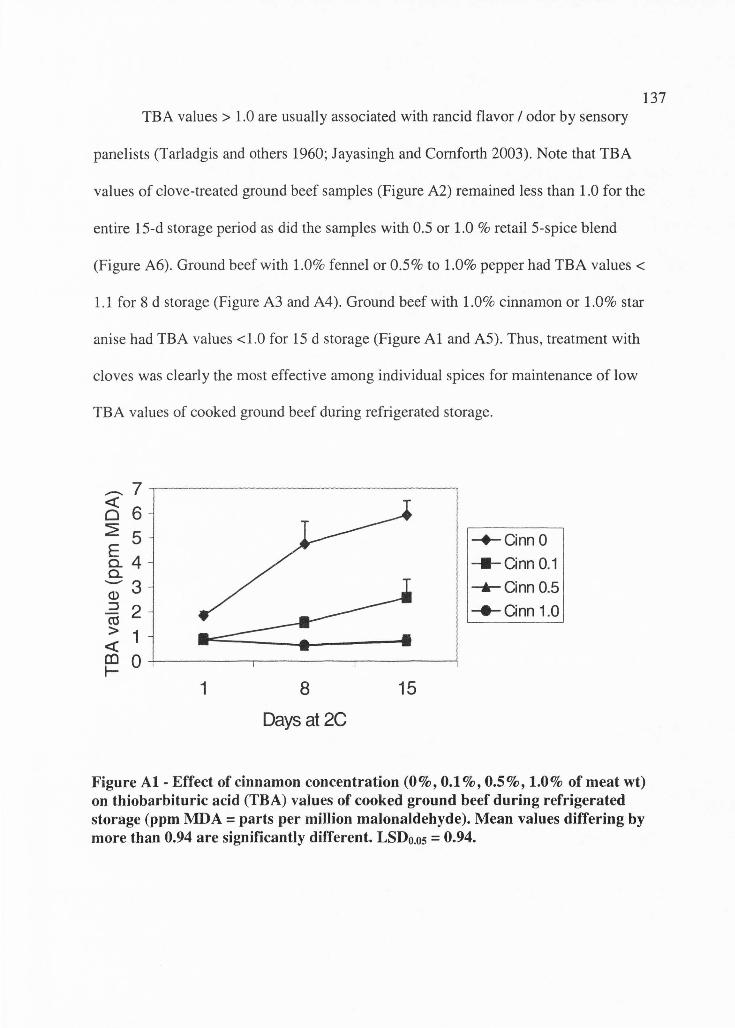
137 TBA values> 1.0 are usually associated with rancid flavor/ odor by sensory
panelists (Tarladgis and others 1960; Jayasingh and Cornforth 2003). Note that TBA
values of clove-treated ground beef samples (Figure A2) remained less than 1.0 for the
entire 15-d storage period as did the samples with 0.5 or 1.0 % retail 5-spice blend
(Figure A6). Ground beef with 1.0% fennel or 0.5% to 1.0% pepper had TBA values<
1.1 for 8 d storage (Figure A3 and A4 ). Ground beef with 1.0% cinnamon or 1.0% star
anise had TBA values <1.0 for 15 d storage (Figure Al and A5). Thus , treatment with
cloves was clearly the most effective among individual spices for maintenance of low
TBA values of cooked ground beef during refrigerated storage.
1 8
Days at 2C
15
-+-Ginn O _.Ginn 0.1
_._Cinn0.5
--- Ginn 1.0
Figure Al - Effect of cinnamon concentration (0%, 0.1 %, 0.5%, 1.0% of meat wt) on thiobarbituric acid (TBA) values of cooked ground beef during refrigerated storage (ppm MDA = parts per million malonaldehyde). Mean values differing by more than 0.94 are significantly different. LSDo.os = 0.94.
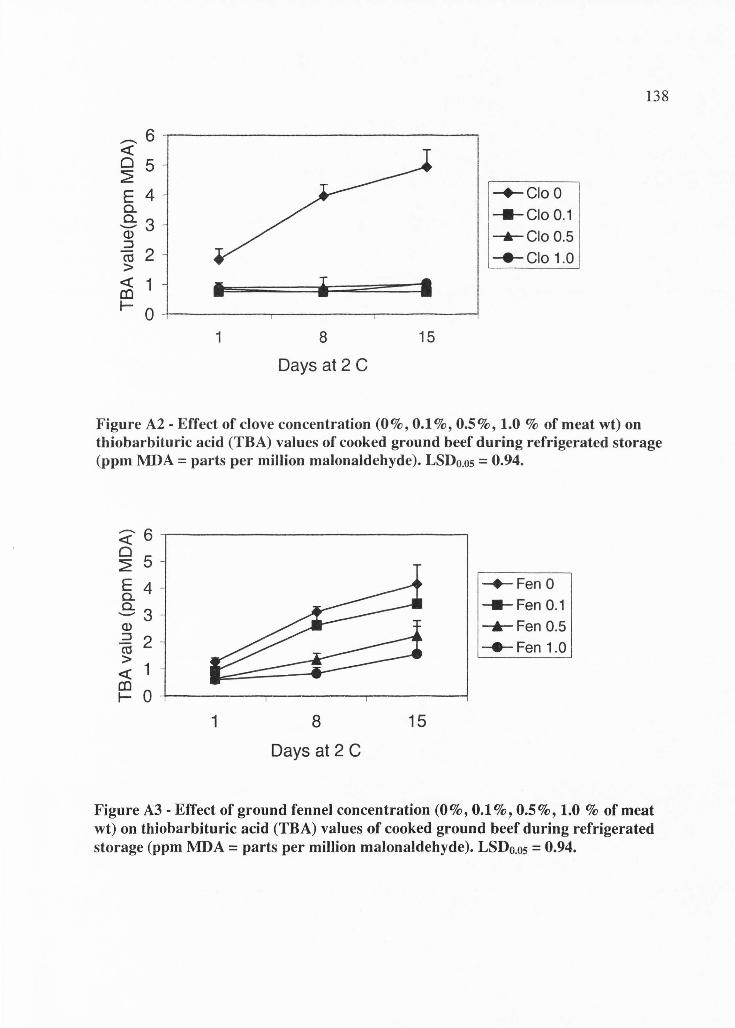
- 6 --,----------------~ <(
0 5 ~ E 4 c.. 83 Q) :::::J
~ 2 >
<( 1 co I iii I r o +------,------,-----~
1 8
Days at 2 C
15
-+-Clo 0 ---Clo 0.1 __._Clo 0.5
-Clo 1.0
138
Figure A2 - Effect of clove concentration (0%, 0.1 %, 0.5%, 1.0 % of meat wt) on thiobarbituric acid (TBA) values of cooked ground beef during refrigerated storage (ppm l\1DA = parts per million malonaldehyde). LSD0.05 = 0.94.
~6--r------------------,
~ 5 E 4 c.. 83 Q)
~ 2
~ 1
~ Q---1---------- ------1 8
Days at 2 C
15
-+-Fen 0 ---Fen 0.1 --lr-Fen 0.5 -Fen 1.0
Figure A3 - Effect of ground fennel concentration (0%, 0.1 %, 0.5%, 1.0 % of meat wt) on thiobarbituric acid (TBA) values of cooked ground beef during refrigerated storage (ppm l\1DA = parts per million malonaldehyde). LSDo.os = 0.94.
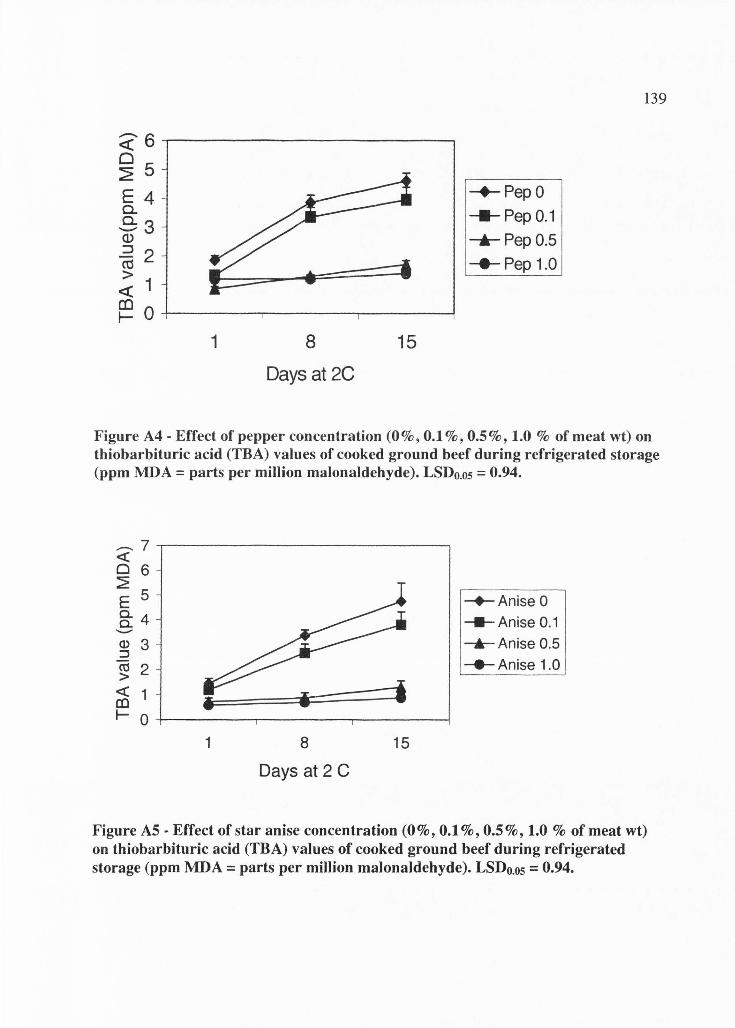
1 8
Days at 2C
15
~PepO
---Pep 0.1 _...,_Pep0.5
~Pep1.0
139
Figure A4 - Effect of pepper concentration (0 % , 0.1 % , 0.5 % , 1.0 % of meat wt) on thiobarbituric acid (TBA) values of cooked ground beef during refrigerated storage (ppm MDA = parts per million malonaldehyde). LSD0.05 = 0.94.
Q) 3 ::::,
CtS 2 > <( 1 co ~ 0+------r------r-------i
1 8
Days at 2 C
15
-+-Anise O -II- Anise 0.1 _,._Anise0.5
-Anise 1.0
Figure AS - Effect of star anise concentration (0%, 0.1 %, 0.5%, 1.0 % of meat wt) on thiobarbituric acid (TBA) values of cooked ground beef during refrigerated storage (ppm MDA = parts per million malonaldehyde). LSD0.05 = 0.94.
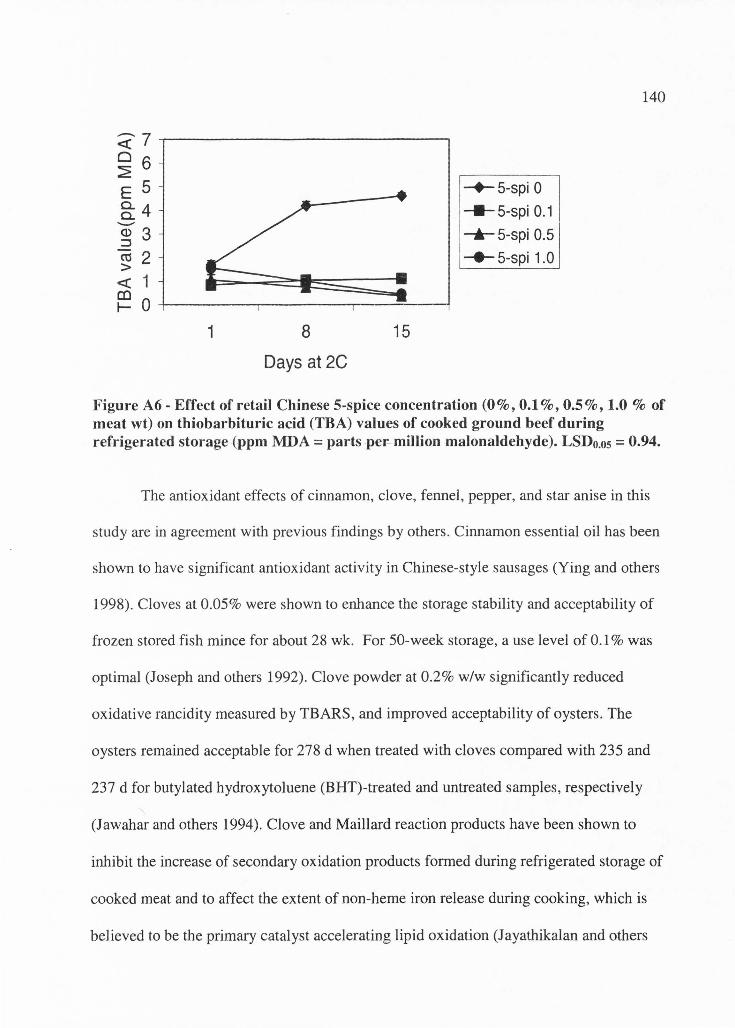
;;j7---,------------------.
~ 6 E 5 §: 4 -Q) 3 ~
cu 2 >
<( 1 ~ 0-------,------,-------1
1 8
Days at 2C
15
140
-+-5-spi O -..5-spi 0.1 -A-5-spi 0.5
-+-5-spi 1.0
Figure A6 - Effect of retail Chinese 5-spice concentration (0 % , 0.1 % , 0.5 % , 1.0 % of meat wt) on thiobarbituric acid (TBA) values of cooked ground beef during refrigerated storage (ppm MDA = parts per-miHion ma)onaldehyde). LSDo.os = 0.94.
The antioxidant effects of cinnamon, clove, fennel, pepper, and star anise in this
study are in agreement with previous findings by others. Cinnamon essential oil has been
shown to have significant antioxidant activity in Chinese-style sausages (Ying and others
1998). Cloves at 0.05% were shown to enhance the storage stability and acceptability of
frozen stored fish mince for about 28 wk. For 50-week storage, a use level of 0.1 % was
optimal (Joseph and others 1992). Clove powder at 0.2% w/w significantly reduced
oxidative rancidity measured by TBARS, and improved acceptability of oysters. The
oysters remained acceptable for 278 d when treated with cloves compared with 235 and
237 d for butylated hydroxytoluene (BHT)-treated and untreated samples, respectively
(Jawahar and others 1994). Clove and Maillard reaction products have been shown to
inhibit the increase of secondary oxidation products formed during refrigerated storage of
cooked meat and to affect the extent of non-heme iron release during cooking, which is
believed to be the primary catalyst accelerating lipid oxidation (Jayathikalan and others
141 1997). Black pepper was an effective sensory flavoring agent in chicken feet
(Jokpyun, a traditional Korean gel type delicacy) at 0.33% level, based on response
surface methodology (Mira and others 2000). Ground black pepper oleoresin extracted by
supercritical carbon dioxide was more effective in reducing lipid oxidation of cooked
ground pork than oleoresin extracted by conventional methods (Tiprisukond and others
1998). Star anise was effective at 0.5% level based on meat weight. Anise-treated
samples had a TBA value of 0.97. Anise has also been shown to have antioxidant effects
in Chinese marinated pork shanks as compared to controls (Tzu and others 1997).
Experiment 2 - Sensory evaluation
Mean trained panel sensory scores and thiobarbituric acid (TBA) values of spice
treated , cooked ground beef crumbles after 15 d storage at 2°C are shown in Table A3.
The control samples without added spices (rancid control) had the highest scores for
rancid odor and flavor intensity and also the highest TBA values (7 .2). The control
samples made with 0.5% sodium tripolyphosphate (STPP control) had low scores for
rancid odor, flavor, and spice flavor intensity, and also had lowest TBA value of 0.3. This
observation is in agreement with previous work showing that phosphate compounds such
as sodium tripolyphosphate (STPP) or milk mineral are quite effective antioxidants in
cooked ground meats, due to their ability to bind ionic iron and thus prevent iron catalysis
of lipid oxidation (Cornforth and West 2002; J ayasingh and Cornforth 2003 ). The control
samples without spices, and prepared on the day of the panel evaluation (fresh control)
also had low scores for rancid odor, flavor, and spice flavor intensity, and had a relatively
low TBA value of 1.0. All cooked ground beef samples made with spices ( cinnamon,
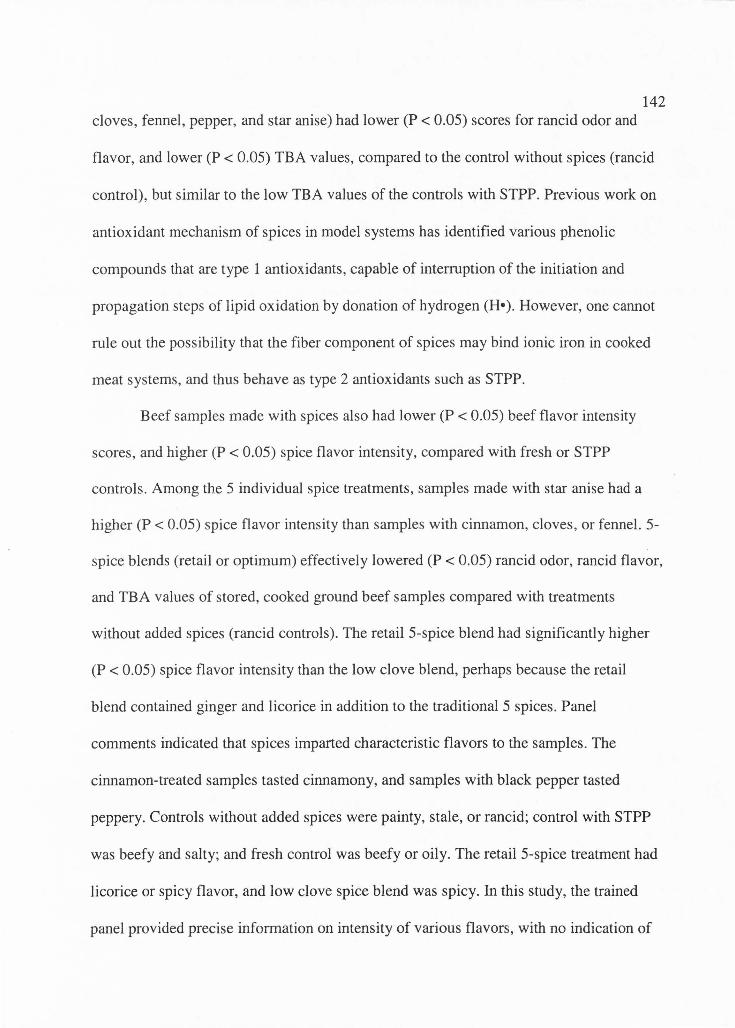
142 cloves, fennel, pepper, and star anise) had lower (P < 0.05) scores for rancid odor and
flavor, and lower (P < 0.05) TBA values, compared to the control without spices (rancid
control), but similar to the low TBA values of the controls with STPP. Previous work on
antioxidant mechanism of spices in model systems has identified various phenolic
compounds that are type 1 antioxidants, capable of intenuption of the initiation and
propagation steps of lipid oxidation by donation of hydrogen (H•). However, one cannot
rule out the possibility that the fiber component of spices may bind ionic iron in cooked
meat systems, and thus behave as type 2 antioxidants such as STPP.
Beef samples made with spices also had lower (P < 0.05) beef flavor intensity
scores, and higher (P < 0.05) spice flavor intensity, compared with fresh or STPP
controls. Among the 5 individual spice treatments, samples made with star anise had a
higher (P < 0.05) spice flavor intensity than samples with cinnamon, cloves, or fennel. 5-
spice blends (retail or optimum) effectively lowered (P < 0.05) rancid odor, rancid flavor,
and TBA values of stored, cooked ground beef samples compared with treatments
without added spices (rancid controls). The retail 5-spice blend had significantly higher
(P < 0.05) spice flavor intensity than the low clove blend, perhaps because the retail
blend contained ginger and licorice in addition to the traditional 5 spices. Panel
comments indicated that spices imparted characteristic flavors to the samples . The
cinnamon-treated samples tasted cinnamony, and samples with black pepper tasted
peppery. Controls without added spices were painty, stale, or rancid; control with STPP
was beefy and salty; and fresh control was beefy or oily. The retail 5-spice treatment had
licorice or spicy flavor, and low clove spice blend was spicy. In this study, the trained
panel provided precise information on intensity of various flavors, with no indication of
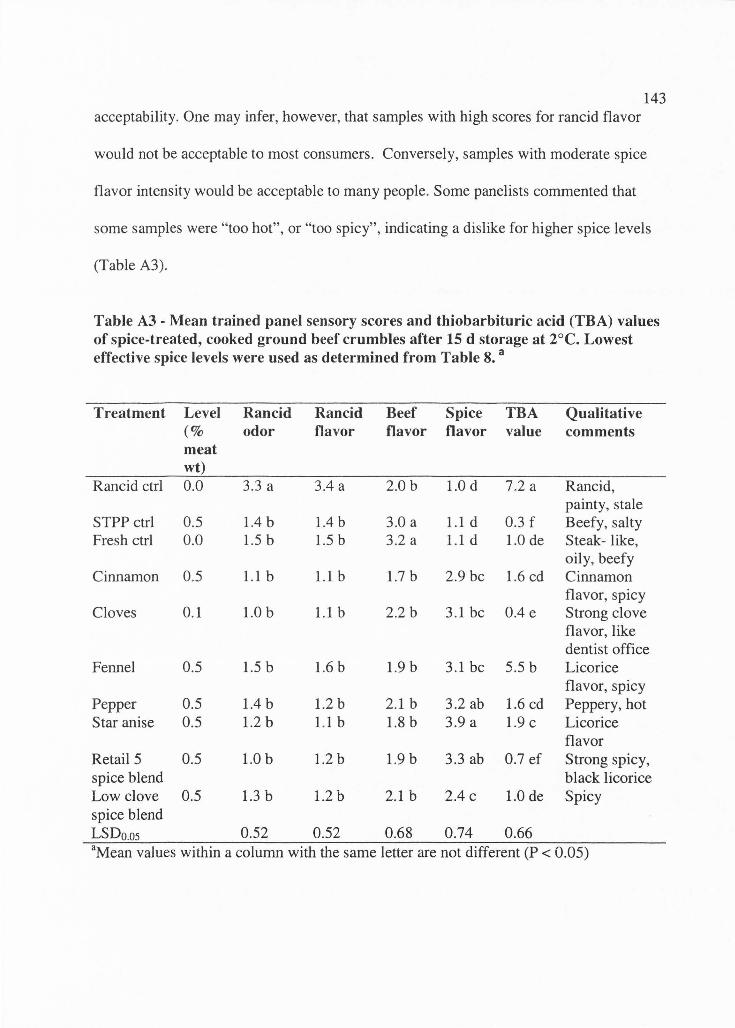
143 acceptability. One may infer, however, that samples with high scores for rancid flavor
would not be acceptable to most consumers. Conversely, samples with moderate spice
flavor intensity would be acceptable to many people. Some panelists commented that
some samples were "too hot", or "too spicy", indicating a dislike for higher spice levels
(Table A3).
Table A3 - Mean trained panel sensory scores and thiobarbituric acid (TBA) values of spice-treated, cooked ground beef crumbles after 15 d storage at 2°C. Lowest effective spice levels were used as determined from Table 8. a
Treatment Level Rancid Rancid Beef Spice TBA Qualitative (% odor flavor flavor flavor value comments meat wt)
Rancid ctrl 0.0 3.3 a 3.4 a 2.0 b 1.0d 7.2 a Rancid, painty, stale
STPP ctrl 0.5 1.4 b 1.4 b 3.0 a 1.1 d 0.3 f Beefy , salty Fresh ctrl 0.0 1.5 b 1.5 b 3.2 a 1.1 d 1.0 de Steak- like,
oily, beefy Cinnamon 0.5 1.1 b 1.1 b 1.7 b 2.9 be 1.6 cd Cinnamon
flavor, spicy Cloves 0.1 I.Ob 1.1 b 2.2 b 3.1 be 0.4 e Strong clove
flavor, like dentist office
Fennel 0.5 1.5 b 1.6 b 1.9 b 3.1 be 5.5 b Licorice flavor, spicy
Pepper 0.5 1.4 b 1.2 b 2.1 b 3.2 ab 1.6 cd Peppery, hot Star anise 0.5 1.2 b 1.1 b 1.8 b 3.9 a 1.9 C Licorice
flavor Retail 5 0.5 1.0b 1.2 b 1.9 b 3.3 ab 0.7 ef Strong spicy, spice blend black licorice Low clove 0.5 1.3 b 1.2 b 2.1 b 2.4 C 1.0 de Spicy spice blend LSDo.os 0.52 0.52 0.68 0.74 0.66 3Mean values within a column with the same letter are not different (P < 0.05)
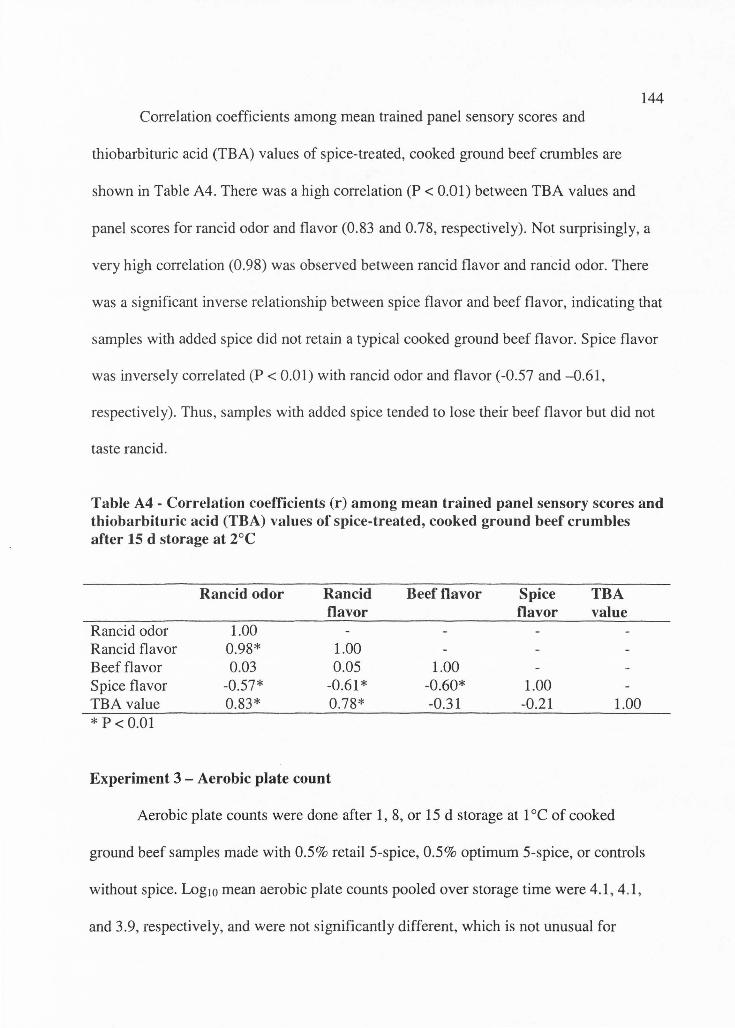
144 Correlation coefficients among mean trained panel sensory scores and
thiobarbituric acid (TBA) values of spice-treated, cooked ground beef crumbles are
shown in Table A4. There was a high correlation (P < 0.01) between TBA values and
panel scores for rancid odor and flavor (0.83 and 0.78, respectively) . Not surprisingly, a
very high correlation (0.98) was observed between rancid flavor and rancid odor. There
was a significant inverse relationship between spice flavor and beef flavor, indicating that
samples with added spice did not retain a typical cooked ground beef flavor. Spice flavor
was inversely correlated (P < 0.01) with rancid odor and flavor (-0.57 and --0.61,
respectively). Thus, samples with added spice tended to lose their beef flavor but did not
taste rancid .
Table A4 - Correlation coefficients (r) among mean trained panel sensory scores and thiobarbituric acid (TBA) values of spice-treated, cooked ground beef crumbles after 15 d storage at 2°c
Rancid odor Rancid Beef flavor Spice TBA flavor flavor value
Rancid odor 1.00 Rancid flavor 0.98* 1.00 Beef flavor 0.03 0.05 1.00 Spice flavor -0.57* -0.61 * -0.60* 1.00 TBA value 0.83* 0.78* -0.31 -0.21 1.00 *P<0.01
Experiment 3 - Aerobic plate count
Aerobic plate counts were done after 1, 8, or 15 d storage at 1 °C of cooked
ground beef samples made with 0.5% retail 5-spice, 0.5% optimum 5-spice, or controls
without spice. Log 10 mean aerobic plate counts pooled over storage time were 4.1, 4.1,
and 3.9, respectively, and were not significantly different, which is not unusual for
145 cooked samples. There was no significant treatment x time interaction for aerobic
plate counts . Thus, addition of 0.5% spice blends had no antimicrobial effects during
storage of cooked ground beef in this study. Spices and essential oils are known to exhibit
antimicrobial effects in various food products or model systems (Yuste and Fung 2002;
Guynot and others 2003; Ozkan and others 2003). The lack of antimicrobial effects in
cooked ground beef during storage in this study may be due to heat inactivation or loss of
antimicrobial components during cooking .
Conclusions
All spices imparted a distinctive flavor to the cooked ground beef and had marked
antioxidant properties. These traditional spices do not simply mask the rancid off-flavors,
but rather have antioxidant effects.
References
Al-Jalay B, Blank G, McConnell B, Al-Khayat M. 1987. Antioxidant activity of selected
spices used in fermented meat sausage. J Food Prot 50:25-7.
Baron CP, Andersen HJ. 2002. Myoglobin induced lipid oxidation- a review. J Agric
Food Chem 50:3887-97.
Buege JA, Aust SD. 1978. Microsomal lipid peroxidation. Meth Enzymol 52:302-4.
Chipault JR, Mizuna GR, Hawkins JM, Lundberg WO. 1952. The antioxidant properties
of natural spices. Food Res 17:47-55.
146 Chipault JR, Mizuna GR, Hawkins JM, Lundberg WO. 1955. The antioxidant
properties of spices in foods. Food Technol 10:209-11.
Cornforth DP, West EM. 2002. Evaluation of the antioxidant effects of dried milk
mineral in cooked beef, pork, and poultry. J Food Sci 67(2):615-8.
Craig JW. 1999. Health- promoting properties of common herbs. Am J Clin Nutr 70:
491S-9S.
Garcia S, Iracheta F, Galvan F, Heredia N. 2001. Microbiological survey ofretail herbs
and spices from Mexican markets. J Food Prot 64(1):99-103.
Guynot ME, Ramos AJ, Seto 1, Puroy , P, Sanchis V, Marin S. 2003. Antifungal activity
of volatile compounds generated by essential oils against fungi commonly causing
deterioration of bakery products. J Appl Microbial 94(5):893-9.
Jawahar AT, Balasundari S, Indra JG, Jeyachandran, P. 1994. Influence of antioxidants
on the sensory quality and oxidative rancidity of frozen edible oyster. J Food Sci
Technol India 31(2):168-70.
Jayasingh P, Cornforth DP. 2003. Comparison of antioxidant effects of milk mineral,
butylated hydroxytoluene and sodium tripolyphosphate in raw and cooked ground
pork. Meat Sci 66:83-9.
Jayathikalan K, Vasundhara TS, Kumudavally, KV.1997. Effect of spices and Maillard
reaction products on rancidity development in precooked refrigerated meat. J
Food Sci Technol India 34(2): 128-31.
Jimenez A, Romojaro F, Gomez JM, Llanos MR, Sevilla F. 2003. Antioxidant systems
and their relationship with the response of pepper fruits to storage at 20°C. J
Agric Food Chem 51(21): 6293-9.
147 Joseph J, George C, Peri green PA. 1992. Effect of spices on improving the stability
of frozen stored fish mince. Fishery Technol 29(1):30-4.
Jurdi-Haldeman D, MacNeil JH, Yared DM. 1987. Antioxidant activity of onion and
garlic juices in stored cooked ground lamb. J Food Prot 50:411-3.
Keller JD, Kinsella JE .1973. Phospholipid changes and lipid oxidation during cooking
and frozen storage of raw ground beef. J Food Sci 38: 1200-4.
Lee KG, Shibamoto, T. 2002. Determination of Antioxidant potential of volatile extracts
isolated from various herbs and spices. J Agric Food Chem 50(17) : 4947-52.
Lee KG, Shibamoto, T. 2001. Antioxidant property of aroma extract isolated from clove
buds [Syzygium aromaticum (L) Merr. Et Perry]. Food Chem 74:443-8 .
Love JD and Pearson AM. 1974. Metmyoglobin and non-heme iron as proxidants in
cooked meat. J Agric Food Chem 22(6): 1032-4.
Maillard MN, Soum MH, Boivin P, Bers et C. 1996. Antioxidant activity of barley and
malt - Relationship with phenolic content. Lesbensm Wissen 29:238-4.
McDonald RE and Hultin HO. 1987. Some characteristics of enzymic lipid peroxidation
systems in the microsomal fraction of flounder muscle. J Food Sci 52:15-21, 27.
Messer JW, Peeler JT, Gilchrist JE. 1978. Aerobic plate count. In: FDA Bacteriological
analytical manual. 5th ed. Ch. 4. Washington, D.C.: AOAC. p 1-10.
Mira J, Sang SO, Kwang OK. 2000. Effects of levels of flavoring materials on the
sensory properties of chicken feet jokpyun (Korean traditional gel type food).
Korean J Food Sci Technol 32(6):1306-12.
148 Murcia AM, Egea I, Romojaro F, Parras P, Jimenez AM and Martinez-Tome M.
2004. Antioxidant evaluation in dessert spices compared with common food
additives. Influence of irradiation procedure. J Agric Food Chem 52(7):1872-81.
Namiki M. 1990. Antioxidants/ antimutagens in foods. Crit Rev Food Sci Nutr 29:273-
300.
Needham J, Wang L. 1956. Science and Civilization in China, Vol. 2. London:
Cambridge Univ. Press. p 262-3.
Oktay M, Gulr;in I, Kufrevioglu OI. 2003. Determination of in vitro antioxidant activity
of fennel (Foeniculum vulgare) seed extracts . Lebens Wissen 36:263-71.
Ozkan G, Sagdic 0, Ozcan M. 2003. Inhibition of pathogenic bacteria by essential oils at
different concentrations. Food Sci Technol Int 9(2):85-88 .
Parejo I, Viladomat F, Bastida J, Schmeda-Hirschmann G, Burillo J, Codina C. 2004 .
Bioguided isolation and identification of the nonvolatile antioxidant compounds
from Fennel (Foeniculum vulgare Mill.) waste. J Agric Food Chem 52(7): 1890-7.
Reeder BJ, Wilson MT. 2001. The effects of pH on the mechanism of hydrogen peroxide
and lipid hydroperoxide consumption by myoglobin: a role for the protonated
ferryl species. Free Rad Biol Med 30(11):1311-18.
Richards MP, Hultin HO. 2002. Contributions of blood and blood components to lipid
oxidation in fish muscle. J Agric Food Chem 50:555-64.
Sato K, Hegarty GR.1971. Warmed-over flavor in cooked meats. J Food Sci 36: 1098-
102.
Shahidi F, Janitha PK, Wanasundara PD. 1992. Phenolic antioxidants. Crit Rev Food Sci
Nutr 32 :67-103.
149 Sinnhuber RO, Yu TC. 1958. 2- Thiobarbituric acid method for the measurement of
rancidity in fishery products. II. The quantitative determination of malonaldehyde.
Food Technol 12(1):9-12.
Tarladgis BG, Watts BM, Younathan MT, Dugan L. 1960. A distillation method for the
quantitative determina6on of malonaldehyde in rancid foods. J Am Oil Chem Soc
37:44-8.
Tims MJ, Watts BM. 1958. Protection of cooked meats with phosphates. Food Technol
12:240-3.
Tiprisukond N, Fernando LN, Clarke AD. 1998. Antioxidant effects of essential oil and
oleoresin of black pepper from supercritical carbon dioxide extractions in ground
pork. J Agric Food Chem 46(10):4329-33.
Tzu YW, Ming TC, Deng CL, Shiu LG. 1997. Effect of procedure, spice, herb and anka
rice on the quality of Chinese marinated and spiced pork shank. J Chinese Soc
Animal Sci 26(2):211-22.
Ying RY, Ming TC, Deng CL. 1998. A study of antioxidative and antibacterial effects of
different spices in Chinese-style sausage. J Chinese Soc Animal Sci 27(1):117-28.
Younathan MT, Marjan ZM, Arshad FB. 1980. Oxidative rancidity in stored ground
turkey and beef. J Food Sci 45:274-5.
Yuste J and Fung DYC. 2002. Inactivation of Listeria monocytogenes Scott A 49594 in
apple juice supplemented with cinnamon. J Food Prot 65(10): 1663-6.
APPENDIXB
DATA FOR CHAPTER 3
150
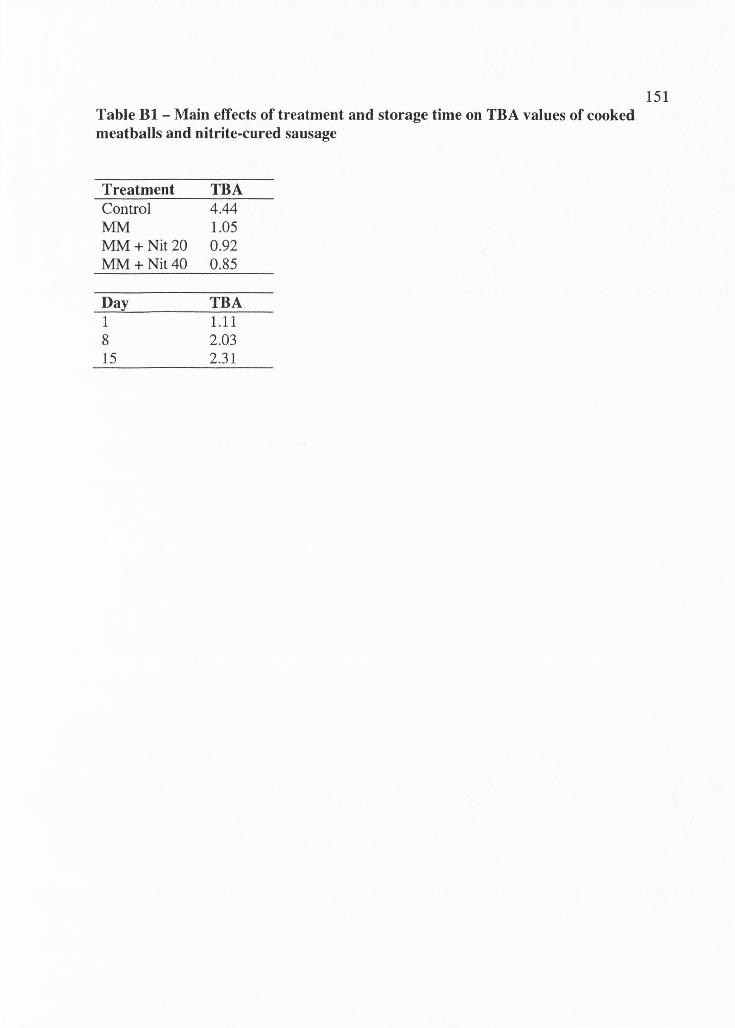
Table Bl - Main effects of treatment and storage time on TBA values of cooked meatballs and nitrite-cured sausage
Treatment TBA Control 4.44 MM 1.05 MM+ Nit 20 0.92 MM+ Nit40 0.85
Day TBA 1 1.11 8 2.03 15 2.31
151
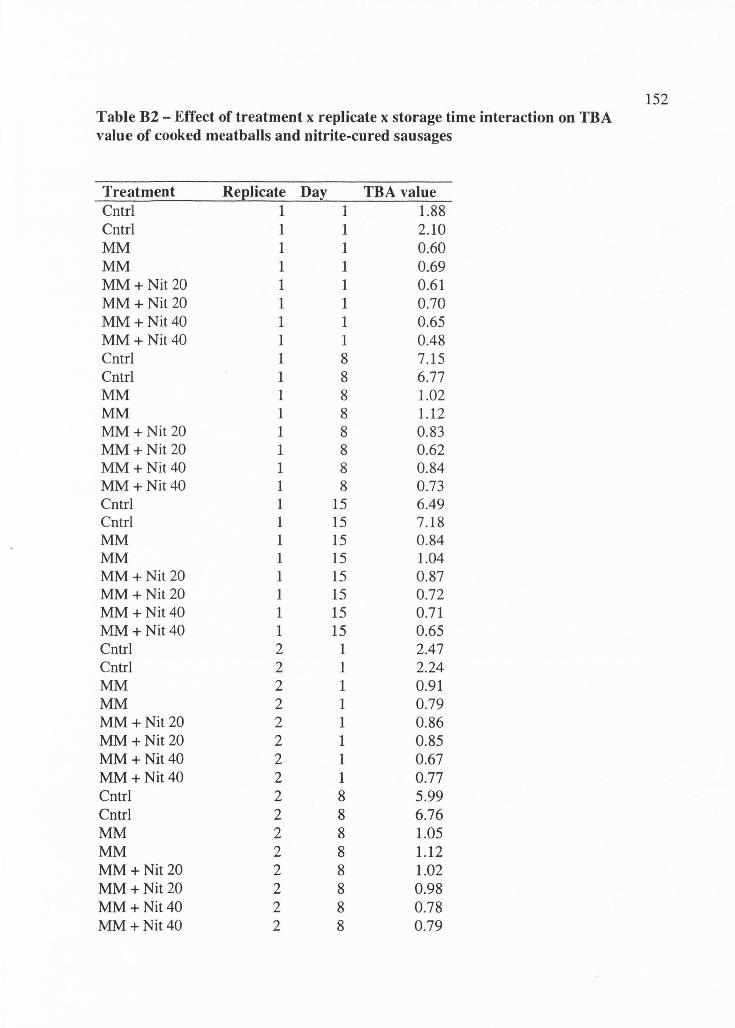
Table B2 - Effect of treatment x replicate x storage time interaction on TBA value of cooked meatballs and nitrite-cured sausages
Treatment Reelicate Day TBA value Cntrl 1 1 1.88 Cntrl 1 1 2.10 MM 1 1 0.60 MM 1 1 0.69 MM+ Nit 20 1 1 0.61 MM+ Nit 20 1 1 0.70 MM+ Nit 40 1 1 0.65 MM +Nit40 1 1 0.48 Cntrl 1 8 7.15 Cntrl 1 8 6.77 MM 1 8 1.02 MM 1 8 1.12 MM+ Nit 20 1 8 0.83 MM+Nit20 1 8 0.62 MM+ Nit40 1 8 0.84 MM +Nit40 1 8 0.73 Cntrl 1 15 6.49 Cntrl 1 15 7.18 MM 1 15 0.84 MM 1 15 1.04 MM+ Nit 20 1 15 0.87 MM+Nit20 1 15 0.72 MM+Nit40 1 15 0.71 MM+ Nit40 1 15 0.65 Cntrl 2 1 2.47 Cntrl 2 1 2.24 MM 2 1 0.91 MM 2 1 0.79 MM+Nit20 2 1 0.86 MM +Nit 20 2 1 0.85 MM+ Nit40 2 1 0.67 MM +Nit40 2 1 0.77 Cntrl 2 8 5.99 Cntrl 2 8 6.76 MM 2 8 1.05 MM 2 8 1.12 MM +Nit20 2 8 1.02 MM +Nit20 2 8 0.98 MM+ Nit40 2 8 0.78 MM+ Nit40 2 8 0.79
152
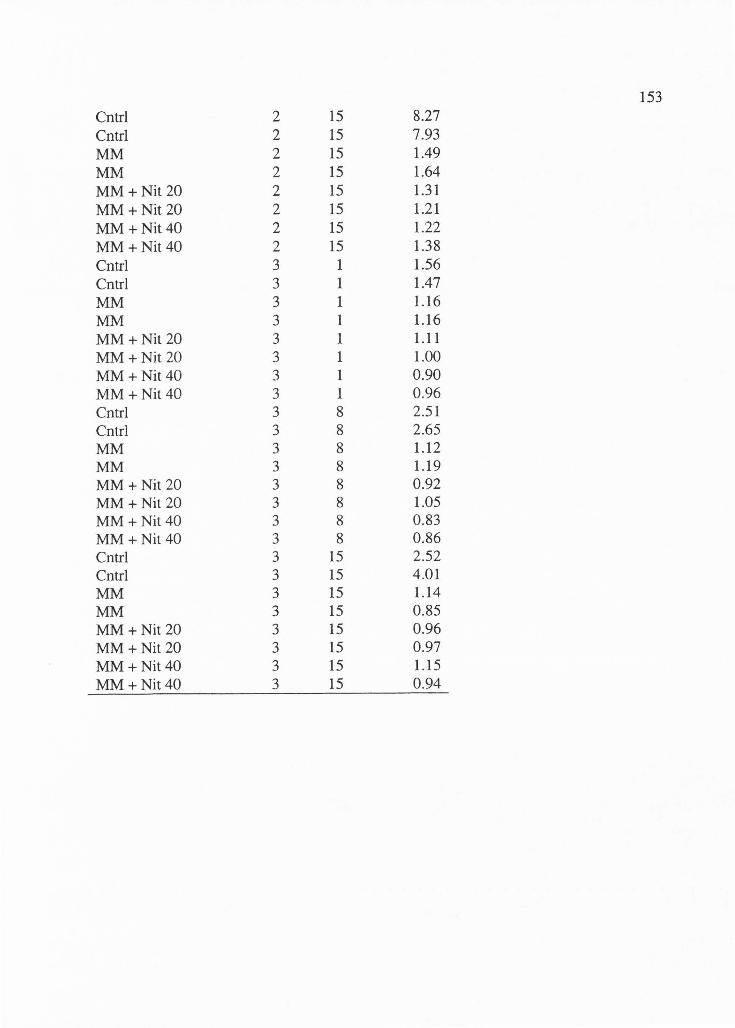
153 Cntrl 2 15 8.27 Cntrl 2 15 7.93 MM 2 15 1.49 MM 2 15 1.64 MM+ Nit 20 2 15 1.31 MM+Nit20 2 15 1.21 MM+ Nit40 2 15 1.22 MM+ Nit40 2 15 1.38 Cntrl 3 1 1.56 Cntrl 3 1 1.47 MM 3 1 1.16 MM 3 1 1.16 MM+ Nit 20 3 1 1.11 MM+ Nit 20 3 1 1.00 MM+ Nit 40 3 1 0.90 MM+ Nit 40 3 1 0.96 Cntrl 3 8 2.51 Cntrl 3 8 2.65 MM 3 8 1.12 MM 3 8 1.19 MM+ Nit 20 3 8 0.92 MM+ Nit 20 3 8 1.05 MM+Nit40 3 8 0.83 MM+ Nit40 3 8 0.86 Cntrl 3 15 2.52 Cntrl 3 15 4.01 MM 3 15 1.14 MM 3 15 0.85 MM+ Nit 20 3 15 0.96 MM+ Nit 20 3 15 0.97 MM+ Nit40 3 15 1.15 MM+ Nit40 3 15 0.94
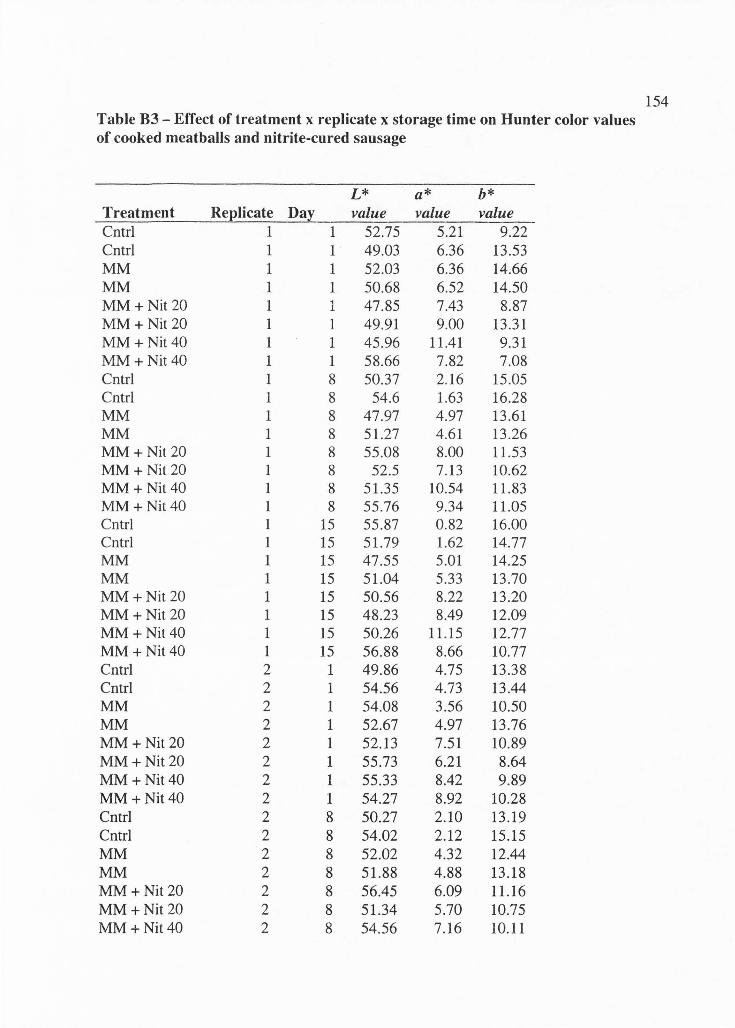
Table B3 - Effect of treatment x replicate x storage time on Hunter color values of cooked meatballs and nitrite-cured sausage
L* a* b* Treatment Re~licate Dar value value value Cntrl 1 1 52.75 5.21 9.22 Cntrl 1 1 49.03 6.36 13.53 MM 1 1 52.03 6.36 14.66 MM 1 1 50.68 6.52 14.50 MM+ Nit 20 1 1 47.85 7.43 8.87 MM+ Nit 20 1 1 49.91 9.00 13.31 MM+ Nit40 1 1 45.96 11.41 9.31 MM+ Nit40 1 1 58.66 7.82 7.08 Cntrl 1 8 50.37 2.16 15.05 Cntrl 1 8 54.6 1.63 16.28 MM 1 8 47.97 4.97 13.61 MM 1 8 51.27 4.61 13.26 MM+Nit20 1 8 55.08 8.00 11.53 MM+ Nit 20 1 8 52.5 7.13 10.62 MM+ Nit40 1 8 51.35 10.54 11.83 MM+ Nit40 1 8 55.76 9.34 11.05 Cntrl 1 15 55.87 0.82 16.00 Cntrl 1 15 51.79 1.62 14.77 MM 1 15 47.55 5.01 14.25 MM 1 15 51.04 5.33 13.70 MM +Nit 20 1 15 50.56 8.22 13.20 MM+ Nit 20 1 15 48.23 8.49 12.09 MM+ Nit40 1 15 50.26 11.15 12.77 MM+ Nit40 1 15 56.88 8.66 10.77 Cntrl 2 1 49.86 4.75 13.38 Cntrl 2 1 54.56 4.73 13.44 MM 2 1 54.08 3.56 10.50 MM 2 1 52.67 4.97 13.76 MM+Nit20 2 1 52.13 7.51 10.89 MM+Nit20 2 1 55.73 6.21 8.64 MM+ Nit40 2 1 55.33 8.42 9.89 MM +Nit40 2 1 54.27 8.92 10.28 Cntrl 2 8 50.27 2.10 13.19 Cntrl 2 8 54.02 2.12 15.15 MM 2 8 52.02 4.32 12.44 MM 2 8 51.88 4.88 13.18 MM+ Nit20 2 8 56.45 6.09 11.16 MM+ Nit20 2 8 51.34 5.70 10.75 MM+Nit40 2 8 54.56 7.16 10.11
154
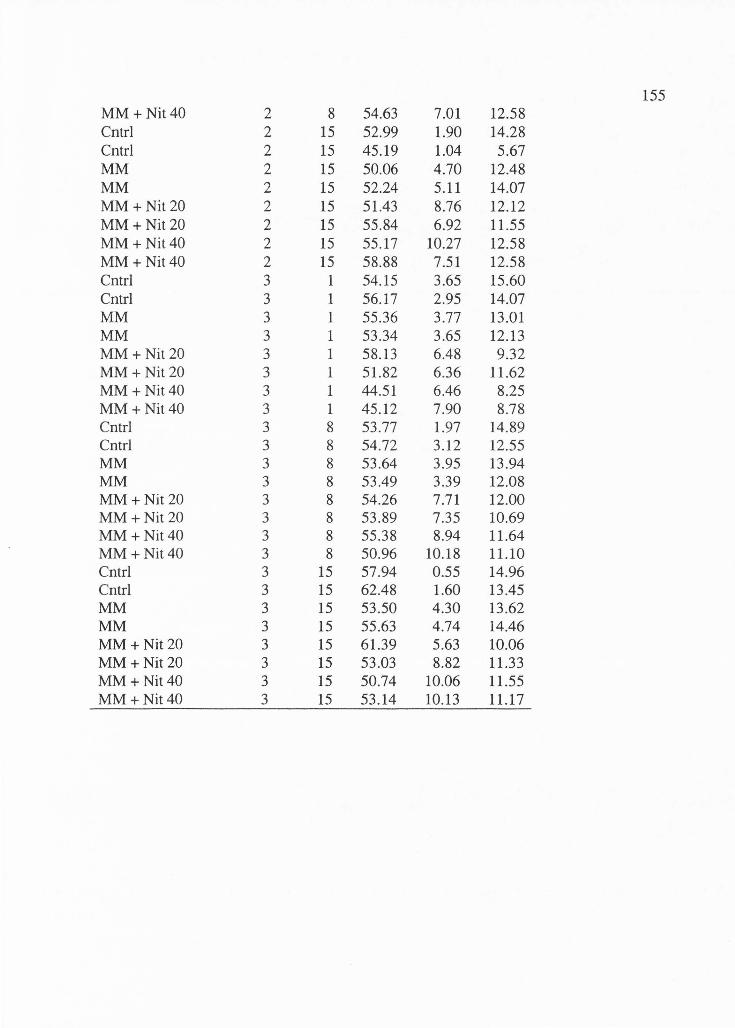
155 MM +Nit40 2 8 54.63 7.01 12.58 Cntrl 2 15 52.99 1.90 14.28 Cntrl 2 15 45.19 1.04 5.67 MM 2 15 50.06 4.70 12.48 MM 2 15 52.24 5.11 14.07 MM+ Nit20 2 15 51.43 8.76 12.12 MM+ Nit 20 2 15 55.84 6.92 11.55 MM+ Nit40 2 15 55.17 10.27 12.58 MM +Nit40 2 15 58.88 7.51 12.58 Cntrl 3 1 54.15 3.65 15.60 Cntrl 3 1 56.17 2.95 14.07 MM 3 1 55.36 3.77 13.01 MM 3 1 53.34 3.65 12.13 MM+ Nit 20 3 1 58.13 6.48 9.32 MM+ Nit 20 3 1 51.82 6.36 11.62 MM+ Nit40 3 1 44.51 6.46 8.25 MM+ Nit40 3 1 45.12 7.90 8.78 Cntrl 3 8 53.77 1.97 14.89 Cntrl 3 8 54.72 3.12 12.55 MM 3 8 53.64 3.95 13.94 MM 3 8 53.49 3.39 12.08 MM+ Nit20 3 8 54.26 7.71 12.00 MM+Nit20 3 8 53.89 7.35 10.69 MM+ Nit40 3 8 55.38 8.94 11.64 MM+ Nit40 3 8 50.96 10.18 11.10 Cntrl 3 15 57.94 0.55 14.96 Cntrl 3 15 62.48 1.60 13.45 MM 3 15 53.50 4.30 13.62 MM 3 15 55.63 4.74 14.46 MM+ Nit20 3 15 61.39 5.63 10.06 MM+ Nit20 3 15 53.03 8.82 11.33 MM+ Nit40 3 15 50.74 10.06 11.55 MM +Nit40 3 15 53.14 10.13 11.17
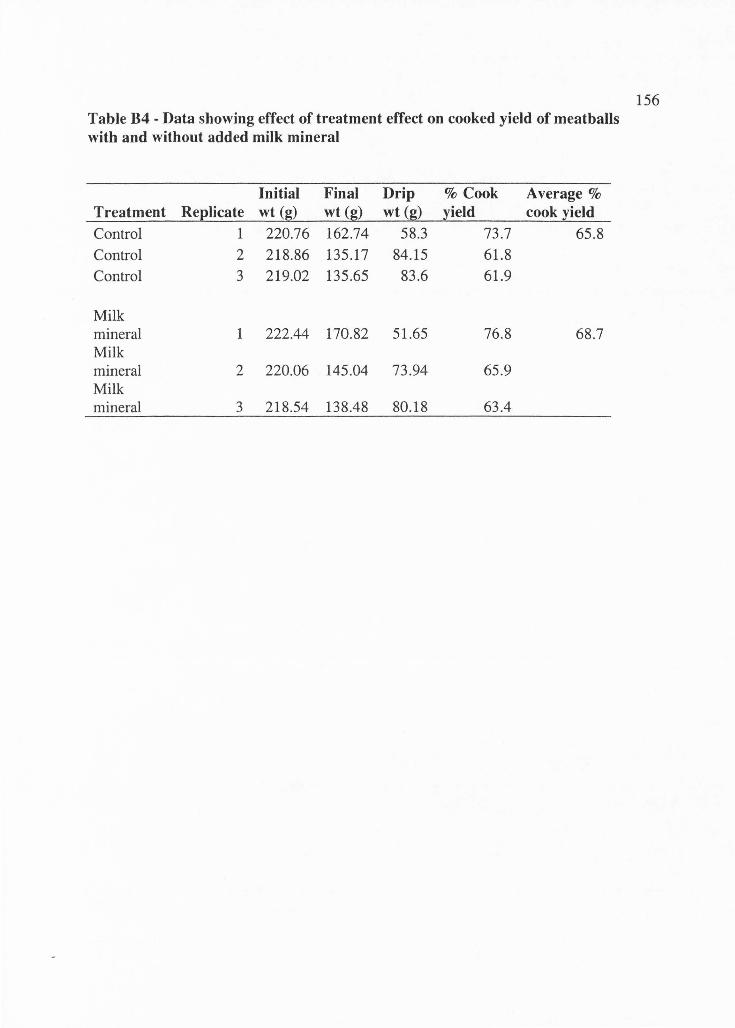
Table B4 - Data showing effect of treatment effect on cooked yield of meatballs with and without added milk mineral
Initial Final Drip % Cook Average% Treatment Reelicate wt (g) wt (g) wt (g) ~ield cook yield Control 1 220.76 162.74 58.3 73.7 65.8
Control 2 218.86 135.17 84.15 61.8
Control 3 219.02 135.65 83.6 61.9
Milk mineral 1 222.44 170.82 51.65 76.8 68 .7 Milk mineral 2 220.06 145.04 73.94 65.9 Milk mineral 3 218 .54 138.48 80.18 63.4
156
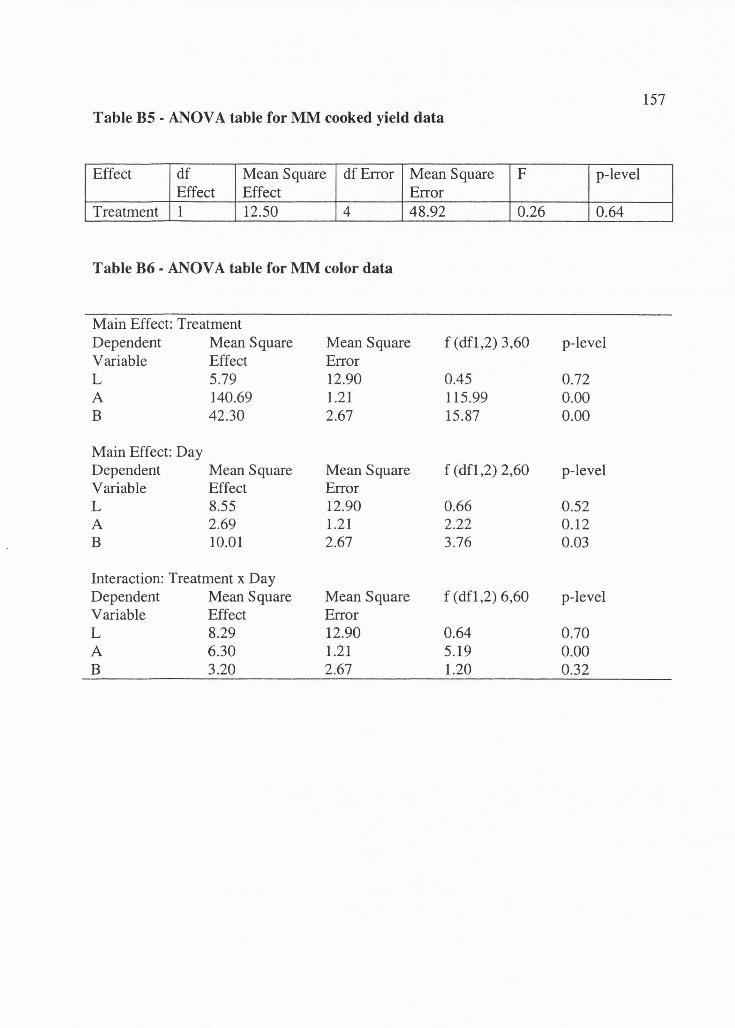
157 Table BS - ANOV A table for MM cooked yield data
Effect df Mean Square df Error Mean Square F p-level Effect Effect Error
Treatment 1 12.50 4 48.92 0.26 0.64
Table B6 - ANOV A table for MM color data
Main Effect: Treatment Dependent Mean Square Mean Square f (dfl,2) 3,60 p-level Variable Effect Error L 5.79 12.90 0.45 0.72 A 140.69 1.21 115.99 0.00 B 42.30 2.67 15.87 0.00
Main Effect: Day Dependent Mean Square Mean Square f (dfl ,2) 2,60 p-level Variable Effect Error L 8.55 12.90 0.66 0.52 A 2.69 1.21 2.22 0.12 B 10.01 2.67 3.76 0.03
Interaction: Treatment x Day Dependent Mean Square Mean Square f (dfl,2) 6,60 p-level Variable Effect Error L 8.29 12.90 0.64 0.70 A 6.30 1.21 5.19 0.00 B 3.20 2.67 1.20 0.32
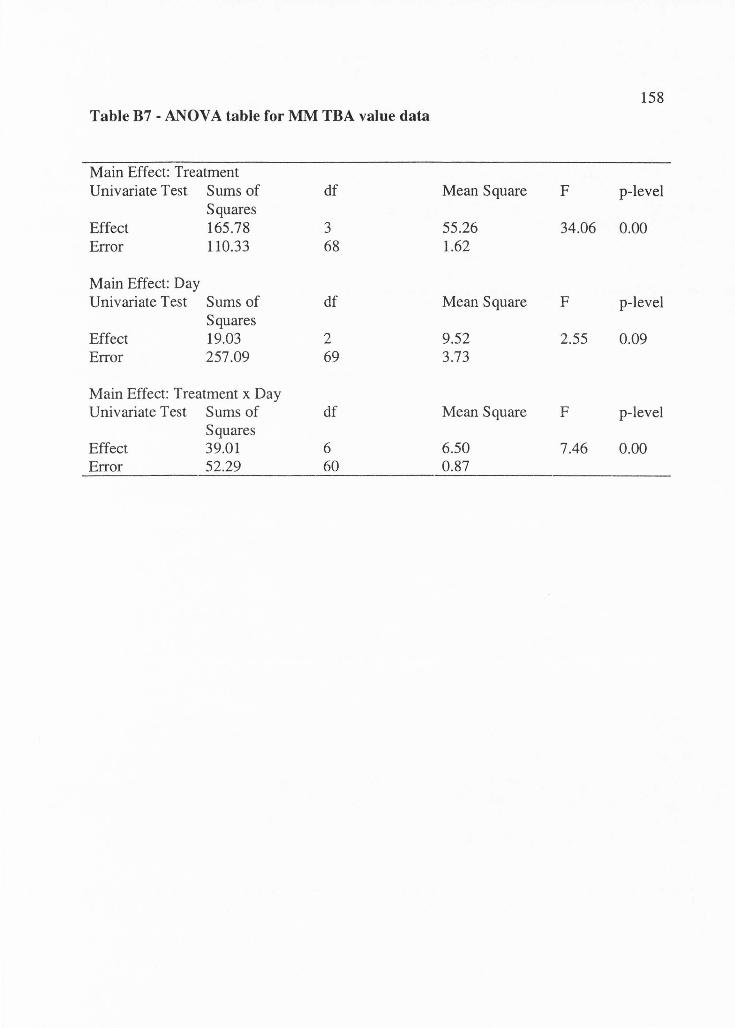
158 Table B7 - ANOV A table for MM TBA value data
Main Effect: Treatment Univariate Test Sums of df Mean Square F p-level
Squares Effect 165.78 3 55.26 34.06 0.00 Error 110.33 68 1.62
Main Effect: Day Univariate Test Sums of df Mean Square F p-level
Squares Effect 19.03 2 9.52 2.55 0.09 Error 257.09 69 3.73
Main Effect: Treatment x Day Univariate Test Sums of df Mean Square F p-level
Squares Effect 39.01 6 6.50 7.46 0.00 Error 52.29 60 0.87
159
APPENDIXC
DAT A FOR CHAPTER 4
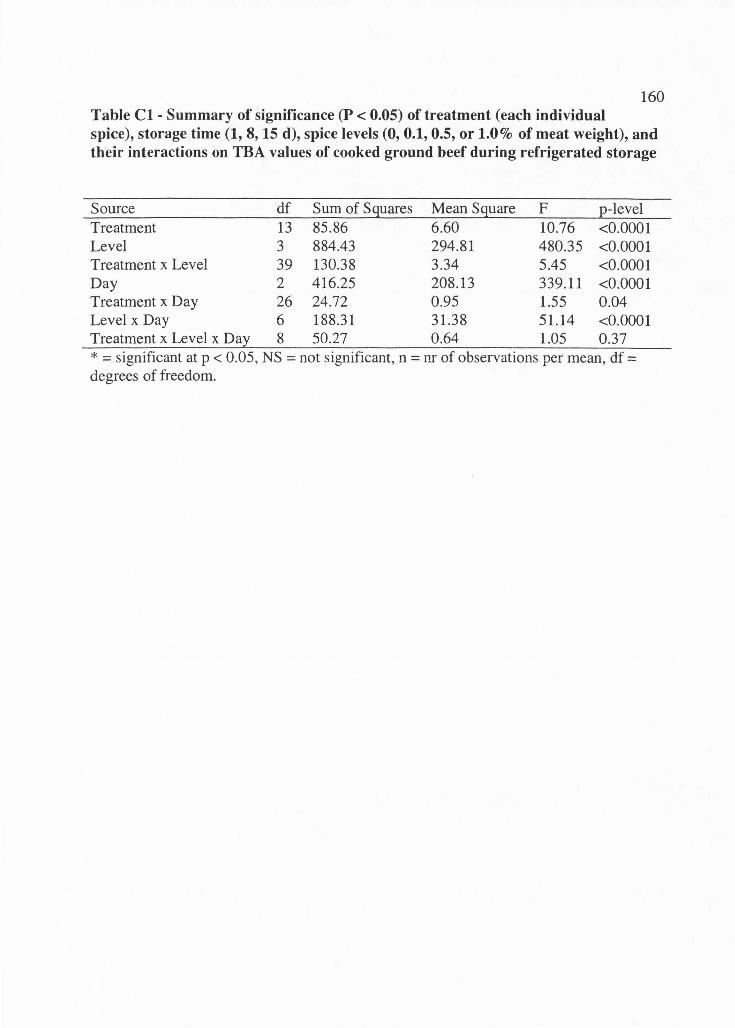
160 Table Cl - Summary of significance (P < 0.05) of treatment (each individual spice), storage time (1, 8, 15 d), spice levels (0, 0.1, 0.5, or 1.0% of meat weight), and their interactions on TBA values of cooked ground beef during refrigerated storage
Source df Sum of Squares Mean Square F p-level Treatment 13 85.86 6.60 10.76 <0.0001 Level 3 884.43 294.81 480.35 <0.0001 Treatment x Level 39 130.38 3.34 5.45 <0.0001 Day 2 416.25 208.13 339.11 <0.0001 Treatment x Day 26 24.72 0.95 1.55 0.04 Level x Day 6 188.31 31.38 51.14 <0.0001 Treatment x Level x Day 8 50.27 0.64 1.05 0.37 * = significant at p < 0.05, NS = not significant, n = nr of observations per mean, df = degrees of freedom.
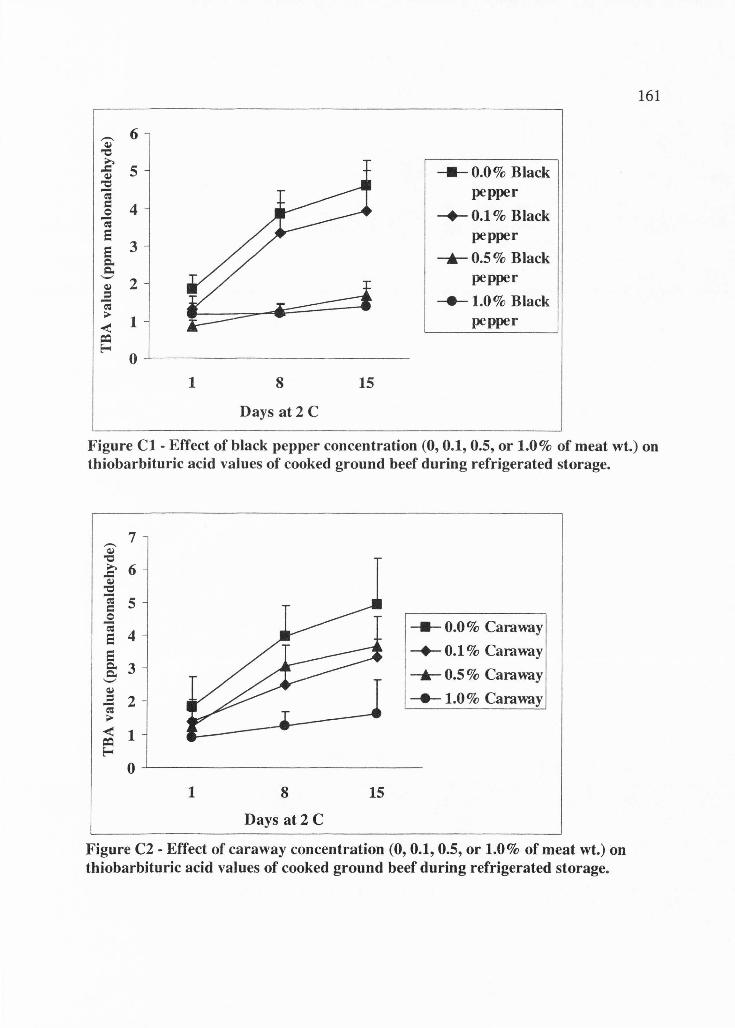
161
- 6 ~
"C ...... .c 5 -a-0.0% Black ~ "C -; pepper C 4 0 -+--0.1 % Black -; s pepper s 3
-.-0.5% Black Q. C.
'-' 2 pepper
~ = -e-1.0% Black -; ~
1 pepper < = E--< 0
1 8 15
Days at2 C
Figure Cl - Effect of black pepper concentration (0, 0.1, 0.5, or 1.0% of meat wt.) on thiobarbituric acid values of cooked ground beef during refrigerated storage.
7 -~ "C ...... 6 .c ~
"C -; 5 C 0 -;
4 -a- 0.0 % Caraway s
5 -+--0.1 % Caraway Q. 3 -.- 0.5 % Caraway Q.
'-' ~ -e- 1.0 % Caraway = 2 -; ~
< 1 = E--<
0
1 8 15
Days at2 C
Figure C2 - Effect of caraway concentration (0, 0.1, 0.5, or 1.0% of meat wt.) on thiobarbituric acid values of cooked ground beef during refrigerated storage.
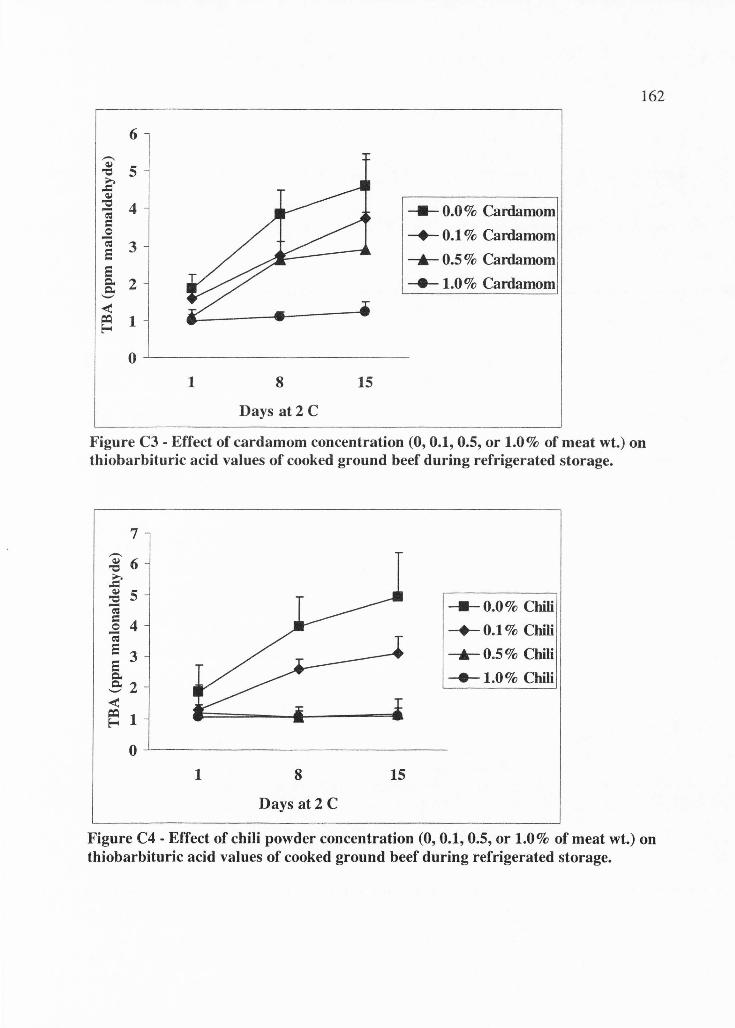
6
-~ 5 "0 ..., .c ~
"Cl 4 ca = 0 -= 3 s s Q. 2 Q.
'-'
< ~ 1 E--
0
1 8
Days at2 C
15
--- 0.0 % Cardamom
-+--0.1 % Cardamom
~ 0.5 % Cardamom
---e-1.0% Cardamom
162
Figure C3 · Effect of cardamom concentration (0, 0.1, 0.5, or 1.0% of meat wt. ) on thiobarbituric acid values of cooked ground beef during refrigerated storage.
7
1 8
Days at2 C
15
--- 0.0 % Chili -+--0.1 % Chili
~0.5% Chili
-e--1.0% Chili
Figure C4 • Effect of chili powder concentration (0, 0.1, 0.5, or 1.0% of meat wt.) on thiobarbituric acid values of cooked ground beef during refrigerated storage.
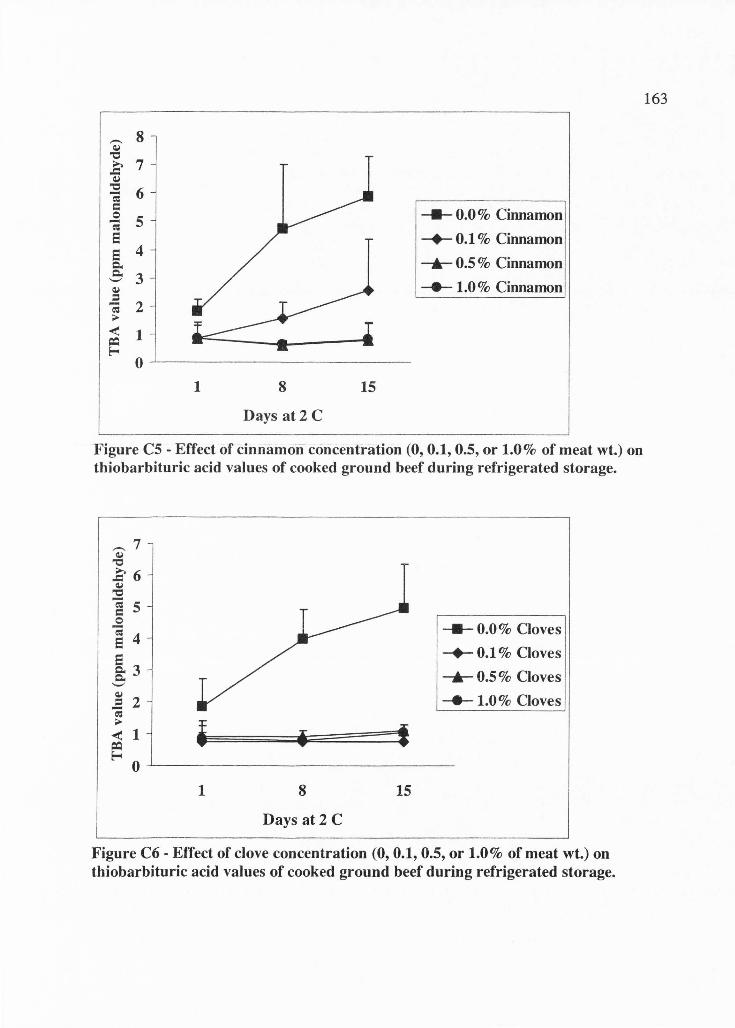
- 8 ~
"0 ..... 7 .c: ~
"0 6 -; C -a- 0.0% Cinnamon 0 5 -; e -+- 0.1 % Cinnamon e 4 Q. _....,_ 0.5 % Cinnamon Q.
3 '-' -1.0% Cinnamon ~ = -; 2
;;,.
< 1 ~ E--
0
1 8 15
Days at2 C
Figure CS - Effect of cinnamon concentration (0, 0.1, 0.5, or 1.0% of meat wt.) on thiobarbituric acid values of cooked ground beef during refrigerated storage.
• • t
-a- 0.0 % Cloves
-+- 0.1 % Cloves
_....,_ 0.5 % Cloves
-1.0% Cloves
o ~- ---- - ----- ---- -1 8
Days at 2 C
15
Figure C6 - Effect of clove concentration (0, 0.1, 0.5, or 1.0% of meat wt.) on thiobarbituric acid values of cooked ground beef during refrigerated storage.
163
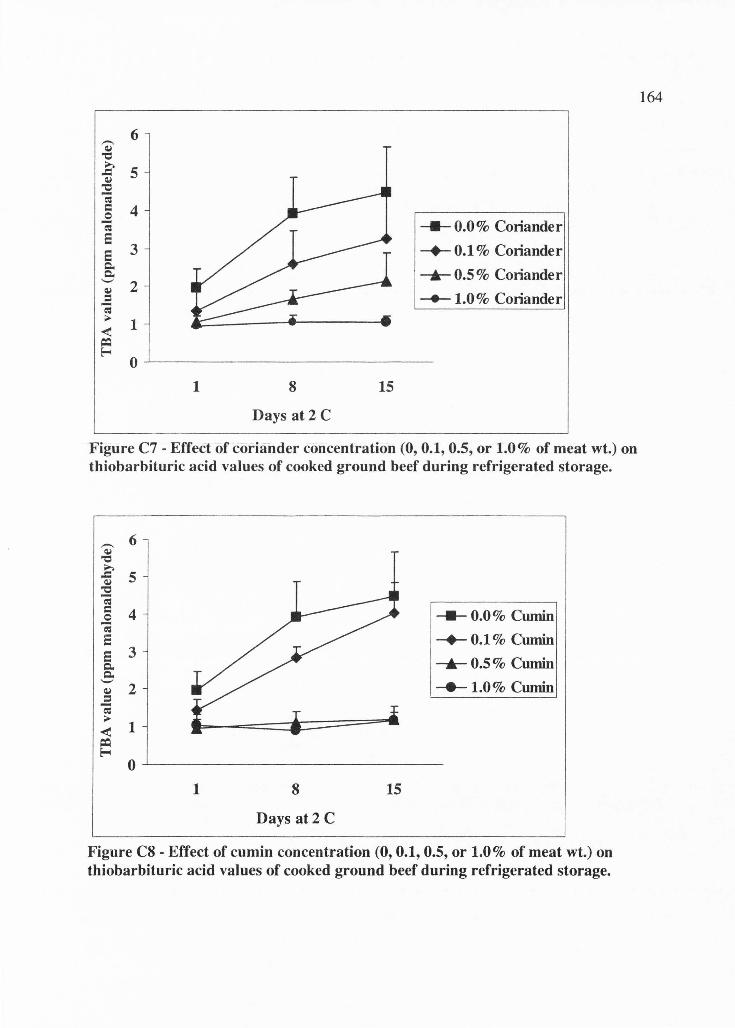
6 ,-._ ~
"0 >.
5 .c ~
"0 'i C 4 0 'i --11--0.0% Coriander s
3 s --+--0.1 % Coriander Q,
_._ 0.5 % Coriander Q, '-' 2 ~
.E ___._ 1.0% Coriander ~ ;>
1 < ~ E-<
0
1 8 15
Days at2 C
Figure C7 - Effect of coriander concentration (0, 0.1, 0.5, or 1.0 % of meat wt.) on thiobarbituric acid values of cooked ground beef during refrigerated storage.
,-._ 6 ~
"0 >. .c 5 ~ "0 'i C 4 -11-0.0% Cumin 0 'i s --+-- 0.1 % Cumin s 3
_._ 0.5 % Cumin Q, Q,
'-' ----1.0% Cumin ~ 2 = 'i ;>
1 < ~ ~
0
1 8 15
Days at2 C
Figure CS - Effect of cumin concentration (0, 0.1, 0.5, or 1.0% of meat wt.) on thiobarbituric acid values of cooked ground beef during refrigerated storage.
164
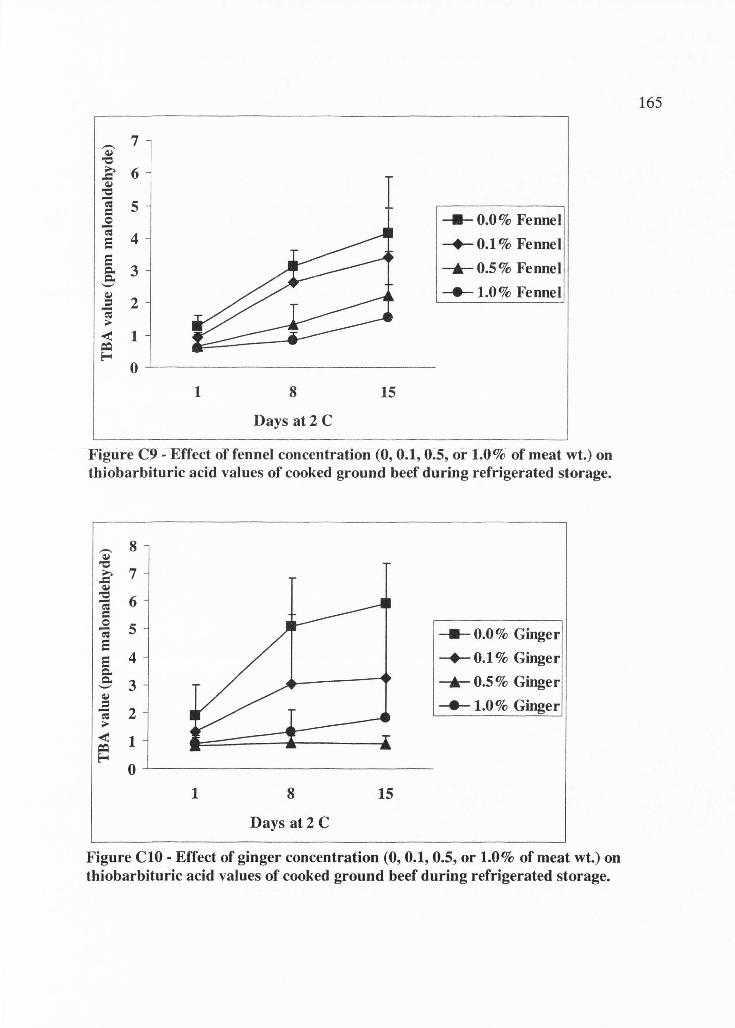
--7 QJ
"'O ...... 6 .c: QJ
"'O 'i 5 C 0 -a- 0.0% Fennel -cu
4 e -+- 0.1 % Fennel e
3 -.-o.5% Fennel Q. Q. ,_,
----1.0% Fennel QJ
2 = -cu ... < 1 =::i E--
0
1 8 15
Days at2 C
Figure C9 - Effect of fennel concentration (0, 0.1, 0.5, or 1.0% of meat wt.) on thiobarbituric acid values of cooked ground beef during refrigerated storage.
-- 8 QJ
"Cl
E 7 QJ
"Cl 6 -;
C 0
5 - -a-0.0% Ginger cu e e 4 -+- 0.1 % Ginger Q. Q.
3 _._ 0.5 % Ginger ,_, QJ
= ---- 1.0% Ginger 'i 2 ... < 1 =::i E--
0
1 8 15
Days at2 C
Figure ClO - Effect of ginger concentration (0, 0.1, 0.5, or 1.0% of meat wt.) on thiobarbituric acid values of cooked ground beef during refrigerated storage.
165
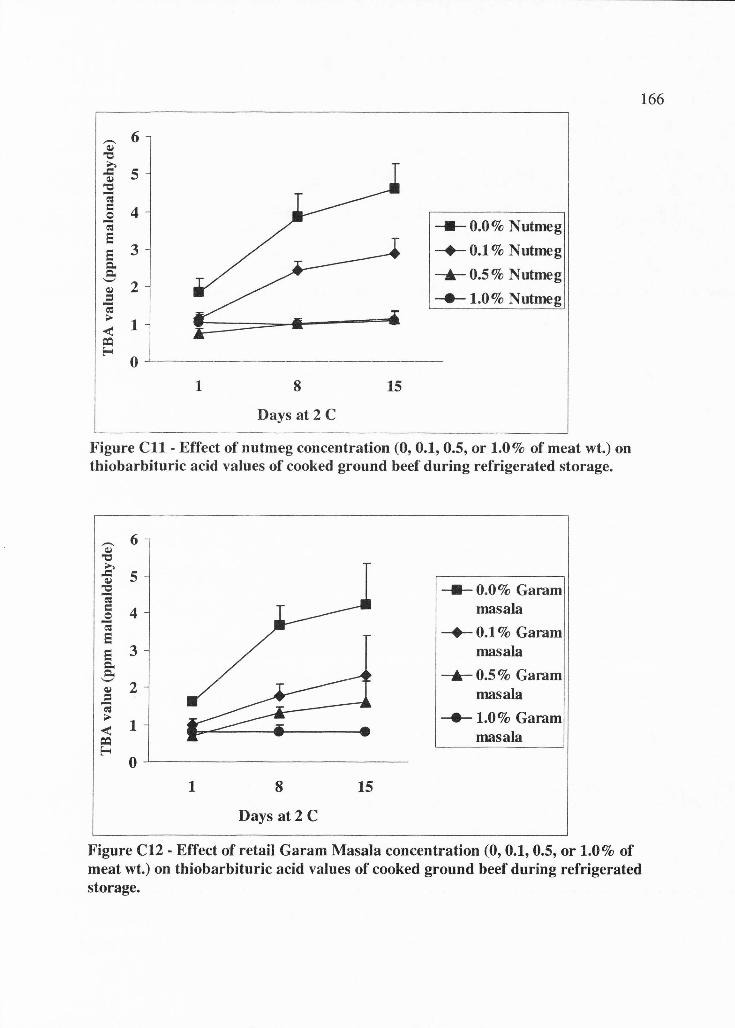
166
,__ 6 Q,I
"O .... .c 5 Q,I
::!:! ~ C: 4 0 -; ---0.0% Nutmeg s s 3 -+- 0.1 % Nutmeg Q..
-.-0.5%Nutmeg Q.. '-'
2 Q,I
_._1.0%Nutmeg = -; ... 1 <
~ ~
0
1 8 15
Days at 2 C
Figure CU - Effect of nutmeg concentration (0, 0.1, 0.5, or 1.0% of meat wt.) on thiobarbituric acid values of cooked ground beef during refrigerated storage.
,__ 6 Q,I
"O .... .c 5 Q,I "O --- 0.0% Garam -; C: 4 masala 0 -; -+- 0.1 % Garam s s 3 masala Q..
-.- 0.5 % Garam Q.. '-' Q,I 2 masala = -;
_._ 1.0% Garam ... 1 < masala ~
~ 0
1 8 15
Days at2 C
Figure C12 - Effect of retail Garam Masala concentration (0, 0.1, 0.5, or 1.0% of meat wt.) on thiobarbituric acid values of cooked ground beef during refrigerated storage.
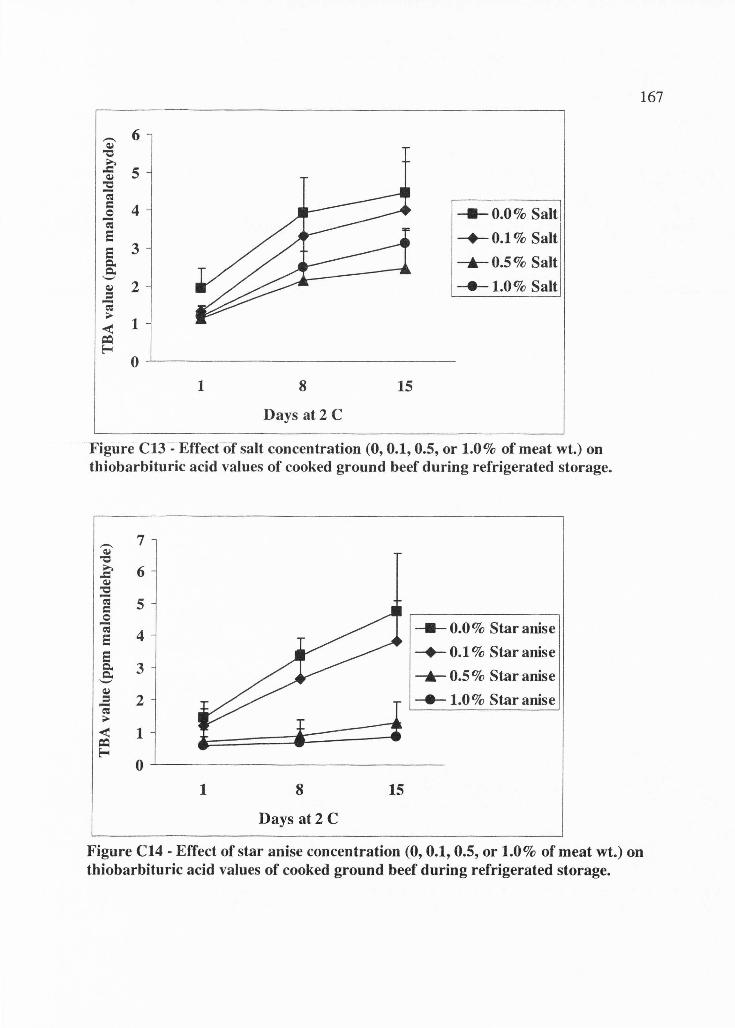
- 6 ~
"0 ..... -= 5 ~ "0 -; C 4 ---0.0% Salt ~ ~
s -+--0.1 % Salt s 3 C. --.-0.5% Salt C.
'-' --e- 1.0% Salt ~ 2 = -; i>
1 < ~ E--
0
1 8 15
Days at2 C
Figure C13 ~ Effect of salt concentration (0, 0.1, 0.5, or 1.0% of meat wt.) on thiobarbituric acid values of cooked ground beef during refrigerated storage.
- 7 ~
"0 ..... 6 -= ~ "0 -; 5 C 0 -;
4 --- 0.0% Star anise s s -+--0.1 % Star anise C. 3 --.- 0.5 % Star anise C.
'-' ~ --e- 1.0% Star anise = 2 -; i>
< ~
1 E--
0
1 8 15
Days at2 C
167
Figure C14 - Effect of star anise concentration (0, 0.1, 0.5, or 1.0% of meat wt.) on thiobarbituric acid values of cooked ground beef during refrigerated storage.
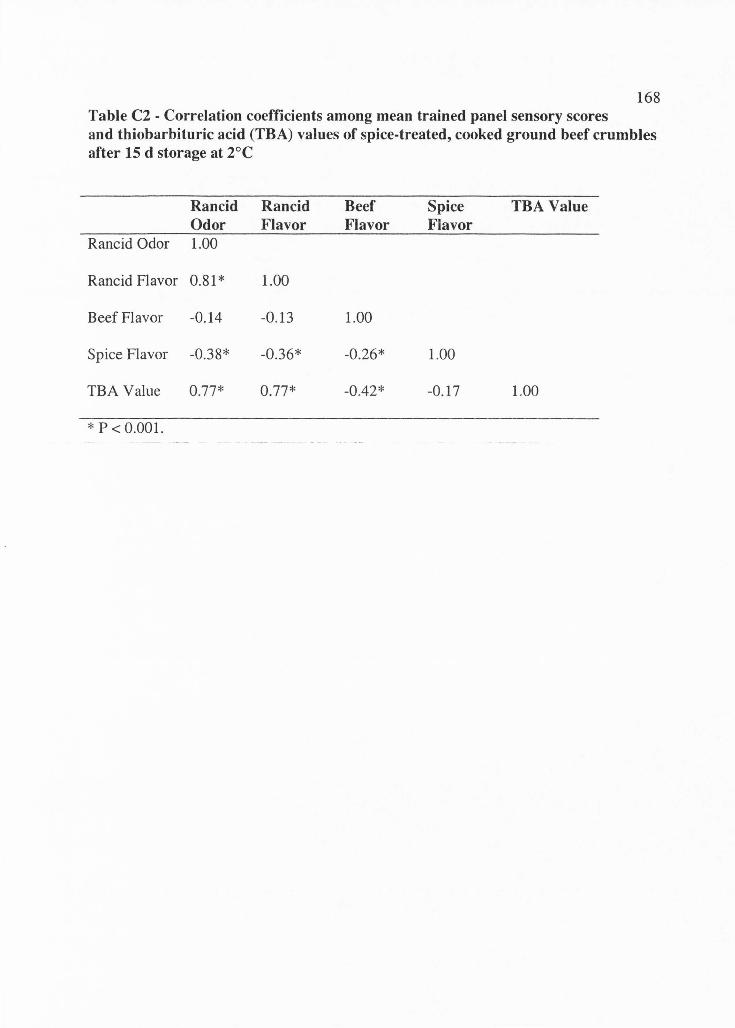
168 Table C2 · Correlation coefficients among mean trained panel sensory scores and thiobarbituric acid (TBA) values of spice-treated, cooked ground beef crumbles after 15 d storage at 2°C
Rancid Rancid Beef Spice TBA Value Odor Flavor Flavor Flavor
Rancid Odor 1.00
Rancid Flavor 0.81 * 1.00
Beef Flavor -0.14 -0 .13 1.00
Spice Flavor -0.38* -0 .36* -0.26 * 1.00
TBA Value 0.77* 0.77* -0.42 * -0.17 1.00
* P < 0.001.
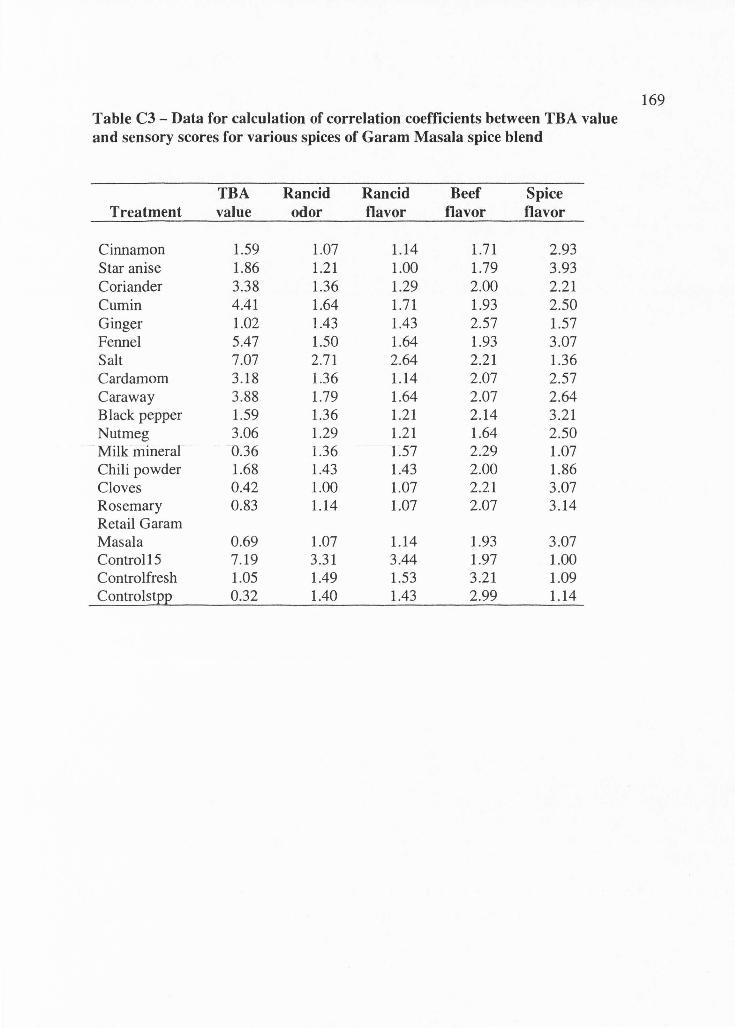
Table C3 - Data for calculation of correlation coefficients between TBA value and sensory scores for various spices of Garam Masala spice blend
TBA Rancid Rancid Beef Spice Treatment value odor flavor flavor flavor
Cinnamon 1.59 1.07 1.14 1.71 2.93 Star anise 1.86 1.21 1.00 1.79 3.93 Coriander 3.38 1.36 1.29 2.00 2.21 Cumin 4.41 1.64 1.71 1.93 2.50 Ginger 1.02 1.43 1.43 2.57 1.57 Fennel 5.47 1.50 1.64 1.93 3.07 Salt 7.07 2.71 2.64 2.21 1.36 Cardamom 3.18 1.36 1.14 2.07 2.57 Caraway 3.88 1.79 1.64 2.07 2.64 Black pepper 1.59 1.36 1.21 2.14 3.21 Nutmeg 3.06 1.29 1.21 1.64 2.50 Milk minerar 0.36 1.36 1.57 2.29 1.07 Chili powder 1.68 1.43 1.43 2.00 1.86 Cloves 0.42 1.00 1.07 2.21 3.07 Rosemary 0.83 1.14 1.07 2.07 3.14 Retail Garam Masala 0.69 1.07 1.14 1.93 3.07 Control15 7.19 3.31 3.44 1.97 1.00 Controlfresh 1.05 1.49 1.53 3.21 1.09 Controlst22 0.32 1.40 1.43 2.99 1.14
169
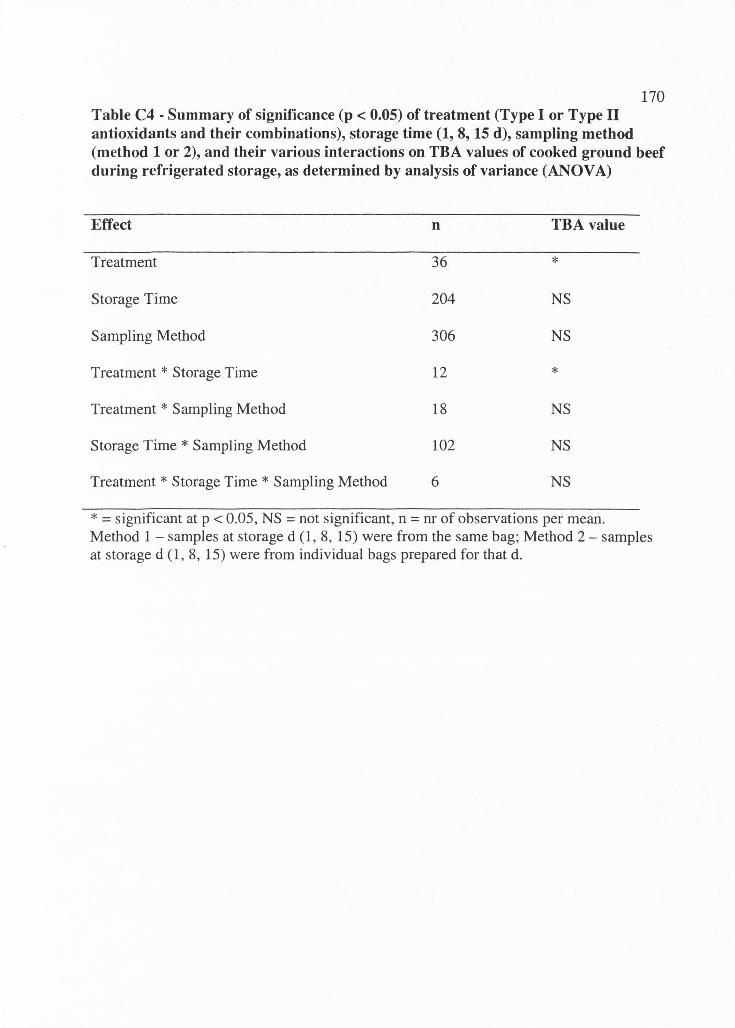
170 Table C4 · Summary of significance (p < 0.05) of treatment (Type I or Type II antioxidants and their combinations), storage time (1, 8, 15 d), sampling method (method 1 or 2), and their various interactions on TBA values of cooked ground beef during refrigerated storage, as determined by analysis of variance (ANOV A)
Effect n TBA value
Treatment 36 *
Storage Time 204 NS
Sampling Method 306 NS
Treatment * Storage Time 12 *
Treatment * Sampling Method 18 NS
Storage Time * Sampling Method 102 NS
Treatment * Storage Time * Sampling Method 6 NS
* = significant at p < 0.05, NS = not significant , n = nr of observation s per mean . Method 1 - samples at storage d (1 , 8, 15) were from the same bag; Method 2 - sample s at storage d (1 , 8, 15) were from individual bags prepared for that d.
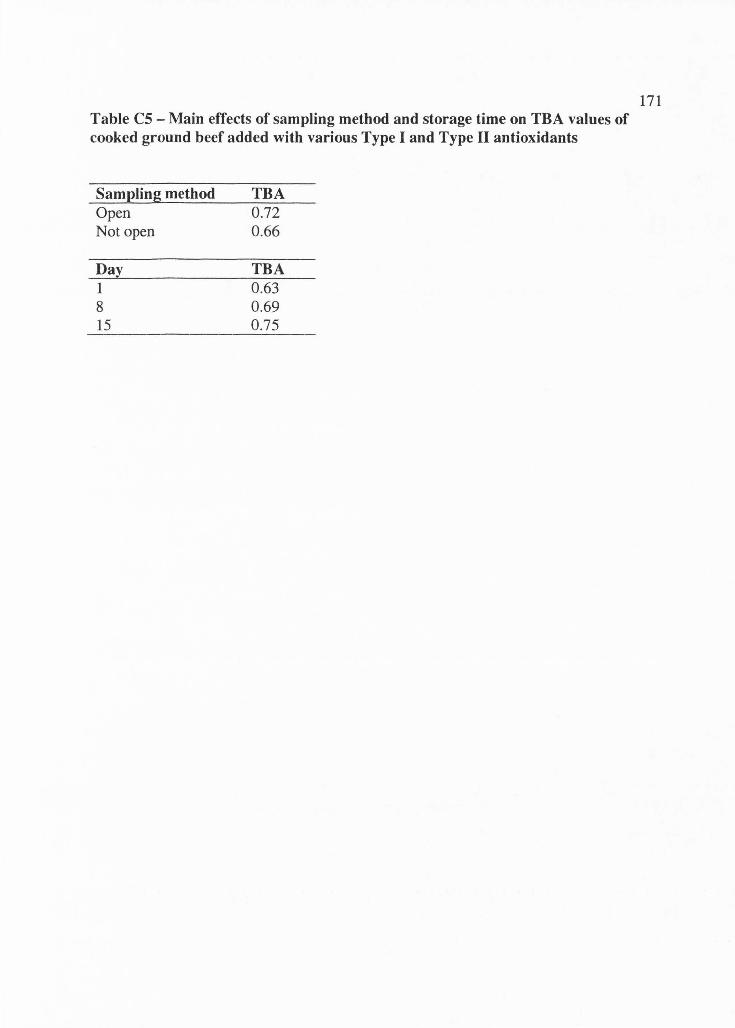
Table CS - Main effects of sampling method and storage time on TBA values of cooked ground beef added with various Type I and Type II antioxidants
Sampling method Open Not open
Day 1 8 15
TBA 0.72 0.66
TBA 0.63 0.69 0.75
171
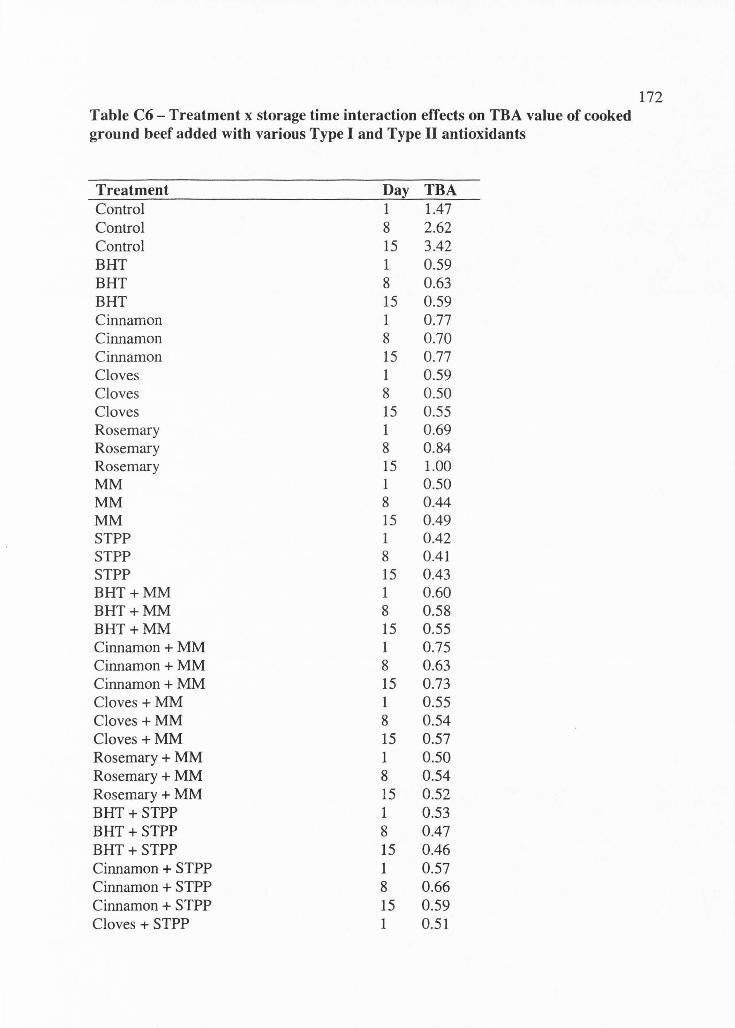
Table C6 - Treatment x storage time interaction effects on TBA value of cooked ground beef added with various Type I and Type II antioxidants
Treatment Day TBA Control 1 1.47 Control 8 2.62 Control 15 3.42 BHT 1 0.59 BHT 8 0.63 BHT 15 0.59 Cinnamon 1 0.77 Cinnamon 8 0.70 Cinnamon 15 0.77 Cloves 1 0.59 Cloves 8 0.50 Cloves 15 0.55 Rosemary 1 0.69 Rosemary 8 0.84 Rosemary 15 1.00 MM 1 0.50 MM 8 0.44 MM 15 0.49 STPP 1 0.42 STPP 8 0.41 STPP 15 0.43 BHT+MM 1 0.60 BHT+MM 8 0.58 BHT+MM 15 0.55 Cinnamon + MM 1 0.75 Cinnamon + MM 8 0.63 Cinnamon + MM 15 0.73 Cloves +MM 1 0.55 Cloves+ MM 8 0.54 Cloves +MM 15 0.57 Rosemary + MM 1 0.50 Rosemary + MM 8 0.54 Rosemary + MM 15 0.52 BHT+STPP 1 0.53 BHT+STPP 8 0.47 BHT+STPP 15 0.46 Cinnamon + STPP 1 0.57 Cinnamon + STPP 8 0.66 Cinnamon + STPP 15 0.59 Cloves + STPP 1 0.51
172
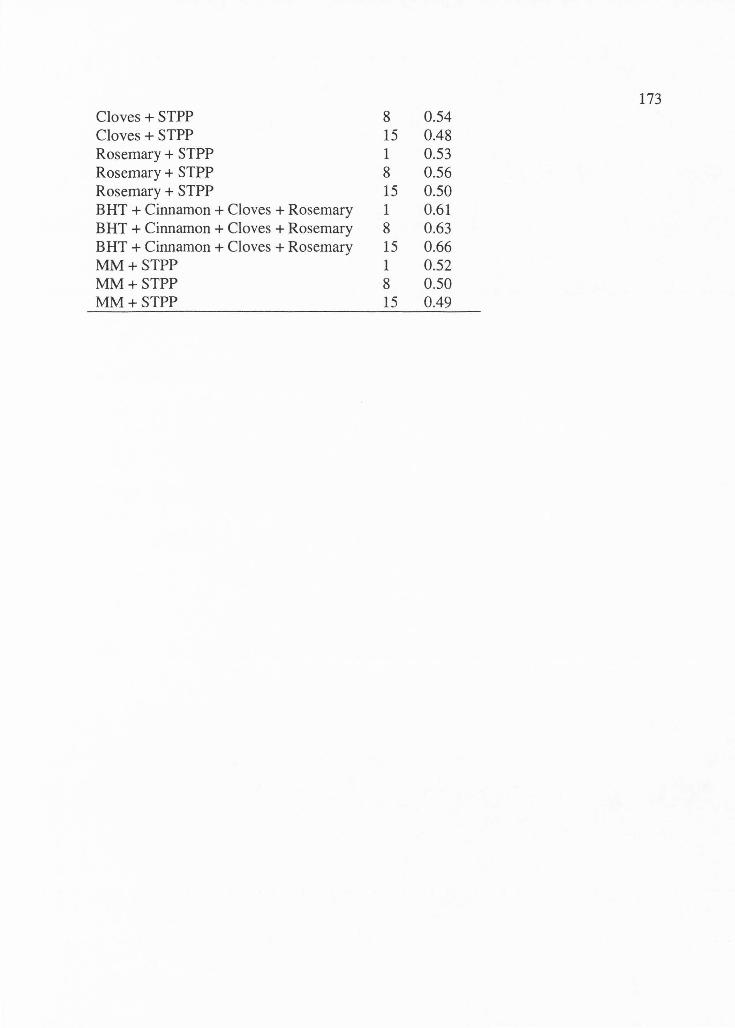
173 Cloves + STPP 8 0.54 Cloves + STPP 15 0.48 Rosemary + STPP 1 0.53 Rosemary + STPP 8 0.56 Rosemary + STPP 15 0.50 BHT + Cinnamon + Cloves + Rosemary 1 0.61 BHT + Cinnamon + Cloves + Rosemary 8 0.63 BHT + Cinnamon + Cloves + Rosemary 15 0.66 MM+STPP 1 0.52 MM+STPP 8 0.50 MM+STPP 15 0.49
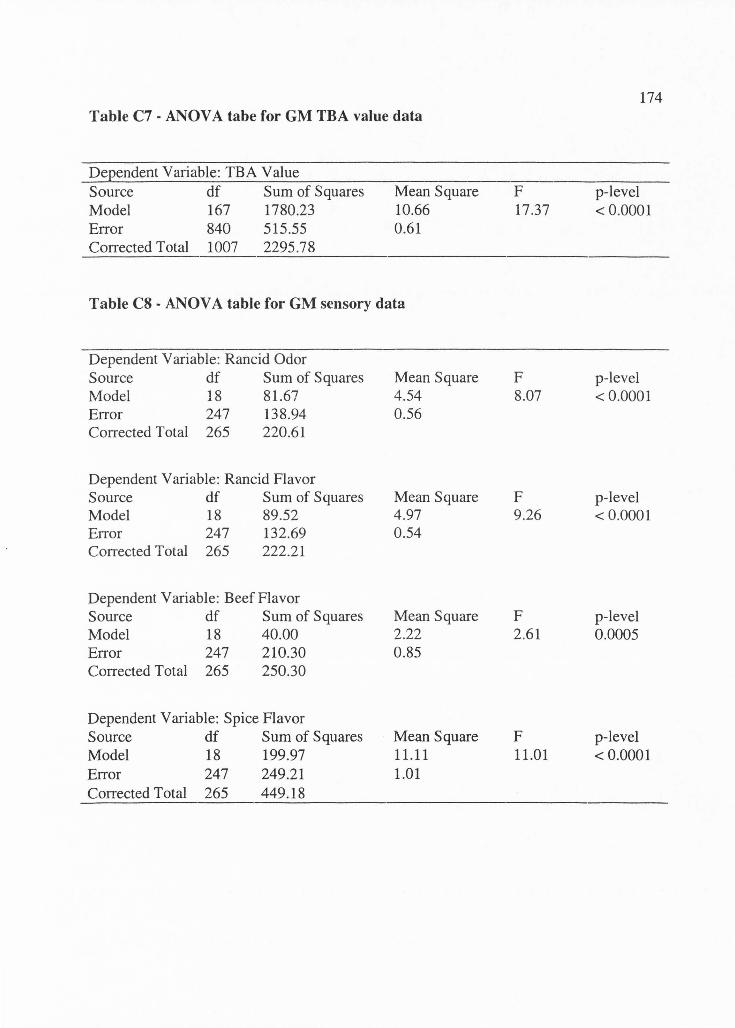
Table C7 - ANOV A tabe for GM TBA value data
Dependent Variable: TBA Value Source df Sum of Squares Model 167 1780.23 Error 840 515.55 Corrected Total 1007 2295.78
Mean Square 10.66 0.61
Table CS - ANOV A table for GM sensory data
Dependent Variable: Rancid Odor Source df Sum of Squares Mean Square Model 18 81.67 4.54 Error 247 138.94 0.56 Corrected Total 265 220.61
Dependent Variable: Rancid Flavor Source df Sum of Squares Mean Square Model 18 89.52 4.97 Error 247 132.69 0.54 Corrected Total 265 222.21
Dependent Variable: Beef Flavor Source df Sum of Squares Mean Square Model 18 40.00 2.22 Error 247 210.30 0.85 Corrected Total 265 250.30
Dependent Variable: Spice Flavor Source df Sum of Squares Mean Square Model 18 199.97 11.11 Error 247 249.21 1.01 Corrected Total 265 449.18
F 17.37
F 8.07
F 9.26
F 2.61
F 11.01
174
p-level < 0.0001
p-level < 0.0001
p-level < 0.0001
p-level 0.0005
p-level < 0.0001
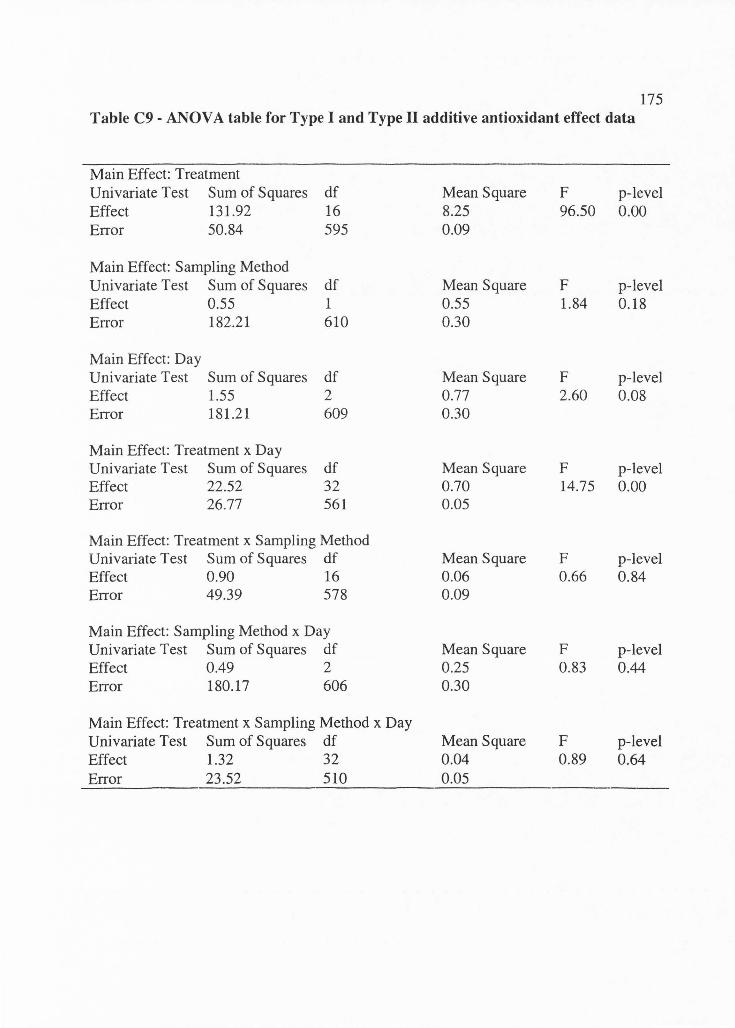
175 Table C9 - ANOV A table for Type I and Type II additive antioxidant effect data
Main Effect: Treatment Univariate Test Sum of Squares df Mean Square F p-level Effect 131.92 16 8.25 96.50 0.00 Error 50.84 595 0.09
Main Effect: Sampling Method Univariate Test Sum of Squares df Mean Square F p-level Effect 0.55 1 0.55 1.84 0.18 Error 182.21 610 0.30
Main Effect: Day Univariate Test Sum of Squares df Mean Square F p-level Effect 1.55 2 0.77 2.60 0.08 Error 181.21 609 0.30
Main Effect: Treatment x Day Univariate Test Sum of Squares df Mean Square F p-level Effect 22.52 32 0.70 14.75 0.00 Error 26.77 561 0.05
Main Effect: Treatment x Sampling Method Univariate Test Sum of Squares df Mean Square F p-level Effect 0.90 16 0.06 0.66 0.84 Error 49.39 578 0.09
Main Effect: Sampling Method x Day Univariate Test Sum of Squares df Mean Square F p-level Effect 0.49 2 0.25 0.83 0.44 Error 180.17 606 0.30
Main Effect: Treatment x Sampling Method x Day Univariate Test Sum of Squares df Mean Square F p-level Effect 1.32 32 0.04 0.89 0.64 Error 23.52 510 0.05
176
APPENDIXD
DAT A FOR CHAPTER 5
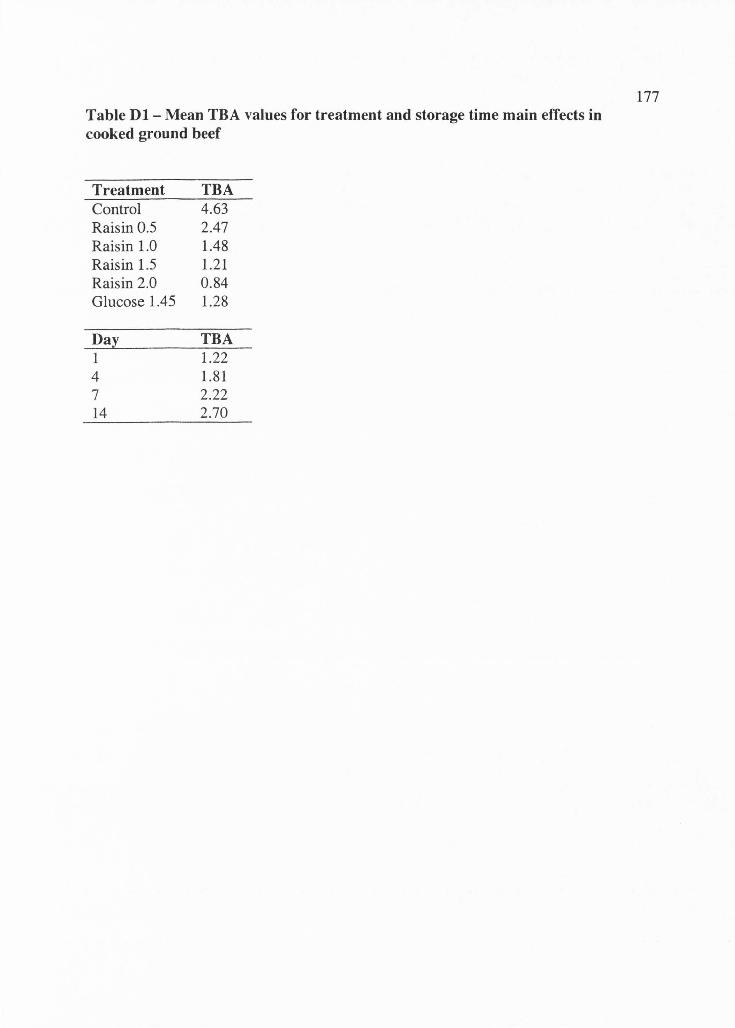
Table Dl - Mean TBA values for treatment and storage time main effects in cooked ground beef
Treatment TBA Control 4.63 Raisin 0.5 2.47 Raisin 1.0 1.48 Raisin 1.5 1.21 Raisin 2.0 0.84 Glucose 1.45 1.28
Day TBA 1 1.22 4 1.81 7 2.22 14 2.70
177

Table D2 - Mean TBA values for treatment and storage time main effects in cooked ground pork
Treatment TBA Control 12.75 Raisin 1.0 5.26 Raisin 2.0 2.60 Raisin 3.0 2.16 Raisin 4.0 1.81 Glucose 2.9 3.23
Day TBA 1 2.65 4 4.30 7 5.62 14 5.96
178
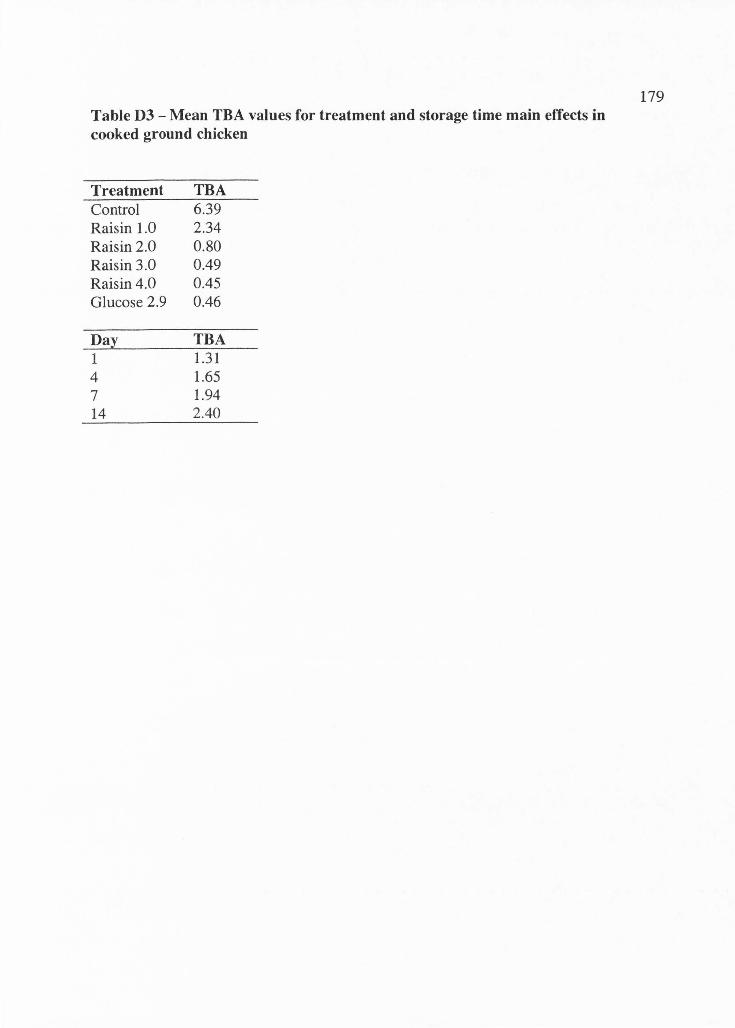
Table D3 - Mean TBA values for treatment and storage time main effects in cooked ground chicken
Treatment TBA Control 6.39 Raisin 1.0 2.34 Raisin 2.0 0.80 Raisin 3.0 0.49 Raisin 4.0 0.45 Glucose 2.9 0.46
Day TBA 1 1.31 4 1.65 7 1.94 14 2.40
179
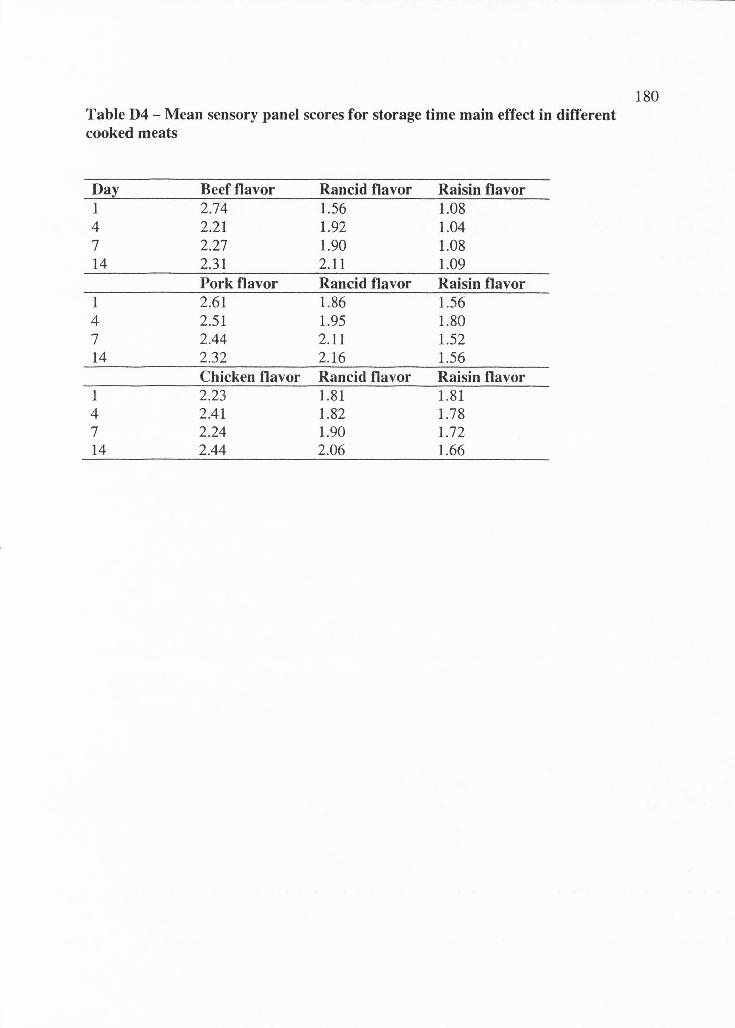
Table D4 - Mean sensory panel scores for storage time main effect in different cooked meats
Day Beef flavor Rancid flavor Raisin flavor 1 2.74 1.56 1.08 4 2.21 1.92 1.04 7 2.27 1.90 1.08 14 2.31 2.11 1.09
Pork flavor Rancid flavor Raisin flavor 1 2.61 1.86 1.56 4 2.51 1.95 1.80 7 2.44 2.11 1.52 14 2.32 2.16 1.56
Chicken flavor Rancid flavor Raisin flavor 1 2.23 1.81 1.81 4 2.41 1.82 1.78 7 2.24 1.90 1.72 14 2.44 2.06 1.66
180
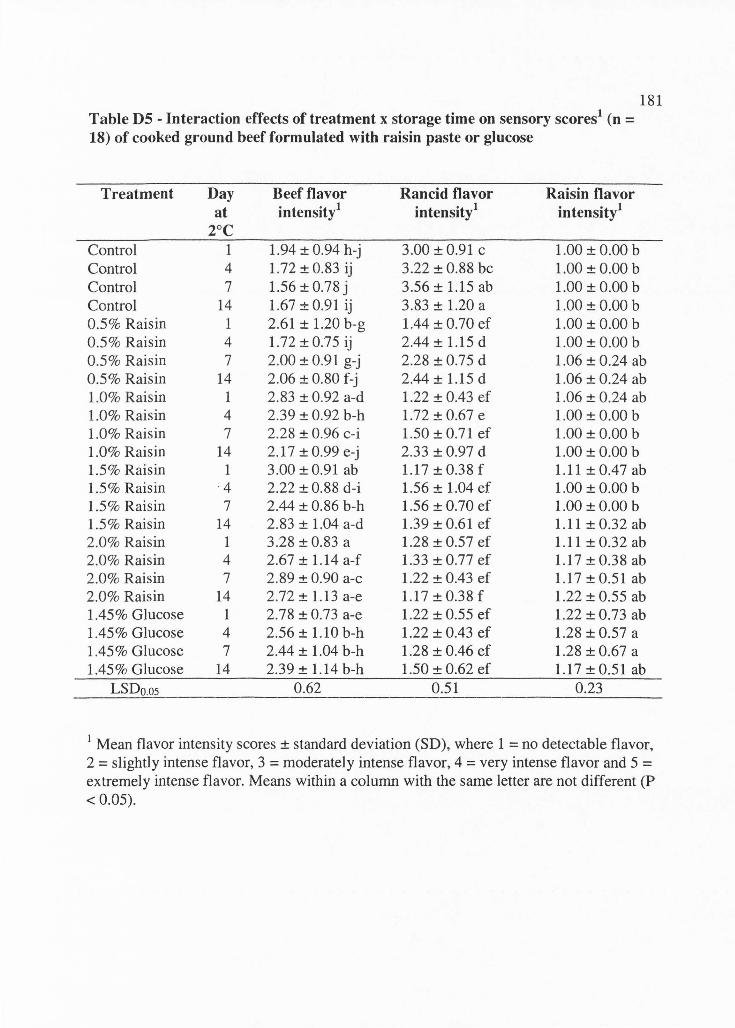
181 Table D5 - Interaction effects of treatment x storage time on sensory scores 1 (n = 18) of cooked ground beef formulated with raisin paste or glucose
Treatment Day Beef flavor Rancid flavor Raisin flavor at • t •t I m ens1 y intensity 1 intensity 1
2°c Control 1 1.94 ± 0.94 h-j 3.00 ± 0.91 C 1.00 ± 0.00 b Control 4 1.72 ± 0.83 ij 3.22 ± 0.88 be 1.00 ± 0.00 b Control 7 1.56 ± 0.78 j 3.56 ± 1.15 ab 1.00 ± 0.00 b Control 14 1.67 ± 0.91 ij 3.83 ± 1.20 a 1.00 ± 0.00 b 0.5% Raisin 1 2.61 ± 1.20 b-g 1.44 ± 0.70 ef 1.00 ± 0.00 b 0.5% Raisin 4 1.72 ± 0.75 ij 2.44 ± 1.15 d 1.00 ± 0.00 b 0 .5% Raisin 7 2.00 ± 0.91 g-j 2.28 ± 0.75 d 1.06 ± 0.24 ab 0.5% Raisin 14 2.06 ± 0.80 f-j 2.44 ± 1.15 d 1.06 ±0.24 ab 1.0% Raisin 1 2.83 ± 0.92 a-d 1.22 ± 0.43 ef 1.06 ± 0.24 ab 1.0% Raisin 4 2.39 ± 0.92 b-h 1.72 ± 0.67 e 1.00 ± 0.00 b 1.0% Raisin 7 2.28 ± 0.96 c-i 1.50 ± 0.71 ef 1.00 ± 0.00 b 1.0% Raisin 14 2.17 ± 0.99 e-j 2.33 ± 0.97 d 1.00 ± 0.00 b 1.5% Raisin 1 3.00 ± 0.91 ab 1.17 ±0.38 f 1.11 ± 0.47 ab 1.5% Raisin ·4 2.22 ± 0.88 d-i 1.56 ± 1.04 ef 1.00 ± 0.00 b 1.5% Raisin 7 2.44 ± 0.86 b-h 1.56 ± 0.70 ef 1.00 ± 0.00 b 1.5% Raisin 14 2.83 ± 1.04 a-d 1.39 ± 0.61 ef 1.11 ± 0.32 ab 2.0% Raisin 1 3.28 ± 0.83 a 1.28 ± 0.57 ef 1.11 ± 0.32 ab 2.0% Raisin 4 2.67 ± 1.14 a-f 1.33 ± 0.77 ef 1.17 ± 0.38 ab 2.0% Raisin 7 2.89 ± 0.90 a-c 1.22 ± 0.43 ef 1.17±0.51ab 2.0% Raisin 14 2.72 ± 1.13 a-e l.17±0.38f 1.22 ± 0.55 ab 1 .45% Glucose 1 2.78 ± 0.73 a-e 1.22 ± 0.55 ef 1.22 ± 0.73 ab 1.45% Glucose 4 2.56 ± 1. 10 b-h 1.22 ± 0.43 ef 1.28 ± 0.57 a 1.45% Glucose 7 2.44 ± 1.04 b-h 1.28 ± 0.46 ef 1.28 ± 0.67 a 1.45% Glucose 14 2.39 ± 1.14 b-h 1.50 ± 0.62 ef 1.17 ± 0.51 ab
LSDo.os 0.62 0.51 0.23
1 Mean flavor intensity scores ± standard deviation (SD), where 1 = no detectable flavor, 2 = slightly intense flavor, 3 = moderately intense flavor, 4 = very intense flavor and 5 = extremely intense flavor. Means within a column with the same letter are not different (P < 0.05).
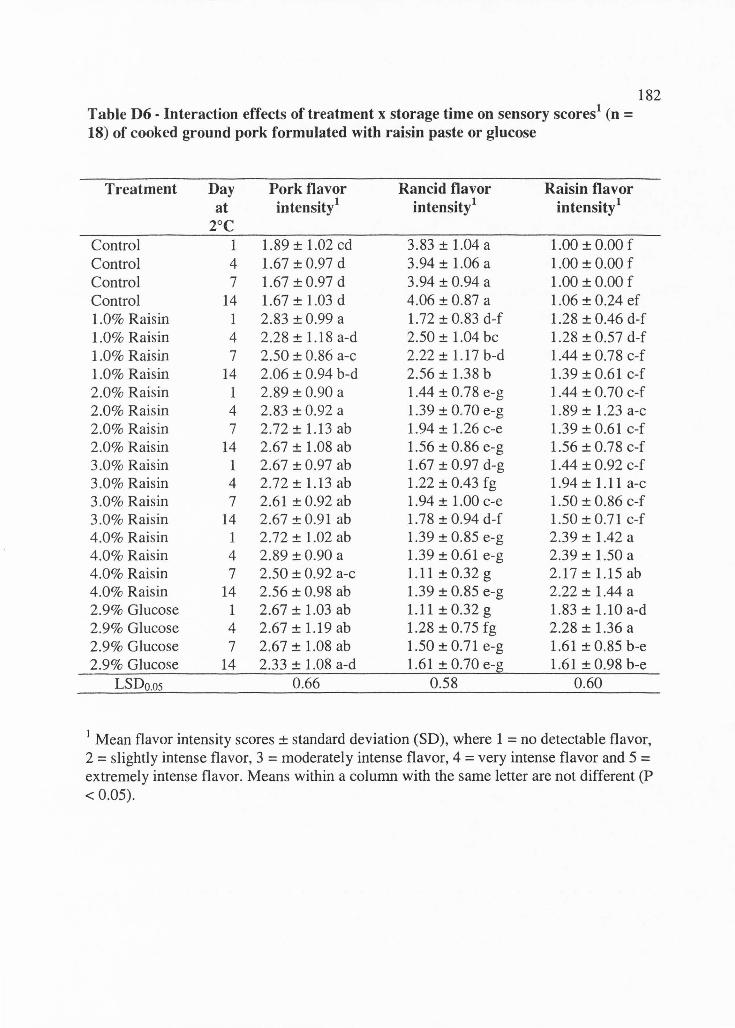
182 Table D6 - Interaction effects of treatment x storage time on sensory scores 1 (n = 18) of cooked ground pork formulated with raisin paste or glucose
Treatment Day Pork flavor Rancid flavor Raisin flavor at ' t 't I ' t 't I intensity 1
ID ens1 y ID ens1 y 2°c
Control 1 1.89 ± 1.02 cd 3.83 ± 1.04 a 1.00 ±0.00 f Control 4 1.67 ± 0.97 d 3.94 ± 1.06 a 1.00 ± 0.00 f Control 7 1.67 ± 0.97 d 3.94 ± 0.94 a 1.00 ± 0.00 f Control 14 1.67 ± 1.03 d 4.06 ± 0.87 a 1.06 ± 0.24 ef 1.0% Raisin 1 2.83 ± 0.99 a 1.72 ± 0.83 d-f 1.28 ± 0.46 d-f 1.0% Raisin 4 2.28 ± 1.18 a-d 2.50 ± 1.04 be 1.28 ± 0.57 d-f 1.0% Raisin 7 2.50 ± 0.86 a-c 2.22 ± 1.17 b-d 1.44 ± 0.78 c-f 1.0% Raisin 14 2.06 ± 0.94 b-d 2.56 ± 1.38 b 1.39 ± 0.61 c-f 2.0% Raisin 1 2.89 ± 0.90 a 1.44 ± 0.78 e-g 1.44 ± 0.70 c-f 2.0% Raisin 4 2.83 ± 0.92 a 1.39 ± 0.70 e-g 1.89 ± 1.23 a-c 2.0% Raisin 7 2.72 ± 1.13 ab 1. 94 ± 1.26 c-e 1.39 ± 0.61 c-f 2.0% Raisin 14 2.67 ± 1.08 ab 1.56 ± 0.86 e-g 1.56 ± 0.78 c-f 3.0% Raisin 1 2.67 ± 0.97 ab 1.67 ± 0.97 d-g 1.44 ± 0.92 c-f 3.0% Raisin 4 2.72 ± 1.13 ab 1.22 ± 0.43 fg 1.94 ± 1.11 a-c 3.0% Raisin 7 2.61 ± 0.92 ab 1.94 ± 1.00 c-e 1.50 ± 0.86 c-f 3.0% Raisin 14 2.67 ± 0.91 ab 1.78 ± 0.94 d-f 1.50 ± 0.71 c-f 4.0% Raisin 1 2.72 ± 1.02 ab 1.39 ± 0.85 e-g 2.39 ± 1.42 a 4.0% Raisin 4 2.89 ± 0.90 a 1.39 ± 0.61 e-g 2.39 ± 1.50 a 4.0% Raisin 7 2.50 ± 0.92 a-c 1.11 ± 0.32 g 2.17 ± 1.15 ab 4.0% Raisin 14 2.56 ± 0.98 ab 1.39 ± 0.85 e-g 2.22 ± 1.44 a 2.9% Glucose 1 2.67 ± 1.03 ab 1.11 ± 0.32 g 1.83 ± 1.10 a-d 2.9% Glucose 4 2.67 ± 1.19 ab 1.28 ± 0.75 fg 2.28 ± 1.36 a 2.9% Glucose 7 2.67 ± 1.08 ab 1.50 ± 0.71 e-g 1.61 ± 0.85 b-e 2.9% Glucose 14 2.33 ± 1.08 a-d 1.61 ± 0.70 e-g 1.61 ± 0.98 b-e
LSDo.os 0.66 0.58 0.60
1 Mean flavor intensity scores ± standard deviation (SD), where 1 = no detectable flavor, 2 = slightly intense flavor, 3 = moderately intense flavor, 4 = very intense flavor and 5 = extremely intense flavor. Means within a column with the same letter are not different (P < 0.05).
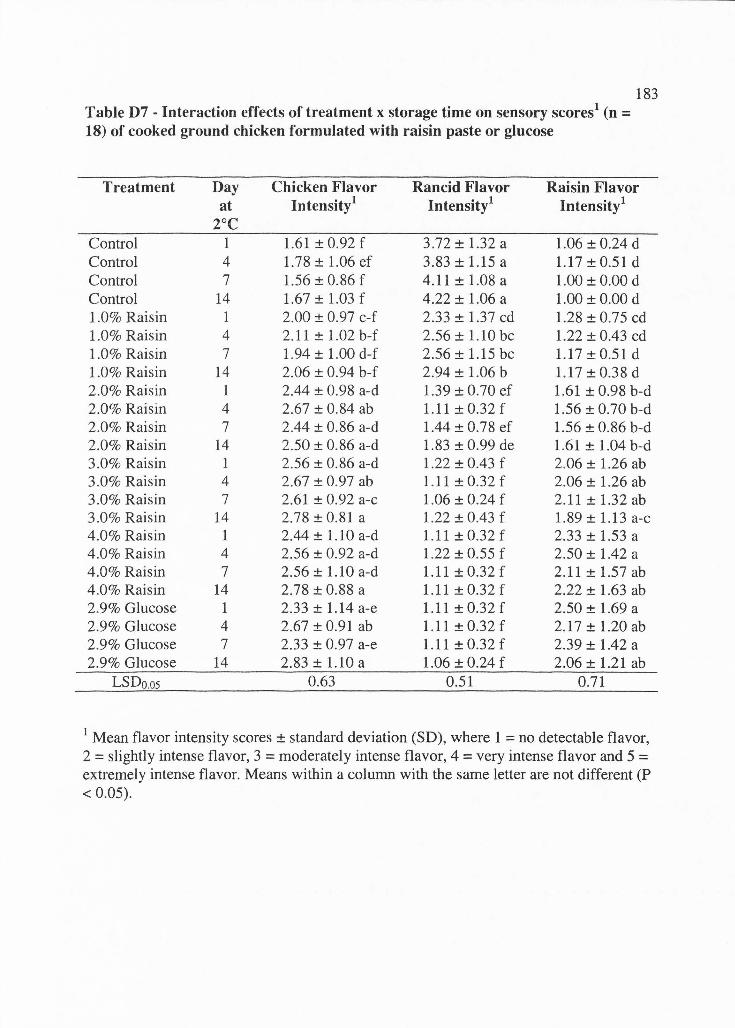
183 Table D7 - Interaction effects of treatment x storage time on sensory scores 1 (n = 18) of cooked ground chicken formulated with raisin paste or glucose
Treatment Day Chicken Flavor Rancid Flavor Raisin Flavor at lntensity 1 Intensity 1 Intensity 1
2°C Control 1 1.61 ± 0.92 f 3.72 ± 1.32 a 1.06 ± 0.24 d Control 4 1.78 ± 1.06 ef 3.83 ± 1.15 a 1.17±0.51d Control 7 1.56 ± 0.86 f 4.11 ± 1.08 a 1.00 ± 0.00 d Control 14 1.67 ± 1.03 f 4.22 ± 1.06 a 1.00 ± 0.00 d 1.0% Raisin 1 2.00 ± 0.97 c-f 2.33 ± 1.37 cd 1.28 ± 0.75 cd 1.0% Raisin 4 2.11 ± 1.02 b-f 2.56 ± 1.10 be 1.22 ± 0.43 cd 1.0% Raisin 7 1.94 ± 1.00 d-f 2.56 ± 1.15 be 1.17±0.51d 1.0% Raisin 14 2.06 ± 0.94 b-f 2.94 ± 1.06 b 1.17 ± 0.38 d 2.0% Raisin 1 2.44 ± 0.98 a-d 1.39 ± 0.70 ef 1.61 ± 0.98 b-d 2.0% Raisin 4 2.67 ± 0.84 ab 1.11 ± 0.32 f 1.56 ± 0.70 b-d 2.0% Raisin 7 2.44 ± 0.86 a-d 1.44 ± 0.78 ef 1.56 ± 0.86 b-d 2.0% Raisin 14 2.50 ± 0.86 a-d 1.83 ± 0.99 de 1.61 ± 1.04 b-d 3.0% Raisin 1 2.56 ± 0.86 a-d 1.22 ± 0.43 f 2.06 ± 1.26 ab 3.0% Raisin 4 2.67 ± 0.97 ab 1.11 ± 0.32 f 2.06 ± 1.26 ab 3.0% Raisin 7 2.61 ± 0.92 a-c 1.06 ± 0.24 f 2.11 ± 1.32 ab 3.0% Raisin 14 2.78 ± 0.81 a 1.22 ± 0.43 f 1.89 ± 1.13 a-c 4.0% Raisin 1 2.44 ± 1.10 a-d 1.11 ± 0.32 f 2.33 ± 1.53 a 4 .0% Raisin 4 2.56 ± 0.92 a-d 1.22 ± 0.55 f 2.50 ± 1.42 a 4.0% Raisin 7 2.56 ± 1. 10 a-d 1.11 ±0.32f 2.11 ± 1.57 ab 4.0% Raisin 14 2.78 ± 0.88 a 1.11 ± 0.32 f 2.22 ± 1.63 ab 2.9% Glucose 1 2.33 ± 1.14 a-e 1.11 ± 0.32 f 2.50 ± 1.69 a 2.9% Glucose 4 2.67 ± 0.91 ab 1.11 ± 0.32 f 2.17 ± 1.20 ab 2.9% Glucose 7 2.33 ± 0.97 a-e 1.11 ± 0.32 f 2.39 ± 1.42 a 2.9% Glucose 14 2.83 ± 1.10 a 1.06 ± 0.24 f 2.06 ± 1.21 ab
LSDo.os 0.63 0.51 0.71
1 Mean flavor intensity scores± standard deviation (SD), where 1 = no detectable flavor, 2 = slightly intense flavor, 3 = moderately intense flavor, 4 = very intense flavor and 5 = extremely intense flavor. Means within a column with the same letter are not different (P < 0.05).
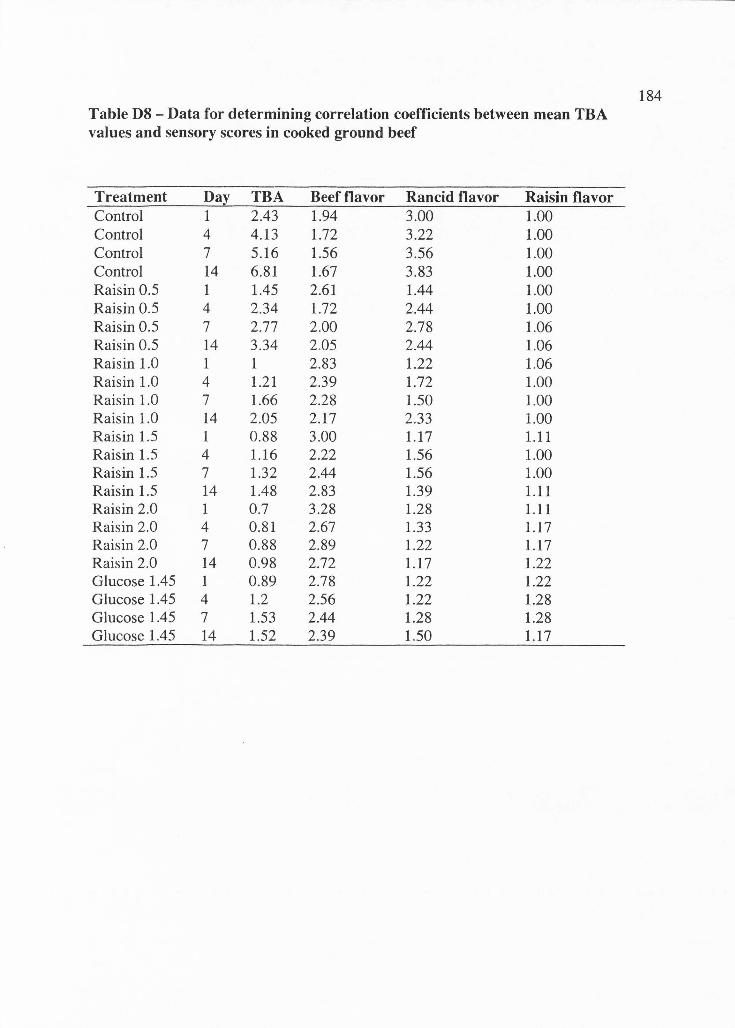
Table D8 - Data for determining correlation coefficients between mean TBA values and sensory scores in cooked ground beef
Treatment Day TBA Beef flavor Rancid flavor Raisin flavor Control 1 2.43 1.94 3.00 1.00 Control 4 4.13 1.72 3.22 1.00 Control 7 5.16 1.56 3.56 1.00 Control 14 6.81 1.67 3.83 1.00 Raisin 0.5 1 1.45 2.61 1.44 1.00 Raisin 0.5 4 2.34 1.72 2.44 1.00 Raisin 0.5 7 2.77 2.00 2.78 1.06 Raisin 0.5 14 3.34 2.05 2.44 1.06 Raisin 1.0 1 1 2.83 1.22 1.06 Raisin 1.0 4 1.21 2.39 1.72 1.00 Raisin 1.0 7 1.66 2.28 1.50 1.00 Raisin 1.0 14 2.05 2.17 2.33 1.00 Raisin 1.5 1 0.88 3.00 1.17 1.11 Raisin 1.5 4 1.16 2.22 1.56 1.00 Raisin 1.5 7 1.32 2.44 1.56 1.00 Raisin 1.5 14 1.48 2.83 1.39 1.11 Raisin 2.0 1 0.7 3.28 1.28 1.11 Rai sin 2.0 4 0.81 2.67 1.33 1.17 Raisin 2.0 7 0.88 2.89 1.22 1.17 Raisin 2.0 14 0.98 2.72 1.17 1.22 Glucose 1.45 1 0.89 2.78 1.22 1.22 Glucose 1.45 4 1.2 2.56 1.22 1.28 Glucose 1.45 7 1.53 2.44 1.28 1.28 Glucose 1.45 14 1.52 2.39 1.50 1.17
184
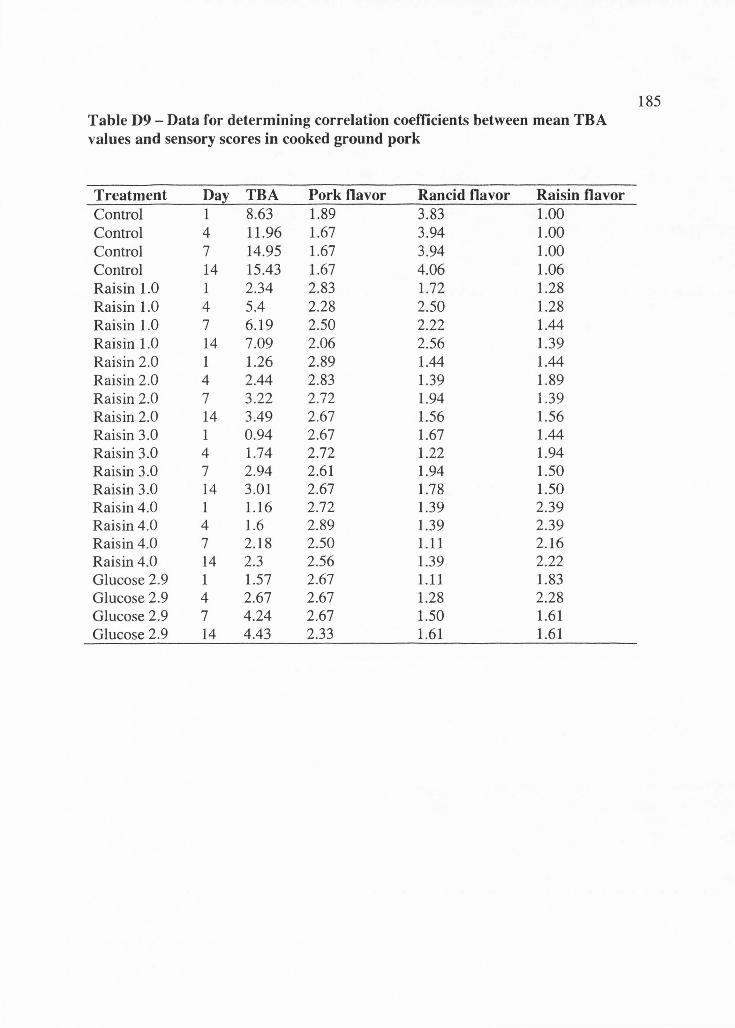
Table D9 - Data for determining correlation coefficients between mean TBA values and sensory scores in cooked ground pork
Treatment Day TBA Pork flavor Rancid flavor Raisin flavor Control 1 8.63 1.89 3.83 1.00 Control 4 11.96 1.67 3.94 1.00 Control 7 14.95 1.67 3.94 1.00 Control 14 15.43 1.67 4.06 1.06 Raisin 1.0 1 2.34 2.83 1.72 1.28 Raisin 1.0 4 5.4 2.28 2.50 1.28 Raisin 1.0 7 6.19 2.50 2.22 1.44 Raisin 1.0 14 7.09 2.06 2.56 1.39 Raisin 2.0 1 1.26 2.89 1.44 1.44 Raisin 2.0 4 2.44 2.83 1.39 1.89 Raisin 2.0 7 3.22 2.72 1.94 1.39 Raisin 2.0 14 3.49 2.67 1.56 1.56 Raisin 3.0 1 0.94 2.67 1.67 1.44 Raisin 3.0 4 1.74 2.72 1.22 1.94 Raisin 3.0 7 2.94 2.61 1.94 1.50 Raisin 3.0 14 3.01 2.67 1.78 1.50 Raisin 4.0 1 1.16 2.72 1.39 2.39 Raisin 4.0 4 1.6 2.89 1.39 2.39 Raisin 4.0 7 2.18 2.50 1.11 2.16 Raisin 4.0 14 2.3 2.56 1.39 2.22 Glucose 2.9 1 1.57 2.67 1.11 1.83 Glucose 2.9 4 2.67 2.67 1.28 2.28 Glucose 2.9 7 4.24 2.67 1.50 1.61 Glucose 2.9 14 4.43 2.33 1.61 1.61
185
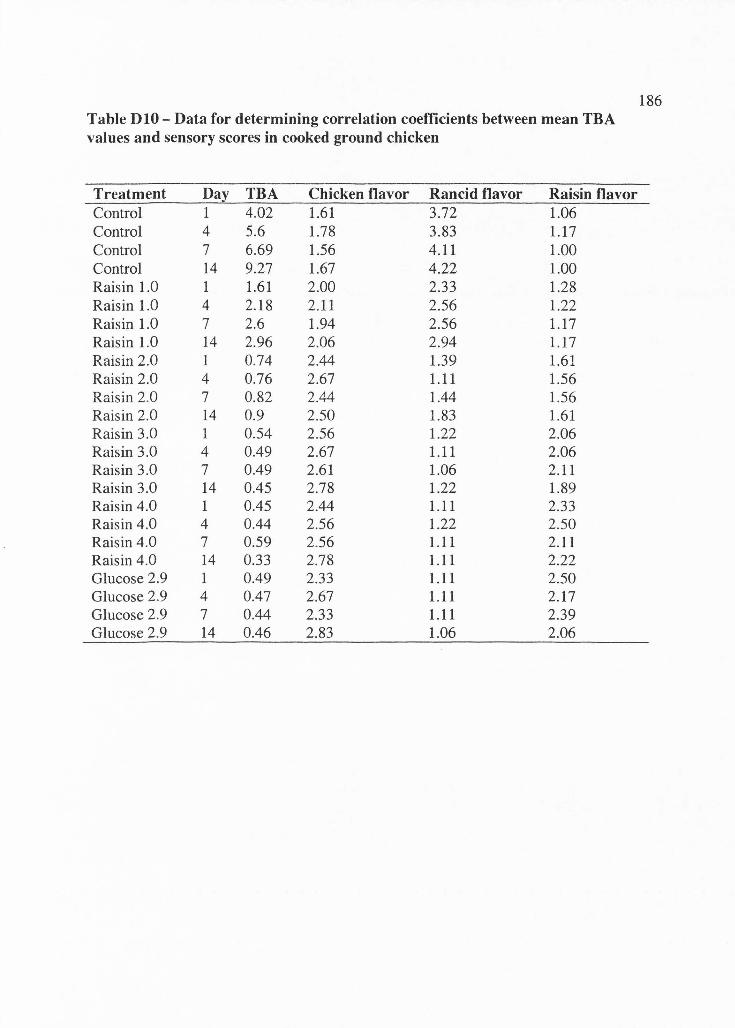
Table D10 - Data for determining correlation coefficients between mean TBA values and sensory scores in cooked ground chicken
Treatment Da! TBA Chicken flavor Rancid flavor Raisin flavor Control 1 4.02 1.61 3.72 1.06 Control 4 5.6 1.78 3.83 1.17 Control 7 6.69 1.56 4.11 1.00 Control 14 9.27 1.67 4.22 1.00 Raisin 1.0 1 1.61 2.00 2.33 1.28 Raisin 1.0 4 2.18 2.11 2.56 1.22 Raisin 1.0 7 2.6 1.94 2.56 1.17 Raisin 1.0 14 2.96 2.06 2.94 1.17 Raisin 2.0 1 0.74 2.44 1.39 1.61 Raisin 2.0 4 0.76 2.67 1.11 1.56 Raisin 2.0 7 0.82 2.44 1.44 1.56 Raisin 2.0 14 0.9 2.50 1.83 1.61 Raisin 3.0 1 0.54 2.56 1.22 2.06 Raisin 3.0 4 0.49 2.67 1.11 2.06 Raisin 3.0 7 0.49 2.61 1.06 2.11 Raisin 3.0 14 0.45 2.78 1.22 1.89 Raisin 4.0 1 0.45 2.44 1.11 2.33 Raisin 4.0 4 0.44 2.56 1.22 2.50 Raisin 4.0 7 0.59 2.56 1.11 2.11 Raisin 4.0 14 0.33 2.78 1.11 2.22 Glucose 2.9 1 0.49 2.33 1.11 2.50 Glucose 2.9 4 0.47 2.67 1.11 2.17 Glucose 2.9 7 0.44 2.33 1.11 2.39 Glucose 2.9 14 0.46 2.83 1.06 2.06
186
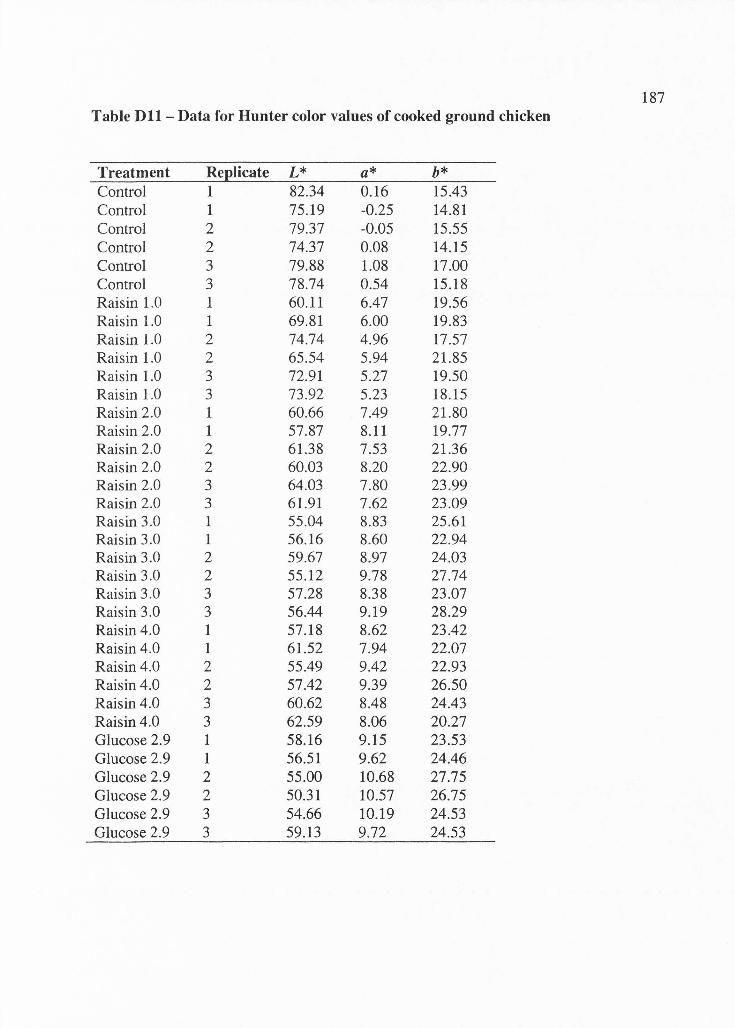
187 Table Dll - Data for Hunter color values of cooked ground chicken
Treatment Replicate L* a* b* Control 1 82.34 0.16 15.43 Control 1 75.19 -0.25 14.81 Control 2 79.37 -0.05 15.55 Control 2 74.37 0.08 14.15 Control 3 79.88 1.08 17.00 Control 3 78.74 0.54 15.18 Raisin 1.0 1 60.11 6.47 19.56 Raisin 1.0 1 69.81 6.00 19.83 Raisin 1.0 2 74.74 4.96 17.57 Raisin 1.0 2 65.54 5.94 21.85 Raisin 1.0 3 72.91 5.27 19.50 Raisin 1.0 3 73.92 5.23 18.15 Raisin 2.0 1 60.66 7.49 21.80 Raisin 2.0 1 57.87 8.11 19.77 Raisin 2.0 2 61.38 7.53 21.36 Raisin 2.0 2 60.03 8.20 22.90 Raisin 2.0 3 64.03 7.80 23.99 Raisin 2.0 3 61.91 7.62 23.09 Raisin 3.0 1 55.04 8.83 25.61 Raisin 3.0 1 56.16 8.60 22.94 Raisin 3.0 2 59.67 8.97 24.03 Raisin 3.0 2 55.12 9.78 27.74 Raisin 3.0 3 57.28 8.38 23.07 Raisin 3.0 3 56.44 9.19 28.29 Raisin 4.0 1 57.18 8.62 23.42 Raisin 4.0 1 61.52 7.94 22.07 Raisin 4.0 2 55.49 9.42 22.93 Raisin 4.0 2 57.42 9.39 26.50 Raisin 4.0 3 60.62 8.48 24.43 Raisin 4.0 3 62.59 8.06 20.27 Glucose 2.9 1 58.16 9.15 23.53 Glucose 2.9 1 56.51 9.62 24.46 Glucose 2.9 2 55.00 10.68 27.75 Glucose 2.9 2 50.31 10.57 26.75 Glucose 2.9 3 54.66 10.19 24.53 Glucose 2.9 3 59.13 9.72 24.53
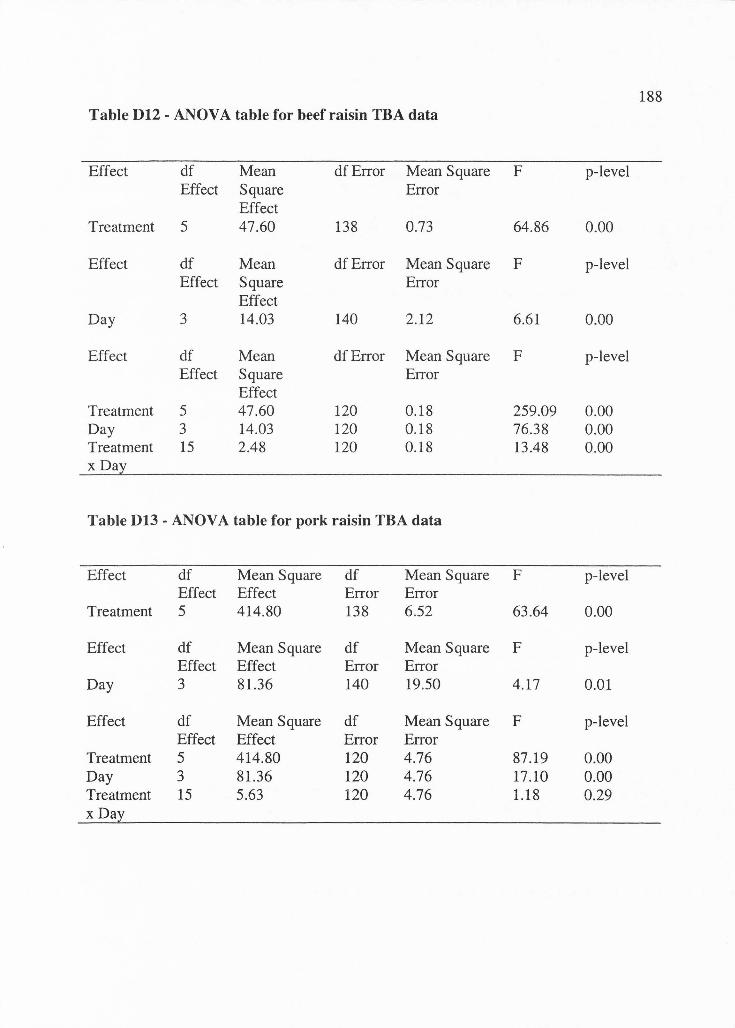
188 Table D12 - ANOV A table for beef raisin TBA data
Effect df Mean df Error Mean Square F p-level Effect Square Error
Effect Treatment 5 47.60 138 0.73 64.86 0.00
Effect df Mean df Error Mean Square F p-level Effect Square Error
Effect Day 3 14.03 140 2.12 6.61 0.00
Effect df Mean df Error Mean Square F p-level Effect Square Error
Effect Treatment 5 47.60 120 0.18 259.09 0.00 Day 3 14.03 120 0.18 76.38 0.00 Treatment 15 2.48 120 0.18 13.48 0.00 xDa
Table D13 - ANOV A table for pork raisin TBA data
Effect df Mean Square df Mean Square F p-level Effect Effect Error Error
Treatment 5 414.80 138 6.52 63.64 0.00
Effect df Mean Square df Mean Square F p-level Effect Effect Error Error
Day 3 81.36 140 19.50 4.17 0.01
Effect df Mean Square df Mean Square F p-level Effect Effect Error Error
Treatment 5 414.80 120 4.76 87.19 0.00 Day 3 81.36 120 4.76 17.10 0.00 Treatment 15 5.63 120 4.76 1.18 0.29 xDay
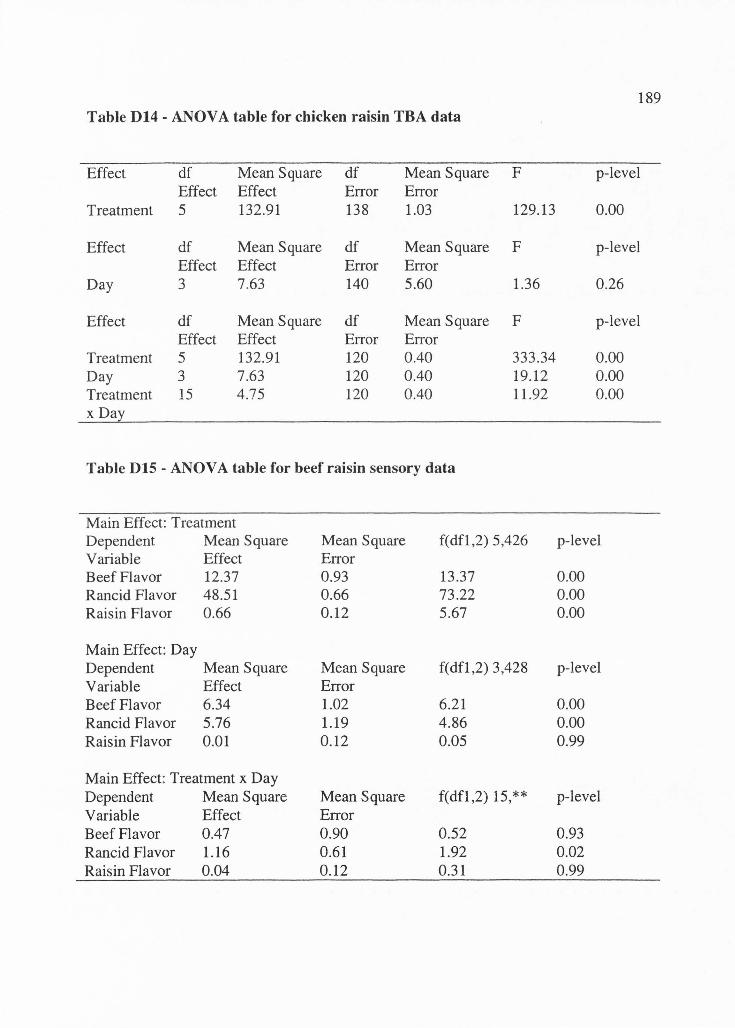
189 Table D14 - ANOV A table for chicken raisin TBA data
Effect df Mean Square df Mean Square F p-level Effect Effect Error Error
Treatment 5 132.91 138 1.03 129.13 0.00
Effect df Mean Square df Mean Square F p-level Effect Effect Error Error
Day 3 7.63 140 5.60 1.36 0.26
Effect df Mean Square df Mean Square F p-level Effect Effect Error Error
Treatment 5 132.91 120 0.40 333.34 0.00 Day 3 7.63 120 0.40 19.12 0.00 Treatment 15 4.75 120 0.40 11.92 0.00 x Da
Table DIS - ANOV A table for beef raisin sensory data
Main Effect: Treatment Dependent Mean Square Mean Square f(dfl,2) 5,426 p-level Variable Effect Error Beef Flavor 12.37 0.93 13.37 0.00 Rancid Flavor 48.51 0.66 73.22 0.00 Raisin Flavor 0.66 0.12 5.67 0.00
Main Effect: Day Dependent Mean Square Mean Square f(dfl,2) 3,428 p-level Variable Effect Error Beef Flavor 6.34 1.02 6.21 0.00 Rancid Flavor 5.76 1.19 4.86 0.00 Raisin Flavor 0.01 0.12 0.05 0.99
Main Effect: Treatment x Day Dependent Mean Square Mean Square f(dfl,2) 15,** p-level Variable Effect Error Beef Flavor 0.47 0.90 0.52 0.93 Rancid Flavor 1.16 0.61 1.92 0.02 Raisin Flavor 0.04 0.12 0.31 0.99
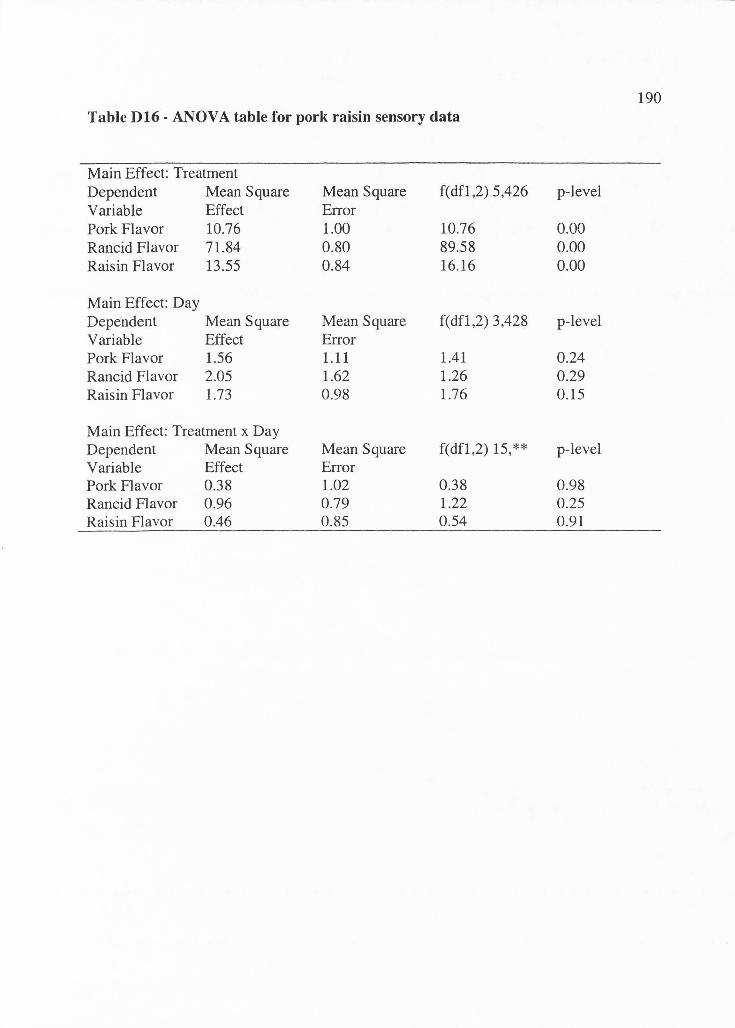
190 Table D16 - ANOV A table for pork raisin sensory data
Main Effect: Treatment Dependent Mean Square Mean Square f(dfl,2) 5,426 p-level Variable Effect Error Pork Flavor 10.76 1.00 10.76 0.00 Rancid Flavor 71.84 0.80 89.58 0.00 Raisin Flavor 13.55 0.84 16.16 0.00
Main Effect: Day Dependent Mean Square Mean Square f(dfl,2) 3,428 p-level Variable Effect Error Pork Flavor 1.56 1.11 1.41 0.24 Rancid Flavor 2.05 1.62 1.26 0.29 Raisin Flavor 1.73 0.98 1.76 0.15
Main Effect: Treatment x Day Dependent Mean Square Mean Square f(dfl,2) 15,** p-level Variable Effect Error Pork Flavor 0.38 1.02 0.38 0.98 Rancid Flavor 0.96 0.79 1.22 0.25 Raisin Flavor 0.46 0.85 0.54 0.91
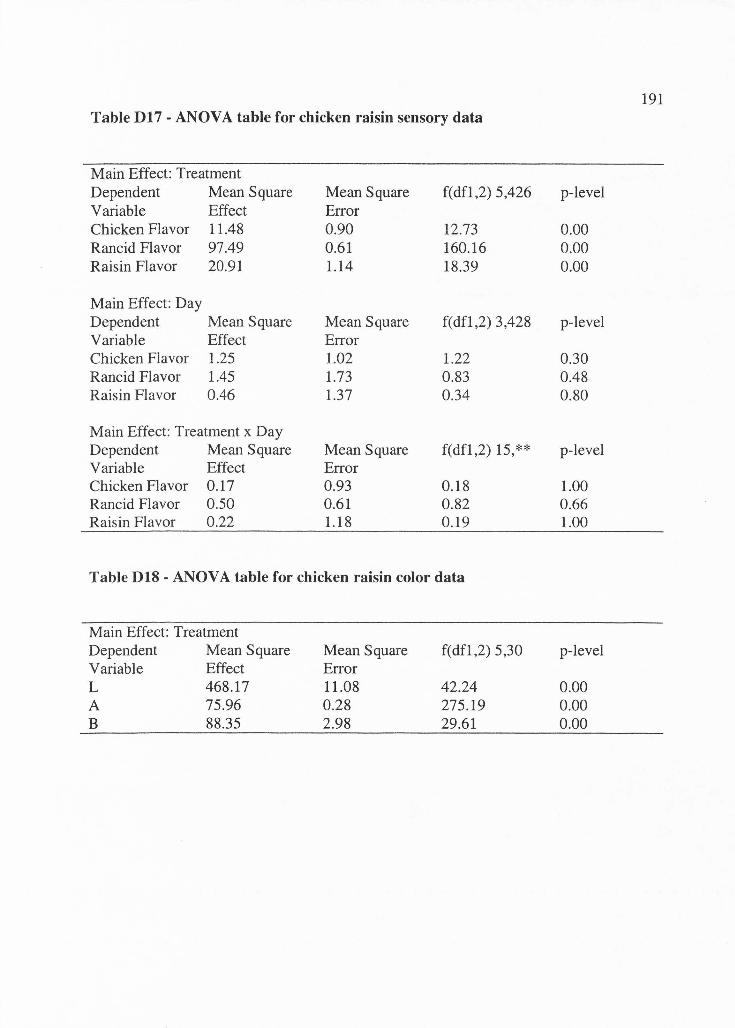
191 Table D17 - ANOVA table for chicken raisin sensory data
Main Effect: Treatment Dependent Mean Square Mean Square f(dfl,2) 5,426 p-level Variable Effect Error Chicken Flavor 11.48 0.90 12.73 0.00 Rancid Flavor 97.49 0.61 160.16 0.00 Raisin Flavor 20.91 1.14 18.39 0.00
Main Effect: Day Dependent Mean Square Mean Square f(dfl,2) 3,428 p-level Variable Effect Error Chicken Flavor 1.25 1.02 1.22 0.30 Rancid Flavor 1.45 1.73 0.83 0.48 Raisin Flavor 0.46 1.37 0.34 0.80
Main Effect: Treatment x Day Dependent Mean Square Mean Square f(dfl,2) 15,** p-level Variable Effect Error Chicken Flavor 0.17 0.93 0.18 1.00 Rancid Flavor 0.50 0.61 0.82 0.66 Raisin Flavor 0 .22 1.18 0.19 1.00
Table D18 - ANOV A table for chicken raisin color data
Main Effect: Treatment Dependent Mean Square Mean Square f(dfl,2) 5,30 p-level Variable Effect Error L 468.17 11.08 42.24 0.00 A 75.96 0.28 275.19 0.00 B 88.35 2.98 29.61 0.00
192
APPENDIXE
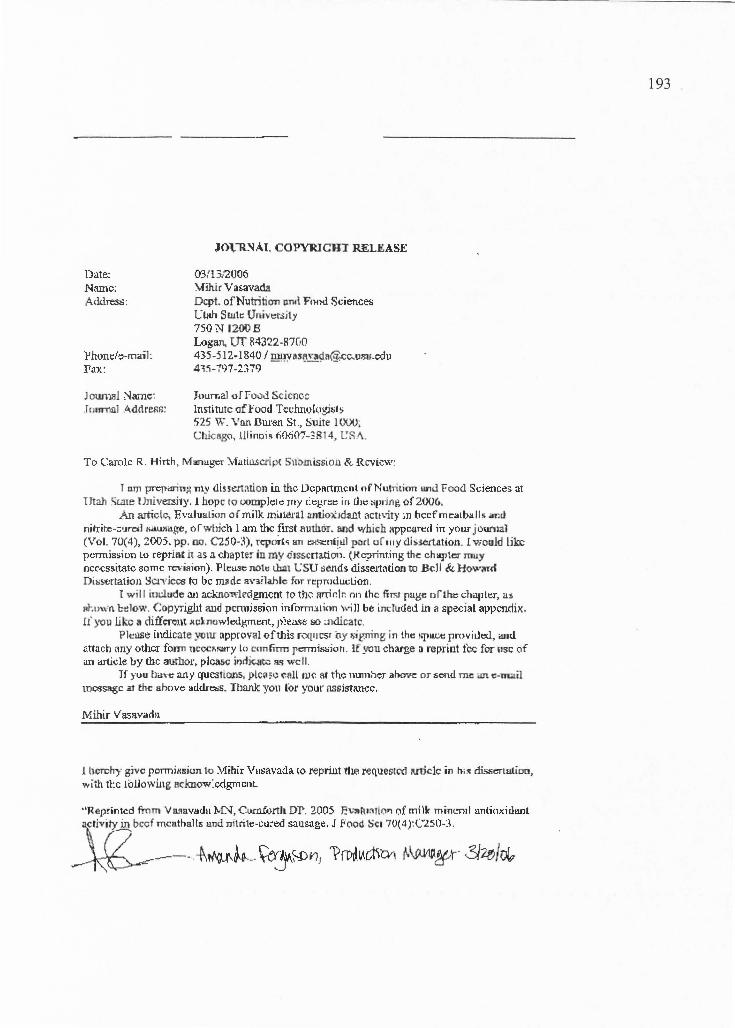
---- -- --------- --- -- -- - - ------
Date: Nl!Il'lc; A,kl~ :
}' hom/~mail: F~:x:
Jown~l Nam<:: .Tcmrnul .4.ddresf::
JO\.""R:'IAI. COPYRIGHT RELEASE
(13/lJ/2006 \fjhir Varavada Dept. ofNuttition imil Fnnd Scienc~ U11h S UJ.ti: U ni,,t=i-~it y 7SON 1200B Logan. UT R4322-R7C•O 43-5-:512-1840 / mID1aS{!Vll\[[email protected] 41~-197-2?.79
Journal off-00.:i Scicnc-c lmtitutc af:t"ood T~l:.l:muk1gi~•> 525 W. \'!ll\ Ilure.n ~t.. Suite 1000; Chi c&~, lllinoi~ tiMITT-3814, l:~ .I\.
To Carole R. Hirth , M11r1uger \,fotill.Sc.ripc S\l:>missiou & Rcvt.:-w:
T 11m prep.inn~ nty <lisse.rtation i.a. the !JcpAlimtnt ofNutriticm ll.nd Food Sdenc~;;. .it lJtah Sune ?Jnivexsi1y. 1 hope to oompk::tc my c:tgn:t in cii~ :spdtll', of 2006.
An article, Evalualion of milk mi.J~·al wtiox1dant .icttvit}' ;n li,;:cfmc-.1111:>,,tll~ aml nitrit:c-:;•~ro11 i;aul'iage, Mwhich 1 am the first 8uthor. and whi1:h xppcured in your jounial (Vol. 70(4), 2005. pp. lllJ. C250-3), rq,cii-,~ 1m ~~nii_ul pi:lrl uf 111y disiertatton . 1 would liloc pt,Tinis1.ion Lo reprint i1 as a. chapter in my <f1sscrt&tion. (~9rint.ing the chllJltei-muy nc~-cs,-itatc some revision). Pl~u.,e not..: Llun CSU sends dissei1.ition to Bell & Howard Dii;!ltrtation Scn--iccs lo be m~dc anilahle for rcpmducli011.
! wi 11 irn.:.lude .3!l a.cknowkclgmcrtt TO t~.;: w.i r.1 ~ nn the fir.-t puge u r lh~ d1ap La, as Rr.D\\'I'\ l-~low. Copyri.gb.t auo :pcrmi,sion infrrrm.:tti<m will be im:lucled in a spocial appcrufac. If you like a diff~\t &ck nowlcdwrtt:flt, p~~a.~ oo ;ndicatc.
Plt:!lSe [n.dicate yoiu· approval of this rv<[IJcsr (ly ,;ip:ning in the !ip~ provit.lt:tl, ,sud ~tt.ich (lilY other forrn moci;sirry lo cunfirm r=i~iot1. if you charge a reprint fee fer use; of an artide by the authoi·, plcax imliQit.:: a'! well.
lf yuu !la, ·t:-:any qucstio.nr,, _plc.i;.; '°'all UJ~ & th,;: nrnn~~ .af-.ovc OT semi me un e-m.1il mO'!s~c .at the at->nve atldrc,;s. Ibunk you for your .issistmcc-.
Mihir Vasav.icfa
1 hcrchy give pcnniHsion to :vlihtr Vm:avada io reprint "fire requestcx'I 11.rtick in tl;~ dis1;enufam, wtth tl:c 101.lowi.ng ~cknow'.c<lgmcnL
193
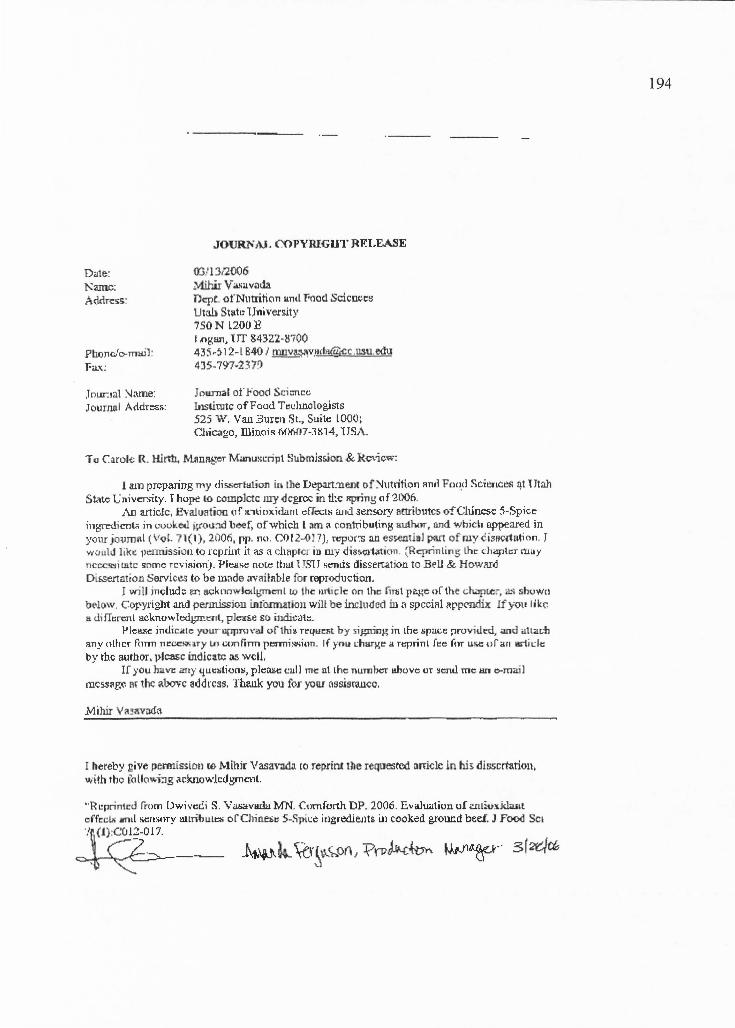
Date: Name; Adcln:ss,:
Pbonc!c-mw1: Fa-.:.;
.T mir.ial >J.\me: J ourruil A<ldr:=s~:
JOURJliM. C'OPYRIGUT RF.I.EASE
03/13/2006 .Mihir V a.~il V.'.llh
Dept. orNutriflcm imd Food Scic~t:~ Utah Stilt~ 1Jni,·erslty 750N L200:E 1.0[1:wi, ur S4JZ2-8700 435.:i 12-l 840 / mnv~v.~,hl@<;c.usu.ecru 435-797•237?
Journal or!•ooc1 Sc;i:mcc !Jistitutc of F cod Tc1:h..o.o logists 525 W, Vau 3urc11 St., Suite: lOOO; ChiC.lgO, lliinoi~ Af)6H7-1Kl4, USA.
To C: aruk R. Hirth. Mlln~= Manusi:ript Submiss.ion & Review:
1 am prcpa:riJJg my di!;Serhilion in the D~:nent of:-.lutntion Arnl Fnci_d Scie.i.c~ ~t Utah St.w; L" nivcr..-ily . I ho~ to complete my dcgroc in tl:i; Rpnng a f2()0fi.
,\D article, E,,·a!uation ~1 f inli t>x icLrll cffcx:t1, aJ1d 3er.sory ~ndbutc5 ofClu~ :'i-Spiccingrroicrit.; in cuukt(} wot1'.ld beef, ofwhich lam a r.ontnbutin!l author , and wt:iid, opt>eared in yo11r journal ( Vot. 71(1), 2006, pp. m1. 0)!2-0J 7), repor:s :ui essentfal pqi.rt ofruy~is!Nrtation . J w'1uhi like 1>enn.ission to reprint it as (l. clrnplcJ iD my d1s~uticm . (Reprinting lht ch<IJ1foT may nccc~itatc some rcvisionj . l'iea~ note tbul lTSlJ sc~mis clisserta.tion to Bell & Howll!d Dl&sertat,on Services to be m:ide avai!al>le for reproduction.
I will includ ~ ~ ack nnwloilb'TTlCTI t l() the tirti t:: le <ln the rin;t p~e or the dl.lf]LC,, a.~ shuWtl be-low. C()J'yri2)Jt .111.cl pe.rJ.11.issiou lnto.nnation wiH be included ill a spcciRl 1tppC'lldi11: lfyo,, l,k~ a difTt:rc:nt acknu"'fo<lwr.t:r1l, ple~i.~ so ilidit:.:it~.
P lel!J'ie incli:c.ate )'UUT' upprn ,·al of thi ~ r~~uci;t by siwring in 1be apace pruvitlt:d, and ,11lac;h R.ny other form ni=c:cs,;iry Lo confirm p~i~iun. If rou i.:hsrfi:t:' a r~rinl fte for us.c of'a11 wiii.:lt: by the aolhor, )}lease indican;: as well.
If you ha vi: a:ny '! ut:~lioni;, pleai;e cal I me nt lhe num bcr llhuve or ~e:ru.1 me lill o-mai J
rncss11~ Hf the .1oovc ao-0rcss. Tkuk you for yoil! .iss.isra.ucc.
Mihir Va311v.ida
I hereby give perm[s~iDll ro Mibir Vasa,"lld:J. co reprfn.t the requesrod :irriclc .in hh dissertation, wtth the f<illcrn,i:ig ilr.knowkc.lgJ11a1l.
··Ri:printi:d rmm !Jwivec;;i S. V.:iaavlU.W. MN. Cornforth DP. 2006. Evaluation uf .:rLl~uxi<la.nl effcd;; lfflll s.cr1smy atlritiul~ orChinei;i: 5-Spi~~ irlgredie.nts i.u cooked g,rour.d beef, J Food Sci
~--- 1't.'1fJJ~.\tr~~,\..or.1 ~rv~~ tJ,,..n~-- 3/~~
194
D:lfe'. N'~~ Addresl'.:
founuu N :mi.e: l-0urnal Article:
J'OURNAL CO PYRIGnT RELli:AS~ COAUTHORS PERMlSSIO!li FORM
U3/J~.1200r5 Mihit Va.savada Dept. ofNutrition nnd Food Sciem~s. Utah Sta~ V11ivcrsny 750 N l200 D Logan, ur ~4:u2 -11100 435-~ 12-l 1140
Journal. Qff ood Sci~ Evaluation of Antioxidant Bffr::ci~ tr.ii $e$;sory Attrilruir.s of Chiries.e 5-Spi[r.': !ngrecient$ in Coolced Ground Boef
Dear Ms. Sa.umya Dw1v(di,
1 =-m i11 ttle 'PZ'(lce:iis ofprqilll"lllEl 'JT!f i:.lia~eru.tJon in me Dept. of:.\'utrition lllld Food S6 ei,~s .at r.,-1a.h Stilt~ U11i=hy. I hl)J)e to complete in tlu: Spri~ of 2006.
r .1lTl -requ~ling yoUI penninioo to inclwie the 1d'taclitit ir.a.teri.tl a3 Rhown ehnvo . ( will ill~~ u.cknowlodgmmts to the anjcle, i.u the tl~e ~ oflli<; chaptr:i\ ~s ~how:i boimv. Copyright and _permissirui mfim11..dn11 will be Included in a spc,ccal avpeooix. Please lodicat~ )'0\11" •pproval ufthfa request by signia,g in thCl 1pacerirovi.~.
Mihir Vasawda
~kL~ -r h~ "'' ,;,., p,,,m;"= "'""" to,,.::, '"'"~'""" aai'1e ,., J,i, di~~tiQXJ. , with the foU,,wing i1c:k111,wledgment
' 'Rqrritil.cd lhmi Dwivedl S, Yasavuia MN, Cornforth D. 2006. Evaluation of Anri(ixidazit E~ Md s~!mJyAttributeg 1>febhcsc 5-SpiO!! I.ngf!lriil!!f1t~ 111 Cookfil Gtour.ri Beof. J .Food Sci 71(1);C012-0!' I_
195
Date : Name: Add!ess :
Poonc/c-rmril: F'ax;
Jou.."!131 Name: Journal Addresq :
------- -- · -
JOUR..NAL COPYRIGHT RELEASE
031131'2006 Mihir Vasavada Dept. of Nutrition and .food Sciences V4ah State University ?lON 1200 E Logan, L 1 84322-8700 435 -512-1840 I mt1vasava,cia.:@cc:.usu.e<lu 435-797-2379
Journlll ofFood Science Institute ofFood Tedu10logists 525 W. Van BumnSt., Suite 1000; Chicago, Jllinois 60607-3814, USA .
Tt) Carole R. Hirth, Manager Mann5cript Subm ission & Rt:,·.ii:w:
I am preparing ny dissertation in the Department ofNutriiion and food Science~ at Utah State University . J hope to complete my degree in the spring of 2006 .
An article , E"aluation of entiox.idrurt effect s of rai~in pw;tc in cooked ground beef. JX>rk, and chicken , ofv.tiich I Wn the first autnor, wid which is due to appear in your joum.,I (Vol. 71 (4), 2000), reports an csscnl ial parl uf wy dissrnation . T would like pcrrnjs9.ion lo reprint it as a chapter in my disserta tion (Reprin ting the chapter may ncccssiwlt: su r,1e revision). Please note that USU sends dissertation to Bell &.Howard Dissertation Services to be made availabl.~ for n:productic-n .
I will include ari acknowledgment to the arriclc on the first page of th1:.' chapter, as showr. below . Copyright and permission information will be included in R speci.31 nppcnclix.. l f ~uu like a different acknow ledgmcnt, pl=:: ao indi~te.
l'lease indicate your approval of this request by signin~ in the space provided, and attach a:r:y other form ueces~ to confirm peonission. If you chl\J'ge a reprint fee for use of an article by the author, please indicate as well.
lf yon h11vc any questions, plci;.sc call me at the number above or se..,d me m e-mail message e.t the above add:ress. Thrullc you for yonr as~ii.tance.
Miliir Vasavada
I hereby give permission to Mihir Vasavada to reprint tbe TetJnesAcrl article in his dissertation , wjth the folloWulg R(.knowlcd!:JllCllt.,
'' Rcprimed from Vasa,;ada MN, Cum.fo.rth DP. 2006. l3valuation of antioxidant effects of rai in pe.ste in cooked ground beef, pork, and chicken . J F-Ood Sci 71 (4) .
196
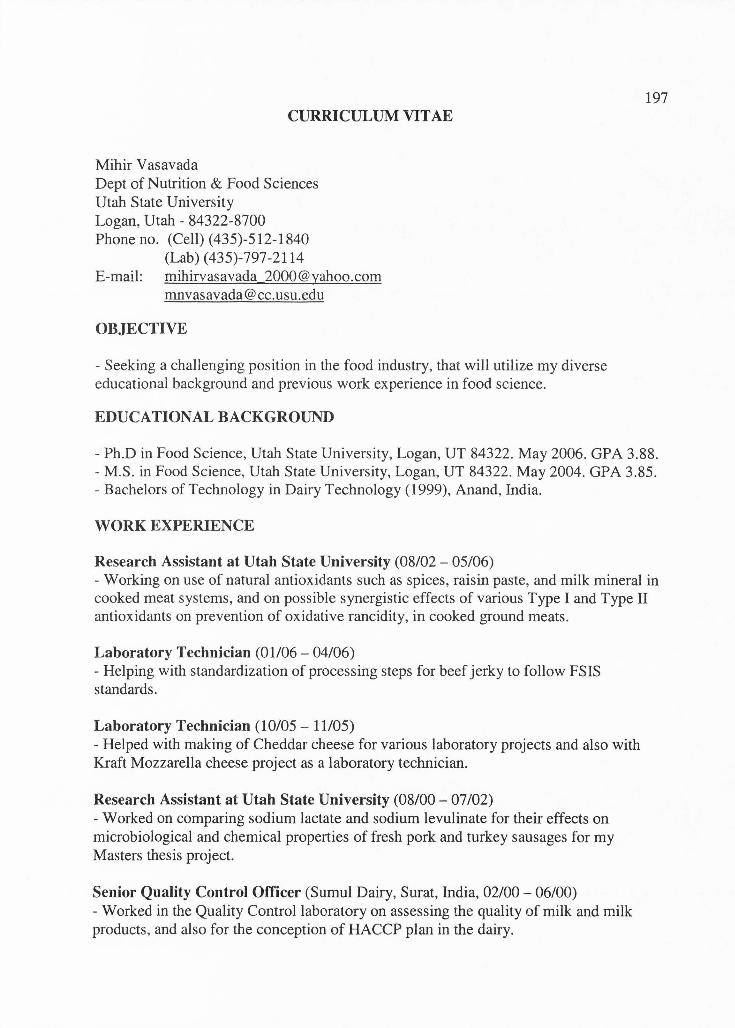
CURRICULUM VITAE
Mihir Vasavada Dept of Nutrition & Food Sciences Utah State University Logan , Utah - 84322-8700 Phone no. (Cell) ( 435)-512-1840
(Lab) (435)-797 -2114 E-mail: mihirvasavada 2000@yahoo .com
OBJECTIVE
- Seeking a challenging position in the food industry, that will utilize my diverse educational background and previous work experience in food science.
EDUCATIONAL BACKGROUND
197
- Ph .Din Food Science, Utah State University , Logan, UT 84322. May 2006. GPA 3.88. - M.S. in Food Science, Utah State University, Logan, UT 84322 . May 2004. GPA 3.85. - Bachelors of Technology in Dairy Technology (1999), Anand , India.
WORK EXPERIENCE
Research Assistant at Utah State University (08/02 - 05/06) - Working on use of natural antioxidants such as spices, raisin paste, and milk mineral in cooked meat systems, and on possible synergistic effects of various Type I and Type II antioxidants on prevention of oxidative rancidity, in cooked ground meats.
Laboratory Technician (01/06 - 04/06) - Helping with standardization of processing steps for beef jerky to follow FSIS standards.
Laboratory Technician (10/05 - 11/05) - Helped with making of Cheddar cheese for various laboratory projects and also with Kraft Mozzarella cheese project as a laboratory technician.
Research Assistant at Utah State University (08/00 - 07 /02) - Worked on comparing sodium lactate and sodium levulinate for their effects on microbiological and chemical properties of fresh pork and turkey sausages for my Masters thesis project.
Senior Quality Control Officer (Sumul Dairy, Surat, India, 02/00 - 06/00) - Worked in the Quality Control laboratory on assessing the quality of milk and milk products, and also for the conception of HACCP plan in the dairy.
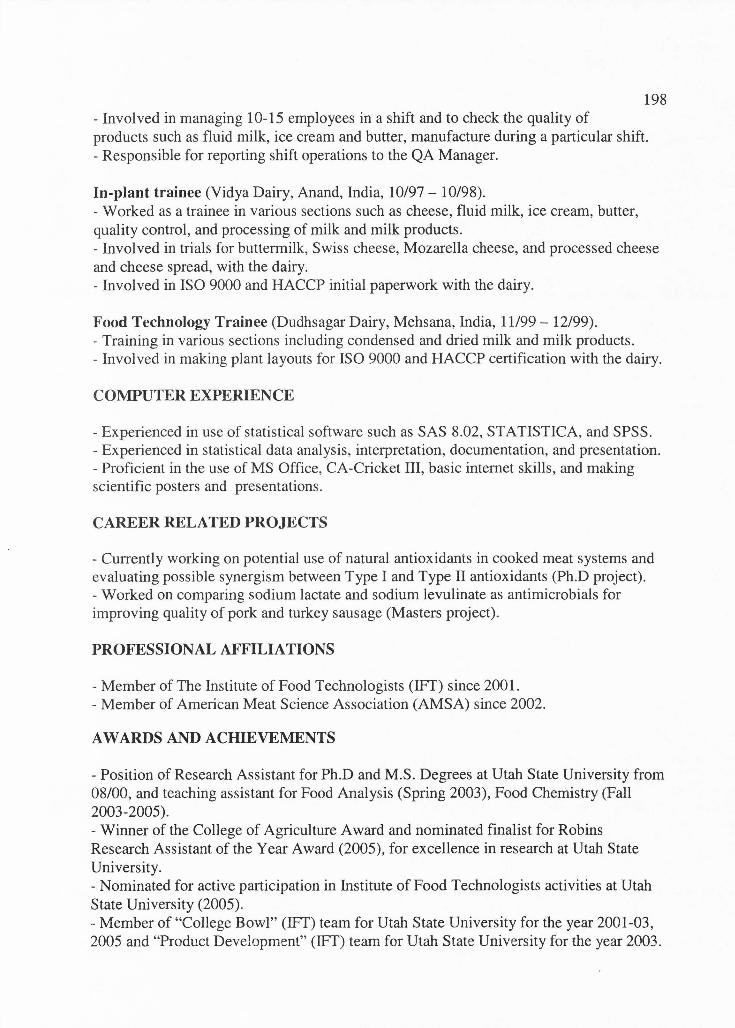
198 - Involved in managing 10-15 employees in a shift and to check the quality of products such as fluid milk, ice cream and butter, manufacture during a particular shift. - Responsible for reporting shift operations to the QA Manager.
In-plant trainee (Vidya Dairy, Anand, India, 10/97 - 10/98). - Worked as a trainee in various sections such as cheese, fluid milk, ice cream, butter, quality control , and processing of milk and milk products. - Involved in trials for buttermilk, Swiss cheese, Mozarella cheese, and processed cheese and cheese spread, with the dairy. - Involved in ISO 9000 and HACCP initial paperwork with the dairy.
Food Technology Trainee (Dudhsagar Dairy, Mehsana, India, 11/99 - 12/99). - Training in various sections including condensed and dried milk and milk products. - Involved in making plant layouts for ISO 9000 and HACCP certification with the dairy.
COMPUTER EXPERIENCE
- Experienced in use of statistical software such as SAS 8.02, STA TISTICA, and SPSS. - Experienced in statistical data analysis, interpretation , documentation, and presentation. - Proficient in the use of MS Office, CA-Cricket III, basic internet skills, and making scientific posters and presentations.
CAREER RELATED PROJECTS
- Currently working on potential use of natural antioxidants in cooked meat systems and evaluating possible synergism between Type I and Type II antioxidants (Ph.D project). - Worked on comparing sodium lactate and sodium levulinate as antimicrobials for improving quality of pork and turkey sausage (Masters project).
PROFESSIONAL AFFILIATIONS
- Member of The Institute of Food Technologists (IFT) since 2001. - Member of American Meat Science Association (AMSA) since 2002.
A WARDS AND ACHIEVEMENTS
- Position of Research Assistant for Ph.D and M.S. Degrees at Utah State University from 08/00, and teaching assistant for Food Analysis (Spring 2003), Food Chemistry (Fall 2003-2005). - Winner of the College of Agriculture Award and nominated finalist for Robins Research Assistant of the Year A ward (2005), for excellence in research at Utah State University. - Nominated for active participation in Institute of Food Technologists activities at Utah State University (2005). - Member of "College Bowl" (IFT) team for Utah State University for the year 2001-03, 2005 and "Product Development" (IFT) team for Utah State University for the year 2003 .
199 - Cleared All India Exam for Masters Degree in NDRI, Kamal, India in the Dairy Chemistry - Dairy Microbiology Division. - Acknowledged as one of the most active participant in extra-curricular activities at the undergraduate level and actively involved in the activities of the Indian Student Association (ISA) at Utah State University as a member and as the Cultural Secretary for 2002-2003.
PUBLICATIONS
- M. Vasavada, C.E. Carpenter , D.P. Cornforth and V. Ghorpade. 2003. Sodium levulinate and sodium lactate effects on microbial growth and stability of fresh pork and turkey sausages. J Muscle Foods 14(2):119-129. - M. Vasavada and D.P. Cornforth. 2005. Evaluation of milk mineral antioxidant activity in beef meatballs and nitrite-cured sausage. J Food Sci 70(4): 250-253. - S. Dwivedi, M. Vasavada, and D. P. Cornforth. 2006. Evaluation of antioxidant effects and sensory attributes of Chinese 5-spice ingredients in cooked ground beef . J Food Sci 71(1):C012-017 . - M. Vasavada , D.P. Cornforth. 2006. Evaluation of antioxidant effects of raisin paste in cooked ground beef, pork, and chicken. (Accepted in J Food Sci). - M . Vasavada, S. Dwivedi, and D.P. Cornforth. 2006 . Evaluation of garam masala spices and phosphates as antioxidants in cooked ground beef. (Accepted in J Food Sci).
TECHNICAL PRESENTATIONS AND POSTERS
Posters at various conferences: - Reciprocal Meat Conference: Use of levulinic acid in pork and turkey sausages (2002), Evaluation of various antioxidants including rosemary powder, rosemary oil and BHT (2003), Use of garam masala blend in ground beef for prevention of oxidative rancidity (2004). - International Conference of Meat Science and Technology: Use of raisin paste in cooked ground beef and pork to prevent oxidative rancidity (2005). - Institute of Food Technologists Annual Meeting: Use of milk mineral in cooked, ground beef for prevention of oxidative rancidity and comparison with sodium nitrite (2004).
REFERENCES
- Will be made available upon request.


![Unique Oxidative Stress Markers · Oxidative Stress Markers Overview ... anti-Acrolein [ACR], mAb (5F6) ... antioxidants such as Vitamin E.](https://static.cupdf.com/doc/110x72/5ad2ff3f7f8b9a05208d5d5f/unique-oxidative-stress-markers-oxidative-stress-markers-overview-anti-acrolein.jpg)


![Antioxidative screening of fractions from the mucus of ... · antioxidants in the cell, since this could lead to „oxidative stress” [9,10]. Antioxidants from natural origins have](https://static.cupdf.com/doc/110x72/5ceb632288c993031a8b56f1/antioxidative-screening-of-fractions-from-the-mucus-of-antioxidants-in-the.jpg)