1
US ndash China Commission on Economics and Security
The Impact of Chinarsquos Five-Year Plans on Strategic Industries
Panel II ndash April 22 2015
Gary H Jefferson jeffersonbrandeisedu
Brandeis University
Department of Economics International Business School
April 22 2015
1 Introduction
In this initial draft of my testimony I attempt to shed light on the following questions
1 To what extent and in what ways is Chinarsquos manufacturing sector catching up with US manufacturing
2 What are the factors responsible for driving the catch-up process What are the major impediments to catch-up What are some of the relevant examples
3 To what extent is Chinarsquos innovation system advancing and catching with OECD countries
4 What are the principal weaknesses of Chinarsquos innovation system and impediments to the catch-up process
5 What recommendations might emerge from this analysis
2 Manufacturing Catch-up
In our research on Chinarsquos manufacturing sector1
1 ldquoWill China Escape the Middle- Income Traprdquo draft December 22 2014
my research colleague Professor Paul
Deng at the Copenhagen Business School and I find that two factors are highly statistically
robust indicators of the rate of Chinarsquos manufacturing catch-up ie reducing the manufacturing
labor productivity gap with US firms These two factors are i) the size of the initial labor
productivity gap between the Chinese firm and the average productivity of the corresponding
2
US 3-digit SIC industry and ii) the rate of productivity growth of the corresponding US
industry
Highlights of Figure 1 The scatter plot shows a very clear relationship within Chinese
manufacturing between the rate of firm labor productivity growth and the size of the productivity
gap (measured as the log) with the US frontier of the Chinese-based firm The larger the firmrsquos
productivity gap the higher its rate of catch-up productivity growth The graph shows that at the
firm level Chinese-based manufacturing firms span a wide range of productivity gaps with the
US as well as a wide range of annual rates of labor productivity growth Despite the variation
the inverse relationship between them is size of the gap and the rate of productivity growth is
evident
Highlights of Figure 2 Figure 2 shows the relationship between the same US-China
productivity gap and the related rate of growth of catch-up ie the annual rate of growth of gap
reduction Because in this figure the firms have been aggregated by their 3-digit industrial
classification the spread is more concentrated than that shown for the individual firms in Figure
1 Since this graph represents the rate of catch-up the rate of growth of the Chinese firmrsquos labor
productivity and the rate of growth of productivity at the US frontier both matter As shown in
Figure 2 the relationship between the rate of gap reduction and the size of the initial gap is also
extremely robust In the figure the industries in the northwest quadrant and those in the
southeast quadrant have been highlighted
The industries shown to the northwest are largely those in the primary metals sector such
as steel production It turns out that for each of these industries the rate of growth of
productivity of their counterpart US industries was relatively slow hence for a given gap the
catch-up rate for the Chinese firms was unusually high By contrast for the industries in the
southeast quadrant of the figure the rate of productivity growth for the corresponding US
industries was relatively high Hence notwithstanding the large gap this high US productivity
growth impeded the rate of catch-up for the corresponding Chinese firms including petroleum
and coal products chemicals apparel and computer and electronic products
Regression analysis shows that the rate of growth the productivity at the US frontier
critically affects the rate of productivity growth and catch-up for the Chinese-based firms In
general every 1 increase in the rate of productivity growth of a US industry (eg from 4 to
3
5) boosts Chinese industry productivity growth by 03 to 04 On the other hand the same
productivity growth for the counterpart US firm slows catch-up by 06 to 07 on average
That is to say as the US frontier shifts out its productivity about one-third of the productivity
advance at the US frontier appears to spillover to China within 5 years of the advance
otherwise productivity growth at the frontier slows the process of catch-up
Highlights of Figure 3 Figure 3 tells a more granular story about the iron and steel
industry As described above this industry appears to perform particularly well from 1998 to
2007 Figure 3 explains in part why that was the case It shows the capacity utilization in the
iron and steel industry rising prior to 2007 and then peaking in that year Indeed Table 1 will
show that in 2007 the iron and steel industry (ie primary metals) had achieved the smallest gap
with its US counterpart (ie nearly 30 of the US average) However thereafter in part due
to the international financial crisis but also due to coordination problems the industry fell into a
period of a substantial decline in capacity utilization mitigated only during 2009-2010 by the
temporary Chinese stimulus
Explanation of Figure 2 Figure 2 (from a paper by Dr Markus Taube) summarizes
Chinarsquos pervasive problem of multiple principals It shows the multiplicity of central
government agencies that exercise oversight of Chinarsquos iron and steel industry in which state-
ownership is extensive and the vertical divide between these principals of the central government
and the local governments and individual enterprises While the central government is generally
intent on rationalizing the distribution product mix and capacity of iron and steel local
governments are often hungry to expand their tax bases and employment thus encouraging
redundant investment from the national perspective
In an attempt to address this problem Chinarsquos 12th 5-year plan acknowledged the
problem of a proliferation of Chinese-owned enterprises and plants Ch 9 sec 4 sets forth the
following provision ldquoDrive advantaged enterprises to carry out alliance cross-regional merger
and reorganization and increase industry concentration with an focus on automobile iron and
steel cement machine building electrolytic aluminum rare earth electronic information and
pharmaceutical industries etcrdquo Still as shown in Figure 2 within the iron and steel industry the
problem of overcapacity became more pronounced during the 12th 5-year plan The problem is
reflected in the next table (Table 3) which shows the share of sector production represented by
4
the 10 most efficient industries in each sector The 10-firm value-added shares for the industries
cited in the Plan for consolidation include just 5 of value added in the primary metals sector
4 in chemicals and 3 in machinery
Highlights of Table 1 Table 1 shows that for total manufacturing from 1998 to 2007
the US-China gap in the average levels of value added per worker declined from about 201 to
71 In both years the top-decile productivity firms in China exhibit a much smaller gap ie
rising from just 30 of the US average in 1998 to 70 in 2007 In the latter period the top
decile firms accounted for 35 of total Chinese manufacturing output suggesting that the scale
of the more efficient firms was well above average (3frac12 times the average size) In 2007 for 3 of
the 18 two-digit industries Chinarsquos top decile firms show higher average levels of productivity
than the corresponding (full) industry averages for the US Table 1 also shows the average of
Chinarsquos 10 most productive firms in each industry The ratio of productivity of the top 10 firms
to the US average is quite striking In 1998 average productivity for two of the 18 industries
exceeds the US industry average By 2007 the number of top 10 firm Chinese clusters
exceeding the US industry average rises to 15 of 18 industries
This last result ndash the finding of the relatively high productivity of the top 10 firms within
each industry ndash raises the possibility that China has created its own internal frontier That is firms
such as Huawei in telecommunications equipment BYD in batteries and electric cars SunTech
in solar panels Haier in white goods and Xiaomi in smartphones may themselves represent
technology frontiers against which to measure the progress of the lagging elements of Chinese
industry
Highlights of Table 2 This table attempts to address the factors that are most important
policy-related instruments that are driving Chinarsquos productivity advance An extensive literature
shows a range of factors that bear upon the dynamic of catch-up but two of these stand out
These are i) technology or productivity spillovers from regions or industries with concentrations
of foreign direct investment to Chinese-owned firms within those regions or industries2
Some of these studies also find evidence of a so-called ldquoseparation effectrdquo That is in the
face of foreign entry and FDI and also with or without FDI in the face of import competition
and ii)
import completion that drives firms to upgrade
2 Deng and Jefferson (2011)
5
Chinese firms that are relatively efficient tend to benefit the most whereas firms that are
relatively weak are more likely to struggle from a loss of market share Specifically the research
shows that in the face of FDI andor import competition the stronger firms tend to load up on
RampD in order to upgrade their capabilities an effort which may be facilitated by the very fact of
FDI andor import competition Using RampD resources the more capable Chinese firms use their
RampD to capture technology from the foreign firms within the same industry or geographic area
or they may use imports in order to reverse engineer products that enter the markets in which
they compete Within these competitive product markets Chinese firms may in particular
benefit from the phenomenon or ldquolearning by usingrdquo which refers to the process of gathering
feedback from markets which are purchasing and using onersquos own products as well as those of
competitors
Table 2 shows the Chinarsquos top five manufacturing import sectors Five of the 10 top
imports are raw materials The table also shows that these same five top manufacturing import
sectors account for 5 of the 8 principal export industries The top industry on both lists ie
electronic equipment is a good example as it includes mobile phones and smart phones and
computers Whereas during the 1990s and early 2000s China was a major importer of these
products or the component that it assembled for re-export presently Chinese companies have
moved substantially up the value chain For the mobile phone industry the succession has
moved from Motorola to Apple to indigenous smartphone suppliers such as Xiaomi For the
computer industry Chinese made and exported Hewlett-Packard laptops and printers have
successively moved up the value chain as has Lenovo in part through the acquisition of the IBM
personal computer unit These are key illustrations of the argument that FDI and imports
competition are a critical aspect of the rising capacity of Chinese firms to establish a substantial
presence on both domestic and international markets They help to explain the dynamics of the
progression of firms as shown in Figure 1 and industries as shown in Figure 2 to move down
the GAP curve resulting in both a degree of catch-up but also in the process experiencing
slower growth of productivity and slower rates of catch-up
Consistent with this account my research with Professor Deng gives support to the
notion of a separating effect in which as the US-China productivity diminishes we tend to
observe the phenomenon of break-out firms This is evident from the fact that within 3-digit
6
industries with smaller gaps we observe a wider spread (or standard deviation) of the firms that
comprise those industries Hence catch-up seems to be a dynamic of the break out of a sub-
group of firms not so much the alternative in which the comparatively backward firms catch-up
to the industry norm or drop out altogether
The computer chip industry is added to the lists shown in Table 3 This is because it is
such a critical industry and also because it may well be in the early stages of the dynamic in
which an industry with a high intensity of imports transforms itself into becoming a substantial
exporter This testimony later references the computer chip industry
Finally with respect to the efficiency comparisons of the US and China Table A1 in
the Annex shows the comparative productivity of 3 US firms and 3 Chinese firms My
colleague Aiyi Zhang and I prepared undertook this analysis so that unlike Table 1 which
compares various groupings of Chinese firms with the US average we could instead attempt to
compare the a Chinese frontier with a US frontier The firms used for Table A1 both the
Chinese and US firms are virtually all publicly traded some of the Chinese firms are well
known The comparisons show that relative to the all-industry gap comparisons the US-China
gap using the top 3-firm data is somewhat smaller At 228 the average 3-firm gap is about 25
smaller than the 306 gap for the comparative full-industry average comparisons Five industries
exhibit a gaps of 15 or less while two of these ndash primary metals and computers ndash appear to
match or better their US counterparts Clearly convergence and occasional catch-up are
ongoing phenomenon in Chinese manufacturing
3 Comparisons of Chinarsquos Innovation System with the US
and other OECD Country Systems
Clearly the surge in innovation effort and measures of innovation output is a critical part of
the story of the rapidly growing scope and capabilities of Chinese industry Table 6 shows some
summary statistics which may be helpful
Highlights of Table 3
First we see from the total column that by 2012 China was well on its way to
entering into the2-3 range of RampDGDP intensity occupied by most of the larger
7
OECD countries S Korea Singapore and Taiwan However as shown in the basic
column the composition of Chinese RampD spending is notably tilted away from basic
research which accounts for about 5 of total RampD spending In 2012 for the US
that proportion was approximately 18
Higher education accounts for nearly 55 of basic RampD Chinarsquos research
institutions account for 40 Over the past 20 years universities have been playing a
larger role in Chinarsquos basic research while the relative contribution of the research
institute sector has diminished
At 762 the principal source of RampD spending is enterprise self-raised funds This
proportion exceeds most OECD countries
In 2012 government accounted for 216 of total RampD spending in Chinese industry
The RampD contribution of the foreign sector was largely through spending within
foreign-invested firms ie the enterprise sector
Table 3 also shows the government share of RampD spending by province
Unsurprisingly due to its concentration of universities and research institutes (eg
the Chinese Academy of Sciences) at 537 Beijing shows the highest proportion of
government-sourced RampD Liaoning Province the seat of a substantial number of
state-owned enterprises received 23 of its RampD spending from the government At
the other end of the spectrum Zhejiang Province known for its robust private sector
shows a government funding share of 83
Significance of Figure 5 Figure 5 trends in Federal RampD shows federally-funded
RampD spending as a share of GDP While the measure we have used for the Chinese
governmentrsquos share is measured relative to total RampD spending this figure shows federal RampD
as a share of GDP However because we know that for the US total RampD spending is in the
range of 28 of GDP we can infer that as a share of total RampD spending in the US the
governmentrsquos share is about 29 of the total Governmentrsquos share appears to have declined over
the past 30 years particularly that of defense spending
Highlights from Table 4 While not the only measureable output of RampD activity the
incidence and quality of patenting may be the most important single measure of RampD
productivity This is the case notwithstanding extensive survey literature that indicates that at
8
least for American firms with the exception of the drug industry patenting is not the principal
means of securing intellectual property3
Table 4 documents the distribution of patenting in Chinarsquos State Intellectual Property
Office (SIPO) across three patent types (invention utility and design) during 2012 In China
invention patents are typically of substantially higher quality than the alternative utility model
and design patents The former of 20 years duration are subject to greater patent review
scrutiny than the latter two types which receive only 10 years of protection Table 3 also shows
the distribution of patenting activity by domestic and foreign patent applicants and patent holders
and for domestic patent sources it shows the type of organizational unit (eg enterprise
university etc) The lower tier of Table 4 shows some comparative patenting statistics from the
US patent office
Since Chinarsquos patent law was established in 1985 the
incidence of patenting has surged so that SIPO now receives more patent applications than any
other patent office in the world
Here are some of the highlights from Table 4
Only about 13 of the patent applications are for invention patents versus approximately
90 for the US Among these invention patent applications filed with SIPO
approximately 30 are approved
Foreign-owned entities within China account for approximately 18 of the invention
patent applications and about 337 of the patents grants The vast majority of patents
particularly for Chinese patenting is concentrated in lower-value utility model and design
patents Because the approval process for utility model and design patents is typically
shorter and less rigorous entities will sometimes file for one of these patent types as a
place holder for an invention patent application Since the review period for invention
patents has been shortened and having more than one patent application pending for the
same innovation can result in legal complications this practice has been somewhat
curtailed
3 See Cohen Nelson and Walsh (2000) who find substantial differences across industries in strategies used to secure IP rights For example in most industries secrecy and lead time were cited as more important than patenting as a means of securing intellectual property The pharmaceutical industry was the only industry listing patents as the most important measure
9
Table 4 also reports various data from the USPTO for 2007 and 2014 for granted utility
(invention) patents Among the highlights are
In 2012 China granted 217105 invention patents of which 143847 were granted to
Chinese applicants In 2012 the USPTO granted 3000678 invention patents of which
144621 were granted to US applicants and 156057 to foreign applicants of which
7236 were Chinese filers
There has also been a growing body of research concerning patent production functions
(ie the relationship between inputs to innovation notably RampD and patent outcomes) the
impact of government patenting incentives on patent quality and the implications of patent
production for firm performance including productivity and profitability
Hu and Jefferson (ldquoGreat Wall of Patentsrdquo 2007) find a relatively weak link between
RampD and patenting ie substantially weaker than counterpart US and EU studies
however FDI spillovers exhibit a substantial impact on patent production That RampD is
even less important for foreign firms that patent indicates that at least during the earlier
2000 period most of the intellectual property that foreign firms patented in China was
transferred from parent companies
Various provincial governments offer incentivesrewards for either filing patents andor
securing patent grants The research shows that incentives to file patents led to more
filings however a lower proportion of these were granted Incentives for securing patent
grants seemed to motivate patent applicants to draw the scope of the patent claim more
narrowly thus improving the likelihood of approval while at the same time diminishing
the potential value of the patent
Recent research by Hu Zhang and Zhao (2014) find that i) a significant portion of the
surge has resulted from rapid patent growth in regions and industries that had not
previously actively applied for patents and ii) overall the correlation between patents and
RampD and between patents and labor productivity has become weaker over time
particularly for the regionsindustries with relatively less patenting activity This may
reflect the establishment of patenting incentives for these regionsindustries thus
increasing the incentive to patent and its incidence even as new intellectual property has
not been created to the same degree
10
4 Comparisons and Weaknesses
In summary Chinese manufacturing has been steadily closing the productivity gap with
US manufacturing It appears that China has created its own technology frontier although on
average the firms constituting that frontier may on average exhibit levels of sales per worker
that are about one-half that of the US
Chinarsquos innovation system has transformed dramatically of the past 20 years Over this
period Chinarsquos RampDGDP ratio has risen from less than 06 to more than 2 putting it in a
range similar to that of the US and other OECD countries However the growing parity in
quantity has not been matched with respect to quality comparisons
No more than 5 of Chinese RampD is dedicated to basic research This proportion
compares unfavorably with the US which dedicates approximately 18 of its RampD spending
to basic research and to other OECD countries which typically dedicate in the range of 20 of
RampD spending to basic research
Only one-quarter of the patent grants issued by SIPO and still in force invention patents
more than three-quarters are utility model or design patents for which the patent review is
relatively cursory and the patent duration is 10 years rather than the 20-year duration assigned to
invention patents Moreover for domestic patents still in force only about 15 are invention
patents Notwithstanding the rates of growth of SIPO invention patents and the fraction of those
issued to Chinese residents is growing rapidly Also from a low based patents issued to
Chinese residents by the USPTO are growing rapidly surpassing the UK in 2014 but still some
distance behind S Korea and Taiwan Concerning specific RampD performing sectors the
following weaknesses are evident
In the enterprise sector researchers find low returns to RampD Also at the firm level
there is evidence of a weak correlation between patenting and firm-level productivity growth
Moreover while provincial governments often extend incentives to firms for patenting such as
for securing patent grants the incentive for patent grants appears to motivate filers to narrow the
claims on their patent applications hence lowering the quality of the eventually-approved patents
11
In the higher education sector all OECD countries dedicate larger portions of their RampD
spending to higher education which performs most of basic research generally in the vicinity of
the share of RampD spending captured by the Chinese universities Within higher education
researchers often encounter limits to their autonomy insofar as schools and departments operate
on a more hierarchical basis so that grants and rewards may not be well-aligned with merit
Also university professors often engage extensively with consulting with little research payoff
Finally Chinarsquos research sector while reporting a robust publication record tends to be
surprisingly weak on patent production While Chinarsquos research institutes account for 15 of
total RampD spending that sector accounts for only 78 of basic research and 55 of total
invention patents granted One development that may alter the relatively weak contribution of
Chinarsquos universities and research institutes to Chinarsquos patent production is the implementation
of a Chinese version of Bayh-Dole Act which in China as it has in the US enables recipients
using government-financed research funds (ie universities and research institutes) to secure
patents and retain the revenue generated by their lease or sale
Notwithstanding these weaknesses of Chinarsquos RampD system one development that bears
particular interest is the growth of university-corporate collaborations One such notable
collaboration is that of the Tsinghua Unigroup which has developed acquisitions-partnerships
with chip makers including the acquisition of Spreadtrum in which Intel subsequently acquired a
20 share This mode of collaboration may well be the harbinger of the sustained growth and
development of Chinarsquos semi-conductor industry along the trajectory shown in Figure A1
5 US Recommendations
The following recommendations are intended to follow from the previous testimony
While China is substantially reducing the innovation gap with the US with respect to
several key measures in terms of quality Chinarsquos measures of the quality of innovation outputs
continues to lag substantially behind the US Nevertheless the quality gap is likely to continue
closing over the next several decades
12
In light of this substantial narrowing of the US-China innovation gap the US should
seek to retain and develop its comparative global advantage which is that of basic research
including the robustness of US higher education as the focal point of its basic research activity
Even if the US sustains and expands its commitment to basic research the US should
anticipate that it is very likely that in many quality dimensions of innovation China will
eventually eg within the next 50 years if not well before catch-up with the US If this is
managed properly so that both countries are expanding the international technology frontier
global welfare should substantially gain From this perspective of likely catch-up it is very
unlikely that in 20-25 years that the US will be able to out-spend China on innovation and
defense much of which involves RampD More importantly beyond that ie over a 30-50 year
horizon it is very unlikely that the US will be able to outperform China as the leading global
innovator with the leading defense technologies
In light of this catch-up trajectory in the near term the US should seek to engage with
China in ways that are possible so as to establish a record of collaboration Specifically for
example the US should join the Asia Infrastructure and Investment Bank (AIIB) Also for the
purpose of engaging and over time collaborating and integrating with Chinarsquos rapidly
expanding research capabilities as suggested earlier the US government should fund US
universities so that they can
The following are copies of the slides that were used for
Jeffersonrsquos presentation on April 22
13
Figure 1 Shows how the labor productivity growth (gLP) of Chinese firms responds to the technology gap with the international frontier
(ie the US)hellipthe larger the gap the greater gLP
14
Figure 2 Shows a similar relationship for the rate of growth of catch-up (ie gap reduction) relative to the size of the US-China productivity gap ndash1 industries to the NW (mostly iron and steel due to relatively slow US LP growth) 2 industries to the SE (petroleum and coal products chemicals apparel computer
and electronic products due to relatively high US LP growth
15
Figure 3 Reversals ndash 1998-2007 rising capacity utilization in the iron and steel industry sharp post-2007 decline in capacity utilizationhellip
16
Figure 4 12th 5-year plan Ch 9 (sec 4) ldquoDrive advantaged enterprises to carry out alliance x-regional merger and reorganization and increase
industry concentration with an emphasis onhellipiron and steel (and automobile cement machine buildinghellip) The problemhellip
(source Dr Markus Taube Univ of Duisburg-Essen)
17
Table 1 Has China developed its own internal frontier 1 Top decile Chinese firms gt US average (318) and
top 10 Chinese firms gtgt US average (1518)2 3-firm comparisons (publicly traded companies)
USChina salesemployee advantage = 228 (see Table
18
Table 2 What drives the catch-up 1 Domestic firms with an edge benefit the most from FDI and import competition rarr separation effect with break out firmshellip
2 Five (5) of top 8 import sectors are also top 5 mfg export sectors3 The computer chips sector is on trackhellip
19
Table 3 Chinarsquos innovation systemhellipachievements challengesnumerical catch-up quality lag
1 China as an ldquoinnovative societyrdquohellipRampDGDP = 20 vs US 282 basic research sharehellip50 vs US 183 government sharehellip216 vs US ~29
Table 5 Intramural RampD Expenditure by Performing Sector (billion yuan)
year total Basic () Applied () Experimental Development ()
1995 - Total 3487 (057) 181 (52) 920 2386
2007 ndash Total
2012 - Total 102984 (198) 4988 (48) 11620 (113) 83676 (839)
Enterprises 78422 (762) 071 2389 75963 (969)
Government sector (ie Research institutions)
15489 (150) 1979 (78) 4693 (303) 8817 (519)
Higher education 7806 (76) 2757 (353) 4027 (516) 1022 (131)
Private non-profit 1267 (12) 181 511 574
Intramural RampD by Source (billion yuan)
year Government Self-raised by enterprises
Foreign funds Other funds
2007 ndash 37102
2012 ndash 102984 22213 (216) 76250 (740) 1004 (10) 3516 (34)
Of which
Beijing - 10634 5660 (532) 3686 479 808
Liaoning ndash 3909 900 (230) 2964 008 036
Jiangsu ndash 12879 1388 (108) 10986 096 409
Zhejiang ndash 7229 604 (83) 6444 031 147
Share of GDP share of total RampD expenditure
20
Figure 5 A matter of concernhellipgt US Federal RampD as a share of total RampD - ~29 and declininghellipless than
most large OECD countries gt Non-defense federal RampD as a share of total ~ 14
21
Table 4 Key points re patents and publications 1 China has surpassed the US in total patents filed and granted
2 China has surpassed the US in invention patents granted to domestic filers3 China has surpassed the UK in USPTO patents granted lags S Korea and Taiwan
4 Ratio of total patents in force low relative to other countries5 China ranks 2nd in cited papers 7th in total citations
22
Comparisonsweaknessesbull All OECD countries dedicate substantially larger portions of RampD to basic
research (3-5x)bull Enterprise sector
Declining patent production returns to RampD hellipalso at the firm level weak correlation between patenting and productivity growth
Local government patenting incentives may be unhelpful eg incentives for patent grants appear to motivate filers to narrow the claims on their patent applications rarr lower quality
bull Higher education sector All OECD countries dedicate larger portions of higher education which
performs most of basic research (2-3x) Limits to autonomy-creativity in higher-ed (hierarchicalmuddled incentives)
bull Research institute sector Strong on publications surprisingly weak on patents 15 of total RampD 78 of basic research 55 of total invention patents
granted bull Notable Innovations
Chinese version of Bayh-Dole Act ndash enables recipients (ie universities and research institutes to secure patents for government-funded research)
University-corporate collaborations (eg Tsinghua Unigroup with acquisitions-partnerships with Chip Makers including Spreadtrum in which Intel has a 20 share)
23
US - recommendations
bull Increase spending on basic research ndash retain this comparative advantage as long as possible
bull Anticipate that it is very likely that China will catch-uphellipie It is very unlikely that 25 years from now the US will
be able to out-spend China on innovation and defense orhellipover the following 25 years be able to out-perform China in these areasTo the extent possible seek to establish coordination
andor joint limits on such spendinghellipbull Specificallyhellip Join the AIIBIncrease basic research for US universities and
Chinese graduate student research engagement
24
Annex
Additional tables and figures
25
Table A1 Chinese-US comparisons 2012-2013 Salesemployee ($1000) Chinese US USChina NBS all 3-firm US-
BEA all 3-firm USChina
all 3-firm
comparisons Footwear 1709 2470 5249 8577 322 347 Textiles 857 690 2168 1937 253 281 Apparel 540 3001 1212 3486 224 116 Paper 1272 2366 4314 3315 339 140 Printing 840 1029 1808 1918 215 186 Petroleum 5929 7109 71495 29368 1206 413 Chemicals 1874 2329 9121 11744 487 504 Plastic 1018 1946 3115 3050 306 157 Wood 1081 1030 2079 4323 192 411 Non-metal 1201 1171 2553 3908 213 338 Primary metals 2900 7469 7796 6254 269 084 Fabricated metal 1158 3701 2324 5546 201 150 Machinery 1268 3057 3271 4092 258 134 Computers 1203 9864 3166 9634 263 098 Electrical 1325 2250 3101 3445 234 153 Motor 1686 3276 5130 7078 304 216 Furniture 739 953 1650 1679 223 176 Telecomm Equip na 2298 na 4756 na 207 Mean 1478 3111 7192 6339 306 228 Comparisons of the average salesemployee (generally) for 3 publicly-traded companies in China and the US Information for the individual firms was drawn from the internet andor annual reports
26
Figure A1
27
References
Cohen Wesley Richard Nelson and John Walsh (February 2000) ldquoProtecting their intellectual assets Appropriability conditions and why US manufacturing firms patent (or not)rdquo NBER Working Paper 7552 Deng Paul and Gary Jefferson (2011)ldquoExplaining Spatial Convergence of Chinarsquos Industrial Productivityrdquo (with Paul Deng) Oxford Bulletin of Economics and Statistics Vol 73 Issue 6 pp 818-832
Hu Albert Zhang and Zhao (2014) ldquoChinarsquos patenting surge from 2007 to 2011 more innovation or just more patentsrdquo 2014 Hu Albert and Gary Jefferson (2009) ldquoThe Great Wall of Patents ldquoA Great Wall of Patents What is Behind Chinarsquos Recent Patent Explosionrdquo Journal of Development Economics 90(1) 57-68 Taube Marcus (September 2014) ldquo Driving Forces of Institutional Change in China Global Models and Chinese Idiosyncrasiesrdquo Presented at the annual conference of the CHINESE ECONOMIC ASSOCIATION (EuropeUK) Gothenburg Sweden September 2014
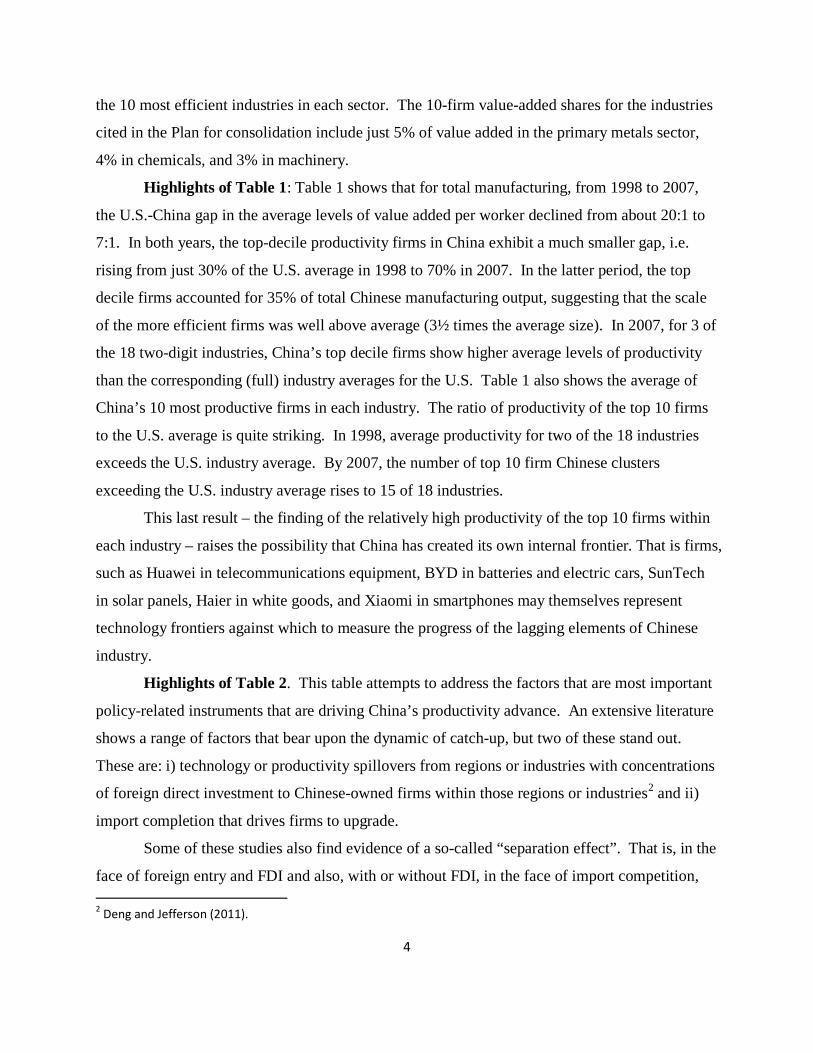
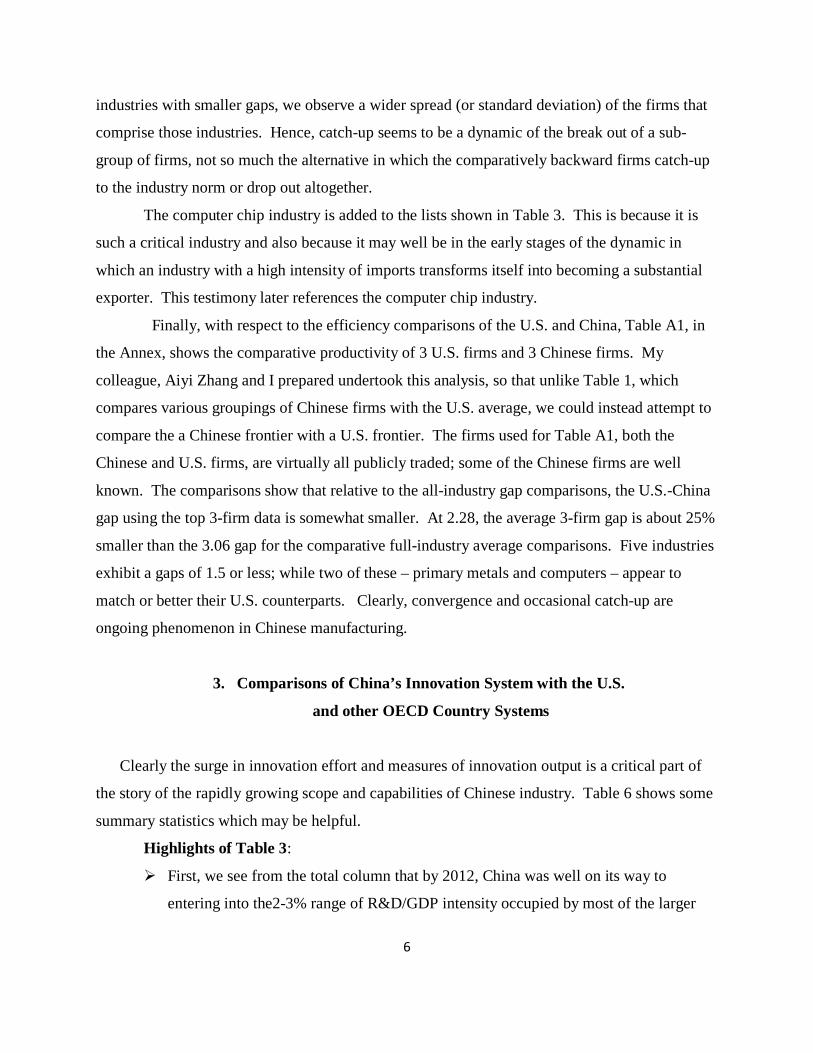
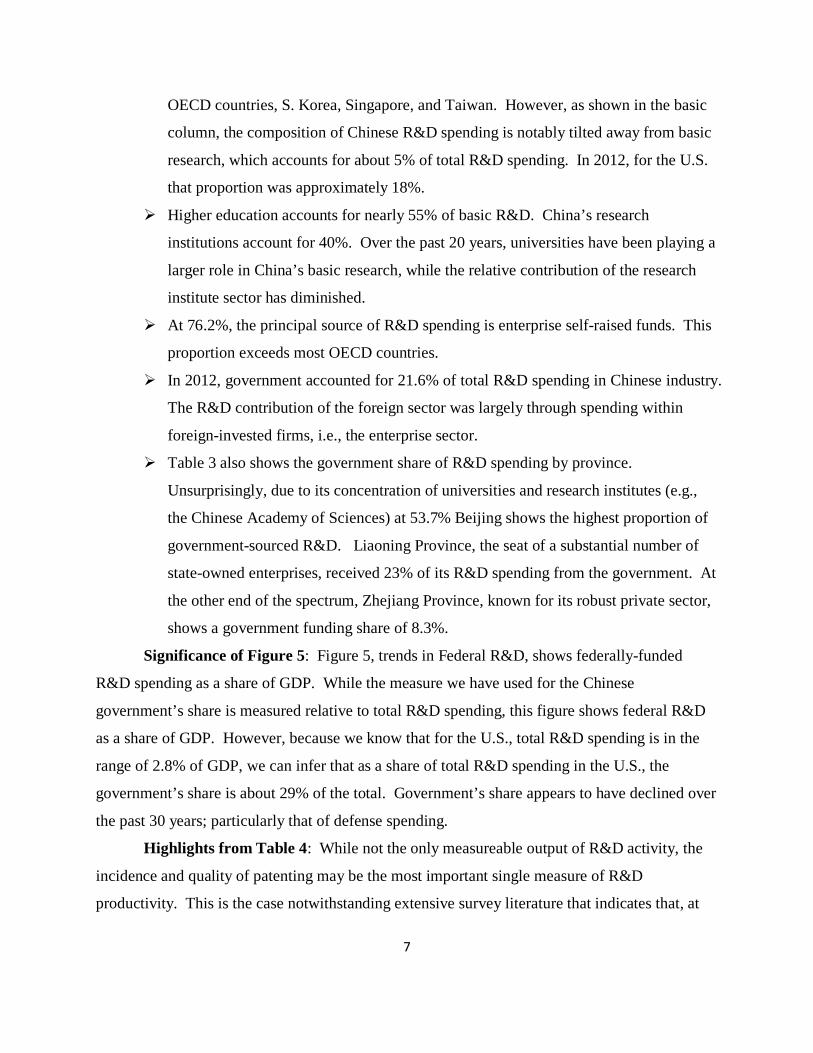
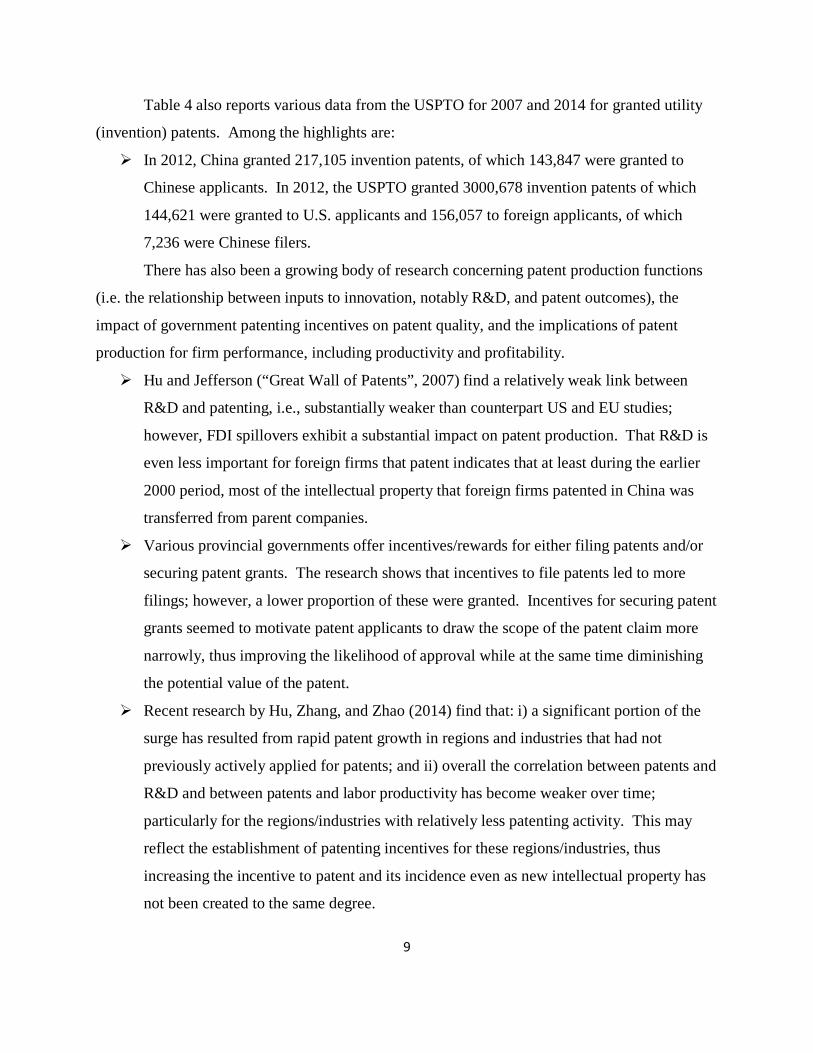
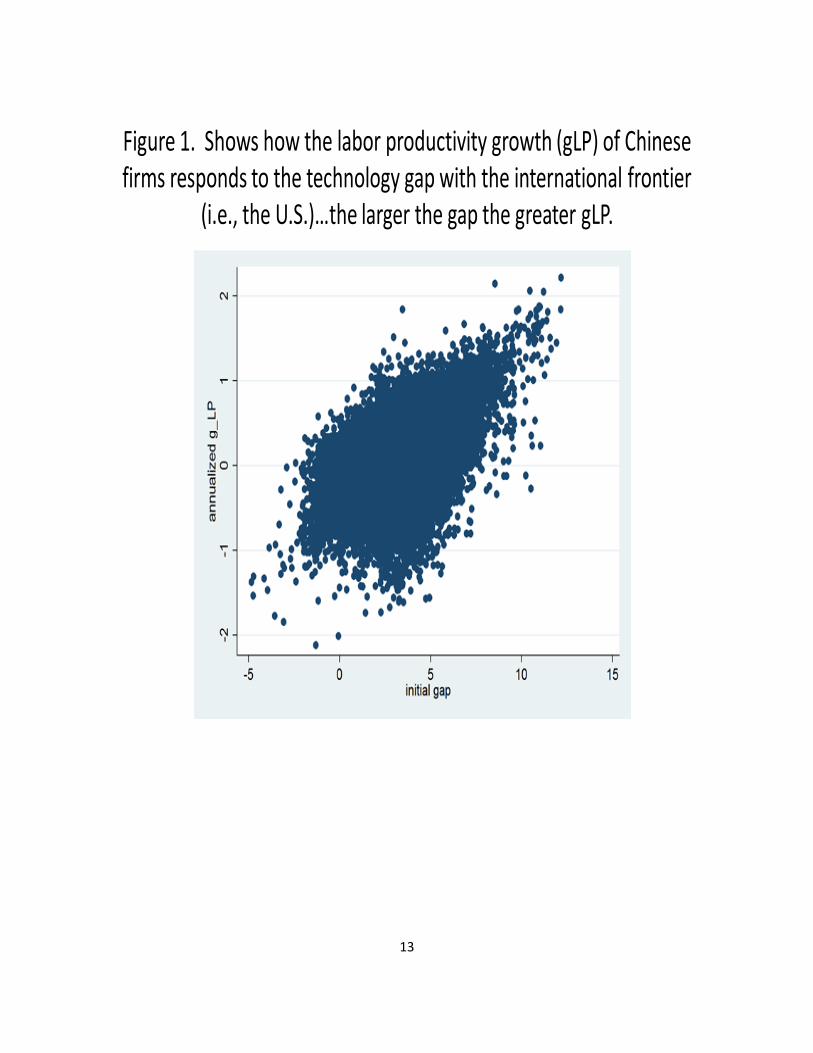
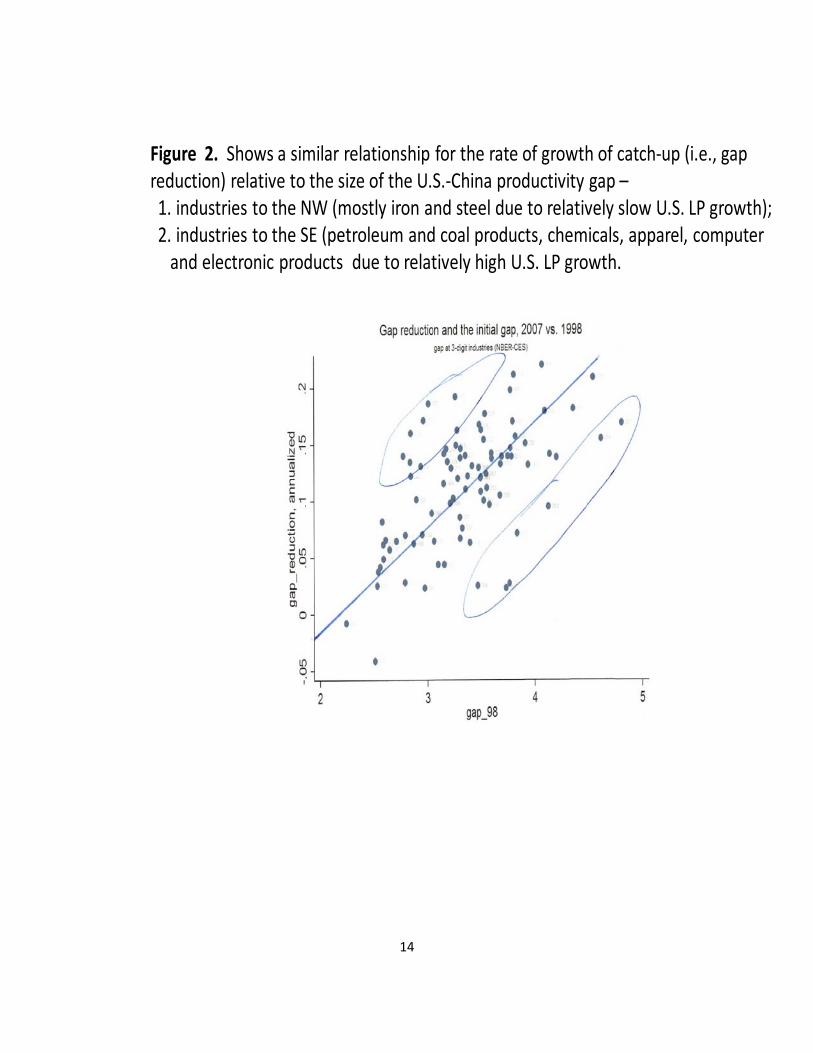
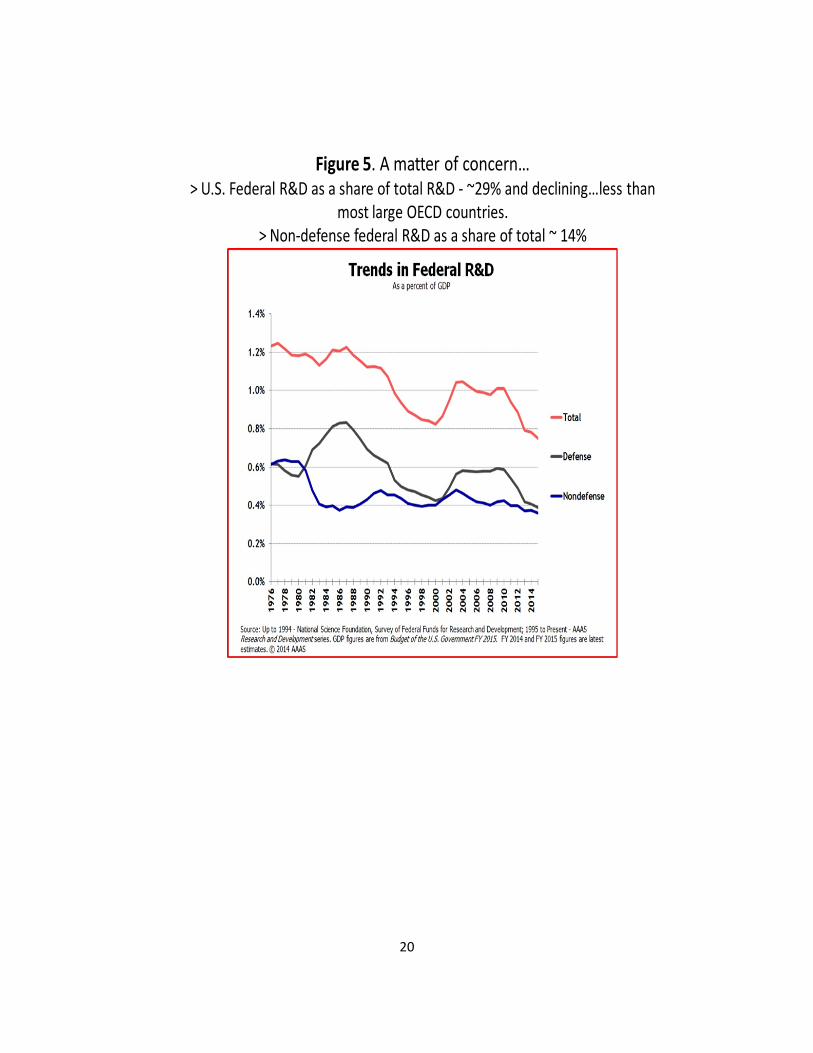
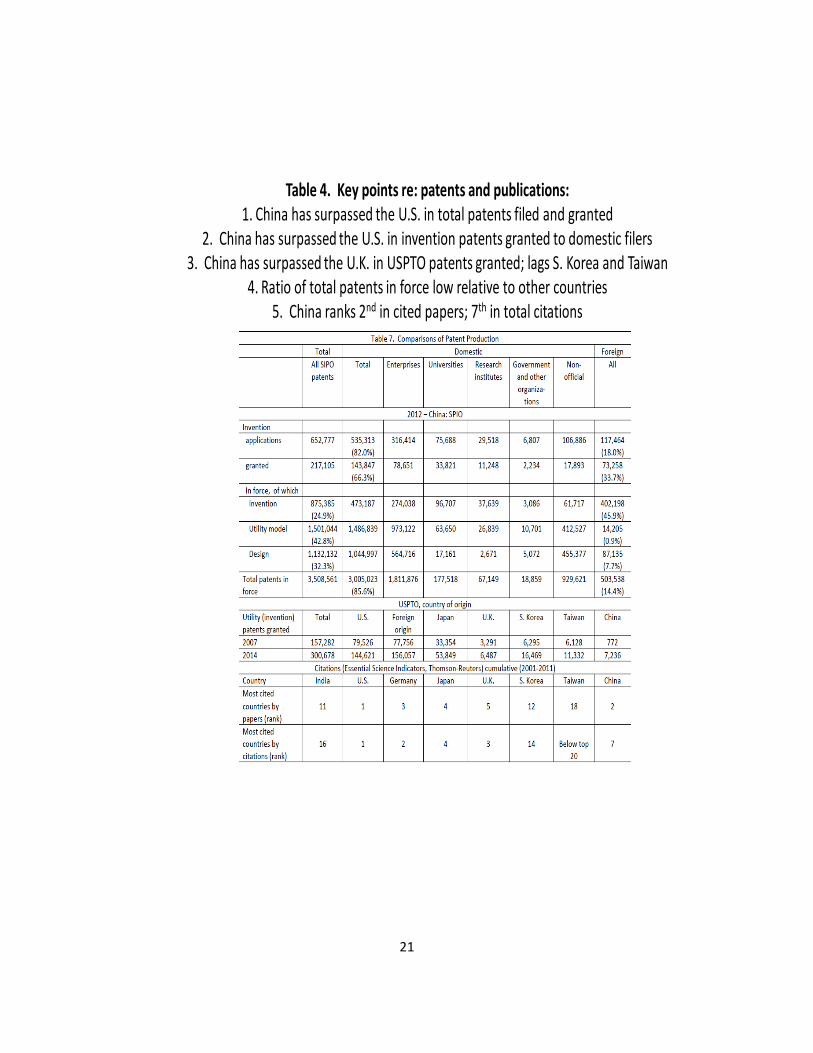
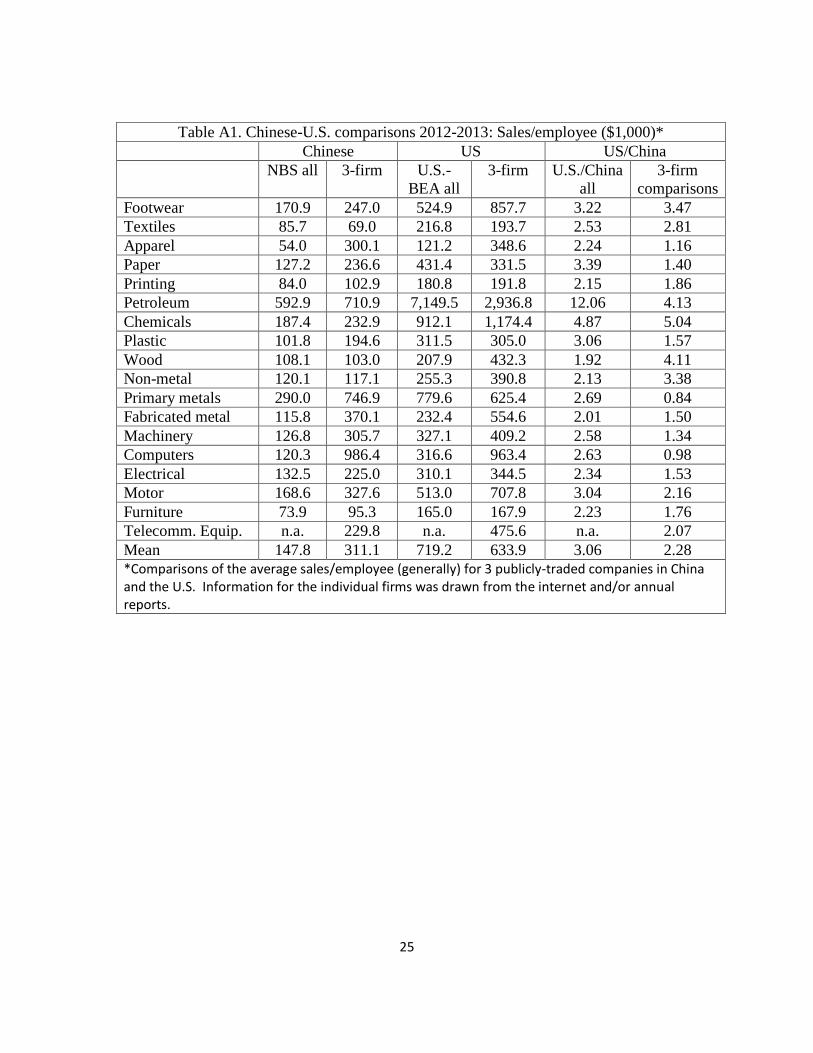