UPPER CALCASIEU RIVER WATERSHED TMDL FOR BIOCHEMICAL OXYGEN-DEMAND SUBSTANCES OR POLLUTANTS
SUBSEGMENT 030101
SURVEYED: JULY 24-25, 2001
TMDL REPORT
By:
Engineering Group 2 Environmental Technology Division Office of Environmental Assessment
Louisiana Department of Environmental Quality
January 7, 2002
Upper Calcasieu River Watershed TMDL for Dissolved Oxygen Subsegment 030101 Originated: January 9, 2002
ii
EXECUTIVE SUMMARY This report presents the results of a watershed based, calibrated modeling analysis of Upper Calcasieu River. The modeling was conducted to establish a TMDL for biochemical oxygen-demanding pollutants in the Upper Calcasieu River watershed. The model extends from its headwaters to its subsegment boundary at the Hwy 8 Bridge. The Upper Calcasieu River watershed is subsegment 030101 of the Calcasieu River Basin (Basin 03). Subsegment 030101 is comprised of Upper Calcasieu River and several unnamed intermittent tributaries. The watershed is 30,710 acres in area. The area is sparsely populated and land use is dominated by upland and wetland forest. Only four treatment facilities were found to have loads, which could affect the dissolved oxygen in the tributaries feeding the mainstem water body. However they should have no appreciable affect on the dissolved oxygen in the 305b listed water body. These were not included in the modeling effort but were addressed in the TMDL calculation using their existing state policy based permit limits. Input data for the calibration model was developed from data collected during the July, 2001 intensive survey; data collected by LDEQ at monitoring stations in the watershed; the LDEQ Reference Stream Studies; USGS low flow publications; and data garnered from several previous LDEQ studies on non-point source loadings. A satisfactory calibration was achieved for the main stem. In those cases where the calibration was not as accurate, the difference was in the conservative direction. For the projection models, data was taken from the ambient water temperature records. The Louisiana Total Maximum Daily Load Technical Procedures (06/15/2001), where applicable, have been followed in this study. Upon review of several long-term LDEQ ambient stations in the area, it was determined that the critical period for dissolved oxygen is the summer (low flow) condition. Thus, seasonal modeling was limited to low flow/high season temperature scenarios. The model used was LAQUAL, a modified version of QUAL-TX, which has been adapted to address specific needs of Louisiana waters. Upper Calcasieu River, Subsegment 030101, was not on any 303(d) list; however, the subsegment was part of the 1999 ambient monitoring program and listed in the 2000 305(b) report. The subsegment was found to be "not supporting" its designated use of Fish and Wildlife. It was "fully supporting" the Primary and Secondary Contact Recreation as well as it’s agricultural uses. Upper Calcasieu River was subsequently scheduled for TMDL development with other listed waters in the Calcasieu River Basin. The suspected causes of impairment are organic enrichment/low D.O.. The suspected sources of impairment are natural sources. This TMDL addresses the organic enrichment/low DO impairment. The results of the projection modeling show that the water quality standard for dissolved oxygen of 5.0 mg/l can be maintained during the summer critical season with an 82.5% reduction of the total non-point pollution. The projection model minimum DO of 5.04 mg/l was from RK 0.3 to RK 0.0, where the baseline zero river kilometer is located at Hwy 8 the subsegment boundary. As stated in the 2000 305b report, the majority of total non-point dissolved oxygen loading is natural background. This fact and the high reduction in the total non-point loading, indicates that the current criteria is inappropriate for this subsegment. A reassessment of the dissolved oxygen criteria is recommended.
Upper Calcasieu River Watershed TMDL for Dissolved Oxygen Subsegment 030101 Originated: January 9, 2002
iii
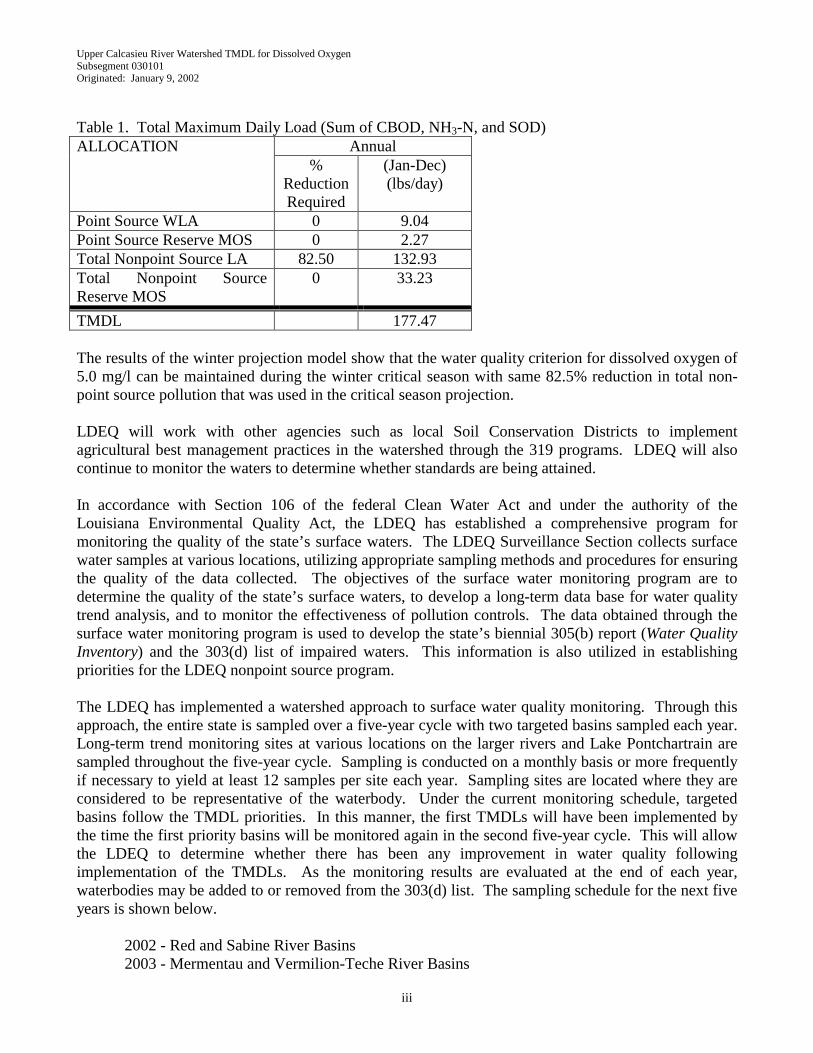
Table 1. Total Maximum Daily Load (Sum of CBOD, NH3-N, and SOD)
Annual ALLOCATION %
Reduction Required
(Jan-Dec) (lbs/day)
Point Source WLA 0 9.04 Point Source Reserve MOS 0 2.27 Total Nonpoint Source LA 82.50 132.93 Total Nonpoint Source Reserve MOS
0 33.23
TMDL 177.47 The results of the winter projection model show that the water quality criterion for dissolved oxygen of 5.0 mg/l can be maintained during the winter critical season with same 82.5% reduction in total non-point source pollution that was used in the critical season projection. LDEQ will work with other agencies such as local Soil Conservation Districts to implement agricultural best management practices in the watershed through the 319 programs. LDEQ will also continue to monitor the waters to determine whether standards are being attained. In accordance with Section 106 of the federal Clean Water Act and under the authority of the Louisiana Environmental Quality Act, the LDEQ has established a comprehensive program for monitoring the quality of the state’s surface waters. The LDEQ Surveillance Section collects surface water samples at various locations, utilizing appropriate sampling methods and procedures for ensuring the quality of the data collected. The objectives of the surface water monitoring program are to determine the quality of the state’s surface waters, to develop a long-term data base for water quality trend analysis, and to monitor the effectiveness of pollution controls. The data obtained through the surface water monitoring program is used to develop the state’s biennial 305(b) report (Water Quality Inventory) and the 303(d) list of impaired waters. This information is also utilized in establishing priorities for the LDEQ nonpoint source program. The LDEQ has implemented a watershed approach to surface water quality monitoring. Through this approach, the entire state is sampled over a five-year cycle with two targeted basins sampled each year. Long-term trend monitoring sites at various locations on the larger rivers and Lake Pontchartrain are sampled throughout the five-year cycle. Sampling is conducted on a monthly basis or more frequently if necessary to yield at least 12 samples per site each year. Sampling sites are located where they are considered to be representative of the waterbody. Under the current monitoring schedule, targeted basins follow the TMDL priorities. In this manner, the first TMDLs will have been implemented by the time the first priority basins will be monitored again in the second five-year cycle. This will allow the LDEQ to determine whether there has been any improvement in water quality following implementation of the TMDLs. As the monitoring results are evaluated at the end of each year, waterbodies may be added to or removed from the 303(d) list. The sampling schedule for the next five years is shown below.
2002 - Red and Sabine River Basins
2003 - Mermentau and Vermilion-Teche River Basins
Upper Calcasieu River Watershed TMDL for Dissolved Oxygen Subsegment 030101 Originated: January 9, 2002
iv
2004 - Calcasieu and Ouachita River Basins 2005 - Barataria and Terrebonne Basins 2006 - Lake Pontchartrain Basin and Pearl River Basin (Atchafalaya and Mississippi Rivers will be sampled continuously.)
Upper Calcasieu River Watershed TMDL for Dissolved Oxygen Subsegment 030101 Originated: January 9, 2002
v
TABLE OF CONTENTS
EXECUTIVE SUMMARY ii LIST OF TABLES vi LIST OF FIGURES vii 1. Introduction 1 2. Study Area Description 1
2.1 General Information 1 2.2 Water Quality Standards 4 2.3 Wastewater Discharges 4 2.4 Water Quality Conditions/Assessment 5 2.5 Prior Studies 5
3. Documentation of Calibration Model 5 3.1 Program Description 5 3.2 Input Data documentation 7
3.2.1 Model Schematics and Maps 8 3.2.2 Model Options, Data Type 2 8 3.2.3 Temperature Correction of Kinetics, Data Type 4 8 3.2.4 Reach Identification Data, Data Type 8 8 3.2.5 Advective Hydraulic Coefficients, Data Type 9 9 3.2.6 Initial Conditions, Data Type 11 9 3.2.7 Reaeration Rates, Data Type 12 9 3.2.8 Sediment Oxygen Demand, Data Type 12 9 3.2.9 Carbonaceous BOD Decay and Settling Rates, Data Type 12 9 3.2.10 Nitrogenous BOD Decay and Settling Rates, Data Type 15 10 3.2.11 Incremental Conditions, Data Types 16, 17, and 18 10 3.2.12 Nonpoint Sources, Data Type 19 10 3.2.13 Headwaters, Data Types 20, 21, and 22 10 3.2.14 Wasteloads, Data Types 24, 25, and 26 10 3.2.15 Boundary Conditions, Data Type 27 11
3.3 Model Discussion and Results 11 4. Water Quality Projections 12
4.1 Critical Conditions, Seasonality and Margin of Safety 13 4.2 Input Data Documentation 14
4.2.1 Model Options, Data Type 2 14 4.2.2 Temperature Correction of Kinetics, Data Type 4 14 4.2.3 Reach Identification Data, Data Type 8 14 4.2.4 Advective Hydraulic Coefficients, Data Type 9 14 4.2.5 Initial Conditions, Data Type 11 15 4.2.6 Reaeration Rates, Carbonaceous BOD Decay and
Settling Rates, Nitrogenous BOD Decay and Settling Rates, Data Type 12 and 15 15
4.2.7 Incremental Conditions, Data Types 16, 17, and 18 15
Upper Calcasieu River Watershed TMDL for Dissolved Oxygen Subsegment 030101 Originated: January 9, 2002
vi
4.2.8 Sediment Oxygen Demand, Nonpoint Sources, Headwaters, Wasteloads, Data Type 12, 19, 20, 21, 22, 24, 25, and 26 15
4.2.9 Boundary Conditions, Data Type 27 16 4.3 Model Discussion and Results 16
4.3.1 No Load Scenario 16 4.3.2 Summer Projection 16 4.3.3 Winter Projection 18
4.4 Calculated TMDL, WLAs and LAs 19 4.4.1 Outline of TMDL Calculations 19 4.4.2 Upper Calcasieu River TMDL 20
5. Sensitivity Analysis 21 6. Conclusions 22 7. References 24 8. Appendices 25
APPENDIX A - Calibration Model Development APPENDIX A1 - Reach parameter calculations APPENDIX A2 - Calibration model input/output and graphs APPENDIX A3 - Calibration model input justification form APPENDIX A4 - Calibration model sensitivity input/output APPENDIX B - Projection Model Development APPENDIX B1 - Critical temperature determinations APPENDIX B2 - Summer projection model input/output and graphs APPENDIX B3 - Summer projection model justifications APPENDIX B4 - Winter projection model input/output and graphs APPENDIX B5 - Winter projection model justifications APPENDIX B6 - Critical temperature DO Saturation calculations APPENDIX C - Survey Data Measurements and Analysis Results
APPENDIX C1 - Overview of survey water quality data APPENDIX C2 - Survey cross-section and discharge sheets APPENDIX C3 - Survey field notes APPENDIX C4 - Continuous monitor graphs APPENDIX C5 - BOD calculation worksheets
APPENDIX D - Historical and Ambient Data APPENDIX D1 - United States census records for Vernon Parish APPENDIX D2 - Ambient data APPENDIX D3 - Subsegment 030101 landuse data
APPENDIX E - Recommended TMDL APPENDIX F - Maps and Diagrams APPENDIX F1 - Reconnaissance survey digital photographs APPENDIX F2 - ARCVIEW mapping APPENDIX F3 - Vector Diagram
LIST OF TABLES Table 1. Total Maximum Daily Load iii Table 2. Land Uses in Segment 030701 1 Table 3. Water Quality Numerical Criteria and Designated Uses 4 Table 4. Discharger Inventory for Subsegment 030701 5
Upper Calcasieu River Watershed TMDL for Dissolved Oxygen Subsegment 030101 Originated: January 9, 2002
vii
Table 5. Total Maximum Daily Load 21 Table 6. Summary of Calibration Model Sensitivity Analysis 22 LIST OF FIGURES Figure 1. Vector Diagram 2 Figure 2. Map of Study Area 3 Figure 3. Calibration Model Dissolved Oxygen versus River Kilometer 12 Figure 4. Summer Projection Model-Dissolved Oxygen versus River Kilometer 18 Figure 5. Winter Projection Model-Dissolved Oxygen versus River Kilometer 19
Upper Calcasieu River Watershed TMDL for Dissolved Oxygen Subsegment 030101 Originated: January 9, 2002
1
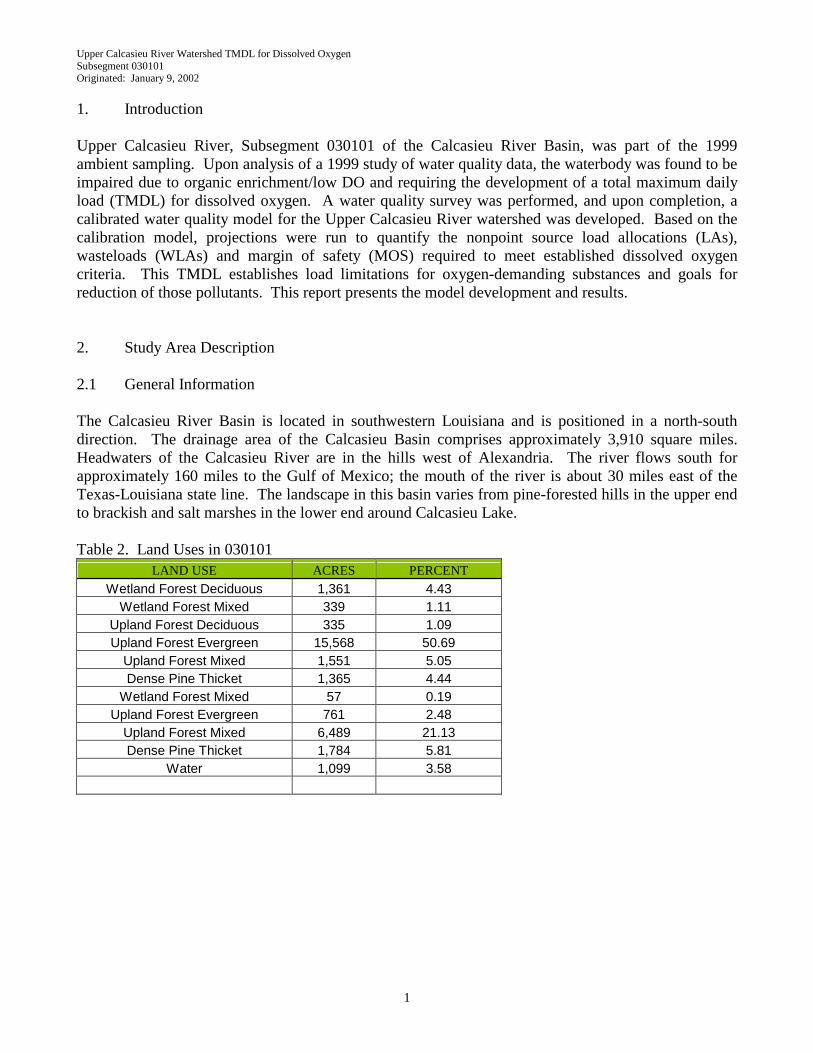
1. Introduction Upper Calcasieu River, Subsegment 030101 of the Calcasieu River Basin, was part of the 1999 ambient sampling. Upon analysis of a 1999 study of water quality data, the waterbody was found to be impaired due to organic enrichment/low DO and requiring the development of a total maximum daily load (TMDL) for dissolved oxygen. A water quality survey was performed, and upon completion, a calibrated water quality model for the Upper Calcasieu River watershed was developed. Based on the calibration model, projections were run to quantify the nonpoint source load allocations (LAs), wasteloads (WLAs) and margin of safety (MOS) required to meet established dissolved oxygen criteria. This TMDL establishes load limitations for oxygen-demanding substances and goals for reduction of those pollutants. This report presents the model development and results. 2. Study Area Description 2.1 General Information The Calcasieu River Basin is located in southwestern Louisiana and is positioned in a north-south direction. The drainage area of the Calcasieu Basin comprises approximately 3,910 square miles. Headwaters of the Calcasieu River are in the hills west of Alexandria. The river flows south for approximately 160 miles to the Gulf of Mexico; the mouth of the river is about 30 miles east of the Texas-Louisiana state line. The landscape in this basin varies from pine-forested hills in the upper end to brackish and salt marshes in the lower end around Calcasieu Lake. Table 2. Land Uses in 030101
LAND USE ACRES PERCENT Wetland Forest Deciduous 1,361 4.43
Wetland Forest Mixed 339 1.11 Upland Forest Deciduous 335 1.09 Upland Forest Evergreen 15,568 50.69
Upland Forest Mixed 1,551 5.05 Dense Pine Thicket 1,365 4.44
Wetland Forest Mixed 57 0.19 Upland Forest Evergreen 761 2.48
Upland Forest Mixed 6,489 21.13 Dense Pine Thicket 1,784 5.81
Water 1,099 3.58
Upper Calcasieu River Watershed TMDL for Dissolved Oxygen Subsegment 080808 Originated: January 9, 2002
2
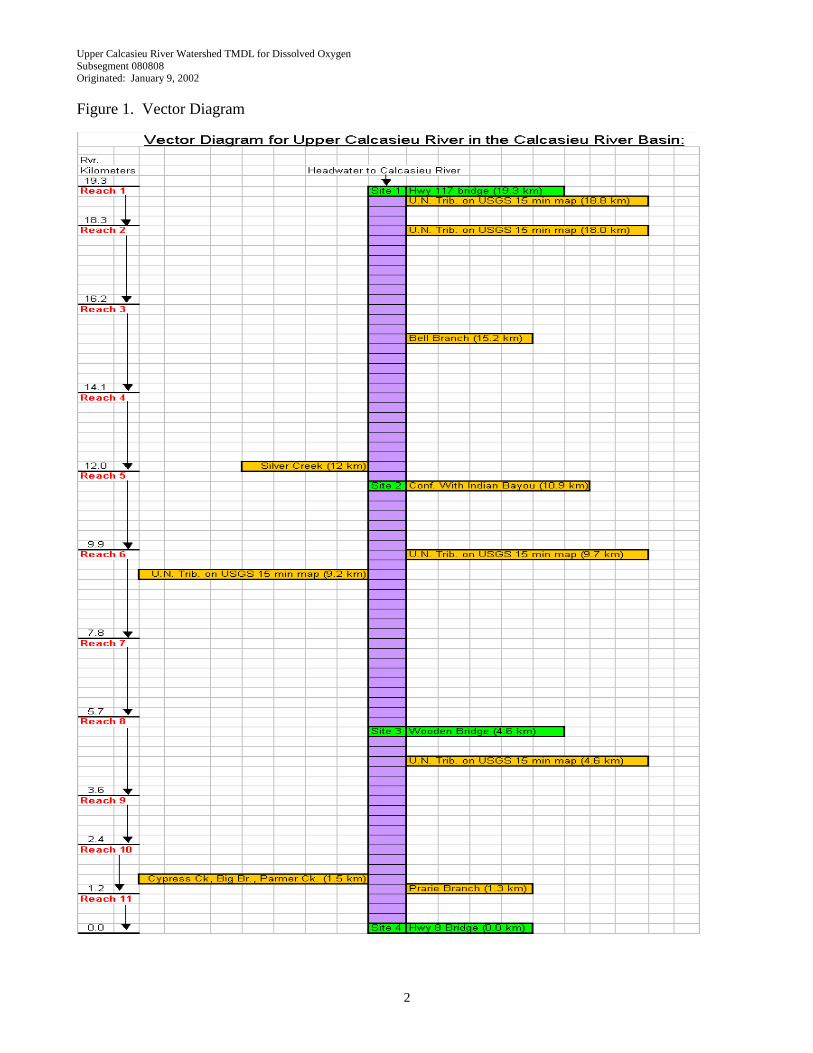
Figure 1. Vector Diagram
Upper Calcasieu River Watershed TMDL for Dissolved Oxygen Subsegment 030101 Originated: January 9, 2002
3
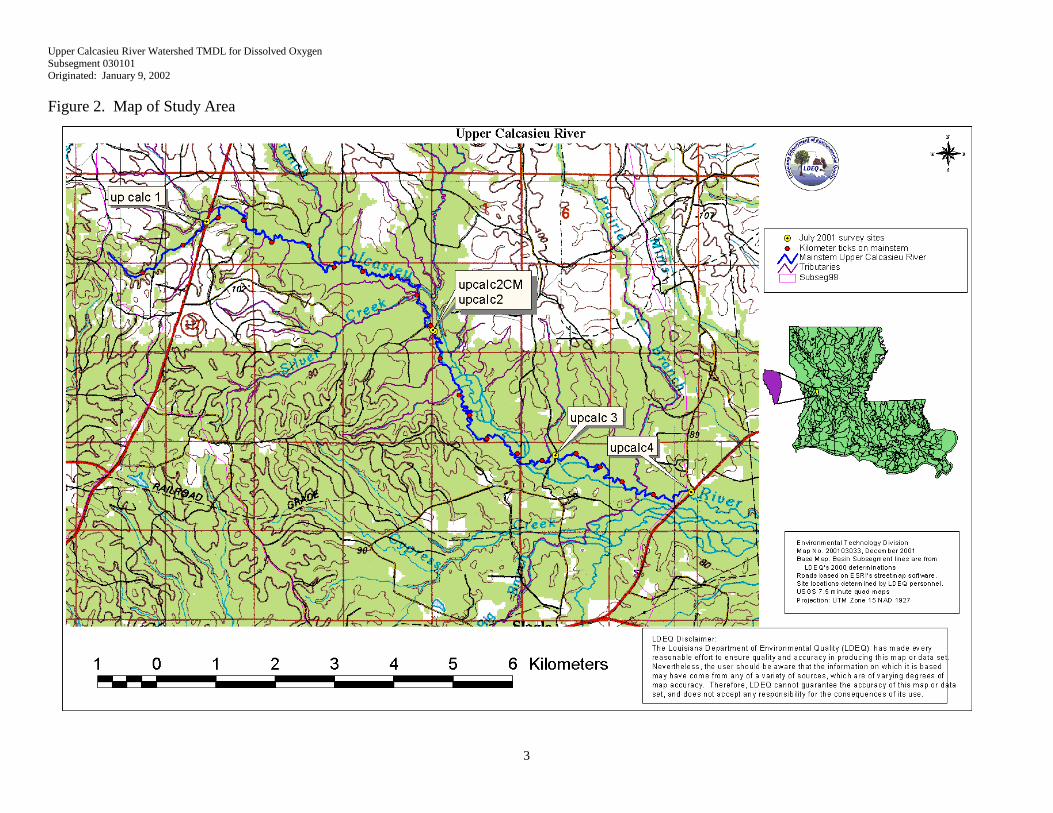
Figure 2. Map of Study Area
Upper Calcasieu River Watershed TMDL for Dissolved Oxygen Subsegment 030101 Originated: January 9, 2002
4
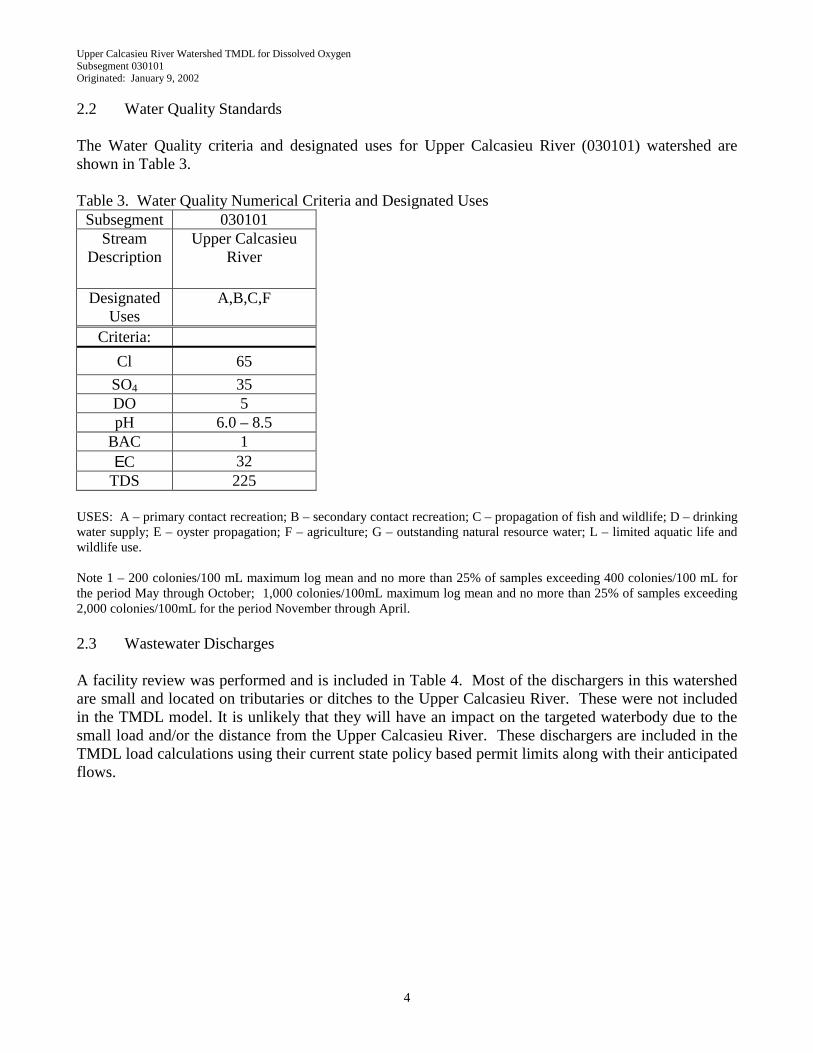
2.2 Water Quality Standards The Water Quality criteria and designated uses for Upper Calcasieu River (030101) watershed are shown in Table 3. Table 3. Water Quality Numerical Criteria and Designated Uses
Subsegment 030101 Stream
Description Upper Calcasieu
River
Designated Uses
A,B,C,F
Criteria: Cl 65
SO4 35 DO 5 pH 6.0 – 8.5
BAC 1 ΕC 32
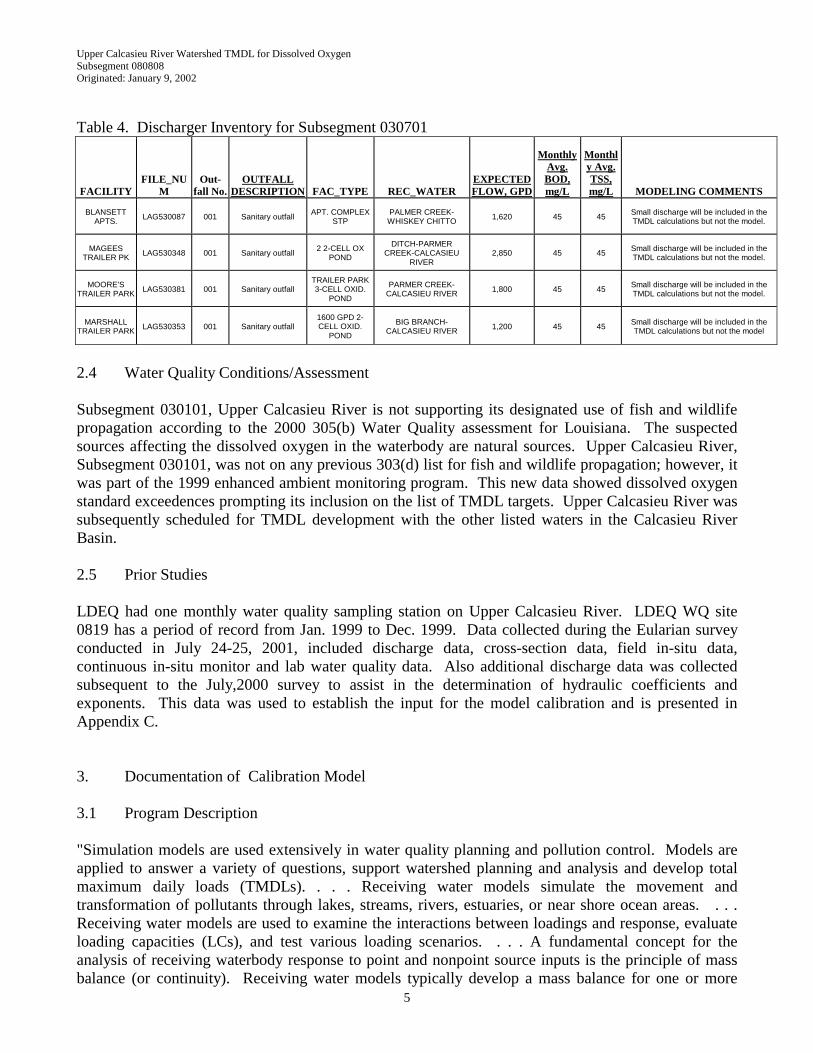
TDS 225 USES: A – primary contact recreation; B – secondary contact recreation; C – propagation of fish and wildlife; D – drinking water supply; E – oyster propagation; F – agriculture; G – outstanding natural resource water; L – limited aquatic life and wildlife use. Note 1 – 200 colonies/100 mL maximum log mean and no more than 25% of samples exceeding 400 colonies/100 mL for the period May through October; 1,000 colonies/100mL maximum log mean and no more than 25% of samples exceeding 2,000 colonies/100mL for the period November through April. 2.3 Wastewater Discharges A facility review was performed and is included in Table 4. Most of the dischargers in this watershed are small and located on tributaries or ditches to the Upper Calcasieu River. These were not included in the TMDL model. It is unlikely that they will have an impact on the targeted waterbody due to the small load and/or the distance from the Upper Calcasieu River. These dischargers are included in the TMDL load calculations using their current state policy based permit limits along with their anticipated flows.
Upper Calcasieu River Watershed TMDL for Dissolved Oxygen Subsegment 080808 Originated: January 9, 2002
5
Table 4. Discharger Inventory for Subsegment 030701
FACILITY FILE_NU
M Out-
fall No. OUTFALL
DESCRIPTION FAC_TYPE REC_WATER EXPECTED FLOW, GPD
Monthly Avg. BOD, mg/L
Monthly Avg. TSS, mg/L MODELING COMMENTS
BLANSETT APTS. LAG530087 001 Sanitary outfall APT. COMPLEX
STP PALMER CREEK-WHISKEY CHITTO 1,620 45 45 Small discharge will be included in the
TMDL calculations but not the model.
MAGEES TRAILER PK LAG530348 001 Sanitary outfall 2 2-CELL OX
POND DITCH-PARMER
CREEK-CALCASIEU RIVER
2,850 45 45 Small discharge will be included in the TMDL calculations but not the model.
MOORE'S TRAILER PARK LAG530381 001 Sanitary outfall
TRAILER PARK 3-CELL OXID.
POND
PARMER CREEK-CALCASIEU RIVER 1,800 45 45 Small discharge will be included in the
TMDL calculations but not the model.
MARSHALL TRAILER PARK LAG530353 001 Sanitary outfall
1600 GPD 2-CELL OXID.
POND
BIG BRANCH-CALCASIEU RIVER 1,200 45 45 Small discharge will be included in the
TMDL calculations but not the model
2.4 Water Quality Conditions/Assessment Subsegment 030101, Upper Calcasieu River is not supporting its designated use of fish and wildlife propagation according to the 2000 305(b) Water Quality assessment for Louisiana. The suspected sources affecting the dissolved oxygen in the waterbody are natural sources. Upper Calcasieu River, Subsegment 030101, was not on any previous 303(d) list for fish and wildlife propagation; however, it was part of the 1999 enhanced ambient monitoring program. This new data showed dissolved oxygen standard exceedences prompting its inclusion on the list of TMDL targets. Upper Calcasieu River was subsequently scheduled for TMDL development with the other listed waters in the Calcasieu River Basin. 2.5 Prior Studies LDEQ had one monthly water quality sampling station on Upper Calcasieu River. LDEQ WQ site 0819 has a period of record from Jan. 1999 to Dec. 1999. Data collected during the Eularian survey conducted in July 24-25, 2001, included discharge data, cross-section data, field in-situ data, continuous in-situ monitor and lab water quality data. Also additional discharge data was collected subsequent to the July,2000 survey to assist in the determination of hydraulic coefficients and exponents. This data was used to establish the input for the model calibration and is presented in Appendix C. 3. Documentation of Calibration Model 3.1 Program Description "Simulation models are used extensively in water quality planning and pollution control. Models are applied to answer a variety of questions, support watershed planning and analysis and develop total maximum daily loads (TMDLs). . . . Receiving water models simulate the movement and transformation of pollutants through lakes, streams, rivers, estuaries, or near shore ocean areas. . . . Receiving water models are used to examine the interactions between loadings and response, evaluate loading capacities (LCs), and test various loading scenarios. . . . A fundamental concept for the analysis of receiving waterbody response to point and nonpoint source inputs is the principle of mass balance (or continuity). Receiving water models typically develop a mass balance for one or more
Upper Calcasieu River Watershed TMDL for Dissolved Oxygen Subsegment 080808 Originated: January 9, 2002
6
constituents, taking into account three factors: transport through the system, reactions within the system, and inputs into the system." (EPA841-B-97-006, pp. 1-30) The model used for this TMDL was LA-QUAL, a steady-state one-dimensional water quality model. LA-QUAL history dates back to the QUAL-I model developed by the Texas Water Development Board with Frank D. Masch & Associates in 1970 and 1971. William A. White wrote the original code. In June, 1972, the United States Environmental Protection Agency awarded Water Resources Engineers, Inc. (now Camp Dresser & McKee) a contract to modify QUAL-I for application to the Chattahoochee-Flint River, the Upper Mississippi River, the Iowa-Cedar River, and the Santee River. The modified version of QUAL-I was known as QUAL-II. Over the next three years, several versions of the model evolved in response to specific client needs. In March, 1976, the Southeast Michigan Council of Governments (SEMCOG) contracted with Water Resources Engineers, Inc. to make further modifications and to combine the best features of the existing versions of QUAL-II into a single model. That became known as the QUAL-II/SEMCOG version. Between 1978 and 1984, Bruce L. Wiland with the Texas Department of Water Resources modified QUAL-II for application to the Houston Ship Channel estuarine system. Numerous modifications were made to enable modeling this very large and complex system including the addition of tidal dispersion, lower boundary conditions, nitrification inhibition, sensitivity analysis capability, branching tributaries, and various input/output changes. This model became known as QUAL-TX and was subsequently applied to streams throughout the State of Texas. In 1999, the Louisiana Department of Environmental Quality and Wiland Consulting, Inc. developed LA-QUAL based on QUAL-TX Version 3.4. The program was converted from a DOS-based program to a Windows-based program with a graphical interface and enhanced graphic output. Other program modifications specific to the needs of Louisiana and the Louisiana DEQ were also made. LA-QUAL is a user-oriented model and is intended to provide the basis for evaluating total maximum daily loads in the State of Louisiana. The development of a TMDL for dissolved oxygen generally occurs in 3 stages. Stage 1 encompasses the data collection activities. These activities may include gathering such information as stream cross-sections, stream flow, stream water chemistry, stream temperature and dissolved oxygen and various locations on the stream, location of the stream centerline and the boundaries of the watershed which drains into the stream, and other physical and chemical factors which are associated with the stream. Additional data gathering activities include gathering all available information on each facility which discharges pollutants in to the stream, gathering all available stream water quality chemistry and flow data from other agencies and groups, gathering population statistics for the watershed to assist in developing projections of future loadings to the water body, land use and crop rotation data where available, and any other information which may have some bearing on the quality of the waters within the watershed. During Stage 1, any data available from reference or least impacted streams which can be used to gauge the relative health of the watershed is also collected. Stage 2 involves organizing all of this data into one or more useable forms from which the input data required by the model can be obtained or derived. Water quality samples, field measurements, and

Upper Calcasieu River Watershed TMDL for Dissolved Oxygen Subsegment 080808 Originated: January 9, 2002
7
historical data must be analyzed and statistically evaluated in order to determine a set of conditions which have actually been measured in the watershed. The findings are then input to the model. Best professional judgment is used to determine initial estimates for parameters, which were not or could not be measured in the field. These estimated variables are adjusted in sequential runs of the model until the model reproduces the field conditions, which were measured. In other words, the model produces a value of the dissolved oxygen, temperature, or other parameters, which matches the measured value within an acceptable margin of error at the locations along the stream where the measurements were actually made. When this happens, the model is said to be calibrated to the actual stream conditions. At this point, the model should confirm that there is an impairment and give some indications of the causes of the impairment. If a second set of measurements is available for slightly different conditions, the calibrated model is run with these conditions to see if the calibration holds for both sets of data. When this happens, the model is said to be verified. Stage 3 covers the projection modeling which results in the TMDL. The critical conditions of flow and temperature are determined for the waterbody and the maximum pollutant discharge conditions from the point sources are determined. These conditions are then substituted into the model along with any related condition changes which are required to perform worst case scenario predictions. At this point, the loadings from the point and nonpoint sources (increased by an acceptable margin of safety) are run at various levels and distributions until the model output shows that dissolved oxygen criteria are achieved. It is critical that a balanced distribution of the point and nonpoint source loads be made in order to predict any success in future achievement of water quality standards. At the end of Stage 3, a TMDL is produced which shows the point source permit limits and the amount of reduction in man-made nonpoint source pollution which must be achieved to attain water quality standards. The man-made portion of the NPS pollution is estimated from the difference between the calibration loads and the loads observed on reference or least impacted streams. 3.2 Input Data Documentation Data collected during an intensive survey conducted from July 24-25, 2001, was used to establish the input for the model calibration and is presented in Appendix C. The flows in each reach and headwater were based on the measured survey discharges and extrapolated for the reaches between measurement sites. Field and laboratory water quality data were entered in a spreadsheet for ease of analysis. Upon review of the measured CBOD daily values it became apparent that there were two distinct CBOD components, which had varying ultimate values as well as decay rates and lag times. The first component started its decay almost immediately while the second component had substantial lag times. The total CBOD curves presented in Appendix C5 is the sum of the two first order equations, which were derived using the Microsoft Excel Solver and were based on the measured daily CBOD values. These two CBOD components were modeled separately as BOD and Nonconservative Material (NCM) in the LAQUAL model. NBOD was modeled as organic nitrogen, ammonia nitrogen and nitrate/nitrite nitrogen. The Louisiana BOD program was applied to the BOD data in a separate spreadsheet and values were computed for each sample taken of ultimate CBOD1, CBOD1 decay rate, CBOD1 lag time, ultimate CBOD2, CBOD2 decay rate, and CBOD2 lag time as well as the ultimate NBOD, NBOD decay rate, and NBOD lag time. The survey data was the primary source of the model input data for initial conditions, decay rates, mainstem water temperature, dissolved oxygen loading, headwater temperature and DO data. Two other sources of data also figured prominently in developing the input data set: reference stream data and previous determinations of nonpoint source

Upper Calcasieu River Watershed TMDL for Dissolved Oxygen Subsegment 080808 Originated: January 9, 2002
8
loadings for several heavily impacted streams. As shown in Figure 3, the DO during the time of the survey was not meeting the standards at any location within the modeled reach. 3.2.1 Model Schematics and Maps A vector diagram of the modeled area is presented in Figure 1 and Appendix F3. The vector diagram shows the locations of survey stations, the reach design, and reach lengths. An ARCVIEW map of the stream and subsegment showing river kilometers, survey stations and other points of interest is also included in Figure 2 and in Appendix F2. 3.2.2 Model Options, Data Type 2 Six constituents were modeled during the calibration process. These were dissolved oxygen, carbonaceous biochemical oxygen demand components 1 & 2, organic nitrogen, ammonia nitrogen and nitrate/nitrite. The continuous monitors did show small diurnal swings, which indicates some algal activity. The algal cycle was not modeled, however the measured chlorophyll A values were included in the initial conditions. This allowed the model to simulate the oxygen production associated with algae without modeling the entire algal cycle. 3.2.3 Temperature Correction of Kinetics, Data Type 4 The temperature values computed are used to correct the rate coefficients in the source/sink terms for the other water quality variables. These coefficients are input at 20 oC and are then corrected to temperature using the following equation: XT = X20 * Theta(T-20) Where: XT = the value of the coefficient at the local temperature T in degrees Celsius X20 = the value of the coefficient at the standard temperature at 20 degrees Celsius Theta = an empirical constant for each reaction coefficient In the absence of specified values for data type 4, the model uses default values. A complete listing of these values can be found in the LA-QUAL for Windows User’s Manual (LDEQ, 2001). 3.2.4 Reach Identification Data, Data Type 8 Model reach breaks were derived from the location of available survey sites and measured stream geometry data. The majority of the reach breaks were spaced uniformly between the survey site locations. The calibration model includes 11 reaches, 193 elements, one headwater, zero wasteloads and tributaries. The projection model did include one tributary into which all four dischargers flow. The tributary was not included in the calibration model because it was not flowing during the July, 2001 survey.
Upper Calcasieu River Watershed TMDL for Dissolved Oxygen Subsegment 080808 Originated: January 9, 2002
9
3.2.5 Advective Hydraulic Coefficients, Data Type 9 Rather than directly inputting the widths and depths of the stream, the model requires entry of the advective hydraulic characteristics (Modified Leopold Coefficients, Exponents, and Constants, Waldon, 2001). These values were derived from the measured values during the July, 2001 survey and a subsequent trip for flow measurement purposes. Site 4 had two flow measurements while the other three sites had only one discharge measurement. With the exception of Site 4, the Leopold coefficients were used for depth and width and the coefficient was determined based on the single flow measurement at the individual site. The measured flow data was used to determine the depth and width coefficients and exponents for Site 4. These assumptions adequately simulated the streams widths and depths during low flow critical conditions. However, in a scenario depicted by higher flow rates, due to storm events, these widths and depths coefficients and exponents should not be used. 3.2.6 Initial Conditions, Data Type 11 The initial conditions are used to reduce the number of iterations required by the model and to set certain parameters for each reach. The values required for this model were temperature, DO, macrophytes and chlorophyll “a” by reach. The input values came from the survey stations located in the vicinity of the reach and were adjusted linearly between sites or from an average of samples taken from adjacent streams considered similar. The exception was macrophytes, these values were determined via calibration. The macrophytes were assumed to be riparian zone plant uptake of flow and nutrients. The incremental flows being simulated by the model would be the differential of the total incremental flow and the plant uptake. Because it was assumed that the macrophyte uptake was attributable to the riparian zone, the oxygen production due to macrophytes was set to zero in the Data Type 3 inputs. The input data and sources are shown in Appendix A3. 3.2.7 Reaeration Rates, Data Type 12 A review of the measured depths and velocities of the waterbody was performed and showed that the Louisiana Equation was an acceptable equation to use on this waterbody. It was the optimum equation based on the available options. The LAQUAL model did compare the calculated Louisiana Equations value to the minimum KL based value and used the higher of the two for each element. Due to the shallow depths in this waterbody the model’s maximum K2 value was adjusted from 10 to 20 (1/day) to accommodate the model’s calculated K2 values. 3.2.8 Sediment Oxygen Demand, Data Type 12 The SOD values were achieved through calibration. The SOD value for each reach is shown in Appendix A3. The conversion ratio of settled CBOD and settled Organic Nitrogen to SOD was considered to be zero for all reaches. 3.2.9 Carbonaceous BOD Decay and Settling Rates, Data Type 12 The decay rates used were based on the bottle rates from the survey or averages of the bottle rates for appropriate groups of stations. Upon review of the measured CBOD daily values it became apparent that there were two distinct CBOD components, which had varying decay rates and lag times. The first component started its decay almost immediately with decay rates ranging from 0.09 to 0.17 per day. The second component had substantial lag times ranging from 12.0 to 13.51 days and decay rates
Upper Calcasieu River Watershed TMDL for Dissolved Oxygen Subsegment 080808 Originated: January 9, 2002
10
from 0.0108 to 0.0298 per day. The total CBOD curves presented in Appendix C5 are the sum of the two first order equations, which were derived using the Microsoft Excel Solver and were based on the measured daily CBOD values. These two CBOD components were modeled separately as BOD and Nonconservative Material (NCM) in the LAQUAL model. The decay and settling rates used for each reach are shown in Appendix A3. 3.2.10 Nitrogen Decay Cycle and Settling Rates, Data Type 13 The organic nitrogen, ammonia nitrogen and nitrate/nitrite were modeled as calibration parameters. The organic nitrogen to ammonia nitrogen decay rates were based on the NBOD bottle rates and the settling rate was based on the LTP CBOD settling rate. The ammonia nitrogen to nitrate/nitrite decay rates were set to the maximum rate as described in the EPA Rates, Constants, and Kinetics Formulations manual. This rate was an unknown value, so the maximum rate was used as a conservative assumption. The restrictive rate of this process is the organic nitrogen to ammonia nitrogen decay, which is why this rate was set to the measured bottle NBOD rates. The decay and settling rates used for each reach are shown in Appendix A3. 3.2.11 Incremental Conditions, Data Types 16, 17, and 18 The incremental conditions are used in the calibration to represent nonpoint source loads associated with flows. Based on the measured flow rates as well as chloride and other conservative parameters, it was determined that there were significant incremental flows entering the system during the survey. Subsequently the incremental flows were determined via calibration in comparison to the measured downstream flows. The flows determined via calibration are the differential of the total incremental flows and the flows associated with plant uptake. The dissolved oxygen for this inflow was set to 2.0 mg/l and the source loading was set to zero. The assumption was that groundwater would have minimal dissolved oxygen demand loads with low dissolved oxygen values entering the stream. Any dissolved oxygen demand loading associated with these flows will be simulated using the Nonpoint Source (Data Type 19) loads. The data and its source for each reach and a summary of the reference stream findings are presented in Appendix A3. 3.2.12 Nonpoint Sources, Data Type 19 Nonpoint source loads, which are not associated with flow are input into this part of the model. These can be most easily understood as resuspended load from the bottom sediments and are modeled as SOD, CBOD1, CBOD2 and organic nitrogen loads. The data and sources are presented in Appendix A3. 3.2.13 Headwaters, Data Types 20, 21, and 22 The Headwater to Upper Calcasieu River is the outflow from two small/unnamed intermittent tributaries. The data and sources are presented in Appendix A3. 3.2.14 Wasteloads, Data Types 24, 25, and 26 A facility review was performed on the subsegment and no major dischargers were found. Four small municipal discharges were located, not discharging directly into Upper Calcasieu River. These
Upper Calcasieu River Watershed TMDL for Dissolved Oxygen Subsegment 080808 Originated: January 9, 2002
11
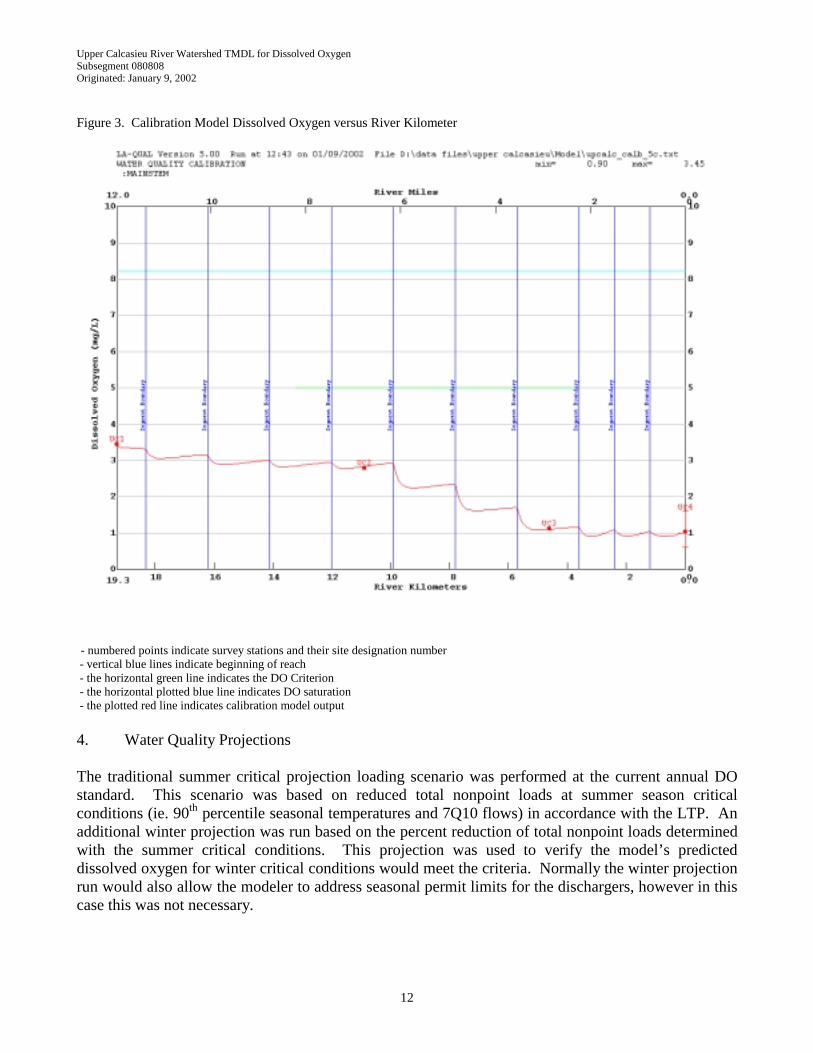
dischargers were included in the TMDL calculation but were not included in the model. See Table 4 for a list of the dischargers. No tributaries were found to be flowing during the water quality survey and thus were not added into the calibration model. Since all four dischargers flowed into the same series of tributaries, their flows were combined and entered into the projection models at background loading conditions. The data and sources are presented in Appendix A3. 3.2.15 Boundary Conditions, Data Type 27 The lower boundary conditions were assumed to be equivalent to the measurements taken at survey station UpCalc4. 3.3 Model Discussion and Results The calibration model input and output are presented in Appendix A2. The overlay plotting option was used to determine if calibration had been achieved. A plot of the dissolved oxygen concentration versus river kilometer is presented in Figure 3. The calibration to flow, depth and width was fairly good from the headwaters to the Hwy 8 bridge at the bottom of the modeled reach. Due to the influence of incremental groundwater and a lack of available chloride data for this inflow a conservative chloride calibration was not attempted. The survey crew was able to obtain discharge measurements at numerous sites along the modeled area. These flows were used to obtain a hydrologic calibration, assuming no additional inflows were occurring during the survey time period. This assumption was supported by visual observations of the survey crew. An adequate calibration was achieved for DO, UCBOD1, UCBOD2, organic nitrogen, ammonia nitrogen and nitrate/nitrite on the main stem. The calibration model shows that during July 2001 survey period, the DO standard of 5 mg/l was not being met in Upper Calcasieu River over any of the modeled reaches. The calibration model minimum DO on the main stem was 0.90 mg/l near RK 0.7.
Upper Calcasieu River Watershed TMDL for Dissolved Oxygen Subsegment 080808 Originated: January 9, 2002
12
Figure 3. Calibration Model Dissolved Oxygen versus River Kilometer
- numbered points indicate survey stations and their site designation number - vertical blue lines indicate beginning of reach - the horizontal green line indicates the DO Criterion - the horizontal plotted blue line indicates DO saturation - the plotted red line indicates calibration model output 4. Water Quality Projections The traditional summer critical projection loading scenario was performed at the current annual DO standard. This scenario was based on reduced total nonpoint loads at summer season critical conditions (ie. 90th percentile seasonal temperatures and 7Q10 flows) in accordance with the LTP. An additional winter projection was run based on the percent reduction of total nonpoint loads determined with the summer critical conditions. This projection was used to verify the model’s predicted dissolved oxygen for winter critical conditions would meet the criteria. Normally the winter projection run would also allow the modeler to address seasonal permit limits for the dischargers, however in this case this was not necessary.
Upper Calcasieu River Watershed TMDL for Dissolved Oxygen Subsegment 080808 Originated: January 9, 2002
13
4.1 Critical Conditions, Seasonality and Margin of Safety The Clean Water Act requires the consideration of seasonal variation of conditions affecting the constituent of concern, and the inclusion of a margin of safety (MOS) in the development of a TMDL. For the Upper Calcasieu River TMDL, an analysis of LDEQ ambient data has been employed to determine critical seasonal conditions and an appropriate margin of safety. Critical conditions for dissolved oxygen were determined for Upper Calcasieu River using LDEQ ambient water quality site data from Calcasieu River at the Hwy 8 bridge, LDEQ Ambient Monitoring Network number 0819. Based on the 90th percentile temperature for each season, the corresponding 90% of saturation DO was determined. Ambient temperature data, critical temperature and DO saturation determinations are shown in Appendix B. Graphical and regression analysis techniques have been used by LDEQ historically to evaluate the temperature and dissolved oxygen data from the Ambient Monitoring Network and run-off determinations from the Louisiana Office of Climatology water budget. Since nonpoint loading is conveyed by run-off, this was a reasonable correlation to use. Temperature is strongly inversely proportional to dissolved oxygen and moderately inversely proportional to run-off. Dissolved oxygen and run-off are also moderately directly proportional. The analysis concluded that the critical conditions for stream dissolved oxygen concentrations were those of negligible nonpoint run-off and low stream flow combined with high stream temperature, all of which combined characterize the summer season. When the rainfall run-off (and non-point loading) and stream flow are high, turbulence is higher due to the higher flow and the temperature is lowered by the run-off. In addition, run-off coefficients are higher in cooler weather due to reduced evaporation and evapotranspiration, so that the high flow periods of the year tend to be the cooler periods. Reaeration rates and DO saturation are, of course, much higher when water temperatures are cooler, but BOD decay rates are much lower. For these reasons, periods of high loading are periods of higher reaeration and dissolved oxygen but not necessarily periods of high BOD decay. This phenomenon is interpreted in TMDL modeling by assuming that nonpoint loading associated with flows into the stream are responsible for the benthic blanket which accumulates on the stream bottom and that the accumulated benthic blanket of the stream, expressed as SOD and/or resuspended BOD in the calibration model, has reached steady state or normal conditions over the long term and that short term additions to the blanket are off set by short term losses. This accumulated loading has its greatest impact on the stream during periods of higher temperature and lower flow. The manmade portion of the NPS loading is the difference between the calibration load and the reference stream load where the calibration load is higher. The only mechanism for changing this normal benthic blanket condition is to implement best management practices and reduce the amount of nonpoint source loading entering the stream and feeding the benthic blanket. Critical season conditions were simulated in Upper Calcasieu River dissolved oxygen TMDL projection modeling by using the default flows from the Louisiana Technical Procedures Manual, and the 90th percentile temperature. Incremental flow was assumed to be zero, based on the USGS historical 7Q10 determination of 0.0 cfs on the Calcasieu River at the Hwy 8 bridge. Model loading was input using sediment oxygen demand, headwater loads, and resuspension loading of the two CBOD components and organic nitrogen sediments.
Upper Calcasieu River Watershed TMDL for Dissolved Oxygen Subsegment 080808 Originated: January 9, 2002
14
In reality, the highest temperatures occur in July-August, the lowest stream flows occur in October-November, and the maximum point source discharge occurs following a significant rainfall, i.e., high-flow conditions. The summer projection model is established as if all these conditions happened at the same time. The winter projection model accounts for the seasonal differences in flows and BMP efficiencies. Other conservative assumptions regarding rates and loadings are also made during the modeling process. In addition to the conservative implicit measures, an explicit MOS was used for all loads to account for future growth, safety, model uncertainty and data inadequacies. An explicit 20% MOS was applied to the point source loads with a 20% MOS for the nonpoint sources. 4.2 Input Data Documentation The flow in the headwater was set at 0.1 cfs = 0.00283 cms for summer critical conditions in accordance with the LTP. The headwater was set at 1.0 cfs = 0.0283 cms for winter projection conditions in accordance with the LTP. 4.2.1 Model Options, Data Type 2 Six constituents were modeled during the projection process. These were dissolved oxygen, the two components of carbonaceous biochemical oxygen demand, organic nitrogen, ammonia nitrogen, and nitrite/nitrate. 4.2.2 Temperature Correction of Kinetics, Data Type 4 The temperature correction factors specified in the LTP were entered in the model or were automatic defaults in the model. 4.2.3 Reach Identification Data, Data Type 8 The reach-element design from the calibration was used in the projection modeling. 4.2.4 Advective Hydraulic Coefficients, Data Type 9 The hydraulic coefficients, exponents and constants determined for the calibration were used in the projection model. These values were determined during a critical flow period and their use should be acceptable during low flow conditions, such as those simulated in the summer and winter projection models. However, in a scenario, which depicts higher flow rates due to storm events, these hydraulic coefficients and exponents should not be used.
Upper Calcasieu River Watershed TMDL for Dissolved Oxygen Subsegment 080808 Originated: January 9, 2002
15
4.2.5 Initial Conditions, Data Type 11 The initial conditions were set to the 90th percentile critical season temperature in accordance with the LTP. The dissolved oxygen values for the initial conditions were set at the stream criteria. The median flowing chlorophyll a concentration based on Louisiana’s reference stream studies was 2.4 ug/l. A conservative value of 2.0 ug/l was used for chlorophyll a in all reaches in each projection. This value also coincides with the TNRCC default headwater value for this parameter. The macrophyte values determined during the calibration were used in both projection scenarios. 4.2.6 Reaeration Rates, Carbonaceous BOD Decay and Settling Rates, Nitrogenous BOD Decay and
Settling Rates, Data Types 12 and 15 The model input values for the reaeration rate equations, the two CBOD components, organic nitrogen, and ammonia nitrogen decay and settling rates were not changed from the calibration. 4.2.7 Incremental Conditions, Data Types 16, 17, and 18 For the projection runs, the incremental flows were set to zero to emulate the critical conditions for dissolved oxygen. This assumption was supported by the USGS determined historical 7Q10 discharge value of 0.0 cfs (LEE, 2000). 4.2.8 Sediment Oxygen Demand, Nonpoint Sources, Headwaters, Wasteloads, Data Type 12, 19, 20, 21, 22, 24, 25, and 26 LDEQ has collected and measured the CBOD and NBOD oxygen demand loading components for a number of years. These loads have been found in all streams including the non-impacted reference streams. It is LDEQ’s opinion that much of this loading is attributable to runoff loads, which are flushed into the stream during run-off events, and subsequently settle to the bottom in our slow moving streams. These benthic loads decay and breakdown during the year, becoming easily resuspended into the water column during the low flow/high temperature season. This season has historically been identified as the critical dissolved oxygen season. LDEQ simulates part of the non-point source oxygen demand loading as resuspended benthic load and SOD. The calibrated non-point loads, UCBOD, UNBOD, AND SOD, are summed to produce the total calibrated benthic load. The total calibrated benthic load is then reduced by the total background benthic load (determined from LDEQ’s reference stream research) to determine the total manmade benthic loading. The manmade portion is then reduced incrementally on a percentage basis to determine the necessary percentage reduction of manmade loading required to meet the water body’s dissolved oxygen criteria. These reductions are applied uniformly to all reaches sharing similar hydrology and land uses.
Upper Calcasieu River Watershed TMDL for Dissolved Oxygen Subsegment 080808 Originated: January 9, 2002
16
Following the same protocol as the point source discharges, the total reduced manmade benthic load is adjusted for the margin of safety by dividing the value by one minus the margin of safety. This adjusted load is added back to the total background benthic value to obtain the total projection model benthic load. This total projection benthic load is then broken out into its components of SOD, resuspended CBOD and resuspended NBOD by multiplying the total projection benthic load by the ratio of each calibrated component to the total calibrated benthic load. LDEQ has found variations in the breakdown of the individual CBOD and NBOD components. While the total BOD is reliable, the carbonaceous and nitrogenous component allocation is subject to the type of test method. In the past, LDEQ used a method which suppressed the nitrogenous component to obtain the carbonaceous component value, which was then subtracted from the total measured BOD to determine the nitrogenous value. The suppressant in this method was only reliable for twenty days thus leading to the assumption that the majority of the carbonaceous loading was depleted within that period of time. The test results supported this assumption. Recently the suppressant started failing around day seven and the manufacturer of the suppressant will only guarantee it’s potency for a five day period. LDEQ felt a five day test would not adequately depict the water quality of streams and began a search for a new test method. The research found a new proposed method for testing long term BODs in Standard Methods. This proposed method is a sixty day test which measures the incremental total BOD of the sample while at the same time measuring the increase in nitrite/nitrate in the sample. This increase in nitrite/nitrate allows LDEQ to calculate the incremental nitrogenous portion by multiplying the increase by 4.57 to determine the NBOD daily readings. These NBOD daily readings are then subtracted from the daily reading for total BOD to determine the CBOD daily values. A curve fit algorithm is then applied to the daily component readings to obtain the estimated ultimate values of each component as well as the decay rate and lag times of the first order equations. LDEQ has implemented the new test method over the last two survey seasons. The results obtained using the new method showed that a portion of the CBOD first order equation does begin to level off prior to the twentieth day, however a secondary CBOD component begins to use dissolved oxygen sometime between day ten and day twenty-five. This secondary CBOD component was not being assessed as CBOD using the previous method but was being included in the NBOD load. Thus the CBOD and NBOD component loading used in the reference stream studies is not consistent with the results using the new proposed 60 day method and the individual values should not be used to determine background values for samples processed using the new test method. However, the sum of CBOD and NBOD should be about the same for both new and old test methods. For this reason LDEQ decided to use the sum of reference stream benthic loads as background values. The resuspended total non-point CBOD1, CBOD2 and NBOD loading was reduced by 82.5% for reaches 1-11 in the summer critical projection scenario to meet the summer water quality criterion for dissolved oxygen. Since LDEQ assumes these benthic loads are long-term loads brought to the stream by various sources throughout the year, the same percentage reductions were made in the winter projection model as were in the summer critical projection model. These reductions met the summer dissolved oxygen criteria and well surpassed requirements in the non-critical winter projection. The reductions were determined using the calibrated values for nonpoint CBOD1, CBOD2 & organic nitrogen. These values were summed by reach, as justified above, an adjusted for the margin of safety.
Upper Calcasieu River Watershed TMDL for Dissolved Oxygen Subsegment 080808 Originated: January 9, 2002
17
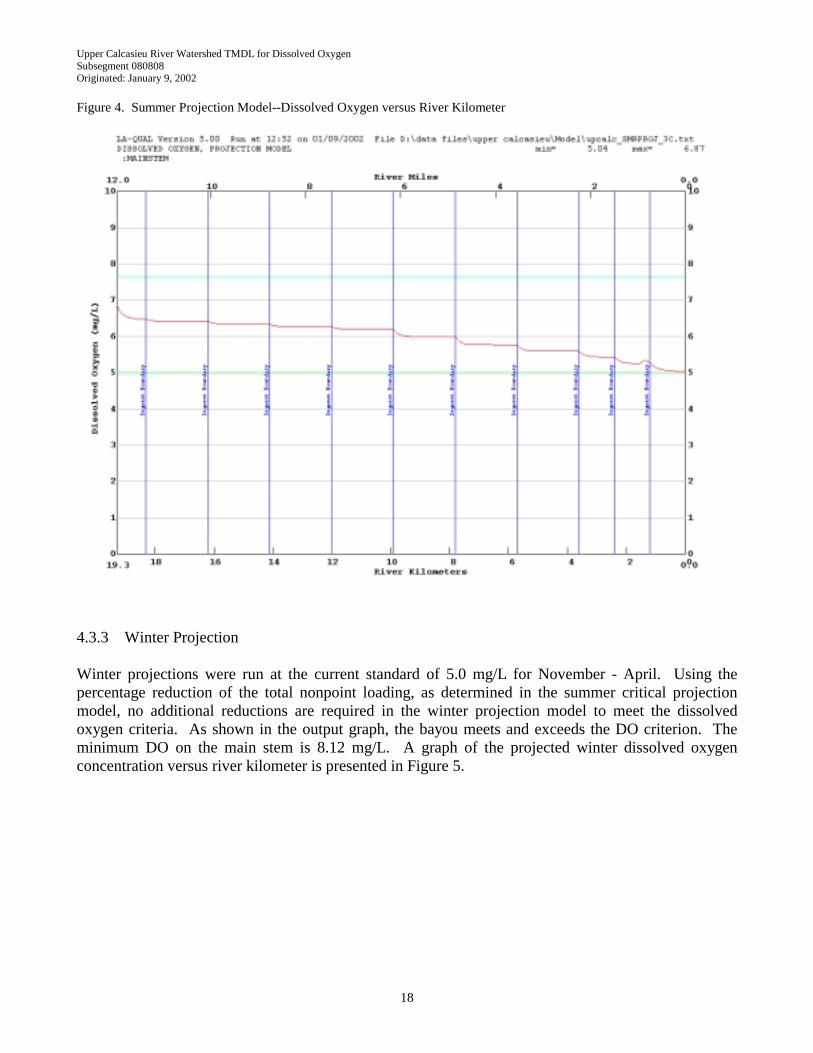
Each reach’s total benthic non-point load was then reduced to meet the dissolved oxygen criteria in each reach. Using the ratios determined in calibration, this reduced total non-point load was then broken into its components of CBOD1, CBOD2, organic nitrogen (resuspension) and SOD. The percentage reduction within mainstem was calculated based on the comparison of the reduced total non-point benthic load to the calibration total non-point benthic load. These calculations are shown in Appendix E. The value and sources of CBOD1, CBOD2 and organic nitrogen for each projection run are presented in Appendix B. 4.2.9 Boundary Conditions, Data Type 27 The lower boundary conditions were set at the 90th percentile projection season temperature for all projections and scenarios. The median reference stream chlorophyll a concentration was 2.4 ug/l. A conservative value of 2.0 ug/l was used for chlorophyll a in all projections. This value also coincides with the TNRCC default headwater value for this parameter. 4.3 Model Discussion and Results The projection’s model input and output data sets as well as the justification charts are presented in Appendix B. 4.3.1 No Load Scenario A summer, no load projection scenario, was not feasible or necessary. Based on the 2000 LDEQ 305b report the major source of the problem was from natural sources, thus the man-made component would be negligible and a no-load run would not be substantially different from the summer critical projection run which required a 82.5% reduction in total loading. Also no valid reference stream background loads were available for such a run. 4.3.2 Summer Projection Summer critical season projections were run for the current standard of 5.0 mg/L May – November. In order to meet the standard, an 82.5% reduction in reaches 1-11 of total non-point sources is necessary. With these percentage reductions in the benthic oxygen demand loads, the bayou meets the dissolved oxygen criterion. The minimum DO on the main stem is 5.04 mg/L. A graph of the dissolved oxygen concentrations versus river kilometers for the summer projection is presented in Figure 4.
Upper Calcasieu River Watershed TMDL for Dissolved Oxygen Subsegment 080808 Originated: January 9, 2002
18
Figure 4. Summer Projection Model--Dissolved Oxygen versus River Kilometer
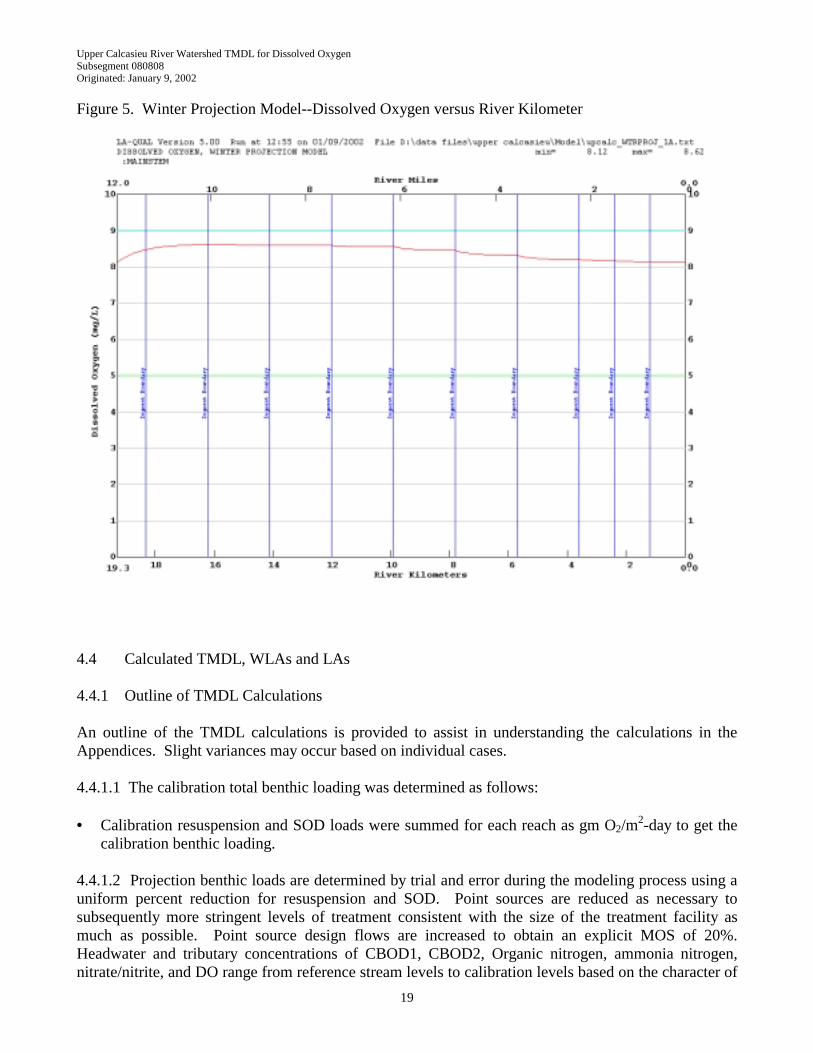
4.3.3 Winter Projection Winter projections were run at the current standard of 5.0 mg/L for November - April. Using the percentage reduction of the total nonpoint loading, as determined in the summer critical projection model, no additional reductions are required in the winter projection model to meet the dissolved oxygen criteria. As shown in the output graph, the bayou meets and exceeds the DO criterion. The minimum DO on the main stem is 8.12 mg/L. A graph of the projected winter dissolved oxygen concentration versus river kilometer is presented in Figure 5.
Upper Calcasieu River Watershed TMDL for Dissolved Oxygen Subsegment 080808 Originated: January 9, 2002
19
Figure 5. Winter Projection Model--Dissolved Oxygen versus River Kilometer
4.4 Calculated TMDL, WLAs and LAs 4.4.1 Outline of TMDL Calculations An outline of the TMDL calculations is provided to assist in understanding the calculations in the Appendices. Slight variances may occur based on individual cases. 4.4.1.1 The calibration total benthic loading was determined as follows: • = Calibration resuspension and SOD loads were summed for each reach as gm O2/m2-day to get the
calibration benthic loading.
4.4.1.2 Projection benthic loads are determined by trial and error during the modeling process using a uniform percent reduction for resuspension and SOD. Point sources are reduced as necessary to subsequently more stringent levels of treatment consistent with the size of the treatment facility as much as possible. Point source design flows are increased to obtain an explicit MOS of 20%. Headwater and tributary concentrations of CBOD1, CBOD2, Organic nitrogen, ammonia nitrogen, nitrate/nitrite, and DO range from reference stream levels to calibration levels based on the character of
Upper Calcasieu River Watershed TMDL for Dissolved Oxygen Subsegment 080808 Originated: January 9, 2002
20
the headwater. Where headwaters and tributaries exhibit man-made pollutant loads in excess of reference stream values, the loadings are reduced by the same uniform percent reduction as the benthic loads. • = The projection benthic loading at 20oC is calculated as the sum of the projection resuspension and
SOD components expressed as gm O2/m2-day. • = The percent reduction of total loads for each reach is determined from the difference between the
projected total non-point load and the total non-point load found during calibration.
• = The projection loads are also computed in units of lb/d and kg/d for each reach. 4.4.1.4 The total stream loading capacity at critical water temperature is calculated as the sum of: • = Headwater and tributary CBOD and NBOD loading in lb/d and kg/d. • = The natural and man-made projection benthic loading for all reaches of the stream is converted to
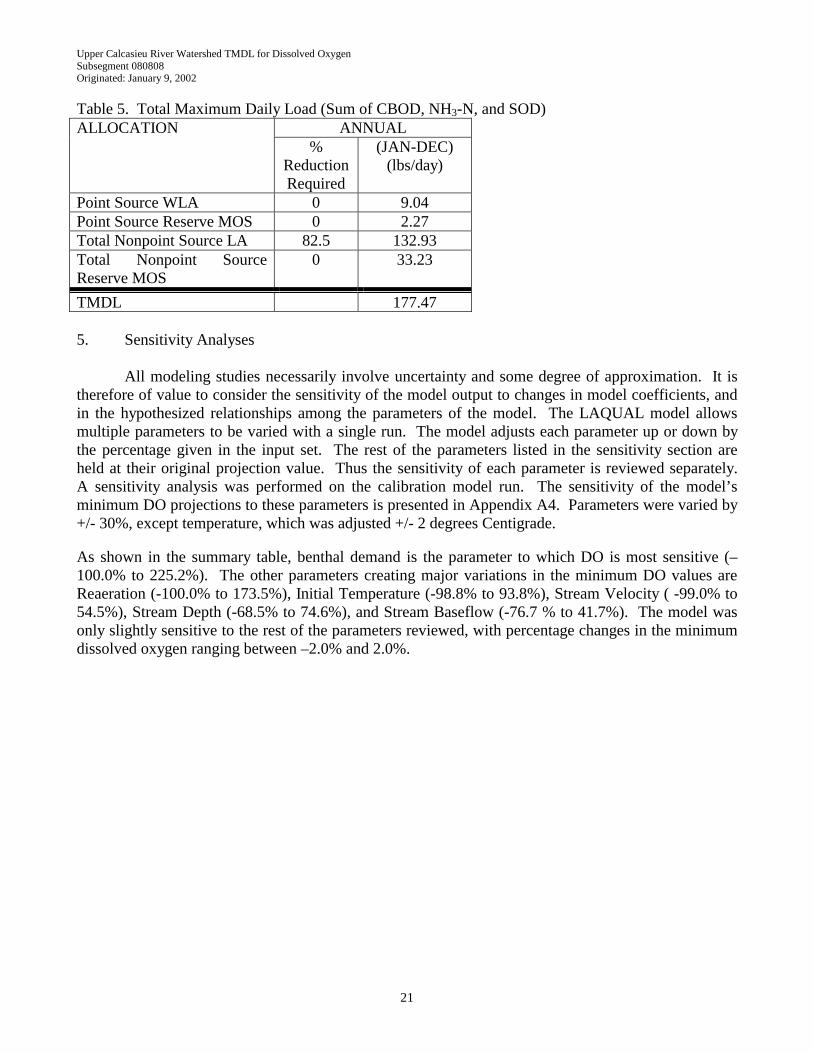
the loading at critical temperature and summed in lb/d and kg/d. • = Point source CBOD and NBOD loading in lb/d and kg/d. • = The margin of safety in lb/d and kg/d. 4.4.2 Upper Calcasieu River TMDL The TMDLs for the biochemical oxygen demanding constituents [CBOD(sum of components), NBOD, and SOD], have been calculated for the critical season. The TMDL’s for the Upper Calcasieu River watershed were set equal to the total stream loading capacity. They are presented in Appendix E by point source and reach. A summary of the loads is presented in Table 5.
Upper Calcasieu River Watershed TMDL for Dissolved Oxygen Subsegment 080808 Originated: January 9, 2002
21
Table 5. Total Maximum Daily Load (Sum of CBOD, NH3-N, and SOD) ANNUAL ALLOCATION
% Reduction Required
(JAN-DEC) (lbs/day)
Point Source WLA 0 9.04 Point Source Reserve MOS 0 2.27 Total Nonpoint Source LA 82.5 132.93 Total Nonpoint Source Reserve MOS
0 33.23
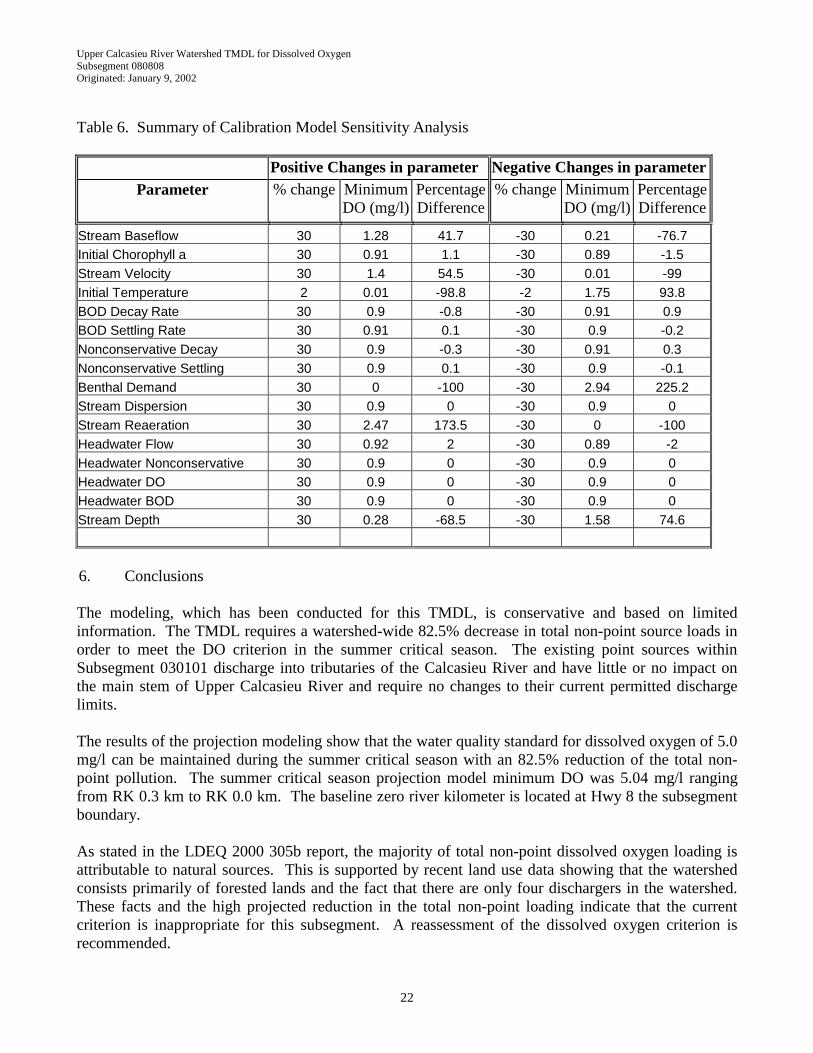
TMDL 177.47 5. Sensitivity Analyses All modeling studies necessarily involve uncertainty and some degree of approximation. It is therefore of value to consider the sensitivity of the model output to changes in model coefficients, and in the hypothesized relationships among the parameters of the model. The LAQUAL model allows multiple parameters to be varied with a single run. The model adjusts each parameter up or down by the percentage given in the input set. The rest of the parameters listed in the sensitivity section are held at their original projection value. Thus the sensitivity of each parameter is reviewed separately. A sensitivity analysis was performed on the calibration model run. The sensitivity of the model’s minimum DO projections to these parameters is presented in Appendix A4. Parameters were varied by +/- 30%, except temperature, which was adjusted +/- 2 degrees Centigrade. As shown in the summary table, benthal demand is the parameter to which DO is most sensitive (–100.0% to 225.2%). The other parameters creating major variations in the minimum DO values are Reaeration (-100.0% to 173.5%), Initial Temperature (-98.8% to 93.8%), Stream Velocity ( -99.0% to 54.5%), Stream Depth (-68.5% to 74.6%), and Stream Baseflow (-76.7 % to 41.7%). The model was only slightly sensitive to the rest of the parameters reviewed, with percentage changes in the minimum dissolved oxygen ranging between –2.0% and 2.0%.
Upper Calcasieu River Watershed TMDL for Dissolved Oxygen Subsegment 080808 Originated: January 9, 2002
22
Table 6. Summary of Calibration Model Sensitivity Analysis
Positive Changes in parameter Negative Changes in parameterParameter % change Minimum
DO (mg/l)Percentage Difference
% change Minimum DO (mg/l)
Percentage Difference
Stream Baseflow 30 1.28 41.7 -30 0.21 -76.7 Initial Chorophyll a 30 0.91 1.1 -30 0.89 -1.5 Stream Velocity 30 1.4 54.5 -30 0.01 -99 Initial Temperature 2 0.01 -98.8 -2 1.75 93.8 BOD Decay Rate 30 0.9 -0.8 -30 0.91 0.9 BOD Settling Rate 30 0.91 0.1 -30 0.9 -0.2 Nonconservative Decay 30 0.9 -0.3 -30 0.91 0.3 Nonconservative Settling 30 0.9 0.1 -30 0.9 -0.1 Benthal Demand 30 0 -100 -30 2.94 225.2 Stream Dispersion 30 0.9 0 -30 0.9 0 Stream Reaeration 30 2.47 173.5 -30 0 -100 Headwater Flow 30 0.92 2 -30 0.89 -2 Headwater Nonconservative 30 0.9 0 -30 0.9 0 Headwater DO 30 0.9 0 -30 0.9 0 Headwater BOD 30 0.9 0 -30 0.9 0 Stream Depth 30 0.28 -68.5 -30 1.58 74.6 6. Conclusions The modeling, which has been conducted for this TMDL, is conservative and based on limited information. The TMDL requires a watershed-wide 82.5% decrease in total non-point source loads in order to meet the DO criterion in the summer critical season. The existing point sources within Subsegment 030101 discharge into tributaries of the Calcasieu River and have little or no impact on the main stem of Upper Calcasieu River and require no changes to their current permitted discharge limits. The results of the projection modeling show that the water quality standard for dissolved oxygen of 5.0 mg/l can be maintained during the summer critical season with an 82.5% reduction of the total non-point pollution. The summer critical season projection model minimum DO was 5.04 mg/l ranging from RK 0.3 km to RK 0.0 km. The baseline zero river kilometer is located at Hwy 8 the subsegment boundary. As stated in the LDEQ 2000 305b report, the majority of total non-point dissolved oxygen loading is attributable to natural sources. This is supported by recent land use data showing that the watershed consists primarily of forested lands and the fact that there are only four dischargers in the watershed. These facts and the high projected reduction in the total non-point loading indicate that the current criterion is inappropriate for this subsegment. A reassessment of the dissolved oxygen criterion is recommended.
Upper Calcasieu River Watershed TMDL for Dissolved Oxygen Subsegment 080808 Originated: January 9, 2002
23
This TMDL has been developed in accordance with the State’s antidegradation policy (LAC 33:IX.1109). LDEQ will work with other agencies such as local Soil Conservation Districts to implement agricultural best management practices in the watershed through the 319 programs. LDEQ will also continue to monitor the waters to determine whether standards are being attained. In accordance with Section 106 of the federal Clean Water Act and under the authority of the Louisiana Environmental Quality Act, the LDEQ has established a comprehensive program for monitoring the quality of the state’s surface waters. The LDEQ Surveillance Section collects surface water samples at various locations, utilizing appropriate sampling methods and procedures for ensuring the quality of the data collected. The objectives of the surface water monitoring program are to determine the quality of the state’s surface waters, to develop a long-term data base for water quality trend analysis, and to monitor the effectiveness of pollution controls. The data obtained through the surface water monitoring program is used to develop the state’s biennial 305(b) report (Water Quality Inventory) and the 303(d) list of impaired waters. This information is also utilized in establishing priorities for the LDEQ nonpoint source program. The LDEQ has implemented a watershed approach to surface water quality monitoring. Through this approach, the entire state is sampled over a five-year cycle with two targeted basins sampled each year. Long-term trend monitoring sites at various locations on the larger rivers and Lake Pontchartrain are sampled throughout the five-year cycle. Sampling is conducted on a monthly basis or more frequently if necessary to yield at least 12 samples per site each year. Sampling sites are located where they are considered to be representative of the waterbody. Under the current monitoring schedule, targeted basins follow the TMDL priorities. In this manner, the first TMDLs will have been implemented by the time the first priority basins will be monitored again in the second five-year cycle. This will allow the LDEQ to determine whether there has been any improvement in water quality following implementation of the TMDLs. As the monitoring results are evaluated at the end of each year, waterbodies may be added to or removed from the 303(d) list. The sampling schedule for the next five years is shown below.
2002 - Red and Sabine River Basins
2003 - Mermentau and Vermilion-Teche River Basins 2004 - Calcasieu and Ouachita River Basins 2005 - Barataria and Terrebonne Basins 2006 - Lake Pontchartrain Basin and Pearl River Basin (Atchafalaya and Mississippi Rivers will be sampled continuously.)
Upper Calcasieu River Watershed TMDL for Dissolved Oxygen Subsegment 080808 Originated: January 9, 2002
24
7. References Bowie, G. L., et. al. Rates, Constants, and Kinetics Formulations in Surface Water Quality Modeling (Second Edition). Env. Res. Lab., USEPA, EPA/600/3-85/040. Athens, GA: 1985. Lee, Fred N. Low-Flow on Streams in Louisiana. Louisiana Department of Environmental Quality. Baton Rouge, LA: March, 2000. Louisiana Department of Environmental Quality. State of Louisiana Water Quality Management Plan, Volume 6, Part A, Nonpoint Source Pollution Assessment Report. Baton Rouge, LA: 1993. Louisiana Department of Environmental Quality. State of Louisiana Water Quality Management Plan, Volume 5A, Water Quality Data Summary, 1992-1993. Baton Rouge, LA: 1994 State of Louisiana Water Quality Management Plan, Volume 6, Part A, Nonpoint Source Pollution Assessment Report.. Louisiana Department of Environmental Quality. Environmental Regulatory Code, Part IX. Water Quality Regulations. Baton Rouge, LA: 1998. Shoemaker, L., et. al. Compendium of Tools for Watershed Assessment and TMDL Development. Office of Wetland, Oceans, and Watersheds, USEPA, EPA841-B-97-006. Washington, DC: May, 1997. Smythe, E. deEtte. Overview of the 1995 and 1996 Reference Streams. Louisiana Department of Environmental Quality. Baton Rouge, LA: June 28, 1999. Waldon, M. G., R. K. Duerr, and Marian U. Aguillard. Louisiana Total Maximum Daily Load Technical Procedures. Louisiana Department of Environmental Quality. Baton Rouge, LA: May, 2001 Wiland, Bruce L. LA-QUAL for Windows User’s Manual (Version 3.02C). Water Support Division, Engineering Section, Louisiana Department of Environmental Quality. Baton Rouge, LA: March, 2000 8.0 Appendices See Attached Appendices A - I.
Upper Calcasieu River Watershed TMDL for Dissolved Oxygen Subsegment 080808 Originated: January 9, 2002
25
Appendix A
Calibration Model Development

Upper Calcasieu River Watershed TMDL for Dissolved Oxygen Subsegment 080808 Originated: January 9, 2002
26
Appendix A1
Calibration Model Development
Reach parameter calculations
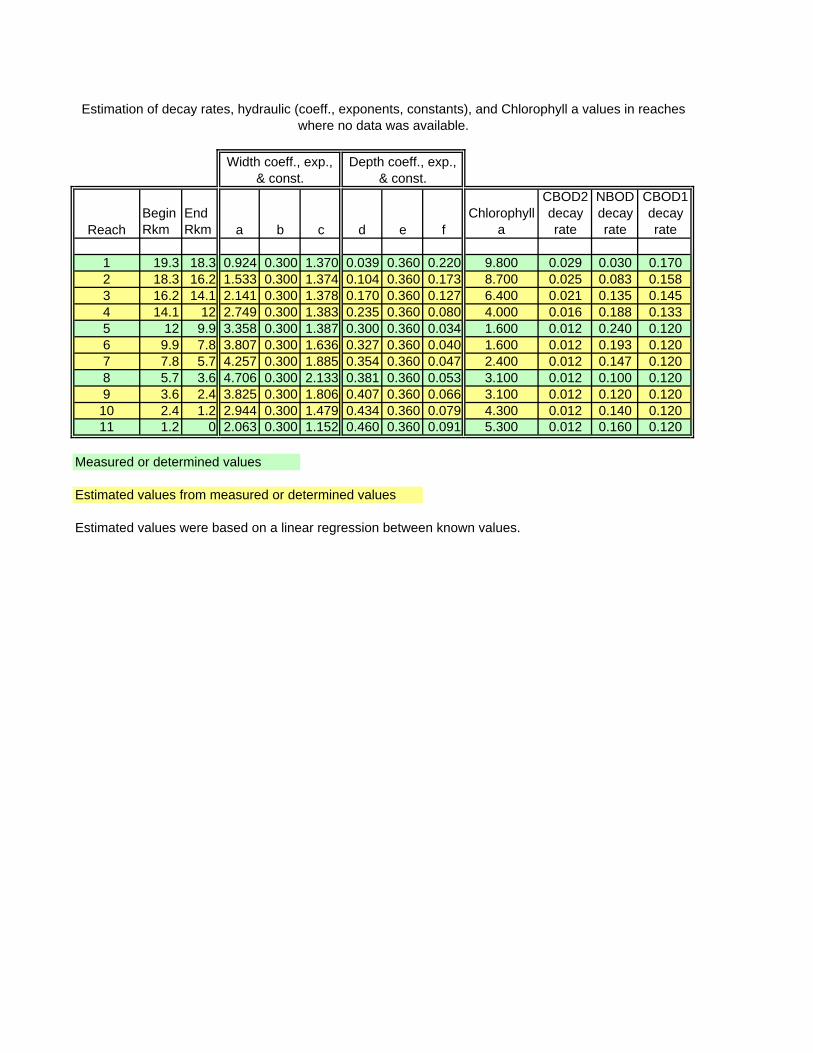
ReachBegin Rkm
End Rkm a b c d e f
Chlorophyll a
CBOD2 decay rate
NBOD decay rate
CBOD1 decay rate
1 19.3 18.3 0.924 0.300 1.370 0.039 0.360 0.220 9.800 0.029 0.030 0.1702 18.3 16.2 1.533 0.300 1.374 0.104 0.360 0.173 8.700 0.025 0.083 0.1583 16.2 14.1 2.141 0.300 1.378 0.170 0.360 0.127 6.400 0.021 0.135 0.1454 14.1 12 2.749 0.300 1.383 0.235 0.360 0.080 4.000 0.016 0.188 0.1335 12 9.9 3.358 0.300 1.387 0.300 0.360 0.034 1.600 0.012 0.240 0.1206 9.9 7.8 3.807 0.300 1.636 0.327 0.360 0.040 1.600 0.012 0.193 0.1207 7.8 5.7 4.257 0.300 1.885 0.354 0.360 0.047 2.400 0.012 0.147 0.1208 5.7 3.6 4.706 0.300 2.133 0.381 0.360 0.053 3.100 0.012 0.100 0.1209 3.6 2.4 3.825 0.300 1.806 0.407 0.360 0.066 3.100 0.012 0.120 0.12010 2.4 1.2 2.944 0.300 1.479 0.434 0.360 0.079 4.300 0.012 0.140 0.12011 1.2 0 2.063 0.300 1.152 0.460 0.360 0.091 5.300 0.012 0.160 0.120
Measured or determined values
Estimated values from measured or determined values
Estimated values were based on a linear regression between known values.
Depth coeff., exp., & const.
Width coeff., exp., & const.
Estimation of decay rates, hydraulic (coeff., exponents, constants), and Chlorophyll a values in reaches where no data was available.

Upper Calcasieu River Watershed TMDL for Dissolved Oxygen Subsegment 080808 Originated: January 9, 2002
27
Appendix A2
Calibration Model Development
Calibration model input/output and graphs
Upper Calcasieu River – Subsegment 030101 Water Quality Calibration for Dissolved Oxygen based on July 2001 Survey Orginated: January 10, 2002
Page 1
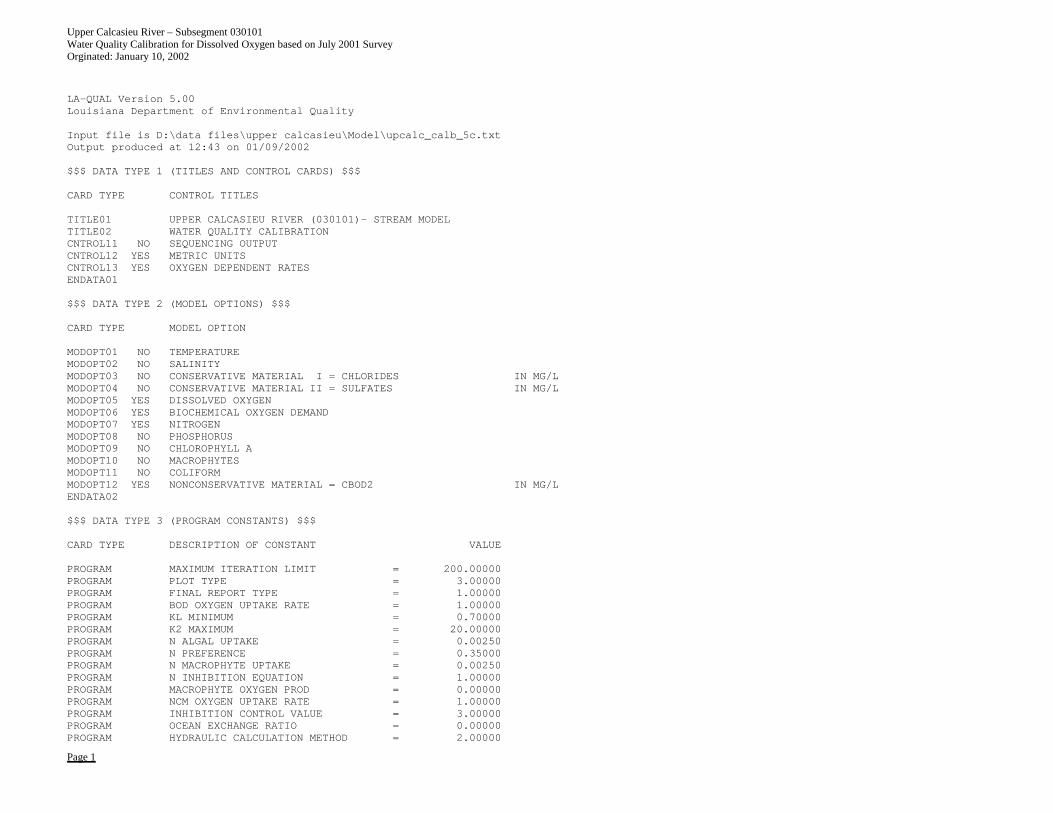
LA-QUAL Version 5.00Louisiana Department of Environmental Quality
Input file is D:\data files\upper calcasieu\Model\upcalc_calb_5c.txtOutput produced at 12:43 on 01/09/2002
$$$ DATA TYPE 1 (TITLES AND CONTROL CARDS) $$$
CARD TYPE CONTROL TITLES
TITLE01 UPPER CALCASIEU RIVER (030101)- STREAM MODELTITLE02 WATER QUALITY CALIBRATIONCNTROL11 NO SEQUENCING OUTPUTCNTROL12 YES METRIC UNITSCNTROL13 YES OXYGEN DEPENDENT RATESENDATA01
$$$ DATA TYPE 2 (MODEL OPTIONS) $$$
CARD TYPE MODEL OPTION
MODOPT01 NO TEMPERATUREMODOPT02 NO SALINITYMODOPT03 NO CONSERVATIVE MATERIAL I = CHLORIDES IN MG/LMODOPT04 NO CONSERVATIVE MATERIAL II = SULFATES IN MG/LMODOPT05 YES DISSOLVED OXYGENMODOPT06 YES BIOCHEMICAL OXYGEN DEMANDMODOPT07 YES NITROGENMODOPT08 NO PHOSPHORUSMODOPT09 NO CHLOROPHYLL AMODOPT10 NO MACROPHYTESMODOPT11 NO COLIFORMMODOPT12 YES NONCONSERVATIVE MATERIAL = CBOD2 IN MG/LENDATA02
$$$ DATA TYPE 3 (PROGRAM CONSTANTS) $$$
CARD TYPE DESCRIPTION OF CONSTANT VALUE
PROGRAM MAXIMUM ITERATION LIMIT = 200.00000PROGRAM PLOT TYPE = 3.00000PROGRAM FINAL REPORT TYPE = 1.00000PROGRAM BOD OXYGEN UPTAKE RATE = 1.00000PROGRAM KL MINIMUM = 0.70000PROGRAM K2 MAXIMUM = 20.00000PROGRAM N ALGAL UPTAKE = 0.00250PROGRAM N PREFERENCE = 0.35000PROGRAM N MACROPHYTE UPTAKE = 0.00250PROGRAM N INHIBITION EQUATION = 1.00000PROGRAM MACROPHYTE OXYGEN PROD = 0.00000PROGRAM NCM OXYGEN UPTAKE RATE = 1.00000PROGRAM INHIBITION CONTROL VALUE = 3.00000PROGRAM OCEAN EXCHANGE RATIO = 0.00000PROGRAM HYDRAULIC CALCULATION METHOD = 2.00000
Upper Calcasieu River – Subsegment 030101 Water Quality Calibration for Dissolved Oxygen based on July 2001 Survey Orginated: January 10, 2002
Page 2
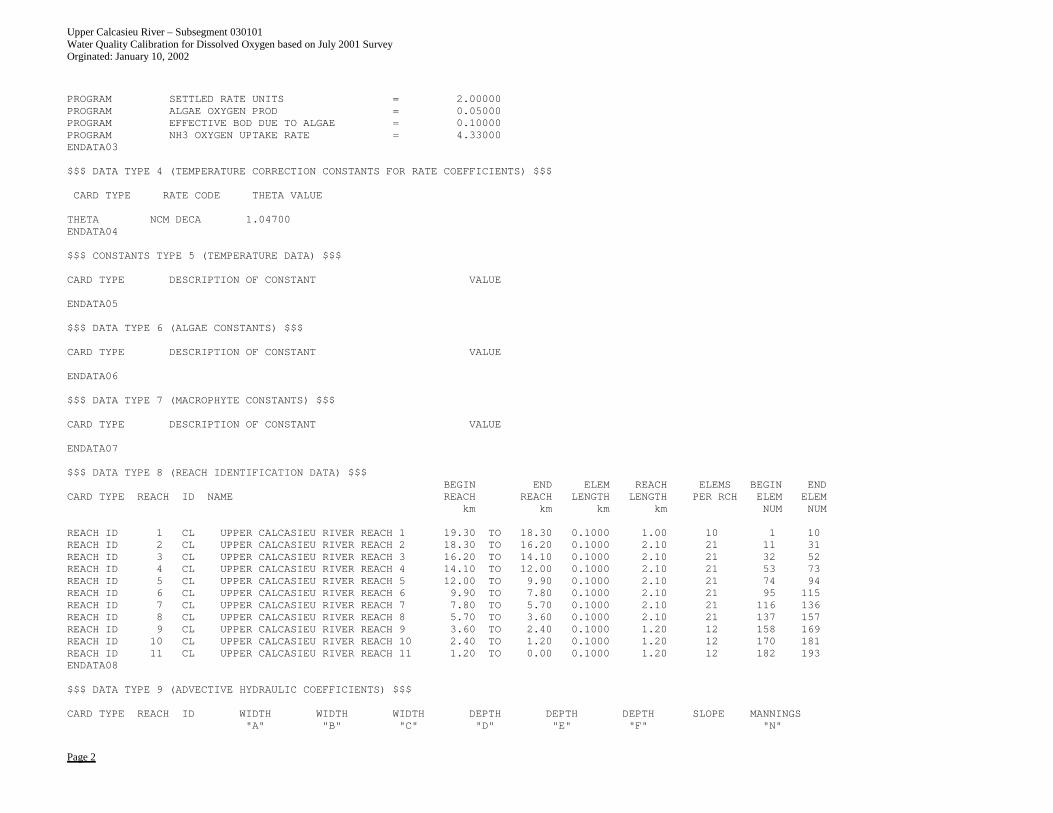
PROGRAM SETTLED RATE UNITS = 2.00000PROGRAM ALGAE OXYGEN PROD = 0.05000PROGRAM EFFECTIVE BOD DUE TO ALGAE = 0.10000PROGRAM NH3 OXYGEN UPTAKE RATE = 4.33000ENDATA03
$$$ DATA TYPE 4 (TEMPERATURE CORRECTION CONSTANTS FOR RATE COEFFICIENTS) $$$
CARD TYPE RATE CODE THETA VALUE
THETA NCM DECA 1.04700ENDATA04
$$$ CONSTANTS TYPE 5 (TEMPERATURE DATA) $$$
CARD TYPE DESCRIPTION OF CONSTANT VALUE
ENDATA05
$$$ DATA TYPE 6 (ALGAE CONSTANTS) $$$
CARD TYPE DESCRIPTION OF CONSTANT VALUE
ENDATA06
$$$ DATA TYPE 7 (MACROPHYTE CONSTANTS) $$$
CARD TYPE DESCRIPTION OF CONSTANT VALUE
ENDATA07
$$$ DATA TYPE 8 (REACH IDENTIFICATION DATA) $$$BEGIN END ELEM REACH ELEMS BEGIN END
CARD TYPE REACH ID NAME REACH REACH LENGTH LENGTH PER RCH ELEM ELEMkm km km km NUM NUM
REACH ID 1 CL UPPER CALCASIEU RIVER REACH 1 19.30 TO 18.30 0.1000 1.00 10 1 10REACH ID 2 CL UPPER CALCASIEU RIVER REACH 2 18.30 TO 16.20 0.1000 2.10 21 11 31REACH ID 3 CL UPPER CALCASIEU RIVER REACH 3 16.20 TO 14.10 0.1000 2.10 21 32 52REACH ID 4 CL UPPER CALCASIEU RIVER REACH 4 14.10 TO 12.00 0.1000 2.10 21 53 73REACH ID 5 CL UPPER CALCASIEU RIVER REACH 5 12.00 TO 9.90 0.1000 2.10 21 74 94REACH ID 6 CL UPPER CALCASIEU RIVER REACH 6 9.90 TO 7.80 0.1000 2.10 21 95 115REACH ID 7 CL UPPER CALCASIEU RIVER REACH 7 7.80 TO 5.70 0.1000 2.10 21 116 136REACH ID 8 CL UPPER CALCASIEU RIVER REACH 8 5.70 TO 3.60 0.1000 2.10 21 137 157REACH ID 9 CL UPPER CALCASIEU RIVER REACH 9 3.60 TO 2.40 0.1000 1.20 12 158 169REACH ID 10 CL UPPER CALCASIEU RIVER REACH 10 2.40 TO 1.20 0.1000 1.20 12 170 181REACH ID 11 CL UPPER CALCASIEU RIVER REACH 11 1.20 TO 0.00 0.1000 1.20 12 182 193ENDATA08
$$$ DATA TYPE 9 (ADVECTIVE HYDRAULIC COEFFICIENTS) $$$
CARD TYPE REACH ID WIDTH WIDTH WIDTH DEPTH DEPTH DEPTH SLOPE MANNINGS"A" "B" "C" "D" "E" "F" "N"

Upper Calcasieu River – Subsegment 030101 Water Quality Calibration for Dissolved Oxygen based on July 2001 Survey Orginated: January 10, 2002
Page 3
HYDR-1 1 CL 0.924 0.300 1.370 0.039 0.360 0.220 0.00000 0.030HYDR-1 2 CL 1.533 0.300 1.374 0.104 0.360 0.173 0.00000 0.030HYDR-1 3 CL 2.141 0.300 1.378 0.170 0.360 0.127 0.00000 0.030HYDR-1 4 CL 2.749 0.300 1.383 0.235 0.360 0.080 0.00000 0.030HYDR-1 5 CL 3.358 0.300 1.387 0.300 0.360 0.034 0.00000 0.030HYDR-1 6 CL 3.807 0.300 1.636 0.327 0.360 0.040 0.00000 0.030HYDR-1 7 CL 4.257 0.300 1.885 0.354 0.360 0.047 0.00000 0.030HYDR-1 8 CL 4.706 0.300 2.133 0.381 0.360 0.053 0.00000 0.030HYDR-1 9 CL 3.825 0.300 1.806 0.407 0.360 0.066 0.00000 0.030HYDR-1 10 CL 2.944 0.300 1.479 0.434 0.360 0.079 0.00000 0.030HYDR-1 11 CL 2.063 0.300 1.152 0.460 0.360 0.091 0.00000 0.030ENDATA09
$$$ DATA TYPE 10 (DISPERSIVE HYDRAULIC COEFFICIENTS) $$$
CARD TYPE REACH ID TIDAL DISPERSION DISPERSION DISPERSION DISPERSIONRANGE "A" "B" "C" "D"
HYDR 1 CL 0.00 0.300 0.000 0.000 0.000HYDR 2 CL 0.00 0.300 0.000 0.000 0.000HYDR 3 CL 0.00 0.300 0.000 0.000 0.000HYDR 4 CL 0.00 0.300 0.000 0.000 0.000HYDR 5 CL 0.00 0.300 0.000 0.000 0.000HYDR 6 CL 0.00 0.300 0.000 0.000 0.000HYDR 7 CL 0.00 0.300 0.000 0.000 0.000HYDR 8 CL 0.00 0.300 0.000 0.000 0.000HYDR 9 CL 0.00 0.300 0.000 0.000 0.000HYDR 10 CL 0.00 0.300 0.000 0.000 0.000HYDR 11 CL 0.00 0.300 0.000 0.000 0.000ENDATA10
$$$ DATA TYPE 11 (INITIAL CONDITIONS) $$$
CARD TYPE REACH ID TEMP SALIN DO NH3 NO3+2 PHOS CHL A MACRO
INITIAL 1 CL 25.21 0.00 5.00 0.00 0.00 0.00 9.80 0.00INITIAL 2 CL 25.21 0.00 5.00 0.00 0.00 0.00 8.70 0.00INITIAL 3 CL 25.21 0.00 5.00 0.00 0.00 0.00 6.40 25.00INITIAL 4 CL 25.21 0.00 5.00 0.00 0.00 0.00 4.00 45.00INITIAL 5 CL 25.21 0.00 5.00 0.00 0.00 0.00 1.60 65.00INITIAL 6 CL 25.21 0.00 5.00 0.00 0.00 0.00 1.60 65.00INITIAL 7 CL 25.21 0.00 5.00 0.00 0.00 0.00 2.40 55.00INITIAL 8 CL 25.21 0.00 5.00 0.00 0.00 0.00 3.10 20.00INITIAL 9 CL 25.21 0.00 5.00 0.00 0.00 0.00 3.10 18.00INITIAL 10 CL 25.21 0.00 5.00 0.00 0.00 0.00 4.30 18.00INITIAL 11 CL 25.21 0.00 5.00 0.00 0.00 0.00 5.30 18.00ENDATA11
$$$ DATA TYPE 12 (REAERATION, SEDIMENT OXYGEN DEMAND, BOD COEFFICIENTS) $$$AEROB ANAER
CARD TYPE REACH ID K2 K2 K2 K2 BKGRND BOD BOD BOD CONV BODOPT "A" "B" "C" SOD DECAY SETT TO SOD DECAY
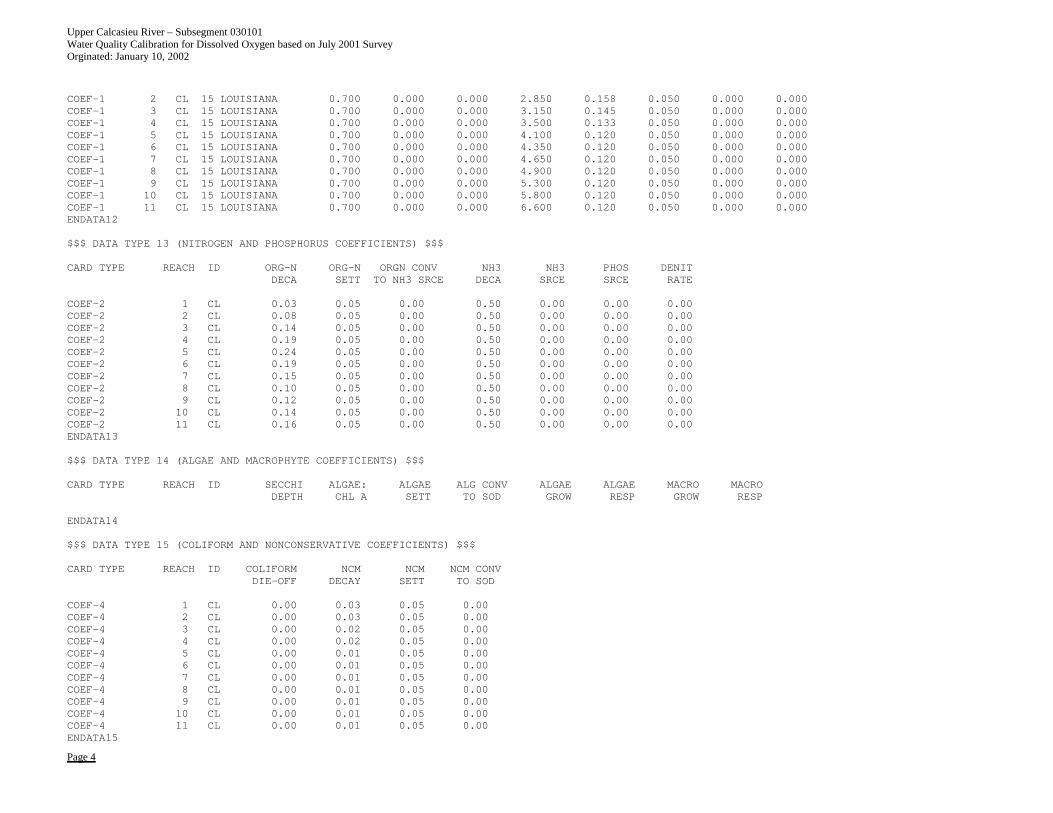
COEF-1 1 CL 15 LOUISIANA 0.700 0.000 0.000 2.600 0.170 0.050 0.000 0.000
Upper Calcasieu River – Subsegment 030101 Water Quality Calibration for Dissolved Oxygen based on July 2001 Survey Orginated: January 10, 2002
Page 4
COEF-1 2 CL 15 LOUISIANA 0.700 0.000 0.000 2.850 0.158 0.050 0.000 0.000COEF-1 3 CL 15 LOUISIANA 0.700 0.000 0.000 3.150 0.145 0.050 0.000 0.000COEF-1 4 CL 15 LOUISIANA 0.700 0.000 0.000 3.500 0.133 0.050 0.000 0.000COEF-1 5 CL 15 LOUISIANA 0.700 0.000 0.000 4.100 0.120 0.050 0.000 0.000COEF-1 6 CL 15 LOUISIANA 0.700 0.000 0.000 4.350 0.120 0.050 0.000 0.000COEF-1 7 CL 15 LOUISIANA 0.700 0.000 0.000 4.650 0.120 0.050 0.000 0.000COEF-1 8 CL 15 LOUISIANA 0.700 0.000 0.000 4.900 0.120 0.050 0.000 0.000COEF-1 9 CL 15 LOUISIANA 0.700 0.000 0.000 5.300 0.120 0.050 0.000 0.000COEF-1 10 CL 15 LOUISIANA 0.700 0.000 0.000 5.800 0.120 0.050 0.000 0.000COEF-1 11 CL 15 LOUISIANA 0.700 0.000 0.000 6.600 0.120 0.050 0.000 0.000ENDATA12
$$$ DATA TYPE 13 (NITROGEN AND PHOSPHORUS COEFFICIENTS) $$$
CARD TYPE REACH ID ORG-N ORG-N ORGN CONV NH3 NH3 PHOS DENITDECA SETT TO NH3 SRCE DECA SRCE SRCE RATE
COEF-2 1 CL 0.03 0.05 0.00 0.50 0.00 0.00 0.00COEF-2 2 CL 0.08 0.05 0.00 0.50 0.00 0.00 0.00COEF-2 3 CL 0.14 0.05 0.00 0.50 0.00 0.00 0.00COEF-2 4 CL 0.19 0.05 0.00 0.50 0.00 0.00 0.00COEF-2 5 CL 0.24 0.05 0.00 0.50 0.00 0.00 0.00COEF-2 6 CL 0.19 0.05 0.00 0.50 0.00 0.00 0.00COEF-2 7 CL 0.15 0.05 0.00 0.50 0.00 0.00 0.00COEF-2 8 CL 0.10 0.05 0.00 0.50 0.00 0.00 0.00COEF-2 9 CL 0.12 0.05 0.00 0.50 0.00 0.00 0.00COEF-2 10 CL 0.14 0.05 0.00 0.50 0.00 0.00 0.00COEF-2 11 CL 0.16 0.05 0.00 0.50 0.00 0.00 0.00ENDATA13
$$$ DATA TYPE 14 (ALGAE AND MACROPHYTE COEFFICIENTS) $$$
CARD TYPE REACH ID SECCHI ALGAE: ALGAE ALG CONV ALGAE ALGAE MACRO MACRODEPTH CHL A SETT TO SOD GROW RESP GROW RESP
ENDATA14
$$$ DATA TYPE 15 (COLIFORM AND NONCONSERVATIVE COEFFICIENTS) $$$
CARD TYPE REACH ID COLIFORM NCM NCM NCM CONVDIE-OFF DECAY SETT TO SOD
COEF-4 1 CL 0.00 0.03 0.05 0.00COEF-4 2 CL 0.00 0.03 0.05 0.00COEF-4 3 CL 0.00 0.02 0.05 0.00COEF-4 4 CL 0.00 0.02 0.05 0.00COEF-4 5 CL 0.00 0.01 0.05 0.00COEF-4 6 CL 0.00 0.01 0.05 0.00COEF-4 7 CL 0.00 0.01 0.05 0.00COEF-4 8 CL 0.00 0.01 0.05 0.00COEF-4 9 CL 0.00 0.01 0.05 0.00COEF-4 10 CL 0.00 0.01 0.05 0.00COEF-4 11 CL 0.00 0.01 0.05 0.00ENDATA15
Upper Calcasieu River – Subsegment 030101 Water Quality Calibration for Dissolved Oxygen based on July 2001 Survey Orginated: January 10, 2002
Page 5
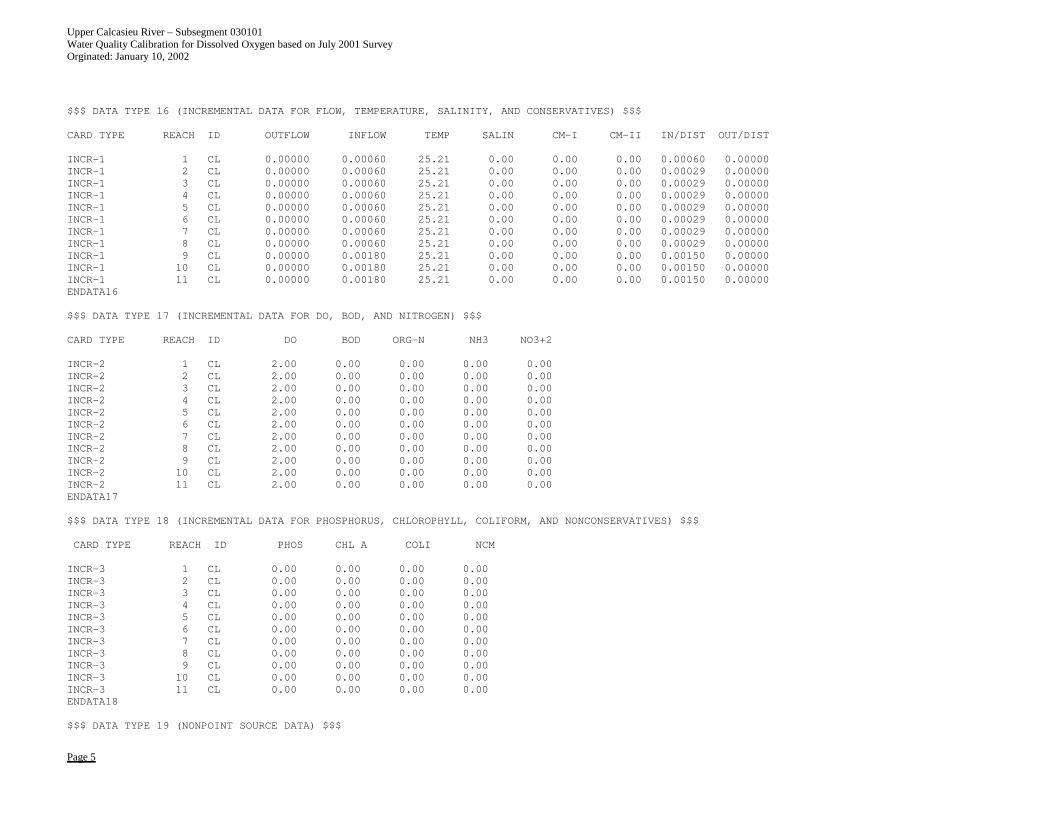
$$$ DATA TYPE 16 (INCREMENTAL DATA FOR FLOW, TEMPERATURE, SALINITY, AND CONSERVATIVES) $$$
CARD TYPE REACH ID OUTFLOW INFLOW TEMP SALIN CM-I CM-II IN/DIST OUT/DIST
INCR-1 1 CL 0.00000 0.00060 25.21 0.00 0.00 0.00 0.00060 0.00000INCR-1 2 CL 0.00000 0.00060 25.21 0.00 0.00 0.00 0.00029 0.00000INCR-1 3 CL 0.00000 0.00060 25.21 0.00 0.00 0.00 0.00029 0.00000INCR-1 4 CL 0.00000 0.00060 25.21 0.00 0.00 0.00 0.00029 0.00000INCR-1 5 CL 0.00000 0.00060 25.21 0.00 0.00 0.00 0.00029 0.00000INCR-1 6 CL 0.00000 0.00060 25.21 0.00 0.00 0.00 0.00029 0.00000INCR-1 7 CL 0.00000 0.00060 25.21 0.00 0.00 0.00 0.00029 0.00000INCR-1 8 CL 0.00000 0.00060 25.21 0.00 0.00 0.00 0.00029 0.00000INCR-1 9 CL 0.00000 0.00180 25.21 0.00 0.00 0.00 0.00150 0.00000INCR-1 10 CL 0.00000 0.00180 25.21 0.00 0.00 0.00 0.00150 0.00000INCR-1 11 CL 0.00000 0.00180 25.21 0.00 0.00 0.00 0.00150 0.00000ENDATA16
$$$ DATA TYPE 17 (INCREMENTAL DATA FOR DO, BOD, AND NITROGEN) $$$
CARD TYPE REACH ID DO BOD ORG-N NH3 NO3+2
INCR-2 1 CL 2.00 0.00 0.00 0.00 0.00INCR-2 2 CL 2.00 0.00 0.00 0.00 0.00INCR-2 3 CL 2.00 0.00 0.00 0.00 0.00INCR-2 4 CL 2.00 0.00 0.00 0.00 0.00INCR-2 5 CL 2.00 0.00 0.00 0.00 0.00INCR-2 6 CL 2.00 0.00 0.00 0.00 0.00INCR-2 7 CL 2.00 0.00 0.00 0.00 0.00INCR-2 8 CL 2.00 0.00 0.00 0.00 0.00INCR-2 9 CL 2.00 0.00 0.00 0.00 0.00INCR-2 10 CL 2.00 0.00 0.00 0.00 0.00INCR-2 11 CL 2.00 0.00 0.00 0.00 0.00ENDATA17
$$$ DATA TYPE 18 (INCREMENTAL DATA FOR PHOSPHORUS, CHLOROPHYLL, COLIFORM, AND NONCONSERVATIVES) $$$
CARD TYPE REACH ID PHOS CHL A COLI NCM
INCR-3 1 CL 0.00 0.00 0.00 0.00INCR-3 2 CL 0.00 0.00 0.00 0.00INCR-3 3 CL 0.00 0.00 0.00 0.00INCR-3 4 CL 0.00 0.00 0.00 0.00INCR-3 5 CL 0.00 0.00 0.00 0.00INCR-3 6 CL 0.00 0.00 0.00 0.00INCR-3 7 CL 0.00 0.00 0.00 0.00INCR-3 8 CL 0.00 0.00 0.00 0.00INCR-3 9 CL 0.00 0.00 0.00 0.00INCR-3 10 CL 0.00 0.00 0.00 0.00INCR-3 11 CL 0.00 0.00 0.00 0.00ENDATA18
$$$ DATA TYPE 19 (NONPOINT SOURCE DATA) $$$

Upper Calcasieu River – Subsegment 030101 Water Quality Calibration for Dissolved Oxygen based on July 2001 Survey Orginated: January 10, 2002
Page 6
CARD TYPE REACH ID BOD ORG-N COLI NCM DO
NONPOINT 1 CL 0.57 0.06 0.00 0.50 0.00NONPOINT 2 CL 0.81 0.12 0.00 0.83 0.00NONPOINT 3 CL 0.61 0.14 0.00 0.83 0.00NONPOINT 4 CL 0.46 0.14 0.00 0.83 0.00NONPOINT 5 CL 0.36 0.12 0.00 0.82 0.00NONPOINT 6 CL 0.36 0.12 0.00 0.75 0.00NONPOINT 7 CL 0.51 0.12 0.00 0.75 0.00NONPOINT 8 CL 0.56 0.12 0.00 1.20 0.00NONPOINT 9 CL 0.81 0.20 0.00 2.20 0.00NONPOINT 10 CL 0.86 0.20 0.00 2.60 0.00NONPOINT 11 CL 0.96 0.22 0.00 2.70 0.00ENDATA19
$$$ DATA TYPE 20 (HEADWATER FOR FLOW, TEMPERATURE, SALINITY AND CONSERVATIVES) $$$
CARD TYPE ELEMENT NAME UNIT FLOW TEMP SALIN CM-I CM-II
HDWTR-1 1 UPPER CALCASIEU RVR 0 0.00028 25.210 0.000 0.000 0.000ENDATA20
$$$ DATA TYPE 21 (HEADWATER DATA FOR DO, BOD, AND NITROGEN) $$$
CARD TYPE ELEMENT NAME DO BOD ORG-N NH3 NO3+2
HDWTR-2 1 UPPER CALCASIEU RVR 3.45 5.06 0.65 0.05 0.03ENDATA21
$$$ DATA TYPE 22 (HEADWATER DATA FOR PHOSPHORUS, CHLOROPHYLL, COLIFORM, AND NONCONSERVATIVES) $$$
CARD TYPE ELEMENT NAME PHOS CHL A COLI NCM
HDWTR-3 1 UPPER CALCASIEU RVR 0.00 9.80 0.00 5.31ENDATA22
$$$ DATA TYPE 23 (JUNCTION DATA) $$$
CARD TYPE JUNCTION UPSTRM RIVER NAMEELEMENT ELEMENT KILOM
ENDATA23
$$$ DATA TYPE 24 (WASTELOAD DATA FOR FLOW, TEMPERATURE, SALINITY, AND CONSERVATIVES) $$$
CARD TYPE ELEMENT RKILO NAME FLOW TEMP SAL CM-I CM-II
ENDATA24
$$$ DATA TYPE 25 (WASTELOAD DATA FOR DO, BOD, AND NITROGEN) $$$% BOD %
CARD TYPE ELEMENT NAME DO BOD RMVL ORG-N NH3 NITRIF NO3+2
ENDATA25
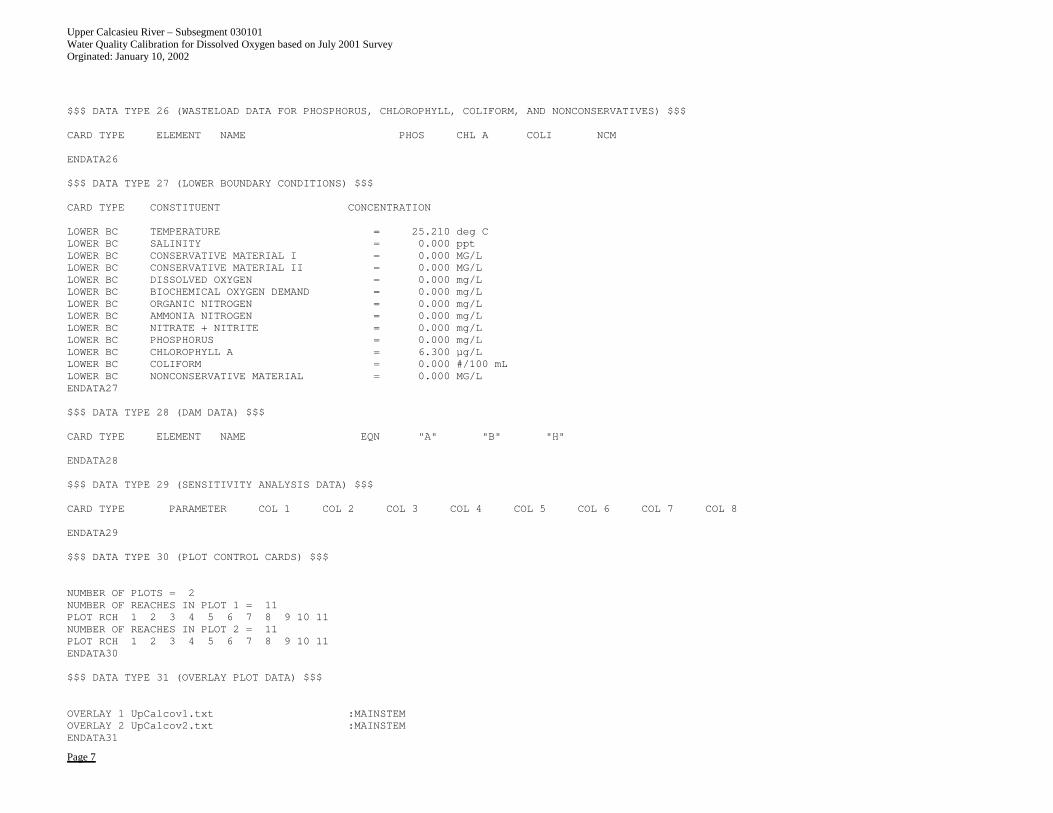
Upper Calcasieu River – Subsegment 030101 Water Quality Calibration for Dissolved Oxygen based on July 2001 Survey Orginated: January 10, 2002
Page 7
$$$ DATA TYPE 26 (WASTELOAD DATA FOR PHOSPHORUS, CHLOROPHYLL, COLIFORM, AND NONCONSERVATIVES) $$$
CARD TYPE ELEMENT NAME PHOS CHL A COLI NCM
ENDATA26
$$$ DATA TYPE 27 (LOWER BOUNDARY CONDITIONS) $$$
CARD TYPE CONSTITUENT CONCENTRATION
LOWER BC TEMPERATURE = 25.210 deg CLOWER BC SALINITY = 0.000 pptLOWER BC CONSERVATIVE MATERIAL I = 0.000 MG/LLOWER BC CONSERVATIVE MATERIAL II = 0.000 MG/LLOWER BC DISSOLVED OXYGEN = 0.000 mg/LLOWER BC BIOCHEMICAL OXYGEN DEMAND = 0.000 mg/LLOWER BC ORGANIC NITROGEN = 0.000 mg/LLOWER BC AMMONIA NITROGEN = 0.000 mg/LLOWER BC NITRATE + NITRITE = 0.000 mg/LLOWER BC PHOSPHORUS = 0.000 mg/LLOWER BC CHLOROPHYLL A = 6.300 µg/LLOWER BC COLIFORM = 0.000 #/100 mLLOWER BC NONCONSERVATIVE MATERIAL = 0.000 MG/LENDATA27
$$$ DATA TYPE 28 (DAM DATA) $$$
CARD TYPE ELEMENT NAME EQN "A" "B" "H"
ENDATA28
$$$ DATA TYPE 29 (SENSITIVITY ANALYSIS DATA) $$$
CARD TYPE PARAMETER COL 1 COL 2 COL 3 COL 4 COL 5 COL 6 COL 7 COL 8
ENDATA29
$$$ DATA TYPE 30 (PLOT CONTROL CARDS) $$$
NUMBER OF PLOTS = 2NUMBER OF REACHES IN PLOT 1 = 11PLOT RCH 1 2 3 4 5 6 7 8 9 10 11NUMBER OF REACHES IN PLOT 2 = 11PLOT RCH 1 2 3 4 5 6 7 8 9 10 11ENDATA30
$$$ DATA TYPE 31 (OVERLAY PLOT DATA) $$$
OVERLAY 1 UpCalcov1.txt :MAINSTEMOVERLAY 2 UpCalcov2.txt :MAINSTEMENDATA31
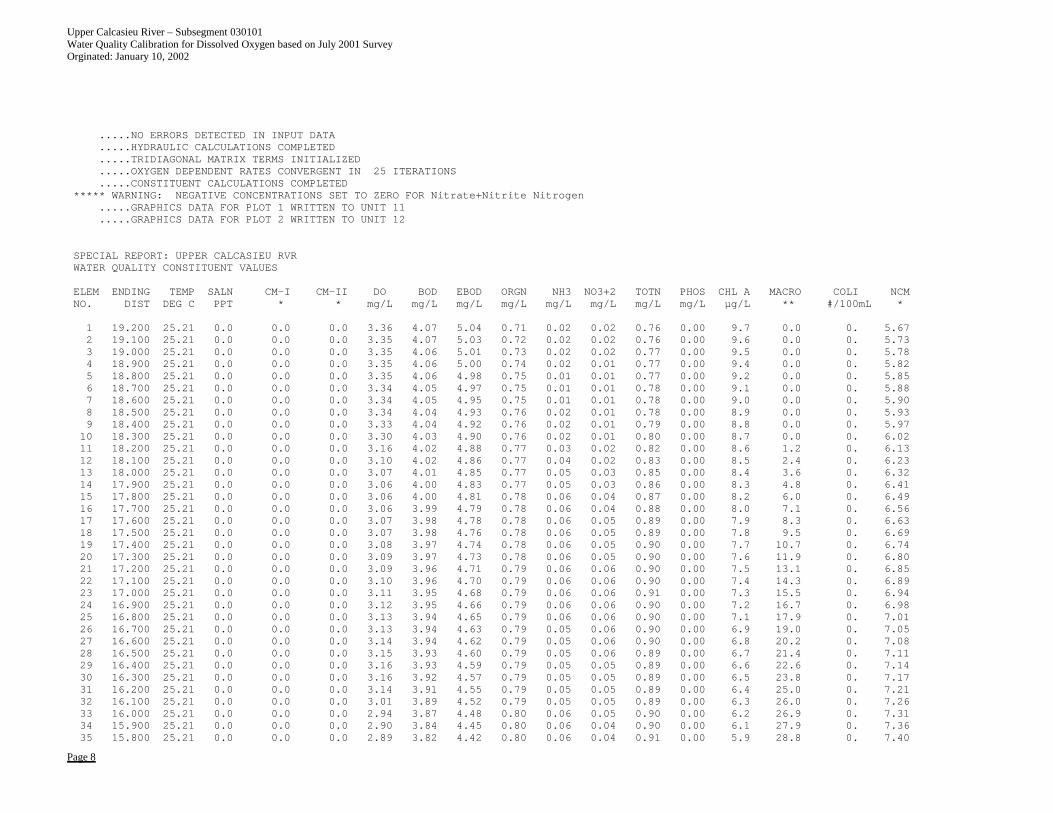
Upper Calcasieu River – Subsegment 030101 Water Quality Calibration for Dissolved Oxygen based on July 2001 Survey Orginated: January 10, 2002
Page 8
.....NO ERRORS DETECTED IN INPUT DATA
.....HYDRAULIC CALCULATIONS COMPLETED
.....TRIDIAGONAL MATRIX TERMS INITIALIZED
.....OXYGEN DEPENDENT RATES CONVERGENT IN 25 ITERATIONS
.....CONSTITUENT CALCULATIONS COMPLETED***** WARNING: NEGATIVE CONCENTRATIONS SET TO ZERO FOR Nitrate+Nitrite Nitrogen
.....GRAPHICS DATA FOR PLOT 1 WRITTEN TO UNIT 11
.....GRAPHICS DATA FOR PLOT 2 WRITTEN TO UNIT 12
SPECIAL REPORT: UPPER CALCASIEU RVRWATER QUALITY CONSTITUENT VALUES
ELEM ENDING TEMP SALN CM-I CM-II DO BOD EBOD ORGN NH3 NO3+2 TOTN PHOS CHL A MACRO COLI NCMNO. DIST DEG C PPT * * mg/L mg/L mg/L mg/L mg/L mg/L mg/L mg/L µg/L ** #/100mL *
1 19.200 25.21 0.0 0.0 0.0 3.36 4.07 5.04 0.71 0.02 0.02 0.76 0.00 9.7 0.0 0. 5.672 19.100 25.21 0.0 0.0 0.0 3.35 4.07 5.03 0.72 0.02 0.02 0.76 0.00 9.6 0.0 0. 5.733 19.000 25.21 0.0 0.0 0.0 3.35 4.06 5.01 0.73 0.02 0.02 0.77 0.00 9.5 0.0 0. 5.784 18.900 25.21 0.0 0.0 0.0 3.35 4.06 5.00 0.74 0.02 0.01 0.77 0.00 9.4 0.0 0. 5.825 18.800 25.21 0.0 0.0 0.0 3.35 4.06 4.98 0.75 0.01 0.01 0.77 0.00 9.2 0.0 0. 5.856 18.700 25.21 0.0 0.0 0.0 3.34 4.05 4.97 0.75 0.01 0.01 0.78 0.00 9.1 0.0 0. 5.887 18.600 25.21 0.0 0.0 0.0 3.34 4.05 4.95 0.75 0.01 0.01 0.78 0.00 9.0 0.0 0. 5.908 18.500 25.21 0.0 0.0 0.0 3.34 4.04 4.93 0.76 0.02 0.01 0.78 0.00 8.9 0.0 0. 5.939 18.400 25.21 0.0 0.0 0.0 3.33 4.04 4.92 0.76 0.02 0.01 0.79 0.00 8.8 0.0 0. 5.9710 18.300 25.21 0.0 0.0 0.0 3.30 4.03 4.90 0.76 0.02 0.01 0.80 0.00 8.7 0.0 0. 6.0211 18.200 25.21 0.0 0.0 0.0 3.16 4.02 4.88 0.77 0.03 0.02 0.82 0.00 8.6 1.2 0. 6.1312 18.100 25.21 0.0 0.0 0.0 3.10 4.02 4.86 0.77 0.04 0.02 0.83 0.00 8.5 2.4 0. 6.2313 18.000 25.21 0.0 0.0 0.0 3.07 4.01 4.85 0.77 0.05 0.03 0.85 0.00 8.4 3.6 0. 6.3214 17.900 25.21 0.0 0.0 0.0 3.06 4.00 4.83 0.77 0.05 0.03 0.86 0.00 8.3 4.8 0. 6.4115 17.800 25.21 0.0 0.0 0.0 3.06 4.00 4.81 0.78 0.06 0.04 0.87 0.00 8.2 6.0 0. 6.4916 17.700 25.21 0.0 0.0 0.0 3.06 3.99 4.79 0.78 0.06 0.04 0.88 0.00 8.0 7.1 0. 6.5617 17.600 25.21 0.0 0.0 0.0 3.07 3.98 4.78 0.78 0.06 0.05 0.89 0.00 7.9 8.3 0. 6.6318 17.500 25.21 0.0 0.0 0.0 3.07 3.98 4.76 0.78 0.06 0.05 0.89 0.00 7.8 9.5 0. 6.6919 17.400 25.21 0.0 0.0 0.0 3.08 3.97 4.74 0.78 0.06 0.05 0.90 0.00 7.7 10.7 0. 6.7420 17.300 25.21 0.0 0.0 0.0 3.09 3.97 4.73 0.78 0.06 0.05 0.90 0.00 7.6 11.9 0. 6.8021 17.200 25.21 0.0 0.0 0.0 3.09 3.96 4.71 0.79 0.06 0.06 0.90 0.00 7.5 13.1 0. 6.8522 17.100 25.21 0.0 0.0 0.0 3.10 3.96 4.70 0.79 0.06 0.06 0.90 0.00 7.4 14.3 0. 6.8923 17.000 25.21 0.0 0.0 0.0 3.11 3.95 4.68 0.79 0.06 0.06 0.91 0.00 7.3 15.5 0. 6.9424 16.900 25.21 0.0 0.0 0.0 3.12 3.95 4.66 0.79 0.06 0.06 0.90 0.00 7.2 16.7 0. 6.9825 16.800 25.21 0.0 0.0 0.0 3.13 3.94 4.65 0.79 0.06 0.06 0.90 0.00 7.1 17.9 0. 7.0126 16.700 25.21 0.0 0.0 0.0 3.13 3.94 4.63 0.79 0.05 0.06 0.90 0.00 6.9 19.0 0. 7.0527 16.600 25.21 0.0 0.0 0.0 3.14 3.94 4.62 0.79 0.05 0.06 0.90 0.00 6.8 20.2 0. 7.0828 16.500 25.21 0.0 0.0 0.0 3.15 3.93 4.60 0.79 0.05 0.06 0.89 0.00 6.7 21.4 0. 7.1129 16.400 25.21 0.0 0.0 0.0 3.16 3.93 4.59 0.79 0.05 0.05 0.89 0.00 6.6 22.6 0. 7.1430 16.300 25.21 0.0 0.0 0.0 3.16 3.92 4.57 0.79 0.05 0.05 0.89 0.00 6.5 23.8 0. 7.1731 16.200 25.21 0.0 0.0 0.0 3.14 3.91 4.55 0.79 0.05 0.05 0.89 0.00 6.4 25.0 0. 7.2132 16.100 25.21 0.0 0.0 0.0 3.01 3.89 4.52 0.79 0.05 0.05 0.89 0.00 6.3 26.0 0. 7.2633 16.000 25.21 0.0 0.0 0.0 2.94 3.87 4.48 0.80 0.06 0.05 0.90 0.00 6.2 26.9 0. 7.3134 15.900 25.21 0.0 0.0 0.0 2.90 3.84 4.45 0.80 0.06 0.04 0.90 0.00 6.1 27.9 0. 7.3635 15.800 25.21 0.0 0.0 0.0 2.89 3.82 4.42 0.80 0.06 0.04 0.91 0.00 5.9 28.8 0. 7.40
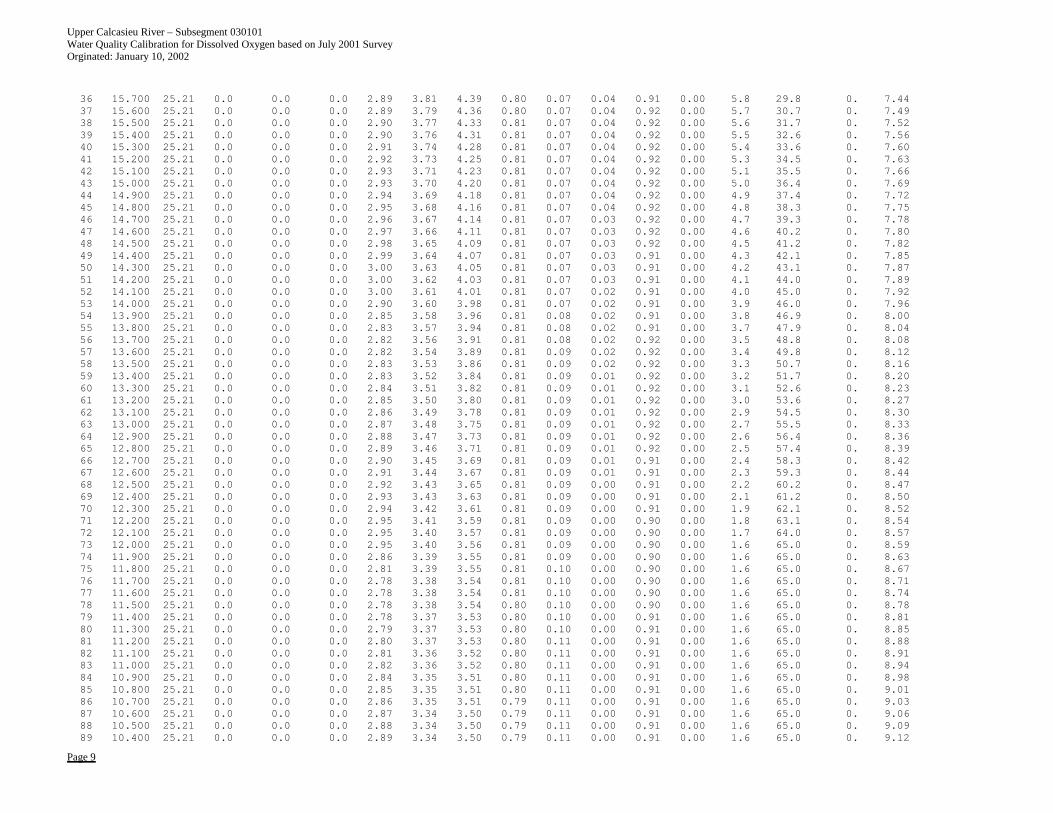
Upper Calcasieu River – Subsegment 030101 Water Quality Calibration for Dissolved Oxygen based on July 2001 Survey Orginated: January 10, 2002
Page 9
36 15.700 25.21 0.0 0.0 0.0 2.89 3.81 4.39 0.80 0.07 0.04 0.91 0.00 5.8 29.8 0. 7.4437 15.600 25.21 0.0 0.0 0.0 2.89 3.79 4.36 0.80 0.07 0.04 0.92 0.00 5.7 30.7 0. 7.4938 15.500 25.21 0.0 0.0 0.0 2.90 3.77 4.33 0.81 0.07 0.04 0.92 0.00 5.6 31.7 0. 7.5239 15.400 25.21 0.0 0.0 0.0 2.90 3.76 4.31 0.81 0.07 0.04 0.92 0.00 5.5 32.6 0. 7.5640 15.300 25.21 0.0 0.0 0.0 2.91 3.74 4.28 0.81 0.07 0.04 0.92 0.00 5.4 33.6 0. 7.6041 15.200 25.21 0.0 0.0 0.0 2.92 3.73 4.25 0.81 0.07 0.04 0.92 0.00 5.3 34.5 0. 7.6342 15.100 25.21 0.0 0.0 0.0 2.93 3.71 4.23 0.81 0.07 0.04 0.92 0.00 5.1 35.5 0. 7.6643 15.000 25.21 0.0 0.0 0.0 2.93 3.70 4.20 0.81 0.07 0.04 0.92 0.00 5.0 36.4 0. 7.6944 14.900 25.21 0.0 0.0 0.0 2.94 3.69 4.18 0.81 0.07 0.04 0.92 0.00 4.9 37.4 0. 7.7245 14.800 25.21 0.0 0.0 0.0 2.95 3.68 4.16 0.81 0.07 0.04 0.92 0.00 4.8 38.3 0. 7.7546 14.700 25.21 0.0 0.0 0.0 2.96 3.67 4.14 0.81 0.07 0.03 0.92 0.00 4.7 39.3 0. 7.7847 14.600 25.21 0.0 0.0 0.0 2.97 3.66 4.11 0.81 0.07 0.03 0.92 0.00 4.6 40.2 0. 7.8048 14.500 25.21 0.0 0.0 0.0 2.98 3.65 4.09 0.81 0.07 0.03 0.92 0.00 4.5 41.2 0. 7.8249 14.400 25.21 0.0 0.0 0.0 2.99 3.64 4.07 0.81 0.07 0.03 0.91 0.00 4.3 42.1 0. 7.8550 14.300 25.21 0.0 0.0 0.0 3.00 3.63 4.05 0.81 0.07 0.03 0.91 0.00 4.2 43.1 0. 7.8751 14.200 25.21 0.0 0.0 0.0 3.00 3.62 4.03 0.81 0.07 0.03 0.91 0.00 4.1 44.0 0. 7.8952 14.100 25.21 0.0 0.0 0.0 3.00 3.61 4.01 0.81 0.07 0.02 0.91 0.00 4.0 45.0 0. 7.9253 14.000 25.21 0.0 0.0 0.0 2.90 3.60 3.98 0.81 0.07 0.02 0.91 0.00 3.9 46.0 0. 7.9654 13.900 25.21 0.0 0.0 0.0 2.85 3.58 3.96 0.81 0.08 0.02 0.91 0.00 3.8 46.9 0. 8.0055 13.800 25.21 0.0 0.0 0.0 2.83 3.57 3.94 0.81 0.08 0.02 0.91 0.00 3.7 47.9 0. 8.0456 13.700 25.21 0.0 0.0 0.0 2.82 3.56 3.91 0.81 0.08 0.02 0.92 0.00 3.5 48.8 0. 8.0857 13.600 25.21 0.0 0.0 0.0 2.82 3.54 3.89 0.81 0.09 0.02 0.92 0.00 3.4 49.8 0. 8.1258 13.500 25.21 0.0 0.0 0.0 2.83 3.53 3.86 0.81 0.09 0.02 0.92 0.00 3.3 50.7 0. 8.1659 13.400 25.21 0.0 0.0 0.0 2.83 3.52 3.84 0.81 0.09 0.01 0.92 0.00 3.2 51.7 0. 8.2060 13.300 25.21 0.0 0.0 0.0 2.84 3.51 3.82 0.81 0.09 0.01 0.92 0.00 3.1 52.6 0. 8.2361 13.200 25.21 0.0 0.0 0.0 2.85 3.50 3.80 0.81 0.09 0.01 0.92 0.00 3.0 53.6 0. 8.2762 13.100 25.21 0.0 0.0 0.0 2.86 3.49 3.78 0.81 0.09 0.01 0.92 0.00 2.9 54.5 0. 8.3063 13.000 25.21 0.0 0.0 0.0 2.87 3.48 3.75 0.81 0.09 0.01 0.92 0.00 2.7 55.5 0. 8.3364 12.900 25.21 0.0 0.0 0.0 2.88 3.47 3.73 0.81 0.09 0.01 0.92 0.00 2.6 56.4 0. 8.3665 12.800 25.21 0.0 0.0 0.0 2.89 3.46 3.71 0.81 0.09 0.01 0.92 0.00 2.5 57.4 0. 8.3966 12.700 25.21 0.0 0.0 0.0 2.90 3.45 3.69 0.81 0.09 0.01 0.91 0.00 2.4 58.3 0. 8.4267 12.600 25.21 0.0 0.0 0.0 2.91 3.44 3.67 0.81 0.09 0.01 0.91 0.00 2.3 59.3 0. 8.4468 12.500 25.21 0.0 0.0 0.0 2.92 3.43 3.65 0.81 0.09 0.00 0.91 0.00 2.2 60.2 0. 8.4769 12.400 25.21 0.0 0.0 0.0 2.93 3.43 3.63 0.81 0.09 0.00 0.91 0.00 2.1 61.2 0. 8.5070 12.300 25.21 0.0 0.0 0.0 2.94 3.42 3.61 0.81 0.09 0.00 0.91 0.00 1.9 62.1 0. 8.5271 12.200 25.21 0.0 0.0 0.0 2.95 3.41 3.59 0.81 0.09 0.00 0.90 0.00 1.8 63.1 0. 8.5472 12.100 25.21 0.0 0.0 0.0 2.95 3.40 3.57 0.81 0.09 0.00 0.90 0.00 1.7 64.0 0. 8.5773 12.000 25.21 0.0 0.0 0.0 2.95 3.40 3.56 0.81 0.09 0.00 0.90 0.00 1.6 65.0 0. 8.5974 11.900 25.21 0.0 0.0 0.0 2.86 3.39 3.55 0.81 0.09 0.00 0.90 0.00 1.6 65.0 0. 8.6375 11.800 25.21 0.0 0.0 0.0 2.81 3.39 3.55 0.81 0.10 0.00 0.90 0.00 1.6 65.0 0. 8.6776 11.700 25.21 0.0 0.0 0.0 2.78 3.38 3.54 0.81 0.10 0.00 0.90 0.00 1.6 65.0 0. 8.7177 11.600 25.21 0.0 0.0 0.0 2.78 3.38 3.54 0.81 0.10 0.00 0.90 0.00 1.6 65.0 0. 8.7478 11.500 25.21 0.0 0.0 0.0 2.78 3.38 3.54 0.80 0.10 0.00 0.90 0.00 1.6 65.0 0. 8.7879 11.400 25.21 0.0 0.0 0.0 2.78 3.37 3.53 0.80 0.10 0.00 0.91 0.00 1.6 65.0 0. 8.8180 11.300 25.21 0.0 0.0 0.0 2.79 3.37 3.53 0.80 0.10 0.00 0.91 0.00 1.6 65.0 0. 8.8581 11.200 25.21 0.0 0.0 0.0 2.80 3.37 3.53 0.80 0.11 0.00 0.91 0.00 1.6 65.0 0. 8.8882 11.100 25.21 0.0 0.0 0.0 2.81 3.36 3.52 0.80 0.11 0.00 0.91 0.00 1.6 65.0 0. 8.9183 11.000 25.21 0.0 0.0 0.0 2.82 3.36 3.52 0.80 0.11 0.00 0.91 0.00 1.6 65.0 0. 8.9484 10.900 25.21 0.0 0.0 0.0 2.84 3.35 3.51 0.80 0.11 0.00 0.91 0.00 1.6 65.0 0. 8.9885 10.800 25.21 0.0 0.0 0.0 2.85 3.35 3.51 0.80 0.11 0.00 0.91 0.00 1.6 65.0 0. 9.0186 10.700 25.21 0.0 0.0 0.0 2.86 3.35 3.51 0.79 0.11 0.00 0.91 0.00 1.6 65.0 0. 9.0387 10.600 25.21 0.0 0.0 0.0 2.87 3.34 3.50 0.79 0.11 0.00 0.91 0.00 1.6 65.0 0. 9.0688 10.500 25.21 0.0 0.0 0.0 2.88 3.34 3.50 0.79 0.11 0.00 0.91 0.00 1.6 65.0 0. 9.0989 10.400 25.21 0.0 0.0 0.0 2.89 3.34 3.50 0.79 0.11 0.00 0.91 0.00 1.6 65.0 0. 9.12

Upper Calcasieu River – Subsegment 030101 Water Quality Calibration for Dissolved Oxygen based on July 2001 Survey Orginated: January 10, 2002
Page 10
90 10.300 25.21 0.0 0.0 0.0 2.90 3.33 3.49 0.79 0.12 0.00 0.91 0.00 1.6 65.0 0. 9.1491 10.200 25.21 0.0 0.0 0.0 2.91 3.33 3.49 0.79 0.12 0.00 0.91 0.00 1.6 65.0 0. 9.1792 10.100 25.21 0.0 0.0 0.0 2.92 3.32 3.48 0.79 0.12 0.00 0.90 0.00 1.6 65.0 0. 9.1993 10.000 25.21 0.0 0.0 0.0 2.93 3.32 3.48 0.79 0.12 0.00 0.90 0.00 1.6 65.0 0. 9.2294 9.900 25.21 0.0 0.0 0.0 2.92 3.32 3.48 0.79 0.12 0.00 0.90 0.00 1.6 65.0 0. 9.2495 9.800 25.21 0.0 0.0 0.0 2.59 3.30 3.46 0.78 0.12 0.00 0.90 0.00 1.6 64.5 0. 9.2496 9.700 25.21 0.0 0.0 0.0 2.41 3.29 3.45 0.78 0.11 0.00 0.89 0.00 1.7 64.0 0. 9.2497 9.600 25.21 0.0 0.0 0.0 2.32 3.27 3.44 0.78 0.11 0.00 0.89 0.00 1.7 63.6 0. 9.2498 9.500 25.21 0.0 0.0 0.0 2.27 3.26 3.43 0.78 0.11 0.00 0.89 0.00 1.8 63.1 0. 9.2499 9.400 25.21 0.0 0.0 0.0 2.25 3.25 3.42 0.77 0.11 0.00 0.88 0.00 1.8 62.6 0. 9.24100 9.300 25.21 0.0 0.0 0.0 2.24 3.23 3.42 0.77 0.11 0.00 0.88 0.00 1.8 62.1 0. 9.24101 9.200 25.21 0.0 0.0 0.0 2.24 3.22 3.41 0.77 0.11 0.00 0.88 0.00 1.9 61.7 0. 9.24102 9.100 25.21 0.0 0.0 0.0 2.24 3.21 3.40 0.77 0.11 0.00 0.87 0.00 1.9 61.2 0. 9.24103 9.000 25.21 0.0 0.0 0.0 2.25 3.20 3.39 0.76 0.11 0.00 0.87 0.00 1.9 60.7 0. 9.24104 8.900 25.21 0.0 0.0 0.0 2.26 3.18 3.38 0.76 0.11 0.00 0.87 0.00 2.0 60.2 0. 9.24105 8.800 25.21 0.0 0.0 0.0 2.27 3.17 3.37 0.76 0.11 0.00 0.87 0.00 2.0 59.8 0. 9.24106 8.700 25.21 0.0 0.0 0.0 2.28 3.16 3.37 0.76 0.10 0.00 0.86 0.00 2.1 59.3 0. 9.24107 8.600 25.21 0.0 0.0 0.0 2.29 3.15 3.36 0.76 0.10 0.00 0.86 0.00 2.1 58.8 0. 9.24108 8.500 25.21 0.0 0.0 0.0 2.29 3.14 3.35 0.75 0.10 0.00 0.86 0.00 2.1 58.3 0. 9.24109 8.400 25.21 0.0 0.0 0.0 2.30 3.13 3.35 0.75 0.10 0.00 0.86 0.00 2.2 57.9 0. 9.24110 8.300 25.21 0.0 0.0 0.0 2.31 3.12 3.34 0.75 0.10 0.00 0.85 0.00 2.2 57.4 0. 9.24111 8.200 25.21 0.0 0.0 0.0 2.32 3.11 3.33 0.75 0.10 0.00 0.85 0.00 2.2 56.9 0. 9.24112 8.100 25.21 0.0 0.0 0.0 2.33 3.10 3.33 0.75 0.10 0.00 0.85 0.00 2.3 56.4 0. 9.24113 8.000 25.21 0.0 0.0 0.0 2.34 3.09 3.32 0.75 0.10 0.00 0.85 0.00 2.3 56.0 0. 9.24114 7.900 25.21 0.0 0.0 0.0 2.35 3.08 3.31 0.74 0.10 0.00 0.85 0.00 2.4 55.5 0. 9.24115 7.800 25.21 0.0 0.0 0.0 2.33 3.07 3.31 0.74 0.10 0.00 0.84 0.00 2.4 55.0 0. 9.24116 7.700 25.21 0.0 0.0 0.0 2.00 3.07 3.31 0.74 0.10 0.00 0.84 0.00 2.4 53.3 0. 9.22117 7.600 25.21 0.0 0.0 0.0 1.81 3.08 3.32 0.74 0.10 0.00 0.83 0.00 2.5 51.7 0. 9.21118 7.500 25.21 0.0 0.0 0.0 1.71 3.08 3.33 0.74 0.09 0.00 0.83 0.00 2.5 50.0 0. 9.20119 7.400 25.21 0.0 0.0 0.0 1.66 3.09 3.34 0.73 0.09 0.00 0.83 0.00 2.5 48.3 0. 9.19120 7.300 25.21 0.0 0.0 0.0 1.63 3.09 3.35 0.73 0.09 0.00 0.82 0.00 2.6 46.7 0. 9.18121 7.200 25.21 0.0 0.0 0.0 1.62 3.10 3.36 0.73 0.09 0.00 0.82 0.00 2.6 45.0 0. 9.18122 7.100 25.21 0.0 0.0 0.0 1.62 3.11 3.37 0.73 0.09 0.00 0.82 0.00 2.6 43.3 0. 9.17123 7.000 25.21 0.0 0.0 0.0 1.62 3.11 3.38 0.73 0.09 0.00 0.82 0.00 2.7 41.7 0. 9.16124 6.900 25.21 0.0 0.0 0.0 1.62 3.12 3.39 0.72 0.09 0.00 0.81 0.00 2.7 40.0 0. 9.15125 6.800 25.21 0.0 0.0 0.0 1.63 3.12 3.40 0.72 0.09 0.00 0.81 0.00 2.7 38.3 0. 9.14126 6.700 25.21 0.0 0.0 0.0 1.64 3.13 3.40 0.72 0.09 0.00 0.81 0.00 2.8 36.7 0. 9.13127 6.600 25.21 0.0 0.0 0.0 1.64 3.13 3.41 0.72 0.09 0.00 0.81 0.00 2.8 35.0 0. 9.12128 6.500 25.21 0.0 0.0 0.0 1.65 3.14 3.42 0.72 0.09 0.00 0.81 0.00 2.8 33.3 0. 9.11129 6.400 25.21 0.0 0.0 0.0 1.66 3.14 3.43 0.72 0.09 0.00 0.81 0.00 2.9 31.7 0. 9.10130 6.300 25.21 0.0 0.0 0.0 1.67 3.14 3.43 0.71 0.09 0.00 0.81 0.00 2.9 30.0 0. 9.09131 6.200 25.21 0.0 0.0 0.0 1.67 3.15 3.44 0.71 0.09 0.00 0.81 0.00 2.9 28.3 0. 9.08132 6.100 25.21 0.0 0.0 0.0 1.68 3.15 3.45 0.71 0.09 0.00 0.81 0.00 3.0 26.7 0. 9.08133 6.000 25.21 0.0 0.0 0.0 1.69 3.15 3.45 0.71 0.10 0.00 0.81 0.00 3.0 25.0 0. 9.07134 5.900 25.21 0.0 0.0 0.0 1.70 3.16 3.46 0.71 0.10 0.00 0.81 0.00 3.0 23.3 0. 9.06135 5.800 25.21 0.0 0.0 0.0 1.70 3.16 3.46 0.71 0.10 0.00 0.81 0.00 3.1 21.7 0. 9.05136 5.700 25.21 0.0 0.0 0.0 1.68 3.16 3.47 0.70 0.10 0.00 0.81 0.00 3.1 20.0 0. 9.05137 5.600 25.21 0.0 0.0 0.0 1.41 3.17 3.48 0.70 0.10 0.00 0.80 0.00 3.1 19.9 0. 9.09138 5.500 25.21 0.0 0.0 0.0 1.26 3.17 3.48 0.70 0.10 0.00 0.80 0.00 3.1 19.8 0. 9.13139 5.400 25.21 0.0 0.0 0.0 1.17 3.18 3.49 0.70 0.10 0.00 0.80 0.00 3.1 19.7 0. 9.16140 5.300 25.21 0.0 0.0 0.0 1.13 3.19 3.50 0.70 0.10 0.00 0.80 0.00 3.1 19.6 0. 9.20141 5.200 25.21 0.0 0.0 0.0 1.10 3.20 3.51 0.70 0.10 0.00 0.80 0.00 3.1 19.5 0. 9.24142 5.100 25.21 0.0 0.0 0.0 1.09 3.21 3.52 0.70 0.10 0.00 0.80 0.00 3.1 19.4 0. 9.27143 5.000 25.21 0.0 0.0 0.0 1.09 3.22 3.53 0.70 0.10 0.00 0.80 0.00 3.1 19.3 0. 9.31
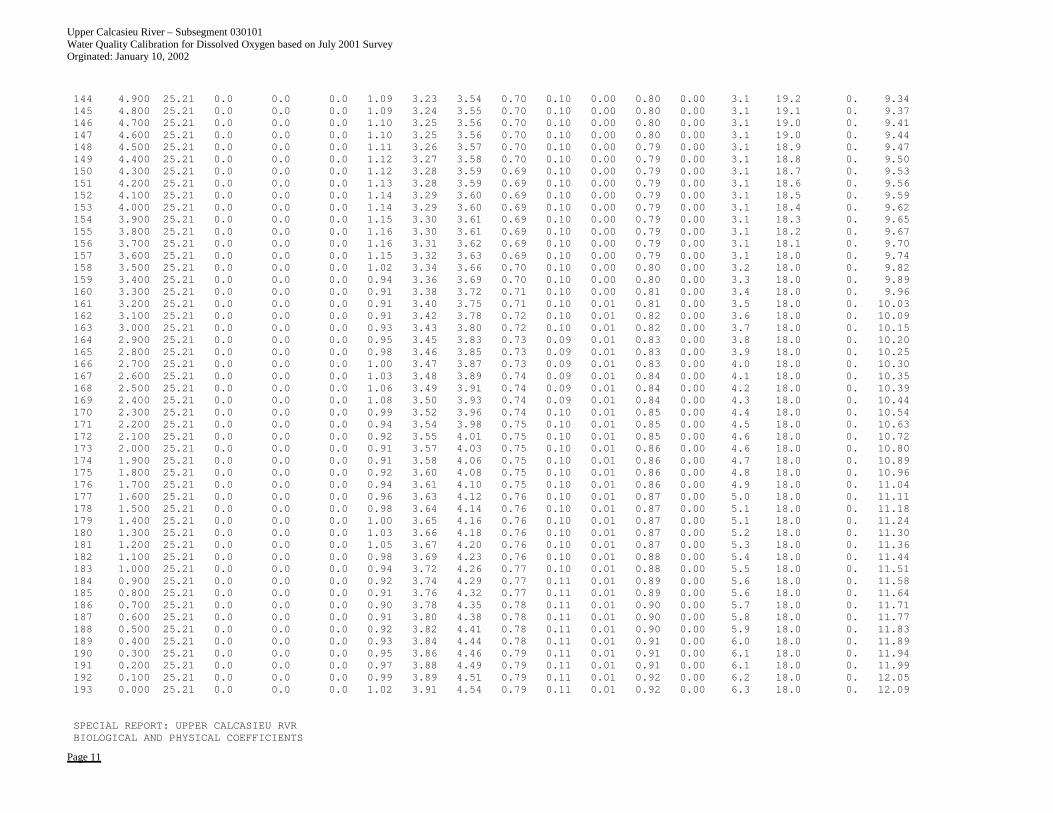
Upper Calcasieu River – Subsegment 030101 Water Quality Calibration for Dissolved Oxygen based on July 2001 Survey Orginated: January 10, 2002
Page 11
144 4.900 25.21 0.0 0.0 0.0 1.09 3.23 3.54 0.70 0.10 0.00 0.80 0.00 3.1 19.2 0. 9.34145 4.800 25.21 0.0 0.0 0.0 1.09 3.24 3.55 0.70 0.10 0.00 0.80 0.00 3.1 19.1 0. 9.37146 4.700 25.21 0.0 0.0 0.0 1.10 3.25 3.56 0.70 0.10 0.00 0.80 0.00 3.1 19.0 0. 9.41147 4.600 25.21 0.0 0.0 0.0 1.10 3.25 3.56 0.70 0.10 0.00 0.80 0.00 3.1 19.0 0. 9.44148 4.500 25.21 0.0 0.0 0.0 1.11 3.26 3.57 0.70 0.10 0.00 0.79 0.00 3.1 18.9 0. 9.47149 4.400 25.21 0.0 0.0 0.0 1.12 3.27 3.58 0.70 0.10 0.00 0.79 0.00 3.1 18.8 0. 9.50150 4.300 25.21 0.0 0.0 0.0 1.12 3.28 3.59 0.69 0.10 0.00 0.79 0.00 3.1 18.7 0. 9.53151 4.200 25.21 0.0 0.0 0.0 1.13 3.28 3.59 0.69 0.10 0.00 0.79 0.00 3.1 18.6 0. 9.56152 4.100 25.21 0.0 0.0 0.0 1.14 3.29 3.60 0.69 0.10 0.00 0.79 0.00 3.1 18.5 0. 9.59153 4.000 25.21 0.0 0.0 0.0 1.14 3.29 3.60 0.69 0.10 0.00 0.79 0.00 3.1 18.4 0. 9.62154 3.900 25.21 0.0 0.0 0.0 1.15 3.30 3.61 0.69 0.10 0.00 0.79 0.00 3.1 18.3 0. 9.65155 3.800 25.21 0.0 0.0 0.0 1.16 3.30 3.61 0.69 0.10 0.00 0.79 0.00 3.1 18.2 0. 9.67156 3.700 25.21 0.0 0.0 0.0 1.16 3.31 3.62 0.69 0.10 0.00 0.79 0.00 3.1 18.1 0. 9.70157 3.600 25.21 0.0 0.0 0.0 1.15 3.32 3.63 0.69 0.10 0.00 0.79 0.00 3.1 18.0 0. 9.74158 3.500 25.21 0.0 0.0 0.0 1.02 3.34 3.66 0.70 0.10 0.00 0.80 0.00 3.2 18.0 0. 9.82159 3.400 25.21 0.0 0.0 0.0 0.94 3.36 3.69 0.70 0.10 0.00 0.80 0.00 3.3 18.0 0. 9.89160 3.300 25.21 0.0 0.0 0.0 0.91 3.38 3.72 0.71 0.10 0.00 0.81 0.00 3.4 18.0 0. 9.96161 3.200 25.21 0.0 0.0 0.0 0.91 3.40 3.75 0.71 0.10 0.01 0.81 0.00 3.5 18.0 0. 10.03162 3.100 25.21 0.0 0.0 0.0 0.91 3.42 3.78 0.72 0.10 0.01 0.82 0.00 3.6 18.0 0. 10.09163 3.000 25.21 0.0 0.0 0.0 0.93 3.43 3.80 0.72 0.10 0.01 0.82 0.00 3.7 18.0 0. 10.15164 2.900 25.21 0.0 0.0 0.0 0.95 3.45 3.83 0.73 0.09 0.01 0.83 0.00 3.8 18.0 0. 10.20165 2.800 25.21 0.0 0.0 0.0 0.98 3.46 3.85 0.73 0.09 0.01 0.83 0.00 3.9 18.0 0. 10.25166 2.700 25.21 0.0 0.0 0.0 1.00 3.47 3.87 0.73 0.09 0.01 0.83 0.00 4.0 18.0 0. 10.30167 2.600 25.21 0.0 0.0 0.0 1.03 3.48 3.89 0.74 0.09 0.01 0.84 0.00 4.1 18.0 0. 10.35168 2.500 25.21 0.0 0.0 0.0 1.06 3.49 3.91 0.74 0.09 0.01 0.84 0.00 4.2 18.0 0. 10.39169 2.400 25.21 0.0 0.0 0.0 1.08 3.50 3.93 0.74 0.09 0.01 0.84 0.00 4.3 18.0 0. 10.44170 2.300 25.21 0.0 0.0 0.0 0.99 3.52 3.96 0.74 0.10 0.01 0.85 0.00 4.4 18.0 0. 10.54171 2.200 25.21 0.0 0.0 0.0 0.94 3.54 3.98 0.75 0.10 0.01 0.85 0.00 4.5 18.0 0. 10.63172 2.100 25.21 0.0 0.0 0.0 0.92 3.55 4.01 0.75 0.10 0.01 0.85 0.00 4.6 18.0 0. 10.72173 2.000 25.21 0.0 0.0 0.0 0.91 3.57 4.03 0.75 0.10 0.01 0.86 0.00 4.6 18.0 0. 10.80174 1.900 25.21 0.0 0.0 0.0 0.91 3.58 4.06 0.75 0.10 0.01 0.86 0.00 4.7 18.0 0. 10.89175 1.800 25.21 0.0 0.0 0.0 0.92 3.60 4.08 0.75 0.10 0.01 0.86 0.00 4.8 18.0 0. 10.96176 1.700 25.21 0.0 0.0 0.0 0.94 3.61 4.10 0.75 0.10 0.01 0.86 0.00 4.9 18.0 0. 11.04177 1.600 25.21 0.0 0.0 0.0 0.96 3.63 4.12 0.76 0.10 0.01 0.87 0.00 5.0 18.0 0. 11.11178 1.500 25.21 0.0 0.0 0.0 0.98 3.64 4.14 0.76 0.10 0.01 0.87 0.00 5.1 18.0 0. 11.18179 1.400 25.21 0.0 0.0 0.0 1.00 3.65 4.16 0.76 0.10 0.01 0.87 0.00 5.1 18.0 0. 11.24180 1.300 25.21 0.0 0.0 0.0 1.03 3.66 4.18 0.76 0.10 0.01 0.87 0.00 5.2 18.0 0. 11.30181 1.200 25.21 0.0 0.0 0.0 1.05 3.67 4.20 0.76 0.10 0.01 0.87 0.00 5.3 18.0 0. 11.36182 1.100 25.21 0.0 0.0 0.0 0.98 3.69 4.23 0.76 0.10 0.01 0.88 0.00 5.4 18.0 0. 11.44183 1.000 25.21 0.0 0.0 0.0 0.94 3.72 4.26 0.77 0.10 0.01 0.88 0.00 5.5 18.0 0. 11.51184 0.900 25.21 0.0 0.0 0.0 0.92 3.74 4.29 0.77 0.11 0.01 0.89 0.00 5.6 18.0 0. 11.58185 0.800 25.21 0.0 0.0 0.0 0.91 3.76 4.32 0.77 0.11 0.01 0.89 0.00 5.6 18.0 0. 11.64186 0.700 25.21 0.0 0.0 0.0 0.90 3.78 4.35 0.78 0.11 0.01 0.90 0.00 5.7 18.0 0. 11.71187 0.600 25.21 0.0 0.0 0.0 0.91 3.80 4.38 0.78 0.11 0.01 0.90 0.00 5.8 18.0 0. 11.77188 0.500 25.21 0.0 0.0 0.0 0.92 3.82 4.41 0.78 0.11 0.01 0.90 0.00 5.9 18.0 0. 11.83189 0.400 25.21 0.0 0.0 0.0 0.93 3.84 4.44 0.78 0.11 0.01 0.91 0.00 6.0 18.0 0. 11.89190 0.300 25.21 0.0 0.0 0.0 0.95 3.86 4.46 0.79 0.11 0.01 0.91 0.00 6.1 18.0 0. 11.94191 0.200 25.21 0.0 0.0 0.0 0.97 3.88 4.49 0.79 0.11 0.01 0.91 0.00 6.1 18.0 0. 11.99192 0.100 25.21 0.0 0.0 0.0 0.99 3.89 4.51 0.79 0.11 0.01 0.92 0.00 6.2 18.0 0. 12.05193 0.000 25.21 0.0 0.0 0.0 1.02 3.91 4.54 0.79 0.11 0.01 0.92 0.00 6.3 18.0 0. 12.09
SPECIAL REPORT: UPPER CALCASIEU RVRBIOLOGICAL AND PHYSICAL COEFFICIENTS
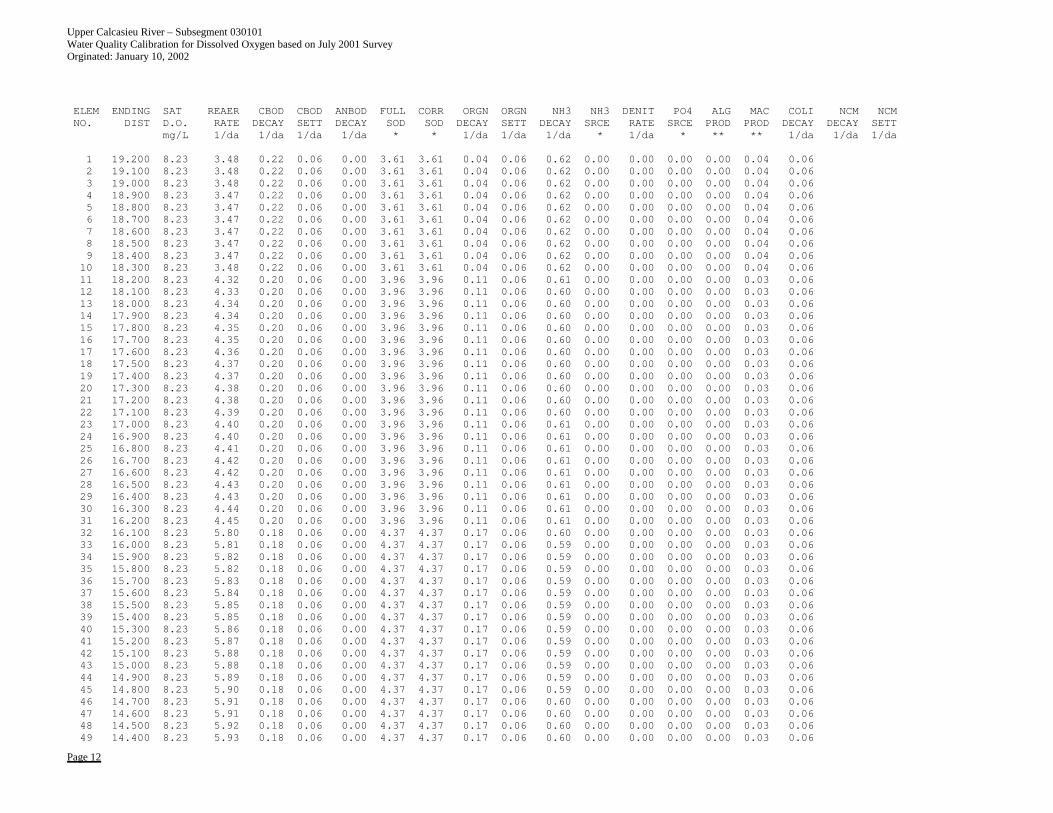
Upper Calcasieu River – Subsegment 030101 Water Quality Calibration for Dissolved Oxygen based on July 2001 Survey Orginated: January 10, 2002
Page 12
ELEM ENDING SAT REAER CBOD CBOD ANBOD FULL CORR ORGN ORGN NH3 NH3 DENIT PO4 ALG MAC COLI NCM NCMNO. DIST D.O. RATE DECAY SETT DECAY SOD SOD DECAY SETT DECAY SRCE RATE SRCE PROD PROD DECAY DECAY SETT
mg/L 1/da 1/da 1/da 1/da * * 1/da 1/da 1/da * 1/da * ** ** 1/da 1/da 1/da
1 19.200 8.23 3.48 0.22 0.06 0.00 3.61 3.61 0.04 0.06 0.62 0.00 0.00 0.00 0.00 0.04 0.062 19.100 8.23 3.48 0.22 0.06 0.00 3.61 3.61 0.04 0.06 0.62 0.00 0.00 0.00 0.00 0.04 0.063 19.000 8.23 3.48 0.22 0.06 0.00 3.61 3.61 0.04 0.06 0.62 0.00 0.00 0.00 0.00 0.04 0.064 18.900 8.23 3.47 0.22 0.06 0.00 3.61 3.61 0.04 0.06 0.62 0.00 0.00 0.00 0.00 0.04 0.065 18.800 8.23 3.47 0.22 0.06 0.00 3.61 3.61 0.04 0.06 0.62 0.00 0.00 0.00 0.00 0.04 0.066 18.700 8.23 3.47 0.22 0.06 0.00 3.61 3.61 0.04 0.06 0.62 0.00 0.00 0.00 0.00 0.04 0.067 18.600 8.23 3.47 0.22 0.06 0.00 3.61 3.61 0.04 0.06 0.62 0.00 0.00 0.00 0.00 0.04 0.068 18.500 8.23 3.47 0.22 0.06 0.00 3.61 3.61 0.04 0.06 0.62 0.00 0.00 0.00 0.00 0.04 0.069 18.400 8.23 3.47 0.22 0.06 0.00 3.61 3.61 0.04 0.06 0.62 0.00 0.00 0.00 0.00 0.04 0.0610 18.300 8.23 3.48 0.22 0.06 0.00 3.61 3.61 0.04 0.06 0.62 0.00 0.00 0.00 0.00 0.04 0.0611 18.200 8.23 4.32 0.20 0.06 0.00 3.96 3.96 0.11 0.06 0.61 0.00 0.00 0.00 0.00 0.03 0.0612 18.100 8.23 4.33 0.20 0.06 0.00 3.96 3.96 0.11 0.06 0.60 0.00 0.00 0.00 0.00 0.03 0.0613 18.000 8.23 4.34 0.20 0.06 0.00 3.96 3.96 0.11 0.06 0.60 0.00 0.00 0.00 0.00 0.03 0.0614 17.900 8.23 4.34 0.20 0.06 0.00 3.96 3.96 0.11 0.06 0.60 0.00 0.00 0.00 0.00 0.03 0.0615 17.800 8.23 4.35 0.20 0.06 0.00 3.96 3.96 0.11 0.06 0.60 0.00 0.00 0.00 0.00 0.03 0.0616 17.700 8.23 4.35 0.20 0.06 0.00 3.96 3.96 0.11 0.06 0.60 0.00 0.00 0.00 0.00 0.03 0.0617 17.600 8.23 4.36 0.20 0.06 0.00 3.96 3.96 0.11 0.06 0.60 0.00 0.00 0.00 0.00 0.03 0.0618 17.500 8.23 4.37 0.20 0.06 0.00 3.96 3.96 0.11 0.06 0.60 0.00 0.00 0.00 0.00 0.03 0.0619 17.400 8.23 4.37 0.20 0.06 0.00 3.96 3.96 0.11 0.06 0.60 0.00 0.00 0.00 0.00 0.03 0.0620 17.300 8.23 4.38 0.20 0.06 0.00 3.96 3.96 0.11 0.06 0.60 0.00 0.00 0.00 0.00 0.03 0.0621 17.200 8.23 4.38 0.20 0.06 0.00 3.96 3.96 0.11 0.06 0.60 0.00 0.00 0.00 0.00 0.03 0.0622 17.100 8.23 4.39 0.20 0.06 0.00 3.96 3.96 0.11 0.06 0.60 0.00 0.00 0.00 0.00 0.03 0.0623 17.000 8.23 4.40 0.20 0.06 0.00 3.96 3.96 0.11 0.06 0.61 0.00 0.00 0.00 0.00 0.03 0.0624 16.900 8.23 4.40 0.20 0.06 0.00 3.96 3.96 0.11 0.06 0.61 0.00 0.00 0.00 0.00 0.03 0.0625 16.800 8.23 4.41 0.20 0.06 0.00 3.96 3.96 0.11 0.06 0.61 0.00 0.00 0.00 0.00 0.03 0.0626 16.700 8.23 4.42 0.20 0.06 0.00 3.96 3.96 0.11 0.06 0.61 0.00 0.00 0.00 0.00 0.03 0.0627 16.600 8.23 4.42 0.20 0.06 0.00 3.96 3.96 0.11 0.06 0.61 0.00 0.00 0.00 0.00 0.03 0.0628 16.500 8.23 4.43 0.20 0.06 0.00 3.96 3.96 0.11 0.06 0.61 0.00 0.00 0.00 0.00 0.03 0.0629 16.400 8.23 4.43 0.20 0.06 0.00 3.96 3.96 0.11 0.06 0.61 0.00 0.00 0.00 0.00 0.03 0.0630 16.300 8.23 4.44 0.20 0.06 0.00 3.96 3.96 0.11 0.06 0.61 0.00 0.00 0.00 0.00 0.03 0.0631 16.200 8.23 4.45 0.20 0.06 0.00 3.96 3.96 0.11 0.06 0.61 0.00 0.00 0.00 0.00 0.03 0.0632 16.100 8.23 5.80 0.18 0.06 0.00 4.37 4.37 0.17 0.06 0.60 0.00 0.00 0.00 0.00 0.03 0.0633 16.000 8.23 5.81 0.18 0.06 0.00 4.37 4.37 0.17 0.06 0.59 0.00 0.00 0.00 0.00 0.03 0.0634 15.900 8.23 5.82 0.18 0.06 0.00 4.37 4.37 0.17 0.06 0.59 0.00 0.00 0.00 0.00 0.03 0.0635 15.800 8.23 5.82 0.18 0.06 0.00 4.37 4.37 0.17 0.06 0.59 0.00 0.00 0.00 0.00 0.03 0.0636 15.700 8.23 5.83 0.18 0.06 0.00 4.37 4.37 0.17 0.06 0.59 0.00 0.00 0.00 0.00 0.03 0.0637 15.600 8.23 5.84 0.18 0.06 0.00 4.37 4.37 0.17 0.06 0.59 0.00 0.00 0.00 0.00 0.03 0.0638 15.500 8.23 5.85 0.18 0.06 0.00 4.37 4.37 0.17 0.06 0.59 0.00 0.00 0.00 0.00 0.03 0.0639 15.400 8.23 5.85 0.18 0.06 0.00 4.37 4.37 0.17 0.06 0.59 0.00 0.00 0.00 0.00 0.03 0.0640 15.300 8.23 5.86 0.18 0.06 0.00 4.37 4.37 0.17 0.06 0.59 0.00 0.00 0.00 0.00 0.03 0.0641 15.200 8.23 5.87 0.18 0.06 0.00 4.37 4.37 0.17 0.06 0.59 0.00 0.00 0.00 0.00 0.03 0.0642 15.100 8.23 5.88 0.18 0.06 0.00 4.37 4.37 0.17 0.06 0.59 0.00 0.00 0.00 0.00 0.03 0.0643 15.000 8.23 5.88 0.18 0.06 0.00 4.37 4.37 0.17 0.06 0.59 0.00 0.00 0.00 0.00 0.03 0.0644 14.900 8.23 5.89 0.18 0.06 0.00 4.37 4.37 0.17 0.06 0.59 0.00 0.00 0.00 0.00 0.03 0.0645 14.800 8.23 5.90 0.18 0.06 0.00 4.37 4.37 0.17 0.06 0.59 0.00 0.00 0.00 0.00 0.03 0.0646 14.700 8.23 5.91 0.18 0.06 0.00 4.37 4.37 0.17 0.06 0.60 0.00 0.00 0.00 0.00 0.03 0.0647 14.600 8.23 5.91 0.18 0.06 0.00 4.37 4.37 0.17 0.06 0.60 0.00 0.00 0.00 0.00 0.03 0.0648 14.500 8.23 5.92 0.18 0.06 0.00 4.37 4.37 0.17 0.06 0.60 0.00 0.00 0.00 0.00 0.03 0.0649 14.400 8.23 5.93 0.18 0.06 0.00 4.37 4.37 0.17 0.06 0.60 0.00 0.00 0.00 0.00 0.03 0.06

Upper Calcasieu River – Subsegment 030101 Water Quality Calibration for Dissolved Oxygen based on July 2001 Survey Orginated: January 10, 2002
Page 13
50 14.300 8.23 5.94 0.18 0.06 0.00 4.37 4.37 0.17 0.06 0.60 0.00 0.00 0.00 0.00 0.03 0.0651 14.200 8.23 5.94 0.18 0.06 0.00 4.37 4.37 0.17 0.06 0.60 0.00 0.00 0.00 0.00 0.03 0.0652 14.100 8.23 5.95 0.18 0.06 0.00 4.37 4.37 0.17 0.06 0.60 0.00 0.00 0.00 0.00 0.03 0.0653 14.000 8.23 8.59 0.17 0.06 0.00 4.86 4.86 0.24 0.06 0.59 0.00 0.00 0.00 0.00 0.02 0.0654 13.900 8.23 8.60 0.17 0.06 0.00 4.86 4.86 0.24 0.06 0.59 0.00 0.00 0.00 0.00 0.02 0.0655 13.800 8.23 8.61 0.17 0.06 0.00 4.86 4.86 0.24 0.06 0.59 0.00 0.00 0.00 0.00 0.02 0.0656 13.700 8.23 8.62 0.17 0.06 0.00 4.86 4.86 0.24 0.06 0.59 0.00 0.00 0.00 0.00 0.02 0.0657 13.600 8.23 8.63 0.17 0.06 0.00 4.86 4.86 0.24 0.06 0.59 0.00 0.00 0.00 0.00 0.02 0.0658 13.500 8.23 8.64 0.17 0.06 0.00 4.86 4.86 0.24 0.06 0.59 0.00 0.00 0.00 0.00 0.02 0.0659 13.400 8.23 8.64 0.17 0.06 0.00 4.86 4.86 0.24 0.06 0.59 0.00 0.00 0.00 0.00 0.02 0.0660 13.300 8.23 8.65 0.17 0.06 0.00 4.86 4.86 0.24 0.06 0.59 0.00 0.00 0.00 0.00 0.02 0.0661 13.200 8.23 8.66 0.17 0.06 0.00 4.86 4.86 0.24 0.06 0.59 0.00 0.00 0.00 0.00 0.02 0.0662 13.100 8.23 8.67 0.17 0.06 0.00 4.86 4.86 0.24 0.06 0.59 0.00 0.00 0.00 0.00 0.02 0.0663 13.000 8.23 8.68 0.17 0.06 0.00 4.86 4.86 0.24 0.06 0.59 0.00 0.00 0.00 0.00 0.02 0.0664 12.900 8.23 8.69 0.17 0.06 0.00 4.86 4.86 0.24 0.06 0.59 0.00 0.00 0.00 0.00 0.02 0.0665 12.800 8.23 8.70 0.17 0.06 0.00 4.86 4.86 0.24 0.06 0.59 0.00 0.00 0.00 0.00 0.02 0.0666 12.700 8.23 8.70 0.17 0.06 0.00 4.86 4.86 0.24 0.06 0.59 0.00 0.00 0.00 0.00 0.02 0.0667 12.600 8.23 8.71 0.17 0.06 0.00 4.86 4.86 0.24 0.06 0.59 0.00 0.00 0.00 0.00 0.02 0.0668 12.500 8.23 8.72 0.17 0.06 0.00 4.86 4.86 0.24 0.06 0.59 0.00 0.00 0.00 0.00 0.02 0.0669 12.400 8.23 8.73 0.17 0.06 0.00 4.86 4.86 0.24 0.06 0.59 0.00 0.00 0.00 0.00 0.02 0.0670 12.300 8.23 8.74 0.17 0.06 0.00 4.86 4.86 0.24 0.06 0.59 0.00 0.00 0.00 0.00 0.02 0.0671 12.200 8.23 8.75 0.17 0.06 0.00 4.86 4.86 0.24 0.06 0.59 0.00 0.00 0.00 0.00 0.02 0.0672 12.100 8.23 8.76 0.17 0.06 0.00 4.86 4.86 0.24 0.06 0.60 0.00 0.00 0.00 0.00 0.02 0.0673 12.000 8.23 8.77 0.17 0.06 0.00 4.86 4.86 0.24 0.06 0.60 0.00 0.00 0.00 0.00 0.02 0.0674 11.900 8.23 15.01 0.15 0.06 0.00 5.69 5.69 0.30 0.06 0.59 0.00 0.00 0.00 0.00 0.02 0.0675 11.800 8.23 15.02 0.15 0.06 0.00 5.69 5.69 0.30 0.06 0.58 0.00 0.00 0.00 0.00 0.02 0.0676 11.700 8.23 15.02 0.15 0.06 0.00 5.69 5.69 0.30 0.06 0.58 0.00 0.00 0.00 0.00 0.02 0.0677 11.600 8.23 15.03 0.15 0.06 0.00 5.69 5.69 0.30 0.06 0.58 0.00 0.00 0.00 0.00 0.02 0.0678 11.500 8.23 15.04 0.15 0.06 0.00 5.69 5.69 0.30 0.06 0.58 0.00 0.00 0.00 0.00 0.02 0.0679 11.400 8.23 15.04 0.15 0.06 0.00 5.69 5.69 0.30 0.06 0.58 0.00 0.00 0.00 0.00 0.02 0.0680 11.300 8.23 15.05 0.15 0.06 0.00 5.69 5.69 0.30 0.06 0.58 0.00 0.00 0.00 0.00 0.02 0.0681 11.200 8.23 15.05 0.15 0.06 0.00 5.69 5.69 0.30 0.06 0.58 0.00 0.00 0.00 0.00 0.02 0.0682 11.100 8.23 15.06 0.15 0.06 0.00 5.69 5.69 0.30 0.06 0.58 0.00 0.00 0.00 0.00 0.02 0.0683 11.000 8.23 15.06 0.15 0.06 0.00 5.69 5.69 0.30 0.06 0.59 0.00 0.00 0.00 0.00 0.02 0.0684 10.900 8.23 15.07 0.15 0.06 0.00 5.69 5.69 0.30 0.06 0.59 0.00 0.00 0.00 0.00 0.02 0.0685 10.800 8.23 15.07 0.15 0.06 0.00 5.69 5.69 0.30 0.06 0.59 0.00 0.00 0.00 0.00 0.02 0.0686 10.700 8.23 15.08 0.15 0.06 0.00 5.69 5.69 0.30 0.06 0.59 0.00 0.00 0.00 0.00 0.02 0.0687 10.600 8.23 15.09 0.15 0.06 0.00 5.69 5.69 0.30 0.06 0.59 0.00 0.00 0.00 0.00 0.02 0.0688 10.500 8.23 15.09 0.15 0.06 0.00 5.69 5.69 0.30 0.06 0.59 0.00 0.00 0.00 0.00 0.02 0.0689 10.400 8.23 15.10 0.15 0.06 0.00 5.69 5.69 0.30 0.06 0.59 0.00 0.00 0.00 0.00 0.02 0.0690 10.300 8.23 15.10 0.15 0.06 0.00 5.69 5.69 0.30 0.06 0.59 0.00 0.00 0.00 0.00 0.02 0.0691 10.200 8.23 15.11 0.15 0.06 0.00 5.69 5.69 0.30 0.06 0.59 0.00 0.00 0.00 0.00 0.02 0.0692 10.100 8.23 15.12 0.15 0.06 0.00 5.69 5.69 0.30 0.06 0.59 0.00 0.00 0.00 0.00 0.02 0.0693 10.000 8.23 15.12 0.15 0.06 0.00 5.69 5.69 0.30 0.06 0.59 0.00 0.00 0.00 0.00 0.02 0.0694 9.900 8.23 15.13 0.15 0.06 0.00 5.69 5.69 0.30 0.06 0.59 0.00 0.00 0.00 0.00 0.02 0.0695 9.800 8.23 12.32 0.15 0.06 0.00 6.04 6.04 0.25 0.06 0.57 0.00 0.00 0.00 0.00 0.02 0.0696 9.700 8.23 12.32 0.15 0.06 0.00 6.04 6.04 0.25 0.06 0.55 0.00 0.00 0.00 0.00 0.02 0.0697 9.600 8.23 12.32 0.15 0.06 0.00 6.04 6.04 0.25 0.06 0.54 0.00 0.00 0.00 0.00 0.02 0.0698 9.500 8.23 12.32 0.15 0.06 0.00 6.04 6.04 0.25 0.06 0.54 0.00 0.00 0.00 0.00 0.02 0.0699 9.400 8.23 12.33 0.15 0.06 0.00 6.04 6.04 0.25 0.06 0.54 0.00 0.00 0.00 0.00 0.02 0.06100 9.300 8.23 12.33 0.15 0.06 0.00 6.04 6.04 0.25 0.06 0.54 0.00 0.00 0.00 0.00 0.02 0.06101 9.200 8.23 12.33 0.15 0.06 0.00 6.04 6.04 0.25 0.06 0.54 0.00 0.00 0.00 0.00 0.02 0.06102 9.100 8.23 12.33 0.15 0.06 0.00 6.04 6.04 0.25 0.06 0.54 0.00 0.00 0.00 0.00 0.02 0.06103 9.000 8.23 12.33 0.15 0.06 0.00 6.04 6.04 0.25 0.06 0.54 0.00 0.00 0.00 0.00 0.02 0.06
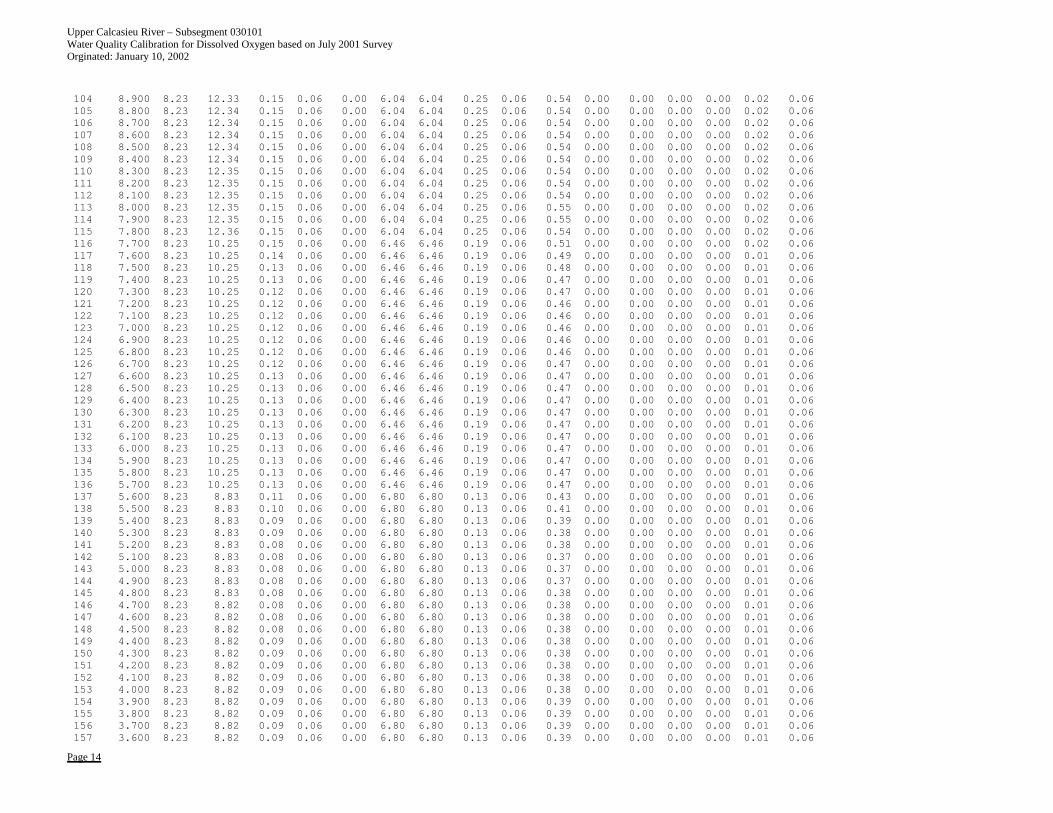
Upper Calcasieu River – Subsegment 030101 Water Quality Calibration for Dissolved Oxygen based on July 2001 Survey Orginated: January 10, 2002
Page 14
104 8.900 8.23 12.33 0.15 0.06 0.00 6.04 6.04 0.25 0.06 0.54 0.00 0.00 0.00 0.00 0.02 0.06105 8.800 8.23 12.34 0.15 0.06 0.00 6.04 6.04 0.25 0.06 0.54 0.00 0.00 0.00 0.00 0.02 0.06106 8.700 8.23 12.34 0.15 0.06 0.00 6.04 6.04 0.25 0.06 0.54 0.00 0.00 0.00 0.00 0.02 0.06107 8.600 8.23 12.34 0.15 0.06 0.00 6.04 6.04 0.25 0.06 0.54 0.00 0.00 0.00 0.00 0.02 0.06108 8.500 8.23 12.34 0.15 0.06 0.00 6.04 6.04 0.25 0.06 0.54 0.00 0.00 0.00 0.00 0.02 0.06109 8.400 8.23 12.34 0.15 0.06 0.00 6.04 6.04 0.25 0.06 0.54 0.00 0.00 0.00 0.00 0.02 0.06110 8.300 8.23 12.35 0.15 0.06 0.00 6.04 6.04 0.25 0.06 0.54 0.00 0.00 0.00 0.00 0.02 0.06111 8.200 8.23 12.35 0.15 0.06 0.00 6.04 6.04 0.25 0.06 0.54 0.00 0.00 0.00 0.00 0.02 0.06112 8.100 8.23 12.35 0.15 0.06 0.00 6.04 6.04 0.25 0.06 0.54 0.00 0.00 0.00 0.00 0.02 0.06113 8.000 8.23 12.35 0.15 0.06 0.00 6.04 6.04 0.25 0.06 0.55 0.00 0.00 0.00 0.00 0.02 0.06114 7.900 8.23 12.35 0.15 0.06 0.00 6.04 6.04 0.25 0.06 0.55 0.00 0.00 0.00 0.00 0.02 0.06115 7.800 8.23 12.36 0.15 0.06 0.00 6.04 6.04 0.25 0.06 0.54 0.00 0.00 0.00 0.00 0.02 0.06116 7.700 8.23 10.25 0.15 0.06 0.00 6.46 6.46 0.19 0.06 0.51 0.00 0.00 0.00 0.00 0.02 0.06117 7.600 8.23 10.25 0.14 0.06 0.00 6.46 6.46 0.19 0.06 0.49 0.00 0.00 0.00 0.00 0.01 0.06118 7.500 8.23 10.25 0.13 0.06 0.00 6.46 6.46 0.19 0.06 0.48 0.00 0.00 0.00 0.00 0.01 0.06119 7.400 8.23 10.25 0.13 0.06 0.00 6.46 6.46 0.19 0.06 0.47 0.00 0.00 0.00 0.00 0.01 0.06120 7.300 8.23 10.25 0.12 0.06 0.00 6.46 6.46 0.19 0.06 0.47 0.00 0.00 0.00 0.00 0.01 0.06121 7.200 8.23 10.25 0.12 0.06 0.00 6.46 6.46 0.19 0.06 0.46 0.00 0.00 0.00 0.00 0.01 0.06122 7.100 8.23 10.25 0.12 0.06 0.00 6.46 6.46 0.19 0.06 0.46 0.00 0.00 0.00 0.00 0.01 0.06123 7.000 8.23 10.25 0.12 0.06 0.00 6.46 6.46 0.19 0.06 0.46 0.00 0.00 0.00 0.00 0.01 0.06124 6.900 8.23 10.25 0.12 0.06 0.00 6.46 6.46 0.19 0.06 0.46 0.00 0.00 0.00 0.00 0.01 0.06125 6.800 8.23 10.25 0.12 0.06 0.00 6.46 6.46 0.19 0.06 0.46 0.00 0.00 0.00 0.00 0.01 0.06126 6.700 8.23 10.25 0.12 0.06 0.00 6.46 6.46 0.19 0.06 0.47 0.00 0.00 0.00 0.00 0.01 0.06127 6.600 8.23 10.25 0.13 0.06 0.00 6.46 6.46 0.19 0.06 0.47 0.00 0.00 0.00 0.00 0.01 0.06128 6.500 8.23 10.25 0.13 0.06 0.00 6.46 6.46 0.19 0.06 0.47 0.00 0.00 0.00 0.00 0.01 0.06129 6.400 8.23 10.25 0.13 0.06 0.00 6.46 6.46 0.19 0.06 0.47 0.00 0.00 0.00 0.00 0.01 0.06130 6.300 8.23 10.25 0.13 0.06 0.00 6.46 6.46 0.19 0.06 0.47 0.00 0.00 0.00 0.00 0.01 0.06131 6.200 8.23 10.25 0.13 0.06 0.00 6.46 6.46 0.19 0.06 0.47 0.00 0.00 0.00 0.00 0.01 0.06132 6.100 8.23 10.25 0.13 0.06 0.00 6.46 6.46 0.19 0.06 0.47 0.00 0.00 0.00 0.00 0.01 0.06133 6.000 8.23 10.25 0.13 0.06 0.00 6.46 6.46 0.19 0.06 0.47 0.00 0.00 0.00 0.00 0.01 0.06134 5.900 8.23 10.25 0.13 0.06 0.00 6.46 6.46 0.19 0.06 0.47 0.00 0.00 0.00 0.00 0.01 0.06135 5.800 8.23 10.25 0.13 0.06 0.00 6.46 6.46 0.19 0.06 0.47 0.00 0.00 0.00 0.00 0.01 0.06136 5.700 8.23 10.25 0.13 0.06 0.00 6.46 6.46 0.19 0.06 0.47 0.00 0.00 0.00 0.00 0.01 0.06137 5.600 8.23 8.83 0.11 0.06 0.00 6.80 6.80 0.13 0.06 0.43 0.00 0.00 0.00 0.00 0.01 0.06138 5.500 8.23 8.83 0.10 0.06 0.00 6.80 6.80 0.13 0.06 0.41 0.00 0.00 0.00 0.00 0.01 0.06139 5.400 8.23 8.83 0.09 0.06 0.00 6.80 6.80 0.13 0.06 0.39 0.00 0.00 0.00 0.00 0.01 0.06140 5.300 8.23 8.83 0.09 0.06 0.00 6.80 6.80 0.13 0.06 0.38 0.00 0.00 0.00 0.00 0.01 0.06141 5.200 8.23 8.83 0.08 0.06 0.00 6.80 6.80 0.13 0.06 0.38 0.00 0.00 0.00 0.00 0.01 0.06142 5.100 8.23 8.83 0.08 0.06 0.00 6.80 6.80 0.13 0.06 0.37 0.00 0.00 0.00 0.00 0.01 0.06143 5.000 8.23 8.83 0.08 0.06 0.00 6.80 6.80 0.13 0.06 0.37 0.00 0.00 0.00 0.00 0.01 0.06144 4.900 8.23 8.83 0.08 0.06 0.00 6.80 6.80 0.13 0.06 0.37 0.00 0.00 0.00 0.00 0.01 0.06145 4.800 8.23 8.83 0.08 0.06 0.00 6.80 6.80 0.13 0.06 0.38 0.00 0.00 0.00 0.00 0.01 0.06146 4.700 8.23 8.82 0.08 0.06 0.00 6.80 6.80 0.13 0.06 0.38 0.00 0.00 0.00 0.00 0.01 0.06147 4.600 8.23 8.82 0.08 0.06 0.00 6.80 6.80 0.13 0.06 0.38 0.00 0.00 0.00 0.00 0.01 0.06148 4.500 8.23 8.82 0.08 0.06 0.00 6.80 6.80 0.13 0.06 0.38 0.00 0.00 0.00 0.00 0.01 0.06149 4.400 8.23 8.82 0.09 0.06 0.00 6.80 6.80 0.13 0.06 0.38 0.00 0.00 0.00 0.00 0.01 0.06150 4.300 8.23 8.82 0.09 0.06 0.00 6.80 6.80 0.13 0.06 0.38 0.00 0.00 0.00 0.00 0.01 0.06151 4.200 8.23 8.82 0.09 0.06 0.00 6.80 6.80 0.13 0.06 0.38 0.00 0.00 0.00 0.00 0.01 0.06152 4.100 8.23 8.82 0.09 0.06 0.00 6.80 6.80 0.13 0.06 0.38 0.00 0.00 0.00 0.00 0.01 0.06153 4.000 8.23 8.82 0.09 0.06 0.00 6.80 6.80 0.13 0.06 0.38 0.00 0.00 0.00 0.00 0.01 0.06154 3.900 8.23 8.82 0.09 0.06 0.00 6.80 6.80 0.13 0.06 0.39 0.00 0.00 0.00 0.00 0.01 0.06155 3.800 8.23 8.82 0.09 0.06 0.00 6.80 6.80 0.13 0.06 0.39 0.00 0.00 0.00 0.00 0.01 0.06156 3.700 8.23 8.82 0.09 0.06 0.00 6.80 6.80 0.13 0.06 0.39 0.00 0.00 0.00 0.00 0.01 0.06157 3.600 8.23 8.82 0.09 0.06 0.00 6.80 6.80 0.13 0.06 0.39 0.00 0.00 0.00 0.00 0.01 0.06
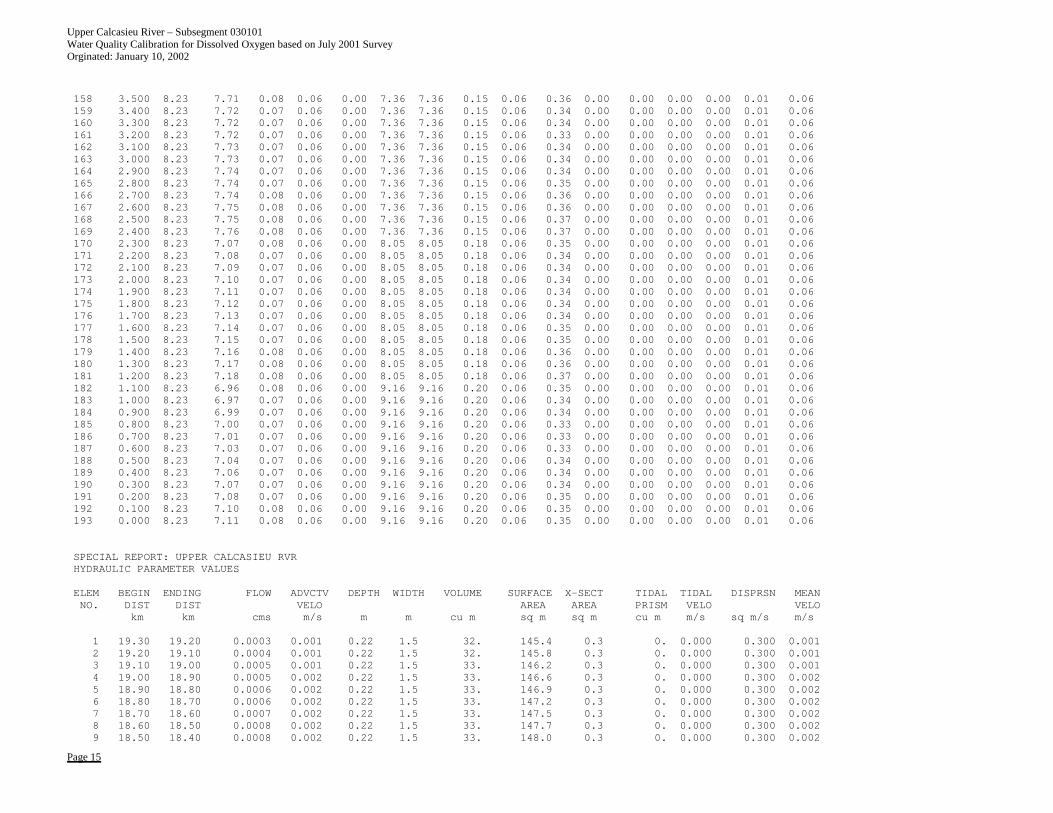
Upper Calcasieu River – Subsegment 030101 Water Quality Calibration for Dissolved Oxygen based on July 2001 Survey Orginated: January 10, 2002
Page 15
158 3.500 8.23 7.71 0.08 0.06 0.00 7.36 7.36 0.15 0.06 0.36 0.00 0.00 0.00 0.00 0.01 0.06159 3.400 8.23 7.72 0.07 0.06 0.00 7.36 7.36 0.15 0.06 0.34 0.00 0.00 0.00 0.00 0.01 0.06160 3.300 8.23 7.72 0.07 0.06 0.00 7.36 7.36 0.15 0.06 0.34 0.00 0.00 0.00 0.00 0.01 0.06161 3.200 8.23 7.72 0.07 0.06 0.00 7.36 7.36 0.15 0.06 0.33 0.00 0.00 0.00 0.00 0.01 0.06162 3.100 8.23 7.73 0.07 0.06 0.00 7.36 7.36 0.15 0.06 0.34 0.00 0.00 0.00 0.00 0.01 0.06163 3.000 8.23 7.73 0.07 0.06 0.00 7.36 7.36 0.15 0.06 0.34 0.00 0.00 0.00 0.00 0.01 0.06164 2.900 8.23 7.74 0.07 0.06 0.00 7.36 7.36 0.15 0.06 0.34 0.00 0.00 0.00 0.00 0.01 0.06165 2.800 8.23 7.74 0.07 0.06 0.00 7.36 7.36 0.15 0.06 0.35 0.00 0.00 0.00 0.00 0.01 0.06166 2.700 8.23 7.74 0.08 0.06 0.00 7.36 7.36 0.15 0.06 0.36 0.00 0.00 0.00 0.00 0.01 0.06167 2.600 8.23 7.75 0.08 0.06 0.00 7.36 7.36 0.15 0.06 0.36 0.00 0.00 0.00 0.00 0.01 0.06168 2.500 8.23 7.75 0.08 0.06 0.00 7.36 7.36 0.15 0.06 0.37 0.00 0.00 0.00 0.00 0.01 0.06169 2.400 8.23 7.76 0.08 0.06 0.00 7.36 7.36 0.15 0.06 0.37 0.00 0.00 0.00 0.00 0.01 0.06170 2.300 8.23 7.07 0.08 0.06 0.00 8.05 8.05 0.18 0.06 0.35 0.00 0.00 0.00 0.00 0.01 0.06171 2.200 8.23 7.08 0.07 0.06 0.00 8.05 8.05 0.18 0.06 0.34 0.00 0.00 0.00 0.00 0.01 0.06172 2.100 8.23 7.09 0.07 0.06 0.00 8.05 8.05 0.18 0.06 0.34 0.00 0.00 0.00 0.00 0.01 0.06173 2.000 8.23 7.10 0.07 0.06 0.00 8.05 8.05 0.18 0.06 0.34 0.00 0.00 0.00 0.00 0.01 0.06174 1.900 8.23 7.11 0.07 0.06 0.00 8.05 8.05 0.18 0.06 0.34 0.00 0.00 0.00 0.00 0.01 0.06175 1.800 8.23 7.12 0.07 0.06 0.00 8.05 8.05 0.18 0.06 0.34 0.00 0.00 0.00 0.00 0.01 0.06176 1.700 8.23 7.13 0.07 0.06 0.00 8.05 8.05 0.18 0.06 0.34 0.00 0.00 0.00 0.00 0.01 0.06177 1.600 8.23 7.14 0.07 0.06 0.00 8.05 8.05 0.18 0.06 0.35 0.00 0.00 0.00 0.00 0.01 0.06178 1.500 8.23 7.15 0.07 0.06 0.00 8.05 8.05 0.18 0.06 0.35 0.00 0.00 0.00 0.00 0.01 0.06179 1.400 8.23 7.16 0.08 0.06 0.00 8.05 8.05 0.18 0.06 0.36 0.00 0.00 0.00 0.00 0.01 0.06180 1.300 8.23 7.17 0.08 0.06 0.00 8.05 8.05 0.18 0.06 0.36 0.00 0.00 0.00 0.00 0.01 0.06181 1.200 8.23 7.18 0.08 0.06 0.00 8.05 8.05 0.18 0.06 0.37 0.00 0.00 0.00 0.00 0.01 0.06182 1.100 8.23 6.96 0.08 0.06 0.00 9.16 9.16 0.20 0.06 0.35 0.00 0.00 0.00 0.00 0.01 0.06183 1.000 8.23 6.97 0.07 0.06 0.00 9.16 9.16 0.20 0.06 0.34 0.00 0.00 0.00 0.00 0.01 0.06184 0.900 8.23 6.99 0.07 0.06 0.00 9.16 9.16 0.20 0.06 0.34 0.00 0.00 0.00 0.00 0.01 0.06185 0.800 8.23 7.00 0.07 0.06 0.00 9.16 9.16 0.20 0.06 0.33 0.00 0.00 0.00 0.00 0.01 0.06186 0.700 8.23 7.01 0.07 0.06 0.00 9.16 9.16 0.20 0.06 0.33 0.00 0.00 0.00 0.00 0.01 0.06187 0.600 8.23 7.03 0.07 0.06 0.00 9.16 9.16 0.20 0.06 0.33 0.00 0.00 0.00 0.00 0.01 0.06188 0.500 8.23 7.04 0.07 0.06 0.00 9.16 9.16 0.20 0.06 0.34 0.00 0.00 0.00 0.00 0.01 0.06189 0.400 8.23 7.06 0.07 0.06 0.00 9.16 9.16 0.20 0.06 0.34 0.00 0.00 0.00 0.00 0.01 0.06190 0.300 8.23 7.07 0.07 0.06 0.00 9.16 9.16 0.20 0.06 0.34 0.00 0.00 0.00 0.00 0.01 0.06191 0.200 8.23 7.08 0.07 0.06 0.00 9.16 9.16 0.20 0.06 0.35 0.00 0.00 0.00 0.00 0.01 0.06192 0.100 8.23 7.10 0.08 0.06 0.00 9.16 9.16 0.20 0.06 0.35 0.00 0.00 0.00 0.00 0.01 0.06193 0.000 8.23 7.11 0.08 0.06 0.00 9.16 9.16 0.20 0.06 0.35 0.00 0.00 0.00 0.00 0.01 0.06
SPECIAL REPORT: UPPER CALCASIEU RVRHYDRAULIC PARAMETER VALUES
ELEM BEGIN ENDING FLOW ADVCTV DEPTH WIDTH VOLUME SURFACE X-SECT TIDAL TIDAL DISPRSN MEANNO. DIST DIST VELO AREA AREA PRISM VELO VELO
km km cms m/s m m cu m sq m sq m cu m m/s sq m/s m/s
1 19.30 19.20 0.0003 0.001 0.22 1.5 32. 145.4 0.3 0. 0.000 0.300 0.0012 19.20 19.10 0.0004 0.001 0.22 1.5 32. 145.8 0.3 0. 0.000 0.300 0.0013 19.10 19.00 0.0005 0.001 0.22 1.5 33. 146.2 0.3 0. 0.000 0.300 0.0014 19.00 18.90 0.0005 0.002 0.22 1.5 33. 146.6 0.3 0. 0.000 0.300 0.0025 18.90 18.80 0.0006 0.002 0.22 1.5 33. 146.9 0.3 0. 0.000 0.300 0.0026 18.80 18.70 0.0006 0.002 0.22 1.5 33. 147.2 0.3 0. 0.000 0.300 0.0027 18.70 18.60 0.0007 0.002 0.22 1.5 33. 147.5 0.3 0. 0.000 0.300 0.0028 18.60 18.50 0.0008 0.002 0.22 1.5 33. 147.7 0.3 0. 0.000 0.300 0.0029 18.50 18.40 0.0008 0.002 0.22 1.5 33. 148.0 0.3 0. 0.000 0.300 0.002
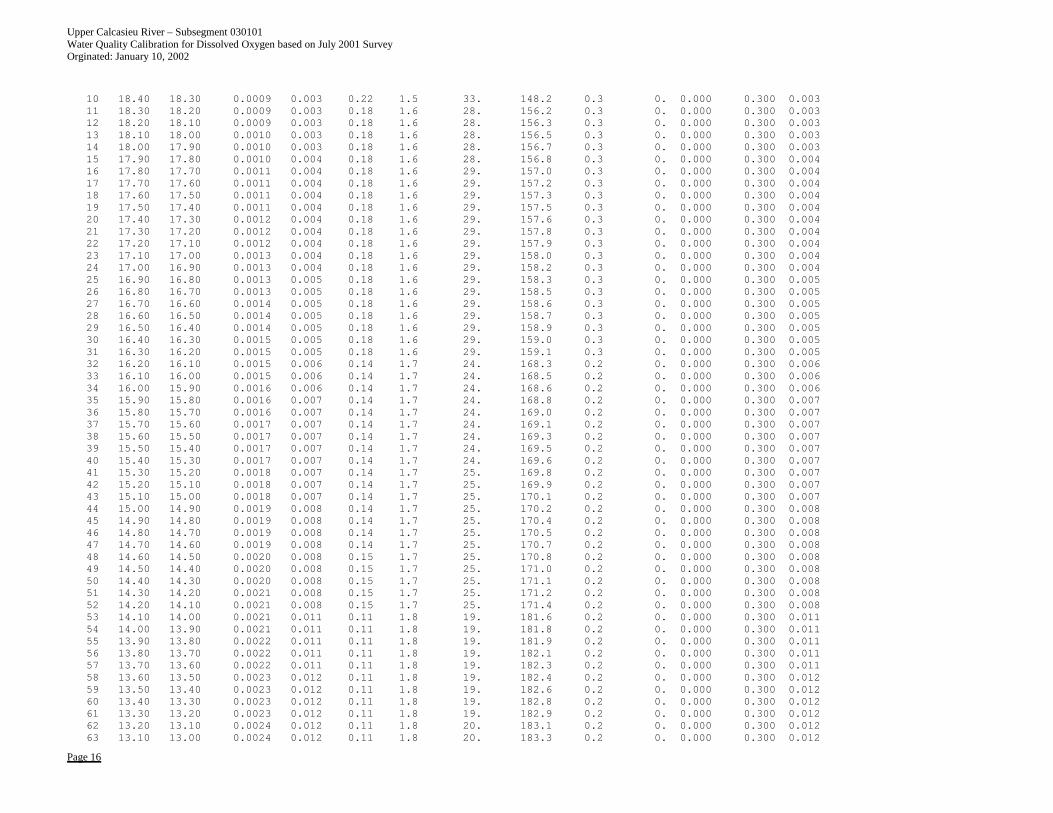
Upper Calcasieu River – Subsegment 030101 Water Quality Calibration for Dissolved Oxygen based on July 2001 Survey Orginated: January 10, 2002
Page 16
10 18.40 18.30 0.0009 0.003 0.22 1.5 33. 148.2 0.3 0. 0.000 0.300 0.00311 18.30 18.20 0.0009 0.003 0.18 1.6 28. 156.2 0.3 0. 0.000 0.300 0.00312 18.20 18.10 0.0009 0.003 0.18 1.6 28. 156.3 0.3 0. 0.000 0.300 0.00313 18.10 18.00 0.0010 0.003 0.18 1.6 28. 156.5 0.3 0. 0.000 0.300 0.00314 18.00 17.90 0.0010 0.003 0.18 1.6 28. 156.7 0.3 0. 0.000 0.300 0.00315 17.90 17.80 0.0010 0.004 0.18 1.6 28. 156.8 0.3 0. 0.000 0.300 0.00416 17.80 17.70 0.0011 0.004 0.18 1.6 29. 157.0 0.3 0. 0.000 0.300 0.00417 17.70 17.60 0.0011 0.004 0.18 1.6 29. 157.2 0.3 0. 0.000 0.300 0.00418 17.60 17.50 0.0011 0.004 0.18 1.6 29. 157.3 0.3 0. 0.000 0.300 0.00419 17.50 17.40 0.0011 0.004 0.18 1.6 29. 157.5 0.3 0. 0.000 0.300 0.00420 17.40 17.30 0.0012 0.004 0.18 1.6 29. 157.6 0.3 0. 0.000 0.300 0.00421 17.30 17.20 0.0012 0.004 0.18 1.6 29. 157.8 0.3 0. 0.000 0.300 0.00422 17.20 17.10 0.0012 0.004 0.18 1.6 29. 157.9 0.3 0. 0.000 0.300 0.00423 17.10 17.00 0.0013 0.004 0.18 1.6 29. 158.0 0.3 0. 0.000 0.300 0.00424 17.00 16.90 0.0013 0.004 0.18 1.6 29. 158.2 0.3 0. 0.000 0.300 0.00425 16.90 16.80 0.0013 0.005 0.18 1.6 29. 158.3 0.3 0. 0.000 0.300 0.00526 16.80 16.70 0.0013 0.005 0.18 1.6 29. 158.5 0.3 0. 0.000 0.300 0.00527 16.70 16.60 0.0014 0.005 0.18 1.6 29. 158.6 0.3 0. 0.000 0.300 0.00528 16.60 16.50 0.0014 0.005 0.18 1.6 29. 158.7 0.3 0. 0.000 0.300 0.00529 16.50 16.40 0.0014 0.005 0.18 1.6 29. 158.9 0.3 0. 0.000 0.300 0.00530 16.40 16.30 0.0015 0.005 0.18 1.6 29. 159.0 0.3 0. 0.000 0.300 0.00531 16.30 16.20 0.0015 0.005 0.18 1.6 29. 159.1 0.3 0. 0.000 0.300 0.00532 16.20 16.10 0.0015 0.006 0.14 1.7 24. 168.3 0.2 0. 0.000 0.300 0.00633 16.10 16.00 0.0015 0.006 0.14 1.7 24. 168.5 0.2 0. 0.000 0.300 0.00634 16.00 15.90 0.0016 0.006 0.14 1.7 24. 168.6 0.2 0. 0.000 0.300 0.00635 15.90 15.80 0.0016 0.007 0.14 1.7 24. 168.8 0.2 0. 0.000 0.300 0.00736 15.80 15.70 0.0016 0.007 0.14 1.7 24. 169.0 0.2 0. 0.000 0.300 0.00737 15.70 15.60 0.0017 0.007 0.14 1.7 24. 169.1 0.2 0. 0.000 0.300 0.00738 15.60 15.50 0.0017 0.007 0.14 1.7 24. 169.3 0.2 0. 0.000 0.300 0.00739 15.50 15.40 0.0017 0.007 0.14 1.7 24. 169.5 0.2 0. 0.000 0.300 0.00740 15.40 15.30 0.0017 0.007 0.14 1.7 24. 169.6 0.2 0. 0.000 0.300 0.00741 15.30 15.20 0.0018 0.007 0.14 1.7 25. 169.8 0.2 0. 0.000 0.300 0.00742 15.20 15.10 0.0018 0.007 0.14 1.7 25. 169.9 0.2 0. 0.000 0.300 0.00743 15.10 15.00 0.0018 0.007 0.14 1.7 25. 170.1 0.2 0. 0.000 0.300 0.00744 15.00 14.90 0.0019 0.008 0.14 1.7 25. 170.2 0.2 0. 0.000 0.300 0.00845 14.90 14.80 0.0019 0.008 0.14 1.7 25. 170.4 0.2 0. 0.000 0.300 0.00846 14.80 14.70 0.0019 0.008 0.14 1.7 25. 170.5 0.2 0. 0.000 0.300 0.00847 14.70 14.60 0.0019 0.008 0.14 1.7 25. 170.7 0.2 0. 0.000 0.300 0.00848 14.60 14.50 0.0020 0.008 0.15 1.7 25. 170.8 0.2 0. 0.000 0.300 0.00849 14.50 14.40 0.0020 0.008 0.15 1.7 25. 171.0 0.2 0. 0.000 0.300 0.00850 14.40 14.30 0.0020 0.008 0.15 1.7 25. 171.1 0.2 0. 0.000 0.300 0.00851 14.30 14.20 0.0021 0.008 0.15 1.7 25. 171.2 0.2 0. 0.000 0.300 0.00852 14.20 14.10 0.0021 0.008 0.15 1.7 25. 171.4 0.2 0. 0.000 0.300 0.00853 14.10 14.00 0.0021 0.011 0.11 1.8 19. 181.6 0.2 0. 0.000 0.300 0.01154 14.00 13.90 0.0021 0.011 0.11 1.8 19. 181.8 0.2 0. 0.000 0.300 0.01155 13.90 13.80 0.0022 0.011 0.11 1.8 19. 181.9 0.2 0. 0.000 0.300 0.01156 13.80 13.70 0.0022 0.011 0.11 1.8 19. 182.1 0.2 0. 0.000 0.300 0.01157 13.70 13.60 0.0022 0.011 0.11 1.8 19. 182.3 0.2 0. 0.000 0.300 0.01158 13.60 13.50 0.0023 0.012 0.11 1.8 19. 182.4 0.2 0. 0.000 0.300 0.01259 13.50 13.40 0.0023 0.012 0.11 1.8 19. 182.6 0.2 0. 0.000 0.300 0.01260 13.40 13.30 0.0023 0.012 0.11 1.8 19. 182.8 0.2 0. 0.000 0.300 0.01261 13.30 13.20 0.0023 0.012 0.11 1.8 19. 182.9 0.2 0. 0.000 0.300 0.01262 13.20 13.10 0.0024 0.012 0.11 1.8 20. 183.1 0.2 0. 0.000 0.300 0.01263 13.10 13.00 0.0024 0.012 0.11 1.8 20. 183.3 0.2 0. 0.000 0.300 0.012
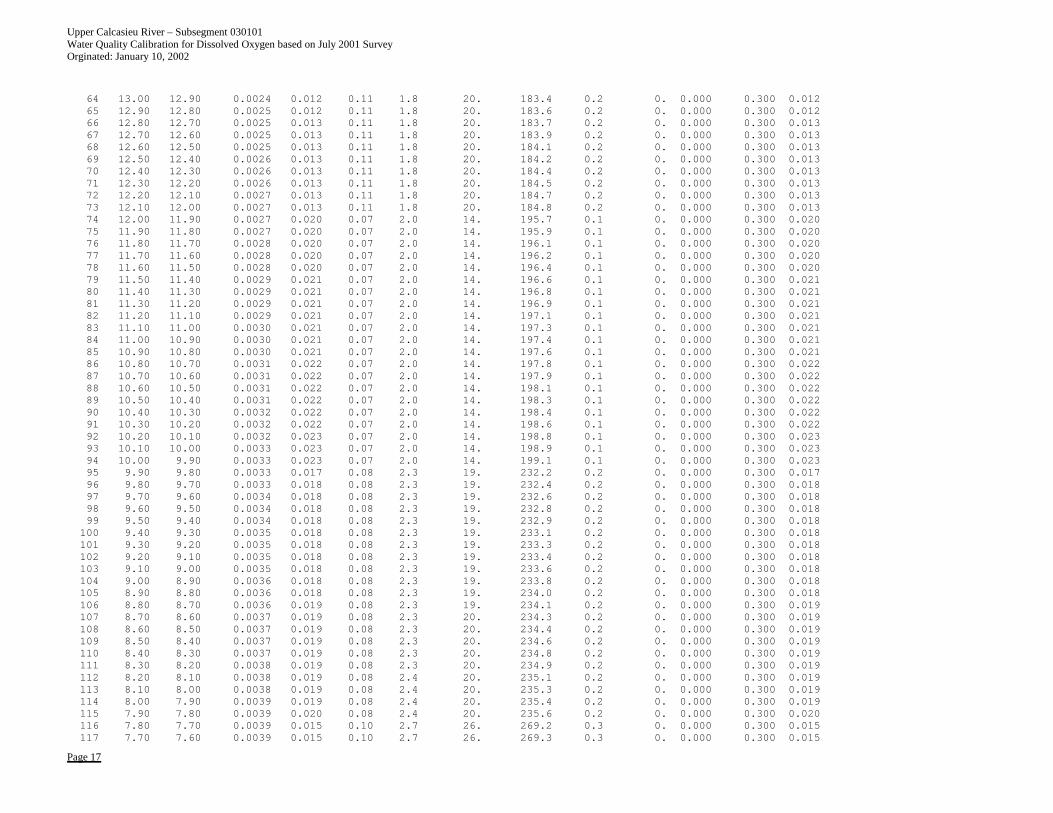
Upper Calcasieu River – Subsegment 030101 Water Quality Calibration for Dissolved Oxygen based on July 2001 Survey Orginated: January 10, 2002
Page 17
64 13.00 12.90 0.0024 0.012 0.11 1.8 20. 183.4 0.2 0. 0.000 0.300 0.01265 12.90 12.80 0.0025 0.012 0.11 1.8 20. 183.6 0.2 0. 0.000 0.300 0.01266 12.80 12.70 0.0025 0.013 0.11 1.8 20. 183.7 0.2 0. 0.000 0.300 0.01367 12.70 12.60 0.0025 0.013 0.11 1.8 20. 183.9 0.2 0. 0.000 0.300 0.01368 12.60 12.50 0.0025 0.013 0.11 1.8 20. 184.1 0.2 0. 0.000 0.300 0.01369 12.50 12.40 0.0026 0.013 0.11 1.8 20. 184.2 0.2 0. 0.000 0.300 0.01370 12.40 12.30 0.0026 0.013 0.11 1.8 20. 184.4 0.2 0. 0.000 0.300 0.01371 12.30 12.20 0.0026 0.013 0.11 1.8 20. 184.5 0.2 0. 0.000 0.300 0.01372 12.20 12.10 0.0027 0.013 0.11 1.8 20. 184.7 0.2 0. 0.000 0.300 0.01373 12.10 12.00 0.0027 0.013 0.11 1.8 20. 184.8 0.2 0. 0.000 0.300 0.01374 12.00 11.90 0.0027 0.020 0.07 2.0 14. 195.7 0.1 0. 0.000 0.300 0.02075 11.90 11.80 0.0027 0.020 0.07 2.0 14. 195.9 0.1 0. 0.000 0.300 0.02076 11.80 11.70 0.0028 0.020 0.07 2.0 14. 196.1 0.1 0. 0.000 0.300 0.02077 11.70 11.60 0.0028 0.020 0.07 2.0 14. 196.2 0.1 0. 0.000 0.300 0.02078 11.60 11.50 0.0028 0.020 0.07 2.0 14. 196.4 0.1 0. 0.000 0.300 0.02079 11.50 11.40 0.0029 0.021 0.07 2.0 14. 196.6 0.1 0. 0.000 0.300 0.02180 11.40 11.30 0.0029 0.021 0.07 2.0 14. 196.8 0.1 0. 0.000 0.300 0.02181 11.30 11.20 0.0029 0.021 0.07 2.0 14. 196.9 0.1 0. 0.000 0.300 0.02182 11.20 11.10 0.0029 0.021 0.07 2.0 14. 197.1 0.1 0. 0.000 0.300 0.02183 11.10 11.00 0.0030 0.021 0.07 2.0 14. 197.3 0.1 0. 0.000 0.300 0.02184 11.00 10.90 0.0030 0.021 0.07 2.0 14. 197.4 0.1 0. 0.000 0.300 0.02185 10.90 10.80 0.0030 0.021 0.07 2.0 14. 197.6 0.1 0. 0.000 0.300 0.02186 10.80 10.70 0.0031 0.022 0.07 2.0 14. 197.8 0.1 0. 0.000 0.300 0.02287 10.70 10.60 0.0031 0.022 0.07 2.0 14. 197.9 0.1 0. 0.000 0.300 0.02288 10.60 10.50 0.0031 0.022 0.07 2.0 14. 198.1 0.1 0. 0.000 0.300 0.02289 10.50 10.40 0.0031 0.022 0.07 2.0 14. 198.3 0.1 0. 0.000 0.300 0.02290 10.40 10.30 0.0032 0.022 0.07 2.0 14. 198.4 0.1 0. 0.000 0.300 0.02291 10.30 10.20 0.0032 0.022 0.07 2.0 14. 198.6 0.1 0. 0.000 0.300 0.02292 10.20 10.10 0.0032 0.023 0.07 2.0 14. 198.8 0.1 0. 0.000 0.300 0.02393 10.10 10.00 0.0033 0.023 0.07 2.0 14. 198.9 0.1 0. 0.000 0.300 0.02394 10.00 9.90 0.0033 0.023 0.07 2.0 14. 199.1 0.1 0. 0.000 0.300 0.02395 9.90 9.80 0.0033 0.017 0.08 2.3 19. 232.2 0.2 0. 0.000 0.300 0.01796 9.80 9.70 0.0033 0.018 0.08 2.3 19. 232.4 0.2 0. 0.000 0.300 0.01897 9.70 9.60 0.0034 0.018 0.08 2.3 19. 232.6 0.2 0. 0.000 0.300 0.01898 9.60 9.50 0.0034 0.018 0.08 2.3 19. 232.8 0.2 0. 0.000 0.300 0.01899 9.50 9.40 0.0034 0.018 0.08 2.3 19. 232.9 0.2 0. 0.000 0.300 0.018100 9.40 9.30 0.0035 0.018 0.08 2.3 19. 233.1 0.2 0. 0.000 0.300 0.018101 9.30 9.20 0.0035 0.018 0.08 2.3 19. 233.3 0.2 0. 0.000 0.300 0.018102 9.20 9.10 0.0035 0.018 0.08 2.3 19. 233.4 0.2 0. 0.000 0.300 0.018103 9.10 9.00 0.0035 0.018 0.08 2.3 19. 233.6 0.2 0. 0.000 0.300 0.018104 9.00 8.90 0.0036 0.018 0.08 2.3 19. 233.8 0.2 0. 0.000 0.300 0.018105 8.90 8.80 0.0036 0.018 0.08 2.3 19. 234.0 0.2 0. 0.000 0.300 0.018106 8.80 8.70 0.0036 0.019 0.08 2.3 19. 234.1 0.2 0. 0.000 0.300 0.019107 8.70 8.60 0.0037 0.019 0.08 2.3 20. 234.3 0.2 0. 0.000 0.300 0.019108 8.60 8.50 0.0037 0.019 0.08 2.3 20. 234.4 0.2 0. 0.000 0.300 0.019109 8.50 8.40 0.0037 0.019 0.08 2.3 20. 234.6 0.2 0. 0.000 0.300 0.019110 8.40 8.30 0.0037 0.019 0.08 2.3 20. 234.8 0.2 0. 0.000 0.300 0.019111 8.30 8.20 0.0038 0.019 0.08 2.3 20. 234.9 0.2 0. 0.000 0.300 0.019112 8.20 8.10 0.0038 0.019 0.08 2.4 20. 235.1 0.2 0. 0.000 0.300 0.019113 8.10 8.00 0.0038 0.019 0.08 2.4 20. 235.3 0.2 0. 0.000 0.300 0.019114 8.00 7.90 0.0039 0.019 0.08 2.4 20. 235.4 0.2 0. 0.000 0.300 0.019115 7.90 7.80 0.0039 0.020 0.08 2.4 20. 235.6 0.2 0. 0.000 0.300 0.020116 7.80 7.70 0.0039 0.015 0.10 2.7 26. 269.2 0.3 0. 0.000 0.300 0.015117 7.70 7.60 0.0039 0.015 0.10 2.7 26. 269.3 0.3 0. 0.000 0.300 0.015
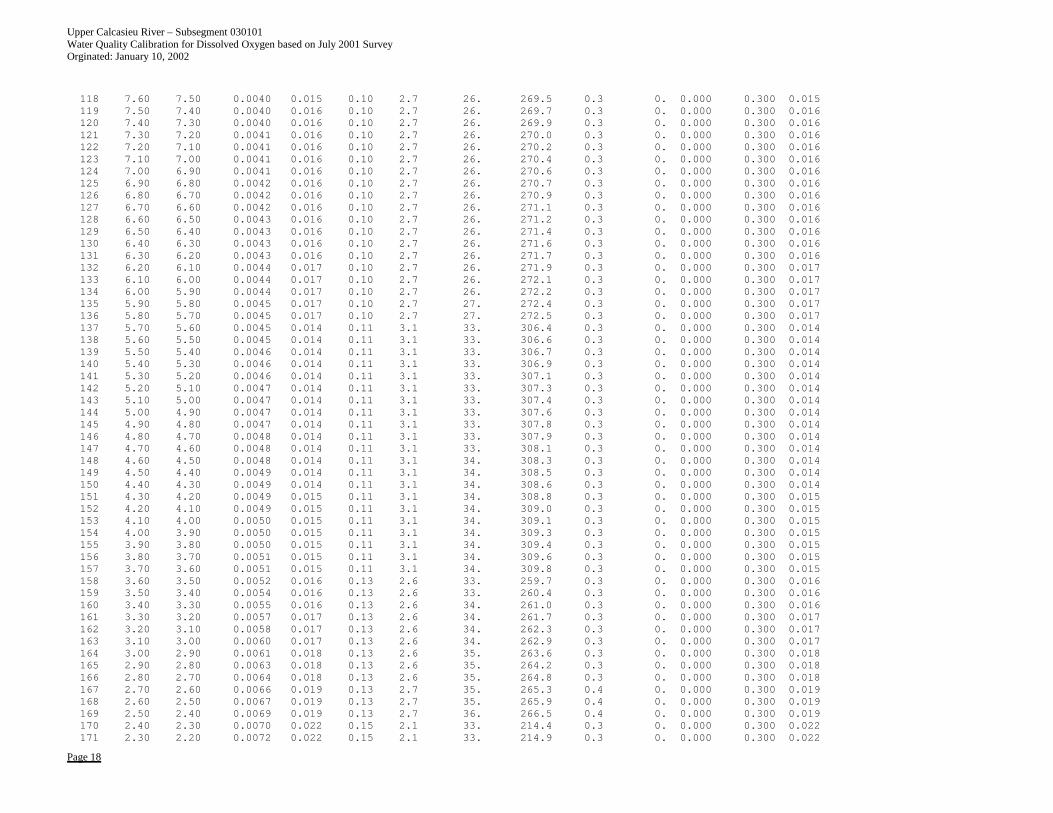
Upper Calcasieu River – Subsegment 030101 Water Quality Calibration for Dissolved Oxygen based on July 2001 Survey Orginated: January 10, 2002
Page 18
118 7.60 7.50 0.0040 0.015 0.10 2.7 26. 269.5 0.3 0. 0.000 0.300 0.015119 7.50 7.40 0.0040 0.016 0.10 2.7 26. 269.7 0.3 0. 0.000 0.300 0.016120 7.40 7.30 0.0040 0.016 0.10 2.7 26. 269.9 0.3 0. 0.000 0.300 0.016121 7.30 7.20 0.0041 0.016 0.10 2.7 26. 270.0 0.3 0. 0.000 0.300 0.016122 7.20 7.10 0.0041 0.016 0.10 2.7 26. 270.2 0.3 0. 0.000 0.300 0.016123 7.10 7.00 0.0041 0.016 0.10 2.7 26. 270.4 0.3 0. 0.000 0.300 0.016124 7.00 6.90 0.0041 0.016 0.10 2.7 26. 270.6 0.3 0. 0.000 0.300 0.016125 6.90 6.80 0.0042 0.016 0.10 2.7 26. 270.7 0.3 0. 0.000 0.300 0.016126 6.80 6.70 0.0042 0.016 0.10 2.7 26. 270.9 0.3 0. 0.000 0.300 0.016127 6.70 6.60 0.0042 0.016 0.10 2.7 26. 271.1 0.3 0. 0.000 0.300 0.016128 6.60 6.50 0.0043 0.016 0.10 2.7 26. 271.2 0.3 0. 0.000 0.300 0.016129 6.50 6.40 0.0043 0.016 0.10 2.7 26. 271.4 0.3 0. 0.000 0.300 0.016130 6.40 6.30 0.0043 0.016 0.10 2.7 26. 271.6 0.3 0. 0.000 0.300 0.016131 6.30 6.20 0.0043 0.016 0.10 2.7 26. 271.7 0.3 0. 0.000 0.300 0.016132 6.20 6.10 0.0044 0.017 0.10 2.7 26. 271.9 0.3 0. 0.000 0.300 0.017133 6.10 6.00 0.0044 0.017 0.10 2.7 26. 272.1 0.3 0. 0.000 0.300 0.017134 6.00 5.90 0.0044 0.017 0.10 2.7 26. 272.2 0.3 0. 0.000 0.300 0.017135 5.90 5.80 0.0045 0.017 0.10 2.7 27. 272.4 0.3 0. 0.000 0.300 0.017136 5.80 5.70 0.0045 0.017 0.10 2.7 27. 272.5 0.3 0. 0.000 0.300 0.017137 5.70 5.60 0.0045 0.014 0.11 3.1 33. 306.4 0.3 0. 0.000 0.300 0.014138 5.60 5.50 0.0045 0.014 0.11 3.1 33. 306.6 0.3 0. 0.000 0.300 0.014139 5.50 5.40 0.0046 0.014 0.11 3.1 33. 306.7 0.3 0. 0.000 0.300 0.014140 5.40 5.30 0.0046 0.014 0.11 3.1 33. 306.9 0.3 0. 0.000 0.300 0.014141 5.30 5.20 0.0046 0.014 0.11 3.1 33. 307.1 0.3 0. 0.000 0.300 0.014142 5.20 5.10 0.0047 0.014 0.11 3.1 33. 307.3 0.3 0. 0.000 0.300 0.014143 5.10 5.00 0.0047 0.014 0.11 3.1 33. 307.4 0.3 0. 0.000 0.300 0.014144 5.00 4.90 0.0047 0.014 0.11 3.1 33. 307.6 0.3 0. 0.000 0.300 0.014145 4.90 4.80 0.0047 0.014 0.11 3.1 33. 307.8 0.3 0. 0.000 0.300 0.014146 4.80 4.70 0.0048 0.014 0.11 3.1 33. 307.9 0.3 0. 0.000 0.300 0.014147 4.70 4.60 0.0048 0.014 0.11 3.1 33. 308.1 0.3 0. 0.000 0.300 0.014148 4.60 4.50 0.0048 0.014 0.11 3.1 34. 308.3 0.3 0. 0.000 0.300 0.014149 4.50 4.40 0.0049 0.014 0.11 3.1 34. 308.5 0.3 0. 0.000 0.300 0.014150 4.40 4.30 0.0049 0.014 0.11 3.1 34. 308.6 0.3 0. 0.000 0.300 0.014151 4.30 4.20 0.0049 0.015 0.11 3.1 34. 308.8 0.3 0. 0.000 0.300 0.015152 4.20 4.10 0.0049 0.015 0.11 3.1 34. 309.0 0.3 0. 0.000 0.300 0.015153 4.10 4.00 0.0050 0.015 0.11 3.1 34. 309.1 0.3 0. 0.000 0.300 0.015154 4.00 3.90 0.0050 0.015 0.11 3.1 34. 309.3 0.3 0. 0.000 0.300 0.015155 3.90 3.80 0.0050 0.015 0.11 3.1 34. 309.4 0.3 0. 0.000 0.300 0.015156 3.80 3.70 0.0051 0.015 0.11 3.1 34. 309.6 0.3 0. 0.000 0.300 0.015157 3.70 3.60 0.0051 0.015 0.11 3.1 34. 309.8 0.3 0. 0.000 0.300 0.015158 3.60 3.50 0.0052 0.016 0.13 2.6 33. 259.7 0.3 0. 0.000 0.300 0.016159 3.50 3.40 0.0054 0.016 0.13 2.6 33. 260.4 0.3 0. 0.000 0.300 0.016160 3.40 3.30 0.0055 0.016 0.13 2.6 34. 261.0 0.3 0. 0.000 0.300 0.016161 3.30 3.20 0.0057 0.017 0.13 2.6 34. 261.7 0.3 0. 0.000 0.300 0.017162 3.20 3.10 0.0058 0.017 0.13 2.6 34. 262.3 0.3 0. 0.000 0.300 0.017163 3.10 3.00 0.0060 0.017 0.13 2.6 34. 262.9 0.3 0. 0.000 0.300 0.017164 3.00 2.90 0.0061 0.018 0.13 2.6 35. 263.6 0.3 0. 0.000 0.300 0.018165 2.90 2.80 0.0063 0.018 0.13 2.6 35. 264.2 0.3 0. 0.000 0.300 0.018166 2.80 2.70 0.0064 0.018 0.13 2.6 35. 264.8 0.3 0. 0.000 0.300 0.018167 2.70 2.60 0.0066 0.019 0.13 2.7 35. 265.3 0.4 0. 0.000 0.300 0.019168 2.60 2.50 0.0067 0.019 0.13 2.7 35. 265.9 0.4 0. 0.000 0.300 0.019169 2.50 2.40 0.0069 0.019 0.13 2.7 36. 266.5 0.4 0. 0.000 0.300 0.019170 2.40 2.30 0.0070 0.022 0.15 2.1 33. 214.4 0.3 0. 0.000 0.300 0.022171 2.30 2.20 0.0072 0.022 0.15 2.1 33. 214.9 0.3 0. 0.000 0.300 0.022
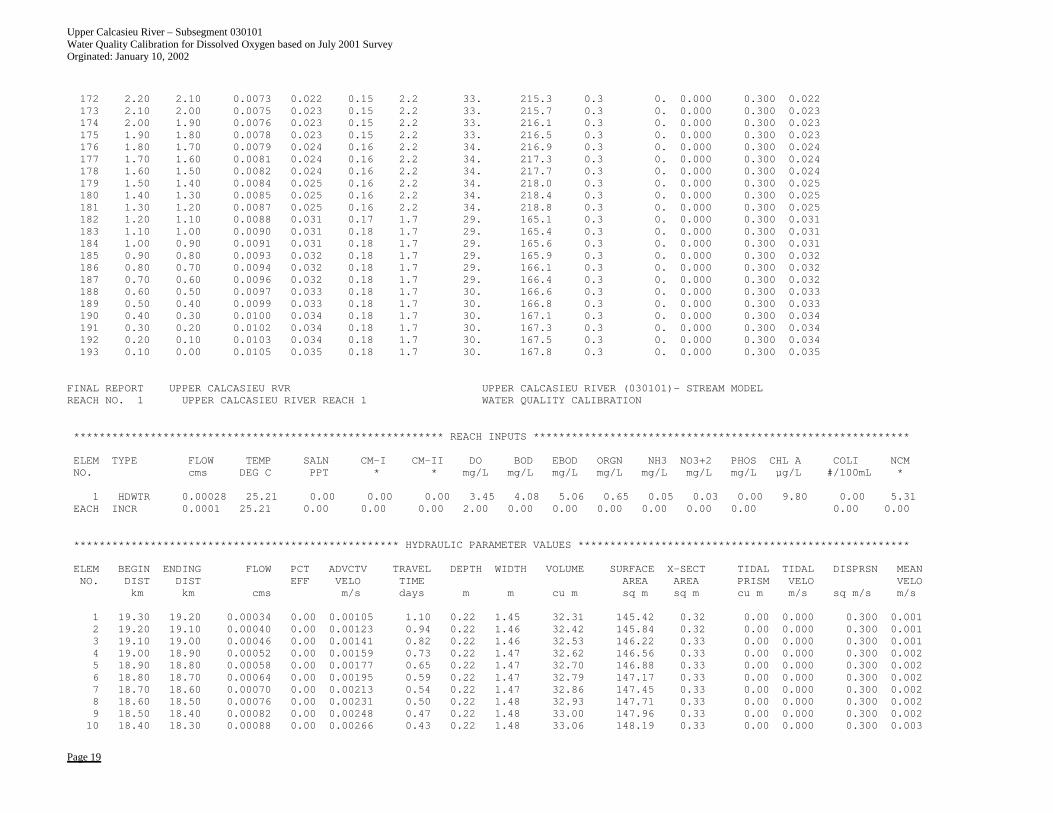
Upper Calcasieu River – Subsegment 030101 Water Quality Calibration for Dissolved Oxygen based on July 2001 Survey Orginated: January 10, 2002
Page 19
172 2.20 2.10 0.0073 0.022 0.15 2.2 33. 215.3 0.3 0. 0.000 0.300 0.022173 2.10 2.00 0.0075 0.023 0.15 2.2 33. 215.7 0.3 0. 0.000 0.300 0.023174 2.00 1.90 0.0076 0.023 0.15 2.2 33. 216.1 0.3 0. 0.000 0.300 0.023175 1.90 1.80 0.0078 0.023 0.15 2.2 33. 216.5 0.3 0. 0.000 0.300 0.023176 1.80 1.70 0.0079 0.024 0.16 2.2 34. 216.9 0.3 0. 0.000 0.300 0.024177 1.70 1.60 0.0081 0.024 0.16 2.2 34. 217.3 0.3 0. 0.000 0.300 0.024178 1.60 1.50 0.0082 0.024 0.16 2.2 34. 217.7 0.3 0. 0.000 0.300 0.024179 1.50 1.40 0.0084 0.025 0.16 2.2 34. 218.0 0.3 0. 0.000 0.300 0.025180 1.40 1.30 0.0085 0.025 0.16 2.2 34. 218.4 0.3 0. 0.000 0.300 0.025181 1.30 1.20 0.0087 0.025 0.16 2.2 34. 218.8 0.3 0. 0.000 0.300 0.025182 1.20 1.10 0.0088 0.031 0.17 1.7 29. 165.1 0.3 0. 0.000 0.300 0.031183 1.10 1.00 0.0090 0.031 0.18 1.7 29. 165.4 0.3 0. 0.000 0.300 0.031184 1.00 0.90 0.0091 0.031 0.18 1.7 29. 165.6 0.3 0. 0.000 0.300 0.031185 0.90 0.80 0.0093 0.032 0.18 1.7 29. 165.9 0.3 0. 0.000 0.300 0.032186 0.80 0.70 0.0094 0.032 0.18 1.7 29. 166.1 0.3 0. 0.000 0.300 0.032187 0.70 0.60 0.0096 0.032 0.18 1.7 29. 166.4 0.3 0. 0.000 0.300 0.032188 0.60 0.50 0.0097 0.033 0.18 1.7 30. 166.6 0.3 0. 0.000 0.300 0.033189 0.50 0.40 0.0099 0.033 0.18 1.7 30. 166.8 0.3 0. 0.000 0.300 0.033190 0.40 0.30 0.0100 0.034 0.18 1.7 30. 167.1 0.3 0. 0.000 0.300 0.034191 0.30 0.20 0.0102 0.034 0.18 1.7 30. 167.3 0.3 0. 0.000 0.300 0.034192 0.20 0.10 0.0103 0.034 0.18 1.7 30. 167.5 0.3 0. 0.000 0.300 0.034193 0.10 0.00 0.0105 0.035 0.18 1.7 30. 167.8 0.3 0. 0.000 0.300 0.035
FINAL REPORT UPPER CALCASIEU RVR UPPER CALCASIEU RIVER (030101)- STREAM MODELREACH NO. 1 UPPER CALCASIEU RIVER REACH 1 WATER QUALITY CALIBRATION
********************************************************** REACH INPUTS ***********************************************************
ELEM TYPE FLOW TEMP SALN CM-I CM-II DO BOD EBOD ORGN NH3 NO3+2 PHOS CHL A COLI NCMNO. cms DEG C PPT * * mg/L mg/L mg/L mg/L mg/L mg/L mg/L µg/L #/100mL *
1 HDWTR 0.00028 25.21 0.00 0.00 0.00 3.45 4.08 5.06 0.65 0.05 0.03 0.00 9.80 0.00 5.31EACH INCR 0.0001 25.21 0.00 0.00 0.00 2.00 0.00 0.00 0.00 0.00 0.00 0.00 0.00 0.00
*************************************************** HYDRAULIC PARAMETER VALUES ****************************************************
ELEM BEGIN ENDING FLOW PCT ADVCTV TRAVEL DEPTH WIDTH VOLUME SURFACE X-SECT TIDAL TIDAL DISPRSN MEANNO. DIST DIST EFF VELO TIME AREA AREA PRISM VELO VELO
km km cms m/s days m m cu m sq m sq m cu m m/s sq m/s m/s
1 19.30 19.20 0.00034 0.00 0.00105 1.10 0.22 1.45 32.31 145.42 0.32 0.00 0.000 0.300 0.0012 19.20 19.10 0.00040 0.00 0.00123 0.94 0.22 1.46 32.42 145.84 0.32 0.00 0.000 0.300 0.0013 19.10 19.00 0.00046 0.00 0.00141 0.82 0.22 1.46 32.53 146.22 0.33 0.00 0.000 0.300 0.0014 19.00 18.90 0.00052 0.00 0.00159 0.73 0.22 1.47 32.62 146.56 0.33 0.00 0.000 0.300 0.0025 18.90 18.80 0.00058 0.00 0.00177 0.65 0.22 1.47 32.70 146.88 0.33 0.00 0.000 0.300 0.0026 18.80 18.70 0.00064 0.00 0.00195 0.59 0.22 1.47 32.79 147.17 0.33 0.00 0.000 0.300 0.0027 18.70 18.60 0.00070 0.00 0.00213 0.54 0.22 1.47 32.86 147.45 0.33 0.00 0.000 0.300 0.0028 18.60 18.50 0.00076 0.00 0.00231 0.50 0.22 1.48 32.93 147.71 0.33 0.00 0.000 0.300 0.0029 18.50 18.40 0.00082 0.00 0.00248 0.47 0.22 1.48 33.00 147.96 0.33 0.00 0.000 0.300 0.00210 18.40 18.30 0.00088 0.00 0.00266 0.43 0.22 1.48 33.06 148.19 0.33 0.00 0.000 0.300 0.003
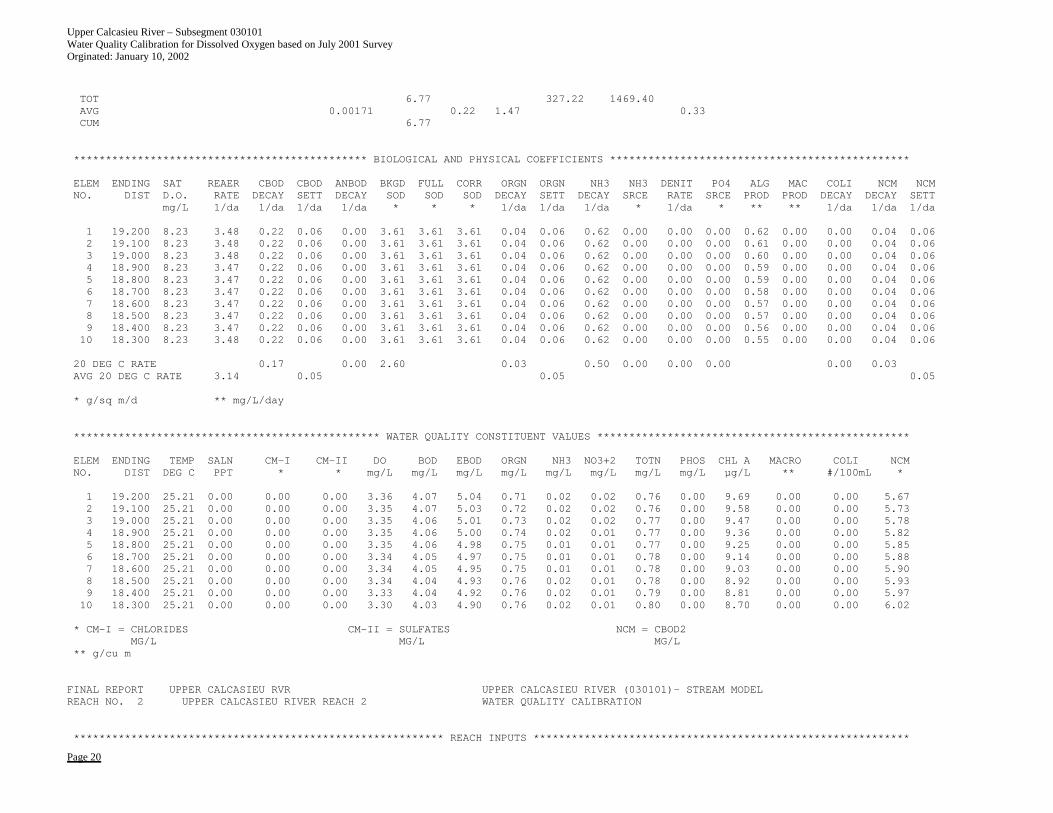
Upper Calcasieu River – Subsegment 030101 Water Quality Calibration for Dissolved Oxygen based on July 2001 Survey Orginated: January 10, 2002
Page 20
TOT 6.77 327.22 1469.40AVG 0.00171 0.22 1.47 0.33CUM 6.77
********************************************** BIOLOGICAL AND PHYSICAL COEFFICIENTS ***********************************************
ELEM ENDING SAT REAER CBOD CBOD ANBOD BKGD FULL CORR ORGN ORGN NH3 NH3 DENIT PO4 ALG MAC COLI NCM NCMNO. DIST D.O. RATE DECAY SETT DECAY SOD SOD SOD DECAY SETT DECAY SRCE RATE SRCE PROD PROD DECAY DECAY SETT
mg/L 1/da 1/da 1/da 1/da * * * 1/da 1/da 1/da * 1/da * ** ** 1/da 1/da 1/da
1 19.200 8.23 3.48 0.22 0.06 0.00 3.61 3.61 3.61 0.04 0.06 0.62 0.00 0.00 0.00 0.62 0.00 0.00 0.04 0.062 19.100 8.23 3.48 0.22 0.06 0.00 3.61 3.61 3.61 0.04 0.06 0.62 0.00 0.00 0.00 0.61 0.00 0.00 0.04 0.063 19.000 8.23 3.48 0.22 0.06 0.00 3.61 3.61 3.61 0.04 0.06 0.62 0.00 0.00 0.00 0.60 0.00 0.00 0.04 0.064 18.900 8.23 3.47 0.22 0.06 0.00 3.61 3.61 3.61 0.04 0.06 0.62 0.00 0.00 0.00 0.59 0.00 0.00 0.04 0.065 18.800 8.23 3.47 0.22 0.06 0.00 3.61 3.61 3.61 0.04 0.06 0.62 0.00 0.00 0.00 0.59 0.00 0.00 0.04 0.066 18.700 8.23 3.47 0.22 0.06 0.00 3.61 3.61 3.61 0.04 0.06 0.62 0.00 0.00 0.00 0.58 0.00 0.00 0.04 0.067 18.600 8.23 3.47 0.22 0.06 0.00 3.61 3.61 3.61 0.04 0.06 0.62 0.00 0.00 0.00 0.57 0.00 0.00 0.04 0.068 18.500 8.23 3.47 0.22 0.06 0.00 3.61 3.61 3.61 0.04 0.06 0.62 0.00 0.00 0.00 0.57 0.00 0.00 0.04 0.069 18.400 8.23 3.47 0.22 0.06 0.00 3.61 3.61 3.61 0.04 0.06 0.62 0.00 0.00 0.00 0.56 0.00 0.00 0.04 0.0610 18.300 8.23 3.48 0.22 0.06 0.00 3.61 3.61 3.61 0.04 0.06 0.62 0.00 0.00 0.00 0.55 0.00 0.00 0.04 0.06
20 DEG C RATE 0.17 0.00 2.60 0.03 0.50 0.00 0.00 0.00 0.00 0.03AVG 20 DEG C RATE 3.14 0.05 0.05 0.05
* g/sq m/d ** mg/L/day
************************************************ WATER QUALITY CONSTITUENT VALUES *************************************************
ELEM ENDING TEMP SALN CM-I CM-II DO BOD EBOD ORGN NH3 NO3+2 TOTN PHOS CHL A MACRO COLI NCMNO. DIST DEG C PPT * * mg/L mg/L mg/L mg/L mg/L mg/L mg/L mg/L µg/L ** #/100mL *
1 19.200 25.21 0.00 0.00 0.00 3.36 4.07 5.04 0.71 0.02 0.02 0.76 0.00 9.69 0.00 0.00 5.672 19.100 25.21 0.00 0.00 0.00 3.35 4.07 5.03 0.72 0.02 0.02 0.76 0.00 9.58 0.00 0.00 5.733 19.000 25.21 0.00 0.00 0.00 3.35 4.06 5.01 0.73 0.02 0.02 0.77 0.00 9.47 0.00 0.00 5.784 18.900 25.21 0.00 0.00 0.00 3.35 4.06 5.00 0.74 0.02 0.01 0.77 0.00 9.36 0.00 0.00 5.825 18.800 25.21 0.00 0.00 0.00 3.35 4.06 4.98 0.75 0.01 0.01 0.77 0.00 9.25 0.00 0.00 5.856 18.700 25.21 0.00 0.00 0.00 3.34 4.05 4.97 0.75 0.01 0.01 0.78 0.00 9.14 0.00 0.00 5.887 18.600 25.21 0.00 0.00 0.00 3.34 4.05 4.95 0.75 0.01 0.01 0.78 0.00 9.03 0.00 0.00 5.908 18.500 25.21 0.00 0.00 0.00 3.34 4.04 4.93 0.76 0.02 0.01 0.78 0.00 8.92 0.00 0.00 5.939 18.400 25.21 0.00 0.00 0.00 3.33 4.04 4.92 0.76 0.02 0.01 0.79 0.00 8.81 0.00 0.00 5.9710 18.300 25.21 0.00 0.00 0.00 3.30 4.03 4.90 0.76 0.02 0.01 0.80 0.00 8.70 0.00 0.00 6.02
* CM-I = CHLORIDES CM-II = SULFATES NCM = CBOD2MG/L MG/L MG/L
** g/cu m
FINAL REPORT UPPER CALCASIEU RVR UPPER CALCASIEU RIVER (030101)- STREAM MODELREACH NO. 2 UPPER CALCASIEU RIVER REACH 2 WATER QUALITY CALIBRATION
********************************************************** REACH INPUTS ***********************************************************
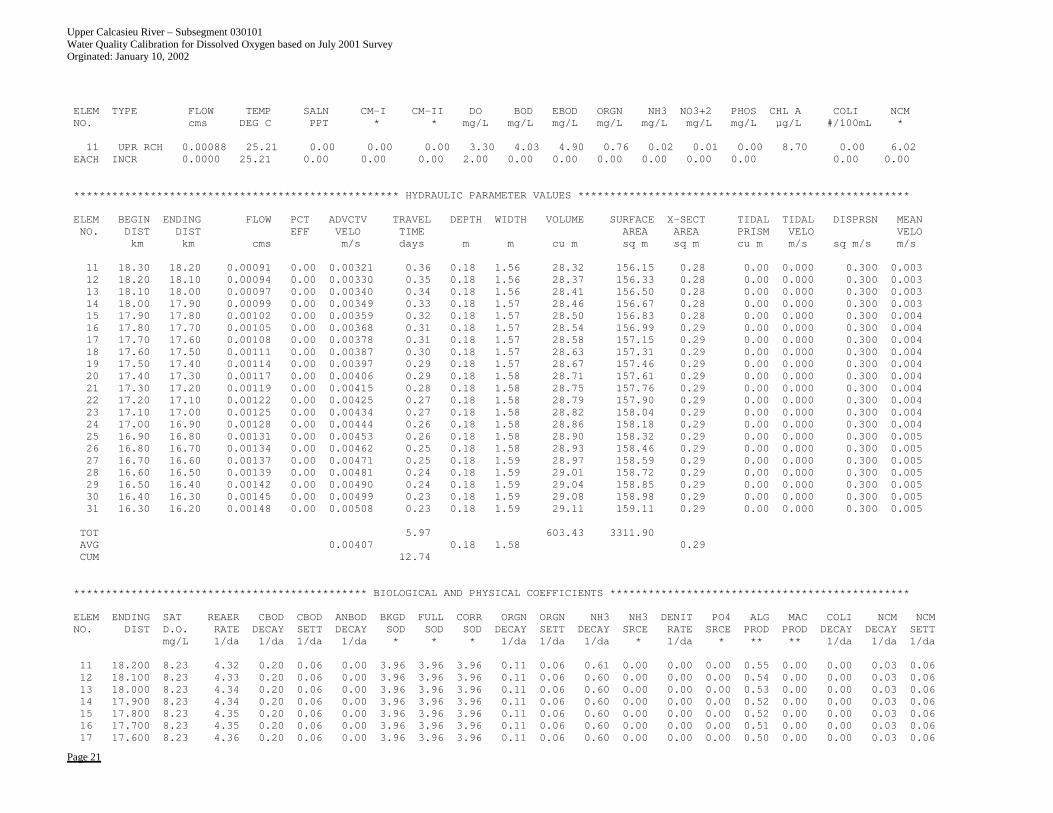
Upper Calcasieu River – Subsegment 030101 Water Quality Calibration for Dissolved Oxygen based on July 2001 Survey Orginated: January 10, 2002
Page 21
ELEM TYPE FLOW TEMP SALN CM-I CM-II DO BOD EBOD ORGN NH3 NO3+2 PHOS CHL A COLI NCMNO. cms DEG C PPT * * mg/L mg/L mg/L mg/L mg/L mg/L mg/L µg/L #/100mL *
11 UPR RCH 0.00088 25.21 0.00 0.00 0.00 3.30 4.03 4.90 0.76 0.02 0.01 0.00 8.70 0.00 6.02EACH INCR 0.0000 25.21 0.00 0.00 0.00 2.00 0.00 0.00 0.00 0.00 0.00 0.00 0.00 0.00
*************************************************** HYDRAULIC PARAMETER VALUES ****************************************************
ELEM BEGIN ENDING FLOW PCT ADVCTV TRAVEL DEPTH WIDTH VOLUME SURFACE X-SECT TIDAL TIDAL DISPRSN MEANNO. DIST DIST EFF VELO TIME AREA AREA PRISM VELO VELO
km km cms m/s days m m cu m sq m sq m cu m m/s sq m/s m/s
11 18.30 18.20 0.00091 0.00 0.00321 0.36 0.18 1.56 28.32 156.15 0.28 0.00 0.000 0.300 0.00312 18.20 18.10 0.00094 0.00 0.00330 0.35 0.18 1.56 28.37 156.33 0.28 0.00 0.000 0.300 0.00313 18.10 18.00 0.00097 0.00 0.00340 0.34 0.18 1.56 28.41 156.50 0.28 0.00 0.000 0.300 0.00314 18.00 17.90 0.00099 0.00 0.00349 0.33 0.18 1.57 28.46 156.67 0.28 0.00 0.000 0.300 0.00315 17.90 17.80 0.00102 0.00 0.00359 0.32 0.18 1.57 28.50 156.83 0.28 0.00 0.000 0.300 0.00416 17.80 17.70 0.00105 0.00 0.00368 0.31 0.18 1.57 28.54 156.99 0.29 0.00 0.000 0.300 0.00417 17.70 17.60 0.00108 0.00 0.00378 0.31 0.18 1.57 28.58 157.15 0.29 0.00 0.000 0.300 0.00418 17.60 17.50 0.00111 0.00 0.00387 0.30 0.18 1.57 28.63 157.31 0.29 0.00 0.000 0.300 0.00419 17.50 17.40 0.00114 0.00 0.00397 0.29 0.18 1.57 28.67 157.46 0.29 0.00 0.000 0.300 0.00420 17.40 17.30 0.00117 0.00 0.00406 0.29 0.18 1.58 28.71 157.61 0.29 0.00 0.000 0.300 0.00421 17.30 17.20 0.00119 0.00 0.00415 0.28 0.18 1.58 28.75 157.76 0.29 0.00 0.000 0.300 0.00422 17.20 17.10 0.00122 0.00 0.00425 0.27 0.18 1.58 28.79 157.90 0.29 0.00 0.000 0.300 0.00423 17.10 17.00 0.00125 0.00 0.00434 0.27 0.18 1.58 28.82 158.04 0.29 0.00 0.000 0.300 0.00424 17.00 16.90 0.00128 0.00 0.00444 0.26 0.18 1.58 28.86 158.18 0.29 0.00 0.000 0.300 0.00425 16.90 16.80 0.00131 0.00 0.00453 0.26 0.18 1.58 28.90 158.32 0.29 0.00 0.000 0.300 0.00526 16.80 16.70 0.00134 0.00 0.00462 0.25 0.18 1.58 28.93 158.46 0.29 0.00 0.000 0.300 0.00527 16.70 16.60 0.00137 0.00 0.00471 0.25 0.18 1.59 28.97 158.59 0.29 0.00 0.000 0.300 0.00528 16.60 16.50 0.00139 0.00 0.00481 0.24 0.18 1.59 29.01 158.72 0.29 0.00 0.000 0.300 0.00529 16.50 16.40 0.00142 0.00 0.00490 0.24 0.18 1.59 29.04 158.85 0.29 0.00 0.000 0.300 0.00530 16.40 16.30 0.00145 0.00 0.00499 0.23 0.18 1.59 29.08 158.98 0.29 0.00 0.000 0.300 0.00531 16.30 16.20 0.00148 0.00 0.00508 0.23 0.18 1.59 29.11 159.11 0.29 0.00 0.000 0.300 0.005
TOT 5.97 603.43 3311.90AVG 0.00407 0.18 1.58 0.29CUM 12.74
********************************************** BIOLOGICAL AND PHYSICAL COEFFICIENTS ***********************************************
ELEM ENDING SAT REAER CBOD CBOD ANBOD BKGD FULL CORR ORGN ORGN NH3 NH3 DENIT PO4 ALG MAC COLI NCM NCMNO. DIST D.O. RATE DECAY SETT DECAY SOD SOD SOD DECAY SETT DECAY SRCE RATE SRCE PROD PROD DECAY DECAY SETT
mg/L 1/da 1/da 1/da 1/da * * * 1/da 1/da 1/da * 1/da * ** ** 1/da 1/da 1/da
11 18.200 8.23 4.32 0.20 0.06 0.00 3.96 3.96 3.96 0.11 0.06 0.61 0.00 0.00 0.00 0.55 0.00 0.00 0.03 0.0612 18.100 8.23 4.33 0.20 0.06 0.00 3.96 3.96 3.96 0.11 0.06 0.60 0.00 0.00 0.00 0.54 0.00 0.00 0.03 0.0613 18.000 8.23 4.34 0.20 0.06 0.00 3.96 3.96 3.96 0.11 0.06 0.60 0.00 0.00 0.00 0.53 0.00 0.00 0.03 0.0614 17.900 8.23 4.34 0.20 0.06 0.00 3.96 3.96 3.96 0.11 0.06 0.60 0.00 0.00 0.00 0.52 0.00 0.00 0.03 0.0615 17.800 8.23 4.35 0.20 0.06 0.00 3.96 3.96 3.96 0.11 0.06 0.60 0.00 0.00 0.00 0.52 0.00 0.00 0.03 0.0616 17.700 8.23 4.35 0.20 0.06 0.00 3.96 3.96 3.96 0.11 0.06 0.60 0.00 0.00 0.00 0.51 0.00 0.00 0.03 0.0617 17.600 8.23 4.36 0.20 0.06 0.00 3.96 3.96 3.96 0.11 0.06 0.60 0.00 0.00 0.00 0.50 0.00 0.00 0.03 0.06
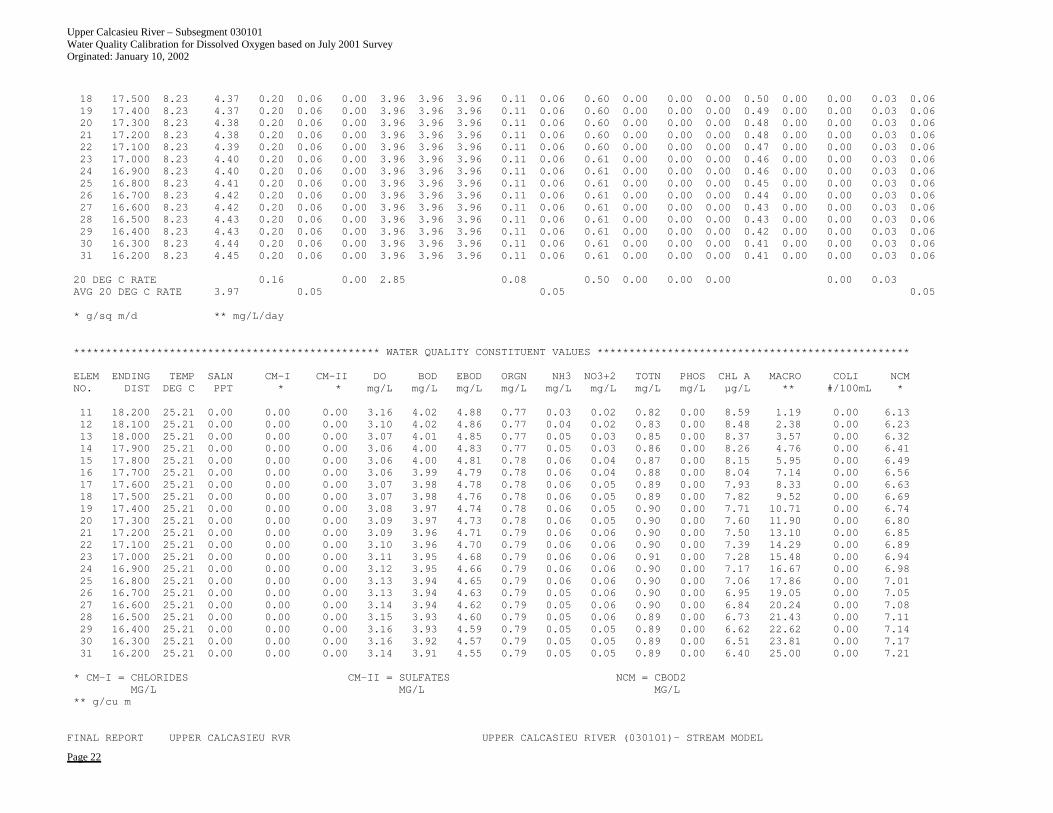
Upper Calcasieu River – Subsegment 030101 Water Quality Calibration for Dissolved Oxygen based on July 2001 Survey Orginated: January 10, 2002
Page 22
18 17.500 8.23 4.37 0.20 0.06 0.00 3.96 3.96 3.96 0.11 0.06 0.60 0.00 0.00 0.00 0.50 0.00 0.00 0.03 0.0619 17.400 8.23 4.37 0.20 0.06 0.00 3.96 3.96 3.96 0.11 0.06 0.60 0.00 0.00 0.00 0.49 0.00 0.00 0.03 0.0620 17.300 8.23 4.38 0.20 0.06 0.00 3.96 3.96 3.96 0.11 0.06 0.60 0.00 0.00 0.00 0.48 0.00 0.00 0.03 0.0621 17.200 8.23 4.38 0.20 0.06 0.00 3.96 3.96 3.96 0.11 0.06 0.60 0.00 0.00 0.00 0.48 0.00 0.00 0.03 0.0622 17.100 8.23 4.39 0.20 0.06 0.00 3.96 3.96 3.96 0.11 0.06 0.60 0.00 0.00 0.00 0.47 0.00 0.00 0.03 0.0623 17.000 8.23 4.40 0.20 0.06 0.00 3.96 3.96 3.96 0.11 0.06 0.61 0.00 0.00 0.00 0.46 0.00 0.00 0.03 0.0624 16.900 8.23 4.40 0.20 0.06 0.00 3.96 3.96 3.96 0.11 0.06 0.61 0.00 0.00 0.00 0.46 0.00 0.00 0.03 0.0625 16.800 8.23 4.41 0.20 0.06 0.00 3.96 3.96 3.96 0.11 0.06 0.61 0.00 0.00 0.00 0.45 0.00 0.00 0.03 0.0626 16.700 8.23 4.42 0.20 0.06 0.00 3.96 3.96 3.96 0.11 0.06 0.61 0.00 0.00 0.00 0.44 0.00 0.00 0.03 0.0627 16.600 8.23 4.42 0.20 0.06 0.00 3.96 3.96 3.96 0.11 0.06 0.61 0.00 0.00 0.00 0.43 0.00 0.00 0.03 0.0628 16.500 8.23 4.43 0.20 0.06 0.00 3.96 3.96 3.96 0.11 0.06 0.61 0.00 0.00 0.00 0.43 0.00 0.00 0.03 0.0629 16.400 8.23 4.43 0.20 0.06 0.00 3.96 3.96 3.96 0.11 0.06 0.61 0.00 0.00 0.00 0.42 0.00 0.00 0.03 0.0630 16.300 8.23 4.44 0.20 0.06 0.00 3.96 3.96 3.96 0.11 0.06 0.61 0.00 0.00 0.00 0.41 0.00 0.00 0.03 0.0631 16.200 8.23 4.45 0.20 0.06 0.00 3.96 3.96 3.96 0.11 0.06 0.61 0.00 0.00 0.00 0.41 0.00 0.00 0.03 0.06
20 DEG C RATE 0.16 0.00 2.85 0.08 0.50 0.00 0.00 0.00 0.00 0.03AVG 20 DEG C RATE 3.97 0.05 0.05 0.05
* g/sq m/d ** mg/L/day
************************************************ WATER QUALITY CONSTITUENT VALUES *************************************************
ELEM ENDING TEMP SALN CM-I CM-II DO BOD EBOD ORGN NH3 NO3+2 TOTN PHOS CHL A MACRO COLI NCMNO. DIST DEG C PPT * * mg/L mg/L mg/L mg/L mg/L mg/L mg/L mg/L µg/L ** #/100mL *
11 18.200 25.21 0.00 0.00 0.00 3.16 4.02 4.88 0.77 0.03 0.02 0.82 0.00 8.59 1.19 0.00 6.1312 18.100 25.21 0.00 0.00 0.00 3.10 4.02 4.86 0.77 0.04 0.02 0.83 0.00 8.48 2.38 0.00 6.2313 18.000 25.21 0.00 0.00 0.00 3.07 4.01 4.85 0.77 0.05 0.03 0.85 0.00 8.37 3.57 0.00 6.3214 17.900 25.21 0.00 0.00 0.00 3.06 4.00 4.83 0.77 0.05 0.03 0.86 0.00 8.26 4.76 0.00 6.4115 17.800 25.21 0.00 0.00 0.00 3.06 4.00 4.81 0.78 0.06 0.04 0.87 0.00 8.15 5.95 0.00 6.4916 17.700 25.21 0.00 0.00 0.00 3.06 3.99 4.79 0.78 0.06 0.04 0.88 0.00 8.04 7.14 0.00 6.5617 17.600 25.21 0.00 0.00 0.00 3.07 3.98 4.78 0.78 0.06 0.05 0.89 0.00 7.93 8.33 0.00 6.6318 17.500 25.21 0.00 0.00 0.00 3.07 3.98 4.76 0.78 0.06 0.05 0.89 0.00 7.82 9.52 0.00 6.6919 17.400 25.21 0.00 0.00 0.00 3.08 3.97 4.74 0.78 0.06 0.05 0.90 0.00 7.71 10.71 0.00 6.7420 17.300 25.21 0.00 0.00 0.00 3.09 3.97 4.73 0.78 0.06 0.05 0.90 0.00 7.60 11.90 0.00 6.8021 17.200 25.21 0.00 0.00 0.00 3.09 3.96 4.71 0.79 0.06 0.06 0.90 0.00 7.50 13.10 0.00 6.8522 17.100 25.21 0.00 0.00 0.00 3.10 3.96 4.70 0.79 0.06 0.06 0.90 0.00 7.39 14.29 0.00 6.8923 17.000 25.21 0.00 0.00 0.00 3.11 3.95 4.68 0.79 0.06 0.06 0.91 0.00 7.28 15.48 0.00 6.9424 16.900 25.21 0.00 0.00 0.00 3.12 3.95 4.66 0.79 0.06 0.06 0.90 0.00 7.17 16.67 0.00 6.9825 16.800 25.21 0.00 0.00 0.00 3.13 3.94 4.65 0.79 0.06 0.06 0.90 0.00 7.06 17.86 0.00 7.0126 16.700 25.21 0.00 0.00 0.00 3.13 3.94 4.63 0.79 0.05 0.06 0.90 0.00 6.95 19.05 0.00 7.0527 16.600 25.21 0.00 0.00 0.00 3.14 3.94 4.62 0.79 0.05 0.06 0.90 0.00 6.84 20.24 0.00 7.0828 16.500 25.21 0.00 0.00 0.00 3.15 3.93 4.60 0.79 0.05 0.06 0.89 0.00 6.73 21.43 0.00 7.1129 16.400 25.21 0.00 0.00 0.00 3.16 3.93 4.59 0.79 0.05 0.05 0.89 0.00 6.62 22.62 0.00 7.1430 16.300 25.21 0.00 0.00 0.00 3.16 3.92 4.57 0.79 0.05 0.05 0.89 0.00 6.51 23.81 0.00 7.1731 16.200 25.21 0.00 0.00 0.00 3.14 3.91 4.55 0.79 0.05 0.05 0.89 0.00 6.40 25.00 0.00 7.21
* CM-I = CHLORIDES CM-II = SULFATES NCM = CBOD2MG/L MG/L MG/L
** g/cu m
FINAL REPORT UPPER CALCASIEU RVR UPPER CALCASIEU RIVER (030101)- STREAM MODEL
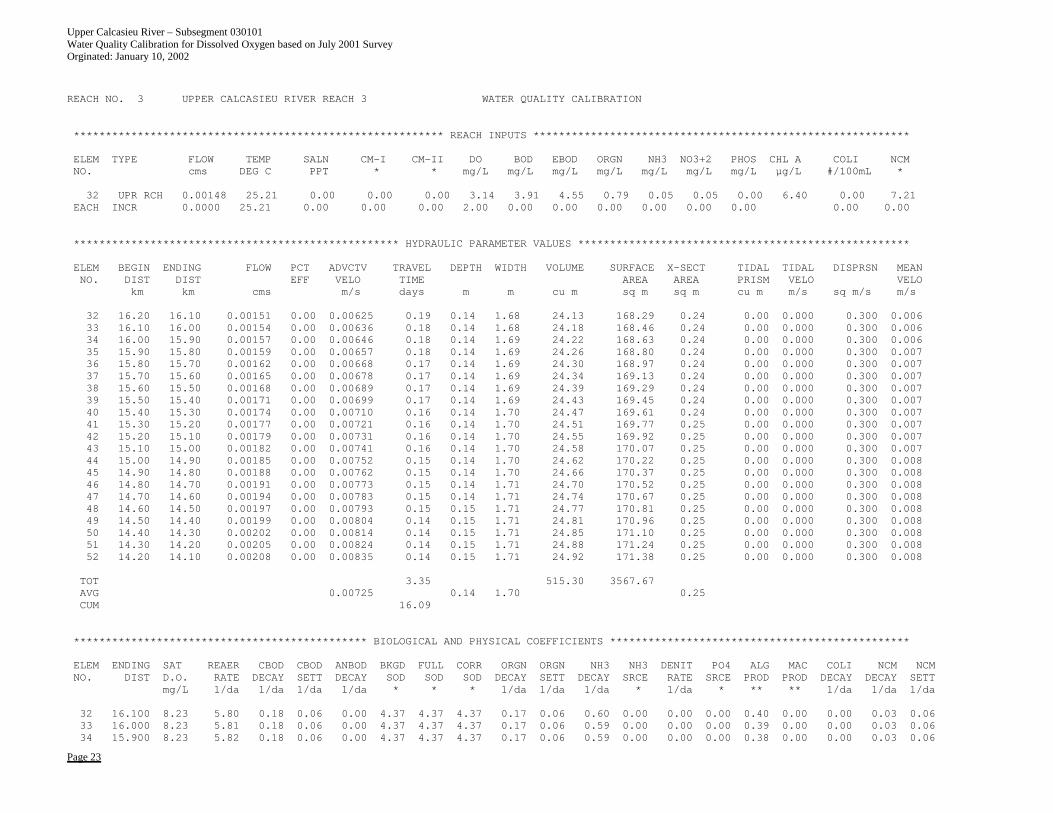
Upper Calcasieu River – Subsegment 030101 Water Quality Calibration for Dissolved Oxygen based on July 2001 Survey Orginated: January 10, 2002
Page 23
REACH NO. 3 UPPER CALCASIEU RIVER REACH 3 WATER QUALITY CALIBRATION
********************************************************** REACH INPUTS ***********************************************************
ELEM TYPE FLOW TEMP SALN CM-I CM-II DO BOD EBOD ORGN NH3 NO3+2 PHOS CHL A COLI NCMNO. cms DEG C PPT * * mg/L mg/L mg/L mg/L mg/L mg/L mg/L µg/L #/100mL *
32 UPR RCH 0.00148 25.21 0.00 0.00 0.00 3.14 3.91 4.55 0.79 0.05 0.05 0.00 6.40 0.00 7.21EACH INCR 0.0000 25.21 0.00 0.00 0.00 2.00 0.00 0.00 0.00 0.00 0.00 0.00 0.00 0.00
*************************************************** HYDRAULIC PARAMETER VALUES ****************************************************
ELEM BEGIN ENDING FLOW PCT ADVCTV TRAVEL DEPTH WIDTH VOLUME SURFACE X-SECT TIDAL TIDAL DISPRSN MEANNO. DIST DIST EFF VELO TIME AREA AREA PRISM VELO VELO
km km cms m/s days m m cu m sq m sq m cu m m/s sq m/s m/s
32 16.20 16.10 0.00151 0.00 0.00625 0.19 0.14 1.68 24.13 168.29 0.24 0.00 0.000 0.300 0.00633 16.10 16.00 0.00154 0.00 0.00636 0.18 0.14 1.68 24.18 168.46 0.24 0.00 0.000 0.300 0.00634 16.00 15.90 0.00157 0.00 0.00646 0.18 0.14 1.69 24.22 168.63 0.24 0.00 0.000 0.300 0.00635 15.90 15.80 0.00159 0.00 0.00657 0.18 0.14 1.69 24.26 168.80 0.24 0.00 0.000 0.300 0.00736 15.80 15.70 0.00162 0.00 0.00668 0.17 0.14 1.69 24.30 168.97 0.24 0.00 0.000 0.300 0.00737 15.70 15.60 0.00165 0.00 0.00678 0.17 0.14 1.69 24.34 169.13 0.24 0.00 0.000 0.300 0.00738 15.60 15.50 0.00168 0.00 0.00689 0.17 0.14 1.69 24.39 169.29 0.24 0.00 0.000 0.300 0.00739 15.50 15.40 0.00171 0.00 0.00699 0.17 0.14 1.69 24.43 169.45 0.24 0.00 0.000 0.300 0.00740 15.40 15.30 0.00174 0.00 0.00710 0.16 0.14 1.70 24.47 169.61 0.24 0.00 0.000 0.300 0.00741 15.30 15.20 0.00177 0.00 0.00721 0.16 0.14 1.70 24.51 169.77 0.25 0.00 0.000 0.300 0.00742 15.20 15.10 0.00179 0.00 0.00731 0.16 0.14 1.70 24.55 169.92 0.25 0.00 0.000 0.300 0.00743 15.10 15.00 0.00182 0.00 0.00741 0.16 0.14 1.70 24.58 170.07 0.25 0.00 0.000 0.300 0.00744 15.00 14.90 0.00185 0.00 0.00752 0.15 0.14 1.70 24.62 170.22 0.25 0.00 0.000 0.300 0.00845 14.90 14.80 0.00188 0.00 0.00762 0.15 0.14 1.70 24.66 170.37 0.25 0.00 0.000 0.300 0.00846 14.80 14.70 0.00191 0.00 0.00773 0.15 0.14 1.71 24.70 170.52 0.25 0.00 0.000 0.300 0.00847 14.70 14.60 0.00194 0.00 0.00783 0.15 0.14 1.71 24.74 170.67 0.25 0.00 0.000 0.300 0.00848 14.60 14.50 0.00197 0.00 0.00793 0.15 0.15 1.71 24.77 170.81 0.25 0.00 0.000 0.300 0.00849 14.50 14.40 0.00199 0.00 0.00804 0.14 0.15 1.71 24.81 170.96 0.25 0.00 0.000 0.300 0.00850 14.40 14.30 0.00202 0.00 0.00814 0.14 0.15 1.71 24.85 171.10 0.25 0.00 0.000 0.300 0.00851 14.30 14.20 0.00205 0.00 0.00824 0.14 0.15 1.71 24.88 171.24 0.25 0.00 0.000 0.300 0.00852 14.20 14.10 0.00208 0.00 0.00835 0.14 0.15 1.71 24.92 171.38 0.25 0.00 0.000 0.300 0.008
TOT 3.35 515.30 3567.67AVG 0.00725 0.14 1.70 0.25CUM 16.09
********************************************** BIOLOGICAL AND PHYSICAL COEFFICIENTS ***********************************************
ELEM ENDING SAT REAER CBOD CBOD ANBOD BKGD FULL CORR ORGN ORGN NH3 NH3 DENIT PO4 ALG MAC COLI NCM NCMNO. DIST D.O. RATE DECAY SETT DECAY SOD SOD SOD DECAY SETT DECAY SRCE RATE SRCE PROD PROD DECAY DECAY SETT
mg/L 1/da 1/da 1/da 1/da * * * 1/da 1/da 1/da * 1/da * ** ** 1/da 1/da 1/da
32 16.100 8.23 5.80 0.18 0.06 0.00 4.37 4.37 4.37 0.17 0.06 0.60 0.00 0.00 0.00 0.40 0.00 0.00 0.03 0.0633 16.000 8.23 5.81 0.18 0.06 0.00 4.37 4.37 4.37 0.17 0.06 0.59 0.00 0.00 0.00 0.39 0.00 0.00 0.03 0.0634 15.900 8.23 5.82 0.18 0.06 0.00 4.37 4.37 4.37 0.17 0.06 0.59 0.00 0.00 0.00 0.38 0.00 0.00 0.03 0.06
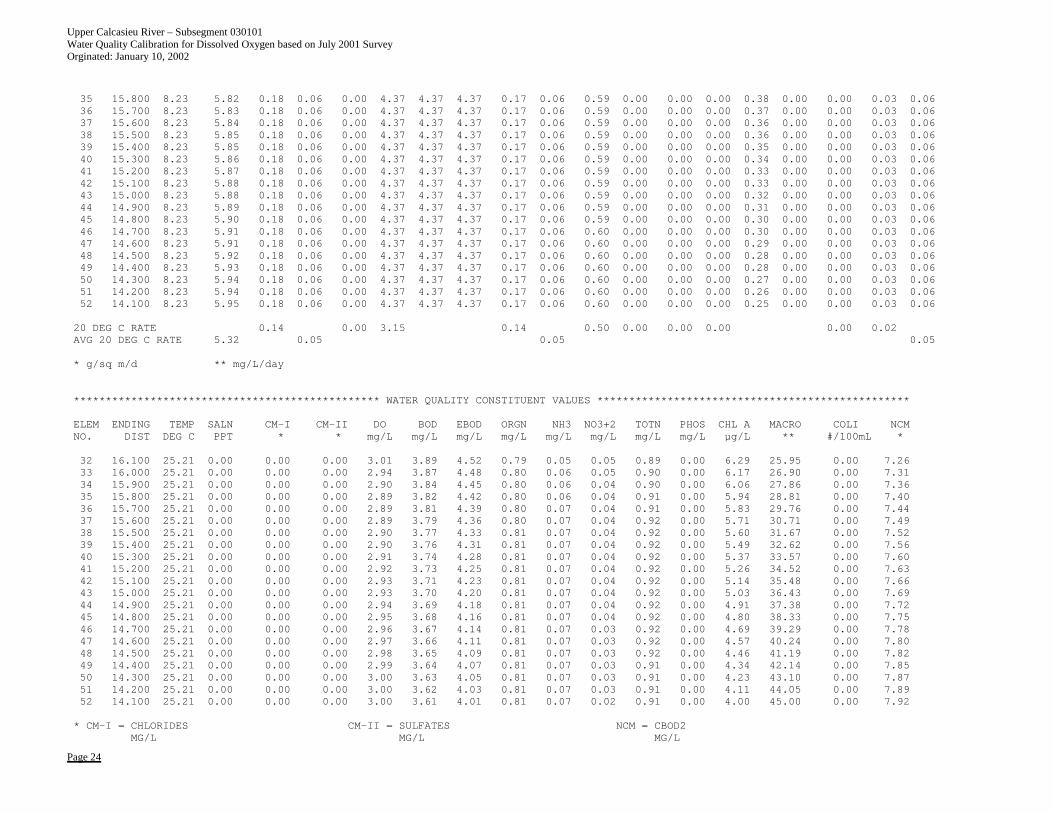
Upper Calcasieu River – Subsegment 030101 Water Quality Calibration for Dissolved Oxygen based on July 2001 Survey Orginated: January 10, 2002
Page 24
35 15.800 8.23 5.82 0.18 0.06 0.00 4.37 4.37 4.37 0.17 0.06 0.59 0.00 0.00 0.00 0.38 0.00 0.00 0.03 0.0636 15.700 8.23 5.83 0.18 0.06 0.00 4.37 4.37 4.37 0.17 0.06 0.59 0.00 0.00 0.00 0.37 0.00 0.00 0.03 0.0637 15.600 8.23 5.84 0.18 0.06 0.00 4.37 4.37 4.37 0.17 0.06 0.59 0.00 0.00 0.00 0.36 0.00 0.00 0.03 0.0638 15.500 8.23 5.85 0.18 0.06 0.00 4.37 4.37 4.37 0.17 0.06 0.59 0.00 0.00 0.00 0.36 0.00 0.00 0.03 0.0639 15.400 8.23 5.85 0.18 0.06 0.00 4.37 4.37 4.37 0.17 0.06 0.59 0.00 0.00 0.00 0.35 0.00 0.00 0.03 0.0640 15.300 8.23 5.86 0.18 0.06 0.00 4.37 4.37 4.37 0.17 0.06 0.59 0.00 0.00 0.00 0.34 0.00 0.00 0.03 0.0641 15.200 8.23 5.87 0.18 0.06 0.00 4.37 4.37 4.37 0.17 0.06 0.59 0.00 0.00 0.00 0.33 0.00 0.00 0.03 0.0642 15.100 8.23 5.88 0.18 0.06 0.00 4.37 4.37 4.37 0.17 0.06 0.59 0.00 0.00 0.00 0.33 0.00 0.00 0.03 0.0643 15.000 8.23 5.88 0.18 0.06 0.00 4.37 4.37 4.37 0.17 0.06 0.59 0.00 0.00 0.00 0.32 0.00 0.00 0.03 0.0644 14.900 8.23 5.89 0.18 0.06 0.00 4.37 4.37 4.37 0.17 0.06 0.59 0.00 0.00 0.00 0.31 0.00 0.00 0.03 0.0645 14.800 8.23 5.90 0.18 0.06 0.00 4.37 4.37 4.37 0.17 0.06 0.59 0.00 0.00 0.00 0.30 0.00 0.00 0.03 0.0646 14.700 8.23 5.91 0.18 0.06 0.00 4.37 4.37 4.37 0.17 0.06 0.60 0.00 0.00 0.00 0.30 0.00 0.00 0.03 0.0647 14.600 8.23 5.91 0.18 0.06 0.00 4.37 4.37 4.37 0.17 0.06 0.60 0.00 0.00 0.00 0.29 0.00 0.00 0.03 0.0648 14.500 8.23 5.92 0.18 0.06 0.00 4.37 4.37 4.37 0.17 0.06 0.60 0.00 0.00 0.00 0.28 0.00 0.00 0.03 0.0649 14.400 8.23 5.93 0.18 0.06 0.00 4.37 4.37 4.37 0.17 0.06 0.60 0.00 0.00 0.00 0.28 0.00 0.00 0.03 0.0650 14.300 8.23 5.94 0.18 0.06 0.00 4.37 4.37 4.37 0.17 0.06 0.60 0.00 0.00 0.00 0.27 0.00 0.00 0.03 0.0651 14.200 8.23 5.94 0.18 0.06 0.00 4.37 4.37 4.37 0.17 0.06 0.60 0.00 0.00 0.00 0.26 0.00 0.00 0.03 0.0652 14.100 8.23 5.95 0.18 0.06 0.00 4.37 4.37 4.37 0.17 0.06 0.60 0.00 0.00 0.00 0.25 0.00 0.00 0.03 0.06
20 DEG C RATE 0.14 0.00 3.15 0.14 0.50 0.00 0.00 0.00 0.00 0.02AVG 20 DEG C RATE 5.32 0.05 0.05 0.05
* g/sq m/d ** mg/L/day
************************************************ WATER QUALITY CONSTITUENT VALUES *************************************************
ELEM ENDING TEMP SALN CM-I CM-II DO BOD EBOD ORGN NH3 NO3+2 TOTN PHOS CHL A MACRO COLI NCMNO. DIST DEG C PPT * * mg/L mg/L mg/L mg/L mg/L mg/L mg/L mg/L µg/L ** #/100mL *
32 16.100 25.21 0.00 0.00 0.00 3.01 3.89 4.52 0.79 0.05 0.05 0.89 0.00 6.29 25.95 0.00 7.2633 16.000 25.21 0.00 0.00 0.00 2.94 3.87 4.48 0.80 0.06 0.05 0.90 0.00 6.17 26.90 0.00 7.3134 15.900 25.21 0.00 0.00 0.00 2.90 3.84 4.45 0.80 0.06 0.04 0.90 0.00 6.06 27.86 0.00 7.3635 15.800 25.21 0.00 0.00 0.00 2.89 3.82 4.42 0.80 0.06 0.04 0.91 0.00 5.94 28.81 0.00 7.4036 15.700 25.21 0.00 0.00 0.00 2.89 3.81 4.39 0.80 0.07 0.04 0.91 0.00 5.83 29.76 0.00 7.4437 15.600 25.21 0.00 0.00 0.00 2.89 3.79 4.36 0.80 0.07 0.04 0.92 0.00 5.71 30.71 0.00 7.4938 15.500 25.21 0.00 0.00 0.00 2.90 3.77 4.33 0.81 0.07 0.04 0.92 0.00 5.60 31.67 0.00 7.5239 15.400 25.21 0.00 0.00 0.00 2.90 3.76 4.31 0.81 0.07 0.04 0.92 0.00 5.49 32.62 0.00 7.5640 15.300 25.21 0.00 0.00 0.00 2.91 3.74 4.28 0.81 0.07 0.04 0.92 0.00 5.37 33.57 0.00 7.6041 15.200 25.21 0.00 0.00 0.00 2.92 3.73 4.25 0.81 0.07 0.04 0.92 0.00 5.26 34.52 0.00 7.6342 15.100 25.21 0.00 0.00 0.00 2.93 3.71 4.23 0.81 0.07 0.04 0.92 0.00 5.14 35.48 0.00 7.6643 15.000 25.21 0.00 0.00 0.00 2.93 3.70 4.20 0.81 0.07 0.04 0.92 0.00 5.03 36.43 0.00 7.6944 14.900 25.21 0.00 0.00 0.00 2.94 3.69 4.18 0.81 0.07 0.04 0.92 0.00 4.91 37.38 0.00 7.7245 14.800 25.21 0.00 0.00 0.00 2.95 3.68 4.16 0.81 0.07 0.04 0.92 0.00 4.80 38.33 0.00 7.7546 14.700 25.21 0.00 0.00 0.00 2.96 3.67 4.14 0.81 0.07 0.03 0.92 0.00 4.69 39.29 0.00 7.7847 14.600 25.21 0.00 0.00 0.00 2.97 3.66 4.11 0.81 0.07 0.03 0.92 0.00 4.57 40.24 0.00 7.8048 14.500 25.21 0.00 0.00 0.00 2.98 3.65 4.09 0.81 0.07 0.03 0.92 0.00 4.46 41.19 0.00 7.8249 14.400 25.21 0.00 0.00 0.00 2.99 3.64 4.07 0.81 0.07 0.03 0.91 0.00 4.34 42.14 0.00 7.8550 14.300 25.21 0.00 0.00 0.00 3.00 3.63 4.05 0.81 0.07 0.03 0.91 0.00 4.23 43.10 0.00 7.8751 14.200 25.21 0.00 0.00 0.00 3.00 3.62 4.03 0.81 0.07 0.03 0.91 0.00 4.11 44.05 0.00 7.8952 14.100 25.21 0.00 0.00 0.00 3.00 3.61 4.01 0.81 0.07 0.02 0.91 0.00 4.00 45.00 0.00 7.92
* CM-I = CHLORIDES CM-II = SULFATES NCM = CBOD2MG/L MG/L MG/L
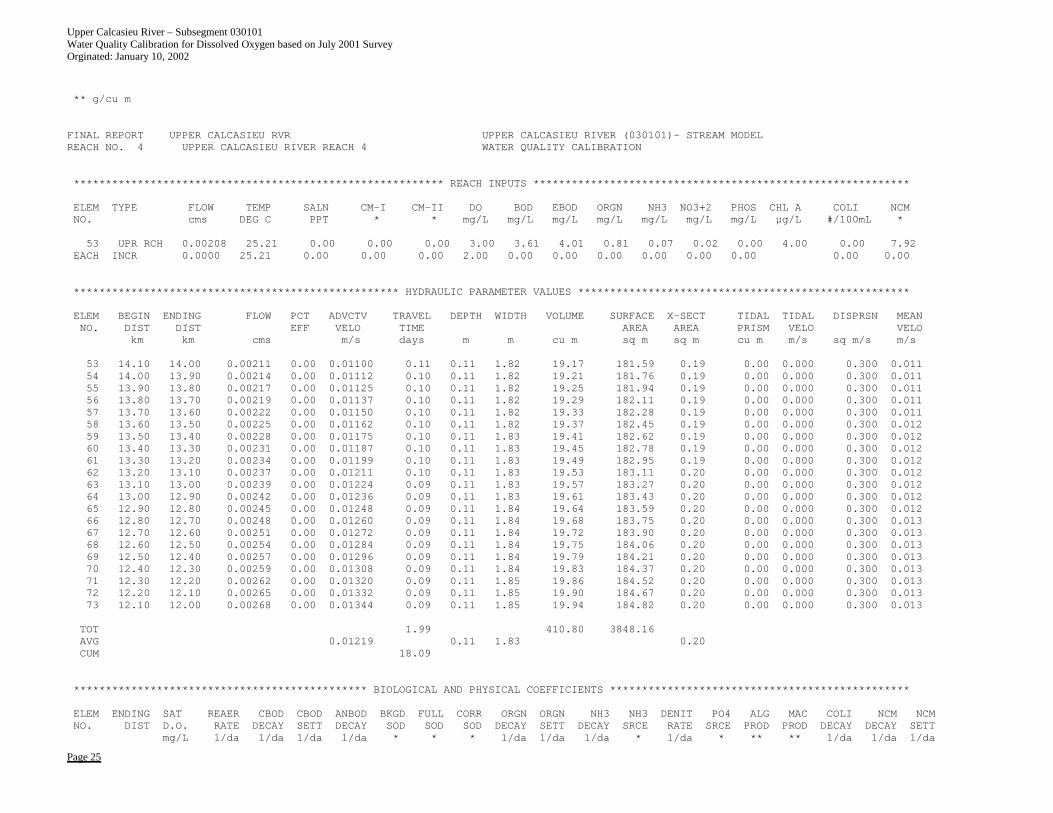
Upper Calcasieu River – Subsegment 030101 Water Quality Calibration for Dissolved Oxygen based on July 2001 Survey Orginated: January 10, 2002
Page 25
** g/cu m
FINAL REPORT UPPER CALCASIEU RVR UPPER CALCASIEU RIVER (030101)- STREAM MODELREACH NO. 4 UPPER CALCASIEU RIVER REACH 4 WATER QUALITY CALIBRATION
********************************************************** REACH INPUTS ***********************************************************
ELEM TYPE FLOW TEMP SALN CM-I CM-II DO BOD EBOD ORGN NH3 NO3+2 PHOS CHL A COLI NCMNO. cms DEG C PPT * * mg/L mg/L mg/L mg/L mg/L mg/L mg/L µg/L #/100mL *
53 UPR RCH 0.00208 25.21 0.00 0.00 0.00 3.00 3.61 4.01 0.81 0.07 0.02 0.00 4.00 0.00 7.92EACH INCR 0.0000 25.21 0.00 0.00 0.00 2.00 0.00 0.00 0.00 0.00 0.00 0.00 0.00 0.00
*************************************************** HYDRAULIC PARAMETER VALUES ****************************************************
ELEM BEGIN ENDING FLOW PCT ADVCTV TRAVEL DEPTH WIDTH VOLUME SURFACE X-SECT TIDAL TIDAL DISPRSN MEANNO. DIST DIST EFF VELO TIME AREA AREA PRISM VELO VELO
km km cms m/s days m m cu m sq m sq m cu m m/s sq m/s m/s
53 14.10 14.00 0.00211 0.00 0.01100 0.11 0.11 1.82 19.17 181.59 0.19 0.00 0.000 0.300 0.01154 14.00 13.90 0.00214 0.00 0.01112 0.10 0.11 1.82 19.21 181.76 0.19 0.00 0.000 0.300 0.01155 13.90 13.80 0.00217 0.00 0.01125 0.10 0.11 1.82 19.25 181.94 0.19 0.00 0.000 0.300 0.01156 13.80 13.70 0.00219 0.00 0.01137 0.10 0.11 1.82 19.29 182.11 0.19 0.00 0.000 0.300 0.01157 13.70 13.60 0.00222 0.00 0.01150 0.10 0.11 1.82 19.33 182.28 0.19 0.00 0.000 0.300 0.01158 13.60 13.50 0.00225 0.00 0.01162 0.10 0.11 1.82 19.37 182.45 0.19 0.00 0.000 0.300 0.01259 13.50 13.40 0.00228 0.00 0.01175 0.10 0.11 1.83 19.41 182.62 0.19 0.00 0.000 0.300 0.01260 13.40 13.30 0.00231 0.00 0.01187 0.10 0.11 1.83 19.45 182.78 0.19 0.00 0.000 0.300 0.01261 13.30 13.20 0.00234 0.00 0.01199 0.10 0.11 1.83 19.49 182.95 0.19 0.00 0.000 0.300 0.01262 13.20 13.10 0.00237 0.00 0.01211 0.10 0.11 1.83 19.53 183.11 0.20 0.00 0.000 0.300 0.01263 13.10 13.00 0.00239 0.00 0.01224 0.09 0.11 1.83 19.57 183.27 0.20 0.00 0.000 0.300 0.01264 13.00 12.90 0.00242 0.00 0.01236 0.09 0.11 1.83 19.61 183.43 0.20 0.00 0.000 0.300 0.01265 12.90 12.80 0.00245 0.00 0.01248 0.09 0.11 1.84 19.64 183.59 0.20 0.00 0.000 0.300 0.01266 12.80 12.70 0.00248 0.00 0.01260 0.09 0.11 1.84 19.68 183.75 0.20 0.00 0.000 0.300 0.01367 12.70 12.60 0.00251 0.00 0.01272 0.09 0.11 1.84 19.72 183.90 0.20 0.00 0.000 0.300 0.01368 12.60 12.50 0.00254 0.00 0.01284 0.09 0.11 1.84 19.75 184.06 0.20 0.00 0.000 0.300 0.01369 12.50 12.40 0.00257 0.00 0.01296 0.09 0.11 1.84 19.79 184.21 0.20 0.00 0.000 0.300 0.01370 12.40 12.30 0.00259 0.00 0.01308 0.09 0.11 1.84 19.83 184.37 0.20 0.00 0.000 0.300 0.01371 12.30 12.20 0.00262 0.00 0.01320 0.09 0.11 1.85 19.86 184.52 0.20 0.00 0.000 0.300 0.01372 12.20 12.10 0.00265 0.00 0.01332 0.09 0.11 1.85 19.90 184.67 0.20 0.00 0.000 0.300 0.01373 12.10 12.00 0.00268 0.00 0.01344 0.09 0.11 1.85 19.94 184.82 0.20 0.00 0.000 0.300 0.013
TOT 1.99 410.80 3848.16AVG 0.01219 0.11 1.83 0.20CUM 18.09
********************************************** BIOLOGICAL AND PHYSICAL COEFFICIENTS ***********************************************
ELEM ENDING SAT REAER CBOD CBOD ANBOD BKGD FULL CORR ORGN ORGN NH3 NH3 DENIT PO4 ALG MAC COLI NCM NCMNO. DIST D.O. RATE DECAY SETT DECAY SOD SOD SOD DECAY SETT DECAY SRCE RATE SRCE PROD PROD DECAY DECAY SETT
mg/L 1/da 1/da 1/da 1/da * * * 1/da 1/da 1/da * 1/da * ** ** 1/da 1/da 1/da
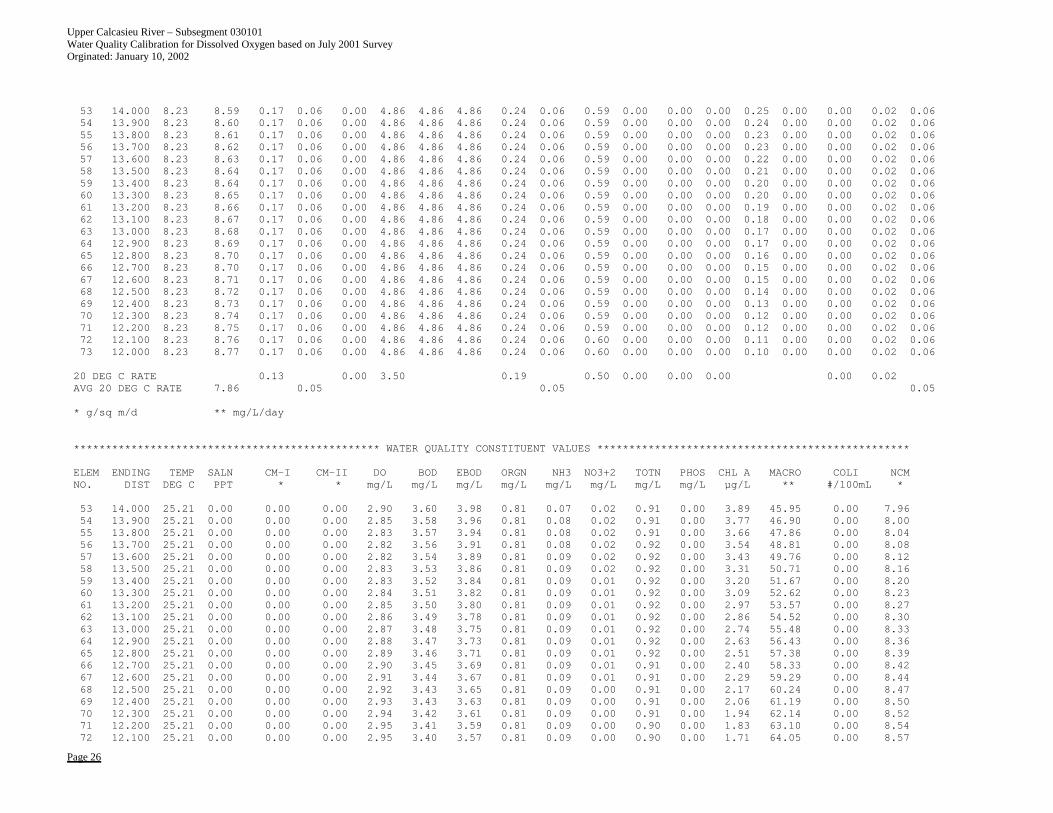
Upper Calcasieu River – Subsegment 030101 Water Quality Calibration for Dissolved Oxygen based on July 2001 Survey Orginated: January 10, 2002
Page 26
53 14.000 8.23 8.59 0.17 0.06 0.00 4.86 4.86 4.86 0.24 0.06 0.59 0.00 0.00 0.00 0.25 0.00 0.00 0.02 0.0654 13.900 8.23 8.60 0.17 0.06 0.00 4.86 4.86 4.86 0.24 0.06 0.59 0.00 0.00 0.00 0.24 0.00 0.00 0.02 0.0655 13.800 8.23 8.61 0.17 0.06 0.00 4.86 4.86 4.86 0.24 0.06 0.59 0.00 0.00 0.00 0.23 0.00 0.00 0.02 0.0656 13.700 8.23 8.62 0.17 0.06 0.00 4.86 4.86 4.86 0.24 0.06 0.59 0.00 0.00 0.00 0.23 0.00 0.00 0.02 0.0657 13.600 8.23 8.63 0.17 0.06 0.00 4.86 4.86 4.86 0.24 0.06 0.59 0.00 0.00 0.00 0.22 0.00 0.00 0.02 0.0658 13.500 8.23 8.64 0.17 0.06 0.00 4.86 4.86 4.86 0.24 0.06 0.59 0.00 0.00 0.00 0.21 0.00 0.00 0.02 0.0659 13.400 8.23 8.64 0.17 0.06 0.00 4.86 4.86 4.86 0.24 0.06 0.59 0.00 0.00 0.00 0.20 0.00 0.00 0.02 0.0660 13.300 8.23 8.65 0.17 0.06 0.00 4.86 4.86 4.86 0.24 0.06 0.59 0.00 0.00 0.00 0.20 0.00 0.00 0.02 0.0661 13.200 8.23 8.66 0.17 0.06 0.00 4.86 4.86 4.86 0.24 0.06 0.59 0.00 0.00 0.00 0.19 0.00 0.00 0.02 0.0662 13.100 8.23 8.67 0.17 0.06 0.00 4.86 4.86 4.86 0.24 0.06 0.59 0.00 0.00 0.00 0.18 0.00 0.00 0.02 0.0663 13.000 8.23 8.68 0.17 0.06 0.00 4.86 4.86 4.86 0.24 0.06 0.59 0.00 0.00 0.00 0.17 0.00 0.00 0.02 0.0664 12.900 8.23 8.69 0.17 0.06 0.00 4.86 4.86 4.86 0.24 0.06 0.59 0.00 0.00 0.00 0.17 0.00 0.00 0.02 0.0665 12.800 8.23 8.70 0.17 0.06 0.00 4.86 4.86 4.86 0.24 0.06 0.59 0.00 0.00 0.00 0.16 0.00 0.00 0.02 0.0666 12.700 8.23 8.70 0.17 0.06 0.00 4.86 4.86 4.86 0.24 0.06 0.59 0.00 0.00 0.00 0.15 0.00 0.00 0.02 0.0667 12.600 8.23 8.71 0.17 0.06 0.00 4.86 4.86 4.86 0.24 0.06 0.59 0.00 0.00 0.00 0.15 0.00 0.00 0.02 0.0668 12.500 8.23 8.72 0.17 0.06 0.00 4.86 4.86 4.86 0.24 0.06 0.59 0.00 0.00 0.00 0.14 0.00 0.00 0.02 0.0669 12.400 8.23 8.73 0.17 0.06 0.00 4.86 4.86 4.86 0.24 0.06 0.59 0.00 0.00 0.00 0.13 0.00 0.00 0.02 0.0670 12.300 8.23 8.74 0.17 0.06 0.00 4.86 4.86 4.86 0.24 0.06 0.59 0.00 0.00 0.00 0.12 0.00 0.00 0.02 0.0671 12.200 8.23 8.75 0.17 0.06 0.00 4.86 4.86 4.86 0.24 0.06 0.59 0.00 0.00 0.00 0.12 0.00 0.00 0.02 0.0672 12.100 8.23 8.76 0.17 0.06 0.00 4.86 4.86 4.86 0.24 0.06 0.60 0.00 0.00 0.00 0.11 0.00 0.00 0.02 0.0673 12.000 8.23 8.77 0.17 0.06 0.00 4.86 4.86 4.86 0.24 0.06 0.60 0.00 0.00 0.00 0.10 0.00 0.00 0.02 0.06
20 DEG C RATE 0.13 0.00 3.50 0.19 0.50 0.00 0.00 0.00 0.00 0.02AVG 20 DEG C RATE 7.86 0.05 0.05 0.05
* g/sq m/d ** mg/L/day
************************************************ WATER QUALITY CONSTITUENT VALUES *************************************************
ELEM ENDING TEMP SALN CM-I CM-II DO BOD EBOD ORGN NH3 NO3+2 TOTN PHOS CHL A MACRO COLI NCMNO. DIST DEG C PPT * * mg/L mg/L mg/L mg/L mg/L mg/L mg/L mg/L µg/L ** #/100mL *
53 14.000 25.21 0.00 0.00 0.00 2.90 3.60 3.98 0.81 0.07 0.02 0.91 0.00 3.89 45.95 0.00 7.9654 13.900 25.21 0.00 0.00 0.00 2.85 3.58 3.96 0.81 0.08 0.02 0.91 0.00 3.77 46.90 0.00 8.0055 13.800 25.21 0.00 0.00 0.00 2.83 3.57 3.94 0.81 0.08 0.02 0.91 0.00 3.66 47.86 0.00 8.0456 13.700 25.21 0.00 0.00 0.00 2.82 3.56 3.91 0.81 0.08 0.02 0.92 0.00 3.54 48.81 0.00 8.0857 13.600 25.21 0.00 0.00 0.00 2.82 3.54 3.89 0.81 0.09 0.02 0.92 0.00 3.43 49.76 0.00 8.1258 13.500 25.21 0.00 0.00 0.00 2.83 3.53 3.86 0.81 0.09 0.02 0.92 0.00 3.31 50.71 0.00 8.1659 13.400 25.21 0.00 0.00 0.00 2.83 3.52 3.84 0.81 0.09 0.01 0.92 0.00 3.20 51.67 0.00 8.2060 13.300 25.21 0.00 0.00 0.00 2.84 3.51 3.82 0.81 0.09 0.01 0.92 0.00 3.09 52.62 0.00 8.2361 13.200 25.21 0.00 0.00 0.00 2.85 3.50 3.80 0.81 0.09 0.01 0.92 0.00 2.97 53.57 0.00 8.2762 13.100 25.21 0.00 0.00 0.00 2.86 3.49 3.78 0.81 0.09 0.01 0.92 0.00 2.86 54.52 0.00 8.3063 13.000 25.21 0.00 0.00 0.00 2.87 3.48 3.75 0.81 0.09 0.01 0.92 0.00 2.74 55.48 0.00 8.3364 12.900 25.21 0.00 0.00 0.00 2.88 3.47 3.73 0.81 0.09 0.01 0.92 0.00 2.63 56.43 0.00 8.3665 12.800 25.21 0.00 0.00 0.00 2.89 3.46 3.71 0.81 0.09 0.01 0.92 0.00 2.51 57.38 0.00 8.3966 12.700 25.21 0.00 0.00 0.00 2.90 3.45 3.69 0.81 0.09 0.01 0.91 0.00 2.40 58.33 0.00 8.4267 12.600 25.21 0.00 0.00 0.00 2.91 3.44 3.67 0.81 0.09 0.01 0.91 0.00 2.29 59.29 0.00 8.4468 12.500 25.21 0.00 0.00 0.00 2.92 3.43 3.65 0.81 0.09 0.00 0.91 0.00 2.17 60.24 0.00 8.4769 12.400 25.21 0.00 0.00 0.00 2.93 3.43 3.63 0.81 0.09 0.00 0.91 0.00 2.06 61.19 0.00 8.5070 12.300 25.21 0.00 0.00 0.00 2.94 3.42 3.61 0.81 0.09 0.00 0.91 0.00 1.94 62.14 0.00 8.5271 12.200 25.21 0.00 0.00 0.00 2.95 3.41 3.59 0.81 0.09 0.00 0.90 0.00 1.83 63.10 0.00 8.5472 12.100 25.21 0.00 0.00 0.00 2.95 3.40 3.57 0.81 0.09 0.00 0.90 0.00 1.71 64.05 0.00 8.57
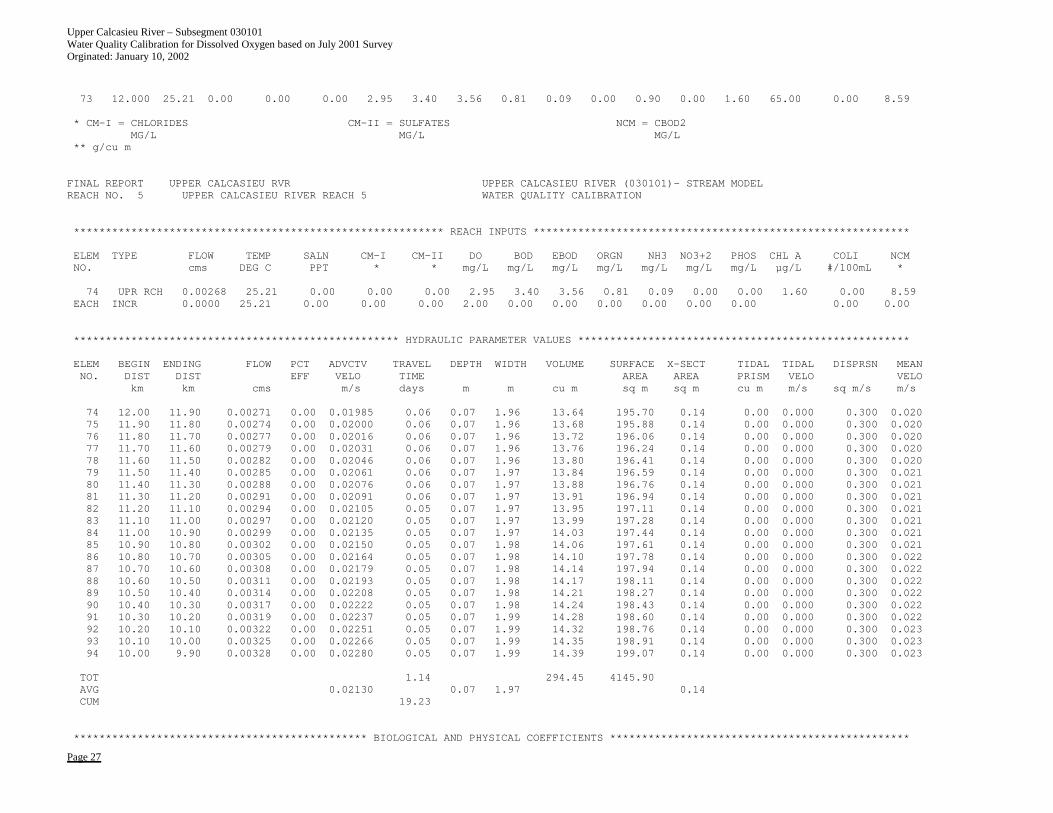
Upper Calcasieu River – Subsegment 030101 Water Quality Calibration for Dissolved Oxygen based on July 2001 Survey Orginated: January 10, 2002
Page 27
73 12.000 25.21 0.00 0.00 0.00 2.95 3.40 3.56 0.81 0.09 0.00 0.90 0.00 1.60 65.00 0.00 8.59
* CM-I = CHLORIDES CM-II = SULFATES NCM = CBOD2MG/L MG/L MG/L
** g/cu m
FINAL REPORT UPPER CALCASIEU RVR UPPER CALCASIEU RIVER (030101)- STREAM MODELREACH NO. 5 UPPER CALCASIEU RIVER REACH 5 WATER QUALITY CALIBRATION
********************************************************** REACH INPUTS ***********************************************************
ELEM TYPE FLOW TEMP SALN CM-I CM-II DO BOD EBOD ORGN NH3 NO3+2 PHOS CHL A COLI NCMNO. cms DEG C PPT * * mg/L mg/L mg/L mg/L mg/L mg/L mg/L µg/L #/100mL *
74 UPR RCH 0.00268 25.21 0.00 0.00 0.00 2.95 3.40 3.56 0.81 0.09 0.00 0.00 1.60 0.00 8.59EACH INCR 0.0000 25.21 0.00 0.00 0.00 2.00 0.00 0.00 0.00 0.00 0.00 0.00 0.00 0.00
*************************************************** HYDRAULIC PARAMETER VALUES ****************************************************
ELEM BEGIN ENDING FLOW PCT ADVCTV TRAVEL DEPTH WIDTH VOLUME SURFACE X-SECT TIDAL TIDAL DISPRSN MEANNO. DIST DIST EFF VELO TIME AREA AREA PRISM VELO VELO
km km cms m/s days m m cu m sq m sq m cu m m/s sq m/s m/s
74 12.00 11.90 0.00271 0.00 0.01985 0.06 0.07 1.96 13.64 195.70 0.14 0.00 0.000 0.300 0.02075 11.90 11.80 0.00274 0.00 0.02000 0.06 0.07 1.96 13.68 195.88 0.14 0.00 0.000 0.300 0.02076 11.80 11.70 0.00277 0.00 0.02016 0.06 0.07 1.96 13.72 196.06 0.14 0.00 0.000 0.300 0.02077 11.70 11.60 0.00279 0.00 0.02031 0.06 0.07 1.96 13.76 196.24 0.14 0.00 0.000 0.300 0.02078 11.60 11.50 0.00282 0.00 0.02046 0.06 0.07 1.96 13.80 196.41 0.14 0.00 0.000 0.300 0.02079 11.50 11.40 0.00285 0.00 0.02061 0.06 0.07 1.97 13.84 196.59 0.14 0.00 0.000 0.300 0.02180 11.40 11.30 0.00288 0.00 0.02076 0.06 0.07 1.97 13.88 196.76 0.14 0.00 0.000 0.300 0.02181 11.30 11.20 0.00291 0.00 0.02091 0.06 0.07 1.97 13.91 196.94 0.14 0.00 0.000 0.300 0.02182 11.20 11.10 0.00294 0.00 0.02105 0.05 0.07 1.97 13.95 197.11 0.14 0.00 0.000 0.300 0.02183 11.10 11.00 0.00297 0.00 0.02120 0.05 0.07 1.97 13.99 197.28 0.14 0.00 0.000 0.300 0.02184 11.00 10.90 0.00299 0.00 0.02135 0.05 0.07 1.97 14.03 197.44 0.14 0.00 0.000 0.300 0.02185 10.90 10.80 0.00302 0.00 0.02150 0.05 0.07 1.98 14.06 197.61 0.14 0.00 0.000 0.300 0.02186 10.80 10.70 0.00305 0.00 0.02164 0.05 0.07 1.98 14.10 197.78 0.14 0.00 0.000 0.300 0.02287 10.70 10.60 0.00308 0.00 0.02179 0.05 0.07 1.98 14.14 197.94 0.14 0.00 0.000 0.300 0.02288 10.60 10.50 0.00311 0.00 0.02193 0.05 0.07 1.98 14.17 198.11 0.14 0.00 0.000 0.300 0.02289 10.50 10.40 0.00314 0.00 0.02208 0.05 0.07 1.98 14.21 198.27 0.14 0.00 0.000 0.300 0.02290 10.40 10.30 0.00317 0.00 0.02222 0.05 0.07 1.98 14.24 198.43 0.14 0.00 0.000 0.300 0.02291 10.30 10.20 0.00319 0.00 0.02237 0.05 0.07 1.99 14.28 198.60 0.14 0.00 0.000 0.300 0.02292 10.20 10.10 0.00322 0.00 0.02251 0.05 0.07 1.99 14.32 198.76 0.14 0.00 0.000 0.300 0.02393 10.10 10.00 0.00325 0.00 0.02266 0.05 0.07 1.99 14.35 198.91 0.14 0.00 0.000 0.300 0.02394 10.00 9.90 0.00328 0.00 0.02280 0.05 0.07 1.99 14.39 199.07 0.14 0.00 0.000 0.300 0.023
TOT 1.14 294.45 4145.90AVG 0.02130 0.07 1.97 0.14CUM 19.23
********************************************** BIOLOGICAL AND PHYSICAL COEFFICIENTS ***********************************************
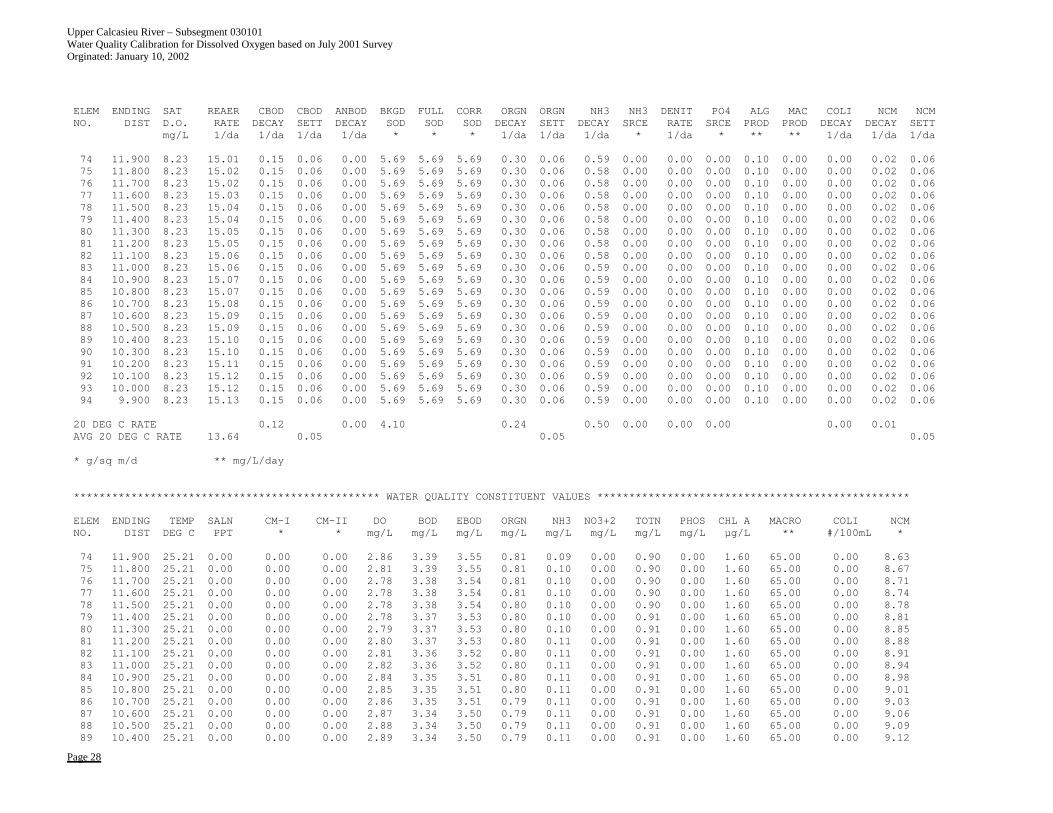
Upper Calcasieu River – Subsegment 030101 Water Quality Calibration for Dissolved Oxygen based on July 2001 Survey Orginated: January 10, 2002
Page 28
ELEM ENDING SAT REAER CBOD CBOD ANBOD BKGD FULL CORR ORGN ORGN NH3 NH3 DENIT PO4 ALG MAC COLI NCM NCMNO. DIST D.O. RATE DECAY SETT DECAY SOD SOD SOD DECAY SETT DECAY SRCE RATE SRCE PROD PROD DECAY DECAY SETT
mg/L 1/da 1/da 1/da 1/da * * * 1/da 1/da 1/da * 1/da * ** ** 1/da 1/da 1/da
74 11.900 8.23 15.01 0.15 0.06 0.00 5.69 5.69 5.69 0.30 0.06 0.59 0.00 0.00 0.00 0.10 0.00 0.00 0.02 0.0675 11.800 8.23 15.02 0.15 0.06 0.00 5.69 5.69 5.69 0.30 0.06 0.58 0.00 0.00 0.00 0.10 0.00 0.00 0.02 0.0676 11.700 8.23 15.02 0.15 0.06 0.00 5.69 5.69 5.69 0.30 0.06 0.58 0.00 0.00 0.00 0.10 0.00 0.00 0.02 0.0677 11.600 8.23 15.03 0.15 0.06 0.00 5.69 5.69 5.69 0.30 0.06 0.58 0.00 0.00 0.00 0.10 0.00 0.00 0.02 0.0678 11.500 8.23 15.04 0.15 0.06 0.00 5.69 5.69 5.69 0.30 0.06 0.58 0.00 0.00 0.00 0.10 0.00 0.00 0.02 0.0679 11.400 8.23 15.04 0.15 0.06 0.00 5.69 5.69 5.69 0.30 0.06 0.58 0.00 0.00 0.00 0.10 0.00 0.00 0.02 0.0680 11.300 8.23 15.05 0.15 0.06 0.00 5.69 5.69 5.69 0.30 0.06 0.58 0.00 0.00 0.00 0.10 0.00 0.00 0.02 0.0681 11.200 8.23 15.05 0.15 0.06 0.00 5.69 5.69 5.69 0.30 0.06 0.58 0.00 0.00 0.00 0.10 0.00 0.00 0.02 0.0682 11.100 8.23 15.06 0.15 0.06 0.00 5.69 5.69 5.69 0.30 0.06 0.58 0.00 0.00 0.00 0.10 0.00 0.00 0.02 0.0683 11.000 8.23 15.06 0.15 0.06 0.00 5.69 5.69 5.69 0.30 0.06 0.59 0.00 0.00 0.00 0.10 0.00 0.00 0.02 0.0684 10.900 8.23 15.07 0.15 0.06 0.00 5.69 5.69 5.69 0.30 0.06 0.59 0.00 0.00 0.00 0.10 0.00 0.00 0.02 0.0685 10.800 8.23 15.07 0.15 0.06 0.00 5.69 5.69 5.69 0.30 0.06 0.59 0.00 0.00 0.00 0.10 0.00 0.00 0.02 0.0686 10.700 8.23 15.08 0.15 0.06 0.00 5.69 5.69 5.69 0.30 0.06 0.59 0.00 0.00 0.00 0.10 0.00 0.00 0.02 0.0687 10.600 8.23 15.09 0.15 0.06 0.00 5.69 5.69 5.69 0.30 0.06 0.59 0.00 0.00 0.00 0.10 0.00 0.00 0.02 0.0688 10.500 8.23 15.09 0.15 0.06 0.00 5.69 5.69 5.69 0.30 0.06 0.59 0.00 0.00 0.00 0.10 0.00 0.00 0.02 0.0689 10.400 8.23 15.10 0.15 0.06 0.00 5.69 5.69 5.69 0.30 0.06 0.59 0.00 0.00 0.00 0.10 0.00 0.00 0.02 0.0690 10.300 8.23 15.10 0.15 0.06 0.00 5.69 5.69 5.69 0.30 0.06 0.59 0.00 0.00 0.00 0.10 0.00 0.00 0.02 0.0691 10.200 8.23 15.11 0.15 0.06 0.00 5.69 5.69 5.69 0.30 0.06 0.59 0.00 0.00 0.00 0.10 0.00 0.00 0.02 0.0692 10.100 8.23 15.12 0.15 0.06 0.00 5.69 5.69 5.69 0.30 0.06 0.59 0.00 0.00 0.00 0.10 0.00 0.00 0.02 0.0693 10.000 8.23 15.12 0.15 0.06 0.00 5.69 5.69 5.69 0.30 0.06 0.59 0.00 0.00 0.00 0.10 0.00 0.00 0.02 0.0694 9.900 8.23 15.13 0.15 0.06 0.00 5.69 5.69 5.69 0.30 0.06 0.59 0.00 0.00 0.00 0.10 0.00 0.00 0.02 0.06
20 DEG C RATE 0.12 0.00 4.10 0.24 0.50 0.00 0.00 0.00 0.00 0.01AVG 20 DEG C RATE 13.64 0.05 0.05 0.05
* g/sq m/d ** mg/L/day
************************************************ WATER QUALITY CONSTITUENT VALUES *************************************************
ELEM ENDING TEMP SALN CM-I CM-II DO BOD EBOD ORGN NH3 NO3+2 TOTN PHOS CHL A MACRO COLI NCMNO. DIST DEG C PPT * * mg/L mg/L mg/L mg/L mg/L mg/L mg/L mg/L µg/L ** #/100mL *
74 11.900 25.21 0.00 0.00 0.00 2.86 3.39 3.55 0.81 0.09 0.00 0.90 0.00 1.60 65.00 0.00 8.6375 11.800 25.21 0.00 0.00 0.00 2.81 3.39 3.55 0.81 0.10 0.00 0.90 0.00 1.60 65.00 0.00 8.6776 11.700 25.21 0.00 0.00 0.00 2.78 3.38 3.54 0.81 0.10 0.00 0.90 0.00 1.60 65.00 0.00 8.7177 11.600 25.21 0.00 0.00 0.00 2.78 3.38 3.54 0.81 0.10 0.00 0.90 0.00 1.60 65.00 0.00 8.7478 11.500 25.21 0.00 0.00 0.00 2.78 3.38 3.54 0.80 0.10 0.00 0.90 0.00 1.60 65.00 0.00 8.7879 11.400 25.21 0.00 0.00 0.00 2.78 3.37 3.53 0.80 0.10 0.00 0.91 0.00 1.60 65.00 0.00 8.8180 11.300 25.21 0.00 0.00 0.00 2.79 3.37 3.53 0.80 0.10 0.00 0.91 0.00 1.60 65.00 0.00 8.8581 11.200 25.21 0.00 0.00 0.00 2.80 3.37 3.53 0.80 0.11 0.00 0.91 0.00 1.60 65.00 0.00 8.8882 11.100 25.21 0.00 0.00 0.00 2.81 3.36 3.52 0.80 0.11 0.00 0.91 0.00 1.60 65.00 0.00 8.9183 11.000 25.21 0.00 0.00 0.00 2.82 3.36 3.52 0.80 0.11 0.00 0.91 0.00 1.60 65.00 0.00 8.9484 10.900 25.21 0.00 0.00 0.00 2.84 3.35 3.51 0.80 0.11 0.00 0.91 0.00 1.60 65.00 0.00 8.9885 10.800 25.21 0.00 0.00 0.00 2.85 3.35 3.51 0.80 0.11 0.00 0.91 0.00 1.60 65.00 0.00 9.0186 10.700 25.21 0.00 0.00 0.00 2.86 3.35 3.51 0.79 0.11 0.00 0.91 0.00 1.60 65.00 0.00 9.0387 10.600 25.21 0.00 0.00 0.00 2.87 3.34 3.50 0.79 0.11 0.00 0.91 0.00 1.60 65.00 0.00 9.0688 10.500 25.21 0.00 0.00 0.00 2.88 3.34 3.50 0.79 0.11 0.00 0.91 0.00 1.60 65.00 0.00 9.0989 10.400 25.21 0.00 0.00 0.00 2.89 3.34 3.50 0.79 0.11 0.00 0.91 0.00 1.60 65.00 0.00 9.12

Upper Calcasieu River – Subsegment 030101 Water Quality Calibration for Dissolved Oxygen based on July 2001 Survey Orginated: January 10, 2002
Page 29
90 10.300 25.21 0.00 0.00 0.00 2.90 3.33 3.49 0.79 0.12 0.00 0.91 0.00 1.60 65.00 0.00 9.1491 10.200 25.21 0.00 0.00 0.00 2.91 3.33 3.49 0.79 0.12 0.00 0.91 0.00 1.60 65.00 0.00 9.1792 10.100 25.21 0.00 0.00 0.00 2.92 3.32 3.48 0.79 0.12 0.00 0.90 0.00 1.60 65.00 0.00 9.1993 10.000 25.21 0.00 0.00 0.00 2.93 3.32 3.48 0.79 0.12 0.00 0.90 0.00 1.60 65.00 0.00 9.2294 9.900 25.21 0.00 0.00 0.00 2.92 3.32 3.48 0.79 0.12 0.00 0.90 0.00 1.60 65.00 0.00 9.24
* CM-I = CHLORIDES CM-II = SULFATES NCM = CBOD2MG/L MG/L MG/L
** g/cu m
FINAL REPORT UPPER CALCASIEU RVR UPPER CALCASIEU RIVER (030101)- STREAM MODELREACH NO. 6 UPPER CALCASIEU RIVER REACH 6 WATER QUALITY CALIBRATION
********************************************************** REACH INPUTS ***********************************************************
ELEM TYPE FLOW TEMP SALN CM-I CM-II DO BOD EBOD ORGN NH3 NO3+2 PHOS CHL A COLI NCMNO. cms DEG C PPT * * mg/L mg/L mg/L mg/L mg/L mg/L mg/L µg/L #/100mL *
95 UPR RCH 0.00328 25.21 0.00 0.00 0.00 2.92 3.32 3.48 0.79 0.12 0.00 0.00 1.60 0.00 9.24EACH INCR 0.0000 25.21 0.00 0.00 0.00 2.00 0.00 0.00 0.00 0.00 0.00 0.00 0.00 0.00
*************************************************** HYDRAULIC PARAMETER VALUES ****************************************************
ELEM BEGIN ENDING FLOW PCT ADVCTV TRAVEL DEPTH WIDTH VOLUME SURFACE X-SECT TIDAL TIDAL DISPRSN MEANNO. DIST DIST EFF VELO TIME AREA AREA PRISM VELO VELO
km km cms m/s days m m cu m sq m sq m cu m m/s sq m/s m/s
95 9.90 9.80 0.00331 0.00 0.01741 0.07 0.08 2.32 19.01 232.22 0.19 0.00 0.000 0.300 0.01796 9.80 9.70 0.00334 0.00 0.01752 0.07 0.08 2.32 19.05 232.40 0.19 0.00 0.000 0.300 0.01897 9.70 9.60 0.00337 0.00 0.01763 0.07 0.08 2.33 19.09 232.58 0.19 0.00 0.000 0.300 0.01898 9.60 9.50 0.00339 0.00 0.01773 0.07 0.08 2.33 19.14 232.75 0.19 0.00 0.000 0.300 0.01899 9.50 9.40 0.00342 0.00 0.01784 0.06 0.08 2.33 19.18 232.93 0.19 0.00 0.000 0.300 0.018100 9.40 9.30 0.00345 0.00 0.01795 0.06 0.08 2.33 19.23 233.10 0.19 0.00 0.000 0.300 0.018101 9.30 9.20 0.00348 0.00 0.01806 0.06 0.08 2.33 19.27 233.27 0.19 0.00 0.000 0.300 0.018102 9.20 9.10 0.00351 0.00 0.01817 0.06 0.08 2.33 19.31 233.44 0.19 0.00 0.000 0.300 0.018103 9.10 9.00 0.00354 0.00 0.01827 0.06 0.08 2.34 19.36 233.61 0.19 0.00 0.000 0.300 0.018104 9.00 8.90 0.00357 0.00 0.01838 0.06 0.08 2.34 19.40 233.78 0.19 0.00 0.000 0.300 0.018105 8.90 8.80 0.00359 0.00 0.01849 0.06 0.08 2.34 19.44 233.95 0.19 0.00 0.000 0.300 0.018106 8.80 8.70 0.00362 0.00 0.01859 0.06 0.08 2.34 19.49 234.12 0.19 0.00 0.000 0.300 0.019107 8.70 8.60 0.00365 0.00 0.01870 0.06 0.08 2.34 19.53 234.28 0.20 0.00 0.000 0.300 0.019108 8.60 8.50 0.00368 0.00 0.01880 0.06 0.08 2.34 19.57 234.45 0.20 0.00 0.000 0.300 0.019109 8.50 8.40 0.00371 0.00 0.01891 0.06 0.08 2.35 19.61 234.61 0.20 0.00 0.000 0.300 0.019110 8.40 8.30 0.00374 0.00 0.01901 0.06 0.08 2.35 19.66 234.78 0.20 0.00 0.000 0.300 0.019111 8.30 8.20 0.00377 0.00 0.01912 0.06 0.08 2.35 19.70 234.94 0.20 0.00 0.000 0.300 0.019112 8.20 8.10 0.00379 0.00 0.01922 0.06 0.08 2.35 19.74 235.10 0.20 0.00 0.000 0.300 0.019113 8.10 8.00 0.00382 0.00 0.01933 0.06 0.08 2.35 19.78 235.26 0.20 0.00 0.000 0.300 0.019114 8.00 7.90 0.00385 0.00 0.01943 0.06 0.08 2.35 19.82 235.42 0.20 0.00 0.000 0.300 0.019115 7.90 7.80 0.00388 0.00 0.01953 0.06 0.08 2.36 19.86 235.58 0.20 0.00 0.000 0.300 0.020
TOT 1.32 408.24 4912.60AVG 0.01846 0.08 2.34 0.19
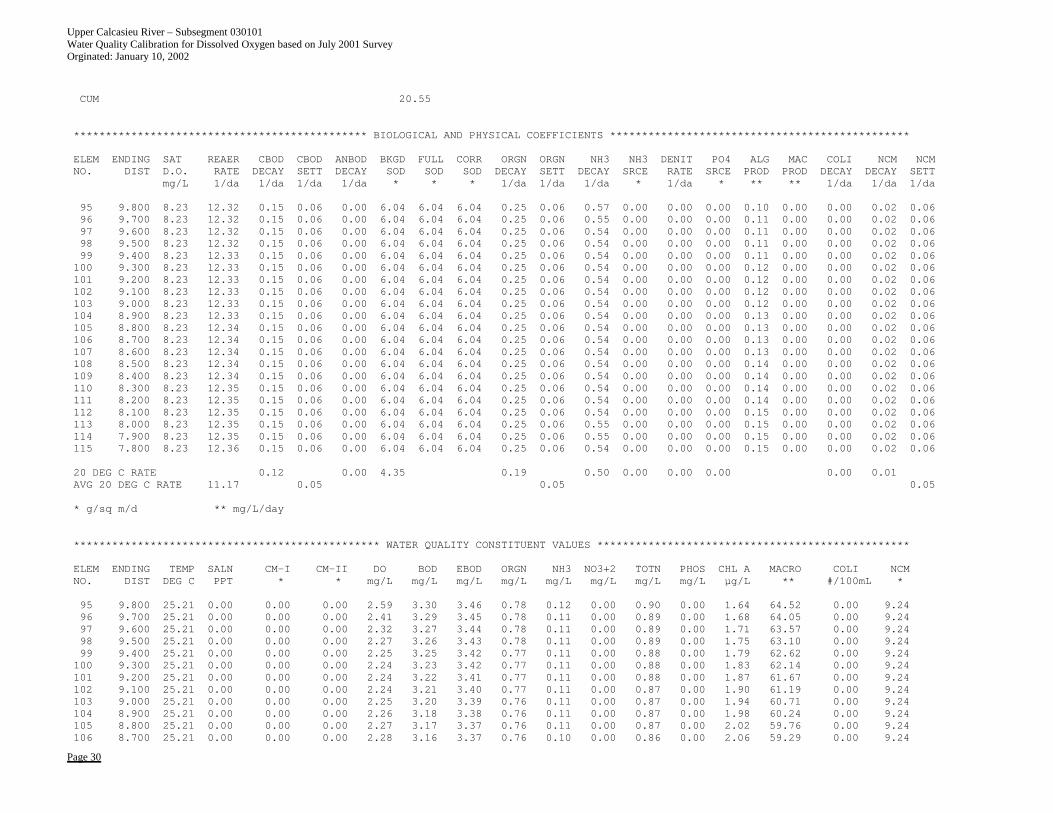
Upper Calcasieu River – Subsegment 030101 Water Quality Calibration for Dissolved Oxygen based on July 2001 Survey Orginated: January 10, 2002
Page 30
CUM 20.55
********************************************** BIOLOGICAL AND PHYSICAL COEFFICIENTS ***********************************************
ELEM ENDING SAT REAER CBOD CBOD ANBOD BKGD FULL CORR ORGN ORGN NH3 NH3 DENIT PO4 ALG MAC COLI NCM NCMNO. DIST D.O. RATE DECAY SETT DECAY SOD SOD SOD DECAY SETT DECAY SRCE RATE SRCE PROD PROD DECAY DECAY SETT
mg/L 1/da 1/da 1/da 1/da * * * 1/da 1/da 1/da * 1/da * ** ** 1/da 1/da 1/da
95 9.800 8.23 12.32 0.15 0.06 0.00 6.04 6.04 6.04 0.25 0.06 0.57 0.00 0.00 0.00 0.10 0.00 0.00 0.02 0.0696 9.700 8.23 12.32 0.15 0.06 0.00 6.04 6.04 6.04 0.25 0.06 0.55 0.00 0.00 0.00 0.11 0.00 0.00 0.02 0.0697 9.600 8.23 12.32 0.15 0.06 0.00 6.04 6.04 6.04 0.25 0.06 0.54 0.00 0.00 0.00 0.11 0.00 0.00 0.02 0.0698 9.500 8.23 12.32 0.15 0.06 0.00 6.04 6.04 6.04 0.25 0.06 0.54 0.00 0.00 0.00 0.11 0.00 0.00 0.02 0.0699 9.400 8.23 12.33 0.15 0.06 0.00 6.04 6.04 6.04 0.25 0.06 0.54 0.00 0.00 0.00 0.11 0.00 0.00 0.02 0.06100 9.300 8.23 12.33 0.15 0.06 0.00 6.04 6.04 6.04 0.25 0.06 0.54 0.00 0.00 0.00 0.12 0.00 0.00 0.02 0.06101 9.200 8.23 12.33 0.15 0.06 0.00 6.04 6.04 6.04 0.25 0.06 0.54 0.00 0.00 0.00 0.12 0.00 0.00 0.02 0.06102 9.100 8.23 12.33 0.15 0.06 0.00 6.04 6.04 6.04 0.25 0.06 0.54 0.00 0.00 0.00 0.12 0.00 0.00 0.02 0.06103 9.000 8.23 12.33 0.15 0.06 0.00 6.04 6.04 6.04 0.25 0.06 0.54 0.00 0.00 0.00 0.12 0.00 0.00 0.02 0.06104 8.900 8.23 12.33 0.15 0.06 0.00 6.04 6.04 6.04 0.25 0.06 0.54 0.00 0.00 0.00 0.13 0.00 0.00 0.02 0.06105 8.800 8.23 12.34 0.15 0.06 0.00 6.04 6.04 6.04 0.25 0.06 0.54 0.00 0.00 0.00 0.13 0.00 0.00 0.02 0.06106 8.700 8.23 12.34 0.15 0.06 0.00 6.04 6.04 6.04 0.25 0.06 0.54 0.00 0.00 0.00 0.13 0.00 0.00 0.02 0.06107 8.600 8.23 12.34 0.15 0.06 0.00 6.04 6.04 6.04 0.25 0.06 0.54 0.00 0.00 0.00 0.13 0.00 0.00 0.02 0.06108 8.500 8.23 12.34 0.15 0.06 0.00 6.04 6.04 6.04 0.25 0.06 0.54 0.00 0.00 0.00 0.14 0.00 0.00 0.02 0.06109 8.400 8.23 12.34 0.15 0.06 0.00 6.04 6.04 6.04 0.25 0.06 0.54 0.00 0.00 0.00 0.14 0.00 0.00 0.02 0.06110 8.300 8.23 12.35 0.15 0.06 0.00 6.04 6.04 6.04 0.25 0.06 0.54 0.00 0.00 0.00 0.14 0.00 0.00 0.02 0.06111 8.200 8.23 12.35 0.15 0.06 0.00 6.04 6.04 6.04 0.25 0.06 0.54 0.00 0.00 0.00 0.14 0.00 0.00 0.02 0.06112 8.100 8.23 12.35 0.15 0.06 0.00 6.04 6.04 6.04 0.25 0.06 0.54 0.00 0.00 0.00 0.15 0.00 0.00 0.02 0.06113 8.000 8.23 12.35 0.15 0.06 0.00 6.04 6.04 6.04 0.25 0.06 0.55 0.00 0.00 0.00 0.15 0.00 0.00 0.02 0.06114 7.900 8.23 12.35 0.15 0.06 0.00 6.04 6.04 6.04 0.25 0.06 0.55 0.00 0.00 0.00 0.15 0.00 0.00 0.02 0.06115 7.800 8.23 12.36 0.15 0.06 0.00 6.04 6.04 6.04 0.25 0.06 0.54 0.00 0.00 0.00 0.15 0.00 0.00 0.02 0.06
20 DEG C RATE 0.12 0.00 4.35 0.19 0.50 0.00 0.00 0.00 0.00 0.01AVG 20 DEG C RATE 11.17 0.05 0.05 0.05
* g/sq m/d ** mg/L/day
************************************************ WATER QUALITY CONSTITUENT VALUES *************************************************
ELEM ENDING TEMP SALN CM-I CM-II DO BOD EBOD ORGN NH3 NO3+2 TOTN PHOS CHL A MACRO COLI NCMNO. DIST DEG C PPT * * mg/L mg/L mg/L mg/L mg/L mg/L mg/L mg/L µg/L ** #/100mL *
95 9.800 25.21 0.00 0.00 0.00 2.59 3.30 3.46 0.78 0.12 0.00 0.90 0.00 1.64 64.52 0.00 9.2496 9.700 25.21 0.00 0.00 0.00 2.41 3.29 3.45 0.78 0.11 0.00 0.89 0.00 1.68 64.05 0.00 9.2497 9.600 25.21 0.00 0.00 0.00 2.32 3.27 3.44 0.78 0.11 0.00 0.89 0.00 1.71 63.57 0.00 9.2498 9.500 25.21 0.00 0.00 0.00 2.27 3.26 3.43 0.78 0.11 0.00 0.89 0.00 1.75 63.10 0.00 9.2499 9.400 25.21 0.00 0.00 0.00 2.25 3.25 3.42 0.77 0.11 0.00 0.88 0.00 1.79 62.62 0.00 9.24100 9.300 25.21 0.00 0.00 0.00 2.24 3.23 3.42 0.77 0.11 0.00 0.88 0.00 1.83 62.14 0.00 9.24101 9.200 25.21 0.00 0.00 0.00 2.24 3.22 3.41 0.77 0.11 0.00 0.88 0.00 1.87 61.67 0.00 9.24102 9.100 25.21 0.00 0.00 0.00 2.24 3.21 3.40 0.77 0.11 0.00 0.87 0.00 1.90 61.19 0.00 9.24103 9.000 25.21 0.00 0.00 0.00 2.25 3.20 3.39 0.76 0.11 0.00 0.87 0.00 1.94 60.71 0.00 9.24104 8.900 25.21 0.00 0.00 0.00 2.26 3.18 3.38 0.76 0.11 0.00 0.87 0.00 1.98 60.24 0.00 9.24105 8.800 25.21 0.00 0.00 0.00 2.27 3.17 3.37 0.76 0.11 0.00 0.87 0.00 2.02 59.76 0.00 9.24106 8.700 25.21 0.00 0.00 0.00 2.28 3.16 3.37 0.76 0.10 0.00 0.86 0.00 2.06 59.29 0.00 9.24
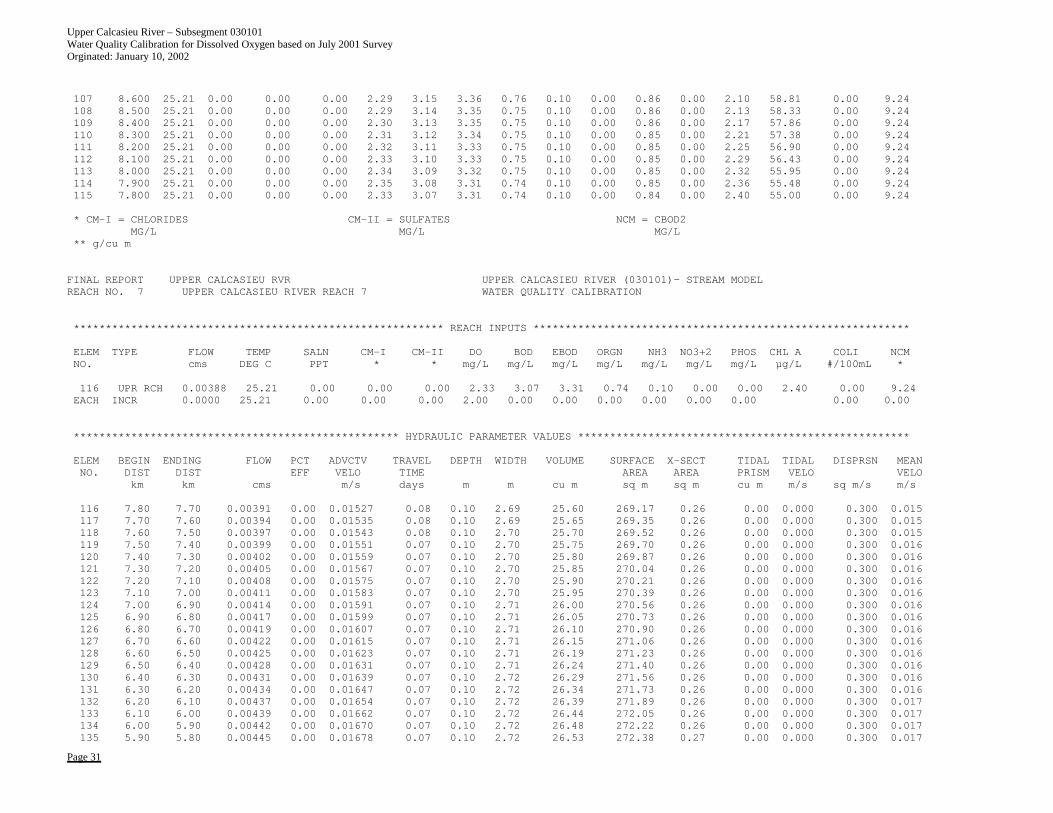
Upper Calcasieu River – Subsegment 030101 Water Quality Calibration for Dissolved Oxygen based on July 2001 Survey Orginated: January 10, 2002
Page 31
107 8.600 25.21 0.00 0.00 0.00 2.29 3.15 3.36 0.76 0.10 0.00 0.86 0.00 2.10 58.81 0.00 9.24108 8.500 25.21 0.00 0.00 0.00 2.29 3.14 3.35 0.75 0.10 0.00 0.86 0.00 2.13 58.33 0.00 9.24109 8.400 25.21 0.00 0.00 0.00 2.30 3.13 3.35 0.75 0.10 0.00 0.86 0.00 2.17 57.86 0.00 9.24110 8.300 25.21 0.00 0.00 0.00 2.31 3.12 3.34 0.75 0.10 0.00 0.85 0.00 2.21 57.38 0.00 9.24111 8.200 25.21 0.00 0.00 0.00 2.32 3.11 3.33 0.75 0.10 0.00 0.85 0.00 2.25 56.90 0.00 9.24112 8.100 25.21 0.00 0.00 0.00 2.33 3.10 3.33 0.75 0.10 0.00 0.85 0.00 2.29 56.43 0.00 9.24113 8.000 25.21 0.00 0.00 0.00 2.34 3.09 3.32 0.75 0.10 0.00 0.85 0.00 2.32 55.95 0.00 9.24114 7.900 25.21 0.00 0.00 0.00 2.35 3.08 3.31 0.74 0.10 0.00 0.85 0.00 2.36 55.48 0.00 9.24115 7.800 25.21 0.00 0.00 0.00 2.33 3.07 3.31 0.74 0.10 0.00 0.84 0.00 2.40 55.00 0.00 9.24
* CM-I = CHLORIDES CM-II = SULFATES NCM = CBOD2MG/L MG/L MG/L
** g/cu m
FINAL REPORT UPPER CALCASIEU RVR UPPER CALCASIEU RIVER (030101)- STREAM MODELREACH NO. 7 UPPER CALCASIEU RIVER REACH 7 WATER QUALITY CALIBRATION
********************************************************** REACH INPUTS ***********************************************************
ELEM TYPE FLOW TEMP SALN CM-I CM-II DO BOD EBOD ORGN NH3 NO3+2 PHOS CHL A COLI NCMNO. cms DEG C PPT * * mg/L mg/L mg/L mg/L mg/L mg/L mg/L µg/L #/100mL *
116 UPR RCH 0.00388 25.21 0.00 0.00 0.00 2.33 3.07 3.31 0.74 0.10 0.00 0.00 2.40 0.00 9.24EACH INCR 0.0000 25.21 0.00 0.00 0.00 2.00 0.00 0.00 0.00 0.00 0.00 0.00 0.00 0.00
*************************************************** HYDRAULIC PARAMETER VALUES ****************************************************
ELEM BEGIN ENDING FLOW PCT ADVCTV TRAVEL DEPTH WIDTH VOLUME SURFACE X-SECT TIDAL TIDAL DISPRSN MEANNO. DIST DIST EFF VELO TIME AREA AREA PRISM VELO VELO
km km cms m/s days m m cu m sq m sq m cu m m/s sq m/s m/s
116 7.80 7.70 0.00391 0.00 0.01527 0.08 0.10 2.69 25.60 269.17 0.26 0.00 0.000 0.300 0.015117 7.70 7.60 0.00394 0.00 0.01535 0.08 0.10 2.69 25.65 269.35 0.26 0.00 0.000 0.300 0.015118 7.60 7.50 0.00397 0.00 0.01543 0.08 0.10 2.70 25.70 269.52 0.26 0.00 0.000 0.300 0.015119 7.50 7.40 0.00399 0.00 0.01551 0.07 0.10 2.70 25.75 269.70 0.26 0.00 0.000 0.300 0.016120 7.40 7.30 0.00402 0.00 0.01559 0.07 0.10 2.70 25.80 269.87 0.26 0.00 0.000 0.300 0.016121 7.30 7.20 0.00405 0.00 0.01567 0.07 0.10 2.70 25.85 270.04 0.26 0.00 0.000 0.300 0.016122 7.20 7.10 0.00408 0.00 0.01575 0.07 0.10 2.70 25.90 270.21 0.26 0.00 0.000 0.300 0.016123 7.10 7.00 0.00411 0.00 0.01583 0.07 0.10 2.70 25.95 270.39 0.26 0.00 0.000 0.300 0.016124 7.00 6.90 0.00414 0.00 0.01591 0.07 0.10 2.71 26.00 270.56 0.26 0.00 0.000 0.300 0.016125 6.90 6.80 0.00417 0.00 0.01599 0.07 0.10 2.71 26.05 270.73 0.26 0.00 0.000 0.300 0.016126 6.80 6.70 0.00419 0.00 0.01607 0.07 0.10 2.71 26.10 270.90 0.26 0.00 0.000 0.300 0.016127 6.70 6.60 0.00422 0.00 0.01615 0.07 0.10 2.71 26.15 271.06 0.26 0.00 0.000 0.300 0.016128 6.60 6.50 0.00425 0.00 0.01623 0.07 0.10 2.71 26.19 271.23 0.26 0.00 0.000 0.300 0.016129 6.50 6.40 0.00428 0.00 0.01631 0.07 0.10 2.71 26.24 271.40 0.26 0.00 0.000 0.300 0.016130 6.40 6.30 0.00431 0.00 0.01639 0.07 0.10 2.72 26.29 271.56 0.26 0.00 0.000 0.300 0.016131 6.30 6.20 0.00434 0.00 0.01647 0.07 0.10 2.72 26.34 271.73 0.26 0.00 0.000 0.300 0.016132 6.20 6.10 0.00437 0.00 0.01654 0.07 0.10 2.72 26.39 271.89 0.26 0.00 0.000 0.300 0.017133 6.10 6.00 0.00439 0.00 0.01662 0.07 0.10 2.72 26.44 272.05 0.26 0.00 0.000 0.300 0.017134 6.00 5.90 0.00442 0.00 0.01670 0.07 0.10 2.72 26.48 272.22 0.26 0.00 0.000 0.300 0.017135 5.90 5.80 0.00445 0.00 0.01678 0.07 0.10 2.72 26.53 272.38 0.27 0.00 0.000 0.300 0.017
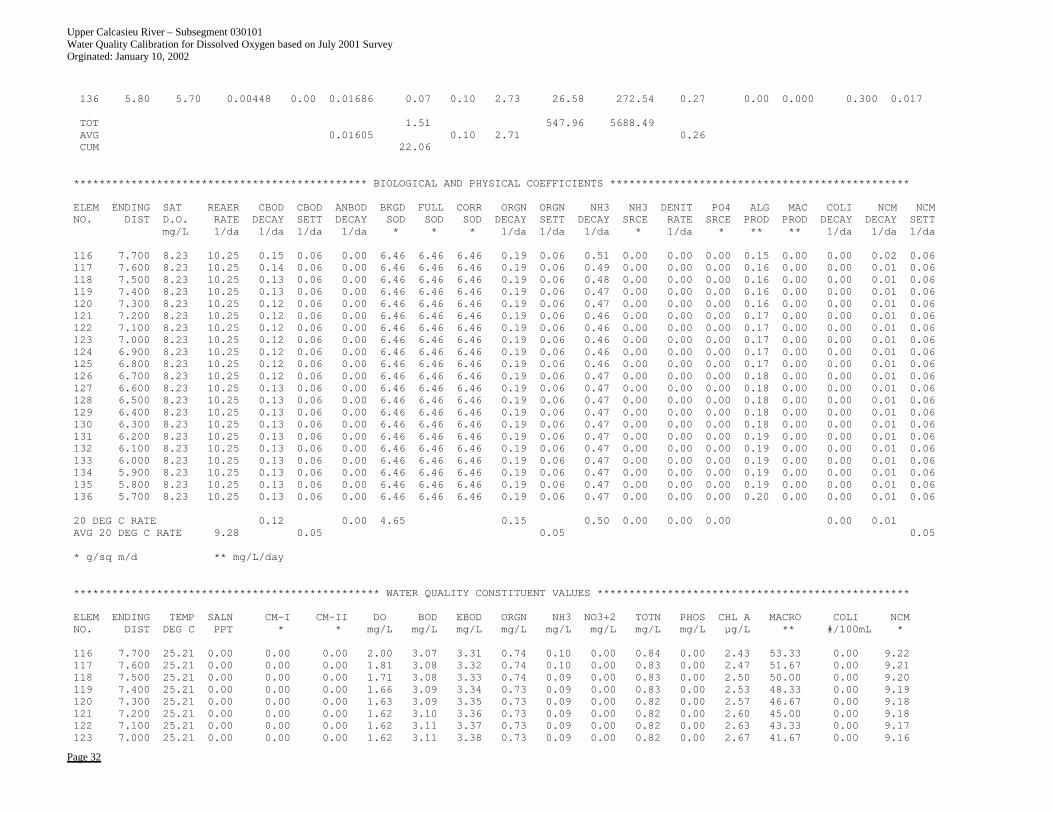
Upper Calcasieu River – Subsegment 030101 Water Quality Calibration for Dissolved Oxygen based on July 2001 Survey Orginated: January 10, 2002
Page 32
136 5.80 5.70 0.00448 0.00 0.01686 0.07 0.10 2.73 26.58 272.54 0.27 0.00 0.000 0.300 0.017
TOT 1.51 547.96 5688.49AVG 0.01605 0.10 2.71 0.26CUM 22.06
********************************************** BIOLOGICAL AND PHYSICAL COEFFICIENTS ***********************************************
ELEM ENDING SAT REAER CBOD CBOD ANBOD BKGD FULL CORR ORGN ORGN NH3 NH3 DENIT PO4 ALG MAC COLI NCM NCMNO. DIST D.O. RATE DECAY SETT DECAY SOD SOD SOD DECAY SETT DECAY SRCE RATE SRCE PROD PROD DECAY DECAY SETT
mg/L 1/da 1/da 1/da 1/da * * * 1/da 1/da 1/da * 1/da * ** ** 1/da 1/da 1/da
116 7.700 8.23 10.25 0.15 0.06 0.00 6.46 6.46 6.46 0.19 0.06 0.51 0.00 0.00 0.00 0.15 0.00 0.00 0.02 0.06117 7.600 8.23 10.25 0.14 0.06 0.00 6.46 6.46 6.46 0.19 0.06 0.49 0.00 0.00 0.00 0.16 0.00 0.00 0.01 0.06118 7.500 8.23 10.25 0.13 0.06 0.00 6.46 6.46 6.46 0.19 0.06 0.48 0.00 0.00 0.00 0.16 0.00 0.00 0.01 0.06119 7.400 8.23 10.25 0.13 0.06 0.00 6.46 6.46 6.46 0.19 0.06 0.47 0.00 0.00 0.00 0.16 0.00 0.00 0.01 0.06120 7.300 8.23 10.25 0.12 0.06 0.00 6.46 6.46 6.46 0.19 0.06 0.47 0.00 0.00 0.00 0.16 0.00 0.00 0.01 0.06121 7.200 8.23 10.25 0.12 0.06 0.00 6.46 6.46 6.46 0.19 0.06 0.46 0.00 0.00 0.00 0.17 0.00 0.00 0.01 0.06122 7.100 8.23 10.25 0.12 0.06 0.00 6.46 6.46 6.46 0.19 0.06 0.46 0.00 0.00 0.00 0.17 0.00 0.00 0.01 0.06123 7.000 8.23 10.25 0.12 0.06 0.00 6.46 6.46 6.46 0.19 0.06 0.46 0.00 0.00 0.00 0.17 0.00 0.00 0.01 0.06124 6.900 8.23 10.25 0.12 0.06 0.00 6.46 6.46 6.46 0.19 0.06 0.46 0.00 0.00 0.00 0.17 0.00 0.00 0.01 0.06125 6.800 8.23 10.25 0.12 0.06 0.00 6.46 6.46 6.46 0.19 0.06 0.46 0.00 0.00 0.00 0.17 0.00 0.00 0.01 0.06126 6.700 8.23 10.25 0.12 0.06 0.00 6.46 6.46 6.46 0.19 0.06 0.47 0.00 0.00 0.00 0.18 0.00 0.00 0.01 0.06127 6.600 8.23 10.25 0.13 0.06 0.00 6.46 6.46 6.46 0.19 0.06 0.47 0.00 0.00 0.00 0.18 0.00 0.00 0.01 0.06128 6.500 8.23 10.25 0.13 0.06 0.00 6.46 6.46 6.46 0.19 0.06 0.47 0.00 0.00 0.00 0.18 0.00 0.00 0.01 0.06129 6.400 8.23 10.25 0.13 0.06 0.00 6.46 6.46 6.46 0.19 0.06 0.47 0.00 0.00 0.00 0.18 0.00 0.00 0.01 0.06130 6.300 8.23 10.25 0.13 0.06 0.00 6.46 6.46 6.46 0.19 0.06 0.47 0.00 0.00 0.00 0.18 0.00 0.00 0.01 0.06131 6.200 8.23 10.25 0.13 0.06 0.00 6.46 6.46 6.46 0.19 0.06 0.47 0.00 0.00 0.00 0.19 0.00 0.00 0.01 0.06132 6.100 8.23 10.25 0.13 0.06 0.00 6.46 6.46 6.46 0.19 0.06 0.47 0.00 0.00 0.00 0.19 0.00 0.00 0.01 0.06133 6.000 8.23 10.25 0.13 0.06 0.00 6.46 6.46 6.46 0.19 0.06 0.47 0.00 0.00 0.00 0.19 0.00 0.00 0.01 0.06134 5.900 8.23 10.25 0.13 0.06 0.00 6.46 6.46 6.46 0.19 0.06 0.47 0.00 0.00 0.00 0.19 0.00 0.00 0.01 0.06135 5.800 8.23 10.25 0.13 0.06 0.00 6.46 6.46 6.46 0.19 0.06 0.47 0.00 0.00 0.00 0.19 0.00 0.00 0.01 0.06136 5.700 8.23 10.25 0.13 0.06 0.00 6.46 6.46 6.46 0.19 0.06 0.47 0.00 0.00 0.00 0.20 0.00 0.00 0.01 0.06
20 DEG C RATE 0.12 0.00 4.65 0.15 0.50 0.00 0.00 0.00 0.00 0.01AVG 20 DEG C RATE 9.28 0.05 0.05 0.05
* g/sq m/d ** mg/L/day
************************************************ WATER QUALITY CONSTITUENT VALUES *************************************************
ELEM ENDING TEMP SALN CM-I CM-II DO BOD EBOD ORGN NH3 NO3+2 TOTN PHOS CHL A MACRO COLI NCMNO. DIST DEG C PPT * * mg/L mg/L mg/L mg/L mg/L mg/L mg/L mg/L µg/L ** #/100mL *
116 7.700 25.21 0.00 0.00 0.00 2.00 3.07 3.31 0.74 0.10 0.00 0.84 0.00 2.43 53.33 0.00 9.22117 7.600 25.21 0.00 0.00 0.00 1.81 3.08 3.32 0.74 0.10 0.00 0.83 0.00 2.47 51.67 0.00 9.21118 7.500 25.21 0.00 0.00 0.00 1.71 3.08 3.33 0.74 0.09 0.00 0.83 0.00 2.50 50.00 0.00 9.20119 7.400 25.21 0.00 0.00 0.00 1.66 3.09 3.34 0.73 0.09 0.00 0.83 0.00 2.53 48.33 0.00 9.19120 7.300 25.21 0.00 0.00 0.00 1.63 3.09 3.35 0.73 0.09 0.00 0.82 0.00 2.57 46.67 0.00 9.18121 7.200 25.21 0.00 0.00 0.00 1.62 3.10 3.36 0.73 0.09 0.00 0.82 0.00 2.60 45.00 0.00 9.18122 7.100 25.21 0.00 0.00 0.00 1.62 3.11 3.37 0.73 0.09 0.00 0.82 0.00 2.63 43.33 0.00 9.17123 7.000 25.21 0.00 0.00 0.00 1.62 3.11 3.38 0.73 0.09 0.00 0.82 0.00 2.67 41.67 0.00 9.16

Upper Calcasieu River – Subsegment 030101 Water Quality Calibration for Dissolved Oxygen based on July 2001 Survey Orginated: January 10, 2002
Page 33
124 6.900 25.21 0.00 0.00 0.00 1.62 3.12 3.39 0.72 0.09 0.00 0.81 0.00 2.70 40.00 0.00 9.15125 6.800 25.21 0.00 0.00 0.00 1.63 3.12 3.40 0.72 0.09 0.00 0.81 0.00 2.73 38.33 0.00 9.14126 6.700 25.21 0.00 0.00 0.00 1.64 3.13 3.40 0.72 0.09 0.00 0.81 0.00 2.77 36.67 0.00 9.13127 6.600 25.21 0.00 0.00 0.00 1.64 3.13 3.41 0.72 0.09 0.00 0.81 0.00 2.80 35.00 0.00 9.12128 6.500 25.21 0.00 0.00 0.00 1.65 3.14 3.42 0.72 0.09 0.00 0.81 0.00 2.83 33.33 0.00 9.11129 6.400 25.21 0.00 0.00 0.00 1.66 3.14 3.43 0.72 0.09 0.00 0.81 0.00 2.87 31.67 0.00 9.10130 6.300 25.21 0.00 0.00 0.00 1.67 3.14 3.43 0.71 0.09 0.00 0.81 0.00 2.90 30.00 0.00 9.09131 6.200 25.21 0.00 0.00 0.00 1.67 3.15 3.44 0.71 0.09 0.00 0.81 0.00 2.93 28.33 0.00 9.08132 6.100 25.21 0.00 0.00 0.00 1.68 3.15 3.45 0.71 0.09 0.00 0.81 0.00 2.97 26.67 0.00 9.08133 6.000 25.21 0.00 0.00 0.00 1.69 3.15 3.45 0.71 0.10 0.00 0.81 0.00 3.00 25.00 0.00 9.07134 5.900 25.21 0.00 0.00 0.00 1.70 3.16 3.46 0.71 0.10 0.00 0.81 0.00 3.03 23.33 0.00 9.06135 5.800 25.21 0.00 0.00 0.00 1.70 3.16 3.46 0.71 0.10 0.00 0.81 0.00 3.07 21.67 0.00 9.05136 5.700 25.21 0.00 0.00 0.00 1.68 3.16 3.47 0.70 0.10 0.00 0.81 0.00 3.10 20.00 0.00 9.05
* CM-I = CHLORIDES CM-II = SULFATES NCM = CBOD2MG/L MG/L MG/L
** g/cu m
FINAL REPORT UPPER CALCASIEU RVR UPPER CALCASIEU RIVER (030101)- STREAM MODELREACH NO. 8 UPPER CALCASIEU RIVER REACH 8 WATER QUALITY CALIBRATION
********************************************************** REACH INPUTS ***********************************************************
ELEM TYPE FLOW TEMP SALN CM-I CM-II DO BOD EBOD ORGN NH3 NO3+2 PHOS CHL A COLI NCMNO. cms DEG C PPT * * mg/L mg/L mg/L mg/L mg/L mg/L mg/L µg/L #/100mL *
137 UPR RCH 0.00448 25.21 0.00 0.00 0.00 1.68 3.16 3.47 0.70 0.10 0.00 0.00 3.10 0.00 9.05EACH INCR 0.0000 25.21 0.00 0.00 0.00 2.00 0.00 0.00 0.00 0.00 0.00 0.00 0.00 0.00
*************************************************** HYDRAULIC PARAMETER VALUES ****************************************************
ELEM BEGIN ENDING FLOW PCT ADVCTV TRAVEL DEPTH WIDTH VOLUME SURFACE X-SECT TIDAL TIDAL DISPRSN MEANNO. DIST DIST EFF VELO TIME AREA AREA PRISM VELO VELO
km km cms m/s days m m cu m sq m sq m cu m m/s sq m/s m/s
137 5.70 5.60 0.00451 0.00 0.01369 0.08 0.11 3.06 32.94 306.38 0.33 0.00 0.000 0.300 0.014138 5.60 5.50 0.00454 0.00 0.01375 0.08 0.11 3.07 32.99 306.56 0.33 0.00 0.000 0.300 0.014139 5.50 5.40 0.00457 0.00 0.01381 0.08 0.11 3.07 33.05 306.73 0.33 0.00 0.000 0.300 0.014140 5.40 5.30 0.00459 0.00 0.01388 0.08 0.11 3.07 33.11 306.91 0.33 0.00 0.000 0.300 0.014141 5.30 5.20 0.00462 0.00 0.01394 0.08 0.11 3.07 33.16 307.08 0.33 0.00 0.000 0.300 0.014142 5.20 5.10 0.00465 0.00 0.01400 0.08 0.11 3.07 33.22 307.26 0.33 0.00 0.000 0.300 0.014143 5.10 5.00 0.00468 0.00 0.01406 0.08 0.11 3.07 33.27 307.43 0.33 0.00 0.000 0.300 0.014144 5.00 4.90 0.00471 0.00 0.01413 0.08 0.11 3.08 33.33 307.60 0.33 0.00 0.000 0.300 0.014145 4.90 4.80 0.00474 0.00 0.01419 0.08 0.11 3.08 33.39 307.77 0.33 0.00 0.000 0.300 0.014146 4.80 4.70 0.00477 0.00 0.01425 0.08 0.11 3.08 33.44 307.94 0.33 0.00 0.000 0.300 0.014147 4.70 4.60 0.00479 0.00 0.01431 0.08 0.11 3.08 33.50 308.11 0.33 0.00 0.000 0.300 0.014148 4.60 4.50 0.00482 0.00 0.01437 0.08 0.11 3.08 33.55 308.28 0.34 0.00 0.000 0.300 0.014149 4.50 4.40 0.00485 0.00 0.01444 0.08 0.11 3.08 33.61 308.45 0.34 0.00 0.000 0.300 0.014150 4.40 4.30 0.00488 0.00 0.01450 0.08 0.11 3.09 33.66 308.62 0.34 0.00 0.000 0.300 0.014151 4.30 4.20 0.00491 0.00 0.01456 0.08 0.11 3.09 33.72 308.79 0.34 0.00 0.000 0.300 0.015152 4.20 4.10 0.00494 0.00 0.01462 0.08 0.11 3.09 33.77 308.95 0.34 0.00 0.000 0.300 0.015
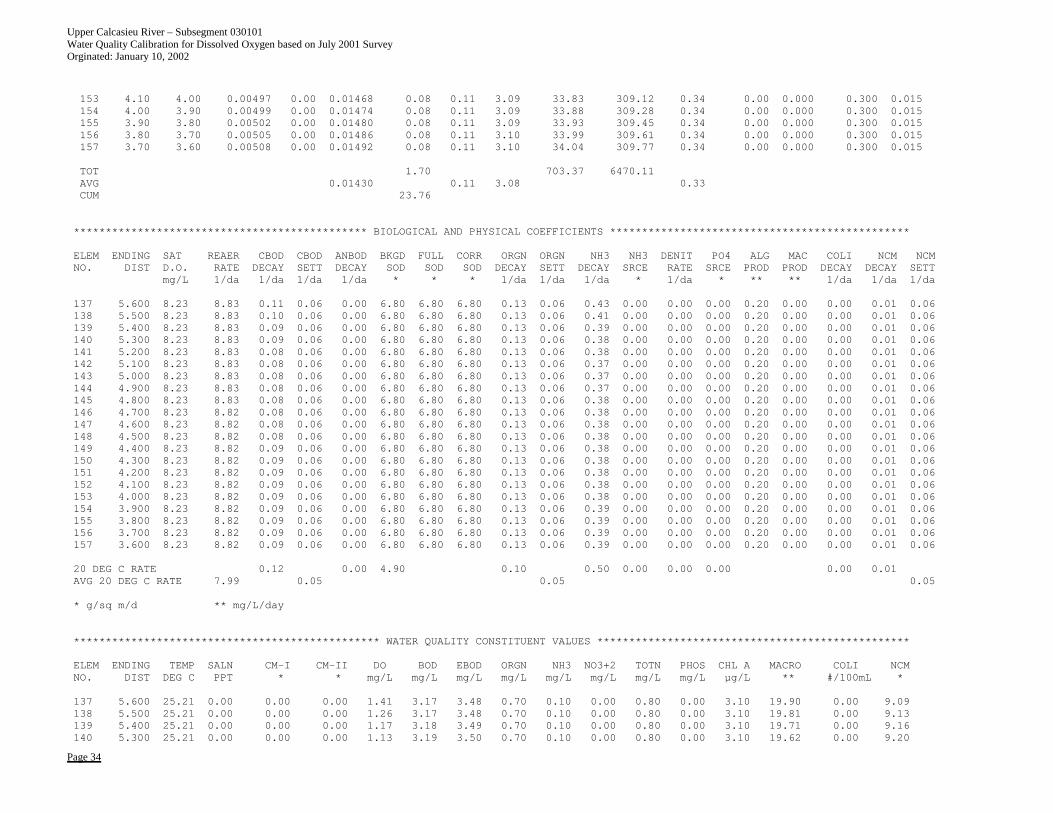
Upper Calcasieu River – Subsegment 030101 Water Quality Calibration for Dissolved Oxygen based on July 2001 Survey Orginated: January 10, 2002
Page 34
153 4.10 4.00 0.00497 0.00 0.01468 0.08 0.11 3.09 33.83 309.12 0.34 0.00 0.000 0.300 0.015154 4.00 3.90 0.00499 0.00 0.01474 0.08 0.11 3.09 33.88 309.28 0.34 0.00 0.000 0.300 0.015155 3.90 3.80 0.00502 0.00 0.01480 0.08 0.11 3.09 33.93 309.45 0.34 0.00 0.000 0.300 0.015156 3.80 3.70 0.00505 0.00 0.01486 0.08 0.11 3.10 33.99 309.61 0.34 0.00 0.000 0.300 0.015157 3.70 3.60 0.00508 0.00 0.01492 0.08 0.11 3.10 34.04 309.77 0.34 0.00 0.000 0.300 0.015
TOT 1.70 703.37 6470.11AVG 0.01430 0.11 3.08 0.33CUM 23.76
********************************************** BIOLOGICAL AND PHYSICAL COEFFICIENTS ***********************************************
ELEM ENDING SAT REAER CBOD CBOD ANBOD BKGD FULL CORR ORGN ORGN NH3 NH3 DENIT PO4 ALG MAC COLI NCM NCMNO. DIST D.O. RATE DECAY SETT DECAY SOD SOD SOD DECAY SETT DECAY SRCE RATE SRCE PROD PROD DECAY DECAY SETT
mg/L 1/da 1/da 1/da 1/da * * * 1/da 1/da 1/da * 1/da * ** ** 1/da 1/da 1/da
137 5.600 8.23 8.83 0.11 0.06 0.00 6.80 6.80 6.80 0.13 0.06 0.43 0.00 0.00 0.00 0.20 0.00 0.00 0.01 0.06138 5.500 8.23 8.83 0.10 0.06 0.00 6.80 6.80 6.80 0.13 0.06 0.41 0.00 0.00 0.00 0.20 0.00 0.00 0.01 0.06139 5.400 8.23 8.83 0.09 0.06 0.00 6.80 6.80 6.80 0.13 0.06 0.39 0.00 0.00 0.00 0.20 0.00 0.00 0.01 0.06140 5.300 8.23 8.83 0.09 0.06 0.00 6.80 6.80 6.80 0.13 0.06 0.38 0.00 0.00 0.00 0.20 0.00 0.00 0.01 0.06141 5.200 8.23 8.83 0.08 0.06 0.00 6.80 6.80 6.80 0.13 0.06 0.38 0.00 0.00 0.00 0.20 0.00 0.00 0.01 0.06142 5.100 8.23 8.83 0.08 0.06 0.00 6.80 6.80 6.80 0.13 0.06 0.37 0.00 0.00 0.00 0.20 0.00 0.00 0.01 0.06143 5.000 8.23 8.83 0.08 0.06 0.00 6.80 6.80 6.80 0.13 0.06 0.37 0.00 0.00 0.00 0.20 0.00 0.00 0.01 0.06144 4.900 8.23 8.83 0.08 0.06 0.00 6.80 6.80 6.80 0.13 0.06 0.37 0.00 0.00 0.00 0.20 0.00 0.00 0.01 0.06145 4.800 8.23 8.83 0.08 0.06 0.00 6.80 6.80 6.80 0.13 0.06 0.38 0.00 0.00 0.00 0.20 0.00 0.00 0.01 0.06146 4.700 8.23 8.82 0.08 0.06 0.00 6.80 6.80 6.80 0.13 0.06 0.38 0.00 0.00 0.00 0.20 0.00 0.00 0.01 0.06147 4.600 8.23 8.82 0.08 0.06 0.00 6.80 6.80 6.80 0.13 0.06 0.38 0.00 0.00 0.00 0.20 0.00 0.00 0.01 0.06148 4.500 8.23 8.82 0.08 0.06 0.00 6.80 6.80 6.80 0.13 0.06 0.38 0.00 0.00 0.00 0.20 0.00 0.00 0.01 0.06149 4.400 8.23 8.82 0.09 0.06 0.00 6.80 6.80 6.80 0.13 0.06 0.38 0.00 0.00 0.00 0.20 0.00 0.00 0.01 0.06150 4.300 8.23 8.82 0.09 0.06 0.00 6.80 6.80 6.80 0.13 0.06 0.38 0.00 0.00 0.00 0.20 0.00 0.00 0.01 0.06151 4.200 8.23 8.82 0.09 0.06 0.00 6.80 6.80 6.80 0.13 0.06 0.38 0.00 0.00 0.00 0.20 0.00 0.00 0.01 0.06152 4.100 8.23 8.82 0.09 0.06 0.00 6.80 6.80 6.80 0.13 0.06 0.38 0.00 0.00 0.00 0.20 0.00 0.00 0.01 0.06153 4.000 8.23 8.82 0.09 0.06 0.00 6.80 6.80 6.80 0.13 0.06 0.38 0.00 0.00 0.00 0.20 0.00 0.00 0.01 0.06154 3.900 8.23 8.82 0.09 0.06 0.00 6.80 6.80 6.80 0.13 0.06 0.39 0.00 0.00 0.00 0.20 0.00 0.00 0.01 0.06155 3.800 8.23 8.82 0.09 0.06 0.00 6.80 6.80 6.80 0.13 0.06 0.39 0.00 0.00 0.00 0.20 0.00 0.00 0.01 0.06156 3.700 8.23 8.82 0.09 0.06 0.00 6.80 6.80 6.80 0.13 0.06 0.39 0.00 0.00 0.00 0.20 0.00 0.00 0.01 0.06157 3.600 8.23 8.82 0.09 0.06 0.00 6.80 6.80 6.80 0.13 0.06 0.39 0.00 0.00 0.00 0.20 0.00 0.00 0.01 0.06
20 DEG C RATE 0.12 0.00 4.90 0.10 0.50 0.00 0.00 0.00 0.00 0.01AVG 20 DEG C RATE 7.99 0.05 0.05 0.05
* g/sq m/d ** mg/L/day
************************************************ WATER QUALITY CONSTITUENT VALUES *************************************************
ELEM ENDING TEMP SALN CM-I CM-II DO BOD EBOD ORGN NH3 NO3+2 TOTN PHOS CHL A MACRO COLI NCMNO. DIST DEG C PPT * * mg/L mg/L mg/L mg/L mg/L mg/L mg/L mg/L µg/L ** #/100mL *
137 5.600 25.21 0.00 0.00 0.00 1.41 3.17 3.48 0.70 0.10 0.00 0.80 0.00 3.10 19.90 0.00 9.09138 5.500 25.21 0.00 0.00 0.00 1.26 3.17 3.48 0.70 0.10 0.00 0.80 0.00 3.10 19.81 0.00 9.13139 5.400 25.21 0.00 0.00 0.00 1.17 3.18 3.49 0.70 0.10 0.00 0.80 0.00 3.10 19.71 0.00 9.16140 5.300 25.21 0.00 0.00 0.00 1.13 3.19 3.50 0.70 0.10 0.00 0.80 0.00 3.10 19.62 0.00 9.20
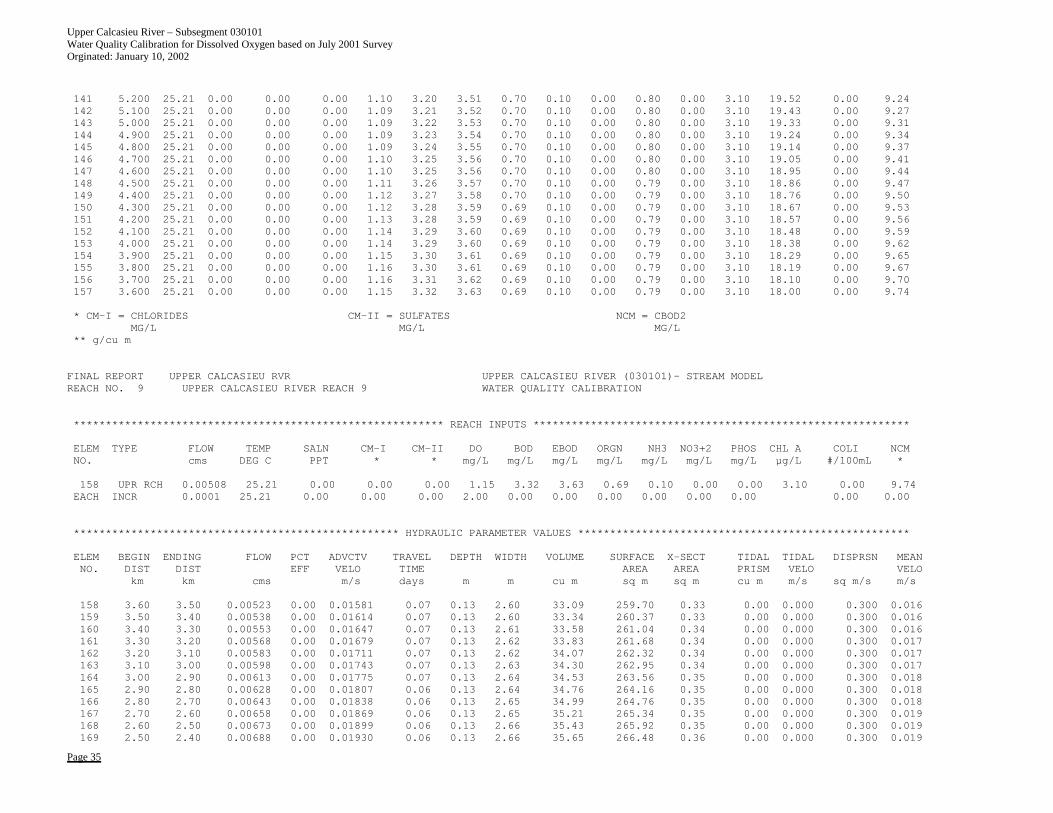
Upper Calcasieu River – Subsegment 030101 Water Quality Calibration for Dissolved Oxygen based on July 2001 Survey Orginated: January 10, 2002
Page 35
141 5.200 25.21 0.00 0.00 0.00 1.10 3.20 3.51 0.70 0.10 0.00 0.80 0.00 3.10 19.52 0.00 9.24142 5.100 25.21 0.00 0.00 0.00 1.09 3.21 3.52 0.70 0.10 0.00 0.80 0.00 3.10 19.43 0.00 9.27143 5.000 25.21 0.00 0.00 0.00 1.09 3.22 3.53 0.70 0.10 0.00 0.80 0.00 3.10 19.33 0.00 9.31144 4.900 25.21 0.00 0.00 0.00 1.09 3.23 3.54 0.70 0.10 0.00 0.80 0.00 3.10 19.24 0.00 9.34145 4.800 25.21 0.00 0.00 0.00 1.09 3.24 3.55 0.70 0.10 0.00 0.80 0.00 3.10 19.14 0.00 9.37146 4.700 25.21 0.00 0.00 0.00 1.10 3.25 3.56 0.70 0.10 0.00 0.80 0.00 3.10 19.05 0.00 9.41147 4.600 25.21 0.00 0.00 0.00 1.10 3.25 3.56 0.70 0.10 0.00 0.80 0.00 3.10 18.95 0.00 9.44148 4.500 25.21 0.00 0.00 0.00 1.11 3.26 3.57 0.70 0.10 0.00 0.79 0.00 3.10 18.86 0.00 9.47149 4.400 25.21 0.00 0.00 0.00 1.12 3.27 3.58 0.70 0.10 0.00 0.79 0.00 3.10 18.76 0.00 9.50150 4.300 25.21 0.00 0.00 0.00 1.12 3.28 3.59 0.69 0.10 0.00 0.79 0.00 3.10 18.67 0.00 9.53151 4.200 25.21 0.00 0.00 0.00 1.13 3.28 3.59 0.69 0.10 0.00 0.79 0.00 3.10 18.57 0.00 9.56152 4.100 25.21 0.00 0.00 0.00 1.14 3.29 3.60 0.69 0.10 0.00 0.79 0.00 3.10 18.48 0.00 9.59153 4.000 25.21 0.00 0.00 0.00 1.14 3.29 3.60 0.69 0.10 0.00 0.79 0.00 3.10 18.38 0.00 9.62154 3.900 25.21 0.00 0.00 0.00 1.15 3.30 3.61 0.69 0.10 0.00 0.79 0.00 3.10 18.29 0.00 9.65155 3.800 25.21 0.00 0.00 0.00 1.16 3.30 3.61 0.69 0.10 0.00 0.79 0.00 3.10 18.19 0.00 9.67156 3.700 25.21 0.00 0.00 0.00 1.16 3.31 3.62 0.69 0.10 0.00 0.79 0.00 3.10 18.10 0.00 9.70157 3.600 25.21 0.00 0.00 0.00 1.15 3.32 3.63 0.69 0.10 0.00 0.79 0.00 3.10 18.00 0.00 9.74
* CM-I = CHLORIDES CM-II = SULFATES NCM = CBOD2MG/L MG/L MG/L
** g/cu m
FINAL REPORT UPPER CALCASIEU RVR UPPER CALCASIEU RIVER (030101)- STREAM MODELREACH NO. 9 UPPER CALCASIEU RIVER REACH 9 WATER QUALITY CALIBRATION
********************************************************** REACH INPUTS ***********************************************************
ELEM TYPE FLOW TEMP SALN CM-I CM-II DO BOD EBOD ORGN NH3 NO3+2 PHOS CHL A COLI NCMNO. cms DEG C PPT * * mg/L mg/L mg/L mg/L mg/L mg/L mg/L µg/L #/100mL *
158 UPR RCH 0.00508 25.21 0.00 0.00 0.00 1.15 3.32 3.63 0.69 0.10 0.00 0.00 3.10 0.00 9.74EACH INCR 0.0001 25.21 0.00 0.00 0.00 2.00 0.00 0.00 0.00 0.00 0.00 0.00 0.00 0.00
*************************************************** HYDRAULIC PARAMETER VALUES ****************************************************
ELEM BEGIN ENDING FLOW PCT ADVCTV TRAVEL DEPTH WIDTH VOLUME SURFACE X-SECT TIDAL TIDAL DISPRSN MEANNO. DIST DIST EFF VELO TIME AREA AREA PRISM VELO VELO
km km cms m/s days m m cu m sq m sq m cu m m/s sq m/s m/s
158 3.60 3.50 0.00523 0.00 0.01581 0.07 0.13 2.60 33.09 259.70 0.33 0.00 0.000 0.300 0.016159 3.50 3.40 0.00538 0.00 0.01614 0.07 0.13 2.60 33.34 260.37 0.33 0.00 0.000 0.300 0.016160 3.40 3.30 0.00553 0.00 0.01647 0.07 0.13 2.61 33.58 261.04 0.34 0.00 0.000 0.300 0.016161 3.30 3.20 0.00568 0.00 0.01679 0.07 0.13 2.62 33.83 261.68 0.34 0.00 0.000 0.300 0.017162 3.20 3.10 0.00583 0.00 0.01711 0.07 0.13 2.62 34.07 262.32 0.34 0.00 0.000 0.300 0.017163 3.10 3.00 0.00598 0.00 0.01743 0.07 0.13 2.63 34.30 262.95 0.34 0.00 0.000 0.300 0.017164 3.00 2.90 0.00613 0.00 0.01775 0.07 0.13 2.64 34.53 263.56 0.35 0.00 0.000 0.300 0.018165 2.90 2.80 0.00628 0.00 0.01807 0.06 0.13 2.64 34.76 264.16 0.35 0.00 0.000 0.300 0.018166 2.80 2.70 0.00643 0.00 0.01838 0.06 0.13 2.65 34.99 264.76 0.35 0.00 0.000 0.300 0.018167 2.70 2.60 0.00658 0.00 0.01869 0.06 0.13 2.65 35.21 265.34 0.35 0.00 0.000 0.300 0.019168 2.60 2.50 0.00673 0.00 0.01899 0.06 0.13 2.66 35.43 265.92 0.35 0.00 0.000 0.300 0.019169 2.50 2.40 0.00688 0.00 0.01930 0.06 0.13 2.66 35.65 266.48 0.36 0.00 0.000 0.300 0.019
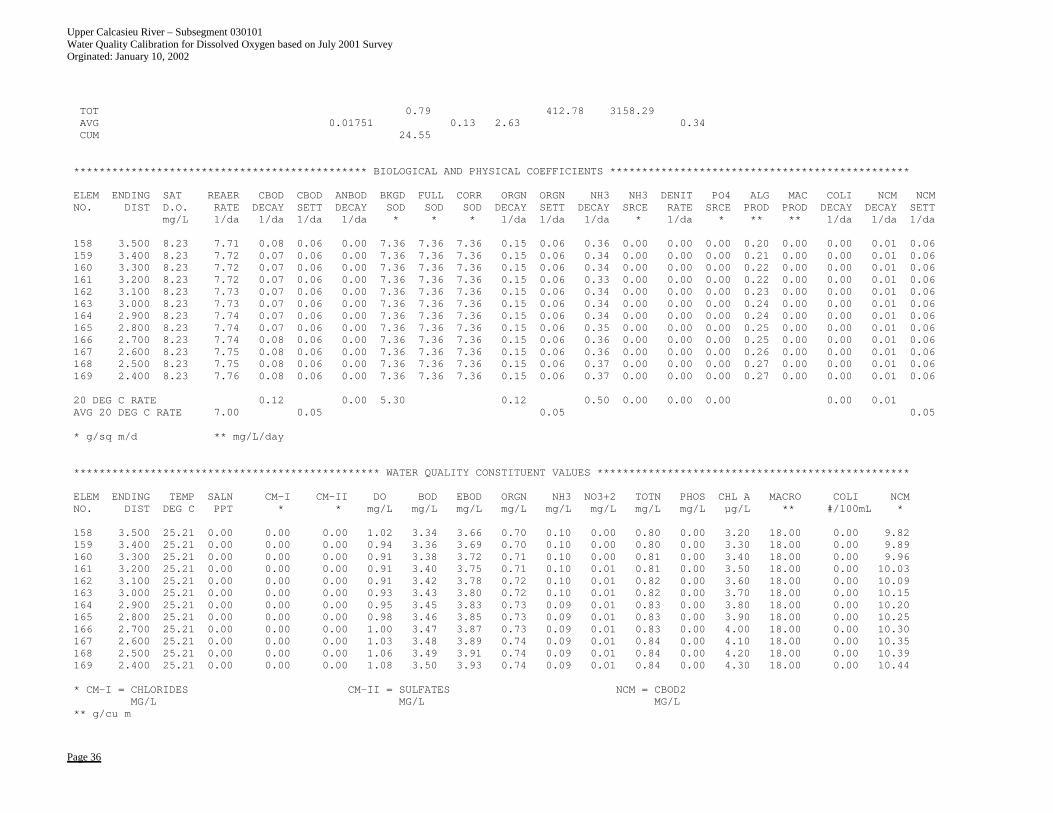
Upper Calcasieu River – Subsegment 030101 Water Quality Calibration for Dissolved Oxygen based on July 2001 Survey Orginated: January 10, 2002
Page 36
TOT 0.79 412.78 3158.29AVG 0.01751 0.13 2.63 0.34CUM 24.55
********************************************** BIOLOGICAL AND PHYSICAL COEFFICIENTS ***********************************************
ELEM ENDING SAT REAER CBOD CBOD ANBOD BKGD FULL CORR ORGN ORGN NH3 NH3 DENIT PO4 ALG MAC COLI NCM NCMNO. DIST D.O. RATE DECAY SETT DECAY SOD SOD SOD DECAY SETT DECAY SRCE RATE SRCE PROD PROD DECAY DECAY SETT
mg/L 1/da 1/da 1/da 1/da * * * 1/da 1/da 1/da * 1/da * ** ** 1/da 1/da 1/da
158 3.500 8.23 7.71 0.08 0.06 0.00 7.36 7.36 7.36 0.15 0.06 0.36 0.00 0.00 0.00 0.20 0.00 0.00 0.01 0.06159 3.400 8.23 7.72 0.07 0.06 0.00 7.36 7.36 7.36 0.15 0.06 0.34 0.00 0.00 0.00 0.21 0.00 0.00 0.01 0.06160 3.300 8.23 7.72 0.07 0.06 0.00 7.36 7.36 7.36 0.15 0.06 0.34 0.00 0.00 0.00 0.22 0.00 0.00 0.01 0.06161 3.200 8.23 7.72 0.07 0.06 0.00 7.36 7.36 7.36 0.15 0.06 0.33 0.00 0.00 0.00 0.22 0.00 0.00 0.01 0.06162 3.100 8.23 7.73 0.07 0.06 0.00 7.36 7.36 7.36 0.15 0.06 0.34 0.00 0.00 0.00 0.23 0.00 0.00 0.01 0.06163 3.000 8.23 7.73 0.07 0.06 0.00 7.36 7.36 7.36 0.15 0.06 0.34 0.00 0.00 0.00 0.24 0.00 0.00 0.01 0.06164 2.900 8.23 7.74 0.07 0.06 0.00 7.36 7.36 7.36 0.15 0.06 0.34 0.00 0.00 0.00 0.24 0.00 0.00 0.01 0.06165 2.800 8.23 7.74 0.07 0.06 0.00 7.36 7.36 7.36 0.15 0.06 0.35 0.00 0.00 0.00 0.25 0.00 0.00 0.01 0.06166 2.700 8.23 7.74 0.08 0.06 0.00 7.36 7.36 7.36 0.15 0.06 0.36 0.00 0.00 0.00 0.25 0.00 0.00 0.01 0.06167 2.600 8.23 7.75 0.08 0.06 0.00 7.36 7.36 7.36 0.15 0.06 0.36 0.00 0.00 0.00 0.26 0.00 0.00 0.01 0.06168 2.500 8.23 7.75 0.08 0.06 0.00 7.36 7.36 7.36 0.15 0.06 0.37 0.00 0.00 0.00 0.27 0.00 0.00 0.01 0.06169 2.400 8.23 7.76 0.08 0.06 0.00 7.36 7.36 7.36 0.15 0.06 0.37 0.00 0.00 0.00 0.27 0.00 0.00 0.01 0.06
20 DEG C RATE 0.12 0.00 5.30 0.12 0.50 0.00 0.00 0.00 0.00 0.01AVG 20 DEG C RATE 7.00 0.05 0.05 0.05
* g/sq m/d ** mg/L/day
************************************************ WATER QUALITY CONSTITUENT VALUES *************************************************
ELEM ENDING TEMP SALN CM-I CM-II DO BOD EBOD ORGN NH3 NO3+2 TOTN PHOS CHL A MACRO COLI NCMNO. DIST DEG C PPT * * mg/L mg/L mg/L mg/L mg/L mg/L mg/L mg/L µg/L ** #/100mL *
158 3.500 25.21 0.00 0.00 0.00 1.02 3.34 3.66 0.70 0.10 0.00 0.80 0.00 3.20 18.00 0.00 9.82159 3.400 25.21 0.00 0.00 0.00 0.94 3.36 3.69 0.70 0.10 0.00 0.80 0.00 3.30 18.00 0.00 9.89160 3.300 25.21 0.00 0.00 0.00 0.91 3.38 3.72 0.71 0.10 0.00 0.81 0.00 3.40 18.00 0.00 9.96161 3.200 25.21 0.00 0.00 0.00 0.91 3.40 3.75 0.71 0.10 0.01 0.81 0.00 3.50 18.00 0.00 10.03162 3.100 25.21 0.00 0.00 0.00 0.91 3.42 3.78 0.72 0.10 0.01 0.82 0.00 3.60 18.00 0.00 10.09163 3.000 25.21 0.00 0.00 0.00 0.93 3.43 3.80 0.72 0.10 0.01 0.82 0.00 3.70 18.00 0.00 10.15164 2.900 25.21 0.00 0.00 0.00 0.95 3.45 3.83 0.73 0.09 0.01 0.83 0.00 3.80 18.00 0.00 10.20165 2.800 25.21 0.00 0.00 0.00 0.98 3.46 3.85 0.73 0.09 0.01 0.83 0.00 3.90 18.00 0.00 10.25166 2.700 25.21 0.00 0.00 0.00 1.00 3.47 3.87 0.73 0.09 0.01 0.83 0.00 4.00 18.00 0.00 10.30167 2.600 25.21 0.00 0.00 0.00 1.03 3.48 3.89 0.74 0.09 0.01 0.84 0.00 4.10 18.00 0.00 10.35168 2.500 25.21 0.00 0.00 0.00 1.06 3.49 3.91 0.74 0.09 0.01 0.84 0.00 4.20 18.00 0.00 10.39169 2.400 25.21 0.00 0.00 0.00 1.08 3.50 3.93 0.74 0.09 0.01 0.84 0.00 4.30 18.00 0.00 10.44
* CM-I = CHLORIDES CM-II = SULFATES NCM = CBOD2MG/L MG/L MG/L
** g/cu m
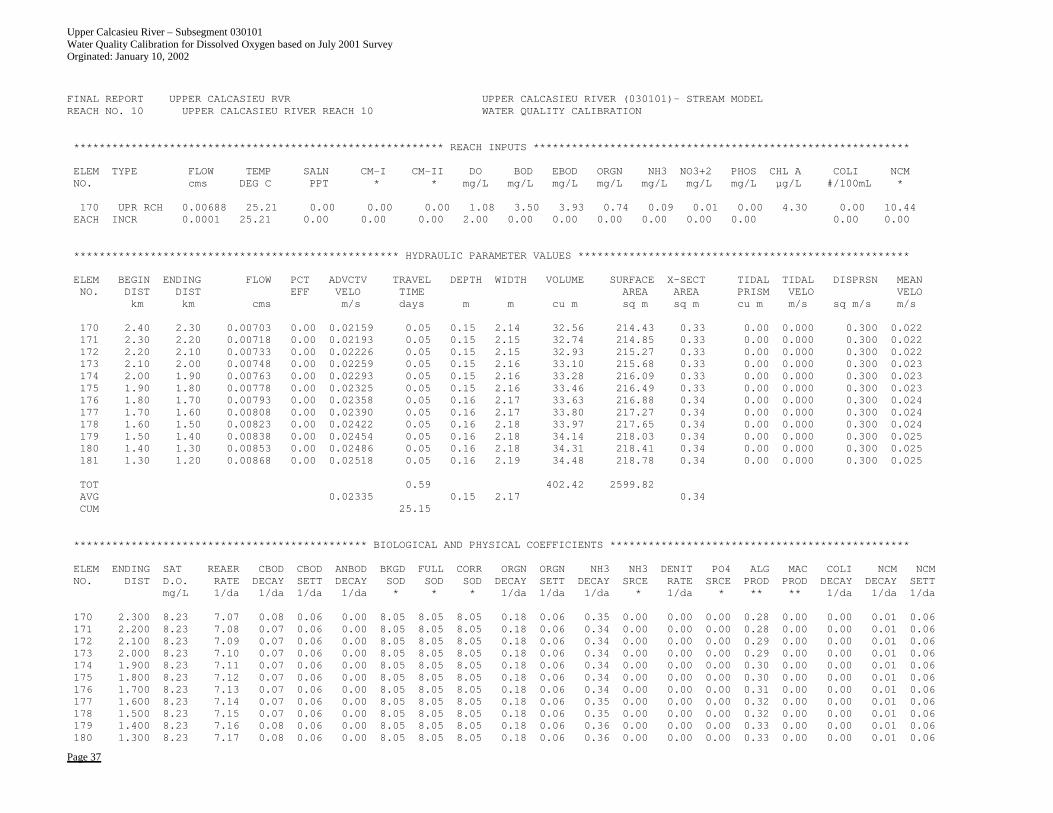
Upper Calcasieu River – Subsegment 030101 Water Quality Calibration for Dissolved Oxygen based on July 2001 Survey Orginated: January 10, 2002
Page 37
FINAL REPORT UPPER CALCASIEU RVR UPPER CALCASIEU RIVER (030101)- STREAM MODELREACH NO. 10 UPPER CALCASIEU RIVER REACH 10 WATER QUALITY CALIBRATION
********************************************************** REACH INPUTS ***********************************************************
ELEM TYPE FLOW TEMP SALN CM-I CM-II DO BOD EBOD ORGN NH3 NO3+2 PHOS CHL A COLI NCMNO. cms DEG C PPT * * mg/L mg/L mg/L mg/L mg/L mg/L mg/L µg/L #/100mL *
170 UPR RCH 0.00688 25.21 0.00 0.00 0.00 1.08 3.50 3.93 0.74 0.09 0.01 0.00 4.30 0.00 10.44EACH INCR 0.0001 25.21 0.00 0.00 0.00 2.00 0.00 0.00 0.00 0.00 0.00 0.00 0.00 0.00
*************************************************** HYDRAULIC PARAMETER VALUES ****************************************************
ELEM BEGIN ENDING FLOW PCT ADVCTV TRAVEL DEPTH WIDTH VOLUME SURFACE X-SECT TIDAL TIDAL DISPRSN MEANNO. DIST DIST EFF VELO TIME AREA AREA PRISM VELO VELO
km km cms m/s days m m cu m sq m sq m cu m m/s sq m/s m/s
170 2.40 2.30 0.00703 0.00 0.02159 0.05 0.15 2.14 32.56 214.43 0.33 0.00 0.000 0.300 0.022171 2.30 2.20 0.00718 0.00 0.02193 0.05 0.15 2.15 32.74 214.85 0.33 0.00 0.000 0.300 0.022172 2.20 2.10 0.00733 0.00 0.02226 0.05 0.15 2.15 32.93 215.27 0.33 0.00 0.000 0.300 0.022173 2.10 2.00 0.00748 0.00 0.02259 0.05 0.15 2.16 33.10 215.68 0.33 0.00 0.000 0.300 0.023174 2.00 1.90 0.00763 0.00 0.02293 0.05 0.15 2.16 33.28 216.09 0.33 0.00 0.000 0.300 0.023175 1.90 1.80 0.00778 0.00 0.02325 0.05 0.15 2.16 33.46 216.49 0.33 0.00 0.000 0.300 0.023176 1.80 1.70 0.00793 0.00 0.02358 0.05 0.16 2.17 33.63 216.88 0.34 0.00 0.000 0.300 0.024177 1.70 1.60 0.00808 0.00 0.02390 0.05 0.16 2.17 33.80 217.27 0.34 0.00 0.000 0.300 0.024178 1.60 1.50 0.00823 0.00 0.02422 0.05 0.16 2.18 33.97 217.65 0.34 0.00 0.000 0.300 0.024179 1.50 1.40 0.00838 0.00 0.02454 0.05 0.16 2.18 34.14 218.03 0.34 0.00 0.000 0.300 0.025180 1.40 1.30 0.00853 0.00 0.02486 0.05 0.16 2.18 34.31 218.41 0.34 0.00 0.000 0.300 0.025181 1.30 1.20 0.00868 0.00 0.02518 0.05 0.16 2.19 34.48 218.78 0.34 0.00 0.000 0.300 0.025
TOT 0.59 402.42 2599.82AVG 0.02335 0.15 2.17 0.34CUM 25.15
********************************************** BIOLOGICAL AND PHYSICAL COEFFICIENTS ***********************************************
ELEM ENDING SAT REAER CBOD CBOD ANBOD BKGD FULL CORR ORGN ORGN NH3 NH3 DENIT PO4 ALG MAC COLI NCM NCMNO. DIST D.O. RATE DECAY SETT DECAY SOD SOD SOD DECAY SETT DECAY SRCE RATE SRCE PROD PROD DECAY DECAY SETT
mg/L 1/da 1/da 1/da 1/da * * * 1/da 1/da 1/da * 1/da * ** ** 1/da 1/da 1/da
170 2.300 8.23 7.07 0.08 0.06 0.00 8.05 8.05 8.05 0.18 0.06 0.35 0.00 0.00 0.00 0.28 0.00 0.00 0.01 0.06171 2.200 8.23 7.08 0.07 0.06 0.00 8.05 8.05 8.05 0.18 0.06 0.34 0.00 0.00 0.00 0.28 0.00 0.00 0.01 0.06172 2.100 8.23 7.09 0.07 0.06 0.00 8.05 8.05 8.05 0.18 0.06 0.34 0.00 0.00 0.00 0.29 0.00 0.00 0.01 0.06173 2.000 8.23 7.10 0.07 0.06 0.00 8.05 8.05 8.05 0.18 0.06 0.34 0.00 0.00 0.00 0.29 0.00 0.00 0.01 0.06174 1.900 8.23 7.11 0.07 0.06 0.00 8.05 8.05 8.05 0.18 0.06 0.34 0.00 0.00 0.00 0.30 0.00 0.00 0.01 0.06175 1.800 8.23 7.12 0.07 0.06 0.00 8.05 8.05 8.05 0.18 0.06 0.34 0.00 0.00 0.00 0.30 0.00 0.00 0.01 0.06176 1.700 8.23 7.13 0.07 0.06 0.00 8.05 8.05 8.05 0.18 0.06 0.34 0.00 0.00 0.00 0.31 0.00 0.00 0.01 0.06177 1.600 8.23 7.14 0.07 0.06 0.00 8.05 8.05 8.05 0.18 0.06 0.35 0.00 0.00 0.00 0.32 0.00 0.00 0.01 0.06178 1.500 8.23 7.15 0.07 0.06 0.00 8.05 8.05 8.05 0.18 0.06 0.35 0.00 0.00 0.00 0.32 0.00 0.00 0.01 0.06179 1.400 8.23 7.16 0.08 0.06 0.00 8.05 8.05 8.05 0.18 0.06 0.36 0.00 0.00 0.00 0.33 0.00 0.00 0.01 0.06180 1.300 8.23 7.17 0.08 0.06 0.00 8.05 8.05 8.05 0.18 0.06 0.36 0.00 0.00 0.00 0.33 0.00 0.00 0.01 0.06
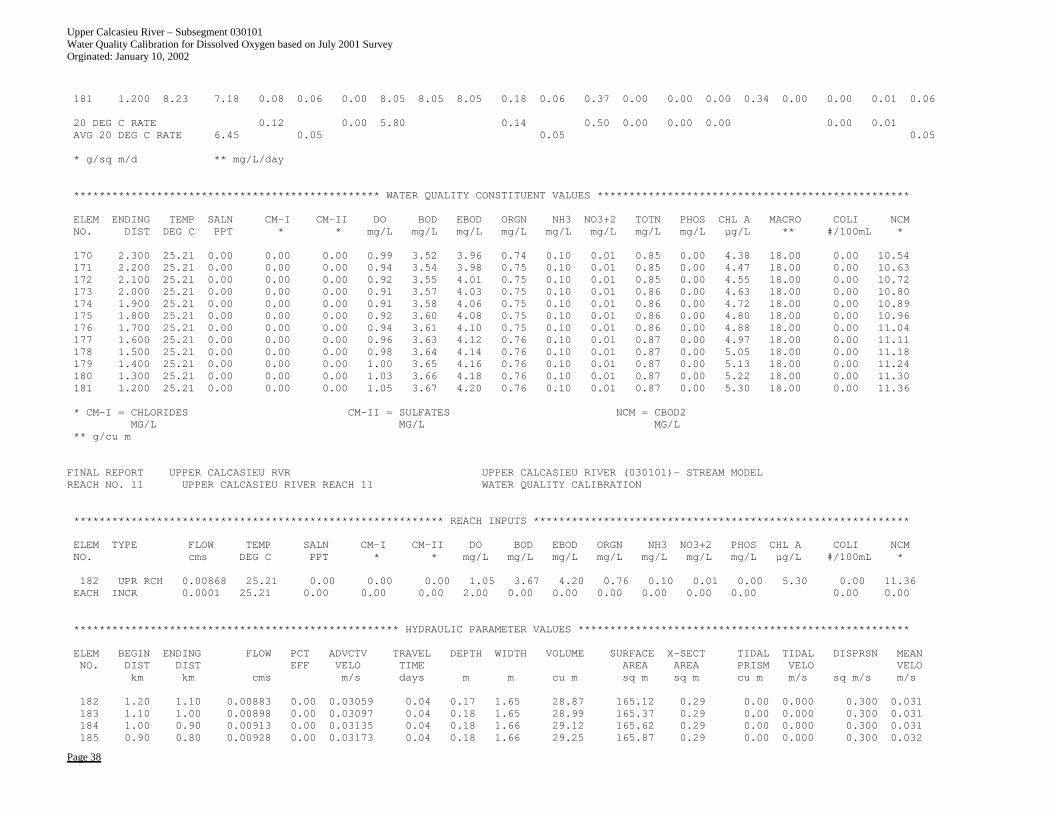
Upper Calcasieu River – Subsegment 030101 Water Quality Calibration for Dissolved Oxygen based on July 2001 Survey Orginated: January 10, 2002
Page 38
181 1.200 8.23 7.18 0.08 0.06 0.00 8.05 8.05 8.05 0.18 0.06 0.37 0.00 0.00 0.00 0.34 0.00 0.00 0.01 0.06
20 DEG C RATE 0.12 0.00 5.80 0.14 0.50 0.00 0.00 0.00 0.00 0.01AVG 20 DEG C RATE 6.45 0.05 0.05 0.05
* g/sq m/d ** mg/L/day
************************************************ WATER QUALITY CONSTITUENT VALUES *************************************************
ELEM ENDING TEMP SALN CM-I CM-II DO BOD EBOD ORGN NH3 NO3+2 TOTN PHOS CHL A MACRO COLI NCMNO. DIST DEG C PPT * * mg/L mg/L mg/L mg/L mg/L mg/L mg/L mg/L µg/L ** #/100mL *
170 2.300 25.21 0.00 0.00 0.00 0.99 3.52 3.96 0.74 0.10 0.01 0.85 0.00 4.38 18.00 0.00 10.54171 2.200 25.21 0.00 0.00 0.00 0.94 3.54 3.98 0.75 0.10 0.01 0.85 0.00 4.47 18.00 0.00 10.63172 2.100 25.21 0.00 0.00 0.00 0.92 3.55 4.01 0.75 0.10 0.01 0.85 0.00 4.55 18.00 0.00 10.72173 2.000 25.21 0.00 0.00 0.00 0.91 3.57 4.03 0.75 0.10 0.01 0.86 0.00 4.63 18.00 0.00 10.80174 1.900 25.21 0.00 0.00 0.00 0.91 3.58 4.06 0.75 0.10 0.01 0.86 0.00 4.72 18.00 0.00 10.89175 1.800 25.21 0.00 0.00 0.00 0.92 3.60 4.08 0.75 0.10 0.01 0.86 0.00 4.80 18.00 0.00 10.96176 1.700 25.21 0.00 0.00 0.00 0.94 3.61 4.10 0.75 0.10 0.01 0.86 0.00 4.88 18.00 0.00 11.04177 1.600 25.21 0.00 0.00 0.00 0.96 3.63 4.12 0.76 0.10 0.01 0.87 0.00 4.97 18.00 0.00 11.11178 1.500 25.21 0.00 0.00 0.00 0.98 3.64 4.14 0.76 0.10 0.01 0.87 0.00 5.05 18.00 0.00 11.18179 1.400 25.21 0.00 0.00 0.00 1.00 3.65 4.16 0.76 0.10 0.01 0.87 0.00 5.13 18.00 0.00 11.24180 1.300 25.21 0.00 0.00 0.00 1.03 3.66 4.18 0.76 0.10 0.01 0.87 0.00 5.22 18.00 0.00 11.30181 1.200 25.21 0.00 0.00 0.00 1.05 3.67 4.20 0.76 0.10 0.01 0.87 0.00 5.30 18.00 0.00 11.36
* CM-I = CHLORIDES CM-II = SULFATES NCM = CBOD2MG/L MG/L MG/L
** g/cu m
FINAL REPORT UPPER CALCASIEU RVR UPPER CALCASIEU RIVER (030101)- STREAM MODELREACH NO. 11 UPPER CALCASIEU RIVER REACH 11 WATER QUALITY CALIBRATION
********************************************************** REACH INPUTS ***********************************************************
ELEM TYPE FLOW TEMP SALN CM-I CM-II DO BOD EBOD ORGN NH3 NO3+2 PHOS CHL A COLI NCMNO. cms DEG C PPT * * mg/L mg/L mg/L mg/L mg/L mg/L mg/L µg/L #/100mL *
182 UPR RCH 0.00868 25.21 0.00 0.00 0.00 1.05 3.67 4.20 0.76 0.10 0.01 0.00 5.30 0.00 11.36EACH INCR 0.0001 25.21 0.00 0.00 0.00 2.00 0.00 0.00 0.00 0.00 0.00 0.00 0.00 0.00
*************************************************** HYDRAULIC PARAMETER VALUES ****************************************************
ELEM BEGIN ENDING FLOW PCT ADVCTV TRAVEL DEPTH WIDTH VOLUME SURFACE X-SECT TIDAL TIDAL DISPRSN MEANNO. DIST DIST EFF VELO TIME AREA AREA PRISM VELO VELO
km km cms m/s days m m cu m sq m sq m cu m m/s sq m/s m/s
182 1.20 1.10 0.00883 0.00 0.03059 0.04 0.17 1.65 28.87 165.12 0.29 0.00 0.000 0.300 0.031183 1.10 1.00 0.00898 0.00 0.03097 0.04 0.18 1.65 28.99 165.37 0.29 0.00 0.000 0.300 0.031184 1.00 0.90 0.00913 0.00 0.03135 0.04 0.18 1.66 29.12 165.62 0.29 0.00 0.000 0.300 0.031185 0.90 0.80 0.00928 0.00 0.03173 0.04 0.18 1.66 29.25 165.87 0.29 0.00 0.000 0.300 0.032
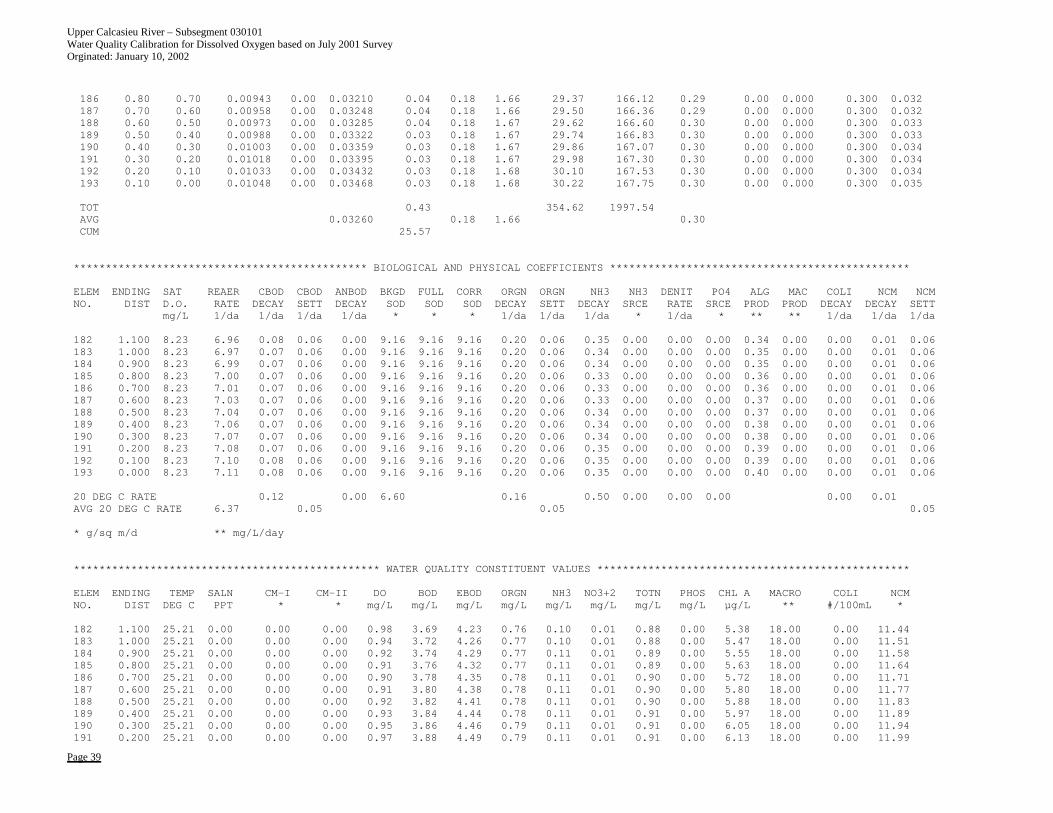
Upper Calcasieu River – Subsegment 030101 Water Quality Calibration for Dissolved Oxygen based on July 2001 Survey Orginated: January 10, 2002
Page 39
186 0.80 0.70 0.00943 0.00 0.03210 0.04 0.18 1.66 29.37 166.12 0.29 0.00 0.000 0.300 0.032187 0.70 0.60 0.00958 0.00 0.03248 0.04 0.18 1.66 29.50 166.36 0.29 0.00 0.000 0.300 0.032188 0.60 0.50 0.00973 0.00 0.03285 0.04 0.18 1.67 29.62 166.60 0.30 0.00 0.000 0.300 0.033189 0.50 0.40 0.00988 0.00 0.03322 0.03 0.18 1.67 29.74 166.83 0.30 0.00 0.000 0.300 0.033190 0.40 0.30 0.01003 0.00 0.03359 0.03 0.18 1.67 29.86 167.07 0.30 0.00 0.000 0.300 0.034191 0.30 0.20 0.01018 0.00 0.03395 0.03 0.18 1.67 29.98 167.30 0.30 0.00 0.000 0.300 0.034192 0.20 0.10 0.01033 0.00 0.03432 0.03 0.18 1.68 30.10 167.53 0.30 0.00 0.000 0.300 0.034193 0.10 0.00 0.01048 0.00 0.03468 0.03 0.18 1.68 30.22 167.75 0.30 0.00 0.000 0.300 0.035
TOT 0.43 354.62 1997.54AVG 0.03260 0.18 1.66 0.30CUM 25.57
********************************************** BIOLOGICAL AND PHYSICAL COEFFICIENTS ***********************************************
ELEM ENDING SAT REAER CBOD CBOD ANBOD BKGD FULL CORR ORGN ORGN NH3 NH3 DENIT PO4 ALG MAC COLI NCM NCMNO. DIST D.O. RATE DECAY SETT DECAY SOD SOD SOD DECAY SETT DECAY SRCE RATE SRCE PROD PROD DECAY DECAY SETT
mg/L 1/da 1/da 1/da 1/da * * * 1/da 1/da 1/da * 1/da * ** ** 1/da 1/da 1/da
182 1.100 8.23 6.96 0.08 0.06 0.00 9.16 9.16 9.16 0.20 0.06 0.35 0.00 0.00 0.00 0.34 0.00 0.00 0.01 0.06183 1.000 8.23 6.97 0.07 0.06 0.00 9.16 9.16 9.16 0.20 0.06 0.34 0.00 0.00 0.00 0.35 0.00 0.00 0.01 0.06184 0.900 8.23 6.99 0.07 0.06 0.00 9.16 9.16 9.16 0.20 0.06 0.34 0.00 0.00 0.00 0.35 0.00 0.00 0.01 0.06185 0.800 8.23 7.00 0.07 0.06 0.00 9.16 9.16 9.16 0.20 0.06 0.33 0.00 0.00 0.00 0.36 0.00 0.00 0.01 0.06186 0.700 8.23 7.01 0.07 0.06 0.00 9.16 9.16 9.16 0.20 0.06 0.33 0.00 0.00 0.00 0.36 0.00 0.00 0.01 0.06187 0.600 8.23 7.03 0.07 0.06 0.00 9.16 9.16 9.16 0.20 0.06 0.33 0.00 0.00 0.00 0.37 0.00 0.00 0.01 0.06188 0.500 8.23 7.04 0.07 0.06 0.00 9.16 9.16 9.16 0.20 0.06 0.34 0.00 0.00 0.00 0.37 0.00 0.00 0.01 0.06189 0.400 8.23 7.06 0.07 0.06 0.00 9.16 9.16 9.16 0.20 0.06 0.34 0.00 0.00 0.00 0.38 0.00 0.00 0.01 0.06190 0.300 8.23 7.07 0.07 0.06 0.00 9.16 9.16 9.16 0.20 0.06 0.34 0.00 0.00 0.00 0.38 0.00 0.00 0.01 0.06191 0.200 8.23 7.08 0.07 0.06 0.00 9.16 9.16 9.16 0.20 0.06 0.35 0.00 0.00 0.00 0.39 0.00 0.00 0.01 0.06192 0.100 8.23 7.10 0.08 0.06 0.00 9.16 9.16 9.16 0.20 0.06 0.35 0.00 0.00 0.00 0.39 0.00 0.00 0.01 0.06193 0.000 8.23 7.11 0.08 0.06 0.00 9.16 9.16 9.16 0.20 0.06 0.35 0.00 0.00 0.00 0.40 0.00 0.00 0.01 0.06
20 DEG C RATE 0.12 0.00 6.60 0.16 0.50 0.00 0.00 0.00 0.00 0.01AVG 20 DEG C RATE 6.37 0.05 0.05 0.05
* g/sq m/d ** mg/L/day
************************************************ WATER QUALITY CONSTITUENT VALUES *************************************************
ELEM ENDING TEMP SALN CM-I CM-II DO BOD EBOD ORGN NH3 NO3+2 TOTN PHOS CHL A MACRO COLI NCMNO. DIST DEG C PPT * * mg/L mg/L mg/L mg/L mg/L mg/L mg/L mg/L µg/L ** #/100mL *
182 1.100 25.21 0.00 0.00 0.00 0.98 3.69 4.23 0.76 0.10 0.01 0.88 0.00 5.38 18.00 0.00 11.44183 1.000 25.21 0.00 0.00 0.00 0.94 3.72 4.26 0.77 0.10 0.01 0.88 0.00 5.47 18.00 0.00 11.51184 0.900 25.21 0.00 0.00 0.00 0.92 3.74 4.29 0.77 0.11 0.01 0.89 0.00 5.55 18.00 0.00 11.58185 0.800 25.21 0.00 0.00 0.00 0.91 3.76 4.32 0.77 0.11 0.01 0.89 0.00 5.63 18.00 0.00 11.64186 0.700 25.21 0.00 0.00 0.00 0.90 3.78 4.35 0.78 0.11 0.01 0.90 0.00 5.72 18.00 0.00 11.71187 0.600 25.21 0.00 0.00 0.00 0.91 3.80 4.38 0.78 0.11 0.01 0.90 0.00 5.80 18.00 0.00 11.77188 0.500 25.21 0.00 0.00 0.00 0.92 3.82 4.41 0.78 0.11 0.01 0.90 0.00 5.88 18.00 0.00 11.83189 0.400 25.21 0.00 0.00 0.00 0.93 3.84 4.44 0.78 0.11 0.01 0.91 0.00 5.97 18.00 0.00 11.89190 0.300 25.21 0.00 0.00 0.00 0.95 3.86 4.46 0.79 0.11 0.01 0.91 0.00 6.05 18.00 0.00 11.94191 0.200 25.21 0.00 0.00 0.00 0.97 3.88 4.49 0.79 0.11 0.01 0.91 0.00 6.13 18.00 0.00 11.99
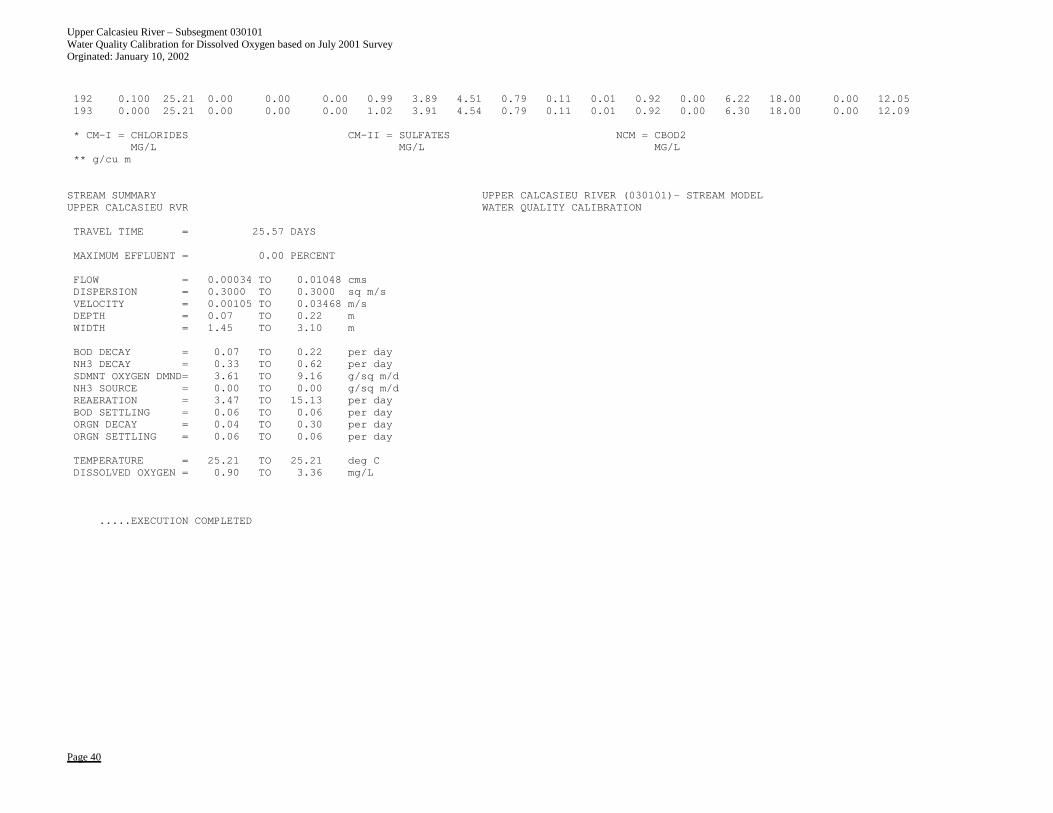
Upper Calcasieu River – Subsegment 030101 Water Quality Calibration for Dissolved Oxygen based on July 2001 Survey Orginated: January 10, 2002
Page 40
192 0.100 25.21 0.00 0.00 0.00 0.99 3.89 4.51 0.79 0.11 0.01 0.92 0.00 6.22 18.00 0.00 12.05193 0.000 25.21 0.00 0.00 0.00 1.02 3.91 4.54 0.79 0.11 0.01 0.92 0.00 6.30 18.00 0.00 12.09
* CM-I = CHLORIDES CM-II = SULFATES NCM = CBOD2MG/L MG/L MG/L
** g/cu m
STREAM SUMMARY UPPER CALCASIEU RIVER (030101)- STREAM MODELUPPER CALCASIEU RVR WATER QUALITY CALIBRATION
TRAVEL TIME = 25.57 DAYS
MAXIMUM EFFLUENT = 0.00 PERCENT
FLOW = 0.00034 TO 0.01048 cmsDISPERSION = 0.3000 TO 0.3000 sq m/sVELOCITY = 0.00105 TO 0.03468 m/sDEPTH = 0.07 TO 0.22 mWIDTH = 1.45 TO 3.10 m
BOD DECAY = 0.07 TO 0.22 per dayNH3 DECAY = 0.33 TO 0.62 per daySDMNT OXYGEN DMND= 3.61 TO 9.16 g/sq m/dNH3 SOURCE = 0.00 TO 0.00 g/sq m/dREAERATION = 3.47 TO 15.13 per dayBOD SETTLING = 0.06 TO 0.06 per dayORGN DECAY = 0.04 TO 0.30 per dayORGN SETTLING = 0.06 TO 0.06 per day
TEMPERATURE = 25.21 TO 25.21 deg CDISSOLVED OXYGEN = 0.90 TO 3.36 mg/L
.....EXECUTION COMPLETED
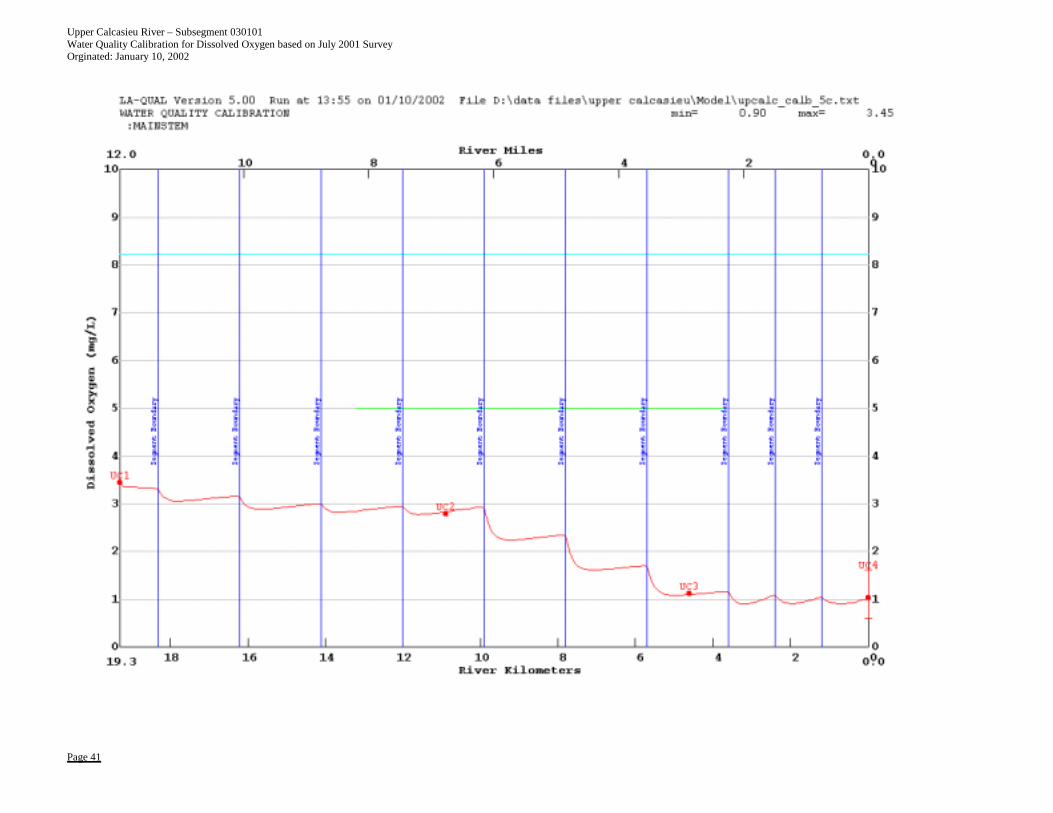
Upper Calcasieu River – Subsegment 030101 Water Quality Calibration for Dissolved Oxygen based on July 2001 Survey Orginated: January 10, 2002
Page 41
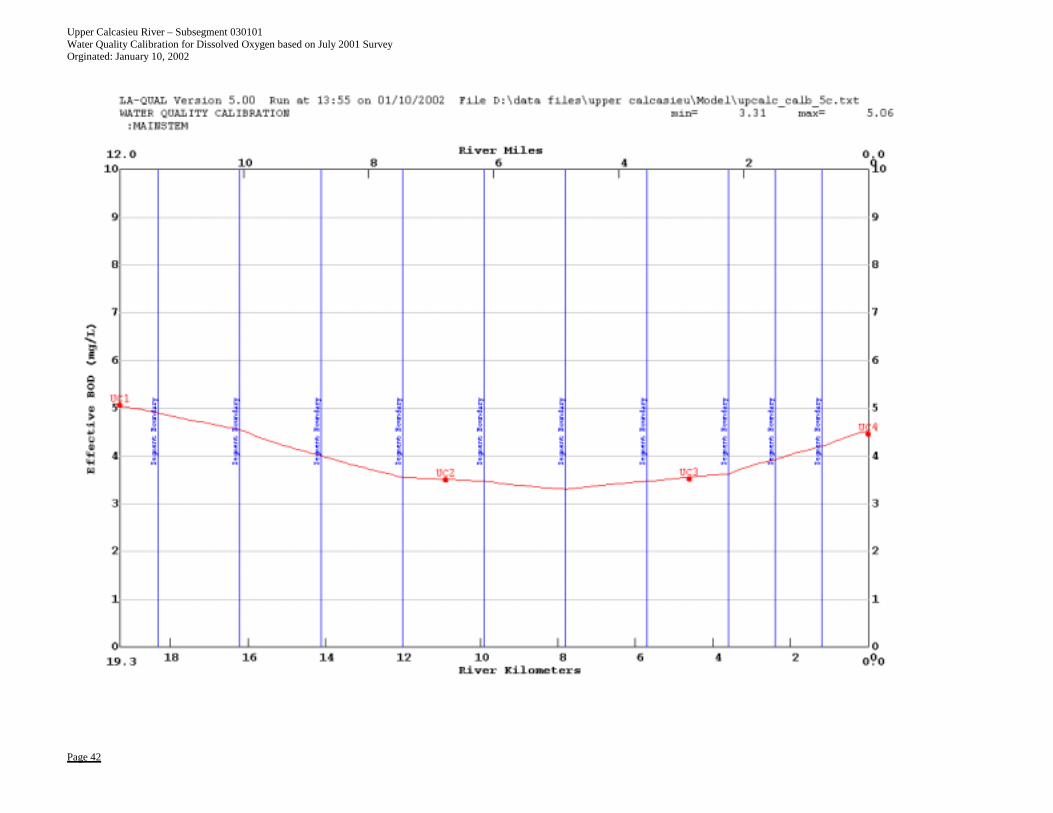
Upper Calcasieu River – Subsegment 030101 Water Quality Calibration for Dissolved Oxygen based on July 2001 Survey Orginated: January 10, 2002
Page 42
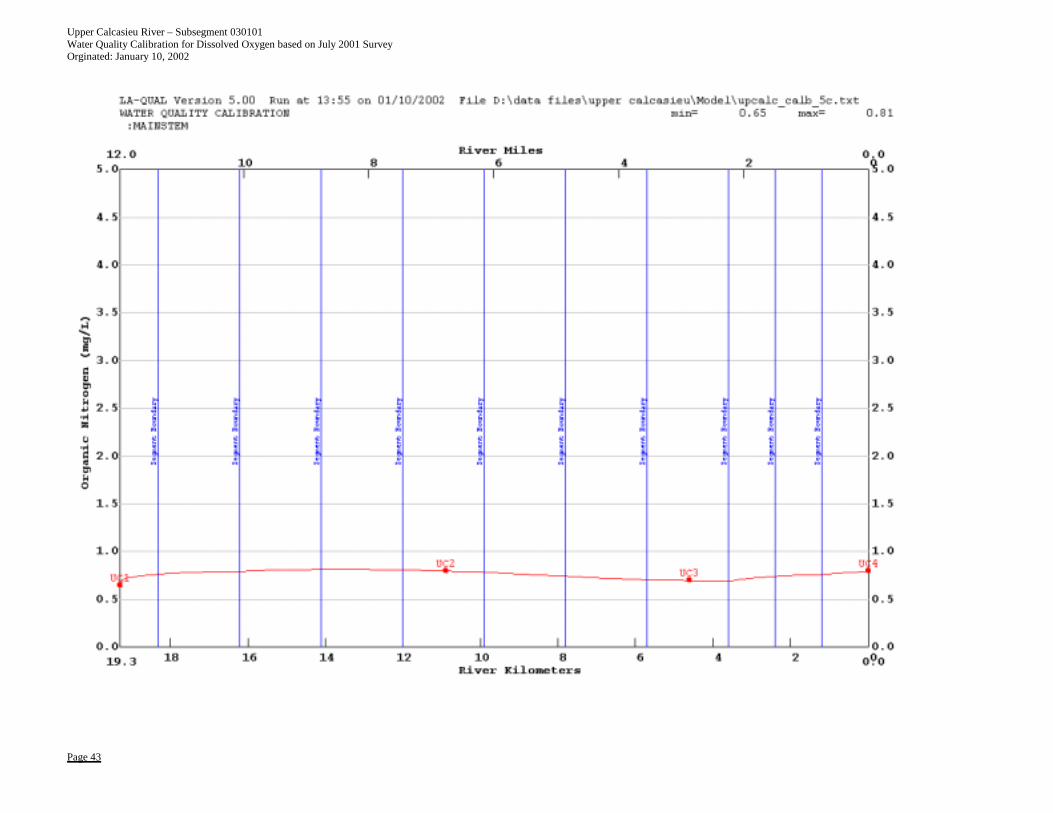
Upper Calcasieu River – Subsegment 030101 Water Quality Calibration for Dissolved Oxygen based on July 2001 Survey Orginated: January 10, 2002
Page 43
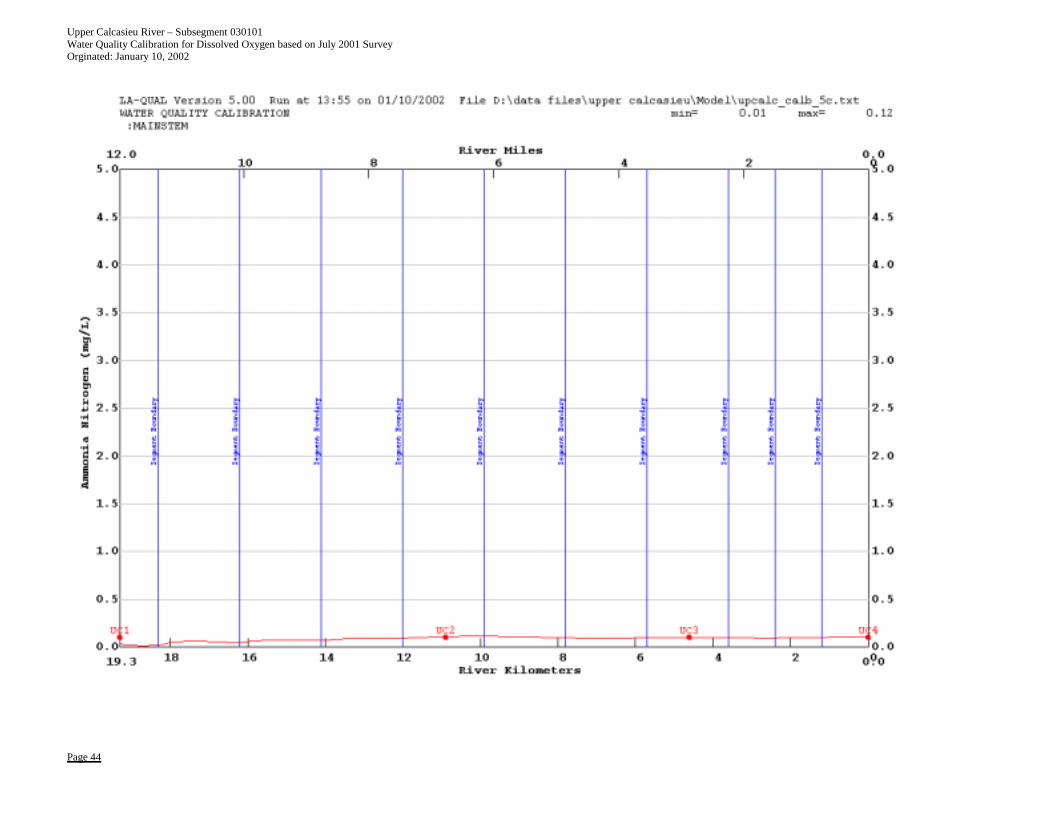
Upper Calcasieu River – Subsegment 030101 Water Quality Calibration for Dissolved Oxygen based on July 2001 Survey Orginated: January 10, 2002
Page 44
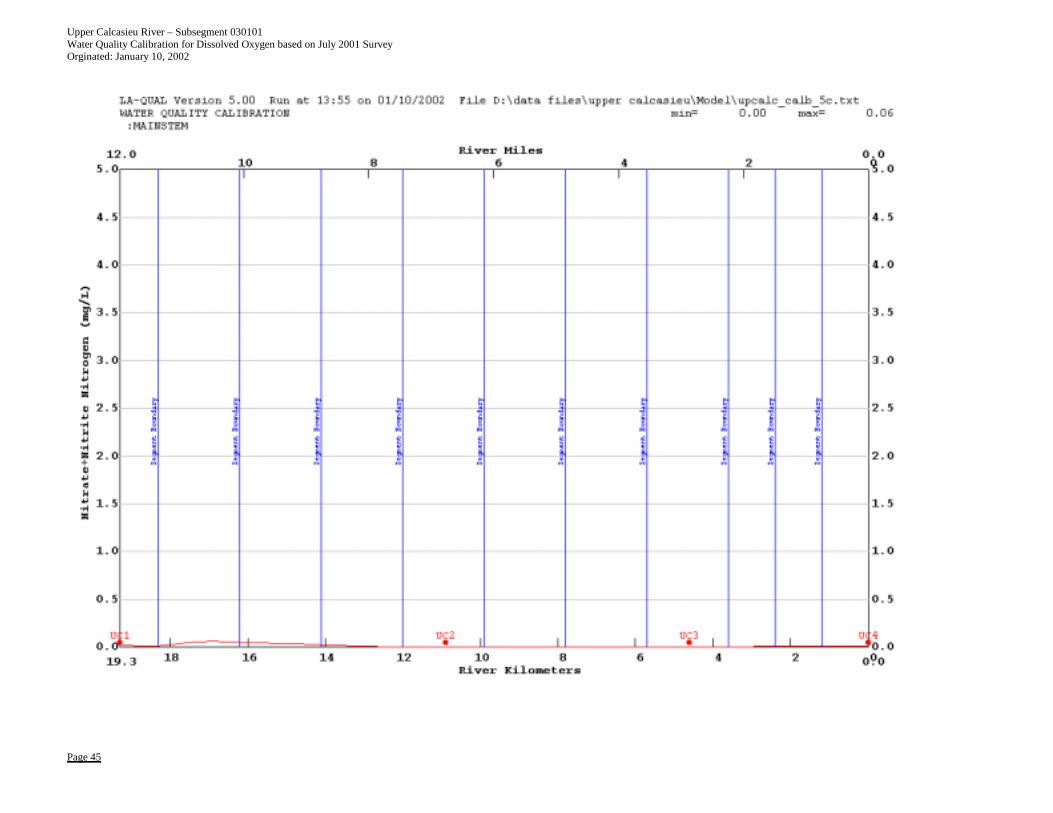
Upper Calcasieu River – Subsegment 030101 Water Quality Calibration for Dissolved Oxygen based on July 2001 Survey Orginated: January 10, 2002
Page 45
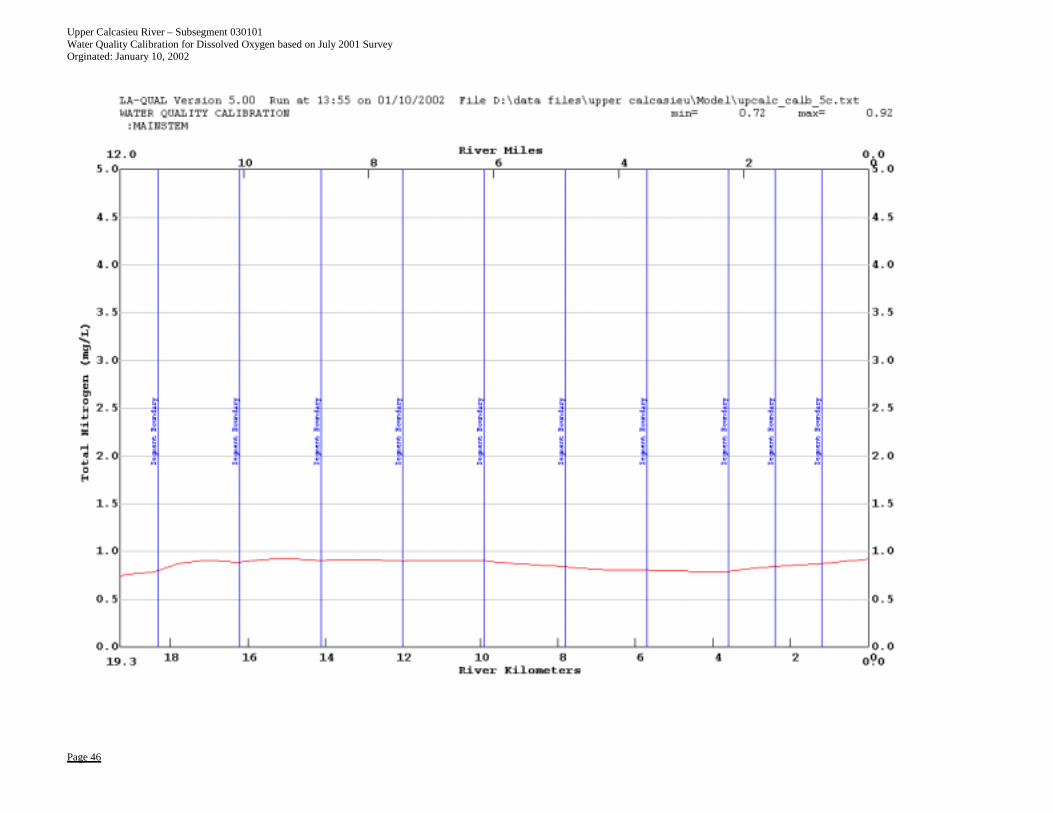
Upper Calcasieu River – Subsegment 030101 Water Quality Calibration for Dissolved Oxygen based on July 2001 Survey Orginated: January 10, 2002
Page 46
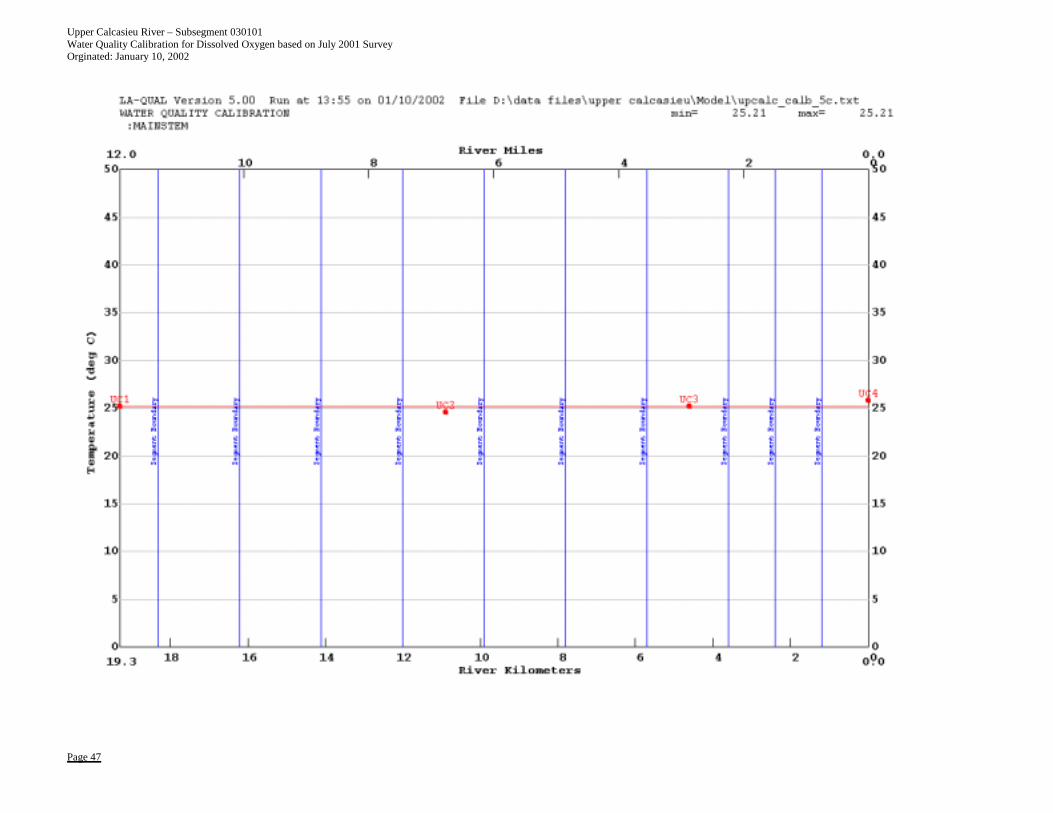
Upper Calcasieu River – Subsegment 030101 Water Quality Calibration for Dissolved Oxygen based on July 2001 Survey Orginated: January 10, 2002
Page 47
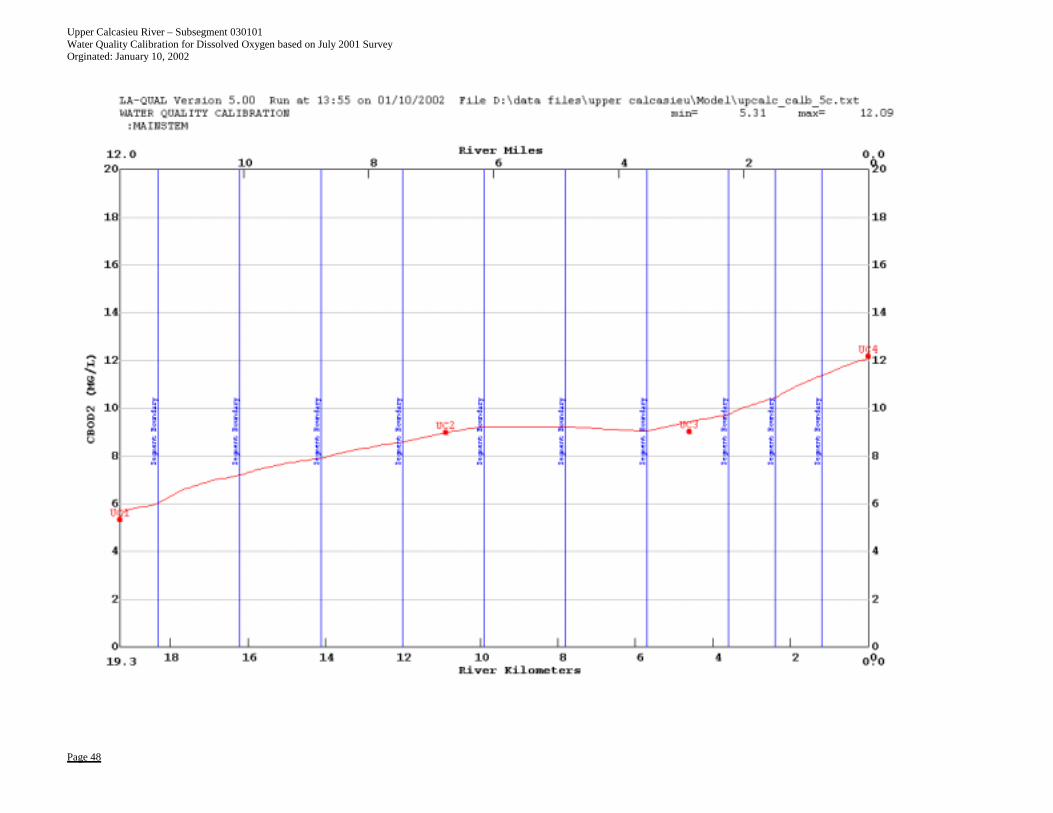
Upper Calcasieu River – Subsegment 030101 Water Quality Calibration for Dissolved Oxygen based on July 2001 Survey Orginated: January 10, 2002
Page 48
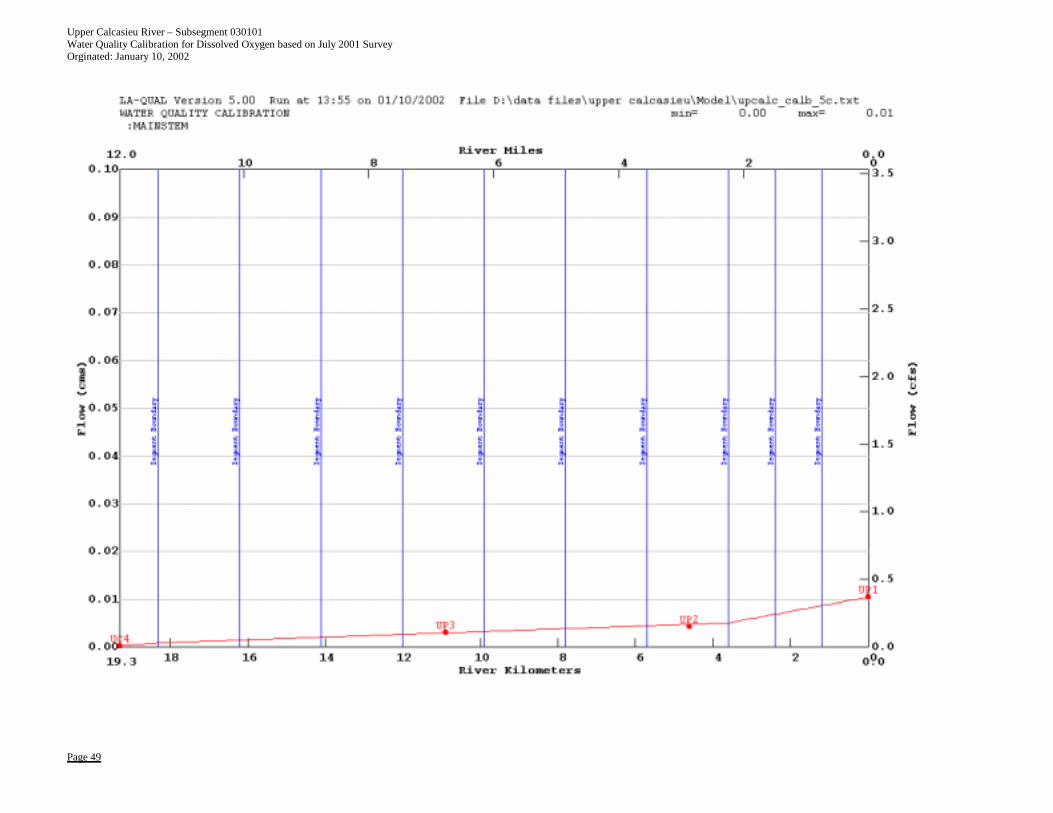
Upper Calcasieu River – Subsegment 030101 Water Quality Calibration for Dissolved Oxygen based on July 2001 Survey Orginated: January 10, 2002
Page 49
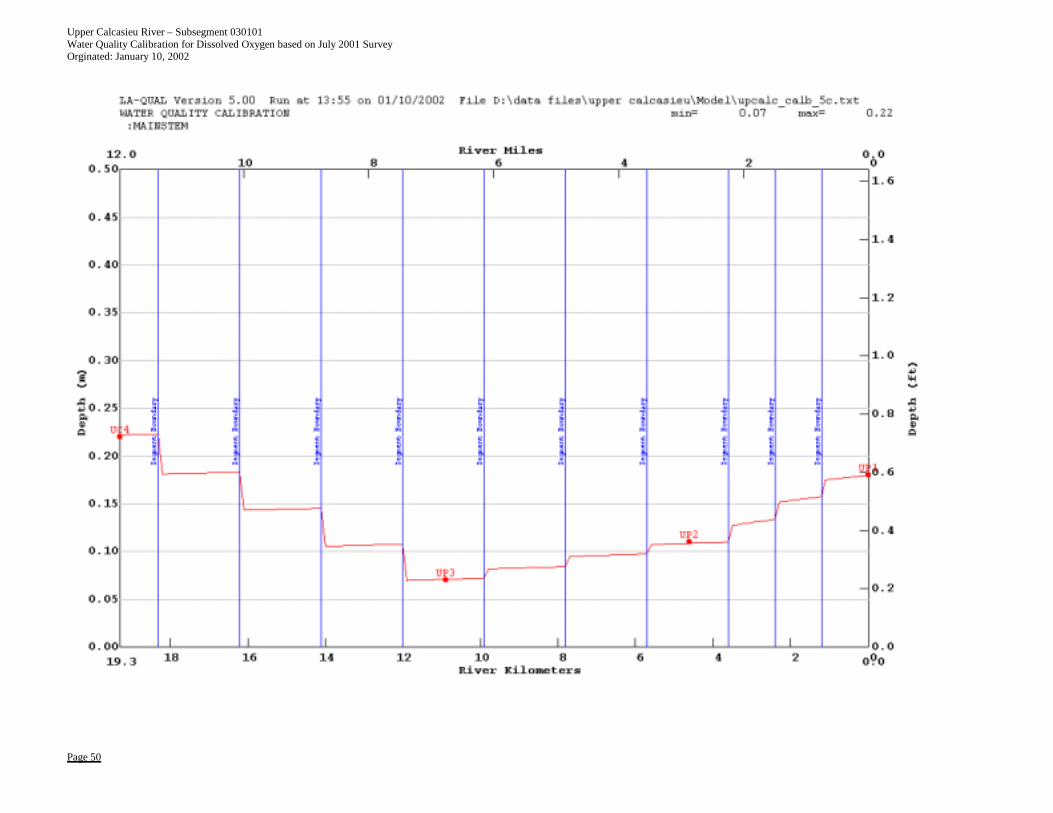
Upper Calcasieu River – Subsegment 030101 Water Quality Calibration for Dissolved Oxygen based on July 2001 Survey Orginated: January 10, 2002
Page 50
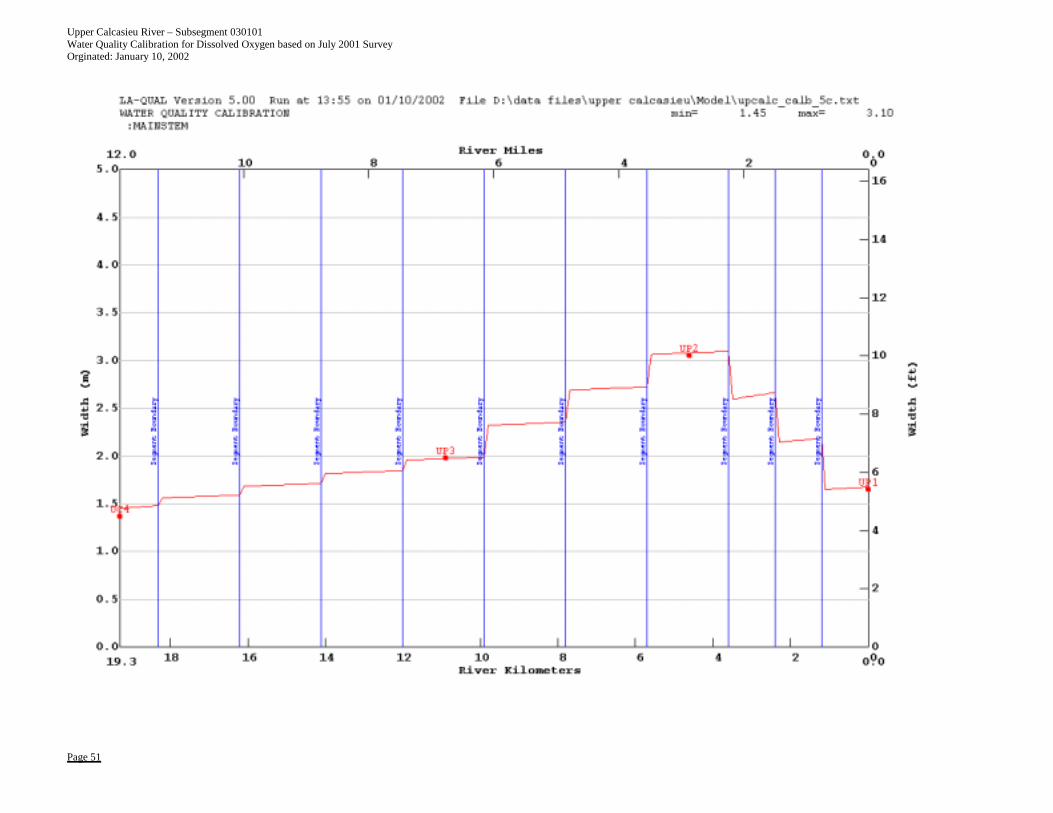
Upper Calcasieu River – Subsegment 030101 Water Quality Calibration for Dissolved Oxygen based on July 2001 Survey Orginated: January 10, 2002
Page 51
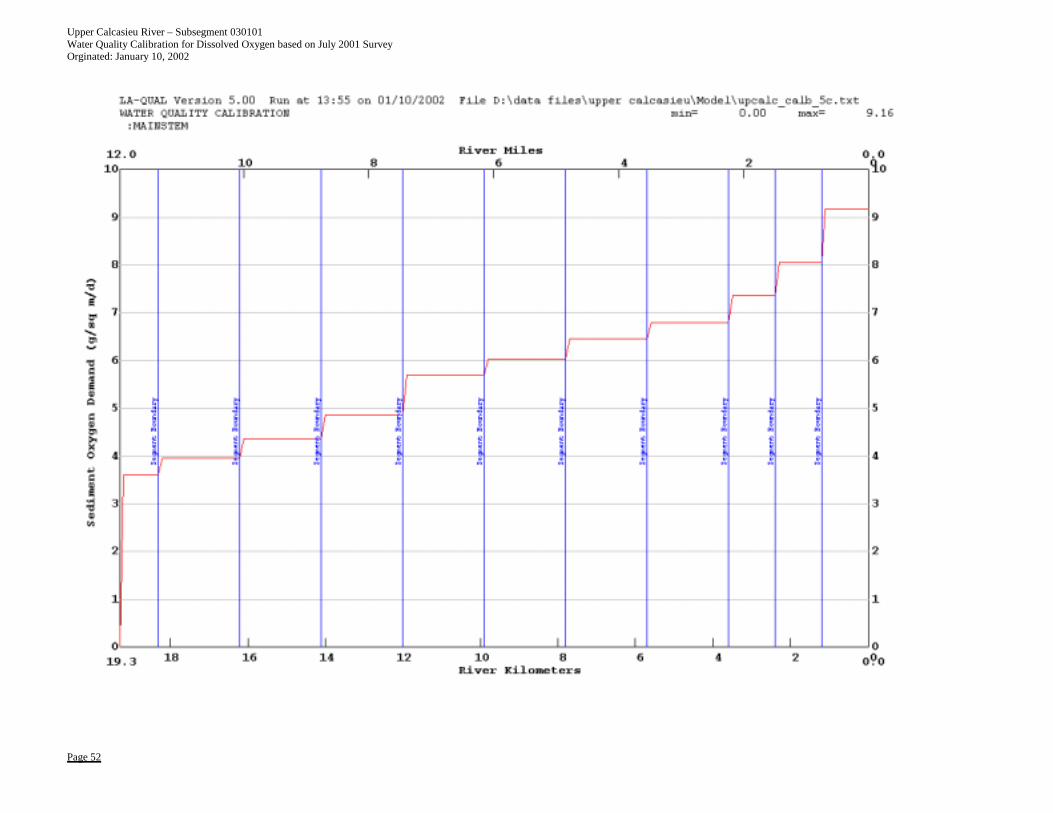
Upper Calcasieu River – Subsegment 030101 Water Quality Calibration for Dissolved Oxygen based on July 2001 Survey Orginated: January 10, 2002
Page 52
Upper Calcasieu River Watershed TMDL for Dissolved Oxygen Subsegment 080808 Originated: January 9, 2002
28
Appendix A3
Calibration Model Development
Calibration model input justification form
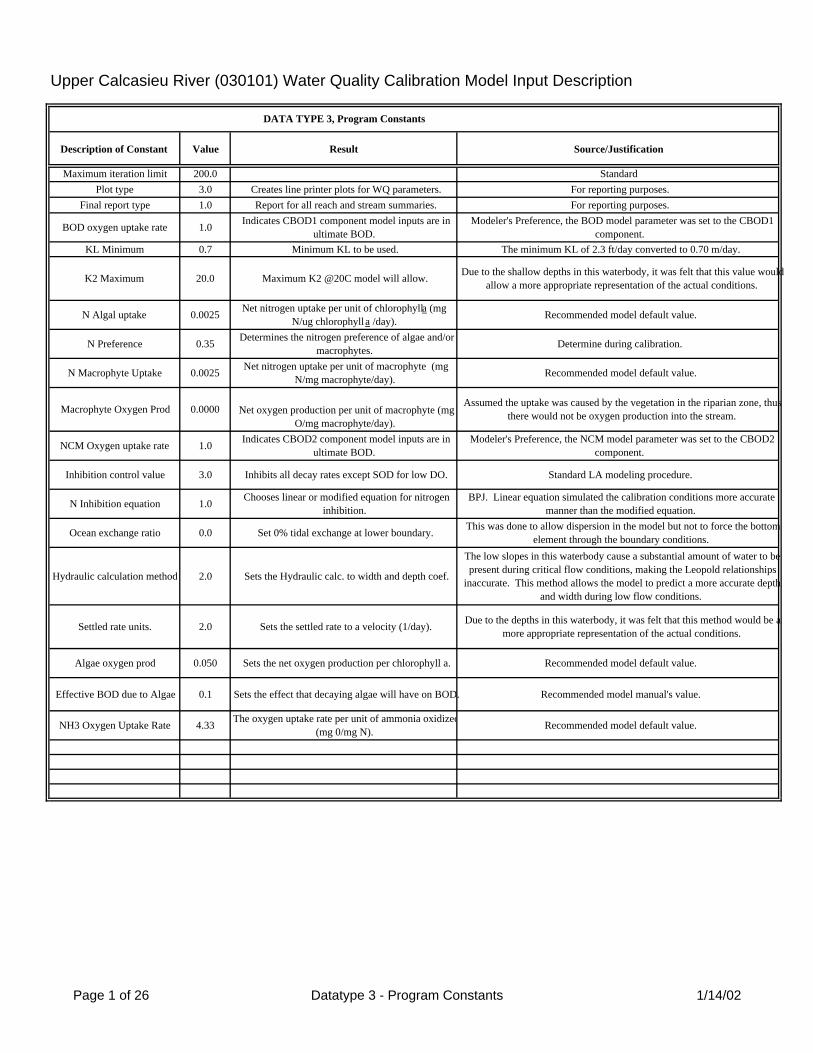
Upper Calcasieu River (030101) Water Quality Calibration Model Input Description
DATA TYPE 3, Program Constants
Description of Constant Value Result Source/Justification
Maximum iteration limit 200.0 StandardPlot type 3.0 Creates line printer plots for WQ parameters. For reporting purposes.
Final report type 1.0 Report for all reach and stream summaries. For reporting purposes.
BOD oxygen uptake rate 1.0 Indicates CBOD1 component model inputs are in ultimate BOD.
Modeler's Preference, the BOD model parameter was set to the CBOD1 component.
KL Minimum 0.7 Minimum KL to be used. The minimum KL of 2.3 ft/day converted to 0.70 m/day.
K2 Maximum 20.0 Maximum K2 @20C model will allow. Due to the shallow depths in this waterbody, it was felt that this value would allow a more appropriate representation of the actual conditions.
N Algal uptake 0.0025 Net nitrogen uptake per unit of chlorophyll a (mg N/ug chlorophyll a /day). Recommended model default value.
N Preference 0.35 Determines the nitrogen preference of algae and/or macrophytes. Determine during calibration.
N Macrophyte Uptake 0.0025 Net nitrogen uptake per unit of macrophyte (mg N/mg macrophyte/day). Recommended model default value.
Macrophyte Oxygen Prod 0.0000 Net oxygen production per unit of macrophyte (mg O/mg macrophyte/day).
Assumed the uptake was caused by the vegetation in the riparian zone, thus there would not be oxygen production into the stream.
NCM Oxygen uptake rate 1.0 Indicates CBOD2 component model inputs are in ultimate BOD.
Modeler's Preference, the NCM model parameter was set to the CBOD2 component.
Inhibition control value 3.0 Inhibits all decay rates except SOD for low DO. Standard LA modeling procedure.
N Inhibition equation 1.0 Chooses linear or modified equation for nitrogen inhibition.
BPJ. Linear equation simulated the calibration conditions more accurate manner than the modified equation.
Ocean exchange ratio 0.0 Set 0% tidal exchange at lower boundary. This was done to allow dispersion in the model but not to force the bottom element through the boundary conditions.
Hydraulic calculation method 2.0 Sets the Hydraulic calc. to width and depth coef.
The low slopes in this waterbody cause a substantial amount of water to be present during critical flow conditions, making the Leopold relationships
inaccurate. This method allows the model to predict a more accurate depth and width during low flow conditions.
Settled rate units. 2.0 Sets the settled rate to a velocity (1/day). Due to the depths in this waterbody, it was felt that this method would be a more appropriate representation of the actual conditions.
Algae oxygen prod 0.050 Sets the net oxygen production per chlorophyll a. Recommended model default value.
Effective BOD due to Algae 0.1 Sets the effect that decaying algae will have on BOD. Recommended model manual's value.
NH3 Oxygen Uptake Rate 4.33 The oxygen uptake rate per unit of ammonia oxidized(mg 0/mg N). Recommended model default value.
Page 1 of 26 Datatype 3 - Program Constants 1/14/02
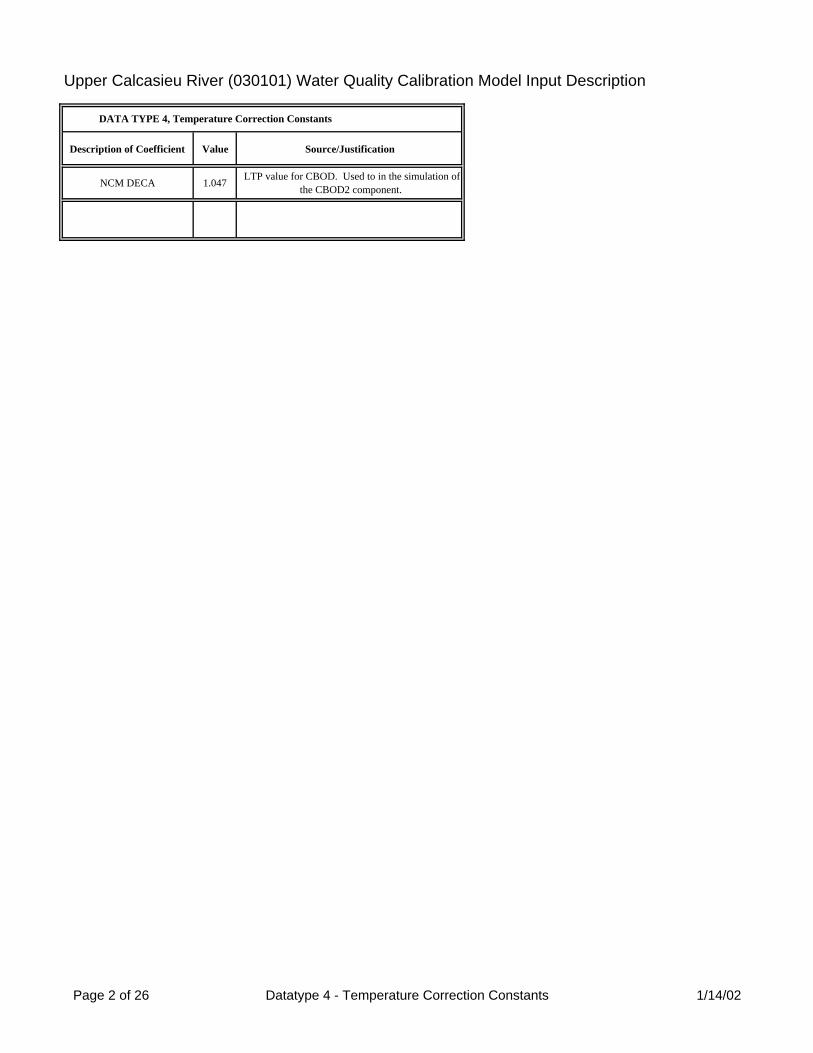
Upper Calcasieu River (030101) Water Quality Calibration Model Input Description
DATA TYPE 4, Temperature Correction Constants
Description of Coefficient Value Source/Justification
NCM DECA 1.047 LTP value for CBOD. Used to in the simulation of the CBOD2 component.
Page 2 of 26 Datatype 4 - Temperature Correction Constants 1/14/02
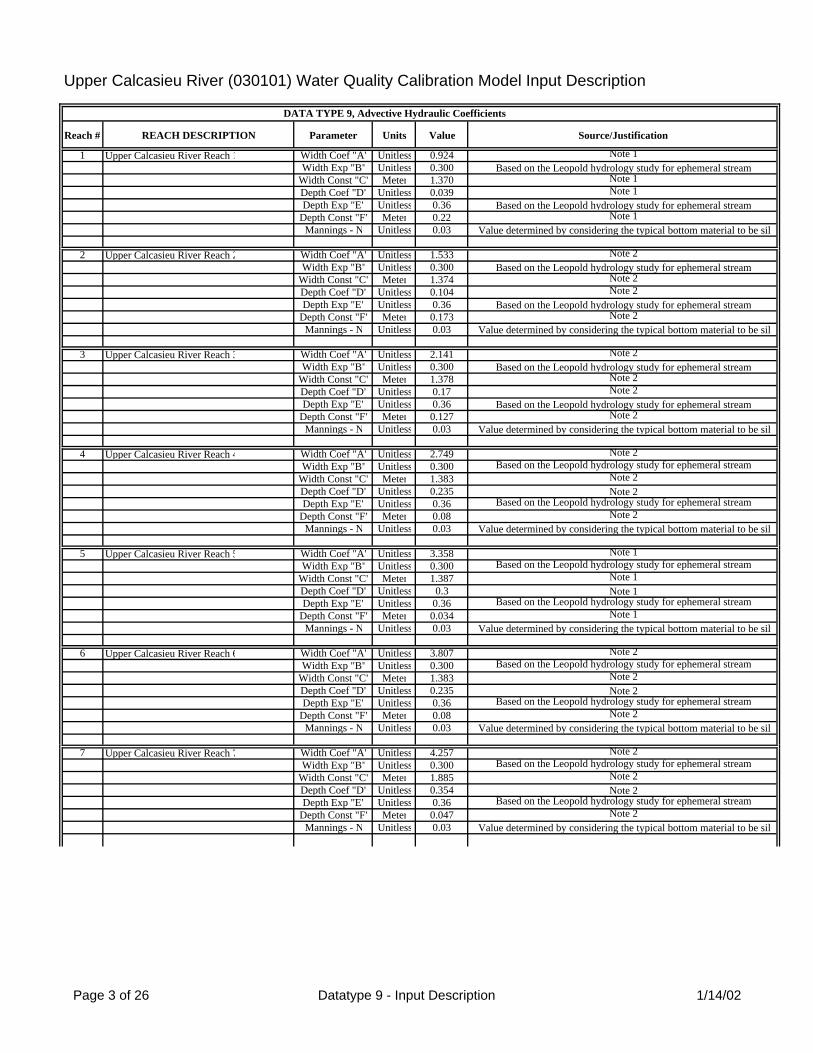
Upper Calcasieu River (030101) Water Quality Calibration Model Input Description
DATA TYPE 9, Advective Hydraulic Coefficients
Reach # REACH DESCRIPTION Parameter Units Value Source/Justification
1 Upper Calcasieu River Reach 1 Width Coef "A" Unitless 0.924 Note 1Width Exp "B" Unitless 0.300 Based on the Leopold hydrology study for ephemeral stream
Width Const "C" Meter 1.370 Note 1Depth Coef "D" Unitless 0.039 Note 1Depth Exp "E" Unitless 0.36 Based on the Leopold hydrology study for ephemeral stream
Depth Const "F" Meter 0.22 Note 1Mannings - N Unitless 0.03 Value determined by considering the typical bottom material to be silt
2 Upper Calcasieu River Reach 2 Width Coef "A" Unitless 1.533 Note 2Width Exp "B" Unitless 0.300 Based on the Leopold hydrology study for ephemeral stream
Width Const "C" Meter 1.374 Note 2Depth Coef "D" Unitless 0.104 Note 2Depth Exp "E" Unitless 0.36 Based on the Leopold hydrology study for ephemeral stream
Depth Const "F" Meter 0.173 Note 2Mannings - N Unitless 0.03 Value determined by considering the typical bottom material to be silt
3 Upper Calcasieu River Reach 3 Width Coef "A" Unitless 2.141 Note 2Width Exp "B" Unitless 0.300 Based on the Leopold hydrology study for ephemeral stream
Width Const "C" Meter 1.378 Note 2Depth Coef "D" Unitless 0.17 Note 2Depth Exp "E" Unitless 0.36 Based on the Leopold hydrology study for ephemeral stream
Depth Const "F" Meter 0.127 Note 2Mannings - N Unitless 0.03 Value determined by considering the typical bottom material to be silt
4 Upper Calcasieu River Reach 4 Width Coef "A" Unitless 2.749 Note 2Width Exp "B" Unitless 0.300 Based on the Leopold hydrology study for ephemeral stream
Width Const "C" Meter 1.383 Note 2Depth Coef "D" Unitless 0.235 Note 2Depth Exp "E" Unitless 0.36 Based on the Leopold hydrology study for ephemeral stream
Depth Const "F" Meter 0.08 Note 2Mannings - N Unitless 0.03 Value determined by considering the typical bottom material to be silt
5 Upper Calcasieu River Reach 5 Width Coef "A" Unitless 3.358 Note 1Width Exp "B" Unitless 0.300 Based on the Leopold hydrology study for ephemeral stream
Width Const "C" Meter 1.387 Note 1Depth Coef "D" Unitless 0.3 Note 1Depth Exp "E" Unitless 0.36 Based on the Leopold hydrology study for ephemeral stream
Depth Const "F" Meter 0.034 Note 1Mannings - N Unitless 0.03 Value determined by considering the typical bottom material to be silt
6 Upper Calcasieu River Reach 6 Width Coef "A" Unitless 3.807 Note 2Width Exp "B" Unitless 0.300 Based on the Leopold hydrology study for ephemeral stream
Width Const "C" Meter 1.383 Note 2Depth Coef "D" Unitless 0.235 Note 2Depth Exp "E" Unitless 0.36 Based on the Leopold hydrology study for ephemeral stream
Depth Const "F" Meter 0.08 Note 2Mannings - N Unitless 0.03 Value determined by considering the typical bottom material to be silt
7 Upper Calcasieu River Reach 7 Width Coef "A" Unitless 4.257 Note 2Width Exp "B" Unitless 0.300 Based on the Leopold hydrology study for ephemeral stream
Width Const "C" Meter 1.885 Note 2Depth Coef "D" Unitless 0.354 Note 2Depth Exp "E" Unitless 0.36 Based on the Leopold hydrology study for ephemeral stream
Depth Const "F" Meter 0.047 Note 2Mannings - N Unitless 0.03 Value determined by considering the typical bottom material to be silt
Page 3 of 26 Datatype 9 - Input Description 1/14/02
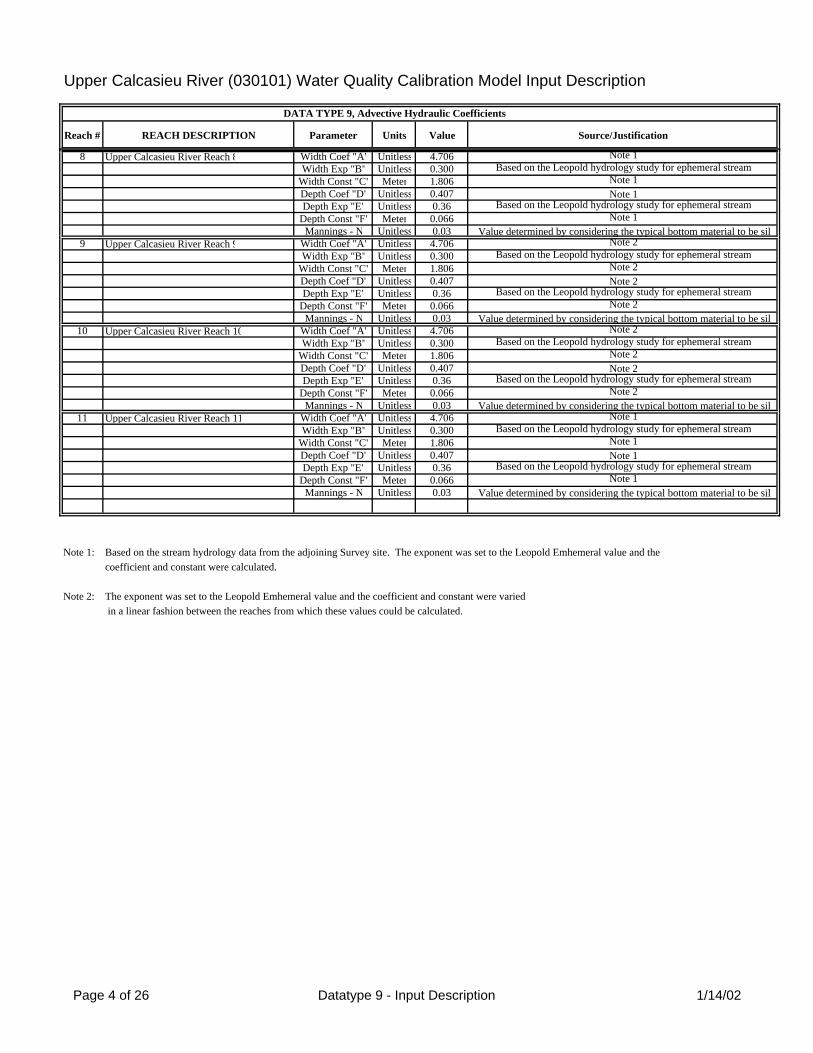
Upper Calcasieu River (030101) Water Quality Calibration Model Input Description
DATA TYPE 9, Advective Hydraulic Coefficients
Reach # REACH DESCRIPTION Parameter Units Value Source/Justification
8 Upper Calcasieu River Reach 8 Width Coef "A" Unitless 4.706 Note 1Width Exp "B" Unitless 0.300 Based on the Leopold hydrology study for ephemeral stream
Width Const "C" Meter 1.806 Note 1Depth Coef "D" Unitless 0.407 Note 1Depth Exp "E" Unitless 0.36 Based on the Leopold hydrology study for ephemeral stream
Depth Const "F" Meter 0.066 Note 1Mannings - N Unitless 0.03 Value determined by considering the typical bottom material to be silt
9 Upper Calcasieu River Reach 9 Width Coef "A" Unitless 4.706 Note 2Width Exp "B" Unitless 0.300 Based on the Leopold hydrology study for ephemeral stream
Width Const "C" Meter 1.806 Note 2Depth Coef "D" Unitless 0.407 Note 2Depth Exp "E" Unitless 0.36 Based on the Leopold hydrology study for ephemeral stream
Depth Const "F" Meter 0.066 Note 2Mannings - N Unitless 0.03 Value determined by considering the typical bottom material to be silt
10 Upper Calcasieu River Reach 10 Width Coef "A" Unitless 4.706 Note 2Width Exp "B" Unitless 0.300 Based on the Leopold hydrology study for ephemeral stream
Width Const "C" Meter 1.806 Note 2Depth Coef "D" Unitless 0.407 Note 2Depth Exp "E" Unitless 0.36 Based on the Leopold hydrology study for ephemeral stream
Depth Const "F" Meter 0.066 Note 2Mannings - N Unitless 0.03 Value determined by considering the typical bottom material to be silt
11 Upper Calcasieu River Reach 11 Width Coef "A" Unitless 4.706 Note 1Width Exp "B" Unitless 0.300 Based on the Leopold hydrology study for ephemeral stream
Width Const "C" Meter 1.806 Note 1Depth Coef "D" Unitless 0.407 Note 1Depth Exp "E" Unitless 0.36 Based on the Leopold hydrology study for ephemeral stream
Depth Const "F" Meter 0.066 Note 1Mannings - N Unitless 0.03 Value determined by considering the typical bottom material to be silt
Note 1: Based on the stream hydrology data from the adjoining Survey site. The exponent was set to the Leopold Emhemeral value and the coefficient and constant were calculated.
Note 2: The exponent was set to the Leopold Emhemeral value and the coefficient and constant were varied in a linear fashion between the reaches from which these values could be calculated.
Page 4 of 26 Datatype 9 - Input Description 1/14/02
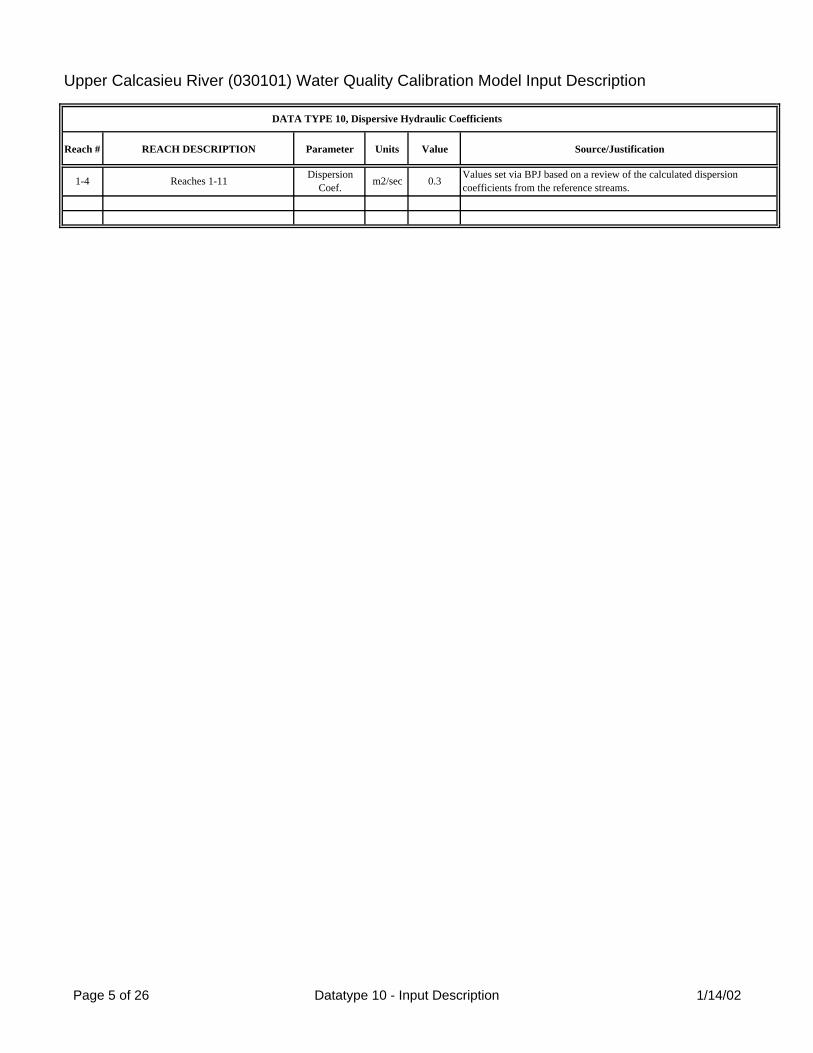
Upper Calcasieu River (030101) Water Quality Calibration Model Input Description
DATA TYPE 10, Dispersive Hydraulic Coefficients
Reach # REACH DESCRIPTION Parameter Units Value Source/Justification
1-4 Reaches 1-11 Dispersion Coef. m2/sec 0.3 Values set via BPJ based on a review of the calculated dispersion
coefficients from the reference streams.
Page 5 of 26 Datatype 10 - Input Description 1/14/02
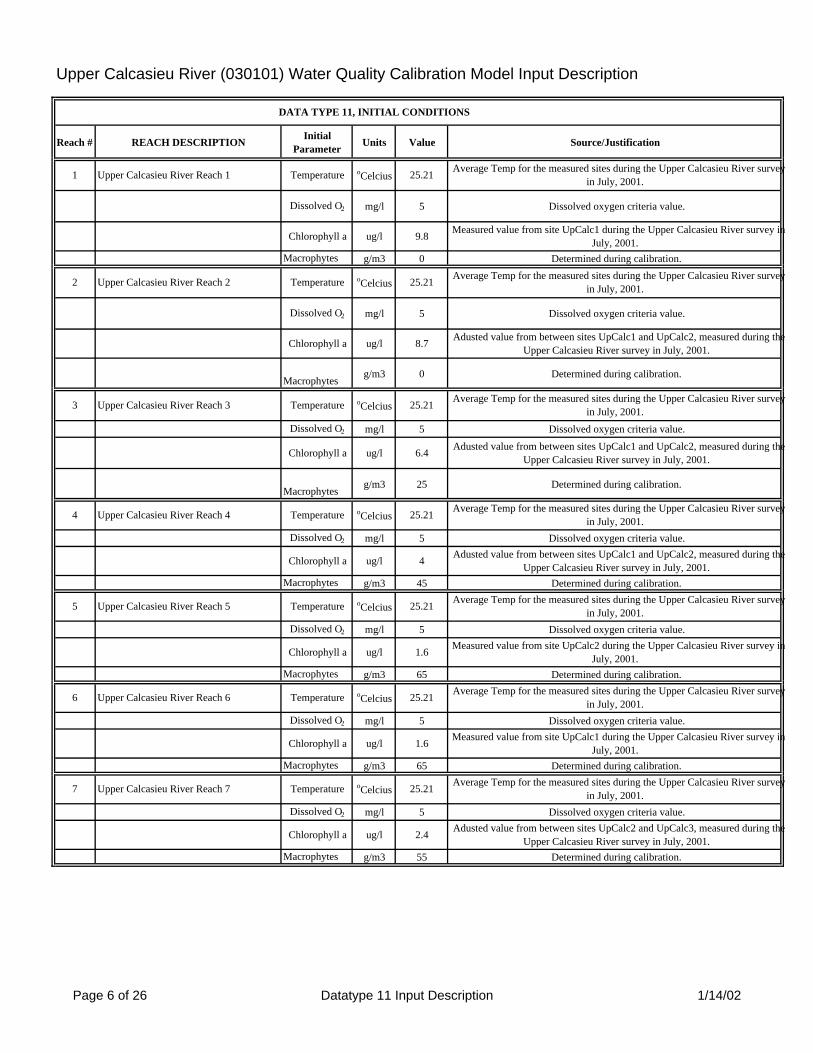
Upper Calcasieu River (030101) Water Quality Calibration Model Input Description
DATA TYPE 11, INITIAL CONDITIONS
Reach # REACH DESCRIPTION Initial Parameter Units Value Source/Justification
1 Upper Calcasieu River Reach 1 Temperature oCelcius 25.21 Average Temp for the measured sites during the Upper Calcasieu River survey in July, 2001.
Dissolved O2 mg/l 5 Dissolved oxygen criteria value.
Chlorophyll a ug/l 9.8 Measured value from site UpCalc1 during the Upper Calcasieu River survey in July, 2001.
Macrophytes g/m3 0 Determined during calibration.
2 Upper Calcasieu River Reach 2 Temperature oCelcius 25.21 Average Temp for the measured sites during the Upper Calcasieu River survey in July, 2001.
Dissolved O2 mg/l 5 Dissolved oxygen criteria value.
Chlorophyll a ug/l 8.7 Adusted value from between sites UpCalc1 and UpCalc2, measured during the Upper Calcasieu River survey in July, 2001.
Macrophytesg/m3 0 Determined during calibration.
3 Upper Calcasieu River Reach 3 Temperature oCelcius 25.21 Average Temp for the measured sites during the Upper Calcasieu River survey in July, 2001.
Dissolved O2 mg/l 5 Dissolved oxygen criteria value.
Chlorophyll a ug/l 6.4 Adusted value from between sites UpCalc1 and UpCalc2, measured during the Upper Calcasieu River survey in July, 2001.
Macrophytesg/m3 25 Determined during calibration.
4 Upper Calcasieu River Reach 4 Temperature oCelcius 25.21 Average Temp for the measured sites during the Upper Calcasieu River survey in July, 2001.
Dissolved O2 mg/l 5 Dissolved oxygen criteria value.
Chlorophyll a ug/l 4 Adusted value from between sites UpCalc1 and UpCalc2, measured during the Upper Calcasieu River survey in July, 2001.
Macrophytes g/m3 45 Determined during calibration.
5 Upper Calcasieu River Reach 5 Temperature oCelcius 25.21 Average Temp for the measured sites during the Upper Calcasieu River survey in July, 2001.
Dissolved O2 mg/l 5 Dissolved oxygen criteria value.
Chlorophyll a ug/l 1.6 Measured value from site UpCalc2 during the Upper Calcasieu River survey in July, 2001.
Macrophytes g/m3 65 Determined during calibration.
6 Upper Calcasieu River Reach 6 Temperature oCelcius 25.21 Average Temp for the measured sites during the Upper Calcasieu River survey in July, 2001.
Dissolved O2 mg/l 5 Dissolved oxygen criteria value.
Chlorophyll a ug/l 1.6 Measured value from site UpCalc1 during the Upper Calcasieu River survey in July, 2001.
Macrophytes g/m3 65 Determined during calibration.
7 Upper Calcasieu River Reach 7 Temperature oCelcius 25.21 Average Temp for the measured sites during the Upper Calcasieu River survey in July, 2001.
Dissolved O2 mg/l 5 Dissolved oxygen criteria value.
Chlorophyll a ug/l 2.4 Adusted value from between sites UpCalc2 and UpCalc3, measured during the Upper Calcasieu River survey in July, 2001.
Macrophytes g/m3 55 Determined during calibration.
Page 6 of 26 Datatype 11 Input Description 1/14/02
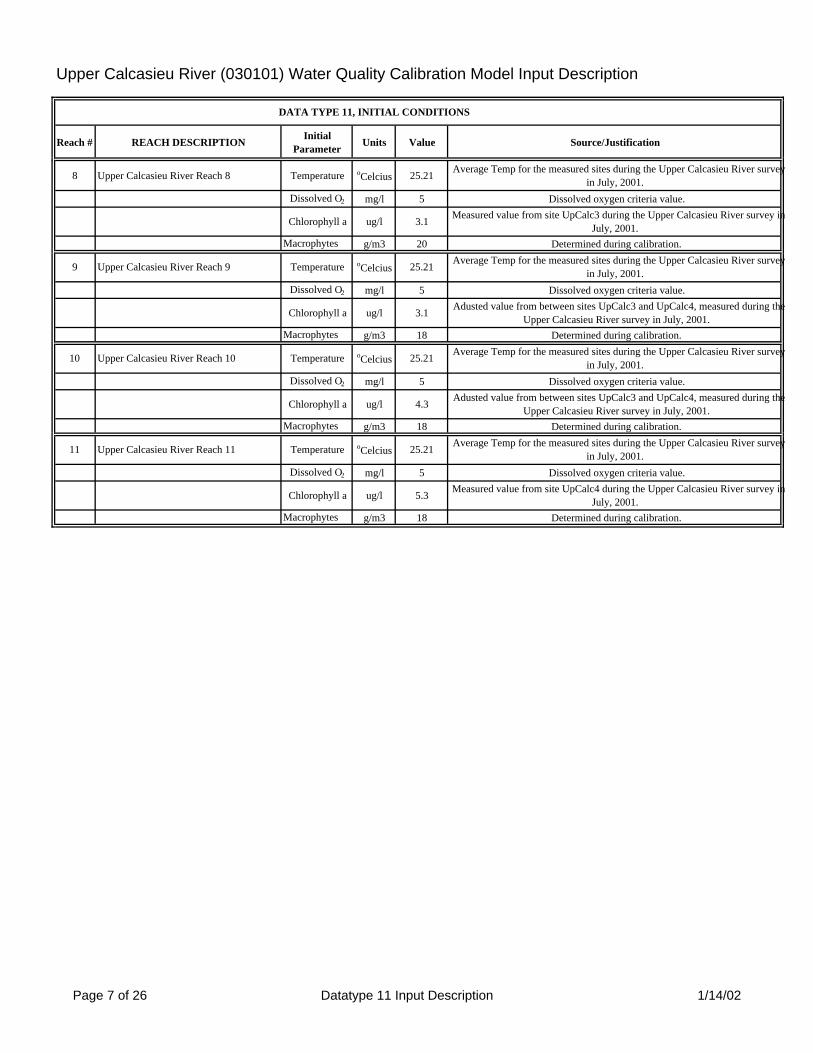
Upper Calcasieu River (030101) Water Quality Calibration Model Input Description
DATA TYPE 11, INITIAL CONDITIONS
Reach # REACH DESCRIPTION Initial Parameter Units Value Source/Justification
8 Upper Calcasieu River Reach 8 Temperature oCelcius 25.21 Average Temp for the measured sites during the Upper Calcasieu River survey in July, 2001.
Dissolved O2 mg/l 5 Dissolved oxygen criteria value.
Chlorophyll a ug/l 3.1 Measured value from site UpCalc3 during the Upper Calcasieu River survey in July, 2001.
Macrophytes g/m3 20 Determined during calibration.
9 Upper Calcasieu River Reach 9 Temperature oCelcius 25.21 Average Temp for the measured sites during the Upper Calcasieu River survey in July, 2001.
Dissolved O2 mg/l 5 Dissolved oxygen criteria value.
Chlorophyll a ug/l 3.1 Adusted value from between sites UpCalc3 and UpCalc4, measured during the Upper Calcasieu River survey in July, 2001.
Macrophytes g/m3 18 Determined during calibration.
10 Upper Calcasieu River Reach 10 Temperature oCelcius 25.21 Average Temp for the measured sites during the Upper Calcasieu River survey in July, 2001.
Dissolved O2 mg/l 5 Dissolved oxygen criteria value.
Chlorophyll a ug/l 4.3 Adusted value from between sites UpCalc3 and UpCalc4, measured during the Upper Calcasieu River survey in July, 2001.
Macrophytes g/m3 18 Determined during calibration.
11 Upper Calcasieu River Reach 11 Temperature oCelcius 25.21 Average Temp for the measured sites during the Upper Calcasieu River survey in July, 2001.
Dissolved O2 mg/l 5 Dissolved oxygen criteria value.
Chlorophyll a ug/l 5.3 Measured value from site UpCalc4 during the Upper Calcasieu River survey in July, 2001.
Macrophytes g/m3 18 Determined during calibration.
Page 7 of 26 Datatype 11 Input Description 1/14/02
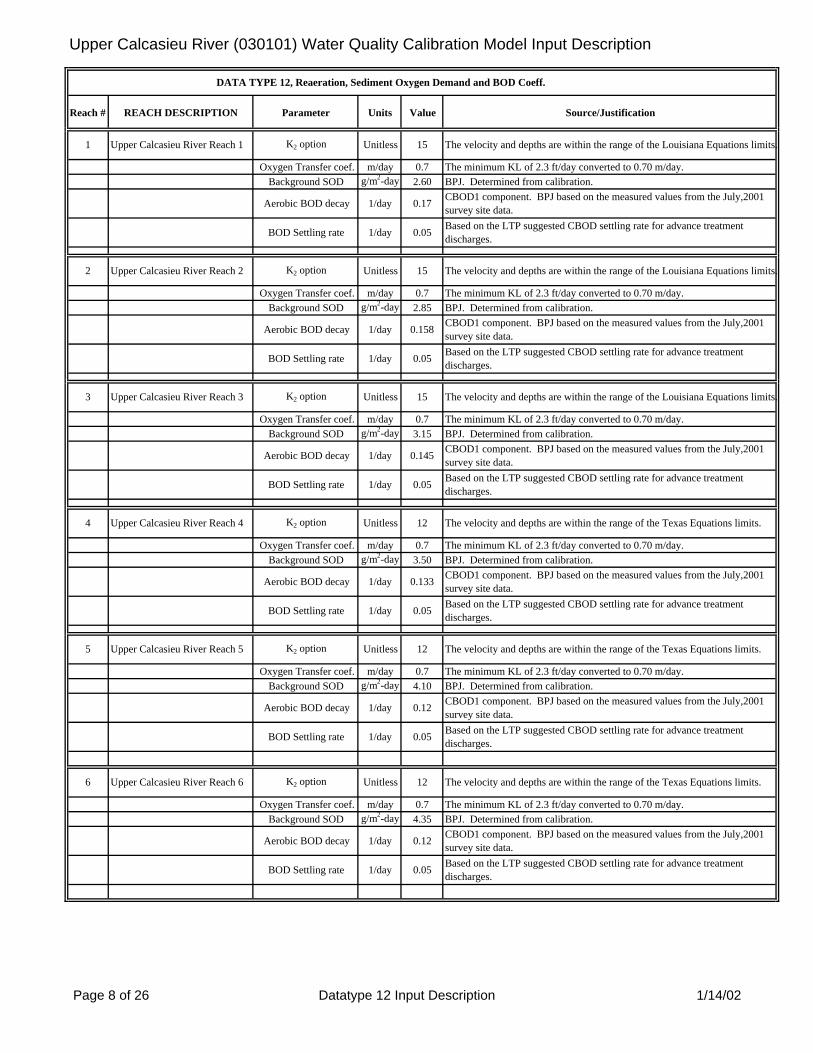
Upper Calcasieu River (030101) Water Quality Calibration Model Input Description
DATA TYPE 12, Reaeration, Sediment Oxygen Demand and BOD Coeff.
Reach # REACH DESCRIPTION Parameter Units Value Source/Justification
1 Upper Calcasieu River Reach 1 K2 option Unitless 15 The velocity and depths are within the range of the Louisiana Equations limits.
Oxygen Transfer coef. m/day 0.7 The minimum KL of 2.3 ft/day converted to 0.70 m/day. Background SOD g/m2-day 2.60 BPJ. Determined from calibration.
Aerobic BOD decay 1/day 0.17 CBOD1 component. BPJ based on the measured values from the July,2001 survey site data.
BOD Settling rate 1/day 0.05 Based on the LTP suggested CBOD settling rate for advance treatment discharges.
2 Upper Calcasieu River Reach 2 K2 option Unitless 15 The velocity and depths are within the range of the Louisiana Equations limits.
Oxygen Transfer coef. m/day 0.7 The minimum KL of 2.3 ft/day converted to 0.70 m/day. Background SOD g/m2-day 2.85 BPJ. Determined from calibration.
Aerobic BOD decay 1/day 0.158 CBOD1 component. BPJ based on the measured values from the July,2001 survey site data.
BOD Settling rate 1/day 0.05 Based on the LTP suggested CBOD settling rate for advance treatment discharges.
3 Upper Calcasieu River Reach 3 K2 option Unitless 15 The velocity and depths are within the range of the Louisiana Equations limits.
Oxygen Transfer coef. m/day 0.7 The minimum KL of 2.3 ft/day converted to 0.70 m/day. Background SOD g/m2-day 3.15 BPJ. Determined from calibration.
Aerobic BOD decay 1/day 0.145 CBOD1 component. BPJ based on the measured values from the July,2001 survey site data.
BOD Settling rate 1/day 0.05 Based on the LTP suggested CBOD settling rate for advance treatment discharges.
4 Upper Calcasieu River Reach 4 K2 option Unitless 12 The velocity and depths are within the range of the Texas Equations limits.
Oxygen Transfer coef. m/day 0.7 The minimum KL of 2.3 ft/day converted to 0.70 m/day. Background SOD g/m2-day 3.50 BPJ. Determined from calibration.
Aerobic BOD decay 1/day 0.133 CBOD1 component. BPJ based on the measured values from the July,2001 survey site data.
BOD Settling rate 1/day 0.05 Based on the LTP suggested CBOD settling rate for advance treatment discharges.
5 Upper Calcasieu River Reach 5 K2 option Unitless 12 The velocity and depths are within the range of the Texas Equations limits.
Oxygen Transfer coef. m/day 0.7 The minimum KL of 2.3 ft/day converted to 0.70 m/day. Background SOD g/m2-day 4.10 BPJ. Determined from calibration.
Aerobic BOD decay 1/day 0.12 CBOD1 component. BPJ based on the measured values from the July,2001 survey site data.
BOD Settling rate 1/day 0.05 Based on the LTP suggested CBOD settling rate for advance treatment discharges.
6 Upper Calcasieu River Reach 6 K2 option Unitless 12 The velocity and depths are within the range of the Texas Equations limits.
Oxygen Transfer coef. m/day 0.7 The minimum KL of 2.3 ft/day converted to 0.70 m/day. Background SOD g/m2-day 4.35 BPJ. Determined from calibration.
Aerobic BOD decay 1/day 0.12 CBOD1 component. BPJ based on the measured values from the July,2001 survey site data.
BOD Settling rate 1/day 0.05 Based on the LTP suggested CBOD settling rate for advance treatment discharges.
Page 8 of 26 Datatype 12 Input Description 1/14/02
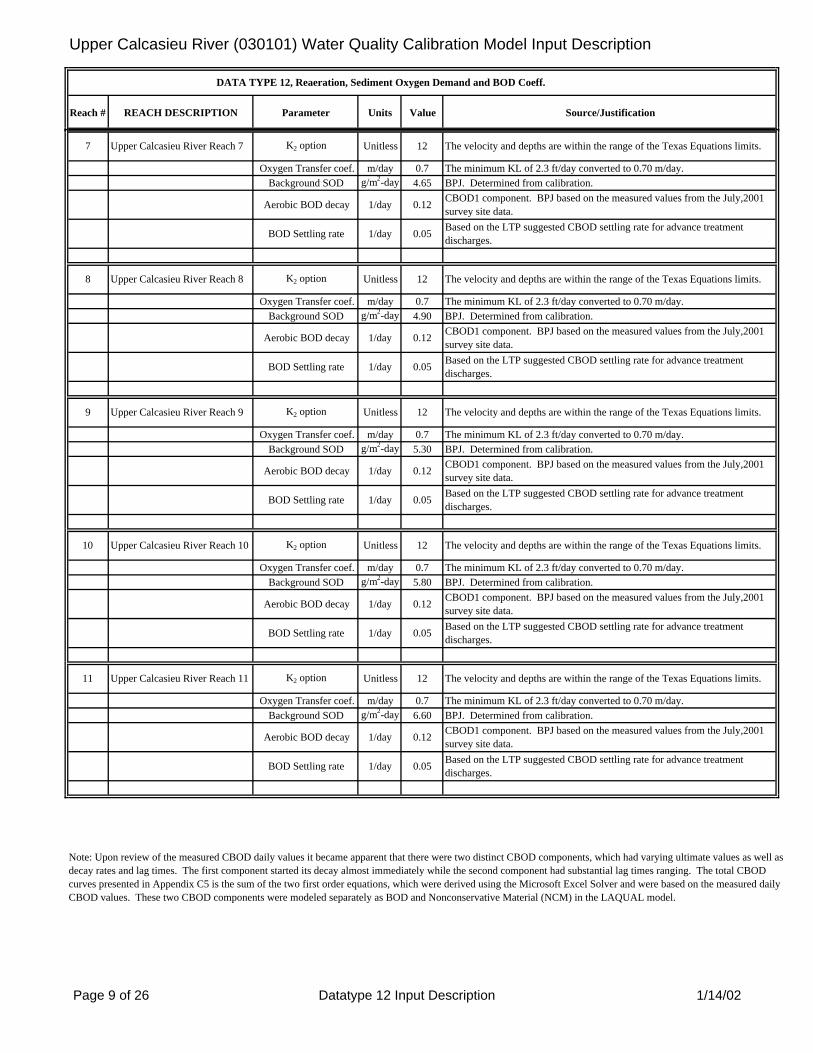
Upper Calcasieu River (030101) Water Quality Calibration Model Input Description
DATA TYPE 12, Reaeration, Sediment Oxygen Demand and BOD Coeff.
Reach # REACH DESCRIPTION Parameter Units Value Source/Justification
7 Upper Calcasieu River Reach 7 K2 option Unitless 12 The velocity and depths are within the range of the Texas Equations limits.
Oxygen Transfer coef. m/day 0.7 The minimum KL of 2.3 ft/day converted to 0.70 m/day. Background SOD g/m2-day 4.65 BPJ. Determined from calibration.
Aerobic BOD decay 1/day 0.12 CBOD1 component. BPJ based on the measured values from the July,2001 survey site data.
BOD Settling rate 1/day 0.05 Based on the LTP suggested CBOD settling rate for advance treatment discharges.
8 Upper Calcasieu River Reach 8 K2 option Unitless 12 The velocity and depths are within the range of the Texas Equations limits.
Oxygen Transfer coef. m/day 0.7 The minimum KL of 2.3 ft/day converted to 0.70 m/day. Background SOD g/m2-day 4.90 BPJ. Determined from calibration.
Aerobic BOD decay 1/day 0.12 CBOD1 component. BPJ based on the measured values from the July,2001 survey site data.
BOD Settling rate 1/day 0.05 Based on the LTP suggested CBOD settling rate for advance treatment discharges.
9 Upper Calcasieu River Reach 9 K2 option Unitless 12 The velocity and depths are within the range of the Texas Equations limits.
Oxygen Transfer coef. m/day 0.7 The minimum KL of 2.3 ft/day converted to 0.70 m/day. Background SOD g/m2-day 5.30 BPJ. Determined from calibration.
Aerobic BOD decay 1/day 0.12 CBOD1 component. BPJ based on the measured values from the July,2001 survey site data.
BOD Settling rate 1/day 0.05 Based on the LTP suggested CBOD settling rate for advance treatment discharges.
10 Upper Calcasieu River Reach 10 K2 option Unitless 12 The velocity and depths are within the range of the Texas Equations limits.
Oxygen Transfer coef. m/day 0.7 The minimum KL of 2.3 ft/day converted to 0.70 m/day. Background SOD g/m2-day 5.80 BPJ. Determined from calibration.
Aerobic BOD decay 1/day 0.12 CBOD1 component. BPJ based on the measured values from the July,2001 survey site data.
BOD Settling rate 1/day 0.05 Based on the LTP suggested CBOD settling rate for advance treatment discharges.
11 Upper Calcasieu River Reach 11 K2 option Unitless 12 The velocity and depths are within the range of the Texas Equations limits.
Oxygen Transfer coef. m/day 0.7 The minimum KL of 2.3 ft/day converted to 0.70 m/day. Background SOD g/m2-day 6.60 BPJ. Determined from calibration.
Aerobic BOD decay 1/day 0.12 CBOD1 component. BPJ based on the measured values from the July,2001 survey site data.
BOD Settling rate 1/day 0.05 Based on the LTP suggested CBOD settling rate for advance treatment discharges.
Note: Upon review of the measured CBOD daily values it became apparent that there were two distinct CBOD components, which had varying ultimate values as well as decay rates and lag times. The first component started its decay almost immediately while the second component had substantial lag times ranging. The total CBOD curves presented in Appendix C5 is the sum of the two first order equations, which were derived using the Microsoft Excel Solver and were based on the measured daily CBOD values. These two CBOD components were modeled separately as BOD and Nonconservative Material (NCM) in the LAQUAL model.
Page 9 of 26 Datatype 12 Input Description 1/14/02
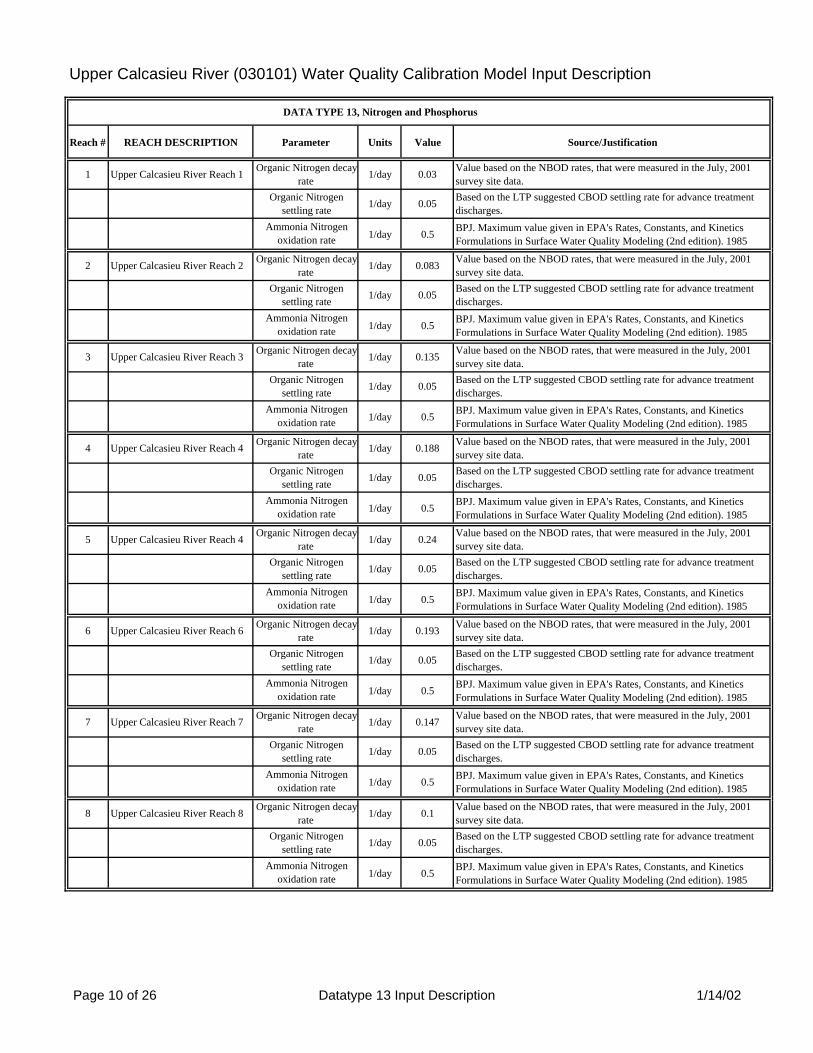
Upper Calcasieu River (030101) Water Quality Calibration Model Input Description
DATA TYPE 13, Nitrogen and Phosphorus
Reach # REACH DESCRIPTION Parameter Units Value Source/Justification
1 Upper Calcasieu River Reach 1 Organic Nitrogen decayrate 1/day 0.03 Value based on the NBOD rates, that were measured in the July, 2001
survey site data.Organic Nitrogen
settling rate 1/day 0.05 Based on the LTP suggested CBOD settling rate for advance treatment discharges.
Ammonia Nitrogen oxidation rate 1/day 0.5 BPJ. Maximum value given in EPA's Rates, Constants, and Kinetics
Formulations in Surface Water Quality Modeling (2nd edition). 1985
2 Upper Calcasieu River Reach 2 Organic Nitrogen decayrate 1/day 0.083 Value based on the NBOD rates, that were measured in the July, 2001
survey site data.Organic Nitrogen
settling rate 1/day 0.05 Based on the LTP suggested CBOD settling rate for advance treatment discharges.
Ammonia Nitrogen oxidation rate 1/day 0.5 BPJ. Maximum value given in EPA's Rates, Constants, and Kinetics
Formulations in Surface Water Quality Modeling (2nd edition). 1985
3 Upper Calcasieu River Reach 3 Organic Nitrogen decayrate 1/day 0.135 Value based on the NBOD rates, that were measured in the July, 2001
survey site data.Organic Nitrogen
settling rate 1/day 0.05 Based on the LTP suggested CBOD settling rate for advance treatment discharges.
Ammonia Nitrogen oxidation rate 1/day 0.5 BPJ. Maximum value given in EPA's Rates, Constants, and Kinetics
Formulations in Surface Water Quality Modeling (2nd edition). 1985
4 Upper Calcasieu River Reach 4 Organic Nitrogen decayrate 1/day 0.188 Value based on the NBOD rates, that were measured in the July, 2001
survey site data.Organic Nitrogen
settling rate 1/day 0.05 Based on the LTP suggested CBOD settling rate for advance treatment discharges.
Ammonia Nitrogen oxidation rate 1/day 0.5 BPJ. Maximum value given in EPA's Rates, Constants, and Kinetics
Formulations in Surface Water Quality Modeling (2nd edition). 1985
5 Upper Calcasieu River Reach 4 Organic Nitrogen decayrate 1/day 0.24 Value based on the NBOD rates, that were measured in the July, 2001
survey site data.Organic Nitrogen
settling rate 1/day 0.05 Based on the LTP suggested CBOD settling rate for advance treatment discharges.
Ammonia Nitrogen oxidation rate 1/day 0.5 BPJ. Maximum value given in EPA's Rates, Constants, and Kinetics
Formulations in Surface Water Quality Modeling (2nd edition). 1985
6 Upper Calcasieu River Reach 6 Organic Nitrogen decayrate 1/day 0.193 Value based on the NBOD rates, that were measured in the July, 2001
survey site data.Organic Nitrogen
settling rate 1/day 0.05 Based on the LTP suggested CBOD settling rate for advance treatment discharges.
Ammonia Nitrogen oxidation rate 1/day 0.5 BPJ. Maximum value given in EPA's Rates, Constants, and Kinetics
Formulations in Surface Water Quality Modeling (2nd edition). 1985
7 Upper Calcasieu River Reach 7 Organic Nitrogen decayrate 1/day 0.147 Value based on the NBOD rates, that were measured in the July, 2001
survey site data.Organic Nitrogen
settling rate 1/day 0.05 Based on the LTP suggested CBOD settling rate for advance treatment discharges.
Ammonia Nitrogen oxidation rate 1/day 0.5 BPJ. Maximum value given in EPA's Rates, Constants, and Kinetics
Formulations in Surface Water Quality Modeling (2nd edition). 1985
8 Upper Calcasieu River Reach 8 Organic Nitrogen decayrate 1/day 0.1 Value based on the NBOD rates, that were measured in the July, 2001
survey site data.Organic Nitrogen
settling rate 1/day 0.05 Based on the LTP suggested CBOD settling rate for advance treatment discharges.
Ammonia Nitrogen oxidation rate 1/day 0.5 BPJ. Maximum value given in EPA's Rates, Constants, and Kinetics
Formulations in Surface Water Quality Modeling (2nd edition). 1985
Page 10 of 26 Datatype 13 Input Description 1/14/02

Upper Calcasieu River (030101) Water Quality Calibration Model Input Description
DATA TYPE 13, Nitrogen and Phosphorus
Reach # REACH DESCRIPTION Parameter Units Value Source/Justification
9 Upper Calcasieu River Reach 9 Organic Nitrogen decayrate 1/day 0.12 Value based on the NBOD rates, that were measured in the July, 2001
survey site data.Organic Nitrogen
settling rate 1/day 0.05 Based on the LTP suggested CBOD settling rate for advance treatment discharges.
Ammonia Nitrogen oxidation rate 1/day 0.5 BPJ. Maximum value given in EPA's Rates, Constants, and Kinetics
Formulations in Surface Water Quality Modeling (2nd edition). 1985
10 Upper Calcasieu River Reach 10 Organic Nitrogen decayrate 1/day 0.14 Value based on the NBOD rates, that were measured in the July, 2001
survey site data.Organic Nitrogen
settling rate 1/day 0.05 Based on the LTP suggested CBOD settling rate for advance treatment discharges.
Ammonia Nitrogen oxidation rate 1/day 0.5 BPJ. Maximum value given in EPA's Rates, Constants, and Kinetics
Formulations in Surface Water Quality Modeling (2nd edition). 1985
11 Upper Calcasieu River Reach 11 Organic Nitrogen decayrate 1/day 0.16 Value based on the NBOD rates, that were measured in the July, 2001
survey site data.Organic Nitrogen
settling rate 1/day 0.05 Based on the LTP suggested CBOD settling rate for advance treatment discharges.
Ammonia Nitrogen oxidation rate 1/day 0.5 BPJ. Maximum value given in EPA's Rates, Constants, and Kinetics
Formulations in Surface Water Quality Modeling (2nd edition). 1985
Page 11 of 26 Datatype 13 Input Description 1/14/02
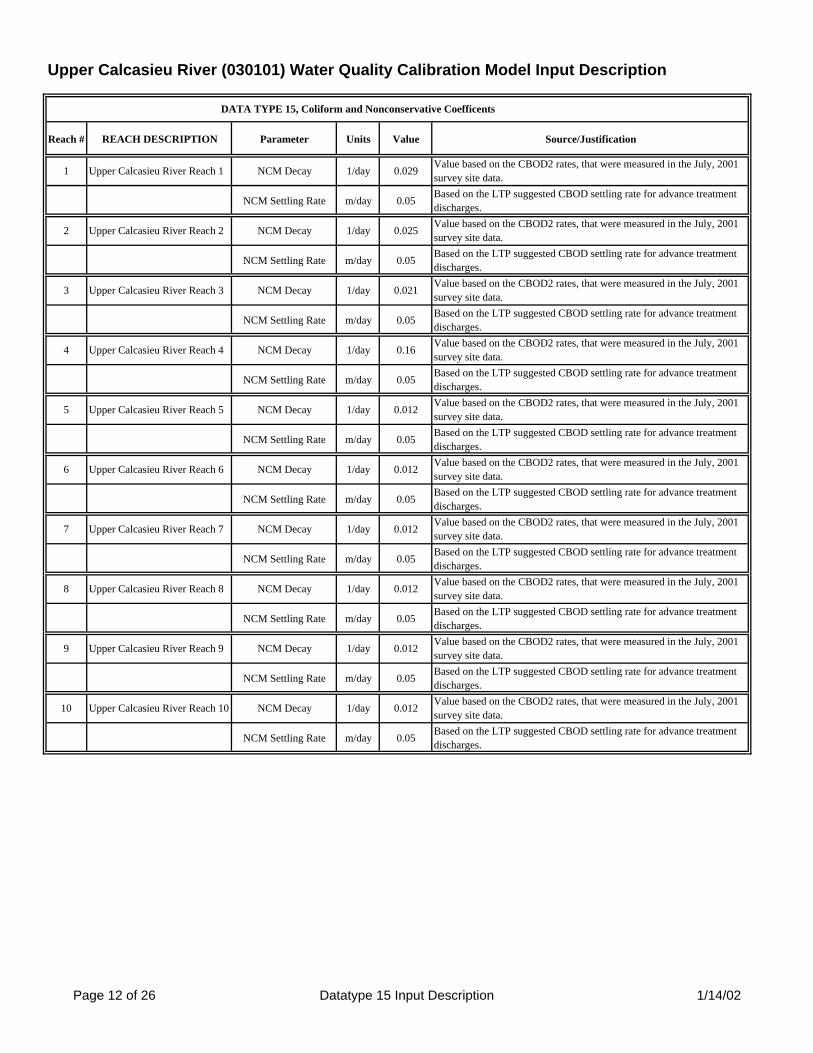
Upper Calcasieu River (030101) Water Quality Calibration Model Input Description
DATA TYPE 15, Coliform and Nonconservative Coefficents
Reach # REACH DESCRIPTION Parameter Units Value Source/Justification
1 Upper Calcasieu River Reach 1 NCM Decay 1/day 0.029 Value based on the CBOD2 rates, that were measured in the July, 2001 survey site data.
NCM Settling Rate m/day 0.05 Based on the LTP suggested CBOD settling rate for advance treatment discharges.
2 Upper Calcasieu River Reach 2 NCM Decay 1/day 0.025 Value based on the CBOD2 rates, that were measured in the July, 2001 survey site data.
NCM Settling Rate m/day 0.05 Based on the LTP suggested CBOD settling rate for advance treatment discharges.
3 Upper Calcasieu River Reach 3 NCM Decay 1/day 0.021 Value based on the CBOD2 rates, that were measured in the July, 2001 survey site data.
NCM Settling Rate m/day 0.05 Based on the LTP suggested CBOD settling rate for advance treatment discharges.
4 Upper Calcasieu River Reach 4 NCM Decay 1/day 0.16 Value based on the CBOD2 rates, that were measured in the July, 2001 survey site data.
NCM Settling Rate m/day 0.05 Based on the LTP suggested CBOD settling rate for advance treatment discharges.
5 Upper Calcasieu River Reach 5 NCM Decay 1/day 0.012 Value based on the CBOD2 rates, that were measured in the July, 2001 survey site data.
NCM Settling Rate m/day 0.05 Based on the LTP suggested CBOD settling rate for advance treatment discharges.
6 Upper Calcasieu River Reach 6 NCM Decay 1/day 0.012 Value based on the CBOD2 rates, that were measured in the July, 2001 survey site data.
NCM Settling Rate m/day 0.05 Based on the LTP suggested CBOD settling rate for advance treatment discharges.
7 Upper Calcasieu River Reach 7 NCM Decay 1/day 0.012 Value based on the CBOD2 rates, that were measured in the July, 2001 survey site data.
NCM Settling Rate m/day 0.05 Based on the LTP suggested CBOD settling rate for advance treatment discharges.
8 Upper Calcasieu River Reach 8 NCM Decay 1/day 0.012 Value based on the CBOD2 rates, that were measured in the July, 2001 survey site data.
NCM Settling Rate m/day 0.05 Based on the LTP suggested CBOD settling rate for advance treatment discharges.
9 Upper Calcasieu River Reach 9 NCM Decay 1/day 0.012 Value based on the CBOD2 rates, that were measured in the July, 2001 survey site data.
NCM Settling Rate m/day 0.05 Based on the LTP suggested CBOD settling rate for advance treatment discharges.
10 Upper Calcasieu River Reach 10 NCM Decay 1/day 0.012 Value based on the CBOD2 rates, that were measured in the July, 2001 survey site data.
NCM Settling Rate m/day 0.05 Based on the LTP suggested CBOD settling rate for advance treatment discharges.
Page 12 of 26 Datatype 15 Input Description 1/14/02
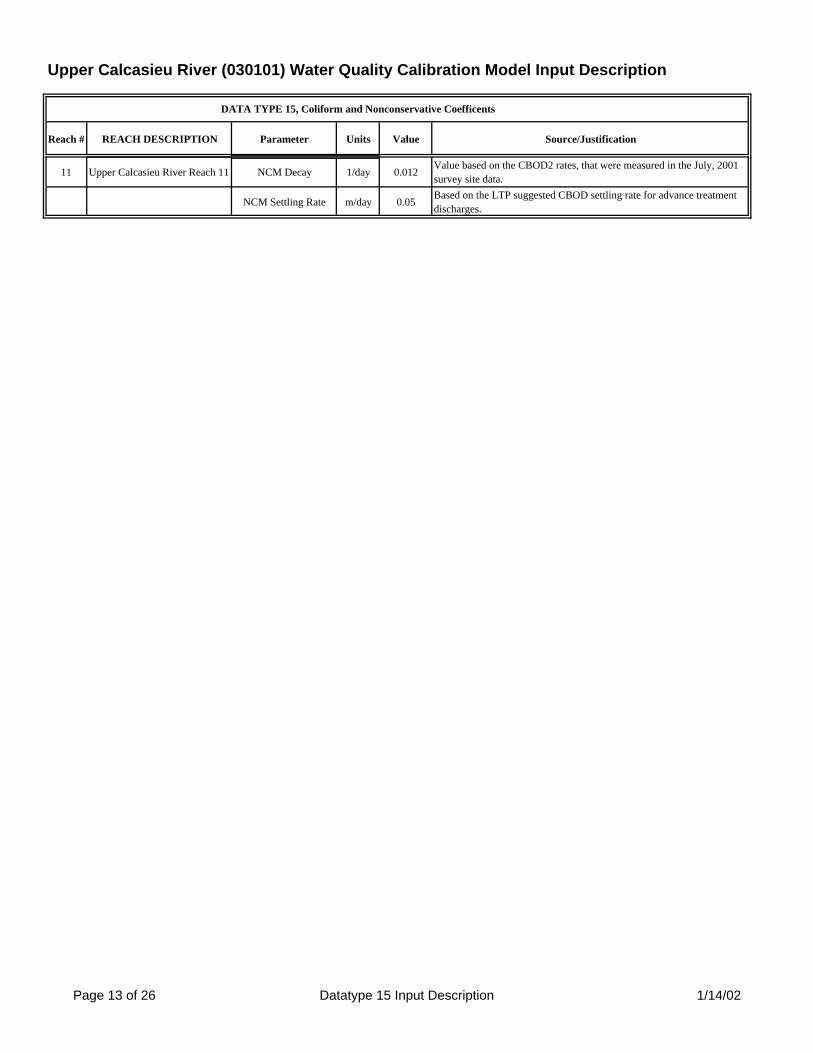
Upper Calcasieu River (030101) Water Quality Calibration Model Input Description
DATA TYPE 15, Coliform and Nonconservative Coefficents
Reach # REACH DESCRIPTION Parameter Units Value Source/Justification
11 Upper Calcasieu River Reach 11 NCM Decay 1/day 0.012 Value based on the CBOD2 rates, that were measured in the July, 2001 survey site data.
NCM Settling Rate m/day 0.05 Based on the LTP suggested CBOD settling rate for advance treatment discharges.
Page 13 of 26 Datatype 15 Input Description 1/14/02
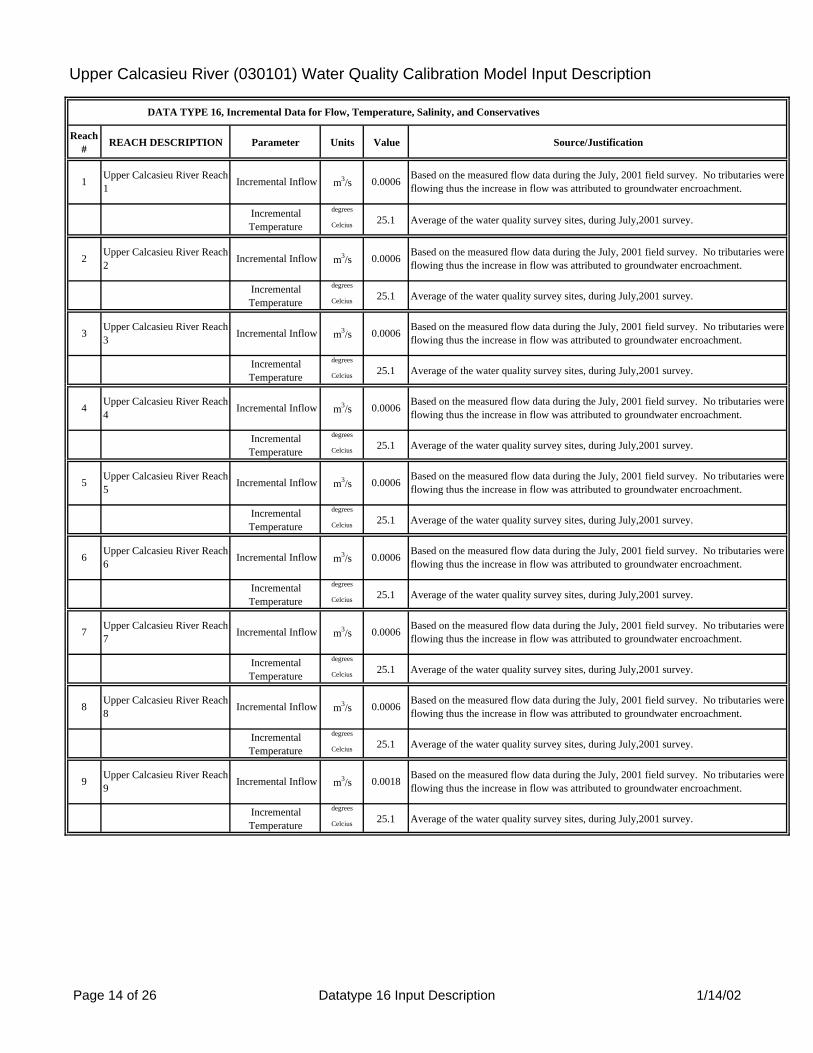
Upper Calcasieu River (030101) Water Quality Calibration Model Input Description
DATA TYPE 16, Incremental Data for Flow, Temperature, Salinity, and Conservatives
Reach # REACH DESCRIPTION Parameter Units Value Source/Justification
1 Upper Calcasieu River Reach 1 Incremental Inflow m3/s 0.0006 Based on the measured flow data during the July, 2001 field survey. No tributaries were
flowing thus the increase in flow was attributed to groundwater encroachment.
Incremental Temperature
degrees
Celcius 25.1 Average of the water quality survey sites, during July,2001 survey.
2 Upper Calcasieu River Reach 2 Incremental Inflow m3/s 0.0006 Based on the measured flow data during the July, 2001 field survey. No tributaries were
flowing thus the increase in flow was attributed to groundwater encroachment.
Incremental Temperature
degrees
Celcius 25.1 Average of the water quality survey sites, during July,2001 survey.
3 Upper Calcasieu River Reach 3 Incremental Inflow m3/s 0.0006 Based on the measured flow data during the July, 2001 field survey. No tributaries were
flowing thus the increase in flow was attributed to groundwater encroachment.
Incremental Temperature
degrees
Celcius 25.1 Average of the water quality survey sites, during July,2001 survey.
4 Upper Calcasieu River Reach 4 Incremental Inflow m3/s 0.0006 Based on the measured flow data during the July, 2001 field survey. No tributaries were
flowing thus the increase in flow was attributed to groundwater encroachment.
Incremental Temperature
degrees
Celcius 25.1 Average of the water quality survey sites, during July,2001 survey.
5 Upper Calcasieu River Reach 5 Incremental Inflow m3/s 0.0006 Based on the measured flow data during the July, 2001 field survey. No tributaries were
flowing thus the increase in flow was attributed to groundwater encroachment.
Incremental Temperature
degrees
Celcius 25.1 Average of the water quality survey sites, during July,2001 survey.
6 Upper Calcasieu River Reach 6 Incremental Inflow m3/s 0.0006 Based on the measured flow data during the July, 2001 field survey. No tributaries were
flowing thus the increase in flow was attributed to groundwater encroachment.
Incremental Temperature
degrees
Celcius 25.1 Average of the water quality survey sites, during July,2001 survey.
7 Upper Calcasieu River Reach 7 Incremental Inflow m3/s 0.0006 Based on the measured flow data during the July, 2001 field survey. No tributaries were
flowing thus the increase in flow was attributed to groundwater encroachment.
Incremental Temperature
degrees
Celcius 25.1 Average of the water quality survey sites, during July,2001 survey.
8 Upper Calcasieu River Reach 8 Incremental Inflow m3/s 0.0006 Based on the measured flow data during the July, 2001 field survey. No tributaries were
flowing thus the increase in flow was attributed to groundwater encroachment.
Incremental Temperature
degrees
Celcius 25.1 Average of the water quality survey sites, during July,2001 survey.
9 Upper Calcasieu River Reach 9 Incremental Inflow m3/s 0.0018 Based on the measured flow data during the July, 2001 field survey. No tributaries were
flowing thus the increase in flow was attributed to groundwater encroachment.
Incremental Temperature
degrees
Celcius 25.1 Average of the water quality survey sites, during July,2001 survey.
Page 14 of 26 Datatype 16 Input Description 1/14/02
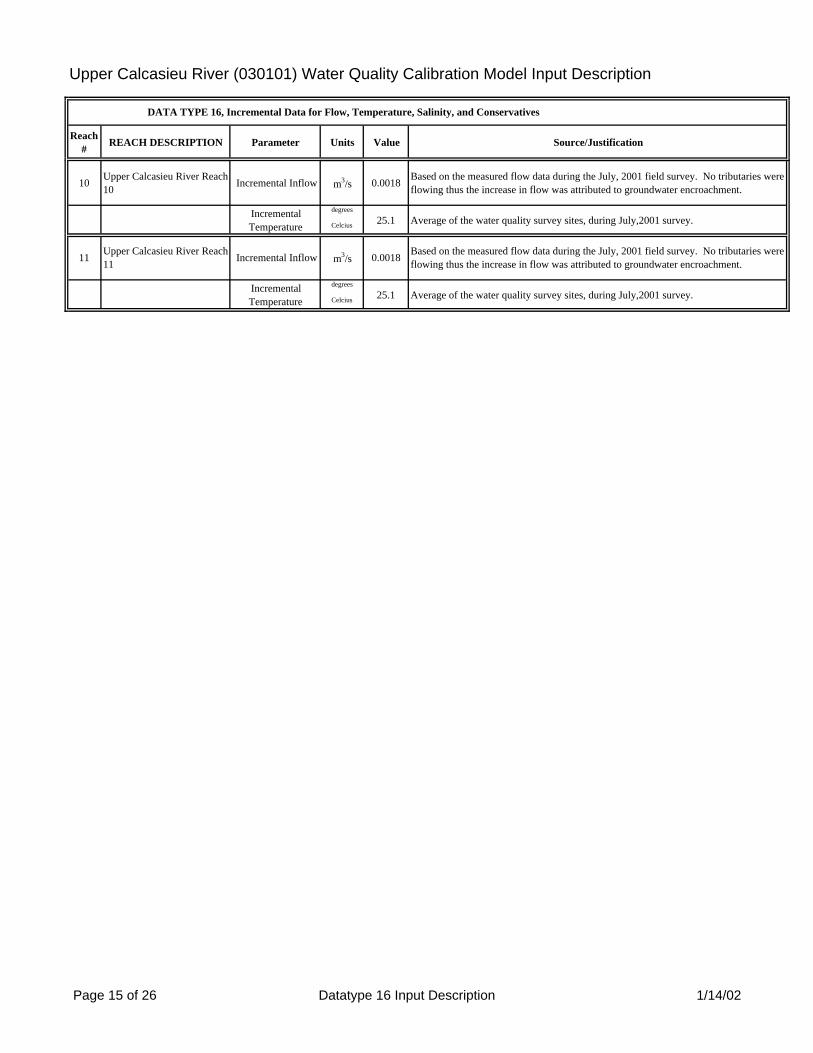
Upper Calcasieu River (030101) Water Quality Calibration Model Input Description
DATA TYPE 16, Incremental Data for Flow, Temperature, Salinity, and Conservatives
Reach # REACH DESCRIPTION Parameter Units Value Source/Justification
10 Upper Calcasieu River Reach 10 Incremental Inflow m3/s 0.0018 Based on the measured flow data during the July, 2001 field survey. No tributaries were
flowing thus the increase in flow was attributed to groundwater encroachment.
Incremental Temperature
degrees
Celcius 25.1 Average of the water quality survey sites, during July,2001 survey.
11 Upper Calcasieu River Reach 11 Incremental Inflow m3/s 0.0018 Based on the measured flow data during the July, 2001 field survey. No tributaries were
flowing thus the increase in flow was attributed to groundwater encroachment.
Incremental Temperature
degrees
Celcius 25.1 Average of the water quality survey sites, during July,2001 survey.
Page 15 of 26 Datatype 16 Input Description 1/14/02
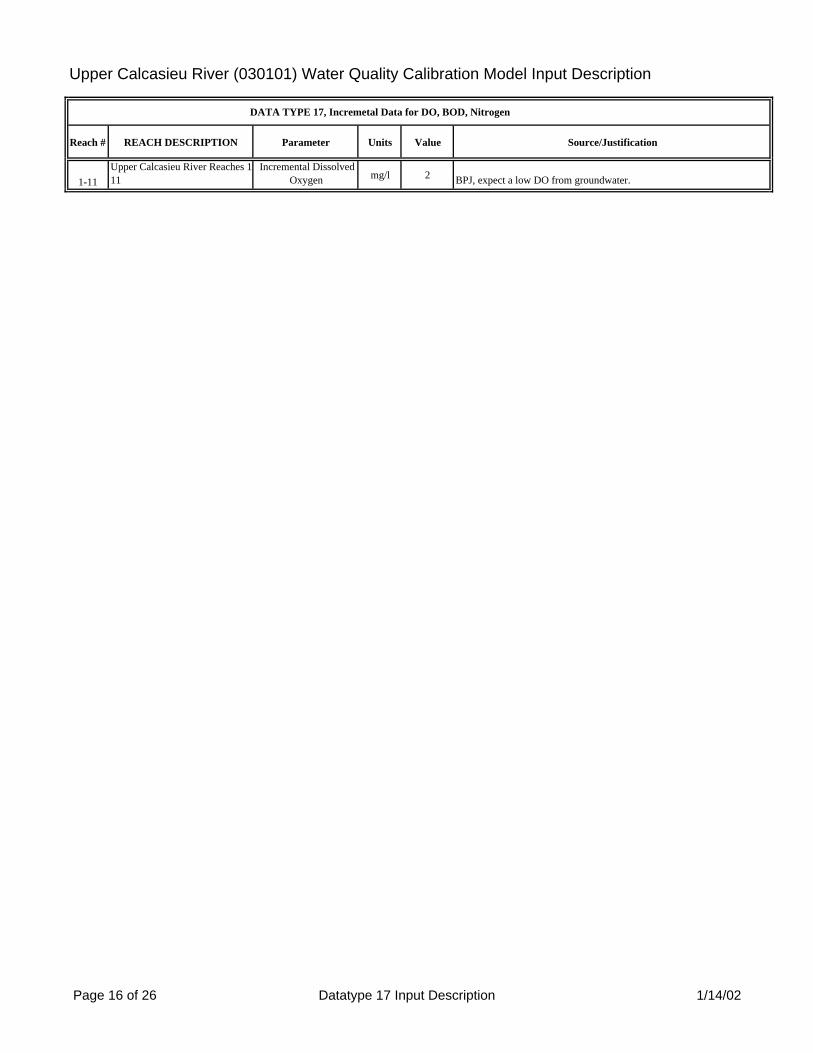
Upper Calcasieu River (030101) Water Quality Calibration Model Input Description
DATA TYPE 17, Incremetal Data for DO, BOD, Nitrogen
Reach # REACH DESCRIPTION Parameter Units Value Source/Justification
1-11Upper Calcasieu River Reaches 111
Incremental Dissolved Oxygen mg/l 2 BPJ, expect a low DO from groundwater.
Page 16 of 26 Datatype 17 Input Description 1/14/02
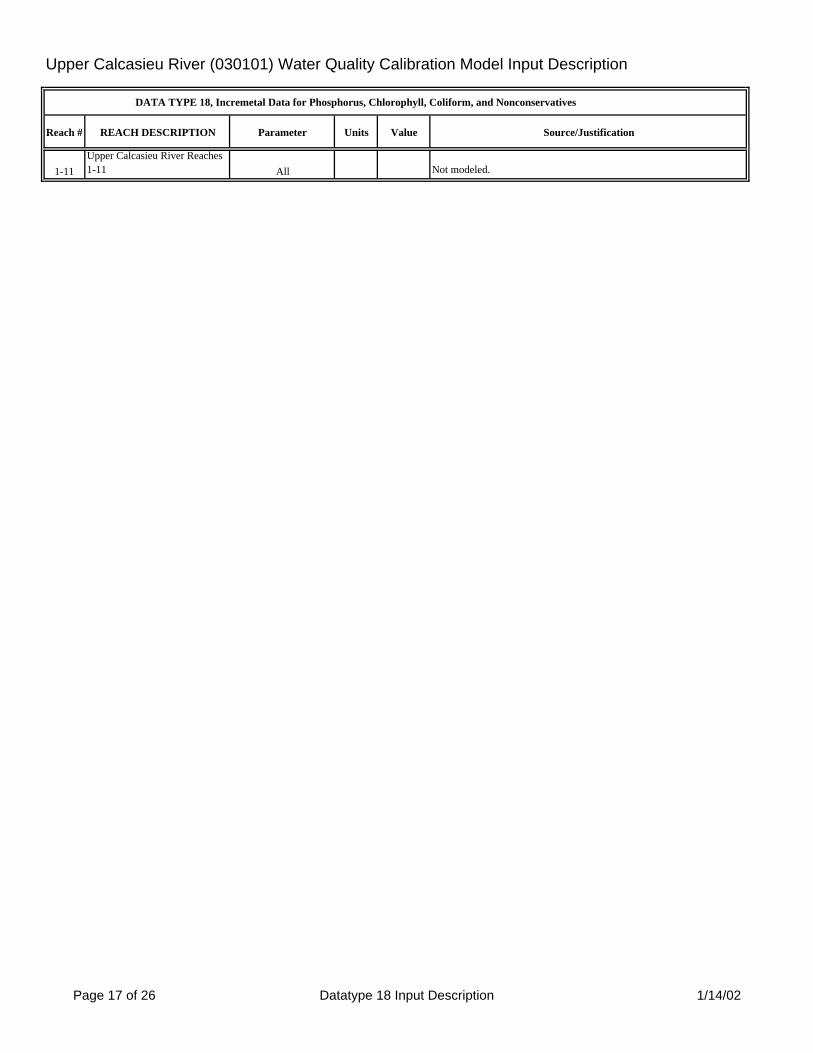
Upper Calcasieu River (030101) Water Quality Calibration Model Input Description
DATA TYPE 18, Incremetal Data for Phosphorus, Chlorophyll, Coliform, and Nonconservatives
Reach # REACH DESCRIPTION Parameter Units Value Source/Justification
1-11Upper Calcasieu River Reaches 1-11 All Not modeled.
Page 17 of 26 Datatype 18 Input Description 1/14/02
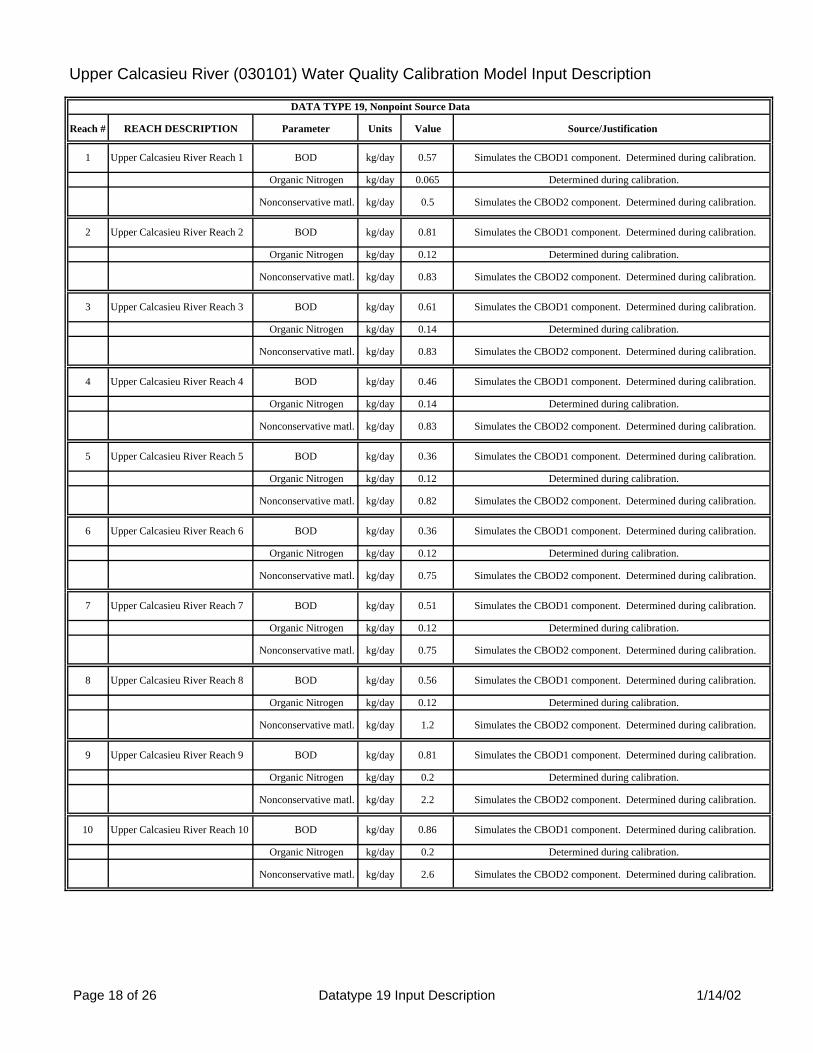
Upper Calcasieu River (030101) Water Quality Calibration Model Input Description
DATA TYPE 19, Nonpoint Source Data
Reach # REACH DESCRIPTION Parameter Units Value Source/Justification
1 Upper Calcasieu River Reach 1 BOD kg/day 0.57 Simulates the CBOD1 component. Determined during calibration.
Organic Nitrogen kg/day 0.065 Determined during calibration.
Nonconservative matl. kg/day 0.5 Simulates the CBOD2 component. Determined during calibration.
2 Upper Calcasieu River Reach 2 BOD kg/day 0.81 Simulates the CBOD1 component. Determined during calibration.
Organic Nitrogen kg/day 0.12 Determined during calibration.
Nonconservative matl. kg/day 0.83 Simulates the CBOD2 component. Determined during calibration.
3 Upper Calcasieu River Reach 3 BOD kg/day 0.61 Simulates the CBOD1 component. Determined during calibration.
Organic Nitrogen kg/day 0.14 Determined during calibration.
Nonconservative matl. kg/day 0.83 Simulates the CBOD2 component. Determined during calibration.
4 Upper Calcasieu River Reach 4 BOD kg/day 0.46 Simulates the CBOD1 component. Determined during calibration.
Organic Nitrogen kg/day 0.14 Determined during calibration.
Nonconservative matl. kg/day 0.83 Simulates the CBOD2 component. Determined during calibration.
5 Upper Calcasieu River Reach 5 BOD kg/day 0.36 Simulates the CBOD1 component. Determined during calibration.
Organic Nitrogen kg/day 0.12 Determined during calibration.
Nonconservative matl. kg/day 0.82 Simulates the CBOD2 component. Determined during calibration.
6 Upper Calcasieu River Reach 6 BOD kg/day 0.36 Simulates the CBOD1 component. Determined during calibration.
Organic Nitrogen kg/day 0.12 Determined during calibration.
Nonconservative matl. kg/day 0.75 Simulates the CBOD2 component. Determined during calibration.
7 Upper Calcasieu River Reach 7 BOD kg/day 0.51 Simulates the CBOD1 component. Determined during calibration.
Organic Nitrogen kg/day 0.12 Determined during calibration.
Nonconservative matl. kg/day 0.75 Simulates the CBOD2 component. Determined during calibration.
8 Upper Calcasieu River Reach 8 BOD kg/day 0.56 Simulates the CBOD1 component. Determined during calibration.
Organic Nitrogen kg/day 0.12 Determined during calibration.
Nonconservative matl. kg/day 1.2 Simulates the CBOD2 component. Determined during calibration.
9 Upper Calcasieu River Reach 9 BOD kg/day 0.81 Simulates the CBOD1 component. Determined during calibration.
Organic Nitrogen kg/day 0.2 Determined during calibration.
Nonconservative matl. kg/day 2.2 Simulates the CBOD2 component. Determined during calibration.
10 Upper Calcasieu River Reach 10 BOD kg/day 0.86 Simulates the CBOD1 component. Determined during calibration.
Organic Nitrogen kg/day 0.2 Determined during calibration.
Nonconservative matl. kg/day 2.6 Simulates the CBOD2 component. Determined during calibration.
Page 18 of 26 Datatype 19 Input Description 1/14/02
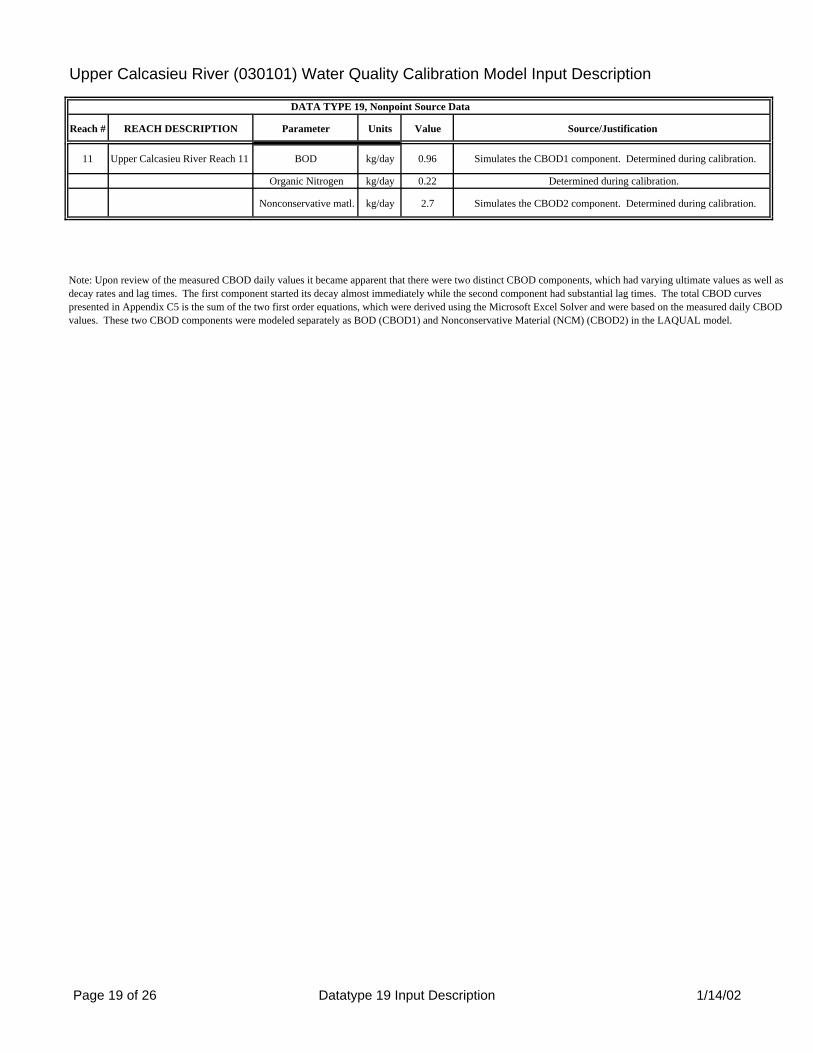
Upper Calcasieu River (030101) Water Quality Calibration Model Input Description
DATA TYPE 19, Nonpoint Source Data
Reach # REACH DESCRIPTION Parameter Units Value Source/Justification
11 Upper Calcasieu River Reach 11 BOD kg/day 0.96 Simulates the CBOD1 component. Determined during calibration.
Organic Nitrogen kg/day 0.22 Determined during calibration.
Nonconservative matl. kg/day 2.7 Simulates the CBOD2 component. Determined during calibration.
Note: Upon review of the measured CBOD daily values it became apparent that there were two distinct CBOD components, which had varying ultimate values as well as decay rates and lag times. The first component started its decay almost immediately while the second component had substantial lag times. The total CBOD curves presented in Appendix C5 is the sum of the two first order equations, which were derived using the Microsoft Excel Solver and were based on the measured daily CBOD values. These two CBOD components were modeled separately as BOD (CBOD1) and Nonconservative Material (NCM) (CBOD2) in the LAQUAL model.
Page 19 of 26 Datatype 19 Input Description 1/14/02
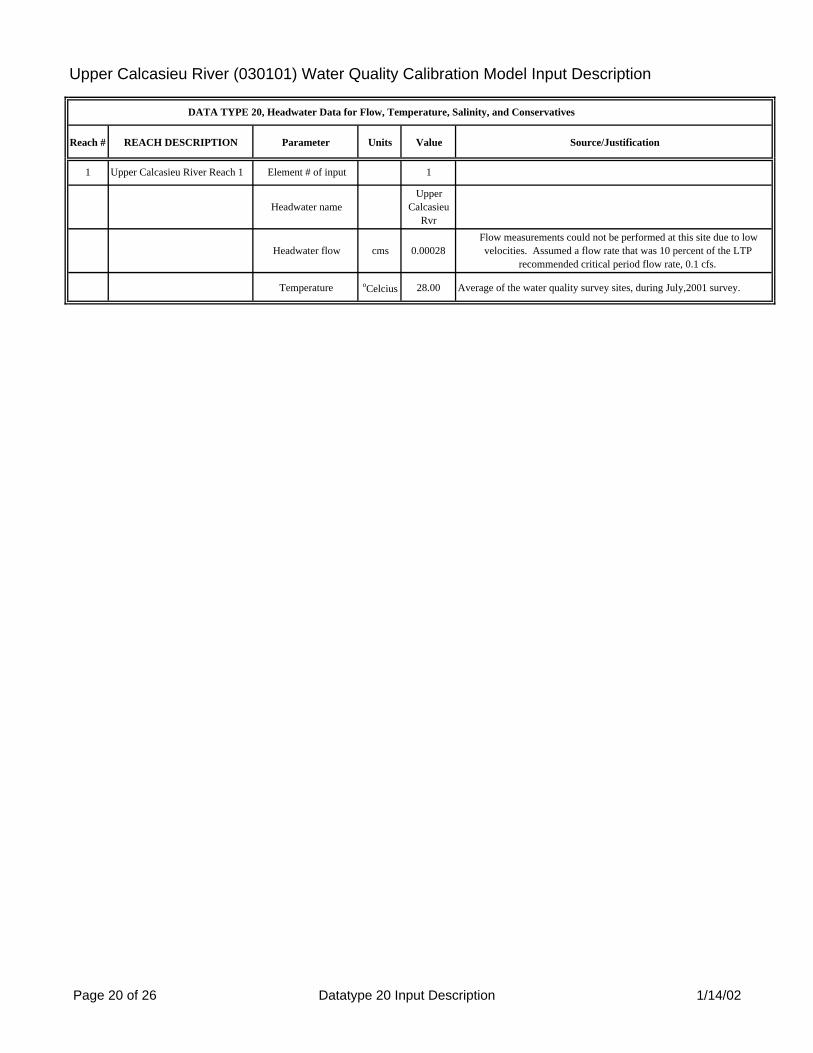
Upper Calcasieu River (030101) Water Quality Calibration Model Input Description
DATA TYPE 20, Headwater Data for Flow, Temperature, Salinity, and Conservatives
Reach # REACH DESCRIPTION Parameter Units Value Source/Justification
1 Upper Calcasieu River Reach 1 Element # of input 1
Headwater nameUpper
Calcasieu Rvr
Headwater flow cms 0.00028Flow measurements could not be performed at this site due to low velocities. Assumed a flow rate that was 10 percent of the LTP
recommended critical period flow rate, 0.1 cfs.
Temperature oCelcius 28.00 Average of the water quality survey sites, during July,2001 survey.
Page 20 of 26 Datatype 20 Input Description 1/14/02
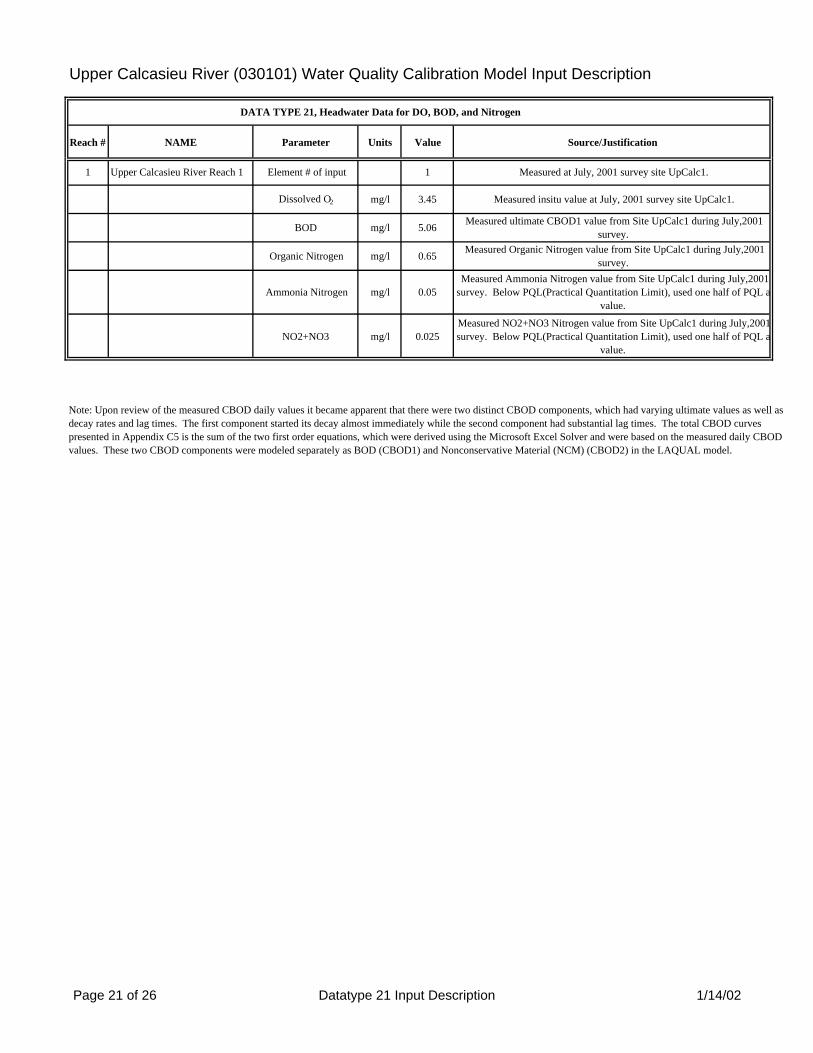
Upper Calcasieu River (030101) Water Quality Calibration Model Input Description
DATA TYPE 21, Headwater Data for DO, BOD, and Nitrogen
Reach # NAME Parameter Units Value Source/Justification
1 Upper Calcasieu River Reach 1 Element # of input 1 Measured at July, 2001 survey site UpCalc1.
Dissolved O2 mg/l 3.45 Measured insitu value at July, 2001 survey site UpCalc1.
BOD mg/l 5.06 Measured ultimate CBOD1 value from Site UpCalc1 during July,2001 survey.
Organic Nitrogen mg/l 0.65 Measured Organic Nitrogen value from Site UpCalc1 during July,2001 survey.
Ammonia Nitrogen mg/l 0.05Measured Ammonia Nitrogen value from Site UpCalc1 during July,2001
survey. Below PQL(Practical Quantitation Limit), used one half of PQL avalue.
NO2+NO3 mg/l 0.025Measured NO2+NO3 Nitrogen value from Site UpCalc1 during July,2001 survey. Below PQL(Practical Quantitation Limit), used one half of PQL a
value.
Note: Upon review of the measured CBOD daily values it became apparent that there were two distinct CBOD components, which had varying ultimate values as well as decay rates and lag times. The first component started its decay almost immediately while the second component had substantial lag times. The total CBOD curves presented in Appendix C5 is the sum of the two first order equations, which were derived using the Microsoft Excel Solver and were based on the measured daily CBOD values. These two CBOD components were modeled separately as BOD (CBOD1) and Nonconservative Material (NCM) (CBOD2) in the LAQUAL model.
Page 21 of 26 Datatype 21 Input Description 1/14/02
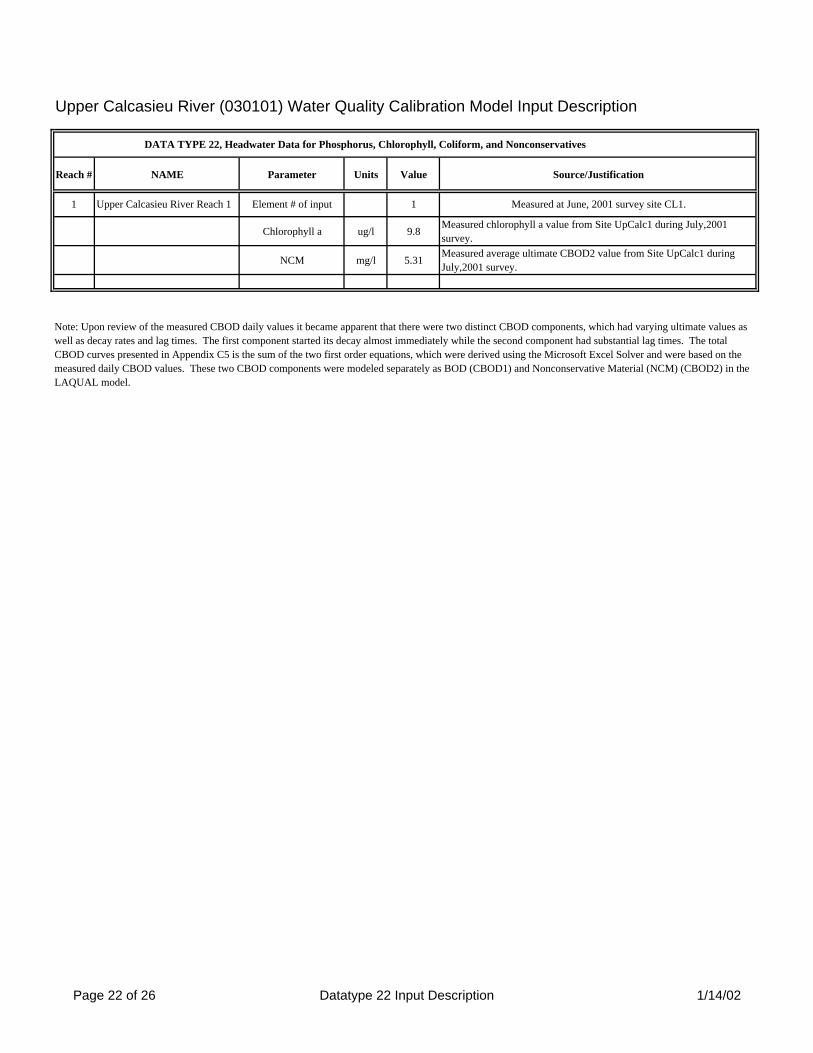
Upper Calcasieu River (030101) Water Quality Calibration Model Input Description
DATA TYPE 22, Headwater Data for Phosphorus, Chlorophyll, Coliform, and Nonconservatives
Reach # NAME Parameter Units Value Source/Justification
1 Upper Calcasieu River Reach 1 Element # of input 1 Measured at June, 2001 survey site CL1.
Chlorophyll a ug/l 9.8 Measured chlorophyll a value from Site UpCalc1 during July,2001 survey.
NCM mg/l 5.31 Measured average ultimate CBOD2 value from Site UpCalc1 during July,2001 survey.
Note: Upon review of the measured CBOD daily values it became apparent that there were two distinct CBOD components, which had varying ultimate values as well as decay rates and lag times. The first component started its decay almost immediately while the second component had substantial lag times. The total CBOD curves presented in Appendix C5 is the sum of the two first order equations, which were derived using the Microsoft Excel Solver and were based on the measured daily CBOD values. These two CBOD components were modeled separately as BOD (CBOD1) and Nonconservative Material (NCM) (CBOD2) in the LAQUAL model.
Page 22 of 26 Datatype 22 Input Description 1/14/02
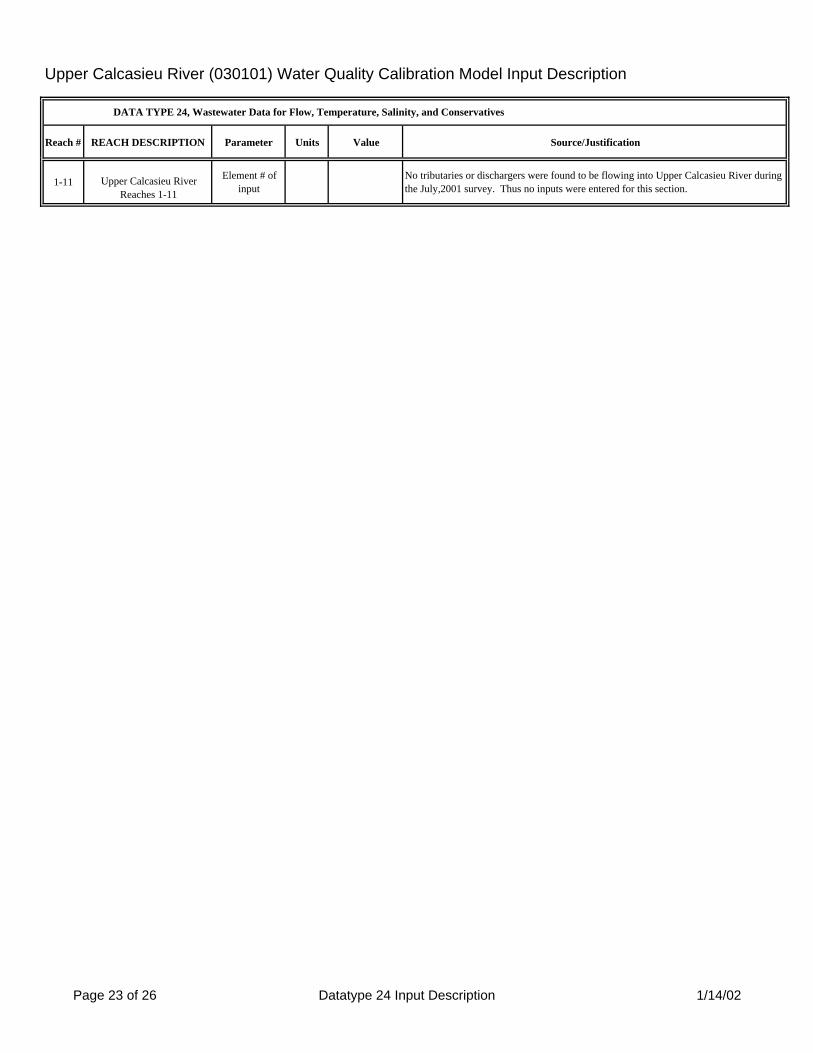
Upper Calcasieu River (030101) Water Quality Calibration Model Input Description
DATA TYPE 24, Wastewater Data for Flow, Temperature, Salinity, and Conservatives
Reach # REACH DESCRIPTION Parameter Units Value Source/Justification
1-11 Upper Calcasieu River Reaches 1-11
Element # of input
No tributaries or dischargers were found to be flowing into Upper Calcasieu River during the July,2001 survey. Thus no inputs were entered for this section.
Page 23 of 26 Datatype 24 Input Description 1/14/02
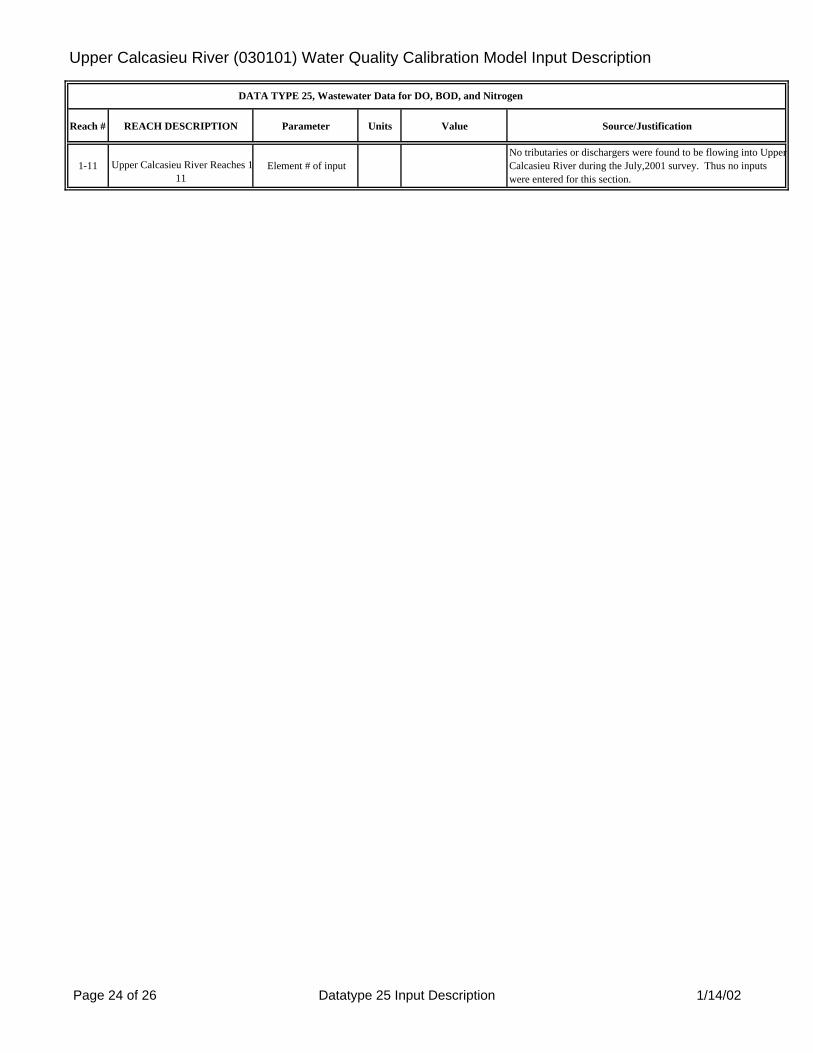
Upper Calcasieu River (030101) Water Quality Calibration Model Input Description
DATA TYPE 25, Wastewater Data for DO, BOD, and Nitrogen
Reach # REACH DESCRIPTION Parameter Units Value Source/Justification
1-11 Upper Calcasieu River Reaches 111
Element # of inputNo tributaries or dischargers were found to be flowing into Upper Calcasieu River during the July,2001 survey. Thus no inputs were entered for this section.
Page 24 of 26 Datatype 25 Input Description 1/14/02
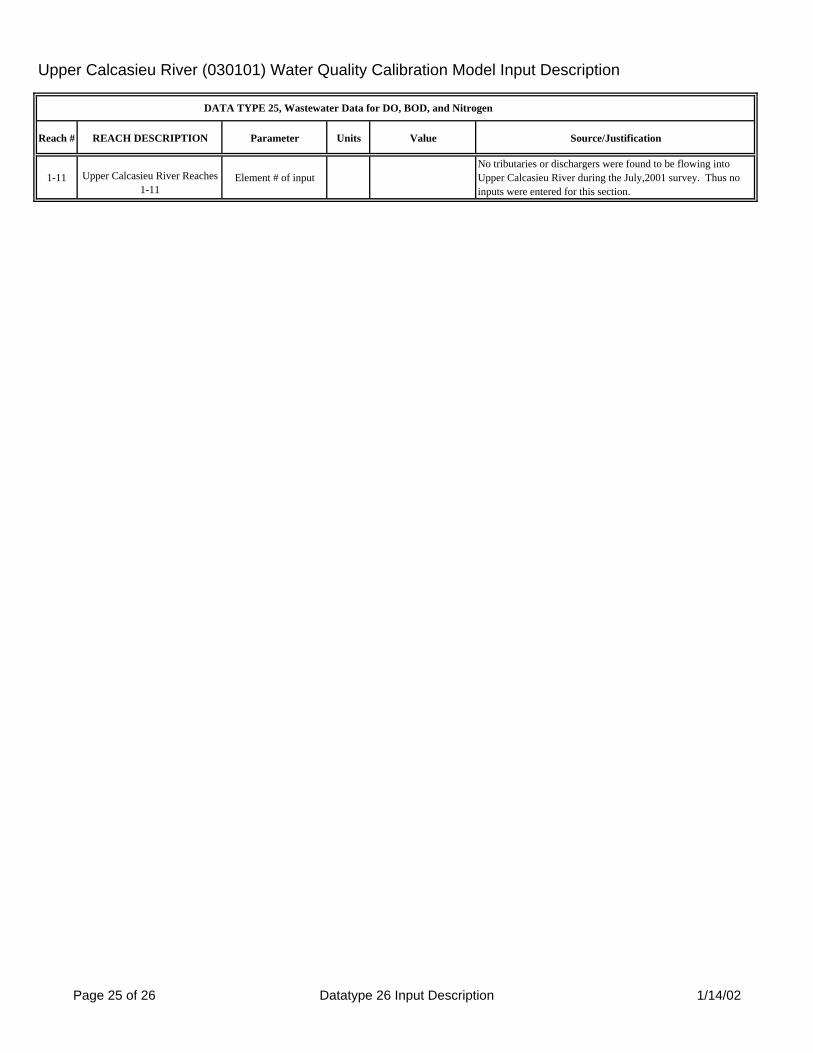
Upper Calcasieu River (030101) Water Quality Calibration Model Input Description
DATA TYPE 25, Wastewater Data for DO, BOD, and Nitrogen
Reach # REACH DESCRIPTION Parameter Units Value Source/Justification
1-11 Upper Calcasieu River Reaches 1-11
Element # of inputNo tributaries or dischargers were found to be flowing into Upper Calcasieu River during the July,2001 survey. Thus no inputs were entered for this section.
Page 25 of 26 Datatype 26 Input Description 1/14/02
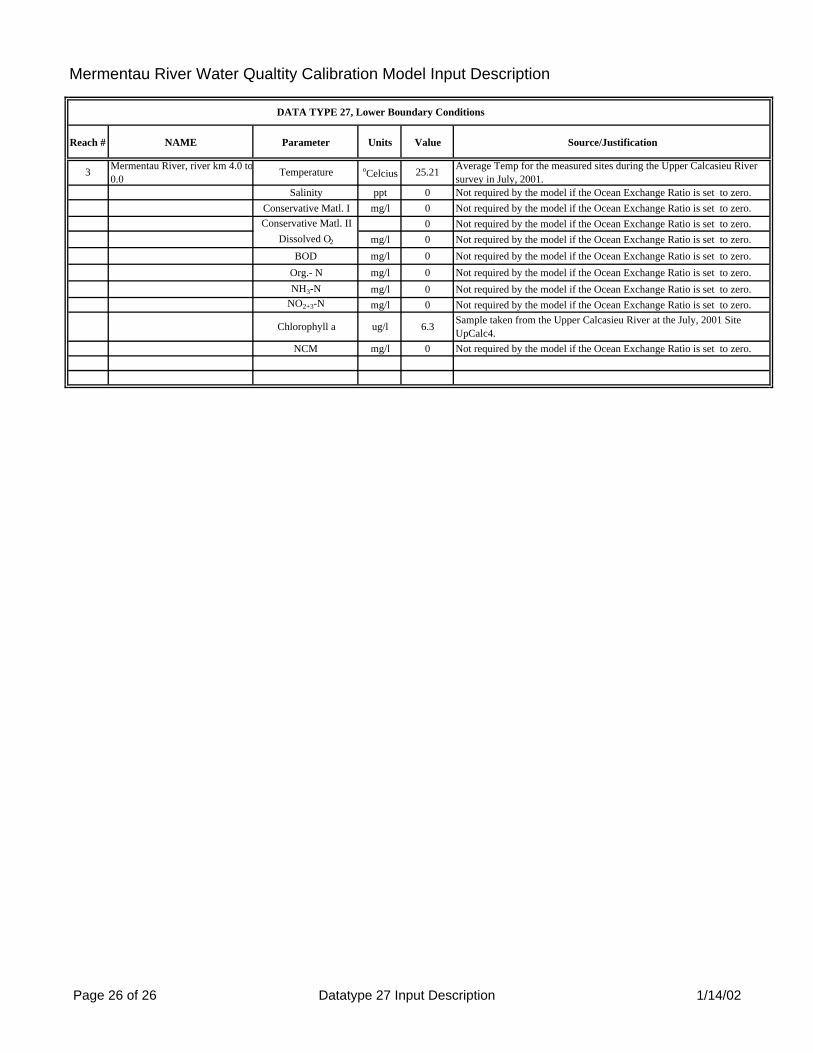
Mermentau River Water Qualtity Calibration Model Input Description
DATA TYPE 27, Lower Boundary Conditions
Reach # NAME Parameter Units Value Source/Justification
3 Mermentau River, river km 4.0 to0.0
Temperature oCelcius 25.21 Average Temp for the measured sites during the Upper Calcasieu River survey in July, 2001.
Salinity ppt 0 Not required by the model if the Ocean Exchange Ratio is set to zero.Conservative Matl. I mg/l 0 Not required by the model if the Ocean Exchange Ratio is set to zero.Conservative Matl. II 0 Not required by the model if the Ocean Exchange Ratio is set to zero.
Dissolved O2 mg/l 0 Not required by the model if the Ocean Exchange Ratio is set to zero.BOD mg/l 0 Not required by the model if the Ocean Exchange Ratio is set to zero.
Org.- N mg/l 0 Not required by the model if the Ocean Exchange Ratio is set to zero.NH3-N mg/l 0 Not required by the model if the Ocean Exchange Ratio is set to zero.
NO2+3-N mg/l 0 Not required by the model if the Ocean Exchange Ratio is set to zero.
Chlorophyll a ug/l 6.3 Sample taken from the Upper Calcasieu River at the July, 2001 Site UpCalc4.
NCM mg/l 0 Not required by the model if the Ocean Exchange Ratio is set to zero.
Page 26 of 26 Datatype 27 Input Description 1/14/02

Upper Calcasieu River Watershed TMDL for Dissolved Oxygen Subsegment 080808 Originated: January 9, 2002
29
Appendix A4
Calibration Model Development
Calibration model sensitivity output
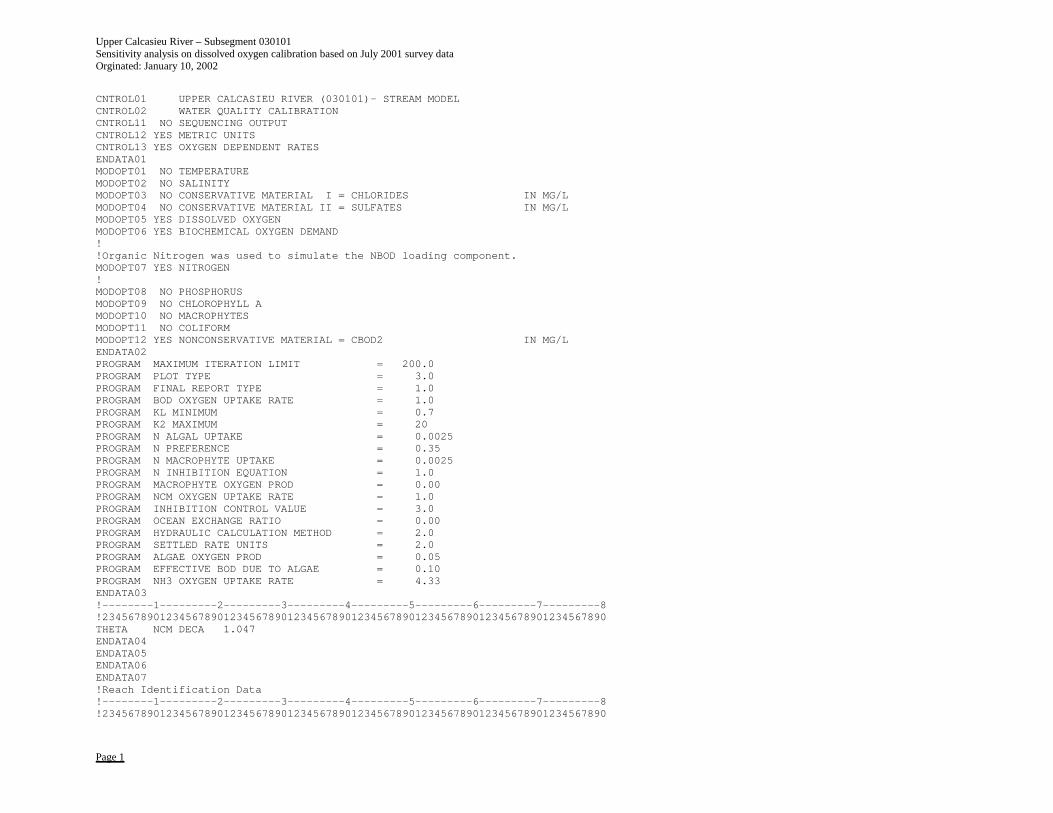
Upper Calcasieu River – Subsegment 030101 Sensitivity analysis on dissolved oxygen calibration based on July 2001 survey data Orginated: January 10, 2002
Page 1
CNTROL01 UPPER CALCASIEU RIVER (030101)- STREAM MODELCNTROL02 WATER QUALITY CALIBRATIONCNTROL11 NO SEQUENCING OUTPUTCNTROL12 YES METRIC UNITSCNTROL13 YES OXYGEN DEPENDENT RATESENDATA01MODOPT01 NO TEMPERATUREMODOPT02 NO SALINITYMODOPT03 NO CONSERVATIVE MATERIAL I = CHLORIDES IN MG/LMODOPT04 NO CONSERVATIVE MATERIAL II = SULFATES IN MG/LMODOPT05 YES DISSOLVED OXYGENMODOPT06 YES BIOCHEMICAL OXYGEN DEMAND!!Organic Nitrogen was used to simulate the NBOD loading component.MODOPT07 YES NITROGEN!MODOPT08 NO PHOSPHORUSMODOPT09 NO CHLOROPHYLL AMODOPT10 NO MACROPHYTESMODOPT11 NO COLIFORMMODOPT12 YES NONCONSERVATIVE MATERIAL = CBOD2 IN MG/LENDATA02PROGRAM MAXIMUM ITERATION LIMIT = 200.0PROGRAM PLOT TYPE = 3.0PROGRAM FINAL REPORT TYPE = 1.0PROGRAM BOD OXYGEN UPTAKE RATE = 1.0PROGRAM KL MINIMUM = 0.7PROGRAM K2 MAXIMUM = 20PROGRAM N ALGAL UPTAKE = 0.0025PROGRAM N PREFERENCE = 0.35PROGRAM N MACROPHYTE UPTAKE = 0.0025PROGRAM N INHIBITION EQUATION = 1.0PROGRAM MACROPHYTE OXYGEN PROD = 0.00PROGRAM NCM OXYGEN UPTAKE RATE = 1.0PROGRAM INHIBITION CONTROL VALUE = 3.0PROGRAM OCEAN EXCHANGE RATIO = 0.00PROGRAM HYDRAULIC CALCULATION METHOD = 2.0PROGRAM SETTLED RATE UNITS = 2.0PROGRAM ALGAE OXYGEN PROD = 0.05PROGRAM EFFECTIVE BOD DUE TO ALGAE = 0.10PROGRAM NH3 OXYGEN UPTAKE RATE = 4.33ENDATA03!--------1---------2---------3---------4---------5---------6---------7---------8!2345678901234567890123456789012345678901234567890123456789012345678901234567890THETA NCM DECA 1.047ENDATA04ENDATA05ENDATA06ENDATA07!Reach Identification Data!--------1---------2---------3---------4---------5---------6---------7---------8!2345678901234567890123456789012345678901234567890123456789012345678901234567890
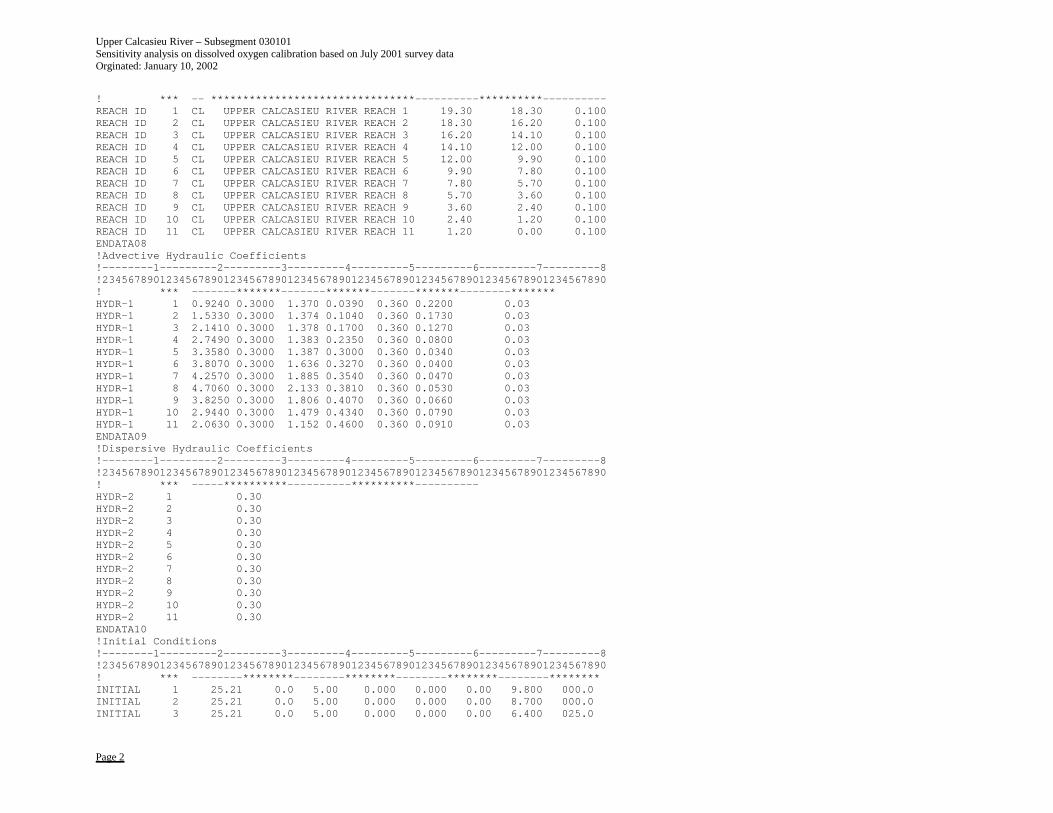
Upper Calcasieu River – Subsegment 030101 Sensitivity analysis on dissolved oxygen calibration based on July 2001 survey data Orginated: January 10, 2002
Page 2
! *** -- ********************************----------**********----------REACH ID 1 CL UPPER CALCASIEU RIVER REACH 1 19.30 18.30 0.100REACH ID 2 CL UPPER CALCASIEU RIVER REACH 2 18.30 16.20 0.100REACH ID 3 CL UPPER CALCASIEU RIVER REACH 3 16.20 14.10 0.100REACH ID 4 CL UPPER CALCASIEU RIVER REACH 4 14.10 12.00 0.100REACH ID 5 CL UPPER CALCASIEU RIVER REACH 5 12.00 9.90 0.100REACH ID 6 CL UPPER CALCASIEU RIVER REACH 6 9.90 7.80 0.100REACH ID 7 CL UPPER CALCASIEU RIVER REACH 7 7.80 5.70 0.100REACH ID 8 CL UPPER CALCASIEU RIVER REACH 8 5.70 3.60 0.100REACH ID 9 CL UPPER CALCASIEU RIVER REACH 9 3.60 2.40 0.100REACH ID 10 CL UPPER CALCASIEU RIVER REACH 10 2.40 1.20 0.100REACH ID 11 CL UPPER CALCASIEU RIVER REACH 11 1.20 0.00 0.100ENDATA08!Advective Hydraulic Coefficients!--------1---------2---------3---------4---------5---------6---------7---------8!2345678901234567890123456789012345678901234567890123456789012345678901234567890! *** -------*******-------*******-------*******--------*******HYDR-1 1 0.9240 0.3000 1.370 0.0390 0.360 0.2200 0.03HYDR-1 2 1.5330 0.3000 1.374 0.1040 0.360 0.1730 0.03HYDR-1 3 2.1410 0.3000 1.378 0.1700 0.360 0.1270 0.03HYDR-1 4 2.7490 0.3000 1.383 0.2350 0.360 0.0800 0.03HYDR-1 5 3.3580 0.3000 1.387 0.3000 0.360 0.0340 0.03HYDR-1 6 3.8070 0.3000 1.636 0.3270 0.360 0.0400 0.03HYDR-1 7 4.2570 0.3000 1.885 0.3540 0.360 0.0470 0.03HYDR-1 8 4.7060 0.3000 2.133 0.3810 0.360 0.0530 0.03HYDR-1 9 3.8250 0.3000 1.806 0.4070 0.360 0.0660 0.03HYDR-1 10 2.9440 0.3000 1.479 0.4340 0.360 0.0790 0.03HYDR-1 11 2.0630 0.3000 1.152 0.4600 0.360 0.0910 0.03ENDATA09!Dispersive Hydraulic Coefficients!--------1---------2---------3---------4---------5---------6---------7---------8!2345678901234567890123456789012345678901234567890123456789012345678901234567890! *** -----**********----------**********----------HYDR-2 1 0.30HYDR-2 2 0.30HYDR-2 3 0.30HYDR-2 4 0.30HYDR-2 5 0.30HYDR-2 6 0.30HYDR-2 7 0.30HYDR-2 8 0.30HYDR-2 9 0.30HYDR-2 10 0.30HYDR-2 11 0.30ENDATA10!Initial Conditions!--------1---------2---------3---------4---------5---------6---------7---------8!2345678901234567890123456789012345678901234567890123456789012345678901234567890! *** --------********--------********--------********--------********INITIAL 1 25.21 0.0 5.00 0.000 0.000 0.00 9.800 000.0INITIAL 2 25.21 0.0 5.00 0.000 0.000 0.00 8.700 000.0INITIAL 3 25.21 0.0 5.00 0.000 0.000 0.00 6.400 025.0
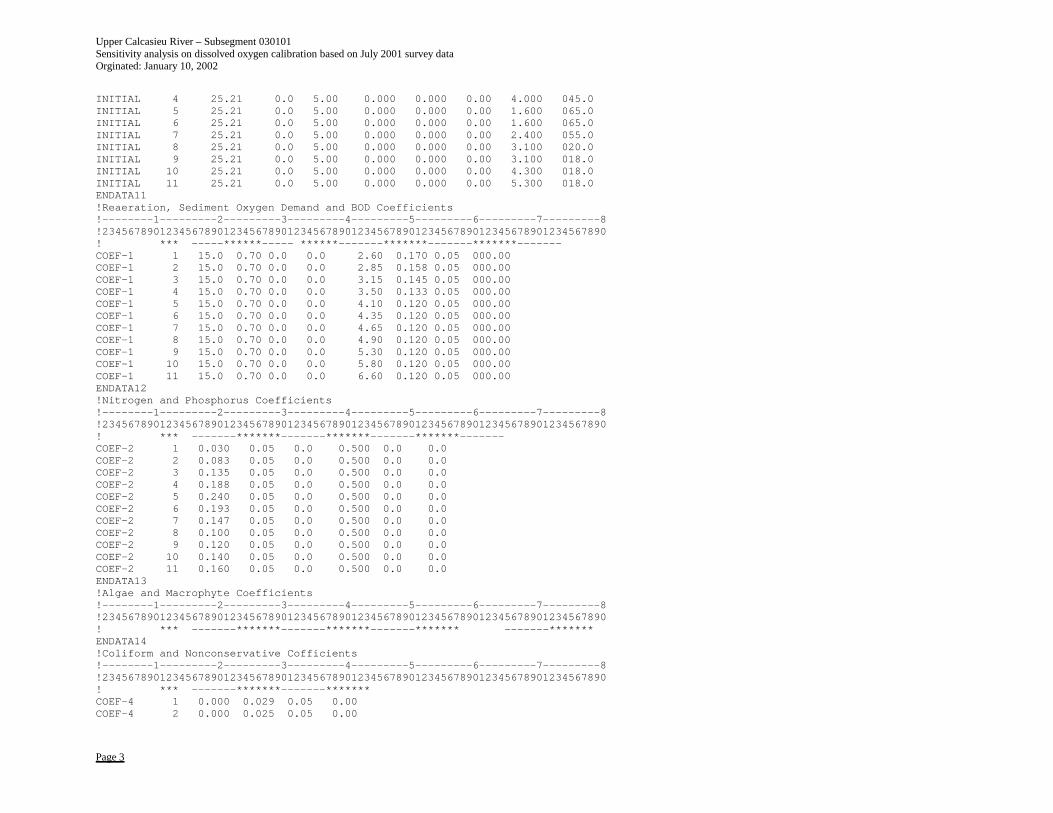
Upper Calcasieu River – Subsegment 030101 Sensitivity analysis on dissolved oxygen calibration based on July 2001 survey data Orginated: January 10, 2002
Page 3
INITIAL 4 25.21 0.0 5.00 0.000 0.000 0.00 4.000 045.0INITIAL 5 25.21 0.0 5.00 0.000 0.000 0.00 1.600 065.0INITIAL 6 25.21 0.0 5.00 0.000 0.000 0.00 1.600 065.0INITIAL 7 25.21 0.0 5.00 0.000 0.000 0.00 2.400 055.0INITIAL 8 25.21 0.0 5.00 0.000 0.000 0.00 3.100 020.0INITIAL 9 25.21 0.0 5.00 0.000 0.000 0.00 3.100 018.0INITIAL 10 25.21 0.0 5.00 0.000 0.000 0.00 4.300 018.0INITIAL 11 25.21 0.0 5.00 0.000 0.000 0.00 5.300 018.0ENDATA11!Reaeration, Sediment Oxygen Demand and BOD Coefficients!--------1---------2---------3---------4---------5---------6---------7---------8!2345678901234567890123456789012345678901234567890123456789012345678901234567890! *** -----******----- ******-------*******-------*******-------COEF-1 1 15.0 0.70 0.0 0.0 2.60 0.170 0.05 000.00COEF-1 2 15.0 0.70 0.0 0.0 2.85 0.158 0.05 000.00COEF-1 3 15.0 0.70 0.0 0.0 3.15 0.145 0.05 000.00COEF-1 4 15.0 0.70 0.0 0.0 3.50 0.133 0.05 000.00COEF-1 5 15.0 0.70 0.0 0.0 4.10 0.120 0.05 000.00COEF-1 6 15.0 0.70 0.0 0.0 4.35 0.120 0.05 000.00COEF-1 7 15.0 0.70 0.0 0.0 4.65 0.120 0.05 000.00COEF-1 8 15.0 0.70 0.0 0.0 4.90 0.120 0.05 000.00COEF-1 9 15.0 0.70 0.0 0.0 5.30 0.120 0.05 000.00COEF-1 10 15.0 0.70 0.0 0.0 5.80 0.120 0.05 000.00COEF-1 11 15.0 0.70 0.0 0.0 6.60 0.120 0.05 000.00ENDATA12!Nitrogen and Phosphorus Coefficients!--------1---------2---------3---------4---------5---------6---------7---------8!2345678901234567890123456789012345678901234567890123456789012345678901234567890! *** -------*******-------*******-------*******-------COEF-2 1 0.030 0.05 0.0 0.500 0.0 0.0COEF-2 2 0.083 0.05 0.0 0.500 0.0 0.0COEF-2 3 0.135 0.05 0.0 0.500 0.0 0.0COEF-2 4 0.188 0.05 0.0 0.500 0.0 0.0COEF-2 5 0.240 0.05 0.0 0.500 0.0 0.0COEF-2 6 0.193 0.05 0.0 0.500 0.0 0.0COEF-2 7 0.147 0.05 0.0 0.500 0.0 0.0COEF-2 8 0.100 0.05 0.0 0.500 0.0 0.0COEF-2 9 0.120 0.05 0.0 0.500 0.0 0.0COEF-2 10 0.140 0.05 0.0 0.500 0.0 0.0COEF-2 11 0.160 0.05 0.0 0.500 0.0 0.0ENDATA13!Algae and Macrophyte Coefficients!--------1---------2---------3---------4---------5---------6---------7---------8!2345678901234567890123456789012345678901234567890123456789012345678901234567890! *** -------*******-------*******-------******* -------*******ENDATA14!Coliform and Nonconservative Cofficients!--------1---------2---------3---------4---------5---------6---------7---------8!2345678901234567890123456789012345678901234567890123456789012345678901234567890! *** -------*******-------*******COEF-4 1 0.000 0.029 0.05 0.00COEF-4 2 0.000 0.025 0.05 0.00
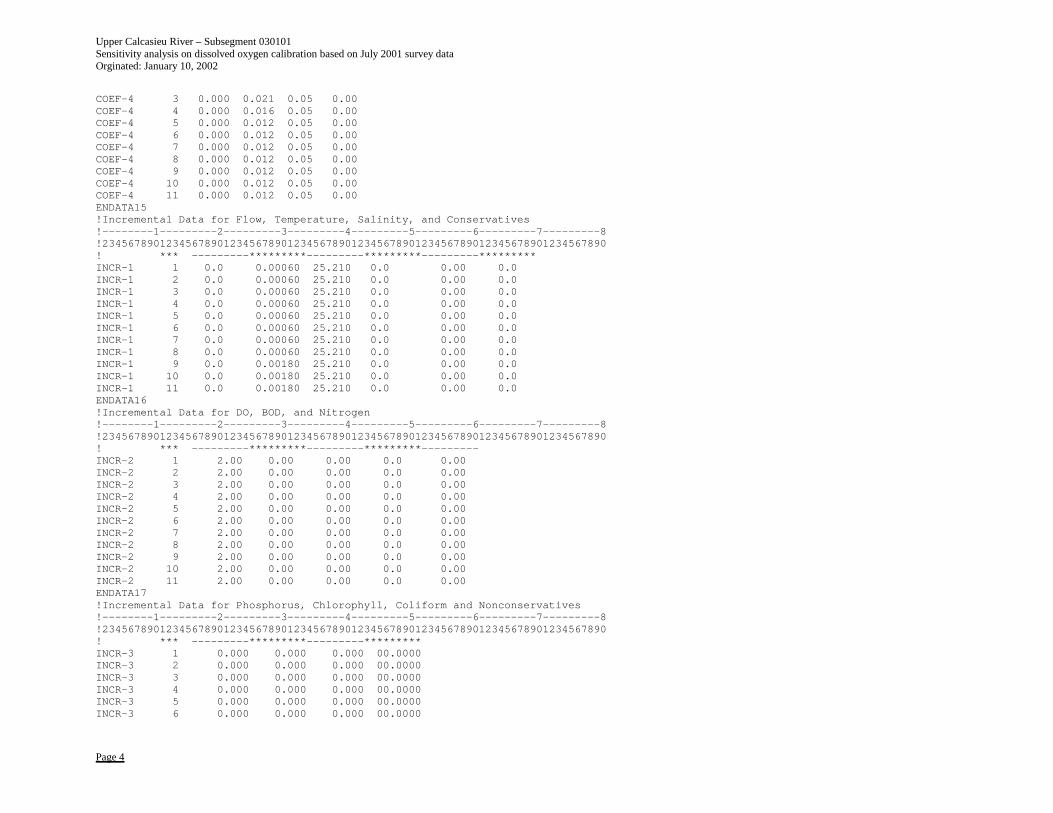
Upper Calcasieu River – Subsegment 030101 Sensitivity analysis on dissolved oxygen calibration based on July 2001 survey data Orginated: January 10, 2002
Page 4
COEF-4 3 0.000 0.021 0.05 0.00COEF-4 4 0.000 0.016 0.05 0.00COEF-4 5 0.000 0.012 0.05 0.00COEF-4 6 0.000 0.012 0.05 0.00COEF-4 7 0.000 0.012 0.05 0.00COEF-4 8 0.000 0.012 0.05 0.00COEF-4 9 0.000 0.012 0.05 0.00COEF-4 10 0.000 0.012 0.05 0.00COEF-4 11 0.000 0.012 0.05 0.00ENDATA15!Incremental Data for Flow, Temperature, Salinity, and Conservatives!--------1---------2---------3---------4---------5---------6---------7---------8!2345678901234567890123456789012345678901234567890123456789012345678901234567890! *** ---------*********---------*********---------*********INCR-1 1 0.0 0.00060 25.210 0.0 0.00 0.0INCR-1 2 0.0 0.00060 25.210 0.0 0.00 0.0INCR-1 3 0.0 0.00060 25.210 0.0 0.00 0.0INCR-1 4 0.0 0.00060 25.210 0.0 0.00 0.0INCR-1 5 0.0 0.00060 25.210 0.0 0.00 0.0INCR-1 6 0.0 0.00060 25.210 0.0 0.00 0.0INCR-1 7 0.0 0.00060 25.210 0.0 0.00 0.0INCR-1 8 0.0 0.00060 25.210 0.0 0.00 0.0INCR-1 9 0.0 0.00180 25.210 0.0 0.00 0.0INCR-1 10 0.0 0.00180 25.210 0.0 0.00 0.0INCR-1 11 0.0 0.00180 25.210 0.0 0.00 0.0ENDATA16!Incremental Data for DO, BOD, and Nitrogen!--------1---------2---------3---------4---------5---------6---------7---------8!2345678901234567890123456789012345678901234567890123456789012345678901234567890! *** ---------*********---------*********---------INCR-2 1 2.00 0.00 0.00 0.0 0.00INCR-2 2 2.00 0.00 0.00 0.0 0.00INCR-2 3 2.00 0.00 0.00 0.0 0.00INCR-2 4 2.00 0.00 0.00 0.0 0.00INCR-2 5 2.00 0.00 0.00 0.0 0.00INCR-2 6 2.00 0.00 0.00 0.0 0.00INCR-2 7 2.00 0.00 0.00 0.0 0.00INCR-2 8 2.00 0.00 0.00 0.0 0.00INCR-2 9 2.00 0.00 0.00 0.0 0.00INCR-2 10 2.00 0.00 0.00 0.0 0.00INCR-2 11 2.00 0.00 0.00 0.0 0.00ENDATA17!Incremental Data for Phosphorus, Chlorophyll, Coliform and Nonconservatives!--------1---------2---------3---------4---------5---------6---------7---------8!2345678901234567890123456789012345678901234567890123456789012345678901234567890! *** ---------*********---------*********INCR-3 1 0.000 0.000 0.000 00.0000INCR-3 2 0.000 0.000 0.000 00.0000INCR-3 3 0.000 0.000 0.000 00.0000INCR-3 4 0.000 0.000 0.000 00.0000INCR-3 5 0.000 0.000 0.000 00.0000INCR-3 6 0.000 0.000 0.000 00.0000
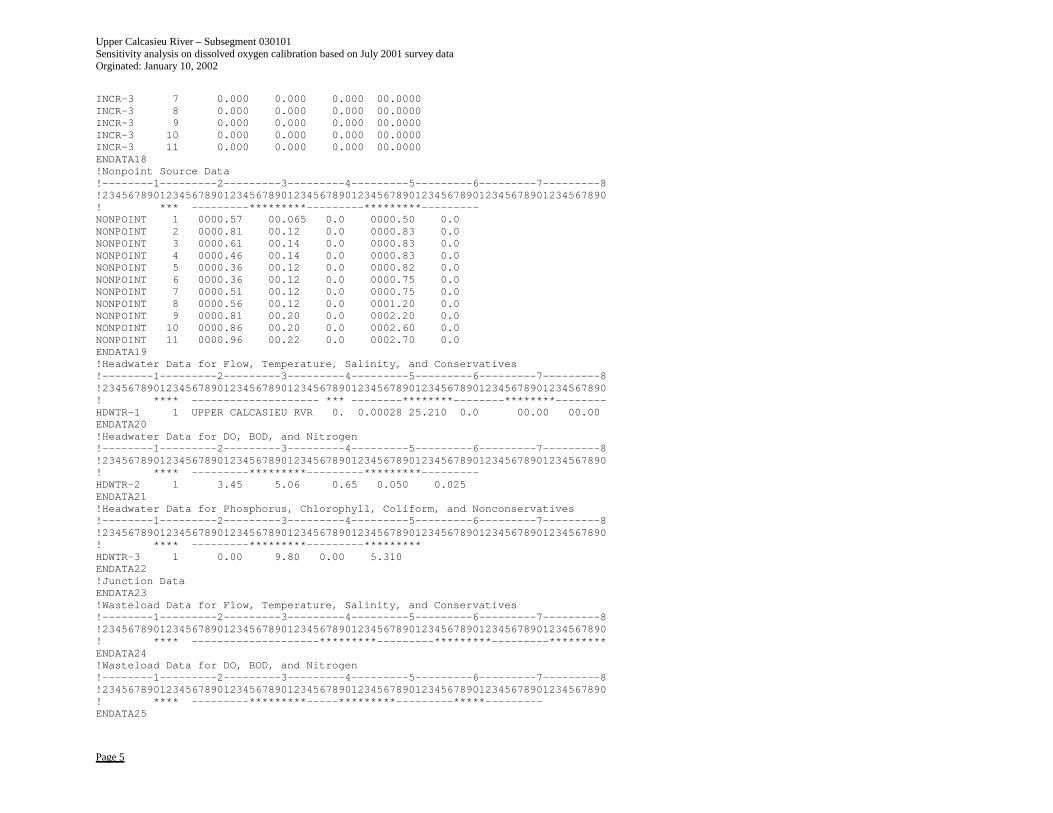
Upper Calcasieu River – Subsegment 030101 Sensitivity analysis on dissolved oxygen calibration based on July 2001 survey data Orginated: January 10, 2002
Page 5
INCR-3 7 0.000 0.000 0.000 00.0000INCR-3 8 0.000 0.000 0.000 00.0000INCR-3 9 0.000 0.000 0.000 00.0000INCR-3 10 0.000 0.000 0.000 00.0000INCR-3 11 0.000 0.000 0.000 00.0000ENDATA18!Nonpoint Source Data!--------1---------2---------3---------4---------5---------6---------7---------8!2345678901234567890123456789012345678901234567890123456789012345678901234567890! *** ---------*********---------*********---------NONPOINT 1 0000.57 00.065 0.0 0000.50 0.0NONPOINT 2 0000.81 00.12 0.0 0000.83 0.0NONPOINT 3 0000.61 00.14 0.0 0000.83 0.0NONPOINT 4 0000.46 00.14 0.0 0000.83 0.0NONPOINT 5 0000.36 00.12 0.0 0000.82 0.0NONPOINT 6 0000.36 00.12 0.0 0000.75 0.0NONPOINT 7 0000.51 00.12 0.0 0000.75 0.0NONPOINT 8 0000.56 00.12 0.0 0001.20 0.0NONPOINT 9 0000.81 00.20 0.0 0002.20 0.0NONPOINT 10 0000.86 00.20 0.0 0002.60 0.0NONPOINT 11 0000.96 00.22 0.0 0002.70 0.0ENDATA19!Headwater Data for Flow, Temperature, Salinity, and Conservatives!--------1---------2---------3---------4---------5---------6---------7---------8!2345678901234567890123456789012345678901234567890123456789012345678901234567890! **** -------------------- *** --------********--------********--------HDWTR-1 1 UPPER CALCASIEU RVR 0. 0.00028 25.210 0.0 00.00 00.00ENDATA20!Headwater Data for DO, BOD, and Nitrogen!--------1---------2---------3---------4---------5---------6---------7---------8!2345678901234567890123456789012345678901234567890123456789012345678901234567890! **** ---------*********---------*********---------HDWTR-2 1 3.45 5.06 0.65 0.050 0.025ENDATA21!Headwater Data for Phosphorus, Chlorophyll, Coliform, and Nonconservatives!--------1---------2---------3---------4---------5---------6---------7---------8!2345678901234567890123456789012345678901234567890123456789012345678901234567890! **** ---------*********---------*********HDWTR-3 1 0.00 9.80 0.00 5.310ENDATA22!Junction DataENDATA23!Wasteload Data for Flow, Temperature, Salinity, and Conservatives!--------1---------2---------3---------4---------5---------6---------7---------8!2345678901234567890123456789012345678901234567890123456789012345678901234567890! **** --------------------*********---------*********---------*********ENDATA24!Wasteload Data for DO, BOD, and Nitrogen!--------1---------2---------3---------4---------5---------6---------7---------8!2345678901234567890123456789012345678901234567890123456789012345678901234567890! **** ---------*********-----*********---------*****---------ENDATA25
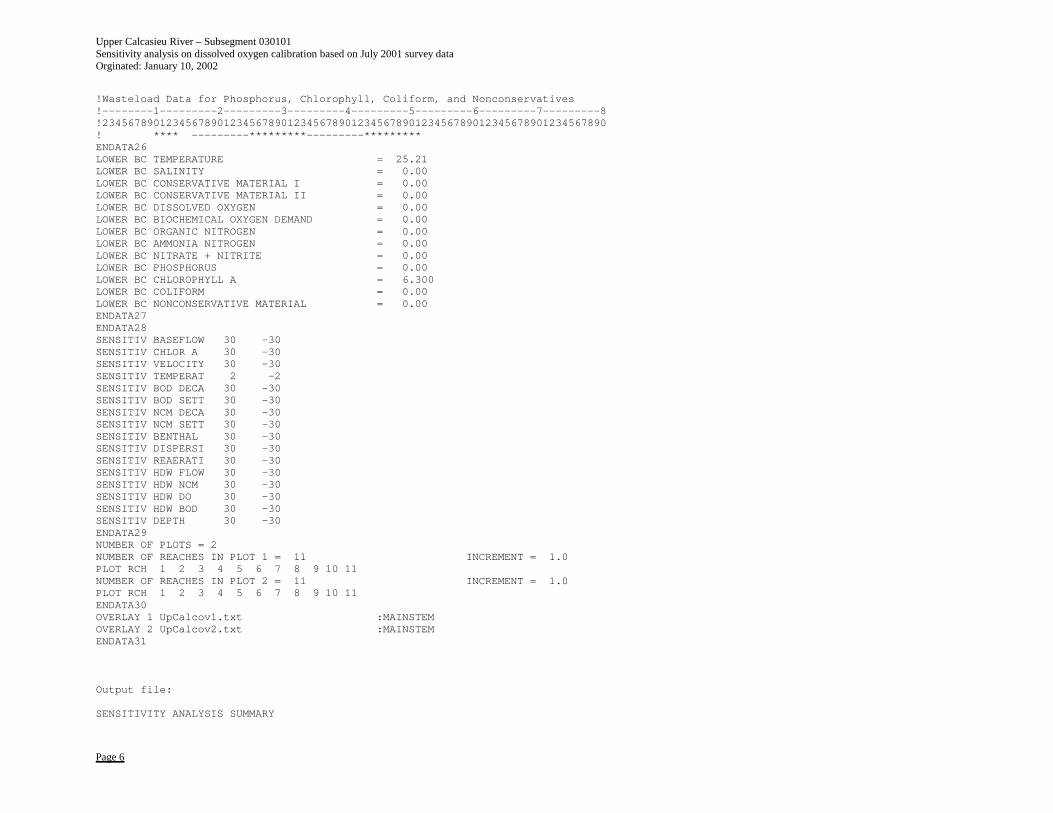
Upper Calcasieu River – Subsegment 030101 Sensitivity analysis on dissolved oxygen calibration based on July 2001 survey data Orginated: January 10, 2002
Page 6
!Wasteload Data for Phosphorus, Chlorophyll, Coliform, and Nonconservatives!--------1---------2---------3---------4---------5---------6---------7---------8!2345678901234567890123456789012345678901234567890123456789012345678901234567890! **** ---------*********---------*********ENDATA26LOWER BC TEMPERATURE = 25.21LOWER BC SALINITY = 0.00LOWER BC CONSERVATIVE MATERIAL I = 0.00LOWER BC CONSERVATIVE MATERIAL II = 0.00LOWER BC DISSOLVED OXYGEN = 0.00LOWER BC BIOCHEMICAL OXYGEN DEMAND = 0.00LOWER BC ORGANIC NITROGEN = 0.00LOWER BC AMMONIA NITROGEN = 0.00LOWER BC NITRATE + NITRITE = 0.00LOWER BC PHOSPHORUS = 0.00LOWER BC CHLOROPHYLL A = 6.300LOWER BC COLIFORM = 0.00LOWER BC NONCONSERVATIVE MATERIAL = 0.00ENDATA27ENDATA28SENSITIV BASEFLOW 30 -30SENSITIV CHLOR A 30 -30SENSITIV VELOCITY 30 -30SENSITIV TEMPERAT 2 -2SENSITIV BOD DECA 30 -30SENSITIV BOD SETT 30 -30SENSITIV NCM DECA 30 -30SENSITIV NCM SETT 30 -30SENSITIV BENTHAL 30 -30SENSITIV DISPERSI 30 -30SENSITIV REAERATI 30 -30SENSITIV HDW FLOW 30 -30SENSITIV HDW NCM 30 -30SENSITIV HDW DO 30 -30SENSITIV HDW BOD 30 -30SENSITIV DEPTH 30 -30ENDATA29NUMBER OF PLOTS = 2NUMBER OF REACHES IN PLOT 1 = 11 INCREMENT = 1.0PLOT RCH 1 2 3 4 5 6 7 8 9 10 11NUMBER OF REACHES IN PLOT 2 = 11 INCREMENT = 1.0PLOT RCH 1 2 3 4 5 6 7 8 9 10 11ENDATA30OVERLAY 1 UpCalcov1.txt :MAINSTEMOVERLAY 2 UpCalcov2.txt :MAINSTEMENDATA31
Output file:
SENSITIVITY ANALYSIS SUMMARY
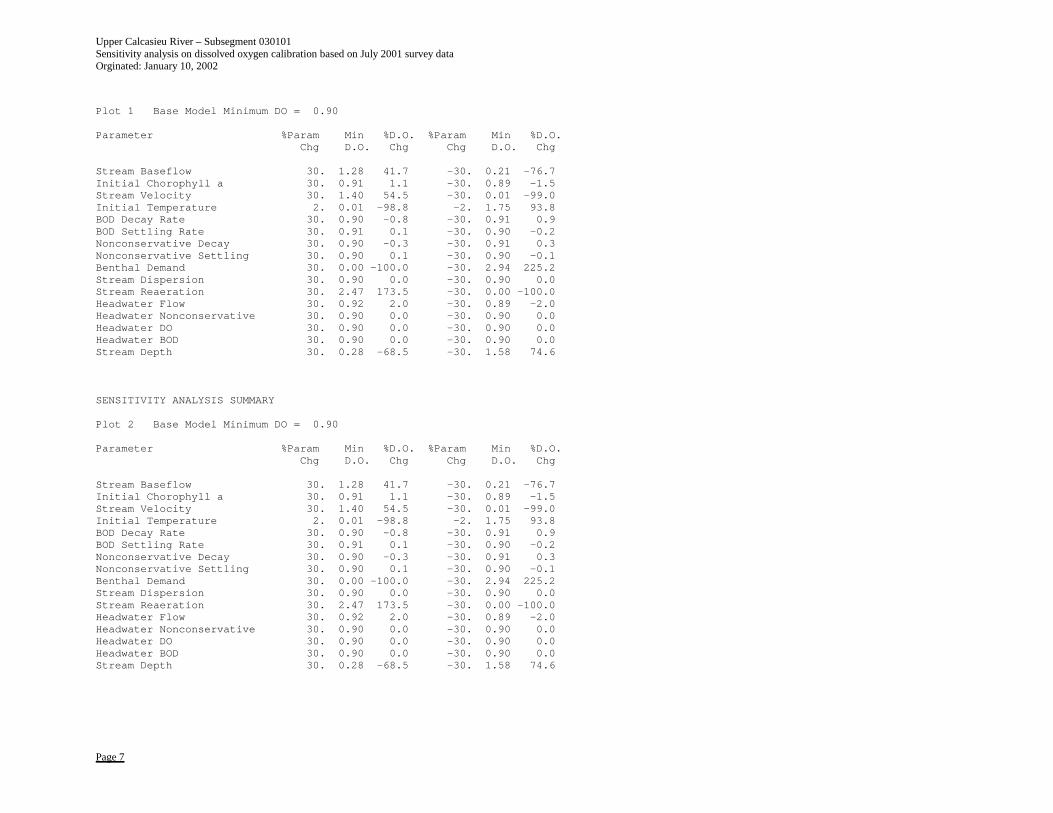
Upper Calcasieu River – Subsegment 030101 Sensitivity analysis on dissolved oxygen calibration based on July 2001 survey data Orginated: January 10, 2002
Page 7
Plot 1 Base Model Minimum DO = 0.90
Parameter %Param Min %D.O. %Param Min %D.O.Chg D.O. Chg Chg D.O. Chg
Stream Baseflow 30. 1.28 41.7 -30. 0.21 -76.7Initial Chorophyll a 30. 0.91 1.1 -30. 0.89 -1.5Stream Velocity 30. 1.40 54.5 -30. 0.01 -99.0Initial Temperature 2. 0.01 -98.8 -2. 1.75 93.8BOD Decay Rate 30. 0.90 -0.8 -30. 0.91 0.9BOD Settling Rate 30. 0.91 0.1 -30. 0.90 -0.2Nonconservative Decay 30. 0.90 -0.3 -30. 0.91 0.3Nonconservative Settling 30. 0.90 0.1 -30. 0.90 -0.1Benthal Demand 30. 0.00 -100.0 -30. 2.94 225.2Stream Dispersion 30. 0.90 0.0 -30. 0.90 0.0Stream Reaeration 30. 2.47 173.5 -30. 0.00 -100.0Headwater Flow 30. 0.92 2.0 -30. 0.89 -2.0Headwater Nonconservative 30. 0.90 0.0 -30. 0.90 0.0Headwater DO 30. 0.90 0.0 -30. 0.90 0.0Headwater BOD 30. 0.90 0.0 -30. 0.90 0.0Stream Depth 30. 0.28 -68.5 -30. 1.58 74.6
SENSITIVITY ANALYSIS SUMMARY
Plot 2 Base Model Minimum DO = 0.90
Parameter %Param Min %D.O. %Param Min %D.O.Chg D.O. Chg Chg D.O. Chg
Stream Baseflow 30. 1.28 41.7 -30. 0.21 -76.7Initial Chorophyll a 30. 0.91 1.1 -30. 0.89 -1.5Stream Velocity 30. 1.40 54.5 -30. 0.01 -99.0Initial Temperature 2. 0.01 -98.8 -2. 1.75 93.8BOD Decay Rate 30. 0.90 -0.8 -30. 0.91 0.9BOD Settling Rate 30. 0.91 0.1 -30. 0.90 -0.2Nonconservative Decay 30. 0.90 -0.3 -30. 0.91 0.3Nonconservative Settling 30. 0.90 0.1 -30. 0.90 -0.1Benthal Demand 30. 0.00 -100.0 -30. 2.94 225.2Stream Dispersion 30. 0.90 0.0 -30. 0.90 0.0Stream Reaeration 30. 2.47 173.5 -30. 0.00 -100.0Headwater Flow 30. 0.92 2.0 -30. 0.89 -2.0Headwater Nonconservative 30. 0.90 0.0 -30. 0.90 0.0Headwater DO 30. 0.90 0.0 -30. 0.90 0.0Headwater BOD 30. 0.90 0.0 -30. 0.90 0.0Stream Depth 30. 0.28 -68.5 -30. 1.58 74.6

Upper Calcasieu River Watershed TMDL for Dissolved Oxygen Subsegment 080808 Originated: January 9, 2002
30
Appendix B
Projection Model Development
Upper Calcasieu River Watershed TMDL for Dissolved Oxygen Subsegment 080808 Originated: January 9, 2002
31
Appendix B1
Projection Model Development
Critical temperature determinations
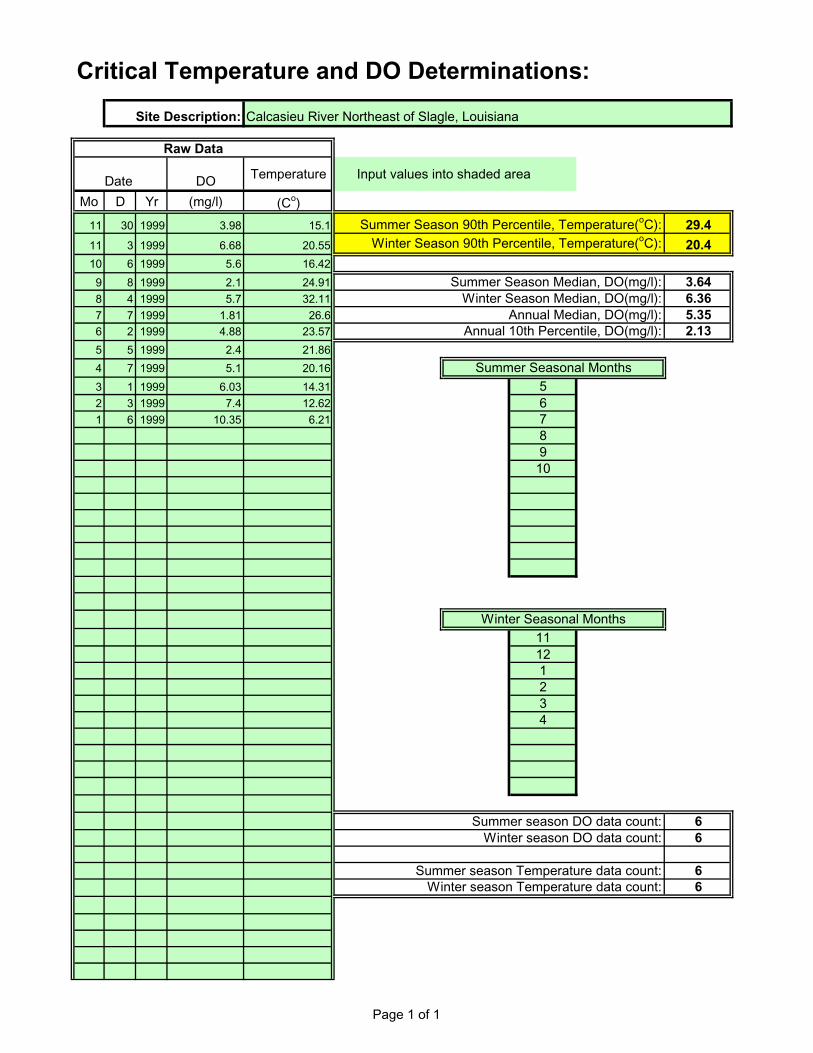
Critical Temperature and DO Determinations:
Site Description: Calcasieu River Northeast of Slagle, Louisiana
Raw Data
Date DO Temperature Input values into shaded area
Mo D Yr (mg/l) (Co)
11 30 1999 3.98 15.1 Summer Season 90th Percentile, Temperature(oC): 29.4
11 3 1999 6.68 20.55 Winter Season 90th Percentile, Temperature(oC): 20.410 6 1999 5.6 16.42
9 8 1999 2.1 24.91 Summer Season Median, DO(mg/l): 3.648 4 1999 5.7 32.11 Winter Season Median, DO(mg/l): 6.367 7 1999 1.81 26.6 Annual Median, DO(mg/l): 5.356 2 1999 4.88 23.57 Annual 10th Percentile, DO(mg/l): 2.135 5 1999 2.4 21.86
4 7 1999 5.1 20.16 Summer Seasonal Months3 1 1999 6.03 14.31 52 3 1999 7.4 12.62 61 6 1999 10.35 6.21 7
8910
Winter Seasonal Months11121234
Summer season DO data count: 6Winter season DO data count: 6
Summer season Temperature data count: 6Winter season Temperature data count: 6
Page 1 of 1

Upper Calcasieu River Watershed TMDL for Dissolved Oxygen Subsegment 080808 Originated: January 9, 2002
32
Appendix B2
Projection Model Development
Summer projection model input/output and graphs
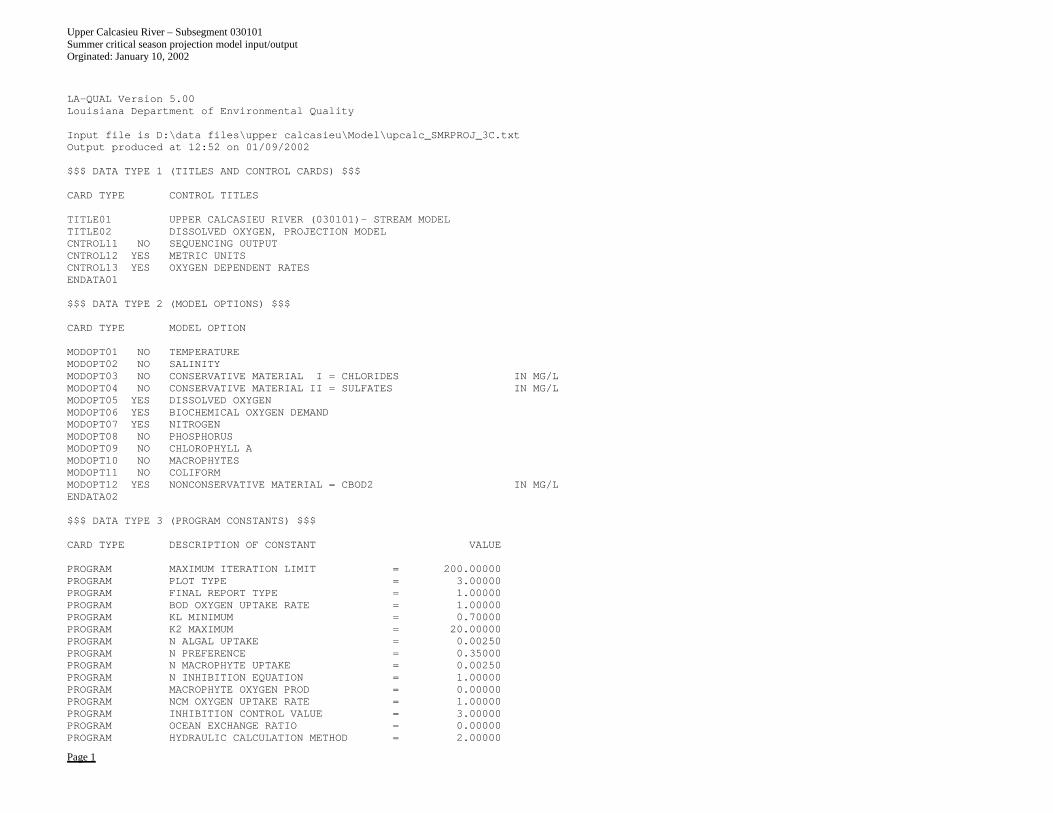
Upper Calcasieu River – Subsegment 030101 Summer critical season projection model input/output Orginated: January 10, 2002
Page 1
LA-QUAL Version 5.00Louisiana Department of Environmental Quality
Input file is D:\data files\upper calcasieu\Model\upcalc_SMRPROJ_3C.txtOutput produced at 12:52 on 01/09/2002
$$$ DATA TYPE 1 (TITLES AND CONTROL CARDS) $$$
CARD TYPE CONTROL TITLES
TITLE01 UPPER CALCASIEU RIVER (030101)- STREAM MODELTITLE02 DISSOLVED OXYGEN, PROJECTION MODELCNTROL11 NO SEQUENCING OUTPUTCNTROL12 YES METRIC UNITSCNTROL13 YES OXYGEN DEPENDENT RATESENDATA01
$$$ DATA TYPE 2 (MODEL OPTIONS) $$$
CARD TYPE MODEL OPTION
MODOPT01 NO TEMPERATUREMODOPT02 NO SALINITYMODOPT03 NO CONSERVATIVE MATERIAL I = CHLORIDES IN MG/LMODOPT04 NO CONSERVATIVE MATERIAL II = SULFATES IN MG/LMODOPT05 YES DISSOLVED OXYGENMODOPT06 YES BIOCHEMICAL OXYGEN DEMANDMODOPT07 YES NITROGENMODOPT08 NO PHOSPHORUSMODOPT09 NO CHLOROPHYLL AMODOPT10 NO MACROPHYTESMODOPT11 NO COLIFORMMODOPT12 YES NONCONSERVATIVE MATERIAL = CBOD2 IN MG/LENDATA02
$$$ DATA TYPE 3 (PROGRAM CONSTANTS) $$$
CARD TYPE DESCRIPTION OF CONSTANT VALUE
PROGRAM MAXIMUM ITERATION LIMIT = 200.00000PROGRAM PLOT TYPE = 3.00000PROGRAM FINAL REPORT TYPE = 1.00000PROGRAM BOD OXYGEN UPTAKE RATE = 1.00000PROGRAM KL MINIMUM = 0.70000PROGRAM K2 MAXIMUM = 20.00000PROGRAM N ALGAL UPTAKE = 0.00250PROGRAM N PREFERENCE = 0.35000PROGRAM N MACROPHYTE UPTAKE = 0.00250PROGRAM N INHIBITION EQUATION = 1.00000PROGRAM MACROPHYTE OXYGEN PROD = 0.00000PROGRAM NCM OXYGEN UPTAKE RATE = 1.00000PROGRAM INHIBITION CONTROL VALUE = 3.00000PROGRAM OCEAN EXCHANGE RATIO = 0.00000PROGRAM HYDRAULIC CALCULATION METHOD = 2.00000
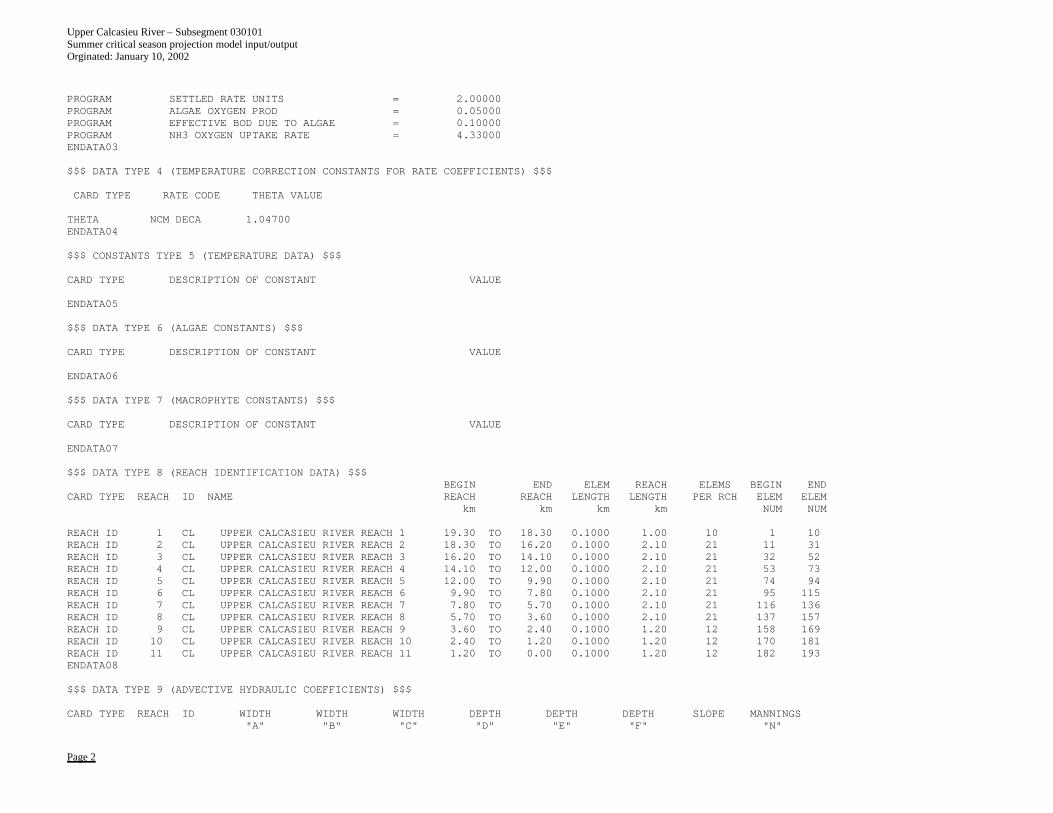
Upper Calcasieu River – Subsegment 030101 Summer critical season projection model input/output Orginated: January 10, 2002
Page 2
PROGRAM SETTLED RATE UNITS = 2.00000PROGRAM ALGAE OXYGEN PROD = 0.05000PROGRAM EFFECTIVE BOD DUE TO ALGAE = 0.10000PROGRAM NH3 OXYGEN UPTAKE RATE = 4.33000ENDATA03
$$$ DATA TYPE 4 (TEMPERATURE CORRECTION CONSTANTS FOR RATE COEFFICIENTS) $$$
CARD TYPE RATE CODE THETA VALUE
THETA NCM DECA 1.04700ENDATA04
$$$ CONSTANTS TYPE 5 (TEMPERATURE DATA) $$$
CARD TYPE DESCRIPTION OF CONSTANT VALUE
ENDATA05
$$$ DATA TYPE 6 (ALGAE CONSTANTS) $$$
CARD TYPE DESCRIPTION OF CONSTANT VALUE
ENDATA06
$$$ DATA TYPE 7 (MACROPHYTE CONSTANTS) $$$
CARD TYPE DESCRIPTION OF CONSTANT VALUE
ENDATA07
$$$ DATA TYPE 8 (REACH IDENTIFICATION DATA) $$$BEGIN END ELEM REACH ELEMS BEGIN END
CARD TYPE REACH ID NAME REACH REACH LENGTH LENGTH PER RCH ELEM ELEMkm km km km NUM NUM
REACH ID 1 CL UPPER CALCASIEU RIVER REACH 1 19.30 TO 18.30 0.1000 1.00 10 1 10REACH ID 2 CL UPPER CALCASIEU RIVER REACH 2 18.30 TO 16.20 0.1000 2.10 21 11 31REACH ID 3 CL UPPER CALCASIEU RIVER REACH 3 16.20 TO 14.10 0.1000 2.10 21 32 52REACH ID 4 CL UPPER CALCASIEU RIVER REACH 4 14.10 TO 12.00 0.1000 2.10 21 53 73REACH ID 5 CL UPPER CALCASIEU RIVER REACH 5 12.00 TO 9.90 0.1000 2.10 21 74 94REACH ID 6 CL UPPER CALCASIEU RIVER REACH 6 9.90 TO 7.80 0.1000 2.10 21 95 115REACH ID 7 CL UPPER CALCASIEU RIVER REACH 7 7.80 TO 5.70 0.1000 2.10 21 116 136REACH ID 8 CL UPPER CALCASIEU RIVER REACH 8 5.70 TO 3.60 0.1000 2.10 21 137 157REACH ID 9 CL UPPER CALCASIEU RIVER REACH 9 3.60 TO 2.40 0.1000 1.20 12 158 169REACH ID 10 CL UPPER CALCASIEU RIVER REACH 10 2.40 TO 1.20 0.1000 1.20 12 170 181REACH ID 11 CL UPPER CALCASIEU RIVER REACH 11 1.20 TO 0.00 0.1000 1.20 12 182 193ENDATA08
$$$ DATA TYPE 9 (ADVECTIVE HYDRAULIC COEFFICIENTS) $$$
CARD TYPE REACH ID WIDTH WIDTH WIDTH DEPTH DEPTH DEPTH SLOPE MANNINGS"A" "B" "C" "D" "E" "F" "N"
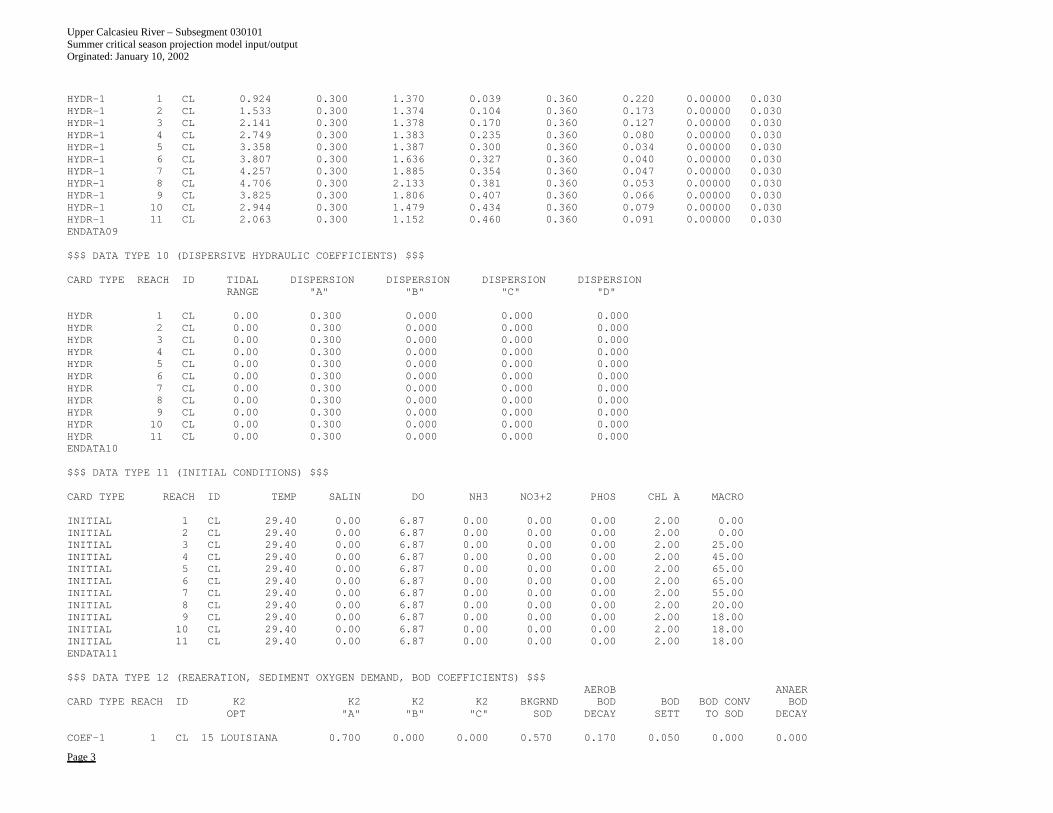
Upper Calcasieu River – Subsegment 030101 Summer critical season projection model input/output Orginated: January 10, 2002
Page 3
HYDR-1 1 CL 0.924 0.300 1.370 0.039 0.360 0.220 0.00000 0.030HYDR-1 2 CL 1.533 0.300 1.374 0.104 0.360 0.173 0.00000 0.030HYDR-1 3 CL 2.141 0.300 1.378 0.170 0.360 0.127 0.00000 0.030HYDR-1 4 CL 2.749 0.300 1.383 0.235 0.360 0.080 0.00000 0.030HYDR-1 5 CL 3.358 0.300 1.387 0.300 0.360 0.034 0.00000 0.030HYDR-1 6 CL 3.807 0.300 1.636 0.327 0.360 0.040 0.00000 0.030HYDR-1 7 CL 4.257 0.300 1.885 0.354 0.360 0.047 0.00000 0.030HYDR-1 8 CL 4.706 0.300 2.133 0.381 0.360 0.053 0.00000 0.030HYDR-1 9 CL 3.825 0.300 1.806 0.407 0.360 0.066 0.00000 0.030HYDR-1 10 CL 2.944 0.300 1.479 0.434 0.360 0.079 0.00000 0.030HYDR-1 11 CL 2.063 0.300 1.152 0.460 0.360 0.091 0.00000 0.030ENDATA09
$$$ DATA TYPE 10 (DISPERSIVE HYDRAULIC COEFFICIENTS) $$$
CARD TYPE REACH ID TIDAL DISPERSION DISPERSION DISPERSION DISPERSIONRANGE "A" "B" "C" "D"
HYDR 1 CL 0.00 0.300 0.000 0.000 0.000HYDR 2 CL 0.00 0.300 0.000 0.000 0.000HYDR 3 CL 0.00 0.300 0.000 0.000 0.000HYDR 4 CL 0.00 0.300 0.000 0.000 0.000HYDR 5 CL 0.00 0.300 0.000 0.000 0.000HYDR 6 CL 0.00 0.300 0.000 0.000 0.000HYDR 7 CL 0.00 0.300 0.000 0.000 0.000HYDR 8 CL 0.00 0.300 0.000 0.000 0.000HYDR 9 CL 0.00 0.300 0.000 0.000 0.000HYDR 10 CL 0.00 0.300 0.000 0.000 0.000HYDR 11 CL 0.00 0.300 0.000 0.000 0.000ENDATA10
$$$ DATA TYPE 11 (INITIAL CONDITIONS) $$$
CARD TYPE REACH ID TEMP SALIN DO NH3 NO3+2 PHOS CHL A MACRO
INITIAL 1 CL 29.40 0.00 6.87 0.00 0.00 0.00 2.00 0.00INITIAL 2 CL 29.40 0.00 6.87 0.00 0.00 0.00 2.00 0.00INITIAL 3 CL 29.40 0.00 6.87 0.00 0.00 0.00 2.00 25.00INITIAL 4 CL 29.40 0.00 6.87 0.00 0.00 0.00 2.00 45.00INITIAL 5 CL 29.40 0.00 6.87 0.00 0.00 0.00 2.00 65.00INITIAL 6 CL 29.40 0.00 6.87 0.00 0.00 0.00 2.00 65.00INITIAL 7 CL 29.40 0.00 6.87 0.00 0.00 0.00 2.00 55.00INITIAL 8 CL 29.40 0.00 6.87 0.00 0.00 0.00 2.00 20.00INITIAL 9 CL 29.40 0.00 6.87 0.00 0.00 0.00 2.00 18.00INITIAL 10 CL 29.40 0.00 6.87 0.00 0.00 0.00 2.00 18.00INITIAL 11 CL 29.40 0.00 6.87 0.00 0.00 0.00 2.00 18.00ENDATA11
$$$ DATA TYPE 12 (REAERATION, SEDIMENT OXYGEN DEMAND, BOD COEFFICIENTS) $$$AEROB ANAER
CARD TYPE REACH ID K2 K2 K2 K2 BKGRND BOD BOD BOD CONV BODOPT "A" "B" "C" SOD DECAY SETT TO SOD DECAY
COEF-1 1 CL 15 LOUISIANA 0.700 0.000 0.000 0.570 0.170 0.050 0.000 0.000
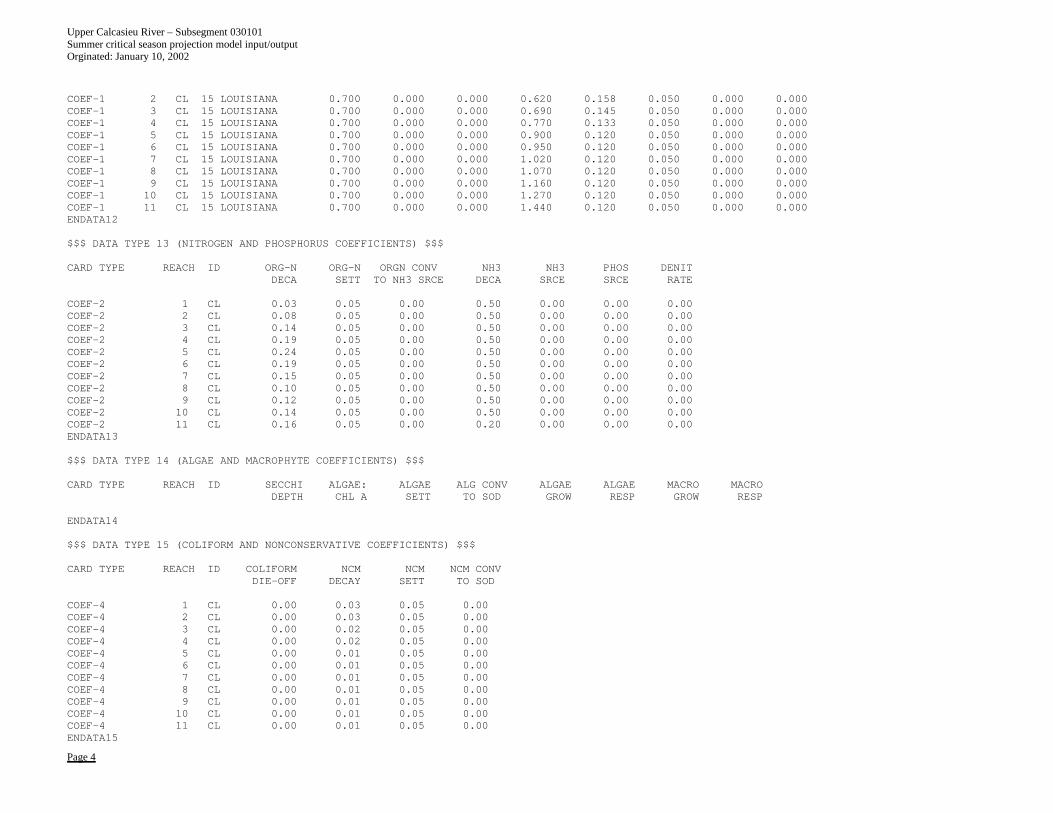
Upper Calcasieu River – Subsegment 030101 Summer critical season projection model input/output Orginated: January 10, 2002
Page 4
COEF-1 2 CL 15 LOUISIANA 0.700 0.000 0.000 0.620 0.158 0.050 0.000 0.000COEF-1 3 CL 15 LOUISIANA 0.700 0.000 0.000 0.690 0.145 0.050 0.000 0.000COEF-1 4 CL 15 LOUISIANA 0.700 0.000 0.000 0.770 0.133 0.050 0.000 0.000COEF-1 5 CL 15 LOUISIANA 0.700 0.000 0.000 0.900 0.120 0.050 0.000 0.000COEF-1 6 CL 15 LOUISIANA 0.700 0.000 0.000 0.950 0.120 0.050 0.000 0.000COEF-1 7 CL 15 LOUISIANA 0.700 0.000 0.000 1.020 0.120 0.050 0.000 0.000COEF-1 8 CL 15 LOUISIANA 0.700 0.000 0.000 1.070 0.120 0.050 0.000 0.000COEF-1 9 CL 15 LOUISIANA 0.700 0.000 0.000 1.160 0.120 0.050 0.000 0.000COEF-1 10 CL 15 LOUISIANA 0.700 0.000 0.000 1.270 0.120 0.050 0.000 0.000COEF-1 11 CL 15 LOUISIANA 0.700 0.000 0.000 1.440 0.120 0.050 0.000 0.000ENDATA12
$$$ DATA TYPE 13 (NITROGEN AND PHOSPHORUS COEFFICIENTS) $$$
CARD TYPE REACH ID ORG-N ORG-N ORGN CONV NH3 NH3 PHOS DENITDECA SETT TO NH3 SRCE DECA SRCE SRCE RATE
COEF-2 1 CL 0.03 0.05 0.00 0.50 0.00 0.00 0.00COEF-2 2 CL 0.08 0.05 0.00 0.50 0.00 0.00 0.00COEF-2 3 CL 0.14 0.05 0.00 0.50 0.00 0.00 0.00COEF-2 4 CL 0.19 0.05 0.00 0.50 0.00 0.00 0.00COEF-2 5 CL 0.24 0.05 0.00 0.50 0.00 0.00 0.00COEF-2 6 CL 0.19 0.05 0.00 0.50 0.00 0.00 0.00COEF-2 7 CL 0.15 0.05 0.00 0.50 0.00 0.00 0.00COEF-2 8 CL 0.10 0.05 0.00 0.50 0.00 0.00 0.00COEF-2 9 CL 0.12 0.05 0.00 0.50 0.00 0.00 0.00COEF-2 10 CL 0.14 0.05 0.00 0.50 0.00 0.00 0.00COEF-2 11 CL 0.16 0.05 0.00 0.20 0.00 0.00 0.00ENDATA13
$$$ DATA TYPE 14 (ALGAE AND MACROPHYTE COEFFICIENTS) $$$
CARD TYPE REACH ID SECCHI ALGAE: ALGAE ALG CONV ALGAE ALGAE MACRO MACRODEPTH CHL A SETT TO SOD GROW RESP GROW RESP
ENDATA14
$$$ DATA TYPE 15 (COLIFORM AND NONCONSERVATIVE COEFFICIENTS) $$$
CARD TYPE REACH ID COLIFORM NCM NCM NCM CONVDIE-OFF DECAY SETT TO SOD
COEF-4 1 CL 0.00 0.03 0.05 0.00COEF-4 2 CL 0.00 0.03 0.05 0.00COEF-4 3 CL 0.00 0.02 0.05 0.00COEF-4 4 CL 0.00 0.02 0.05 0.00COEF-4 5 CL 0.00 0.01 0.05 0.00COEF-4 6 CL 0.00 0.01 0.05 0.00COEF-4 7 CL 0.00 0.01 0.05 0.00COEF-4 8 CL 0.00 0.01 0.05 0.00COEF-4 9 CL 0.00 0.01 0.05 0.00COEF-4 10 CL 0.00 0.01 0.05 0.00COEF-4 11 CL 0.00 0.01 0.05 0.00ENDATA15
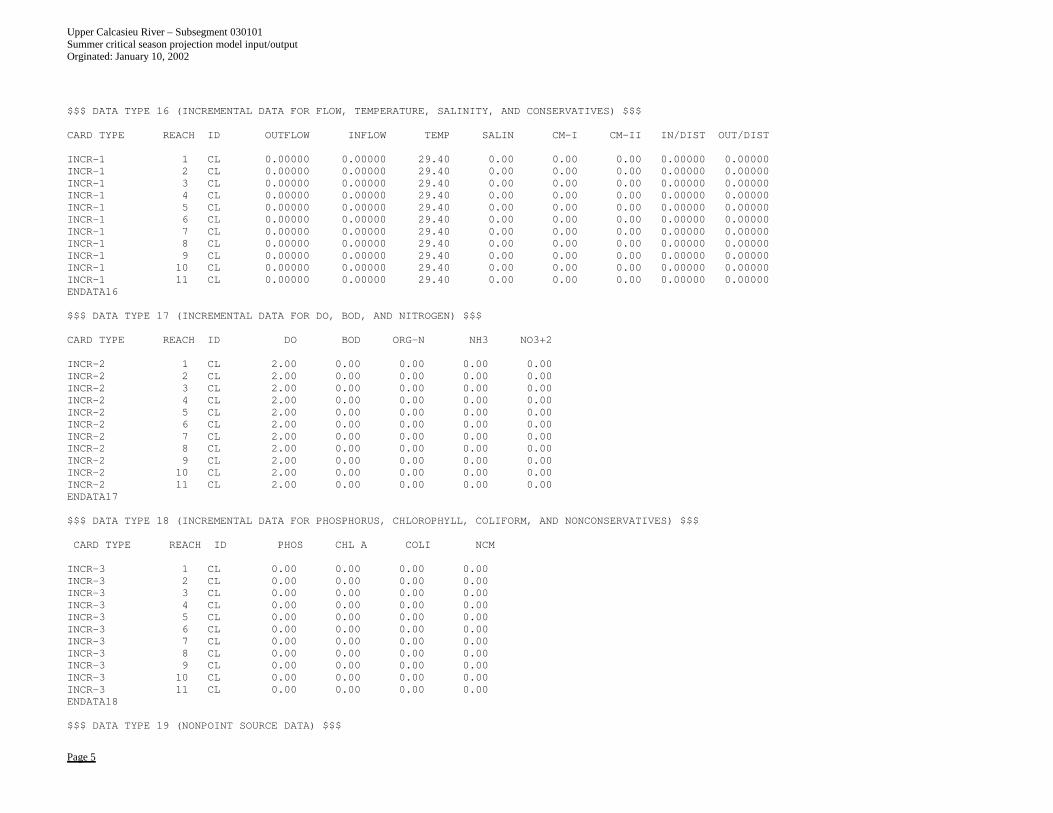
Upper Calcasieu River – Subsegment 030101 Summer critical season projection model input/output Orginated: January 10, 2002
Page 5
$$$ DATA TYPE 16 (INCREMENTAL DATA FOR FLOW, TEMPERATURE, SALINITY, AND CONSERVATIVES) $$$
CARD TYPE REACH ID OUTFLOW INFLOW TEMP SALIN CM-I CM-II IN/DIST OUT/DIST
INCR-1 1 CL 0.00000 0.00000 29.40 0.00 0.00 0.00 0.00000 0.00000INCR-1 2 CL 0.00000 0.00000 29.40 0.00 0.00 0.00 0.00000 0.00000INCR-1 3 CL 0.00000 0.00000 29.40 0.00 0.00 0.00 0.00000 0.00000INCR-1 4 CL 0.00000 0.00000 29.40 0.00 0.00 0.00 0.00000 0.00000INCR-1 5 CL 0.00000 0.00000 29.40 0.00 0.00 0.00 0.00000 0.00000INCR-1 6 CL 0.00000 0.00000 29.40 0.00 0.00 0.00 0.00000 0.00000INCR-1 7 CL 0.00000 0.00000 29.40 0.00 0.00 0.00 0.00000 0.00000INCR-1 8 CL 0.00000 0.00000 29.40 0.00 0.00 0.00 0.00000 0.00000INCR-1 9 CL 0.00000 0.00000 29.40 0.00 0.00 0.00 0.00000 0.00000INCR-1 10 CL 0.00000 0.00000 29.40 0.00 0.00 0.00 0.00000 0.00000INCR-1 11 CL 0.00000 0.00000 29.40 0.00 0.00 0.00 0.00000 0.00000ENDATA16
$$$ DATA TYPE 17 (INCREMENTAL DATA FOR DO, BOD, AND NITROGEN) $$$
CARD TYPE REACH ID DO BOD ORG-N NH3 NO3+2
INCR-2 1 CL 2.00 0.00 0.00 0.00 0.00INCR-2 2 CL 2.00 0.00 0.00 0.00 0.00INCR-2 3 CL 2.00 0.00 0.00 0.00 0.00INCR-2 4 CL 2.00 0.00 0.00 0.00 0.00INCR-2 5 CL 2.00 0.00 0.00 0.00 0.00INCR-2 6 CL 2.00 0.00 0.00 0.00 0.00INCR-2 7 CL 2.00 0.00 0.00 0.00 0.00INCR-2 8 CL 2.00 0.00 0.00 0.00 0.00INCR-2 9 CL 2.00 0.00 0.00 0.00 0.00INCR-2 10 CL 2.00 0.00 0.00 0.00 0.00INCR-2 11 CL 2.00 0.00 0.00 0.00 0.00ENDATA17
$$$ DATA TYPE 18 (INCREMENTAL DATA FOR PHOSPHORUS, CHLOROPHYLL, COLIFORM, AND NONCONSERVATIVES) $$$
CARD TYPE REACH ID PHOS CHL A COLI NCM
INCR-3 1 CL 0.00 0.00 0.00 0.00INCR-3 2 CL 0.00 0.00 0.00 0.00INCR-3 3 CL 0.00 0.00 0.00 0.00INCR-3 4 CL 0.00 0.00 0.00 0.00INCR-3 5 CL 0.00 0.00 0.00 0.00INCR-3 6 CL 0.00 0.00 0.00 0.00INCR-3 7 CL 0.00 0.00 0.00 0.00INCR-3 8 CL 0.00 0.00 0.00 0.00INCR-3 9 CL 0.00 0.00 0.00 0.00INCR-3 10 CL 0.00 0.00 0.00 0.00INCR-3 11 CL 0.00 0.00 0.00 0.00ENDATA18
$$$ DATA TYPE 19 (NONPOINT SOURCE DATA) $$$
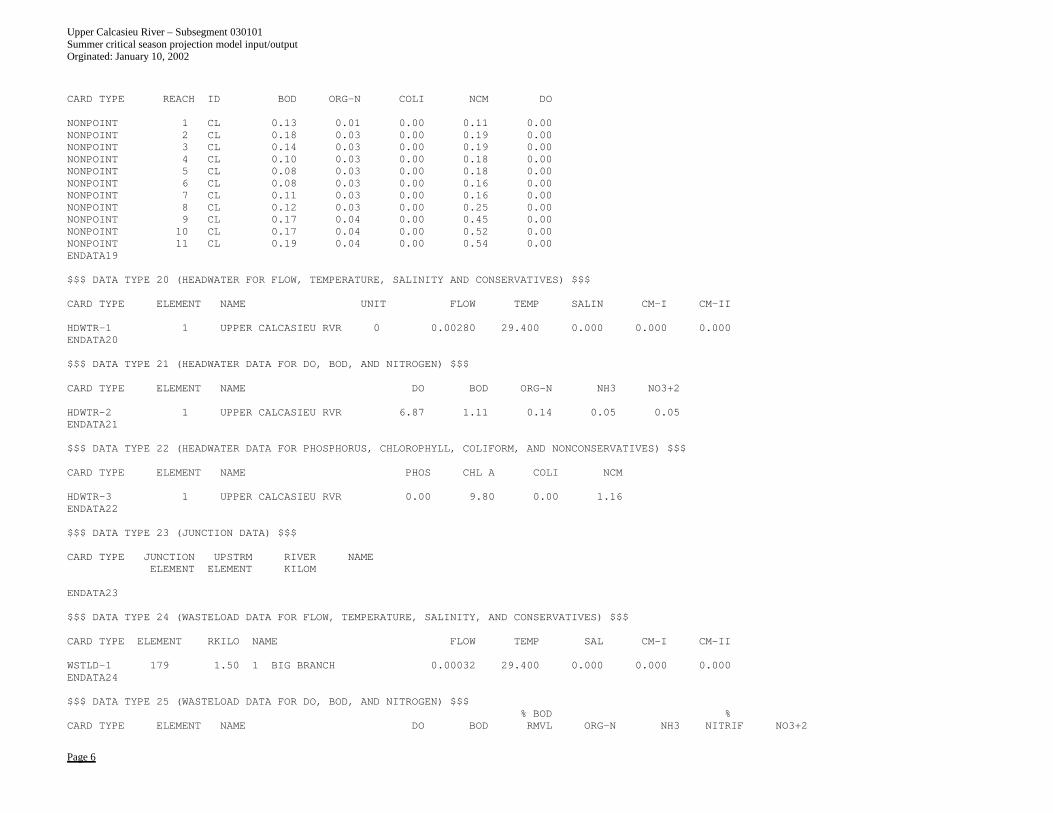
Upper Calcasieu River – Subsegment 030101 Summer critical season projection model input/output Orginated: January 10, 2002
Page 6
CARD TYPE REACH ID BOD ORG-N COLI NCM DO
NONPOINT 1 CL 0.13 0.01 0.00 0.11 0.00NONPOINT 2 CL 0.18 0.03 0.00 0.19 0.00NONPOINT 3 CL 0.14 0.03 0.00 0.19 0.00NONPOINT 4 CL 0.10 0.03 0.00 0.18 0.00NONPOINT 5 CL 0.08 0.03 0.00 0.18 0.00NONPOINT 6 CL 0.08 0.03 0.00 0.16 0.00NONPOINT 7 CL 0.11 0.03 0.00 0.16 0.00NONPOINT 8 CL 0.12 0.03 0.00 0.25 0.00NONPOINT 9 CL 0.17 0.04 0.00 0.45 0.00NONPOINT 10 CL 0.17 0.04 0.00 0.52 0.00NONPOINT 11 CL 0.19 0.04 0.00 0.54 0.00ENDATA19
$$$ DATA TYPE 20 (HEADWATER FOR FLOW, TEMPERATURE, SALINITY AND CONSERVATIVES) $$$
CARD TYPE ELEMENT NAME UNIT FLOW TEMP SALIN CM-I CM-II
HDWTR-1 1 UPPER CALCASIEU RVR 0 0.00280 29.400 0.000 0.000 0.000ENDATA20
$$$ DATA TYPE 21 (HEADWATER DATA FOR DO, BOD, AND NITROGEN) $$$
CARD TYPE ELEMENT NAME DO BOD ORG-N NH3 NO3+2
HDWTR-2 1 UPPER CALCASIEU RVR 6.87 1.11 0.14 0.05 0.05ENDATA21
$$$ DATA TYPE 22 (HEADWATER DATA FOR PHOSPHORUS, CHLOROPHYLL, COLIFORM, AND NONCONSERVATIVES) $$$
CARD TYPE ELEMENT NAME PHOS CHL A COLI NCM
HDWTR-3 1 UPPER CALCASIEU RVR 0.00 9.80 0.00 1.16ENDATA22
$$$ DATA TYPE 23 (JUNCTION DATA) $$$
CARD TYPE JUNCTION UPSTRM RIVER NAMEELEMENT ELEMENT KILOM
ENDATA23
$$$ DATA TYPE 24 (WASTELOAD DATA FOR FLOW, TEMPERATURE, SALINITY, AND CONSERVATIVES) $$$
CARD TYPE ELEMENT RKILO NAME FLOW TEMP SAL CM-I CM-II
WSTLD-1 179 1.50 1 BIG BRANCH 0.00032 29.400 0.000 0.000 0.000ENDATA24
$$$ DATA TYPE 25 (WASTELOAD DATA FOR DO, BOD, AND NITROGEN) $$$% BOD %
CARD TYPE ELEMENT NAME DO BOD RMVL ORG-N NH3 NITRIF NO3+2
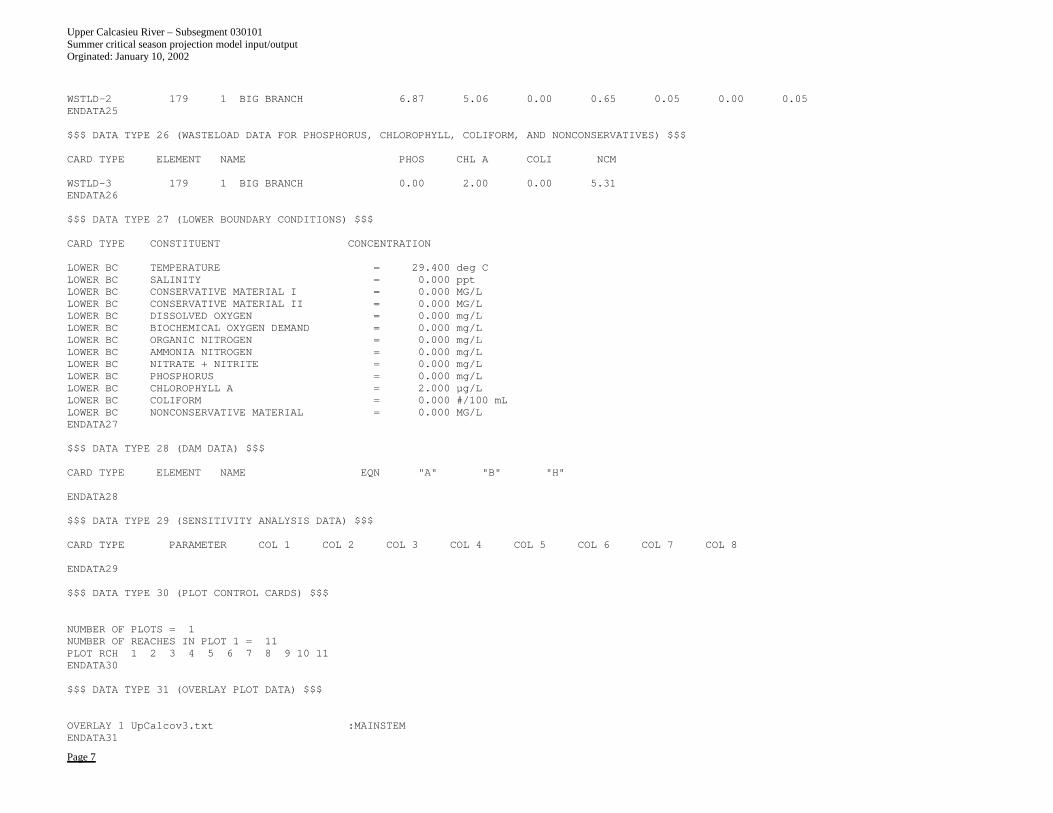
Upper Calcasieu River – Subsegment 030101 Summer critical season projection model input/output Orginated: January 10, 2002
Page 7
WSTLD-2 179 1 BIG BRANCH 6.87 5.06 0.00 0.65 0.05 0.00 0.05ENDATA25
$$$ DATA TYPE 26 (WASTELOAD DATA FOR PHOSPHORUS, CHLOROPHYLL, COLIFORM, AND NONCONSERVATIVES) $$$
CARD TYPE ELEMENT NAME PHOS CHL A COLI NCM
WSTLD-3 179 1 BIG BRANCH 0.00 2.00 0.00 5.31ENDATA26
$$$ DATA TYPE 27 (LOWER BOUNDARY CONDITIONS) $$$
CARD TYPE CONSTITUENT CONCENTRATION
LOWER BC TEMPERATURE = 29.400 deg CLOWER BC SALINITY = 0.000 pptLOWER BC CONSERVATIVE MATERIAL I = 0.000 MG/LLOWER BC CONSERVATIVE MATERIAL II = 0.000 MG/LLOWER BC DISSOLVED OXYGEN = 0.000 mg/LLOWER BC BIOCHEMICAL OXYGEN DEMAND = 0.000 mg/LLOWER BC ORGANIC NITROGEN = 0.000 mg/LLOWER BC AMMONIA NITROGEN = 0.000 mg/LLOWER BC NITRATE + NITRITE = 0.000 mg/LLOWER BC PHOSPHORUS = 0.000 mg/LLOWER BC CHLOROPHYLL A = 2.000 µg/LLOWER BC COLIFORM = 0.000 #/100 mLLOWER BC NONCONSERVATIVE MATERIAL = 0.000 MG/LENDATA27
$$$ DATA TYPE 28 (DAM DATA) $$$
CARD TYPE ELEMENT NAME EQN "A" "B" "H"
ENDATA28
$$$ DATA TYPE 29 (SENSITIVITY ANALYSIS DATA) $$$
CARD TYPE PARAMETER COL 1 COL 2 COL 3 COL 4 COL 5 COL 6 COL 7 COL 8
ENDATA29
$$$ DATA TYPE 30 (PLOT CONTROL CARDS) $$$
NUMBER OF PLOTS = 1NUMBER OF REACHES IN PLOT 1 = 11PLOT RCH 1 2 3 4 5 6 7 8 9 10 11ENDATA30
$$$ DATA TYPE 31 (OVERLAY PLOT DATA) $$$
OVERLAY 1 UpCalcov3.txt :MAINSTEMENDATA31
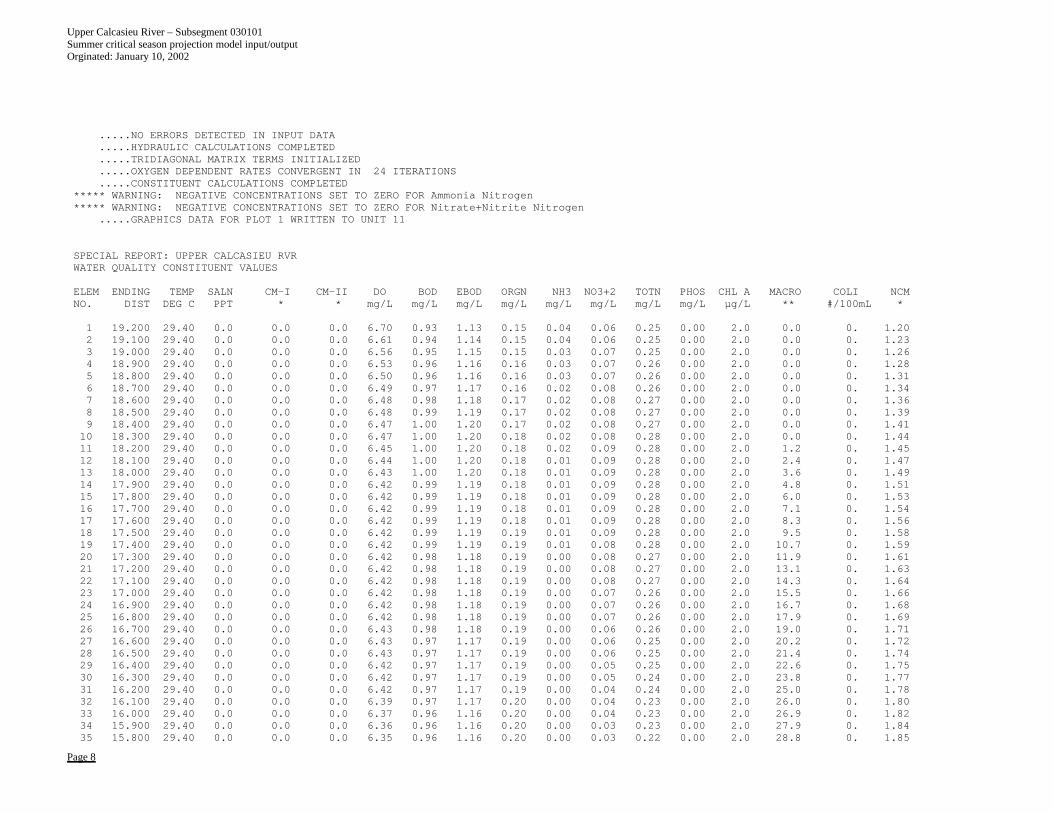
Upper Calcasieu River – Subsegment 030101 Summer critical season projection model input/output Orginated: January 10, 2002
Page 8
.....NO ERRORS DETECTED IN INPUT DATA
.....HYDRAULIC CALCULATIONS COMPLETED
.....TRIDIAGONAL MATRIX TERMS INITIALIZED
.....OXYGEN DEPENDENT RATES CONVERGENT IN 24 ITERATIONS
.....CONSTITUENT CALCULATIONS COMPLETED***** WARNING: NEGATIVE CONCENTRATIONS SET TO ZERO FOR Ammonia Nitrogen***** WARNING: NEGATIVE CONCENTRATIONS SET TO ZERO FOR Nitrate+Nitrite Nitrogen
.....GRAPHICS DATA FOR PLOT 1 WRITTEN TO UNIT 11
SPECIAL REPORT: UPPER CALCASIEU RVRWATER QUALITY CONSTITUENT VALUES
ELEM ENDING TEMP SALN CM-I CM-II DO BOD EBOD ORGN NH3 NO3+2 TOTN PHOS CHL A MACRO COLI NCMNO. DIST DEG C PPT * * mg/L mg/L mg/L mg/L mg/L mg/L mg/L mg/L µg/L ** #/100mL *
1 19.200 29.40 0.0 0.0 0.0 6.70 0.93 1.13 0.15 0.04 0.06 0.25 0.00 2.0 0.0 0. 1.202 19.100 29.40 0.0 0.0 0.0 6.61 0.94 1.14 0.15 0.04 0.06 0.25 0.00 2.0 0.0 0. 1.233 19.000 29.40 0.0 0.0 0.0 6.56 0.95 1.15 0.15 0.03 0.07 0.25 0.00 2.0 0.0 0. 1.264 18.900 29.40 0.0 0.0 0.0 6.53 0.96 1.16 0.16 0.03 0.07 0.26 0.00 2.0 0.0 0. 1.285 18.800 29.40 0.0 0.0 0.0 6.50 0.96 1.16 0.16 0.03 0.07 0.26 0.00 2.0 0.0 0. 1.316 18.700 29.40 0.0 0.0 0.0 6.49 0.97 1.17 0.16 0.02 0.08 0.26 0.00 2.0 0.0 0. 1.347 18.600 29.40 0.0 0.0 0.0 6.48 0.98 1.18 0.17 0.02 0.08 0.27 0.00 2.0 0.0 0. 1.368 18.500 29.40 0.0 0.0 0.0 6.48 0.99 1.19 0.17 0.02 0.08 0.27 0.00 2.0 0.0 0. 1.399 18.400 29.40 0.0 0.0 0.0 6.47 1.00 1.20 0.17 0.02 0.08 0.27 0.00 2.0 0.0 0. 1.4110 18.300 29.40 0.0 0.0 0.0 6.47 1.00 1.20 0.18 0.02 0.08 0.28 0.00 2.0 0.0 0. 1.4411 18.200 29.40 0.0 0.0 0.0 6.45 1.00 1.20 0.18 0.02 0.09 0.28 0.00 2.0 1.2 0. 1.4512 18.100 29.40 0.0 0.0 0.0 6.44 1.00 1.20 0.18 0.01 0.09 0.28 0.00 2.0 2.4 0. 1.4713 18.000 29.40 0.0 0.0 0.0 6.43 1.00 1.20 0.18 0.01 0.09 0.28 0.00 2.0 3.6 0. 1.4914 17.900 29.40 0.0 0.0 0.0 6.42 0.99 1.19 0.18 0.01 0.09 0.28 0.00 2.0 4.8 0. 1.5115 17.800 29.40 0.0 0.0 0.0 6.42 0.99 1.19 0.18 0.01 0.09 0.28 0.00 2.0 6.0 0. 1.5316 17.700 29.40 0.0 0.0 0.0 6.42 0.99 1.19 0.18 0.01 0.09 0.28 0.00 2.0 7.1 0. 1.5417 17.600 29.40 0.0 0.0 0.0 6.42 0.99 1.19 0.18 0.01 0.09 0.28 0.00 2.0 8.3 0. 1.5618 17.500 29.40 0.0 0.0 0.0 6.42 0.99 1.19 0.19 0.01 0.09 0.28 0.00 2.0 9.5 0. 1.5819 17.400 29.40 0.0 0.0 0.0 6.42 0.99 1.19 0.19 0.01 0.08 0.28 0.00 2.0 10.7 0. 1.5920 17.300 29.40 0.0 0.0 0.0 6.42 0.98 1.18 0.19 0.00 0.08 0.27 0.00 2.0 11.9 0. 1.6121 17.200 29.40 0.0 0.0 0.0 6.42 0.98 1.18 0.19 0.00 0.08 0.27 0.00 2.0 13.1 0. 1.6322 17.100 29.40 0.0 0.0 0.0 6.42 0.98 1.18 0.19 0.00 0.08 0.27 0.00 2.0 14.3 0. 1.6423 17.000 29.40 0.0 0.0 0.0 6.42 0.98 1.18 0.19 0.00 0.07 0.26 0.00 2.0 15.5 0. 1.6624 16.900 29.40 0.0 0.0 0.0 6.42 0.98 1.18 0.19 0.00 0.07 0.26 0.00 2.0 16.7 0. 1.6825 16.800 29.40 0.0 0.0 0.0 6.42 0.98 1.18 0.19 0.00 0.07 0.26 0.00 2.0 17.9 0. 1.6926 16.700 29.40 0.0 0.0 0.0 6.43 0.98 1.18 0.19 0.00 0.06 0.26 0.00 2.0 19.0 0. 1.7127 16.600 29.40 0.0 0.0 0.0 6.43 0.97 1.17 0.19 0.00 0.06 0.25 0.00 2.0 20.2 0. 1.7228 16.500 29.40 0.0 0.0 0.0 6.43 0.97 1.17 0.19 0.00 0.06 0.25 0.00 2.0 21.4 0. 1.7429 16.400 29.40 0.0 0.0 0.0 6.42 0.97 1.17 0.19 0.00 0.05 0.25 0.00 2.0 22.6 0. 1.7530 16.300 29.40 0.0 0.0 0.0 6.42 0.97 1.17 0.19 0.00 0.05 0.24 0.00 2.0 23.8 0. 1.7731 16.200 29.40 0.0 0.0 0.0 6.42 0.97 1.17 0.19 0.00 0.04 0.24 0.00 2.0 25.0 0. 1.7832 16.100 29.40 0.0 0.0 0.0 6.39 0.97 1.17 0.20 0.00 0.04 0.23 0.00 2.0 26.0 0. 1.8033 16.000 29.40 0.0 0.0 0.0 6.37 0.96 1.16 0.20 0.00 0.04 0.23 0.00 2.0 26.9 0. 1.8234 15.900 29.40 0.0 0.0 0.0 6.36 0.96 1.16 0.20 0.00 0.03 0.23 0.00 2.0 27.9 0. 1.8435 15.800 29.40 0.0 0.0 0.0 6.35 0.96 1.16 0.20 0.00 0.03 0.22 0.00 2.0 28.8 0. 1.85
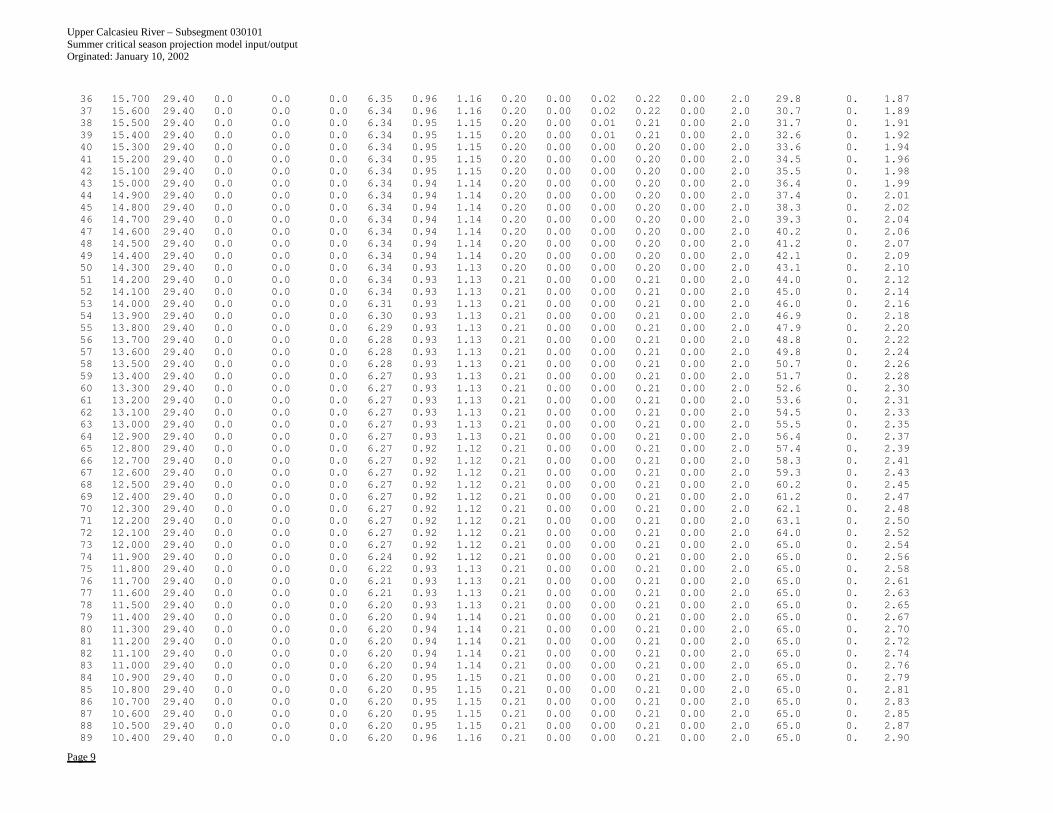
Upper Calcasieu River – Subsegment 030101 Summer critical season projection model input/output Orginated: January 10, 2002
Page 9
36 15.700 29.40 0.0 0.0 0.0 6.35 0.96 1.16 0.20 0.00 0.02 0.22 0.00 2.0 29.8 0. 1.8737 15.600 29.40 0.0 0.0 0.0 6.34 0.96 1.16 0.20 0.00 0.02 0.22 0.00 2.0 30.7 0. 1.8938 15.500 29.40 0.0 0.0 0.0 6.34 0.95 1.15 0.20 0.00 0.01 0.21 0.00 2.0 31.7 0. 1.9139 15.400 29.40 0.0 0.0 0.0 6.34 0.95 1.15 0.20 0.00 0.01 0.21 0.00 2.0 32.6 0. 1.9240 15.300 29.40 0.0 0.0 0.0 6.34 0.95 1.15 0.20 0.00 0.00 0.20 0.00 2.0 33.6 0. 1.9441 15.200 29.40 0.0 0.0 0.0 6.34 0.95 1.15 0.20 0.00 0.00 0.20 0.00 2.0 34.5 0. 1.9642 15.100 29.40 0.0 0.0 0.0 6.34 0.95 1.15 0.20 0.00 0.00 0.20 0.00 2.0 35.5 0. 1.9843 15.000 29.40 0.0 0.0 0.0 6.34 0.94 1.14 0.20 0.00 0.00 0.20 0.00 2.0 36.4 0. 1.9944 14.900 29.40 0.0 0.0 0.0 6.34 0.94 1.14 0.20 0.00 0.00 0.20 0.00 2.0 37.4 0. 2.0145 14.800 29.40 0.0 0.0 0.0 6.34 0.94 1.14 0.20 0.00 0.00 0.20 0.00 2.0 38.3 0. 2.0246 14.700 29.40 0.0 0.0 0.0 6.34 0.94 1.14 0.20 0.00 0.00 0.20 0.00 2.0 39.3 0. 2.0447 14.600 29.40 0.0 0.0 0.0 6.34 0.94 1.14 0.20 0.00 0.00 0.20 0.00 2.0 40.2 0. 2.0648 14.500 29.40 0.0 0.0 0.0 6.34 0.94 1.14 0.20 0.00 0.00 0.20 0.00 2.0 41.2 0. 2.0749 14.400 29.40 0.0 0.0 0.0 6.34 0.94 1.14 0.20 0.00 0.00 0.20 0.00 2.0 42.1 0. 2.0950 14.300 29.40 0.0 0.0 0.0 6.34 0.93 1.13 0.20 0.00 0.00 0.20 0.00 2.0 43.1 0. 2.1051 14.200 29.40 0.0 0.0 0.0 6.34 0.93 1.13 0.21 0.00 0.00 0.21 0.00 2.0 44.0 0. 2.1252 14.100 29.40 0.0 0.0 0.0 6.34 0.93 1.13 0.21 0.00 0.00 0.21 0.00 2.0 45.0 0. 2.1453 14.000 29.40 0.0 0.0 0.0 6.31 0.93 1.13 0.21 0.00 0.00 0.21 0.00 2.0 46.0 0. 2.1654 13.900 29.40 0.0 0.0 0.0 6.30 0.93 1.13 0.21 0.00 0.00 0.21 0.00 2.0 46.9 0. 2.1855 13.800 29.40 0.0 0.0 0.0 6.29 0.93 1.13 0.21 0.00 0.00 0.21 0.00 2.0 47.9 0. 2.2056 13.700 29.40 0.0 0.0 0.0 6.28 0.93 1.13 0.21 0.00 0.00 0.21 0.00 2.0 48.8 0. 2.2257 13.600 29.40 0.0 0.0 0.0 6.28 0.93 1.13 0.21 0.00 0.00 0.21 0.00 2.0 49.8 0. 2.2458 13.500 29.40 0.0 0.0 0.0 6.28 0.93 1.13 0.21 0.00 0.00 0.21 0.00 2.0 50.7 0. 2.2659 13.400 29.40 0.0 0.0 0.0 6.27 0.93 1.13 0.21 0.00 0.00 0.21 0.00 2.0 51.7 0. 2.2860 13.300 29.40 0.0 0.0 0.0 6.27 0.93 1.13 0.21 0.00 0.00 0.21 0.00 2.0 52.6 0. 2.3061 13.200 29.40 0.0 0.0 0.0 6.27 0.93 1.13 0.21 0.00 0.00 0.21 0.00 2.0 53.6 0. 2.3162 13.100 29.40 0.0 0.0 0.0 6.27 0.93 1.13 0.21 0.00 0.00 0.21 0.00 2.0 54.5 0. 2.3363 13.000 29.40 0.0 0.0 0.0 6.27 0.93 1.13 0.21 0.00 0.00 0.21 0.00 2.0 55.5 0. 2.3564 12.900 29.40 0.0 0.0 0.0 6.27 0.93 1.13 0.21 0.00 0.00 0.21 0.00 2.0 56.4 0. 2.3765 12.800 29.40 0.0 0.0 0.0 6.27 0.92 1.12 0.21 0.00 0.00 0.21 0.00 2.0 57.4 0. 2.3966 12.700 29.40 0.0 0.0 0.0 6.27 0.92 1.12 0.21 0.00 0.00 0.21 0.00 2.0 58.3 0. 2.4167 12.600 29.40 0.0 0.0 0.0 6.27 0.92 1.12 0.21 0.00 0.00 0.21 0.00 2.0 59.3 0. 2.4368 12.500 29.40 0.0 0.0 0.0 6.27 0.92 1.12 0.21 0.00 0.00 0.21 0.00 2.0 60.2 0. 2.4569 12.400 29.40 0.0 0.0 0.0 6.27 0.92 1.12 0.21 0.00 0.00 0.21 0.00 2.0 61.2 0. 2.4770 12.300 29.40 0.0 0.0 0.0 6.27 0.92 1.12 0.21 0.00 0.00 0.21 0.00 2.0 62.1 0. 2.4871 12.200 29.40 0.0 0.0 0.0 6.27 0.92 1.12 0.21 0.00 0.00 0.21 0.00 2.0 63.1 0. 2.5072 12.100 29.40 0.0 0.0 0.0 6.27 0.92 1.12 0.21 0.00 0.00 0.21 0.00 2.0 64.0 0. 2.5273 12.000 29.40 0.0 0.0 0.0 6.27 0.92 1.12 0.21 0.00 0.00 0.21 0.00 2.0 65.0 0. 2.5474 11.900 29.40 0.0 0.0 0.0 6.24 0.92 1.12 0.21 0.00 0.00 0.21 0.00 2.0 65.0 0. 2.5675 11.800 29.40 0.0 0.0 0.0 6.22 0.93 1.13 0.21 0.00 0.00 0.21 0.00 2.0 65.0 0. 2.5876 11.700 29.40 0.0 0.0 0.0 6.21 0.93 1.13 0.21 0.00 0.00 0.21 0.00 2.0 65.0 0. 2.6177 11.600 29.40 0.0 0.0 0.0 6.21 0.93 1.13 0.21 0.00 0.00 0.21 0.00 2.0 65.0 0. 2.6378 11.500 29.40 0.0 0.0 0.0 6.20 0.93 1.13 0.21 0.00 0.00 0.21 0.00 2.0 65.0 0. 2.6579 11.400 29.40 0.0 0.0 0.0 6.20 0.94 1.14 0.21 0.00 0.00 0.21 0.00 2.0 65.0 0. 2.6780 11.300 29.40 0.0 0.0 0.0 6.20 0.94 1.14 0.21 0.00 0.00 0.21 0.00 2.0 65.0 0. 2.7081 11.200 29.40 0.0 0.0 0.0 6.20 0.94 1.14 0.21 0.00 0.00 0.21 0.00 2.0 65.0 0. 2.7282 11.100 29.40 0.0 0.0 0.0 6.20 0.94 1.14 0.21 0.00 0.00 0.21 0.00 2.0 65.0 0. 2.7483 11.000 29.40 0.0 0.0 0.0 6.20 0.94 1.14 0.21 0.00 0.00 0.21 0.00 2.0 65.0 0. 2.7684 10.900 29.40 0.0 0.0 0.0 6.20 0.95 1.15 0.21 0.00 0.00 0.21 0.00 2.0 65.0 0. 2.7985 10.800 29.40 0.0 0.0 0.0 6.20 0.95 1.15 0.21 0.00 0.00 0.21 0.00 2.0 65.0 0. 2.8186 10.700 29.40 0.0 0.0 0.0 6.20 0.95 1.15 0.21 0.00 0.00 0.21 0.00 2.0 65.0 0. 2.8387 10.600 29.40 0.0 0.0 0.0 6.20 0.95 1.15 0.21 0.00 0.00 0.21 0.00 2.0 65.0 0. 2.8588 10.500 29.40 0.0 0.0 0.0 6.20 0.95 1.15 0.21 0.00 0.00 0.21 0.00 2.0 65.0 0. 2.8789 10.400 29.40 0.0 0.0 0.0 6.20 0.96 1.16 0.21 0.00 0.00 0.21 0.00 2.0 65.0 0. 2.90

Upper Calcasieu River – Subsegment 030101 Summer critical season projection model input/output Orginated: January 10, 2002
Page 10
90 10.300 29.40 0.0 0.0 0.0 6.20 0.96 1.16 0.21 0.00 0.00 0.21 0.00 2.0 65.0 0. 2.9291 10.200 29.40 0.0 0.0 0.0 6.20 0.96 1.16 0.21 0.00 0.00 0.21 0.00 2.0 65.0 0. 2.9492 10.100 29.40 0.0 0.0 0.0 6.20 0.96 1.16 0.21 0.00 0.00 0.21 0.00 2.0 65.0 0. 2.9693 10.000 29.40 0.0 0.0 0.0 6.20 0.96 1.16 0.21 0.00 0.00 0.21 0.00 2.0 65.0 0. 2.9894 9.900 29.40 0.0 0.0 0.0 6.19 0.96 1.16 0.21 0.00 0.00 0.21 0.00 2.0 65.0 0. 3.0095 9.800 29.40 0.0 0.0 0.0 6.10 0.96 1.16 0.21 0.00 0.00 0.21 0.00 2.0 64.5 0. 3.0296 9.700 29.40 0.0 0.0 0.0 6.05 0.96 1.16 0.21 0.00 0.00 0.21 0.00 2.0 64.0 0. 3.0397 9.600 29.40 0.0 0.0 0.0 6.03 0.96 1.16 0.21 0.00 0.00 0.21 0.00 2.0 63.6 0. 3.0498 9.500 29.40 0.0 0.0 0.0 6.01 0.95 1.15 0.21 0.00 0.00 0.21 0.00 2.0 63.1 0. 3.0699 9.400 29.40 0.0 0.0 0.0 6.01 0.95 1.15 0.21 0.00 0.00 0.21 0.00 2.0 62.6 0. 3.07100 9.300 29.40 0.0 0.0 0.0 6.00 0.95 1.15 0.20 0.00 0.00 0.20 0.00 2.0 62.1 0. 3.08101 9.200 29.40 0.0 0.0 0.0 6.00 0.95 1.15 0.20 0.00 0.00 0.20 0.00 2.0 61.7 0. 3.09102 9.100 29.40 0.0 0.0 0.0 6.00 0.94 1.14 0.20 0.00 0.00 0.20 0.00 2.0 61.2 0. 3.11103 9.000 29.40 0.0 0.0 0.0 6.00 0.94 1.14 0.20 0.00 0.00 0.20 0.00 2.0 60.7 0. 3.12104 8.900 29.40 0.0 0.0 0.0 6.00 0.94 1.14 0.20 0.00 0.00 0.20 0.00 2.0 60.2 0. 3.13105 8.800 29.40 0.0 0.0 0.0 6.00 0.94 1.14 0.20 0.00 0.00 0.20 0.00 2.0 59.8 0. 3.14106 8.700 29.40 0.0 0.0 0.0 6.00 0.93 1.13 0.20 0.00 0.00 0.20 0.00 2.0 59.3 0. 3.16107 8.600 29.40 0.0 0.0 0.0 6.00 0.93 1.13 0.20 0.00 0.00 0.20 0.00 2.0 58.8 0. 3.17108 8.500 29.40 0.0 0.0 0.0 6.00 0.93 1.13 0.20 0.00 0.00 0.20 0.00 2.0 58.3 0. 3.18109 8.400 29.40 0.0 0.0 0.0 6.00 0.93 1.13 0.20 0.00 0.00 0.20 0.00 2.0 57.9 0. 3.19110 8.300 29.40 0.0 0.0 0.0 6.00 0.93 1.13 0.20 0.00 0.00 0.20 0.00 2.0 57.4 0. 3.21111 8.200 29.40 0.0 0.0 0.0 6.00 0.92 1.12 0.20 0.00 0.00 0.20 0.00 2.0 56.9 0. 3.22112 8.100 29.40 0.0 0.0 0.0 6.00 0.92 1.12 0.20 0.00 0.00 0.20 0.00 2.0 56.4 0. 3.23113 8.000 29.40 0.0 0.0 0.0 6.00 0.92 1.12 0.20 0.00 0.00 0.20 0.00 2.0 56.0 0. 3.24114 7.900 29.40 0.0 0.0 0.0 6.00 0.92 1.12 0.20 0.00 0.00 0.20 0.00 2.0 55.5 0. 3.25115 7.800 29.40 0.0 0.0 0.0 5.99 0.92 1.12 0.20 0.00 0.00 0.20 0.00 2.0 55.0 0. 3.27116 7.700 29.40 0.0 0.0 0.0 5.88 0.92 1.12 0.20 0.00 0.00 0.20 0.00 2.0 53.3 0. 3.27117 7.600 29.40 0.0 0.0 0.0 5.83 0.92 1.12 0.20 0.00 0.00 0.20 0.00 2.0 51.7 0. 3.28118 7.500 29.40 0.0 0.0 0.0 5.80 0.91 1.11 0.20 0.00 0.00 0.20 0.00 2.0 50.0 0. 3.28119 7.400 29.40 0.0 0.0 0.0 5.79 0.91 1.11 0.20 0.00 0.00 0.20 0.00 2.0 48.3 0. 3.29120 7.300 29.40 0.0 0.0 0.0 5.78 0.91 1.11 0.20 0.00 0.00 0.20 0.00 2.0 46.7 0. 3.29121 7.200 29.40 0.0 0.0 0.0 5.78 0.91 1.11 0.20 0.00 0.00 0.20 0.00 2.0 45.0 0. 3.30122 7.100 29.40 0.0 0.0 0.0 5.78 0.91 1.11 0.20 0.00 0.00 0.20 0.00 2.0 43.3 0. 3.30123 7.000 29.40 0.0 0.0 0.0 5.78 0.91 1.11 0.19 0.00 0.00 0.19 0.00 2.0 41.7 0. 3.31124 6.900 29.40 0.0 0.0 0.0 5.78 0.91 1.11 0.19 0.00 0.00 0.19 0.00 2.0 40.0 0. 3.31125 6.800 29.40 0.0 0.0 0.0 5.78 0.91 1.11 0.19 0.00 0.00 0.19 0.00 2.0 38.3 0. 3.32126 6.700 29.40 0.0 0.0 0.0 5.78 0.91 1.11 0.19 0.00 0.00 0.19 0.00 2.0 36.7 0. 3.32127 6.600 29.40 0.0 0.0 0.0 5.78 0.91 1.11 0.19 0.00 0.00 0.19 0.00 2.0 35.0 0. 3.33128 6.500 29.40 0.0 0.0 0.0 5.78 0.91 1.11 0.19 0.00 0.00 0.19 0.00 2.0 33.3 0. 3.33129 6.400 29.40 0.0 0.0 0.0 5.78 0.91 1.11 0.19 0.00 0.00 0.19 0.00 2.0 31.7 0. 3.34130 6.300 29.40 0.0 0.0 0.0 5.78 0.91 1.11 0.19 0.00 0.00 0.19 0.00 2.0 30.0 0. 3.34131 6.200 29.40 0.0 0.0 0.0 5.78 0.91 1.11 0.19 0.00 0.00 0.19 0.00 2.0 28.3 0. 3.35132 6.100 29.40 0.0 0.0 0.0 5.78 0.90 1.10 0.19 0.00 0.00 0.19 0.00 2.0 26.7 0. 3.35133 6.000 29.40 0.0 0.0 0.0 5.78 0.90 1.10 0.19 0.00 0.00 0.19 0.00 2.0 25.0 0. 3.36134 5.900 29.40 0.0 0.0 0.0 5.78 0.90 1.10 0.19 0.00 0.00 0.19 0.00 2.0 23.3 0. 3.36135 5.800 29.40 0.0 0.0 0.0 5.77 0.90 1.10 0.19 0.00 0.00 0.19 0.00 2.0 21.7 0. 3.37136 5.700 29.40 0.0 0.0 0.0 5.76 0.90 1.10 0.19 0.00 0.00 0.19 0.00 2.0 20.0 0. 3.37137 5.600 29.40 0.0 0.0 0.0 5.68 0.90 1.10 0.19 0.00 0.00 0.19 0.00 2.0 19.9 0. 3.39138 5.500 29.40 0.0 0.0 0.0 5.64 0.89 1.09 0.19 0.00 0.00 0.19 0.00 2.0 19.8 0. 3.41139 5.400 29.40 0.0 0.0 0.0 5.62 0.89 1.09 0.19 0.00 0.00 0.19 0.00 2.0 19.7 0. 3.42140 5.300 29.40 0.0 0.0 0.0 5.61 0.89 1.09 0.19 0.00 0.00 0.19 0.00 2.0 19.6 0. 3.44141 5.200 29.40 0.0 0.0 0.0 5.61 0.88 1.08 0.19 0.00 0.00 0.19 0.00 2.0 19.5 0. 3.46142 5.100 29.40 0.0 0.0 0.0 5.61 0.88 1.08 0.19 0.00 0.00 0.19 0.00 2.0 19.4 0. 3.47143 5.000 29.40 0.0 0.0 0.0 5.60 0.88 1.08 0.19 0.00 0.00 0.19 0.00 2.0 19.3 0. 3.49

Upper Calcasieu River – Subsegment 030101 Summer critical season projection model input/output Orginated: January 10, 2002
Page 11
144 4.900 29.40 0.0 0.0 0.0 5.60 0.87 1.07 0.19 0.00 0.00 0.19 0.00 2.0 19.2 0. 3.50145 4.800 29.40 0.0 0.0 0.0 5.60 0.87 1.07 0.19 0.00 0.00 0.19 0.00 2.0 19.1 0. 3.52146 4.700 29.40 0.0 0.0 0.0 5.60 0.87 1.07 0.19 0.00 0.00 0.19 0.00 2.0 19.0 0. 3.53147 4.600 29.40 0.0 0.0 0.0 5.60 0.87 1.07 0.19 0.00 0.00 0.19 0.00 2.0 19.0 0. 3.55148 4.500 29.40 0.0 0.0 0.0 5.60 0.86 1.06 0.19 0.00 0.00 0.19 0.00 2.0 18.9 0. 3.56149 4.400 29.40 0.0 0.0 0.0 5.60 0.86 1.06 0.19 0.00 0.00 0.19 0.00 2.0 18.8 0. 3.58150 4.300 29.40 0.0 0.0 0.0 5.60 0.86 1.06 0.19 0.00 0.00 0.19 0.00 2.0 18.7 0. 3.59151 4.200 29.40 0.0 0.0 0.0 5.60 0.86 1.06 0.19 0.00 0.00 0.19 0.00 2.0 18.6 0. 3.60152 4.100 29.40 0.0 0.0 0.0 5.60 0.85 1.05 0.19 0.00 0.00 0.19 0.00 2.0 18.5 0. 3.62153 4.000 29.40 0.0 0.0 0.0 5.60 0.85 1.05 0.19 0.00 0.00 0.19 0.00 2.0 18.4 0. 3.63154 3.900 29.40 0.0 0.0 0.0 5.60 0.85 1.05 0.19 0.00 0.00 0.19 0.00 2.0 18.3 0. 3.65155 3.800 29.40 0.0 0.0 0.0 5.60 0.85 1.05 0.19 0.00 0.00 0.19 0.00 2.0 18.2 0. 3.66156 3.700 29.40 0.0 0.0 0.0 5.60 0.85 1.05 0.19 0.00 0.00 0.19 0.00 2.0 18.1 0. 3.68157 3.600 29.40 0.0 0.0 0.0 5.59 0.85 1.05 0.19 0.00 0.00 0.19 0.00 2.0 18.0 0. 3.72158 3.500 29.40 0.0 0.0 0.0 5.52 0.88 1.08 0.20 0.00 0.00 0.20 0.00 2.0 18.0 0. 3.84159 3.400 29.40 0.0 0.0 0.0 5.48 0.91 1.11 0.21 0.00 0.00 0.21 0.00 2.0 18.0 0. 3.95160 3.300 29.40 0.0 0.0 0.0 5.46 0.94 1.14 0.22 0.00 0.00 0.22 0.00 2.0 18.0 0. 4.07161 3.200 29.40 0.0 0.0 0.0 5.45 0.97 1.17 0.22 0.00 0.00 0.22 0.00 2.0 18.0 0. 4.19162 3.100 29.40 0.0 0.0 0.0 5.44 1.00 1.20 0.23 0.00 0.00 0.23 0.00 2.0 18.0 0. 4.30163 3.000 29.40 0.0 0.0 0.0 5.44 1.03 1.23 0.24 0.00 0.00 0.24 0.00 2.0 18.0 0. 4.41164 2.900 29.40 0.0 0.0 0.0 5.44 1.05 1.25 0.24 0.00 0.00 0.24 0.00 2.0 18.0 0. 4.52165 2.800 29.40 0.0 0.0 0.0 5.44 1.08 1.28 0.25 0.00 0.00 0.25 0.00 2.0 18.0 0. 4.63166 2.700 29.40 0.0 0.0 0.0 5.44 1.11 1.31 0.26 0.00 0.00 0.26 0.00 2.0 18.0 0. 4.74167 2.600 29.40 0.0 0.0 0.0 5.43 1.13 1.33 0.26 0.00 0.00 0.26 0.00 2.0 18.0 0. 4.85168 2.500 29.40 0.0 0.0 0.0 5.43 1.15 1.35 0.27 0.00 0.00 0.27 0.00 2.0 18.0 0. 4.96169 2.400 29.40 0.0 0.0 0.0 5.42 1.18 1.38 0.28 0.00 0.00 0.28 0.00 2.0 18.0 0. 5.07170 2.300 29.40 0.0 0.0 0.0 5.35 1.20 1.40 0.28 0.00 0.00 0.28 0.00 2.0 18.0 0. 5.21171 2.200 29.40 0.0 0.0 0.0 5.31 1.23 1.43 0.29 0.00 0.00 0.29 0.00 2.0 18.0 0. 5.34172 2.100 29.40 0.0 0.0 0.0 5.29 1.26 1.46 0.29 0.00 0.00 0.29 0.00 2.0 18.0 0. 5.47173 2.000 29.40 0.0 0.0 0.0 5.27 1.28 1.48 0.30 0.00 0.00 0.30 0.00 2.0 18.0 0. 5.60174 1.900 29.40 0.0 0.0 0.0 5.27 1.31 1.51 0.30 0.00 0.00 0.30 0.00 2.0 18.0 0. 5.73175 1.800 29.40 0.0 0.0 0.0 5.26 1.33 1.53 0.31 0.00 0.00 0.31 0.00 2.0 18.0 0. 5.85176 1.700 29.40 0.0 0.0 0.0 5.26 1.36 1.56 0.31 0.00 0.00 0.31 0.00 2.0 18.0 0. 5.98177 1.600 29.40 0.0 0.0 0.0 5.25 1.39 1.59 0.32 0.00 0.00 0.32 0.00 2.0 18.0 0. 6.10178 1.500 29.40 0.0 0.0 0.0 5.26 1.47 1.67 0.33 0.01 0.00 0.33 0.00 2.0 18.0 0. 6.21179 1.400 29.40 0.0 0.0 0.0 5.35 1.78 1.98 0.36 0.01 0.00 0.37 0.00 2.0 18.0 0. 6.24180 1.300 29.40 0.0 0.0 0.0 5.31 1.79 1.99 0.36 0.01 0.00 0.37 0.00 2.0 18.0 0. 6.35181 1.200 29.40 0.0 0.0 0.0 5.29 1.80 2.00 0.36 0.01 0.00 0.38 0.00 2.0 18.0 0. 6.46182 1.100 29.40 0.0 0.0 0.0 5.21 1.82 2.02 0.36 0.02 0.00 0.38 0.00 2.0 18.0 0. 6.58183 1.000 29.40 0.0 0.0 0.0 5.15 1.84 2.04 0.37 0.02 0.00 0.39 0.00 2.0 18.0 0. 6.70184 0.900 29.40 0.0 0.0 0.0 5.12 1.86 2.06 0.37 0.02 0.00 0.40 0.00 2.0 18.0 0. 6.82185 0.800 29.40 0.0 0.0 0.0 5.09 1.88 2.08 0.38 0.03 0.00 0.40 0.00 2.0 18.0 0. 6.94186 0.700 29.40 0.0 0.0 0.0 5.08 1.90 2.10 0.38 0.03 0.00 0.41 0.00 2.0 18.0 0. 7.06187 0.600 29.40 0.0 0.0 0.0 5.07 1.92 2.12 0.38 0.03 0.00 0.42 0.00 2.0 18.0 0. 7.17188 0.500 29.40 0.0 0.0 0.0 5.06 1.94 2.14 0.39 0.03 0.00 0.42 0.00 2.0 18.0 0. 7.29189 0.400 29.40 0.0 0.0 0.0 5.05 1.96 2.16 0.39 0.04 0.00 0.43 0.00 2.0 18.0 0. 7.40190 0.300 29.40 0.0 0.0 0.0 5.05 1.98 2.18 0.39 0.04 0.00 0.43 0.00 2.0 18.0 0. 7.52191 0.200 29.40 0.0 0.0 0.0 5.04 2.00 2.20 0.40 0.04 0.00 0.44 0.00 2.0 18.0 0. 7.63192 0.100 29.40 0.0 0.0 0.0 5.04 2.01 2.21 0.40 0.04 0.00 0.45 0.00 2.0 18.0 0. 7.74193 0.000 29.40 0.0 0.0 0.0 5.04 2.03 2.23 0.40 0.05 0.00 0.45 0.00 2.0 18.0 0. 7.83
SPECIAL REPORT: UPPER CALCASIEU RVRBIOLOGICAL AND PHYSICAL COEFFICIENTS
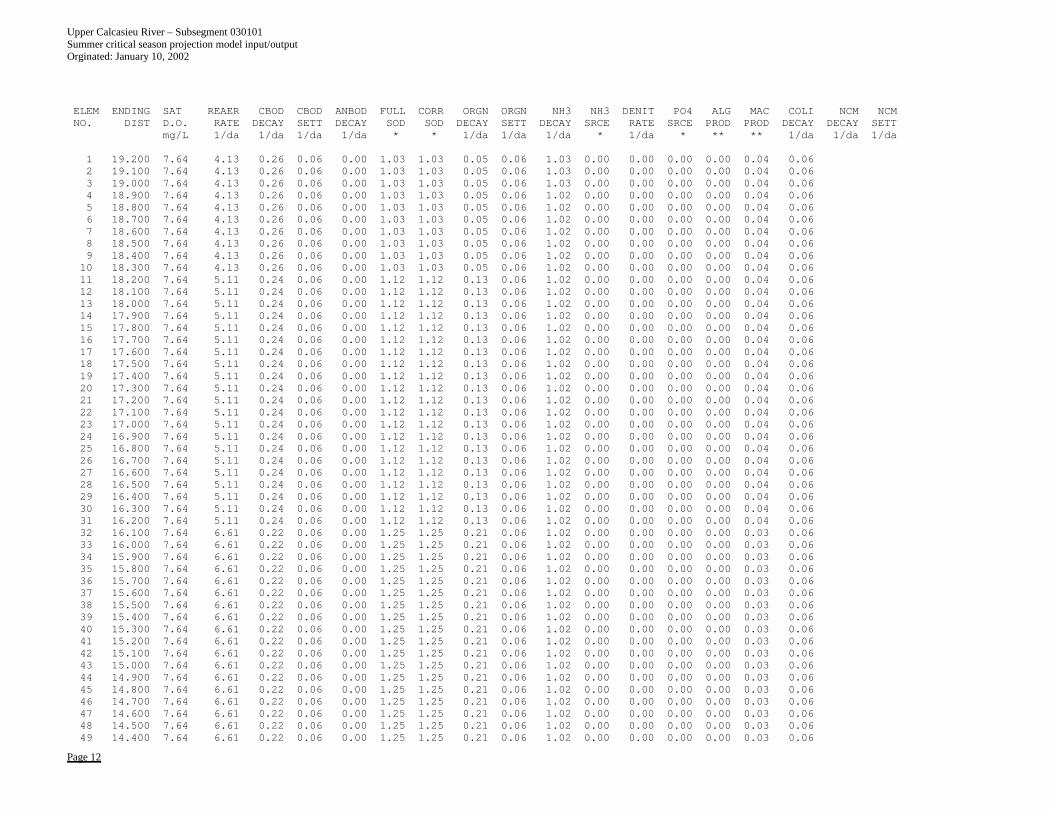
Upper Calcasieu River – Subsegment 030101 Summer critical season projection model input/output Orginated: January 10, 2002
Page 12
ELEM ENDING SAT REAER CBOD CBOD ANBOD FULL CORR ORGN ORGN NH3 NH3 DENIT PO4 ALG MAC COLI NCM NCMNO. DIST D.O. RATE DECAY SETT DECAY SOD SOD DECAY SETT DECAY SRCE RATE SRCE PROD PROD DECAY DECAY SETT
mg/L 1/da 1/da 1/da 1/da * * 1/da 1/da 1/da * 1/da * ** ** 1/da 1/da 1/da
1 19.200 7.64 4.13 0.26 0.06 0.00 1.03 1.03 0.05 0.06 1.03 0.00 0.00 0.00 0.00 0.04 0.062 19.100 7.64 4.13 0.26 0.06 0.00 1.03 1.03 0.05 0.06 1.03 0.00 0.00 0.00 0.00 0.04 0.063 19.000 7.64 4.13 0.26 0.06 0.00 1.03 1.03 0.05 0.06 1.03 0.00 0.00 0.00 0.00 0.04 0.064 18.900 7.64 4.13 0.26 0.06 0.00 1.03 1.03 0.05 0.06 1.02 0.00 0.00 0.00 0.00 0.04 0.065 18.800 7.64 4.13 0.26 0.06 0.00 1.03 1.03 0.05 0.06 1.02 0.00 0.00 0.00 0.00 0.04 0.066 18.700 7.64 4.13 0.26 0.06 0.00 1.03 1.03 0.05 0.06 1.02 0.00 0.00 0.00 0.00 0.04 0.067 18.600 7.64 4.13 0.26 0.06 0.00 1.03 1.03 0.05 0.06 1.02 0.00 0.00 0.00 0.00 0.04 0.068 18.500 7.64 4.13 0.26 0.06 0.00 1.03 1.03 0.05 0.06 1.02 0.00 0.00 0.00 0.00 0.04 0.069 18.400 7.64 4.13 0.26 0.06 0.00 1.03 1.03 0.05 0.06 1.02 0.00 0.00 0.00 0.00 0.04 0.0610 18.300 7.64 4.13 0.26 0.06 0.00 1.03 1.03 0.05 0.06 1.02 0.00 0.00 0.00 0.00 0.04 0.0611 18.200 7.64 5.11 0.24 0.06 0.00 1.12 1.12 0.13 0.06 1.02 0.00 0.00 0.00 0.00 0.04 0.0612 18.100 7.64 5.11 0.24 0.06 0.00 1.12 1.12 0.13 0.06 1.02 0.00 0.00 0.00 0.00 0.04 0.0613 18.000 7.64 5.11 0.24 0.06 0.00 1.12 1.12 0.13 0.06 1.02 0.00 0.00 0.00 0.00 0.04 0.0614 17.900 7.64 5.11 0.24 0.06 0.00 1.12 1.12 0.13 0.06 1.02 0.00 0.00 0.00 0.00 0.04 0.0615 17.800 7.64 5.11 0.24 0.06 0.00 1.12 1.12 0.13 0.06 1.02 0.00 0.00 0.00 0.00 0.04 0.0616 17.700 7.64 5.11 0.24 0.06 0.00 1.12 1.12 0.13 0.06 1.02 0.00 0.00 0.00 0.00 0.04 0.0617 17.600 7.64 5.11 0.24 0.06 0.00 1.12 1.12 0.13 0.06 1.02 0.00 0.00 0.00 0.00 0.04 0.0618 17.500 7.64 5.11 0.24 0.06 0.00 1.12 1.12 0.13 0.06 1.02 0.00 0.00 0.00 0.00 0.04 0.0619 17.400 7.64 5.11 0.24 0.06 0.00 1.12 1.12 0.13 0.06 1.02 0.00 0.00 0.00 0.00 0.04 0.0620 17.300 7.64 5.11 0.24 0.06 0.00 1.12 1.12 0.13 0.06 1.02 0.00 0.00 0.00 0.00 0.04 0.0621 17.200 7.64 5.11 0.24 0.06 0.00 1.12 1.12 0.13 0.06 1.02 0.00 0.00 0.00 0.00 0.04 0.0622 17.100 7.64 5.11 0.24 0.06 0.00 1.12 1.12 0.13 0.06 1.02 0.00 0.00 0.00 0.00 0.04 0.0623 17.000 7.64 5.11 0.24 0.06 0.00 1.12 1.12 0.13 0.06 1.02 0.00 0.00 0.00 0.00 0.04 0.0624 16.900 7.64 5.11 0.24 0.06 0.00 1.12 1.12 0.13 0.06 1.02 0.00 0.00 0.00 0.00 0.04 0.0625 16.800 7.64 5.11 0.24 0.06 0.00 1.12 1.12 0.13 0.06 1.02 0.00 0.00 0.00 0.00 0.04 0.0626 16.700 7.64 5.11 0.24 0.06 0.00 1.12 1.12 0.13 0.06 1.02 0.00 0.00 0.00 0.00 0.04 0.0627 16.600 7.64 5.11 0.24 0.06 0.00 1.12 1.12 0.13 0.06 1.02 0.00 0.00 0.00 0.00 0.04 0.0628 16.500 7.64 5.11 0.24 0.06 0.00 1.12 1.12 0.13 0.06 1.02 0.00 0.00 0.00 0.00 0.04 0.0629 16.400 7.64 5.11 0.24 0.06 0.00 1.12 1.12 0.13 0.06 1.02 0.00 0.00 0.00 0.00 0.04 0.0630 16.300 7.64 5.11 0.24 0.06 0.00 1.12 1.12 0.13 0.06 1.02 0.00 0.00 0.00 0.00 0.04 0.0631 16.200 7.64 5.11 0.24 0.06 0.00 1.12 1.12 0.13 0.06 1.02 0.00 0.00 0.00 0.00 0.04 0.0632 16.100 7.64 6.61 0.22 0.06 0.00 1.25 1.25 0.21 0.06 1.02 0.00 0.00 0.00 0.00 0.03 0.0633 16.000 7.64 6.61 0.22 0.06 0.00 1.25 1.25 0.21 0.06 1.02 0.00 0.00 0.00 0.00 0.03 0.0634 15.900 7.64 6.61 0.22 0.06 0.00 1.25 1.25 0.21 0.06 1.02 0.00 0.00 0.00 0.00 0.03 0.0635 15.800 7.64 6.61 0.22 0.06 0.00 1.25 1.25 0.21 0.06 1.02 0.00 0.00 0.00 0.00 0.03 0.0636 15.700 7.64 6.61 0.22 0.06 0.00 1.25 1.25 0.21 0.06 1.02 0.00 0.00 0.00 0.00 0.03 0.0637 15.600 7.64 6.61 0.22 0.06 0.00 1.25 1.25 0.21 0.06 1.02 0.00 0.00 0.00 0.00 0.03 0.0638 15.500 7.64 6.61 0.22 0.06 0.00 1.25 1.25 0.21 0.06 1.02 0.00 0.00 0.00 0.00 0.03 0.0639 15.400 7.64 6.61 0.22 0.06 0.00 1.25 1.25 0.21 0.06 1.02 0.00 0.00 0.00 0.00 0.03 0.0640 15.300 7.64 6.61 0.22 0.06 0.00 1.25 1.25 0.21 0.06 1.02 0.00 0.00 0.00 0.00 0.03 0.0641 15.200 7.64 6.61 0.22 0.06 0.00 1.25 1.25 0.21 0.06 1.02 0.00 0.00 0.00 0.00 0.03 0.0642 15.100 7.64 6.61 0.22 0.06 0.00 1.25 1.25 0.21 0.06 1.02 0.00 0.00 0.00 0.00 0.03 0.0643 15.000 7.64 6.61 0.22 0.06 0.00 1.25 1.25 0.21 0.06 1.02 0.00 0.00 0.00 0.00 0.03 0.0644 14.900 7.64 6.61 0.22 0.06 0.00 1.25 1.25 0.21 0.06 1.02 0.00 0.00 0.00 0.00 0.03 0.0645 14.800 7.64 6.61 0.22 0.06 0.00 1.25 1.25 0.21 0.06 1.02 0.00 0.00 0.00 0.00 0.03 0.0646 14.700 7.64 6.61 0.22 0.06 0.00 1.25 1.25 0.21 0.06 1.02 0.00 0.00 0.00 0.00 0.03 0.0647 14.600 7.64 6.61 0.22 0.06 0.00 1.25 1.25 0.21 0.06 1.02 0.00 0.00 0.00 0.00 0.03 0.0648 14.500 7.64 6.61 0.22 0.06 0.00 1.25 1.25 0.21 0.06 1.02 0.00 0.00 0.00 0.00 0.03 0.0649 14.400 7.64 6.61 0.22 0.06 0.00 1.25 1.25 0.21 0.06 1.02 0.00 0.00 0.00 0.00 0.03 0.06
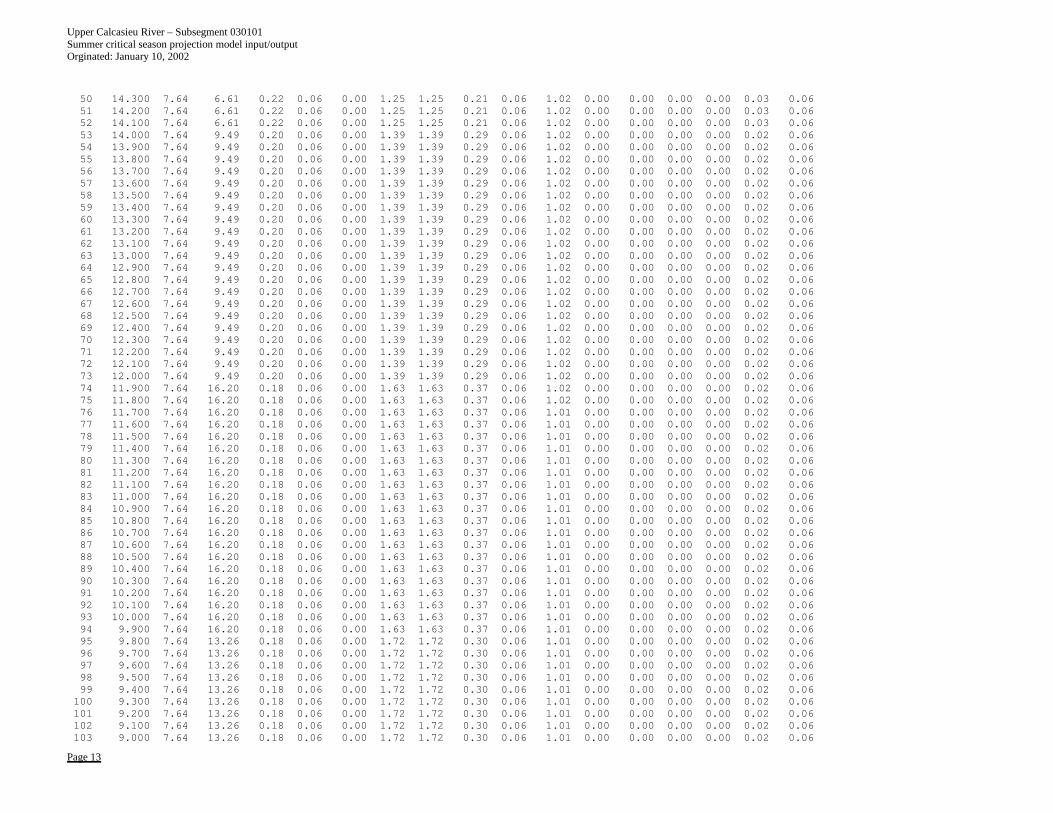
Upper Calcasieu River – Subsegment 030101 Summer critical season projection model input/output Orginated: January 10, 2002
Page 13
50 14.300 7.64 6.61 0.22 0.06 0.00 1.25 1.25 0.21 0.06 1.02 0.00 0.00 0.00 0.00 0.03 0.0651 14.200 7.64 6.61 0.22 0.06 0.00 1.25 1.25 0.21 0.06 1.02 0.00 0.00 0.00 0.00 0.03 0.0652 14.100 7.64 6.61 0.22 0.06 0.00 1.25 1.25 0.21 0.06 1.02 0.00 0.00 0.00 0.00 0.03 0.0653 14.000 7.64 9.49 0.20 0.06 0.00 1.39 1.39 0.29 0.06 1.02 0.00 0.00 0.00 0.00 0.02 0.0654 13.900 7.64 9.49 0.20 0.06 0.00 1.39 1.39 0.29 0.06 1.02 0.00 0.00 0.00 0.00 0.02 0.0655 13.800 7.64 9.49 0.20 0.06 0.00 1.39 1.39 0.29 0.06 1.02 0.00 0.00 0.00 0.00 0.02 0.0656 13.700 7.64 9.49 0.20 0.06 0.00 1.39 1.39 0.29 0.06 1.02 0.00 0.00 0.00 0.00 0.02 0.0657 13.600 7.64 9.49 0.20 0.06 0.00 1.39 1.39 0.29 0.06 1.02 0.00 0.00 0.00 0.00 0.02 0.0658 13.500 7.64 9.49 0.20 0.06 0.00 1.39 1.39 0.29 0.06 1.02 0.00 0.00 0.00 0.00 0.02 0.0659 13.400 7.64 9.49 0.20 0.06 0.00 1.39 1.39 0.29 0.06 1.02 0.00 0.00 0.00 0.00 0.02 0.0660 13.300 7.64 9.49 0.20 0.06 0.00 1.39 1.39 0.29 0.06 1.02 0.00 0.00 0.00 0.00 0.02 0.0661 13.200 7.64 9.49 0.20 0.06 0.00 1.39 1.39 0.29 0.06 1.02 0.00 0.00 0.00 0.00 0.02 0.0662 13.100 7.64 9.49 0.20 0.06 0.00 1.39 1.39 0.29 0.06 1.02 0.00 0.00 0.00 0.00 0.02 0.0663 13.000 7.64 9.49 0.20 0.06 0.00 1.39 1.39 0.29 0.06 1.02 0.00 0.00 0.00 0.00 0.02 0.0664 12.900 7.64 9.49 0.20 0.06 0.00 1.39 1.39 0.29 0.06 1.02 0.00 0.00 0.00 0.00 0.02 0.0665 12.800 7.64 9.49 0.20 0.06 0.00 1.39 1.39 0.29 0.06 1.02 0.00 0.00 0.00 0.00 0.02 0.0666 12.700 7.64 9.49 0.20 0.06 0.00 1.39 1.39 0.29 0.06 1.02 0.00 0.00 0.00 0.00 0.02 0.0667 12.600 7.64 9.49 0.20 0.06 0.00 1.39 1.39 0.29 0.06 1.02 0.00 0.00 0.00 0.00 0.02 0.0668 12.500 7.64 9.49 0.20 0.06 0.00 1.39 1.39 0.29 0.06 1.02 0.00 0.00 0.00 0.00 0.02 0.0669 12.400 7.64 9.49 0.20 0.06 0.00 1.39 1.39 0.29 0.06 1.02 0.00 0.00 0.00 0.00 0.02 0.0670 12.300 7.64 9.49 0.20 0.06 0.00 1.39 1.39 0.29 0.06 1.02 0.00 0.00 0.00 0.00 0.02 0.0671 12.200 7.64 9.49 0.20 0.06 0.00 1.39 1.39 0.29 0.06 1.02 0.00 0.00 0.00 0.00 0.02 0.0672 12.100 7.64 9.49 0.20 0.06 0.00 1.39 1.39 0.29 0.06 1.02 0.00 0.00 0.00 0.00 0.02 0.0673 12.000 7.64 9.49 0.20 0.06 0.00 1.39 1.39 0.29 0.06 1.02 0.00 0.00 0.00 0.00 0.02 0.0674 11.900 7.64 16.20 0.18 0.06 0.00 1.63 1.63 0.37 0.06 1.02 0.00 0.00 0.00 0.00 0.02 0.0675 11.800 7.64 16.20 0.18 0.06 0.00 1.63 1.63 0.37 0.06 1.02 0.00 0.00 0.00 0.00 0.02 0.0676 11.700 7.64 16.20 0.18 0.06 0.00 1.63 1.63 0.37 0.06 1.01 0.00 0.00 0.00 0.00 0.02 0.0677 11.600 7.64 16.20 0.18 0.06 0.00 1.63 1.63 0.37 0.06 1.01 0.00 0.00 0.00 0.00 0.02 0.0678 11.500 7.64 16.20 0.18 0.06 0.00 1.63 1.63 0.37 0.06 1.01 0.00 0.00 0.00 0.00 0.02 0.0679 11.400 7.64 16.20 0.18 0.06 0.00 1.63 1.63 0.37 0.06 1.01 0.00 0.00 0.00 0.00 0.02 0.0680 11.300 7.64 16.20 0.18 0.06 0.00 1.63 1.63 0.37 0.06 1.01 0.00 0.00 0.00 0.00 0.02 0.0681 11.200 7.64 16.20 0.18 0.06 0.00 1.63 1.63 0.37 0.06 1.01 0.00 0.00 0.00 0.00 0.02 0.0682 11.100 7.64 16.20 0.18 0.06 0.00 1.63 1.63 0.37 0.06 1.01 0.00 0.00 0.00 0.00 0.02 0.0683 11.000 7.64 16.20 0.18 0.06 0.00 1.63 1.63 0.37 0.06 1.01 0.00 0.00 0.00 0.00 0.02 0.0684 10.900 7.64 16.20 0.18 0.06 0.00 1.63 1.63 0.37 0.06 1.01 0.00 0.00 0.00 0.00 0.02 0.0685 10.800 7.64 16.20 0.18 0.06 0.00 1.63 1.63 0.37 0.06 1.01 0.00 0.00 0.00 0.00 0.02 0.0686 10.700 7.64 16.20 0.18 0.06 0.00 1.63 1.63 0.37 0.06 1.01 0.00 0.00 0.00 0.00 0.02 0.0687 10.600 7.64 16.20 0.18 0.06 0.00 1.63 1.63 0.37 0.06 1.01 0.00 0.00 0.00 0.00 0.02 0.0688 10.500 7.64 16.20 0.18 0.06 0.00 1.63 1.63 0.37 0.06 1.01 0.00 0.00 0.00 0.00 0.02 0.0689 10.400 7.64 16.20 0.18 0.06 0.00 1.63 1.63 0.37 0.06 1.01 0.00 0.00 0.00 0.00 0.02 0.0690 10.300 7.64 16.20 0.18 0.06 0.00 1.63 1.63 0.37 0.06 1.01 0.00 0.00 0.00 0.00 0.02 0.0691 10.200 7.64 16.20 0.18 0.06 0.00 1.63 1.63 0.37 0.06 1.01 0.00 0.00 0.00 0.00 0.02 0.0692 10.100 7.64 16.20 0.18 0.06 0.00 1.63 1.63 0.37 0.06 1.01 0.00 0.00 0.00 0.00 0.02 0.0693 10.000 7.64 16.20 0.18 0.06 0.00 1.63 1.63 0.37 0.06 1.01 0.00 0.00 0.00 0.00 0.02 0.0694 9.900 7.64 16.20 0.18 0.06 0.00 1.63 1.63 0.37 0.06 1.01 0.00 0.00 0.00 0.00 0.02 0.0695 9.800 7.64 13.26 0.18 0.06 0.00 1.72 1.72 0.30 0.06 1.01 0.00 0.00 0.00 0.00 0.02 0.0696 9.700 7.64 13.26 0.18 0.06 0.00 1.72 1.72 0.30 0.06 1.01 0.00 0.00 0.00 0.00 0.02 0.0697 9.600 7.64 13.26 0.18 0.06 0.00 1.72 1.72 0.30 0.06 1.01 0.00 0.00 0.00 0.00 0.02 0.0698 9.500 7.64 13.26 0.18 0.06 0.00 1.72 1.72 0.30 0.06 1.01 0.00 0.00 0.00 0.00 0.02 0.0699 9.400 7.64 13.26 0.18 0.06 0.00 1.72 1.72 0.30 0.06 1.01 0.00 0.00 0.00 0.00 0.02 0.06100 9.300 7.64 13.26 0.18 0.06 0.00 1.72 1.72 0.30 0.06 1.01 0.00 0.00 0.00 0.00 0.02 0.06101 9.200 7.64 13.26 0.18 0.06 0.00 1.72 1.72 0.30 0.06 1.01 0.00 0.00 0.00 0.00 0.02 0.06102 9.100 7.64 13.26 0.18 0.06 0.00 1.72 1.72 0.30 0.06 1.01 0.00 0.00 0.00 0.00 0.02 0.06103 9.000 7.64 13.26 0.18 0.06 0.00 1.72 1.72 0.30 0.06 1.01 0.00 0.00 0.00 0.00 0.02 0.06
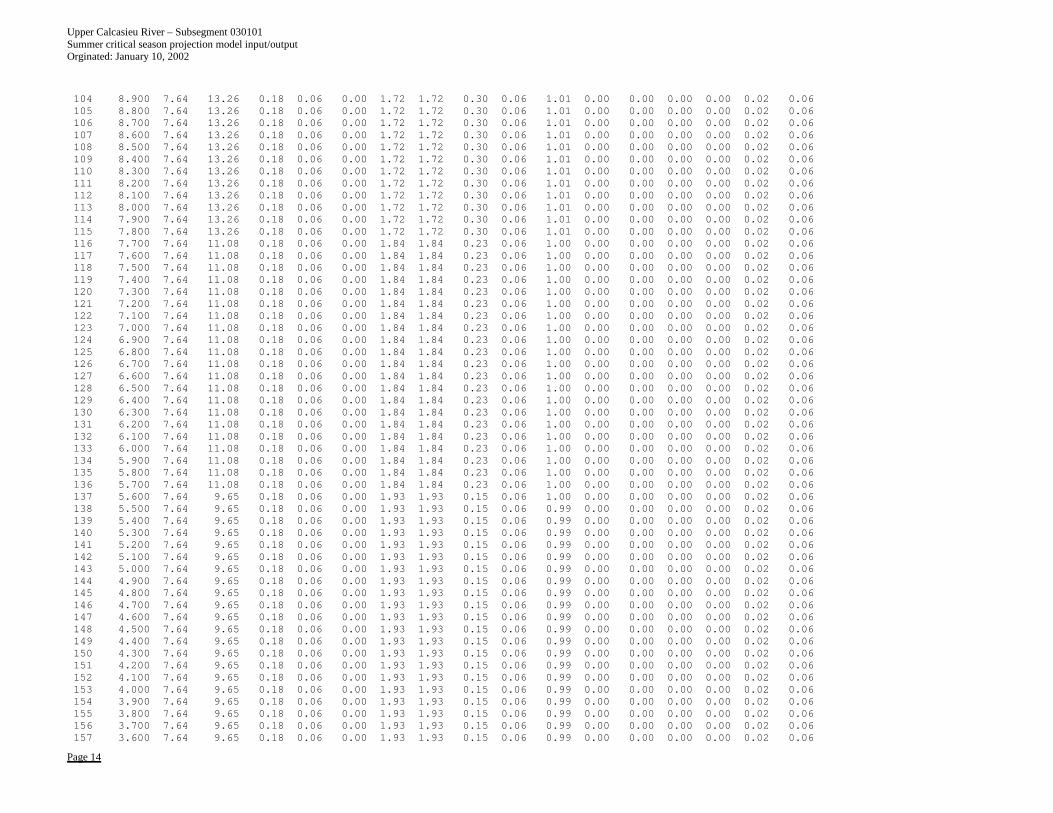
Upper Calcasieu River – Subsegment 030101 Summer critical season projection model input/output Orginated: January 10, 2002
Page 14
104 8.900 7.64 13.26 0.18 0.06 0.00 1.72 1.72 0.30 0.06 1.01 0.00 0.00 0.00 0.00 0.02 0.06105 8.800 7.64 13.26 0.18 0.06 0.00 1.72 1.72 0.30 0.06 1.01 0.00 0.00 0.00 0.00 0.02 0.06106 8.700 7.64 13.26 0.18 0.06 0.00 1.72 1.72 0.30 0.06 1.01 0.00 0.00 0.00 0.00 0.02 0.06107 8.600 7.64 13.26 0.18 0.06 0.00 1.72 1.72 0.30 0.06 1.01 0.00 0.00 0.00 0.00 0.02 0.06108 8.500 7.64 13.26 0.18 0.06 0.00 1.72 1.72 0.30 0.06 1.01 0.00 0.00 0.00 0.00 0.02 0.06109 8.400 7.64 13.26 0.18 0.06 0.00 1.72 1.72 0.30 0.06 1.01 0.00 0.00 0.00 0.00 0.02 0.06110 8.300 7.64 13.26 0.18 0.06 0.00 1.72 1.72 0.30 0.06 1.01 0.00 0.00 0.00 0.00 0.02 0.06111 8.200 7.64 13.26 0.18 0.06 0.00 1.72 1.72 0.30 0.06 1.01 0.00 0.00 0.00 0.00 0.02 0.06112 8.100 7.64 13.26 0.18 0.06 0.00 1.72 1.72 0.30 0.06 1.01 0.00 0.00 0.00 0.00 0.02 0.06113 8.000 7.64 13.26 0.18 0.06 0.00 1.72 1.72 0.30 0.06 1.01 0.00 0.00 0.00 0.00 0.02 0.06114 7.900 7.64 13.26 0.18 0.06 0.00 1.72 1.72 0.30 0.06 1.01 0.00 0.00 0.00 0.00 0.02 0.06115 7.800 7.64 13.26 0.18 0.06 0.00 1.72 1.72 0.30 0.06 1.01 0.00 0.00 0.00 0.00 0.02 0.06116 7.700 7.64 11.08 0.18 0.06 0.00 1.84 1.84 0.23 0.06 1.00 0.00 0.00 0.00 0.00 0.02 0.06117 7.600 7.64 11.08 0.18 0.06 0.00 1.84 1.84 0.23 0.06 1.00 0.00 0.00 0.00 0.00 0.02 0.06118 7.500 7.64 11.08 0.18 0.06 0.00 1.84 1.84 0.23 0.06 1.00 0.00 0.00 0.00 0.00 0.02 0.06119 7.400 7.64 11.08 0.18 0.06 0.00 1.84 1.84 0.23 0.06 1.00 0.00 0.00 0.00 0.00 0.02 0.06120 7.300 7.64 11.08 0.18 0.06 0.00 1.84 1.84 0.23 0.06 1.00 0.00 0.00 0.00 0.00 0.02 0.06121 7.200 7.64 11.08 0.18 0.06 0.00 1.84 1.84 0.23 0.06 1.00 0.00 0.00 0.00 0.00 0.02 0.06122 7.100 7.64 11.08 0.18 0.06 0.00 1.84 1.84 0.23 0.06 1.00 0.00 0.00 0.00 0.00 0.02 0.06123 7.000 7.64 11.08 0.18 0.06 0.00 1.84 1.84 0.23 0.06 1.00 0.00 0.00 0.00 0.00 0.02 0.06124 6.900 7.64 11.08 0.18 0.06 0.00 1.84 1.84 0.23 0.06 1.00 0.00 0.00 0.00 0.00 0.02 0.06125 6.800 7.64 11.08 0.18 0.06 0.00 1.84 1.84 0.23 0.06 1.00 0.00 0.00 0.00 0.00 0.02 0.06126 6.700 7.64 11.08 0.18 0.06 0.00 1.84 1.84 0.23 0.06 1.00 0.00 0.00 0.00 0.00 0.02 0.06127 6.600 7.64 11.08 0.18 0.06 0.00 1.84 1.84 0.23 0.06 1.00 0.00 0.00 0.00 0.00 0.02 0.06128 6.500 7.64 11.08 0.18 0.06 0.00 1.84 1.84 0.23 0.06 1.00 0.00 0.00 0.00 0.00 0.02 0.06129 6.400 7.64 11.08 0.18 0.06 0.00 1.84 1.84 0.23 0.06 1.00 0.00 0.00 0.00 0.00 0.02 0.06130 6.300 7.64 11.08 0.18 0.06 0.00 1.84 1.84 0.23 0.06 1.00 0.00 0.00 0.00 0.00 0.02 0.06131 6.200 7.64 11.08 0.18 0.06 0.00 1.84 1.84 0.23 0.06 1.00 0.00 0.00 0.00 0.00 0.02 0.06132 6.100 7.64 11.08 0.18 0.06 0.00 1.84 1.84 0.23 0.06 1.00 0.00 0.00 0.00 0.00 0.02 0.06133 6.000 7.64 11.08 0.18 0.06 0.00 1.84 1.84 0.23 0.06 1.00 0.00 0.00 0.00 0.00 0.02 0.06134 5.900 7.64 11.08 0.18 0.06 0.00 1.84 1.84 0.23 0.06 1.00 0.00 0.00 0.00 0.00 0.02 0.06135 5.800 7.64 11.08 0.18 0.06 0.00 1.84 1.84 0.23 0.06 1.00 0.00 0.00 0.00 0.00 0.02 0.06136 5.700 7.64 11.08 0.18 0.06 0.00 1.84 1.84 0.23 0.06 1.00 0.00 0.00 0.00 0.00 0.02 0.06137 5.600 7.64 9.65 0.18 0.06 0.00 1.93 1.93 0.15 0.06 1.00 0.00 0.00 0.00 0.00 0.02 0.06138 5.500 7.64 9.65 0.18 0.06 0.00 1.93 1.93 0.15 0.06 0.99 0.00 0.00 0.00 0.00 0.02 0.06139 5.400 7.64 9.65 0.18 0.06 0.00 1.93 1.93 0.15 0.06 0.99 0.00 0.00 0.00 0.00 0.02 0.06140 5.300 7.64 9.65 0.18 0.06 0.00 1.93 1.93 0.15 0.06 0.99 0.00 0.00 0.00 0.00 0.02 0.06141 5.200 7.64 9.65 0.18 0.06 0.00 1.93 1.93 0.15 0.06 0.99 0.00 0.00 0.00 0.00 0.02 0.06142 5.100 7.64 9.65 0.18 0.06 0.00 1.93 1.93 0.15 0.06 0.99 0.00 0.00 0.00 0.00 0.02 0.06143 5.000 7.64 9.65 0.18 0.06 0.00 1.93 1.93 0.15 0.06 0.99 0.00 0.00 0.00 0.00 0.02 0.06144 4.900 7.64 9.65 0.18 0.06 0.00 1.93 1.93 0.15 0.06 0.99 0.00 0.00 0.00 0.00 0.02 0.06145 4.800 7.64 9.65 0.18 0.06 0.00 1.93 1.93 0.15 0.06 0.99 0.00 0.00 0.00 0.00 0.02 0.06146 4.700 7.64 9.65 0.18 0.06 0.00 1.93 1.93 0.15 0.06 0.99 0.00 0.00 0.00 0.00 0.02 0.06147 4.600 7.64 9.65 0.18 0.06 0.00 1.93 1.93 0.15 0.06 0.99 0.00 0.00 0.00 0.00 0.02 0.06148 4.500 7.64 9.65 0.18 0.06 0.00 1.93 1.93 0.15 0.06 0.99 0.00 0.00 0.00 0.00 0.02 0.06149 4.400 7.64 9.65 0.18 0.06 0.00 1.93 1.93 0.15 0.06 0.99 0.00 0.00 0.00 0.00 0.02 0.06150 4.300 7.64 9.65 0.18 0.06 0.00 1.93 1.93 0.15 0.06 0.99 0.00 0.00 0.00 0.00 0.02 0.06151 4.200 7.64 9.65 0.18 0.06 0.00 1.93 1.93 0.15 0.06 0.99 0.00 0.00 0.00 0.00 0.02 0.06152 4.100 7.64 9.65 0.18 0.06 0.00 1.93 1.93 0.15 0.06 0.99 0.00 0.00 0.00 0.00 0.02 0.06153 4.000 7.64 9.65 0.18 0.06 0.00 1.93 1.93 0.15 0.06 0.99 0.00 0.00 0.00 0.00 0.02 0.06154 3.900 7.64 9.65 0.18 0.06 0.00 1.93 1.93 0.15 0.06 0.99 0.00 0.00 0.00 0.00 0.02 0.06155 3.800 7.64 9.65 0.18 0.06 0.00 1.93 1.93 0.15 0.06 0.99 0.00 0.00 0.00 0.00 0.02 0.06156 3.700 7.64 9.65 0.18 0.06 0.00 1.93 1.93 0.15 0.06 0.99 0.00 0.00 0.00 0.00 0.02 0.06157 3.600 7.64 9.65 0.18 0.06 0.00 1.93 1.93 0.15 0.06 0.99 0.00 0.00 0.00 0.00 0.02 0.06
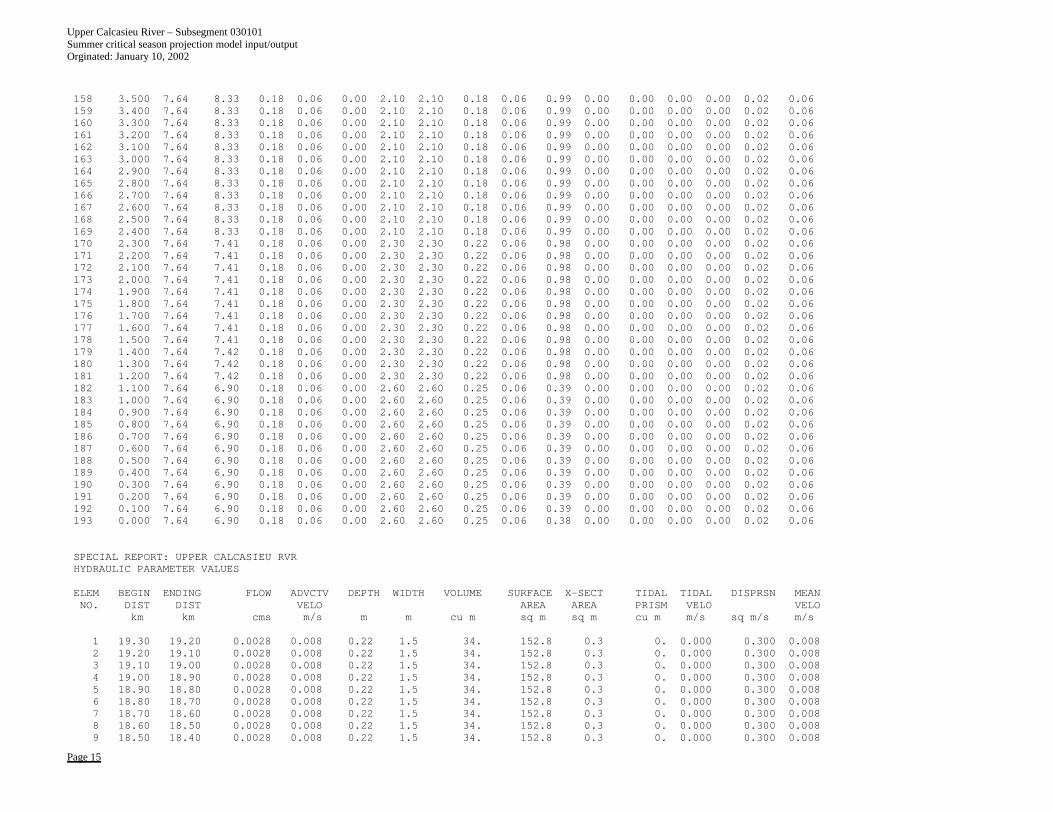
Upper Calcasieu River – Subsegment 030101 Summer critical season projection model input/output Orginated: January 10, 2002
Page 15
158 3.500 7.64 8.33 0.18 0.06 0.00 2.10 2.10 0.18 0.06 0.99 0.00 0.00 0.00 0.00 0.02 0.06159 3.400 7.64 8.33 0.18 0.06 0.00 2.10 2.10 0.18 0.06 0.99 0.00 0.00 0.00 0.00 0.02 0.06160 3.300 7.64 8.33 0.18 0.06 0.00 2.10 2.10 0.18 0.06 0.99 0.00 0.00 0.00 0.00 0.02 0.06161 3.200 7.64 8.33 0.18 0.06 0.00 2.10 2.10 0.18 0.06 0.99 0.00 0.00 0.00 0.00 0.02 0.06162 3.100 7.64 8.33 0.18 0.06 0.00 2.10 2.10 0.18 0.06 0.99 0.00 0.00 0.00 0.00 0.02 0.06163 3.000 7.64 8.33 0.18 0.06 0.00 2.10 2.10 0.18 0.06 0.99 0.00 0.00 0.00 0.00 0.02 0.06164 2.900 7.64 8.33 0.18 0.06 0.00 2.10 2.10 0.18 0.06 0.99 0.00 0.00 0.00 0.00 0.02 0.06165 2.800 7.64 8.33 0.18 0.06 0.00 2.10 2.10 0.18 0.06 0.99 0.00 0.00 0.00 0.00 0.02 0.06166 2.700 7.64 8.33 0.18 0.06 0.00 2.10 2.10 0.18 0.06 0.99 0.00 0.00 0.00 0.00 0.02 0.06167 2.600 7.64 8.33 0.18 0.06 0.00 2.10 2.10 0.18 0.06 0.99 0.00 0.00 0.00 0.00 0.02 0.06168 2.500 7.64 8.33 0.18 0.06 0.00 2.10 2.10 0.18 0.06 0.99 0.00 0.00 0.00 0.00 0.02 0.06169 2.400 7.64 8.33 0.18 0.06 0.00 2.10 2.10 0.18 0.06 0.99 0.00 0.00 0.00 0.00 0.02 0.06170 2.300 7.64 7.41 0.18 0.06 0.00 2.30 2.30 0.22 0.06 0.98 0.00 0.00 0.00 0.00 0.02 0.06171 2.200 7.64 7.41 0.18 0.06 0.00 2.30 2.30 0.22 0.06 0.98 0.00 0.00 0.00 0.00 0.02 0.06172 2.100 7.64 7.41 0.18 0.06 0.00 2.30 2.30 0.22 0.06 0.98 0.00 0.00 0.00 0.00 0.02 0.06173 2.000 7.64 7.41 0.18 0.06 0.00 2.30 2.30 0.22 0.06 0.98 0.00 0.00 0.00 0.00 0.02 0.06174 1.900 7.64 7.41 0.18 0.06 0.00 2.30 2.30 0.22 0.06 0.98 0.00 0.00 0.00 0.00 0.02 0.06175 1.800 7.64 7.41 0.18 0.06 0.00 2.30 2.30 0.22 0.06 0.98 0.00 0.00 0.00 0.00 0.02 0.06176 1.700 7.64 7.41 0.18 0.06 0.00 2.30 2.30 0.22 0.06 0.98 0.00 0.00 0.00 0.00 0.02 0.06177 1.600 7.64 7.41 0.18 0.06 0.00 2.30 2.30 0.22 0.06 0.98 0.00 0.00 0.00 0.00 0.02 0.06178 1.500 7.64 7.41 0.18 0.06 0.00 2.30 2.30 0.22 0.06 0.98 0.00 0.00 0.00 0.00 0.02 0.06179 1.400 7.64 7.42 0.18 0.06 0.00 2.30 2.30 0.22 0.06 0.98 0.00 0.00 0.00 0.00 0.02 0.06180 1.300 7.64 7.42 0.18 0.06 0.00 2.30 2.30 0.22 0.06 0.98 0.00 0.00 0.00 0.00 0.02 0.06181 1.200 7.64 7.42 0.18 0.06 0.00 2.30 2.30 0.22 0.06 0.98 0.00 0.00 0.00 0.00 0.02 0.06182 1.100 7.64 6.90 0.18 0.06 0.00 2.60 2.60 0.25 0.06 0.39 0.00 0.00 0.00 0.00 0.02 0.06183 1.000 7.64 6.90 0.18 0.06 0.00 2.60 2.60 0.25 0.06 0.39 0.00 0.00 0.00 0.00 0.02 0.06184 0.900 7.64 6.90 0.18 0.06 0.00 2.60 2.60 0.25 0.06 0.39 0.00 0.00 0.00 0.00 0.02 0.06185 0.800 7.64 6.90 0.18 0.06 0.00 2.60 2.60 0.25 0.06 0.39 0.00 0.00 0.00 0.00 0.02 0.06186 0.700 7.64 6.90 0.18 0.06 0.00 2.60 2.60 0.25 0.06 0.39 0.00 0.00 0.00 0.00 0.02 0.06187 0.600 7.64 6.90 0.18 0.06 0.00 2.60 2.60 0.25 0.06 0.39 0.00 0.00 0.00 0.00 0.02 0.06188 0.500 7.64 6.90 0.18 0.06 0.00 2.60 2.60 0.25 0.06 0.39 0.00 0.00 0.00 0.00 0.02 0.06189 0.400 7.64 6.90 0.18 0.06 0.00 2.60 2.60 0.25 0.06 0.39 0.00 0.00 0.00 0.00 0.02 0.06190 0.300 7.64 6.90 0.18 0.06 0.00 2.60 2.60 0.25 0.06 0.39 0.00 0.00 0.00 0.00 0.02 0.06191 0.200 7.64 6.90 0.18 0.06 0.00 2.60 2.60 0.25 0.06 0.39 0.00 0.00 0.00 0.00 0.02 0.06192 0.100 7.64 6.90 0.18 0.06 0.00 2.60 2.60 0.25 0.06 0.39 0.00 0.00 0.00 0.00 0.02 0.06193 0.000 7.64 6.90 0.18 0.06 0.00 2.60 2.60 0.25 0.06 0.38 0.00 0.00 0.00 0.00 0.02 0.06
SPECIAL REPORT: UPPER CALCASIEU RVRHYDRAULIC PARAMETER VALUES
ELEM BEGIN ENDING FLOW ADVCTV DEPTH WIDTH VOLUME SURFACE X-SECT TIDAL TIDAL DISPRSN MEANNO. DIST DIST VELO AREA AREA PRISM VELO VELO
km km cms m/s m m cu m sq m sq m cu m m/s sq m/s m/s
1 19.30 19.20 0.0028 0.008 0.22 1.5 34. 152.8 0.3 0. 0.000 0.300 0.0082 19.20 19.10 0.0028 0.008 0.22 1.5 34. 152.8 0.3 0. 0.000 0.300 0.0083 19.10 19.00 0.0028 0.008 0.22 1.5 34. 152.8 0.3 0. 0.000 0.300 0.0084 19.00 18.90 0.0028 0.008 0.22 1.5 34. 152.8 0.3 0. 0.000 0.300 0.0085 18.90 18.80 0.0028 0.008 0.22 1.5 34. 152.8 0.3 0. 0.000 0.300 0.0086 18.80 18.70 0.0028 0.008 0.22 1.5 34. 152.8 0.3 0. 0.000 0.300 0.0087 18.70 18.60 0.0028 0.008 0.22 1.5 34. 152.8 0.3 0. 0.000 0.300 0.0088 18.60 18.50 0.0028 0.008 0.22 1.5 34. 152.8 0.3 0. 0.000 0.300 0.0089 18.50 18.40 0.0028 0.008 0.22 1.5 34. 152.8 0.3 0. 0.000 0.300 0.008

Upper Calcasieu River – Subsegment 030101 Summer critical season projection model input/output Orginated: January 10, 2002
Page 16
10 18.40 18.30 0.0028 0.008 0.22 1.5 34. 152.8 0.3 0. 0.000 0.300 0.00811 18.30 18.20 0.0028 0.009 0.19 1.6 30. 163.7 0.3 0. 0.000 0.300 0.00912 18.20 18.10 0.0028 0.009 0.19 1.6 30. 163.7 0.3 0. 0.000 0.300 0.00913 18.10 18.00 0.0028 0.009 0.19 1.6 30. 163.7 0.3 0. 0.000 0.300 0.00914 18.00 17.90 0.0028 0.009 0.19 1.6 30. 163.7 0.3 0. 0.000 0.300 0.00915 17.90 17.80 0.0028 0.009 0.19 1.6 30. 163.7 0.3 0. 0.000 0.300 0.00916 17.80 17.70 0.0028 0.009 0.19 1.6 30. 163.7 0.3 0. 0.000 0.300 0.00917 17.70 17.60 0.0028 0.009 0.19 1.6 30. 163.7 0.3 0. 0.000 0.300 0.00918 17.60 17.50 0.0028 0.009 0.19 1.6 30. 163.7 0.3 0. 0.000 0.300 0.00919 17.50 17.40 0.0028 0.009 0.19 1.6 30. 163.7 0.3 0. 0.000 0.300 0.00920 17.40 17.30 0.0028 0.009 0.19 1.6 30. 163.7 0.3 0. 0.000 0.300 0.00921 17.30 17.20 0.0028 0.009 0.19 1.6 30. 163.7 0.3 0. 0.000 0.300 0.00922 17.20 17.10 0.0028 0.009 0.19 1.6 30. 163.7 0.3 0. 0.000 0.300 0.00923 17.10 17.00 0.0028 0.009 0.19 1.6 30. 163.7 0.3 0. 0.000 0.300 0.00924 17.00 16.90 0.0028 0.009 0.19 1.6 30. 163.7 0.3 0. 0.000 0.300 0.00925 16.90 16.80 0.0028 0.009 0.19 1.6 30. 163.7 0.3 0. 0.000 0.300 0.00926 16.80 16.70 0.0028 0.009 0.19 1.6 30. 163.7 0.3 0. 0.000 0.300 0.00927 16.70 16.60 0.0028 0.009 0.19 1.6 30. 163.7 0.3 0. 0.000 0.300 0.00928 16.60 16.50 0.0028 0.009 0.19 1.6 30. 163.7 0.3 0. 0.000 0.300 0.00929 16.50 16.40 0.0028 0.009 0.19 1.6 30. 163.7 0.3 0. 0.000 0.300 0.00930 16.40 16.30 0.0028 0.009 0.19 1.6 30. 163.7 0.3 0. 0.000 0.300 0.00931 16.30 16.20 0.0028 0.009 0.19 1.6 30. 163.7 0.3 0. 0.000 0.300 0.00932 16.20 16.10 0.0028 0.011 0.15 1.7 26. 174.5 0.3 0. 0.000 0.300 0.01133 16.10 16.00 0.0028 0.011 0.15 1.7 26. 174.5 0.3 0. 0.000 0.300 0.01134 16.00 15.90 0.0028 0.011 0.15 1.7 26. 174.5 0.3 0. 0.000 0.300 0.01135 15.90 15.80 0.0028 0.011 0.15 1.7 26. 174.5 0.3 0. 0.000 0.300 0.01136 15.80 15.70 0.0028 0.011 0.15 1.7 26. 174.5 0.3 0. 0.000 0.300 0.01137 15.70 15.60 0.0028 0.011 0.15 1.7 26. 174.5 0.3 0. 0.000 0.300 0.01138 15.60 15.50 0.0028 0.011 0.15 1.7 26. 174.5 0.3 0. 0.000 0.300 0.01139 15.50 15.40 0.0028 0.011 0.15 1.7 26. 174.5 0.3 0. 0.000 0.300 0.01140 15.40 15.30 0.0028 0.011 0.15 1.7 26. 174.5 0.3 0. 0.000 0.300 0.01141 15.30 15.20 0.0028 0.011 0.15 1.7 26. 174.5 0.3 0. 0.000 0.300 0.01142 15.20 15.10 0.0028 0.011 0.15 1.7 26. 174.5 0.3 0. 0.000 0.300 0.01143 15.10 15.00 0.0028 0.011 0.15 1.7 26. 174.5 0.3 0. 0.000 0.300 0.01144 15.00 14.90 0.0028 0.011 0.15 1.7 26. 174.5 0.3 0. 0.000 0.300 0.01145 14.90 14.80 0.0028 0.011 0.15 1.7 26. 174.5 0.3 0. 0.000 0.300 0.01146 14.80 14.70 0.0028 0.011 0.15 1.7 26. 174.5 0.3 0. 0.000 0.300 0.01147 14.70 14.60 0.0028 0.011 0.15 1.7 26. 174.5 0.3 0. 0.000 0.300 0.01148 14.60 14.50 0.0028 0.011 0.15 1.7 26. 174.5 0.3 0. 0.000 0.300 0.01149 14.50 14.40 0.0028 0.011 0.15 1.7 26. 174.5 0.3 0. 0.000 0.300 0.01150 14.40 14.30 0.0028 0.011 0.15 1.7 26. 174.5 0.3 0. 0.000 0.300 0.01151 14.30 14.20 0.0028 0.011 0.15 1.7 26. 174.5 0.3 0. 0.000 0.300 0.01152 14.20 14.10 0.0028 0.011 0.15 1.7 26. 174.5 0.3 0. 0.000 0.300 0.01153 14.10 14.00 0.0028 0.014 0.11 1.9 20. 185.4 0.2 0. 0.000 0.300 0.01454 14.00 13.90 0.0028 0.014 0.11 1.9 20. 185.4 0.2 0. 0.000 0.300 0.01455 13.90 13.80 0.0028 0.014 0.11 1.9 20. 185.4 0.2 0. 0.000 0.300 0.01456 13.80 13.70 0.0028 0.014 0.11 1.9 20. 185.4 0.2 0. 0.000 0.300 0.01457 13.70 13.60 0.0028 0.014 0.11 1.9 20. 185.4 0.2 0. 0.000 0.300 0.01458 13.60 13.50 0.0028 0.014 0.11 1.9 20. 185.4 0.2 0. 0.000 0.300 0.01459 13.50 13.40 0.0028 0.014 0.11 1.9 20. 185.4 0.2 0. 0.000 0.300 0.01460 13.40 13.30 0.0028 0.014 0.11 1.9 20. 185.4 0.2 0. 0.000 0.300 0.01461 13.30 13.20 0.0028 0.014 0.11 1.9 20. 185.4 0.2 0. 0.000 0.300 0.01462 13.20 13.10 0.0028 0.014 0.11 1.9 20. 185.4 0.2 0. 0.000 0.300 0.01463 13.10 13.00 0.0028 0.014 0.11 1.9 20. 185.4 0.2 0. 0.000 0.300 0.014
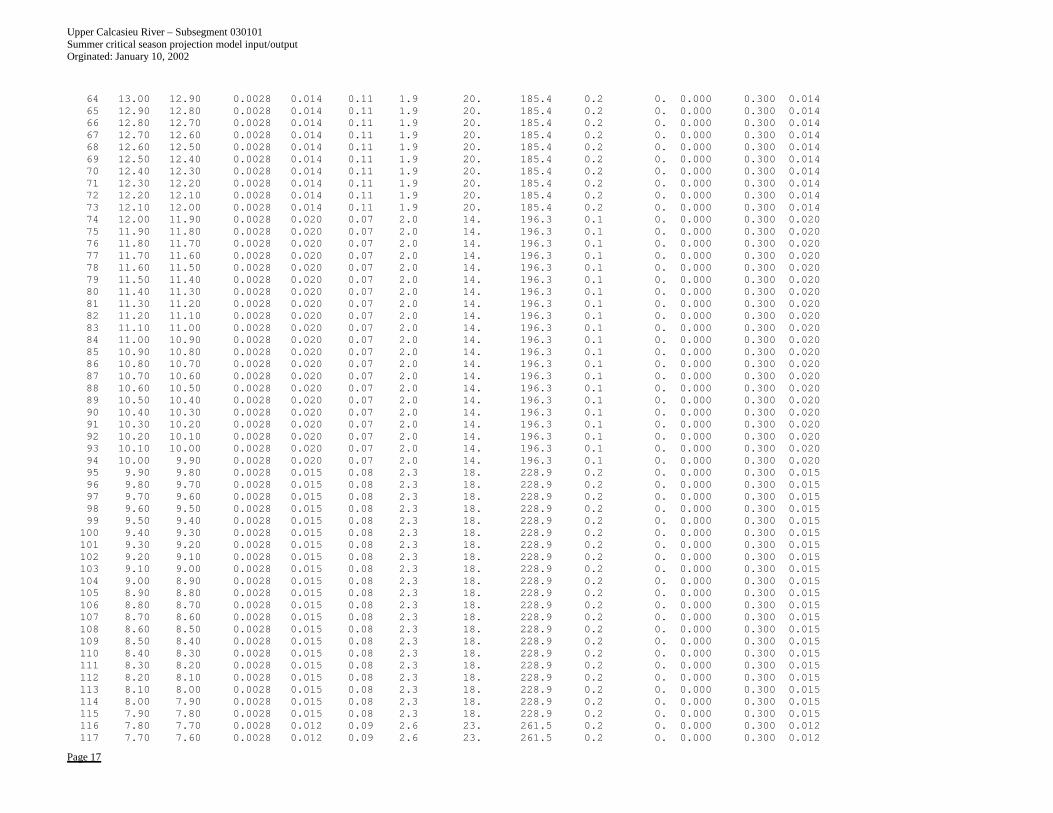
Upper Calcasieu River – Subsegment 030101 Summer critical season projection model input/output Orginated: January 10, 2002
Page 17
64 13.00 12.90 0.0028 0.014 0.11 1.9 20. 185.4 0.2 0. 0.000 0.300 0.01465 12.90 12.80 0.0028 0.014 0.11 1.9 20. 185.4 0.2 0. 0.000 0.300 0.01466 12.80 12.70 0.0028 0.014 0.11 1.9 20. 185.4 0.2 0. 0.000 0.300 0.01467 12.70 12.60 0.0028 0.014 0.11 1.9 20. 185.4 0.2 0. 0.000 0.300 0.01468 12.60 12.50 0.0028 0.014 0.11 1.9 20. 185.4 0.2 0. 0.000 0.300 0.01469 12.50 12.40 0.0028 0.014 0.11 1.9 20. 185.4 0.2 0. 0.000 0.300 0.01470 12.40 12.30 0.0028 0.014 0.11 1.9 20. 185.4 0.2 0. 0.000 0.300 0.01471 12.30 12.20 0.0028 0.014 0.11 1.9 20. 185.4 0.2 0. 0.000 0.300 0.01472 12.20 12.10 0.0028 0.014 0.11 1.9 20. 185.4 0.2 0. 0.000 0.300 0.01473 12.10 12.00 0.0028 0.014 0.11 1.9 20. 185.4 0.2 0. 0.000 0.300 0.01474 12.00 11.90 0.0028 0.020 0.07 2.0 14. 196.3 0.1 0. 0.000 0.300 0.02075 11.90 11.80 0.0028 0.020 0.07 2.0 14. 196.3 0.1 0. 0.000 0.300 0.02076 11.80 11.70 0.0028 0.020 0.07 2.0 14. 196.3 0.1 0. 0.000 0.300 0.02077 11.70 11.60 0.0028 0.020 0.07 2.0 14. 196.3 0.1 0. 0.000 0.300 0.02078 11.60 11.50 0.0028 0.020 0.07 2.0 14. 196.3 0.1 0. 0.000 0.300 0.02079 11.50 11.40 0.0028 0.020 0.07 2.0 14. 196.3 0.1 0. 0.000 0.300 0.02080 11.40 11.30 0.0028 0.020 0.07 2.0 14. 196.3 0.1 0. 0.000 0.300 0.02081 11.30 11.20 0.0028 0.020 0.07 2.0 14. 196.3 0.1 0. 0.000 0.300 0.02082 11.20 11.10 0.0028 0.020 0.07 2.0 14. 196.3 0.1 0. 0.000 0.300 0.02083 11.10 11.00 0.0028 0.020 0.07 2.0 14. 196.3 0.1 0. 0.000 0.300 0.02084 11.00 10.90 0.0028 0.020 0.07 2.0 14. 196.3 0.1 0. 0.000 0.300 0.02085 10.90 10.80 0.0028 0.020 0.07 2.0 14. 196.3 0.1 0. 0.000 0.300 0.02086 10.80 10.70 0.0028 0.020 0.07 2.0 14. 196.3 0.1 0. 0.000 0.300 0.02087 10.70 10.60 0.0028 0.020 0.07 2.0 14. 196.3 0.1 0. 0.000 0.300 0.02088 10.60 10.50 0.0028 0.020 0.07 2.0 14. 196.3 0.1 0. 0.000 0.300 0.02089 10.50 10.40 0.0028 0.020 0.07 2.0 14. 196.3 0.1 0. 0.000 0.300 0.02090 10.40 10.30 0.0028 0.020 0.07 2.0 14. 196.3 0.1 0. 0.000 0.300 0.02091 10.30 10.20 0.0028 0.020 0.07 2.0 14. 196.3 0.1 0. 0.000 0.300 0.02092 10.20 10.10 0.0028 0.020 0.07 2.0 14. 196.3 0.1 0. 0.000 0.300 0.02093 10.10 10.00 0.0028 0.020 0.07 2.0 14. 196.3 0.1 0. 0.000 0.300 0.02094 10.00 9.90 0.0028 0.020 0.07 2.0 14. 196.3 0.1 0. 0.000 0.300 0.02095 9.90 9.80 0.0028 0.015 0.08 2.3 18. 228.9 0.2 0. 0.000 0.300 0.01596 9.80 9.70 0.0028 0.015 0.08 2.3 18. 228.9 0.2 0. 0.000 0.300 0.01597 9.70 9.60 0.0028 0.015 0.08 2.3 18. 228.9 0.2 0. 0.000 0.300 0.01598 9.60 9.50 0.0028 0.015 0.08 2.3 18. 228.9 0.2 0. 0.000 0.300 0.01599 9.50 9.40 0.0028 0.015 0.08 2.3 18. 228.9 0.2 0. 0.000 0.300 0.015100 9.40 9.30 0.0028 0.015 0.08 2.3 18. 228.9 0.2 0. 0.000 0.300 0.015101 9.30 9.20 0.0028 0.015 0.08 2.3 18. 228.9 0.2 0. 0.000 0.300 0.015102 9.20 9.10 0.0028 0.015 0.08 2.3 18. 228.9 0.2 0. 0.000 0.300 0.015103 9.10 9.00 0.0028 0.015 0.08 2.3 18. 228.9 0.2 0. 0.000 0.300 0.015104 9.00 8.90 0.0028 0.015 0.08 2.3 18. 228.9 0.2 0. 0.000 0.300 0.015105 8.90 8.80 0.0028 0.015 0.08 2.3 18. 228.9 0.2 0. 0.000 0.300 0.015106 8.80 8.70 0.0028 0.015 0.08 2.3 18. 228.9 0.2 0. 0.000 0.300 0.015107 8.70 8.60 0.0028 0.015 0.08 2.3 18. 228.9 0.2 0. 0.000 0.300 0.015108 8.60 8.50 0.0028 0.015 0.08 2.3 18. 228.9 0.2 0. 0.000 0.300 0.015109 8.50 8.40 0.0028 0.015 0.08 2.3 18. 228.9 0.2 0. 0.000 0.300 0.015110 8.40 8.30 0.0028 0.015 0.08 2.3 18. 228.9 0.2 0. 0.000 0.300 0.015111 8.30 8.20 0.0028 0.015 0.08 2.3 18. 228.9 0.2 0. 0.000 0.300 0.015112 8.20 8.10 0.0028 0.015 0.08 2.3 18. 228.9 0.2 0. 0.000 0.300 0.015113 8.10 8.00 0.0028 0.015 0.08 2.3 18. 228.9 0.2 0. 0.000 0.300 0.015114 8.00 7.90 0.0028 0.015 0.08 2.3 18. 228.9 0.2 0. 0.000 0.300 0.015115 7.90 7.80 0.0028 0.015 0.08 2.3 18. 228.9 0.2 0. 0.000 0.300 0.015116 7.80 7.70 0.0028 0.012 0.09 2.6 23. 261.5 0.2 0. 0.000 0.300 0.012117 7.70 7.60 0.0028 0.012 0.09 2.6 23. 261.5 0.2 0. 0.000 0.300 0.012
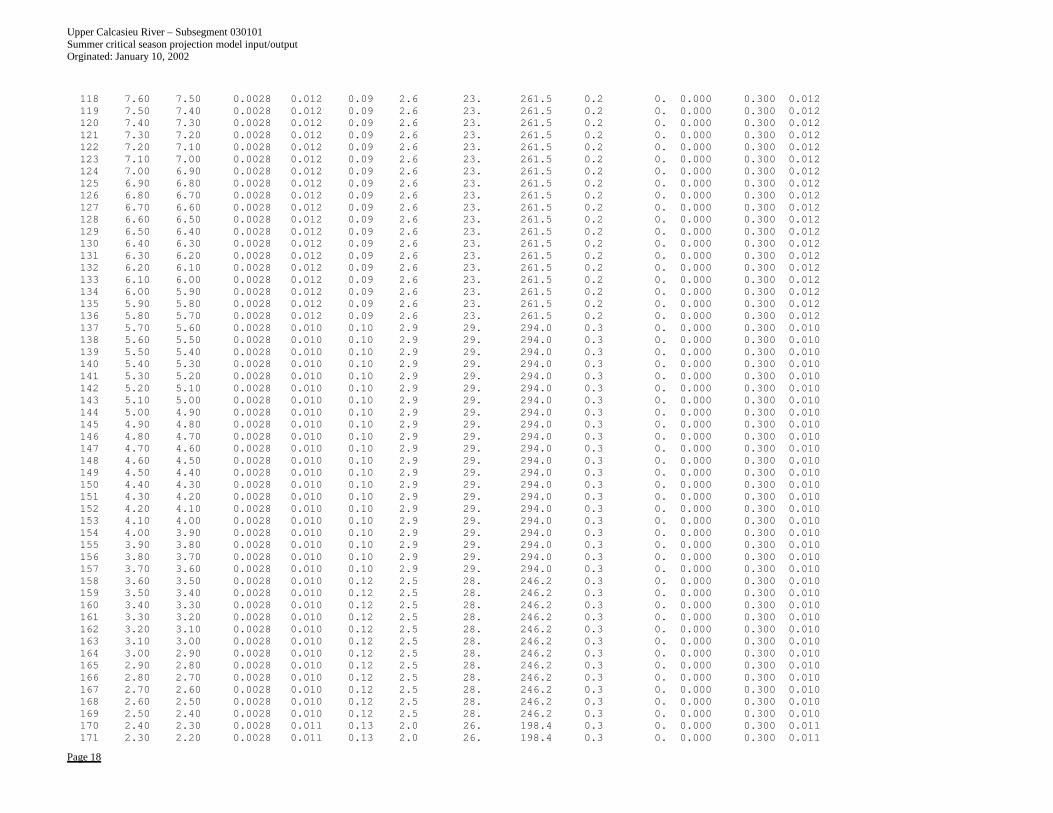
Upper Calcasieu River – Subsegment 030101 Summer critical season projection model input/output Orginated: January 10, 2002
Page 18
118 7.60 7.50 0.0028 0.012 0.09 2.6 23. 261.5 0.2 0. 0.000 0.300 0.012119 7.50 7.40 0.0028 0.012 0.09 2.6 23. 261.5 0.2 0. 0.000 0.300 0.012120 7.40 7.30 0.0028 0.012 0.09 2.6 23. 261.5 0.2 0. 0.000 0.300 0.012121 7.30 7.20 0.0028 0.012 0.09 2.6 23. 261.5 0.2 0. 0.000 0.300 0.012122 7.20 7.10 0.0028 0.012 0.09 2.6 23. 261.5 0.2 0. 0.000 0.300 0.012123 7.10 7.00 0.0028 0.012 0.09 2.6 23. 261.5 0.2 0. 0.000 0.300 0.012124 7.00 6.90 0.0028 0.012 0.09 2.6 23. 261.5 0.2 0. 0.000 0.300 0.012125 6.90 6.80 0.0028 0.012 0.09 2.6 23. 261.5 0.2 0. 0.000 0.300 0.012126 6.80 6.70 0.0028 0.012 0.09 2.6 23. 261.5 0.2 0. 0.000 0.300 0.012127 6.70 6.60 0.0028 0.012 0.09 2.6 23. 261.5 0.2 0. 0.000 0.300 0.012128 6.60 6.50 0.0028 0.012 0.09 2.6 23. 261.5 0.2 0. 0.000 0.300 0.012129 6.50 6.40 0.0028 0.012 0.09 2.6 23. 261.5 0.2 0. 0.000 0.300 0.012130 6.40 6.30 0.0028 0.012 0.09 2.6 23. 261.5 0.2 0. 0.000 0.300 0.012131 6.30 6.20 0.0028 0.012 0.09 2.6 23. 261.5 0.2 0. 0.000 0.300 0.012132 6.20 6.10 0.0028 0.012 0.09 2.6 23. 261.5 0.2 0. 0.000 0.300 0.012133 6.10 6.00 0.0028 0.012 0.09 2.6 23. 261.5 0.2 0. 0.000 0.300 0.012134 6.00 5.90 0.0028 0.012 0.09 2.6 23. 261.5 0.2 0. 0.000 0.300 0.012135 5.90 5.80 0.0028 0.012 0.09 2.6 23. 261.5 0.2 0. 0.000 0.300 0.012136 5.80 5.70 0.0028 0.012 0.09 2.6 23. 261.5 0.2 0. 0.000 0.300 0.012137 5.70 5.60 0.0028 0.010 0.10 2.9 29. 294.0 0.3 0. 0.000 0.300 0.010138 5.60 5.50 0.0028 0.010 0.10 2.9 29. 294.0 0.3 0. 0.000 0.300 0.010139 5.50 5.40 0.0028 0.010 0.10 2.9 29. 294.0 0.3 0. 0.000 0.300 0.010140 5.40 5.30 0.0028 0.010 0.10 2.9 29. 294.0 0.3 0. 0.000 0.300 0.010141 5.30 5.20 0.0028 0.010 0.10 2.9 29. 294.0 0.3 0. 0.000 0.300 0.010142 5.20 5.10 0.0028 0.010 0.10 2.9 29. 294.0 0.3 0. 0.000 0.300 0.010143 5.10 5.00 0.0028 0.010 0.10 2.9 29. 294.0 0.3 0. 0.000 0.300 0.010144 5.00 4.90 0.0028 0.010 0.10 2.9 29. 294.0 0.3 0. 0.000 0.300 0.010145 4.90 4.80 0.0028 0.010 0.10 2.9 29. 294.0 0.3 0. 0.000 0.300 0.010146 4.80 4.70 0.0028 0.010 0.10 2.9 29. 294.0 0.3 0. 0.000 0.300 0.010147 4.70 4.60 0.0028 0.010 0.10 2.9 29. 294.0 0.3 0. 0.000 0.300 0.010148 4.60 4.50 0.0028 0.010 0.10 2.9 29. 294.0 0.3 0. 0.000 0.300 0.010149 4.50 4.40 0.0028 0.010 0.10 2.9 29. 294.0 0.3 0. 0.000 0.300 0.010150 4.40 4.30 0.0028 0.010 0.10 2.9 29. 294.0 0.3 0. 0.000 0.300 0.010151 4.30 4.20 0.0028 0.010 0.10 2.9 29. 294.0 0.3 0. 0.000 0.300 0.010152 4.20 4.10 0.0028 0.010 0.10 2.9 29. 294.0 0.3 0. 0.000 0.300 0.010153 4.10 4.00 0.0028 0.010 0.10 2.9 29. 294.0 0.3 0. 0.000 0.300 0.010154 4.00 3.90 0.0028 0.010 0.10 2.9 29. 294.0 0.3 0. 0.000 0.300 0.010155 3.90 3.80 0.0028 0.010 0.10 2.9 29. 294.0 0.3 0. 0.000 0.300 0.010156 3.80 3.70 0.0028 0.010 0.10 2.9 29. 294.0 0.3 0. 0.000 0.300 0.010157 3.70 3.60 0.0028 0.010 0.10 2.9 29. 294.0 0.3 0. 0.000 0.300 0.010158 3.60 3.50 0.0028 0.010 0.12 2.5 28. 246.2 0.3 0. 0.000 0.300 0.010159 3.50 3.40 0.0028 0.010 0.12 2.5 28. 246.2 0.3 0. 0.000 0.300 0.010160 3.40 3.30 0.0028 0.010 0.12 2.5 28. 246.2 0.3 0. 0.000 0.300 0.010161 3.30 3.20 0.0028 0.010 0.12 2.5 28. 246.2 0.3 0. 0.000 0.300 0.010162 3.20 3.10 0.0028 0.010 0.12 2.5 28. 246.2 0.3 0. 0.000 0.300 0.010163 3.10 3.00 0.0028 0.010 0.12 2.5 28. 246.2 0.3 0. 0.000 0.300 0.010164 3.00 2.90 0.0028 0.010 0.12 2.5 28. 246.2 0.3 0. 0.000 0.300 0.010165 2.90 2.80 0.0028 0.010 0.12 2.5 28. 246.2 0.3 0. 0.000 0.300 0.010166 2.80 2.70 0.0028 0.010 0.12 2.5 28. 246.2 0.3 0. 0.000 0.300 0.010167 2.70 2.60 0.0028 0.010 0.12 2.5 28. 246.2 0.3 0. 0.000 0.300 0.010168 2.60 2.50 0.0028 0.010 0.12 2.5 28. 246.2 0.3 0. 0.000 0.300 0.010169 2.50 2.40 0.0028 0.010 0.12 2.5 28. 246.2 0.3 0. 0.000 0.300 0.010170 2.40 2.30 0.0028 0.011 0.13 2.0 26. 198.4 0.3 0. 0.000 0.300 0.011171 2.30 2.20 0.0028 0.011 0.13 2.0 26. 198.4 0.3 0. 0.000 0.300 0.011
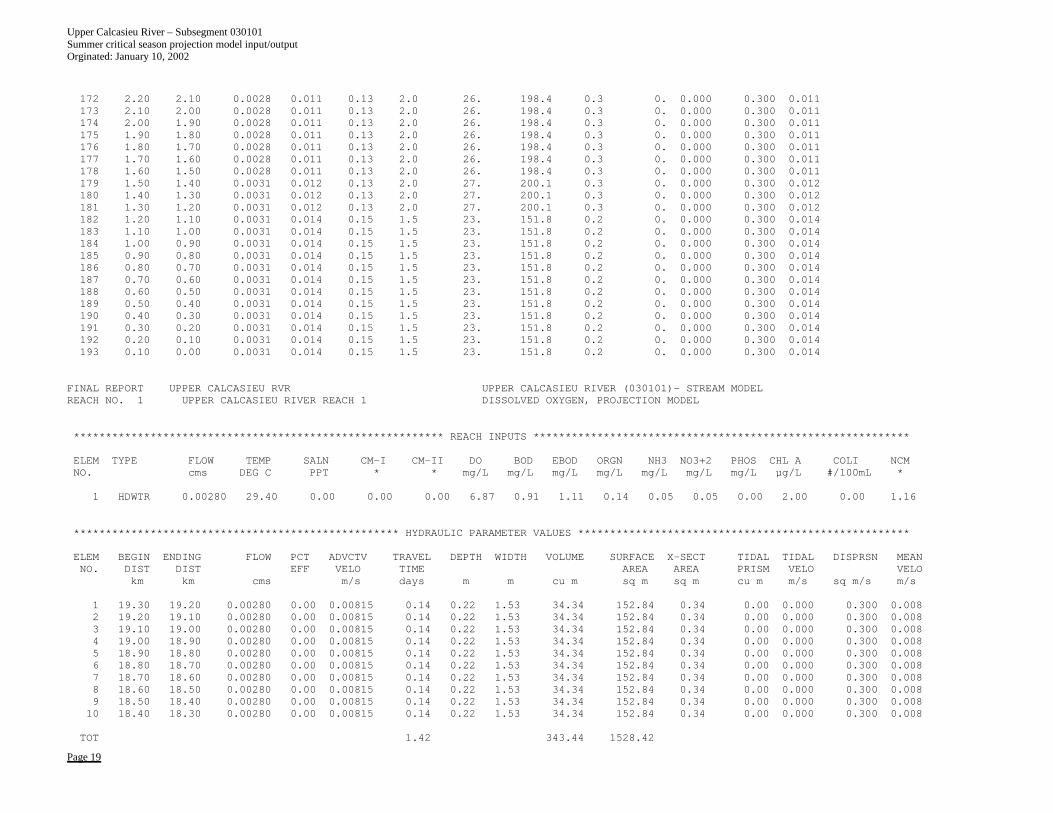
Upper Calcasieu River – Subsegment 030101 Summer critical season projection model input/output Orginated: January 10, 2002
Page 19
172 2.20 2.10 0.0028 0.011 0.13 2.0 26. 198.4 0.3 0. 0.000 0.300 0.011173 2.10 2.00 0.0028 0.011 0.13 2.0 26. 198.4 0.3 0. 0.000 0.300 0.011174 2.00 1.90 0.0028 0.011 0.13 2.0 26. 198.4 0.3 0. 0.000 0.300 0.011175 1.90 1.80 0.0028 0.011 0.13 2.0 26. 198.4 0.3 0. 0.000 0.300 0.011176 1.80 1.70 0.0028 0.011 0.13 2.0 26. 198.4 0.3 0. 0.000 0.300 0.011177 1.70 1.60 0.0028 0.011 0.13 2.0 26. 198.4 0.3 0. 0.000 0.300 0.011178 1.60 1.50 0.0028 0.011 0.13 2.0 26. 198.4 0.3 0. 0.000 0.300 0.011179 1.50 1.40 0.0031 0.012 0.13 2.0 27. 200.1 0.3 0. 0.000 0.300 0.012180 1.40 1.30 0.0031 0.012 0.13 2.0 27. 200.1 0.3 0. 0.000 0.300 0.012181 1.30 1.20 0.0031 0.012 0.13 2.0 27. 200.1 0.3 0. 0.000 0.300 0.012182 1.20 1.10 0.0031 0.014 0.15 1.5 23. 151.8 0.2 0. 0.000 0.300 0.014183 1.10 1.00 0.0031 0.014 0.15 1.5 23. 151.8 0.2 0. 0.000 0.300 0.014184 1.00 0.90 0.0031 0.014 0.15 1.5 23. 151.8 0.2 0. 0.000 0.300 0.014185 0.90 0.80 0.0031 0.014 0.15 1.5 23. 151.8 0.2 0. 0.000 0.300 0.014186 0.80 0.70 0.0031 0.014 0.15 1.5 23. 151.8 0.2 0. 0.000 0.300 0.014187 0.70 0.60 0.0031 0.014 0.15 1.5 23. 151.8 0.2 0. 0.000 0.300 0.014188 0.60 0.50 0.0031 0.014 0.15 1.5 23. 151.8 0.2 0. 0.000 0.300 0.014189 0.50 0.40 0.0031 0.014 0.15 1.5 23. 151.8 0.2 0. 0.000 0.300 0.014190 0.40 0.30 0.0031 0.014 0.15 1.5 23. 151.8 0.2 0. 0.000 0.300 0.014191 0.30 0.20 0.0031 0.014 0.15 1.5 23. 151.8 0.2 0. 0.000 0.300 0.014192 0.20 0.10 0.0031 0.014 0.15 1.5 23. 151.8 0.2 0. 0.000 0.300 0.014193 0.10 0.00 0.0031 0.014 0.15 1.5 23. 151.8 0.2 0. 0.000 0.300 0.014
FINAL REPORT UPPER CALCASIEU RVR UPPER CALCASIEU RIVER (030101)- STREAM MODELREACH NO. 1 UPPER CALCASIEU RIVER REACH 1 DISSOLVED OXYGEN, PROJECTION MODEL
********************************************************** REACH INPUTS ***********************************************************
ELEM TYPE FLOW TEMP SALN CM-I CM-II DO BOD EBOD ORGN NH3 NO3+2 PHOS CHL A COLI NCMNO. cms DEG C PPT * * mg/L mg/L mg/L mg/L mg/L mg/L mg/L µg/L #/100mL *
1 HDWTR 0.00280 29.40 0.00 0.00 0.00 6.87 0.91 1.11 0.14 0.05 0.05 0.00 2.00 0.00 1.16
*************************************************** HYDRAULIC PARAMETER VALUES ****************************************************
ELEM BEGIN ENDING FLOW PCT ADVCTV TRAVEL DEPTH WIDTH VOLUME SURFACE X-SECT TIDAL TIDAL DISPRSN MEANNO. DIST DIST EFF VELO TIME AREA AREA PRISM VELO VELO
km km cms m/s days m m cu m sq m sq m cu m m/s sq m/s m/s
1 19.30 19.20 0.00280 0.00 0.00815 0.14 0.22 1.53 34.34 152.84 0.34 0.00 0.000 0.300 0.0082 19.20 19.10 0.00280 0.00 0.00815 0.14 0.22 1.53 34.34 152.84 0.34 0.00 0.000 0.300 0.0083 19.10 19.00 0.00280 0.00 0.00815 0.14 0.22 1.53 34.34 152.84 0.34 0.00 0.000 0.300 0.0084 19.00 18.90 0.00280 0.00 0.00815 0.14 0.22 1.53 34.34 152.84 0.34 0.00 0.000 0.300 0.0085 18.90 18.80 0.00280 0.00 0.00815 0.14 0.22 1.53 34.34 152.84 0.34 0.00 0.000 0.300 0.0086 18.80 18.70 0.00280 0.00 0.00815 0.14 0.22 1.53 34.34 152.84 0.34 0.00 0.000 0.300 0.0087 18.70 18.60 0.00280 0.00 0.00815 0.14 0.22 1.53 34.34 152.84 0.34 0.00 0.000 0.300 0.0088 18.60 18.50 0.00280 0.00 0.00815 0.14 0.22 1.53 34.34 152.84 0.34 0.00 0.000 0.300 0.0089 18.50 18.40 0.00280 0.00 0.00815 0.14 0.22 1.53 34.34 152.84 0.34 0.00 0.000 0.300 0.00810 18.40 18.30 0.00280 0.00 0.00815 0.14 0.22 1.53 34.34 152.84 0.34 0.00 0.000 0.300 0.008
TOT 1.42 343.44 1528.42
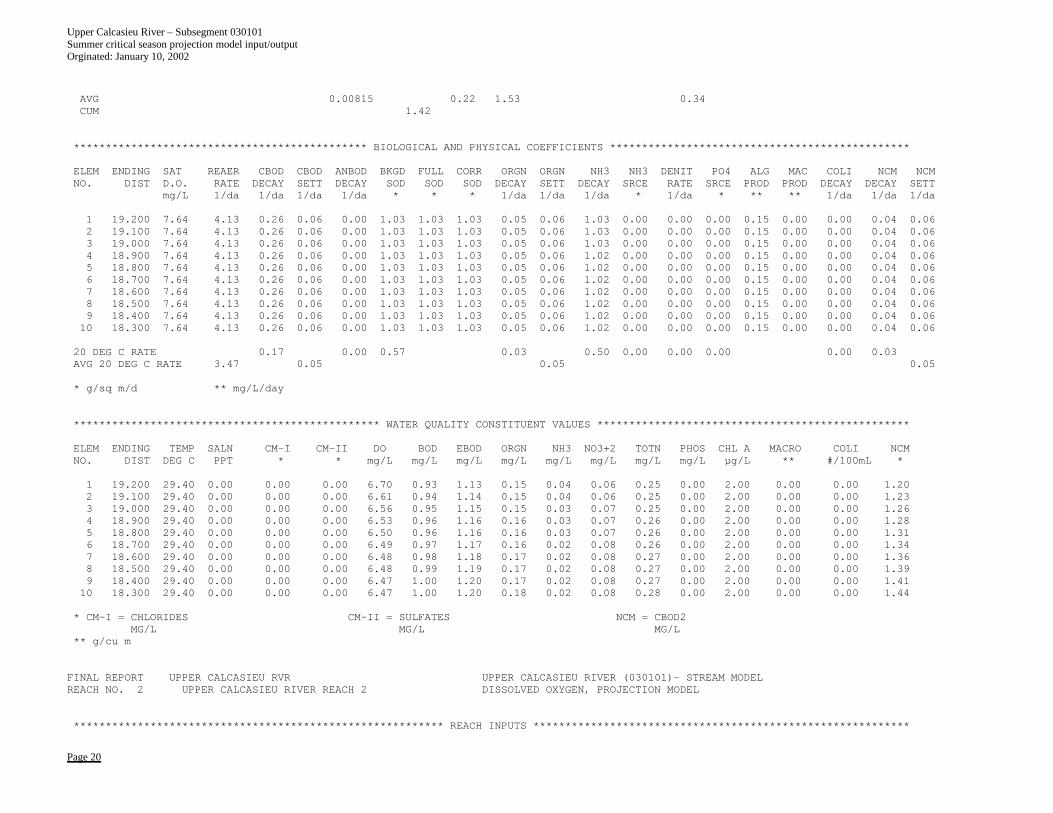
Upper Calcasieu River – Subsegment 030101 Summer critical season projection model input/output Orginated: January 10, 2002
Page 20
AVG 0.00815 0.22 1.53 0.34CUM 1.42
********************************************** BIOLOGICAL AND PHYSICAL COEFFICIENTS ***********************************************
ELEM ENDING SAT REAER CBOD CBOD ANBOD BKGD FULL CORR ORGN ORGN NH3 NH3 DENIT PO4 ALG MAC COLI NCM NCMNO. DIST D.O. RATE DECAY SETT DECAY SOD SOD SOD DECAY SETT DECAY SRCE RATE SRCE PROD PROD DECAY DECAY SETT
mg/L 1/da 1/da 1/da 1/da * * * 1/da 1/da 1/da * 1/da * ** ** 1/da 1/da 1/da
1 19.200 7.64 4.13 0.26 0.06 0.00 1.03 1.03 1.03 0.05 0.06 1.03 0.00 0.00 0.00 0.15 0.00 0.00 0.04 0.062 19.100 7.64 4.13 0.26 0.06 0.00 1.03 1.03 1.03 0.05 0.06 1.03 0.00 0.00 0.00 0.15 0.00 0.00 0.04 0.063 19.000 7.64 4.13 0.26 0.06 0.00 1.03 1.03 1.03 0.05 0.06 1.03 0.00 0.00 0.00 0.15 0.00 0.00 0.04 0.064 18.900 7.64 4.13 0.26 0.06 0.00 1.03 1.03 1.03 0.05 0.06 1.02 0.00 0.00 0.00 0.15 0.00 0.00 0.04 0.065 18.800 7.64 4.13 0.26 0.06 0.00 1.03 1.03 1.03 0.05 0.06 1.02 0.00 0.00 0.00 0.15 0.00 0.00 0.04 0.066 18.700 7.64 4.13 0.26 0.06 0.00 1.03 1.03 1.03 0.05 0.06 1.02 0.00 0.00 0.00 0.15 0.00 0.00 0.04 0.067 18.600 7.64 4.13 0.26 0.06 0.00 1.03 1.03 1.03 0.05 0.06 1.02 0.00 0.00 0.00 0.15 0.00 0.00 0.04 0.068 18.500 7.64 4.13 0.26 0.06 0.00 1.03 1.03 1.03 0.05 0.06 1.02 0.00 0.00 0.00 0.15 0.00 0.00 0.04 0.069 18.400 7.64 4.13 0.26 0.06 0.00 1.03 1.03 1.03 0.05 0.06 1.02 0.00 0.00 0.00 0.15 0.00 0.00 0.04 0.0610 18.300 7.64 4.13 0.26 0.06 0.00 1.03 1.03 1.03 0.05 0.06 1.02 0.00 0.00 0.00 0.15 0.00 0.00 0.04 0.06
20 DEG C RATE 0.17 0.00 0.57 0.03 0.50 0.00 0.00 0.00 0.00 0.03AVG 20 DEG C RATE 3.47 0.05 0.05 0.05
* g/sq m/d ** mg/L/day
************************************************ WATER QUALITY CONSTITUENT VALUES *************************************************
ELEM ENDING TEMP SALN CM-I CM-II DO BOD EBOD ORGN NH3 NO3+2 TOTN PHOS CHL A MACRO COLI NCMNO. DIST DEG C PPT * * mg/L mg/L mg/L mg/L mg/L mg/L mg/L mg/L µg/L ** #/100mL *
1 19.200 29.40 0.00 0.00 0.00 6.70 0.93 1.13 0.15 0.04 0.06 0.25 0.00 2.00 0.00 0.00 1.202 19.100 29.40 0.00 0.00 0.00 6.61 0.94 1.14 0.15 0.04 0.06 0.25 0.00 2.00 0.00 0.00 1.233 19.000 29.40 0.00 0.00 0.00 6.56 0.95 1.15 0.15 0.03 0.07 0.25 0.00 2.00 0.00 0.00 1.264 18.900 29.40 0.00 0.00 0.00 6.53 0.96 1.16 0.16 0.03 0.07 0.26 0.00 2.00 0.00 0.00 1.285 18.800 29.40 0.00 0.00 0.00 6.50 0.96 1.16 0.16 0.03 0.07 0.26 0.00 2.00 0.00 0.00 1.316 18.700 29.40 0.00 0.00 0.00 6.49 0.97 1.17 0.16 0.02 0.08 0.26 0.00 2.00 0.00 0.00 1.347 18.600 29.40 0.00 0.00 0.00 6.48 0.98 1.18 0.17 0.02 0.08 0.27 0.00 2.00 0.00 0.00 1.368 18.500 29.40 0.00 0.00 0.00 6.48 0.99 1.19 0.17 0.02 0.08 0.27 0.00 2.00 0.00 0.00 1.399 18.400 29.40 0.00 0.00 0.00 6.47 1.00 1.20 0.17 0.02 0.08 0.27 0.00 2.00 0.00 0.00 1.4110 18.300 29.40 0.00 0.00 0.00 6.47 1.00 1.20 0.18 0.02 0.08 0.28 0.00 2.00 0.00 0.00 1.44
* CM-I = CHLORIDES CM-II = SULFATES NCM = CBOD2MG/L MG/L MG/L
** g/cu m
FINAL REPORT UPPER CALCASIEU RVR UPPER CALCASIEU RIVER (030101)- STREAM MODELREACH NO. 2 UPPER CALCASIEU RIVER REACH 2 DISSOLVED OXYGEN, PROJECTION MODEL
********************************************************** REACH INPUTS ***********************************************************
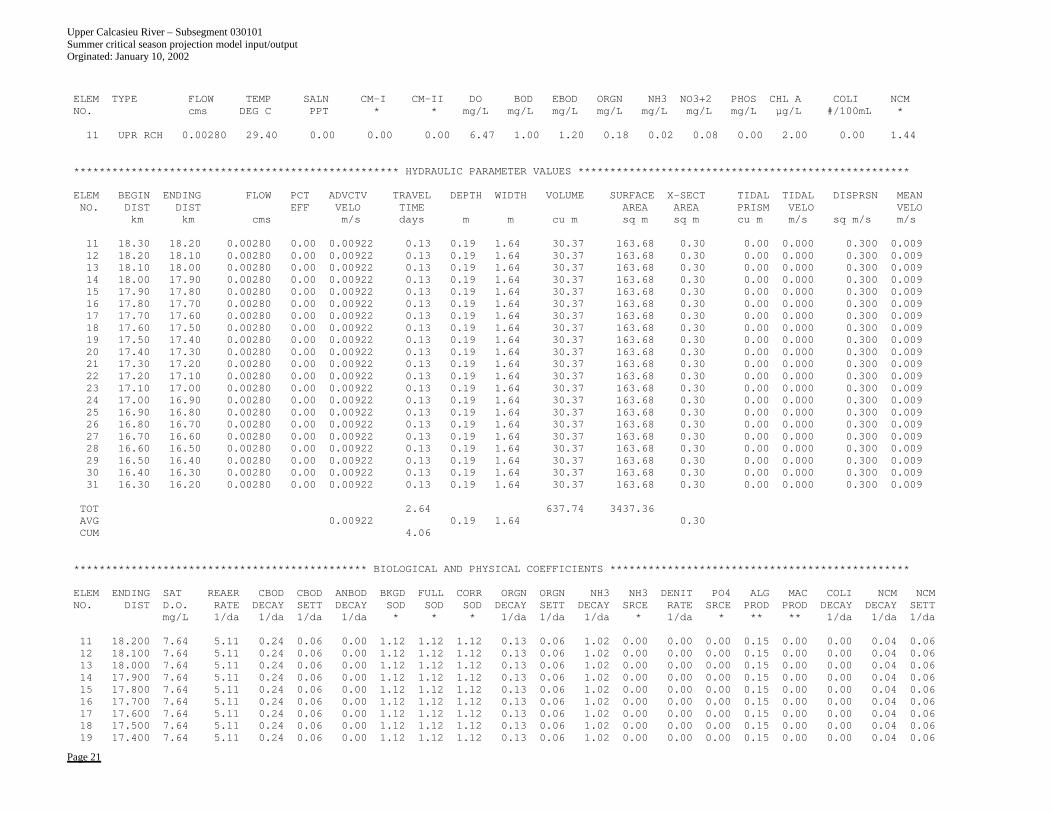
Upper Calcasieu River – Subsegment 030101 Summer critical season projection model input/output Orginated: January 10, 2002
Page 21
ELEM TYPE FLOW TEMP SALN CM-I CM-II DO BOD EBOD ORGN NH3 NO3+2 PHOS CHL A COLI NCMNO. cms DEG C PPT * * mg/L mg/L mg/L mg/L mg/L mg/L mg/L µg/L #/100mL *
11 UPR RCH 0.00280 29.40 0.00 0.00 0.00 6.47 1.00 1.20 0.18 0.02 0.08 0.00 2.00 0.00 1.44
*************************************************** HYDRAULIC PARAMETER VALUES ****************************************************
ELEM BEGIN ENDING FLOW PCT ADVCTV TRAVEL DEPTH WIDTH VOLUME SURFACE X-SECT TIDAL TIDAL DISPRSN MEANNO. DIST DIST EFF VELO TIME AREA AREA PRISM VELO VELO
km km cms m/s days m m cu m sq m sq m cu m m/s sq m/s m/s
11 18.30 18.20 0.00280 0.00 0.00922 0.13 0.19 1.64 30.37 163.68 0.30 0.00 0.000 0.300 0.00912 18.20 18.10 0.00280 0.00 0.00922 0.13 0.19 1.64 30.37 163.68 0.30 0.00 0.000 0.300 0.00913 18.10 18.00 0.00280 0.00 0.00922 0.13 0.19 1.64 30.37 163.68 0.30 0.00 0.000 0.300 0.00914 18.00 17.90 0.00280 0.00 0.00922 0.13 0.19 1.64 30.37 163.68 0.30 0.00 0.000 0.300 0.00915 17.90 17.80 0.00280 0.00 0.00922 0.13 0.19 1.64 30.37 163.68 0.30 0.00 0.000 0.300 0.00916 17.80 17.70 0.00280 0.00 0.00922 0.13 0.19 1.64 30.37 163.68 0.30 0.00 0.000 0.300 0.00917 17.70 17.60 0.00280 0.00 0.00922 0.13 0.19 1.64 30.37 163.68 0.30 0.00 0.000 0.300 0.00918 17.60 17.50 0.00280 0.00 0.00922 0.13 0.19 1.64 30.37 163.68 0.30 0.00 0.000 0.300 0.00919 17.50 17.40 0.00280 0.00 0.00922 0.13 0.19 1.64 30.37 163.68 0.30 0.00 0.000 0.300 0.00920 17.40 17.30 0.00280 0.00 0.00922 0.13 0.19 1.64 30.37 163.68 0.30 0.00 0.000 0.300 0.00921 17.30 17.20 0.00280 0.00 0.00922 0.13 0.19 1.64 30.37 163.68 0.30 0.00 0.000 0.300 0.00922 17.20 17.10 0.00280 0.00 0.00922 0.13 0.19 1.64 30.37 163.68 0.30 0.00 0.000 0.300 0.00923 17.10 17.00 0.00280 0.00 0.00922 0.13 0.19 1.64 30.37 163.68 0.30 0.00 0.000 0.300 0.00924 17.00 16.90 0.00280 0.00 0.00922 0.13 0.19 1.64 30.37 163.68 0.30 0.00 0.000 0.300 0.00925 16.90 16.80 0.00280 0.00 0.00922 0.13 0.19 1.64 30.37 163.68 0.30 0.00 0.000 0.300 0.00926 16.80 16.70 0.00280 0.00 0.00922 0.13 0.19 1.64 30.37 163.68 0.30 0.00 0.000 0.300 0.00927 16.70 16.60 0.00280 0.00 0.00922 0.13 0.19 1.64 30.37 163.68 0.30 0.00 0.000 0.300 0.00928 16.60 16.50 0.00280 0.00 0.00922 0.13 0.19 1.64 30.37 163.68 0.30 0.00 0.000 0.300 0.00929 16.50 16.40 0.00280 0.00 0.00922 0.13 0.19 1.64 30.37 163.68 0.30 0.00 0.000 0.300 0.00930 16.40 16.30 0.00280 0.00 0.00922 0.13 0.19 1.64 30.37 163.68 0.30 0.00 0.000 0.300 0.00931 16.30 16.20 0.00280 0.00 0.00922 0.13 0.19 1.64 30.37 163.68 0.30 0.00 0.000 0.300 0.009
TOT 2.64 637.74 3437.36AVG 0.00922 0.19 1.64 0.30CUM 4.06
********************************************** BIOLOGICAL AND PHYSICAL COEFFICIENTS ***********************************************
ELEM ENDING SAT REAER CBOD CBOD ANBOD BKGD FULL CORR ORGN ORGN NH3 NH3 DENIT PO4 ALG MAC COLI NCM NCMNO. DIST D.O. RATE DECAY SETT DECAY SOD SOD SOD DECAY SETT DECAY SRCE RATE SRCE PROD PROD DECAY DECAY SETT
mg/L 1/da 1/da 1/da 1/da * * * 1/da 1/da 1/da * 1/da * ** ** 1/da 1/da 1/da
11 18.200 7.64 5.11 0.24 0.06 0.00 1.12 1.12 1.12 0.13 0.06 1.02 0.00 0.00 0.00 0.15 0.00 0.00 0.04 0.0612 18.100 7.64 5.11 0.24 0.06 0.00 1.12 1.12 1.12 0.13 0.06 1.02 0.00 0.00 0.00 0.15 0.00 0.00 0.04 0.0613 18.000 7.64 5.11 0.24 0.06 0.00 1.12 1.12 1.12 0.13 0.06 1.02 0.00 0.00 0.00 0.15 0.00 0.00 0.04 0.0614 17.900 7.64 5.11 0.24 0.06 0.00 1.12 1.12 1.12 0.13 0.06 1.02 0.00 0.00 0.00 0.15 0.00 0.00 0.04 0.0615 17.800 7.64 5.11 0.24 0.06 0.00 1.12 1.12 1.12 0.13 0.06 1.02 0.00 0.00 0.00 0.15 0.00 0.00 0.04 0.0616 17.700 7.64 5.11 0.24 0.06 0.00 1.12 1.12 1.12 0.13 0.06 1.02 0.00 0.00 0.00 0.15 0.00 0.00 0.04 0.0617 17.600 7.64 5.11 0.24 0.06 0.00 1.12 1.12 1.12 0.13 0.06 1.02 0.00 0.00 0.00 0.15 0.00 0.00 0.04 0.0618 17.500 7.64 5.11 0.24 0.06 0.00 1.12 1.12 1.12 0.13 0.06 1.02 0.00 0.00 0.00 0.15 0.00 0.00 0.04 0.0619 17.400 7.64 5.11 0.24 0.06 0.00 1.12 1.12 1.12 0.13 0.06 1.02 0.00 0.00 0.00 0.15 0.00 0.00 0.04 0.06
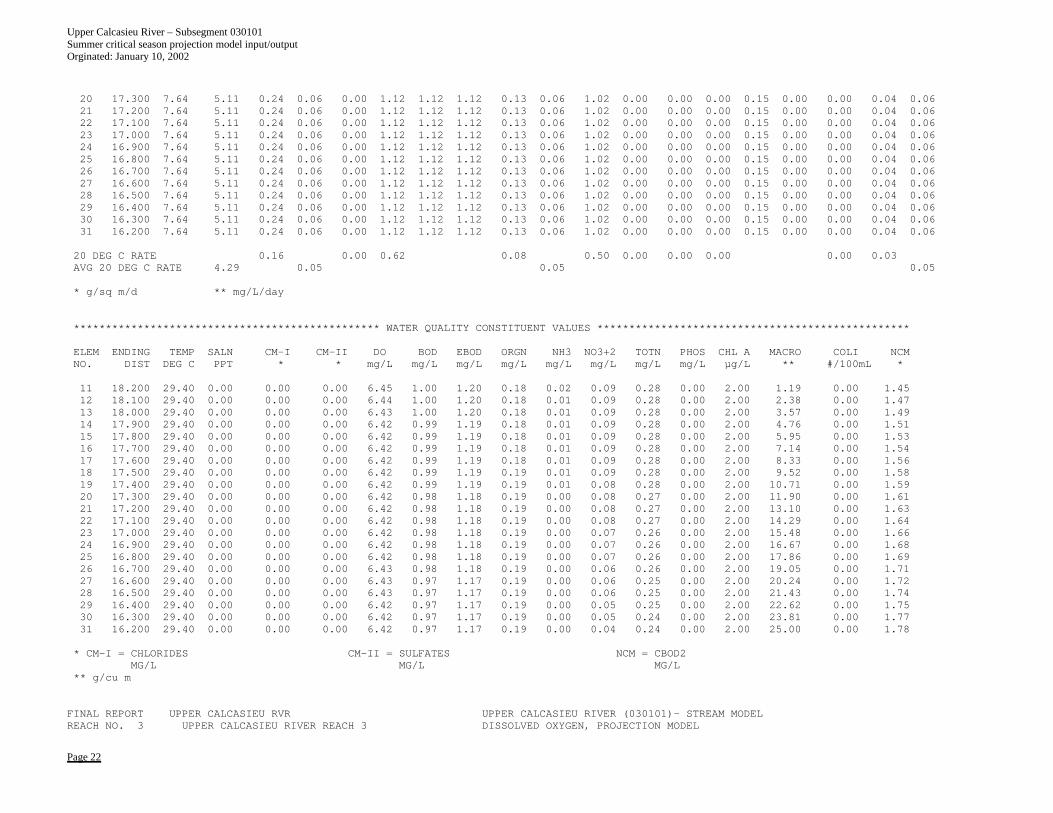
Upper Calcasieu River – Subsegment 030101 Summer critical season projection model input/output Orginated: January 10, 2002
Page 22
20 17.300 7.64 5.11 0.24 0.06 0.00 1.12 1.12 1.12 0.13 0.06 1.02 0.00 0.00 0.00 0.15 0.00 0.00 0.04 0.0621 17.200 7.64 5.11 0.24 0.06 0.00 1.12 1.12 1.12 0.13 0.06 1.02 0.00 0.00 0.00 0.15 0.00 0.00 0.04 0.0622 17.100 7.64 5.11 0.24 0.06 0.00 1.12 1.12 1.12 0.13 0.06 1.02 0.00 0.00 0.00 0.15 0.00 0.00 0.04 0.0623 17.000 7.64 5.11 0.24 0.06 0.00 1.12 1.12 1.12 0.13 0.06 1.02 0.00 0.00 0.00 0.15 0.00 0.00 0.04 0.0624 16.900 7.64 5.11 0.24 0.06 0.00 1.12 1.12 1.12 0.13 0.06 1.02 0.00 0.00 0.00 0.15 0.00 0.00 0.04 0.0625 16.800 7.64 5.11 0.24 0.06 0.00 1.12 1.12 1.12 0.13 0.06 1.02 0.00 0.00 0.00 0.15 0.00 0.00 0.04 0.0626 16.700 7.64 5.11 0.24 0.06 0.00 1.12 1.12 1.12 0.13 0.06 1.02 0.00 0.00 0.00 0.15 0.00 0.00 0.04 0.0627 16.600 7.64 5.11 0.24 0.06 0.00 1.12 1.12 1.12 0.13 0.06 1.02 0.00 0.00 0.00 0.15 0.00 0.00 0.04 0.0628 16.500 7.64 5.11 0.24 0.06 0.00 1.12 1.12 1.12 0.13 0.06 1.02 0.00 0.00 0.00 0.15 0.00 0.00 0.04 0.0629 16.400 7.64 5.11 0.24 0.06 0.00 1.12 1.12 1.12 0.13 0.06 1.02 0.00 0.00 0.00 0.15 0.00 0.00 0.04 0.0630 16.300 7.64 5.11 0.24 0.06 0.00 1.12 1.12 1.12 0.13 0.06 1.02 0.00 0.00 0.00 0.15 0.00 0.00 0.04 0.0631 16.200 7.64 5.11 0.24 0.06 0.00 1.12 1.12 1.12 0.13 0.06 1.02 0.00 0.00 0.00 0.15 0.00 0.00 0.04 0.06
20 DEG C RATE 0.16 0.00 0.62 0.08 0.50 0.00 0.00 0.00 0.00 0.03AVG 20 DEG C RATE 4.29 0.05 0.05 0.05
* g/sq m/d ** mg/L/day
************************************************ WATER QUALITY CONSTITUENT VALUES *************************************************
ELEM ENDING TEMP SALN CM-I CM-II DO BOD EBOD ORGN NH3 NO3+2 TOTN PHOS CHL A MACRO COLI NCMNO. DIST DEG C PPT * * mg/L mg/L mg/L mg/L mg/L mg/L mg/L mg/L µg/L ** #/100mL *
11 18.200 29.40 0.00 0.00 0.00 6.45 1.00 1.20 0.18 0.02 0.09 0.28 0.00 2.00 1.19 0.00 1.4512 18.100 29.40 0.00 0.00 0.00 6.44 1.00 1.20 0.18 0.01 0.09 0.28 0.00 2.00 2.38 0.00 1.4713 18.000 29.40 0.00 0.00 0.00 6.43 1.00 1.20 0.18 0.01 0.09 0.28 0.00 2.00 3.57 0.00 1.4914 17.900 29.40 0.00 0.00 0.00 6.42 0.99 1.19 0.18 0.01 0.09 0.28 0.00 2.00 4.76 0.00 1.5115 17.800 29.40 0.00 0.00 0.00 6.42 0.99 1.19 0.18 0.01 0.09 0.28 0.00 2.00 5.95 0.00 1.5316 17.700 29.40 0.00 0.00 0.00 6.42 0.99 1.19 0.18 0.01 0.09 0.28 0.00 2.00 7.14 0.00 1.5417 17.600 29.40 0.00 0.00 0.00 6.42 0.99 1.19 0.18 0.01 0.09 0.28 0.00 2.00 8.33 0.00 1.5618 17.500 29.40 0.00 0.00 0.00 6.42 0.99 1.19 0.19 0.01 0.09 0.28 0.00 2.00 9.52 0.00 1.5819 17.400 29.40 0.00 0.00 0.00 6.42 0.99 1.19 0.19 0.01 0.08 0.28 0.00 2.00 10.71 0.00 1.5920 17.300 29.40 0.00 0.00 0.00 6.42 0.98 1.18 0.19 0.00 0.08 0.27 0.00 2.00 11.90 0.00 1.6121 17.200 29.40 0.00 0.00 0.00 6.42 0.98 1.18 0.19 0.00 0.08 0.27 0.00 2.00 13.10 0.00 1.6322 17.100 29.40 0.00 0.00 0.00 6.42 0.98 1.18 0.19 0.00 0.08 0.27 0.00 2.00 14.29 0.00 1.6423 17.000 29.40 0.00 0.00 0.00 6.42 0.98 1.18 0.19 0.00 0.07 0.26 0.00 2.00 15.48 0.00 1.6624 16.900 29.40 0.00 0.00 0.00 6.42 0.98 1.18 0.19 0.00 0.07 0.26 0.00 2.00 16.67 0.00 1.6825 16.800 29.40 0.00 0.00 0.00 6.42 0.98 1.18 0.19 0.00 0.07 0.26 0.00 2.00 17.86 0.00 1.6926 16.700 29.40 0.00 0.00 0.00 6.43 0.98 1.18 0.19 0.00 0.06 0.26 0.00 2.00 19.05 0.00 1.7127 16.600 29.40 0.00 0.00 0.00 6.43 0.97 1.17 0.19 0.00 0.06 0.25 0.00 2.00 20.24 0.00 1.7228 16.500 29.40 0.00 0.00 0.00 6.43 0.97 1.17 0.19 0.00 0.06 0.25 0.00 2.00 21.43 0.00 1.7429 16.400 29.40 0.00 0.00 0.00 6.42 0.97 1.17 0.19 0.00 0.05 0.25 0.00 2.00 22.62 0.00 1.7530 16.300 29.40 0.00 0.00 0.00 6.42 0.97 1.17 0.19 0.00 0.05 0.24 0.00 2.00 23.81 0.00 1.7731 16.200 29.40 0.00 0.00 0.00 6.42 0.97 1.17 0.19 0.00 0.04 0.24 0.00 2.00 25.00 0.00 1.78
* CM-I = CHLORIDES CM-II = SULFATES NCM = CBOD2MG/L MG/L MG/L
** g/cu m
FINAL REPORT UPPER CALCASIEU RVR UPPER CALCASIEU RIVER (030101)- STREAM MODELREACH NO. 3 UPPER CALCASIEU RIVER REACH 3 DISSOLVED OXYGEN, PROJECTION MODEL
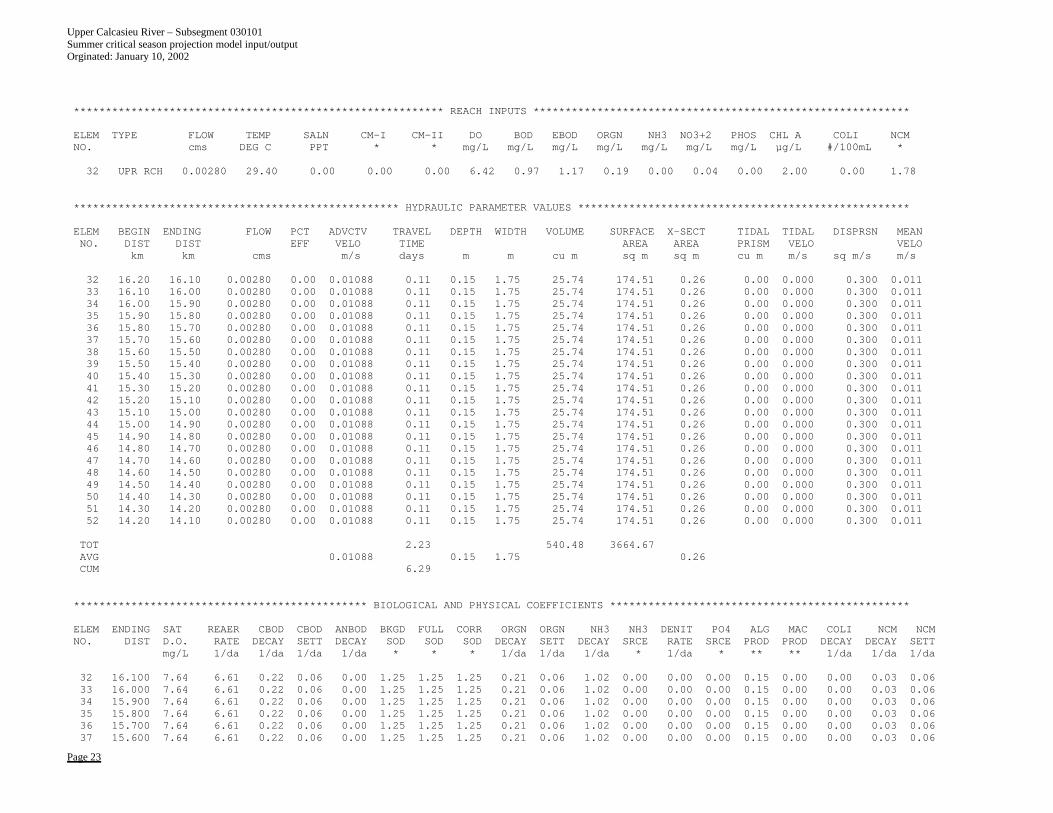
Upper Calcasieu River – Subsegment 030101 Summer critical season projection model input/output Orginated: January 10, 2002
Page 23
********************************************************** REACH INPUTS ***********************************************************
ELEM TYPE FLOW TEMP SALN CM-I CM-II DO BOD EBOD ORGN NH3 NO3+2 PHOS CHL A COLI NCMNO. cms DEG C PPT * * mg/L mg/L mg/L mg/L mg/L mg/L mg/L µg/L #/100mL *
32 UPR RCH 0.00280 29.40 0.00 0.00 0.00 6.42 0.97 1.17 0.19 0.00 0.04 0.00 2.00 0.00 1.78
*************************************************** HYDRAULIC PARAMETER VALUES ****************************************************
ELEM BEGIN ENDING FLOW PCT ADVCTV TRAVEL DEPTH WIDTH VOLUME SURFACE X-SECT TIDAL TIDAL DISPRSN MEANNO. DIST DIST EFF VELO TIME AREA AREA PRISM VELO VELO
km km cms m/s days m m cu m sq m sq m cu m m/s sq m/s m/s
32 16.20 16.10 0.00280 0.00 0.01088 0.11 0.15 1.75 25.74 174.51 0.26 0.00 0.000 0.300 0.01133 16.10 16.00 0.00280 0.00 0.01088 0.11 0.15 1.75 25.74 174.51 0.26 0.00 0.000 0.300 0.01134 16.00 15.90 0.00280 0.00 0.01088 0.11 0.15 1.75 25.74 174.51 0.26 0.00 0.000 0.300 0.01135 15.90 15.80 0.00280 0.00 0.01088 0.11 0.15 1.75 25.74 174.51 0.26 0.00 0.000 0.300 0.01136 15.80 15.70 0.00280 0.00 0.01088 0.11 0.15 1.75 25.74 174.51 0.26 0.00 0.000 0.300 0.01137 15.70 15.60 0.00280 0.00 0.01088 0.11 0.15 1.75 25.74 174.51 0.26 0.00 0.000 0.300 0.01138 15.60 15.50 0.00280 0.00 0.01088 0.11 0.15 1.75 25.74 174.51 0.26 0.00 0.000 0.300 0.01139 15.50 15.40 0.00280 0.00 0.01088 0.11 0.15 1.75 25.74 174.51 0.26 0.00 0.000 0.300 0.01140 15.40 15.30 0.00280 0.00 0.01088 0.11 0.15 1.75 25.74 174.51 0.26 0.00 0.000 0.300 0.01141 15.30 15.20 0.00280 0.00 0.01088 0.11 0.15 1.75 25.74 174.51 0.26 0.00 0.000 0.300 0.01142 15.20 15.10 0.00280 0.00 0.01088 0.11 0.15 1.75 25.74 174.51 0.26 0.00 0.000 0.300 0.01143 15.10 15.00 0.00280 0.00 0.01088 0.11 0.15 1.75 25.74 174.51 0.26 0.00 0.000 0.300 0.01144 15.00 14.90 0.00280 0.00 0.01088 0.11 0.15 1.75 25.74 174.51 0.26 0.00 0.000 0.300 0.01145 14.90 14.80 0.00280 0.00 0.01088 0.11 0.15 1.75 25.74 174.51 0.26 0.00 0.000 0.300 0.01146 14.80 14.70 0.00280 0.00 0.01088 0.11 0.15 1.75 25.74 174.51 0.26 0.00 0.000 0.300 0.01147 14.70 14.60 0.00280 0.00 0.01088 0.11 0.15 1.75 25.74 174.51 0.26 0.00 0.000 0.300 0.01148 14.60 14.50 0.00280 0.00 0.01088 0.11 0.15 1.75 25.74 174.51 0.26 0.00 0.000 0.300 0.01149 14.50 14.40 0.00280 0.00 0.01088 0.11 0.15 1.75 25.74 174.51 0.26 0.00 0.000 0.300 0.01150 14.40 14.30 0.00280 0.00 0.01088 0.11 0.15 1.75 25.74 174.51 0.26 0.00 0.000 0.300 0.01151 14.30 14.20 0.00280 0.00 0.01088 0.11 0.15 1.75 25.74 174.51 0.26 0.00 0.000 0.300 0.01152 14.20 14.10 0.00280 0.00 0.01088 0.11 0.15 1.75 25.74 174.51 0.26 0.00 0.000 0.300 0.011
TOT 2.23 540.48 3664.67AVG 0.01088 0.15 1.75 0.26CUM 6.29
********************************************** BIOLOGICAL AND PHYSICAL COEFFICIENTS ***********************************************
ELEM ENDING SAT REAER CBOD CBOD ANBOD BKGD FULL CORR ORGN ORGN NH3 NH3 DENIT PO4 ALG MAC COLI NCM NCMNO. DIST D.O. RATE DECAY SETT DECAY SOD SOD SOD DECAY SETT DECAY SRCE RATE SRCE PROD PROD DECAY DECAY SETT
mg/L 1/da 1/da 1/da 1/da * * * 1/da 1/da 1/da * 1/da * ** ** 1/da 1/da 1/da
32 16.100 7.64 6.61 0.22 0.06 0.00 1.25 1.25 1.25 0.21 0.06 1.02 0.00 0.00 0.00 0.15 0.00 0.00 0.03 0.0633 16.000 7.64 6.61 0.22 0.06 0.00 1.25 1.25 1.25 0.21 0.06 1.02 0.00 0.00 0.00 0.15 0.00 0.00 0.03 0.0634 15.900 7.64 6.61 0.22 0.06 0.00 1.25 1.25 1.25 0.21 0.06 1.02 0.00 0.00 0.00 0.15 0.00 0.00 0.03 0.0635 15.800 7.64 6.61 0.22 0.06 0.00 1.25 1.25 1.25 0.21 0.06 1.02 0.00 0.00 0.00 0.15 0.00 0.00 0.03 0.0636 15.700 7.64 6.61 0.22 0.06 0.00 1.25 1.25 1.25 0.21 0.06 1.02 0.00 0.00 0.00 0.15 0.00 0.00 0.03 0.0637 15.600 7.64 6.61 0.22 0.06 0.00 1.25 1.25 1.25 0.21 0.06 1.02 0.00 0.00 0.00 0.15 0.00 0.00 0.03 0.06
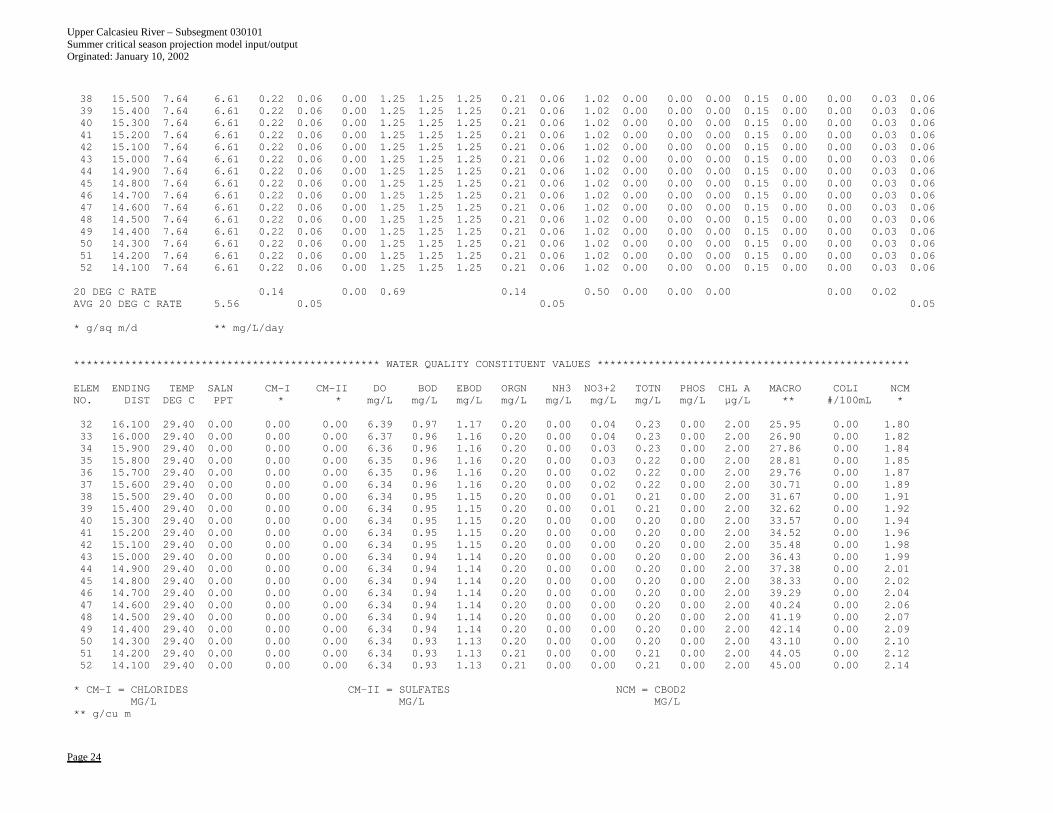
Upper Calcasieu River – Subsegment 030101 Summer critical season projection model input/output Orginated: January 10, 2002
Page 24
38 15.500 7.64 6.61 0.22 0.06 0.00 1.25 1.25 1.25 0.21 0.06 1.02 0.00 0.00 0.00 0.15 0.00 0.00 0.03 0.0639 15.400 7.64 6.61 0.22 0.06 0.00 1.25 1.25 1.25 0.21 0.06 1.02 0.00 0.00 0.00 0.15 0.00 0.00 0.03 0.0640 15.300 7.64 6.61 0.22 0.06 0.00 1.25 1.25 1.25 0.21 0.06 1.02 0.00 0.00 0.00 0.15 0.00 0.00 0.03 0.0641 15.200 7.64 6.61 0.22 0.06 0.00 1.25 1.25 1.25 0.21 0.06 1.02 0.00 0.00 0.00 0.15 0.00 0.00 0.03 0.0642 15.100 7.64 6.61 0.22 0.06 0.00 1.25 1.25 1.25 0.21 0.06 1.02 0.00 0.00 0.00 0.15 0.00 0.00 0.03 0.0643 15.000 7.64 6.61 0.22 0.06 0.00 1.25 1.25 1.25 0.21 0.06 1.02 0.00 0.00 0.00 0.15 0.00 0.00 0.03 0.0644 14.900 7.64 6.61 0.22 0.06 0.00 1.25 1.25 1.25 0.21 0.06 1.02 0.00 0.00 0.00 0.15 0.00 0.00 0.03 0.0645 14.800 7.64 6.61 0.22 0.06 0.00 1.25 1.25 1.25 0.21 0.06 1.02 0.00 0.00 0.00 0.15 0.00 0.00 0.03 0.0646 14.700 7.64 6.61 0.22 0.06 0.00 1.25 1.25 1.25 0.21 0.06 1.02 0.00 0.00 0.00 0.15 0.00 0.00 0.03 0.0647 14.600 7.64 6.61 0.22 0.06 0.00 1.25 1.25 1.25 0.21 0.06 1.02 0.00 0.00 0.00 0.15 0.00 0.00 0.03 0.0648 14.500 7.64 6.61 0.22 0.06 0.00 1.25 1.25 1.25 0.21 0.06 1.02 0.00 0.00 0.00 0.15 0.00 0.00 0.03 0.0649 14.400 7.64 6.61 0.22 0.06 0.00 1.25 1.25 1.25 0.21 0.06 1.02 0.00 0.00 0.00 0.15 0.00 0.00 0.03 0.0650 14.300 7.64 6.61 0.22 0.06 0.00 1.25 1.25 1.25 0.21 0.06 1.02 0.00 0.00 0.00 0.15 0.00 0.00 0.03 0.0651 14.200 7.64 6.61 0.22 0.06 0.00 1.25 1.25 1.25 0.21 0.06 1.02 0.00 0.00 0.00 0.15 0.00 0.00 0.03 0.0652 14.100 7.64 6.61 0.22 0.06 0.00 1.25 1.25 1.25 0.21 0.06 1.02 0.00 0.00 0.00 0.15 0.00 0.00 0.03 0.06
20 DEG C RATE 0.14 0.00 0.69 0.14 0.50 0.00 0.00 0.00 0.00 0.02AVG 20 DEG C RATE 5.56 0.05 0.05 0.05
* g/sq m/d ** mg/L/day
************************************************ WATER QUALITY CONSTITUENT VALUES *************************************************
ELEM ENDING TEMP SALN CM-I CM-II DO BOD EBOD ORGN NH3 NO3+2 TOTN PHOS CHL A MACRO COLI NCMNO. DIST DEG C PPT * * mg/L mg/L mg/L mg/L mg/L mg/L mg/L mg/L µg/L ** #/100mL *
32 16.100 29.40 0.00 0.00 0.00 6.39 0.97 1.17 0.20 0.00 0.04 0.23 0.00 2.00 25.95 0.00 1.8033 16.000 29.40 0.00 0.00 0.00 6.37 0.96 1.16 0.20 0.00 0.04 0.23 0.00 2.00 26.90 0.00 1.8234 15.900 29.40 0.00 0.00 0.00 6.36 0.96 1.16 0.20 0.00 0.03 0.23 0.00 2.00 27.86 0.00 1.8435 15.800 29.40 0.00 0.00 0.00 6.35 0.96 1.16 0.20 0.00 0.03 0.22 0.00 2.00 28.81 0.00 1.8536 15.700 29.40 0.00 0.00 0.00 6.35 0.96 1.16 0.20 0.00 0.02 0.22 0.00 2.00 29.76 0.00 1.8737 15.600 29.40 0.00 0.00 0.00 6.34 0.96 1.16 0.20 0.00 0.02 0.22 0.00 2.00 30.71 0.00 1.8938 15.500 29.40 0.00 0.00 0.00 6.34 0.95 1.15 0.20 0.00 0.01 0.21 0.00 2.00 31.67 0.00 1.9139 15.400 29.40 0.00 0.00 0.00 6.34 0.95 1.15 0.20 0.00 0.01 0.21 0.00 2.00 32.62 0.00 1.9240 15.300 29.40 0.00 0.00 0.00 6.34 0.95 1.15 0.20 0.00 0.00 0.20 0.00 2.00 33.57 0.00 1.9441 15.200 29.40 0.00 0.00 0.00 6.34 0.95 1.15 0.20 0.00 0.00 0.20 0.00 2.00 34.52 0.00 1.9642 15.100 29.40 0.00 0.00 0.00 6.34 0.95 1.15 0.20 0.00 0.00 0.20 0.00 2.00 35.48 0.00 1.9843 15.000 29.40 0.00 0.00 0.00 6.34 0.94 1.14 0.20 0.00 0.00 0.20 0.00 2.00 36.43 0.00 1.9944 14.900 29.40 0.00 0.00 0.00 6.34 0.94 1.14 0.20 0.00 0.00 0.20 0.00 2.00 37.38 0.00 2.0145 14.800 29.40 0.00 0.00 0.00 6.34 0.94 1.14 0.20 0.00 0.00 0.20 0.00 2.00 38.33 0.00 2.0246 14.700 29.40 0.00 0.00 0.00 6.34 0.94 1.14 0.20 0.00 0.00 0.20 0.00 2.00 39.29 0.00 2.0447 14.600 29.40 0.00 0.00 0.00 6.34 0.94 1.14 0.20 0.00 0.00 0.20 0.00 2.00 40.24 0.00 2.0648 14.500 29.40 0.00 0.00 0.00 6.34 0.94 1.14 0.20 0.00 0.00 0.20 0.00 2.00 41.19 0.00 2.0749 14.400 29.40 0.00 0.00 0.00 6.34 0.94 1.14 0.20 0.00 0.00 0.20 0.00 2.00 42.14 0.00 2.0950 14.300 29.40 0.00 0.00 0.00 6.34 0.93 1.13 0.20 0.00 0.00 0.20 0.00 2.00 43.10 0.00 2.1051 14.200 29.40 0.00 0.00 0.00 6.34 0.93 1.13 0.21 0.00 0.00 0.21 0.00 2.00 44.05 0.00 2.1252 14.100 29.40 0.00 0.00 0.00 6.34 0.93 1.13 0.21 0.00 0.00 0.21 0.00 2.00 45.00 0.00 2.14
* CM-I = CHLORIDES CM-II = SULFATES NCM = CBOD2MG/L MG/L MG/L
** g/cu m
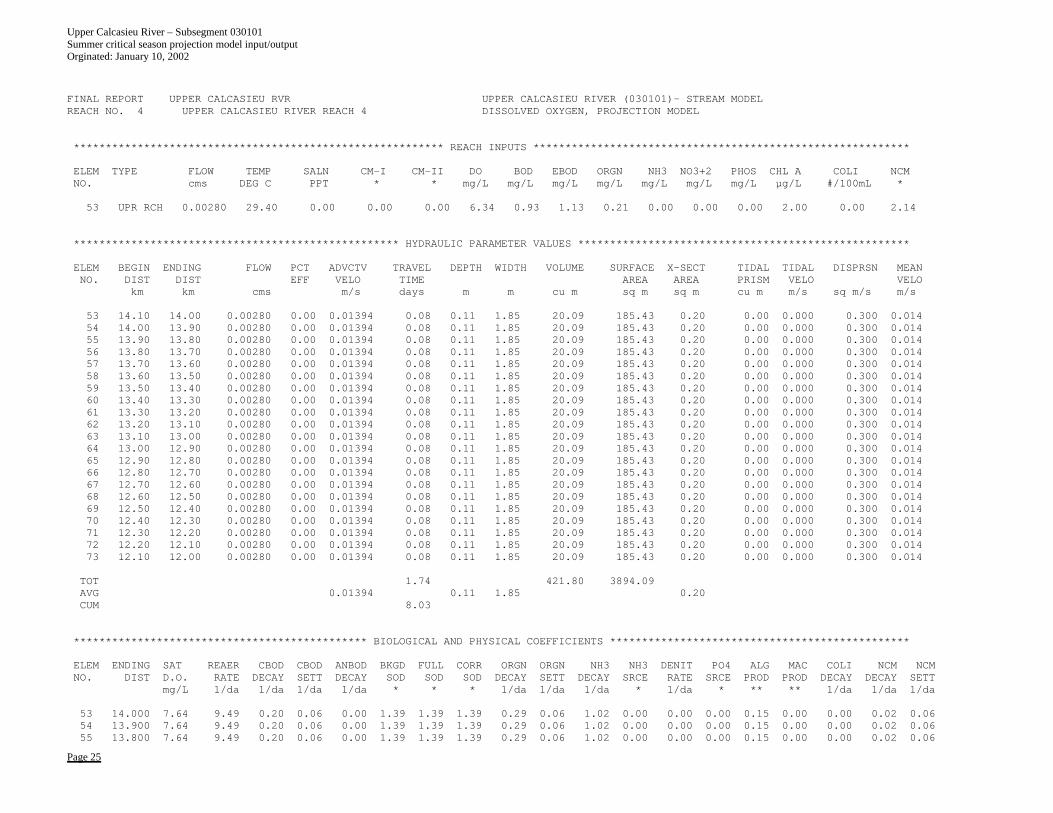
Upper Calcasieu River – Subsegment 030101 Summer critical season projection model input/output Orginated: January 10, 2002
Page 25
FINAL REPORT UPPER CALCASIEU RVR UPPER CALCASIEU RIVER (030101)- STREAM MODELREACH NO. 4 UPPER CALCASIEU RIVER REACH 4 DISSOLVED OXYGEN, PROJECTION MODEL
********************************************************** REACH INPUTS ***********************************************************
ELEM TYPE FLOW TEMP SALN CM-I CM-II DO BOD EBOD ORGN NH3 NO3+2 PHOS CHL A COLI NCMNO. cms DEG C PPT * * mg/L mg/L mg/L mg/L mg/L mg/L mg/L µg/L #/100mL *
53 UPR RCH 0.00280 29.40 0.00 0.00 0.00 6.34 0.93 1.13 0.21 0.00 0.00 0.00 2.00 0.00 2.14
*************************************************** HYDRAULIC PARAMETER VALUES ****************************************************
ELEM BEGIN ENDING FLOW PCT ADVCTV TRAVEL DEPTH WIDTH VOLUME SURFACE X-SECT TIDAL TIDAL DISPRSN MEANNO. DIST DIST EFF VELO TIME AREA AREA PRISM VELO VELO
km km cms m/s days m m cu m sq m sq m cu m m/s sq m/s m/s
53 14.10 14.00 0.00280 0.00 0.01394 0.08 0.11 1.85 20.09 185.43 0.20 0.00 0.000 0.300 0.01454 14.00 13.90 0.00280 0.00 0.01394 0.08 0.11 1.85 20.09 185.43 0.20 0.00 0.000 0.300 0.01455 13.90 13.80 0.00280 0.00 0.01394 0.08 0.11 1.85 20.09 185.43 0.20 0.00 0.000 0.300 0.01456 13.80 13.70 0.00280 0.00 0.01394 0.08 0.11 1.85 20.09 185.43 0.20 0.00 0.000 0.300 0.01457 13.70 13.60 0.00280 0.00 0.01394 0.08 0.11 1.85 20.09 185.43 0.20 0.00 0.000 0.300 0.01458 13.60 13.50 0.00280 0.00 0.01394 0.08 0.11 1.85 20.09 185.43 0.20 0.00 0.000 0.300 0.01459 13.50 13.40 0.00280 0.00 0.01394 0.08 0.11 1.85 20.09 185.43 0.20 0.00 0.000 0.300 0.01460 13.40 13.30 0.00280 0.00 0.01394 0.08 0.11 1.85 20.09 185.43 0.20 0.00 0.000 0.300 0.01461 13.30 13.20 0.00280 0.00 0.01394 0.08 0.11 1.85 20.09 185.43 0.20 0.00 0.000 0.300 0.01462 13.20 13.10 0.00280 0.00 0.01394 0.08 0.11 1.85 20.09 185.43 0.20 0.00 0.000 0.300 0.01463 13.10 13.00 0.00280 0.00 0.01394 0.08 0.11 1.85 20.09 185.43 0.20 0.00 0.000 0.300 0.01464 13.00 12.90 0.00280 0.00 0.01394 0.08 0.11 1.85 20.09 185.43 0.20 0.00 0.000 0.300 0.01465 12.90 12.80 0.00280 0.00 0.01394 0.08 0.11 1.85 20.09 185.43 0.20 0.00 0.000 0.300 0.01466 12.80 12.70 0.00280 0.00 0.01394 0.08 0.11 1.85 20.09 185.43 0.20 0.00 0.000 0.300 0.01467 12.70 12.60 0.00280 0.00 0.01394 0.08 0.11 1.85 20.09 185.43 0.20 0.00 0.000 0.300 0.01468 12.60 12.50 0.00280 0.00 0.01394 0.08 0.11 1.85 20.09 185.43 0.20 0.00 0.000 0.300 0.01469 12.50 12.40 0.00280 0.00 0.01394 0.08 0.11 1.85 20.09 185.43 0.20 0.00 0.000 0.300 0.01470 12.40 12.30 0.00280 0.00 0.01394 0.08 0.11 1.85 20.09 185.43 0.20 0.00 0.000 0.300 0.01471 12.30 12.20 0.00280 0.00 0.01394 0.08 0.11 1.85 20.09 185.43 0.20 0.00 0.000 0.300 0.01472 12.20 12.10 0.00280 0.00 0.01394 0.08 0.11 1.85 20.09 185.43 0.20 0.00 0.000 0.300 0.01473 12.10 12.00 0.00280 0.00 0.01394 0.08 0.11 1.85 20.09 185.43 0.20 0.00 0.000 0.300 0.014
TOT 1.74 421.80 3894.09AVG 0.01394 0.11 1.85 0.20CUM 8.03
********************************************** BIOLOGICAL AND PHYSICAL COEFFICIENTS ***********************************************
ELEM ENDING SAT REAER CBOD CBOD ANBOD BKGD FULL CORR ORGN ORGN NH3 NH3 DENIT PO4 ALG MAC COLI NCM NCMNO. DIST D.O. RATE DECAY SETT DECAY SOD SOD SOD DECAY SETT DECAY SRCE RATE SRCE PROD PROD DECAY DECAY SETT
mg/L 1/da 1/da 1/da 1/da * * * 1/da 1/da 1/da * 1/da * ** ** 1/da 1/da 1/da
53 14.000 7.64 9.49 0.20 0.06 0.00 1.39 1.39 1.39 0.29 0.06 1.02 0.00 0.00 0.00 0.15 0.00 0.00 0.02 0.0654 13.900 7.64 9.49 0.20 0.06 0.00 1.39 1.39 1.39 0.29 0.06 1.02 0.00 0.00 0.00 0.15 0.00 0.00 0.02 0.0655 13.800 7.64 9.49 0.20 0.06 0.00 1.39 1.39 1.39 0.29 0.06 1.02 0.00 0.00 0.00 0.15 0.00 0.00 0.02 0.06
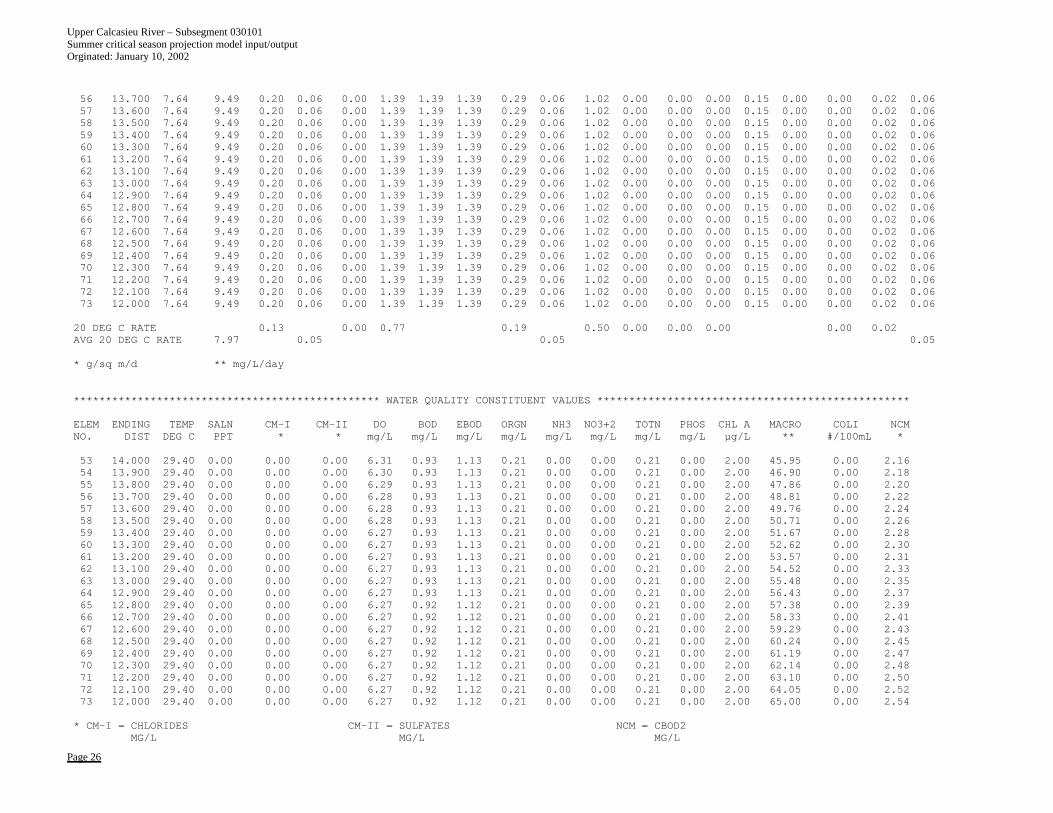
Upper Calcasieu River – Subsegment 030101 Summer critical season projection model input/output Orginated: January 10, 2002
Page 26
56 13.700 7.64 9.49 0.20 0.06 0.00 1.39 1.39 1.39 0.29 0.06 1.02 0.00 0.00 0.00 0.15 0.00 0.00 0.02 0.0657 13.600 7.64 9.49 0.20 0.06 0.00 1.39 1.39 1.39 0.29 0.06 1.02 0.00 0.00 0.00 0.15 0.00 0.00 0.02 0.0658 13.500 7.64 9.49 0.20 0.06 0.00 1.39 1.39 1.39 0.29 0.06 1.02 0.00 0.00 0.00 0.15 0.00 0.00 0.02 0.0659 13.400 7.64 9.49 0.20 0.06 0.00 1.39 1.39 1.39 0.29 0.06 1.02 0.00 0.00 0.00 0.15 0.00 0.00 0.02 0.0660 13.300 7.64 9.49 0.20 0.06 0.00 1.39 1.39 1.39 0.29 0.06 1.02 0.00 0.00 0.00 0.15 0.00 0.00 0.02 0.0661 13.200 7.64 9.49 0.20 0.06 0.00 1.39 1.39 1.39 0.29 0.06 1.02 0.00 0.00 0.00 0.15 0.00 0.00 0.02 0.0662 13.100 7.64 9.49 0.20 0.06 0.00 1.39 1.39 1.39 0.29 0.06 1.02 0.00 0.00 0.00 0.15 0.00 0.00 0.02 0.0663 13.000 7.64 9.49 0.20 0.06 0.00 1.39 1.39 1.39 0.29 0.06 1.02 0.00 0.00 0.00 0.15 0.00 0.00 0.02 0.0664 12.900 7.64 9.49 0.20 0.06 0.00 1.39 1.39 1.39 0.29 0.06 1.02 0.00 0.00 0.00 0.15 0.00 0.00 0.02 0.0665 12.800 7.64 9.49 0.20 0.06 0.00 1.39 1.39 1.39 0.29 0.06 1.02 0.00 0.00 0.00 0.15 0.00 0.00 0.02 0.0666 12.700 7.64 9.49 0.20 0.06 0.00 1.39 1.39 1.39 0.29 0.06 1.02 0.00 0.00 0.00 0.15 0.00 0.00 0.02 0.0667 12.600 7.64 9.49 0.20 0.06 0.00 1.39 1.39 1.39 0.29 0.06 1.02 0.00 0.00 0.00 0.15 0.00 0.00 0.02 0.0668 12.500 7.64 9.49 0.20 0.06 0.00 1.39 1.39 1.39 0.29 0.06 1.02 0.00 0.00 0.00 0.15 0.00 0.00 0.02 0.0669 12.400 7.64 9.49 0.20 0.06 0.00 1.39 1.39 1.39 0.29 0.06 1.02 0.00 0.00 0.00 0.15 0.00 0.00 0.02 0.0670 12.300 7.64 9.49 0.20 0.06 0.00 1.39 1.39 1.39 0.29 0.06 1.02 0.00 0.00 0.00 0.15 0.00 0.00 0.02 0.0671 12.200 7.64 9.49 0.20 0.06 0.00 1.39 1.39 1.39 0.29 0.06 1.02 0.00 0.00 0.00 0.15 0.00 0.00 0.02 0.0672 12.100 7.64 9.49 0.20 0.06 0.00 1.39 1.39 1.39 0.29 0.06 1.02 0.00 0.00 0.00 0.15 0.00 0.00 0.02 0.0673 12.000 7.64 9.49 0.20 0.06 0.00 1.39 1.39 1.39 0.29 0.06 1.02 0.00 0.00 0.00 0.15 0.00 0.00 0.02 0.06
20 DEG C RATE 0.13 0.00 0.77 0.19 0.50 0.00 0.00 0.00 0.00 0.02AVG 20 DEG C RATE 7.97 0.05 0.05 0.05
* g/sq m/d ** mg/L/day
************************************************ WATER QUALITY CONSTITUENT VALUES *************************************************
ELEM ENDING TEMP SALN CM-I CM-II DO BOD EBOD ORGN NH3 NO3+2 TOTN PHOS CHL A MACRO COLI NCMNO. DIST DEG C PPT * * mg/L mg/L mg/L mg/L mg/L mg/L mg/L mg/L µg/L ** #/100mL *
53 14.000 29.40 0.00 0.00 0.00 6.31 0.93 1.13 0.21 0.00 0.00 0.21 0.00 2.00 45.95 0.00 2.1654 13.900 29.40 0.00 0.00 0.00 6.30 0.93 1.13 0.21 0.00 0.00 0.21 0.00 2.00 46.90 0.00 2.1855 13.800 29.40 0.00 0.00 0.00 6.29 0.93 1.13 0.21 0.00 0.00 0.21 0.00 2.00 47.86 0.00 2.2056 13.700 29.40 0.00 0.00 0.00 6.28 0.93 1.13 0.21 0.00 0.00 0.21 0.00 2.00 48.81 0.00 2.2257 13.600 29.40 0.00 0.00 0.00 6.28 0.93 1.13 0.21 0.00 0.00 0.21 0.00 2.00 49.76 0.00 2.2458 13.500 29.40 0.00 0.00 0.00 6.28 0.93 1.13 0.21 0.00 0.00 0.21 0.00 2.00 50.71 0.00 2.2659 13.400 29.40 0.00 0.00 0.00 6.27 0.93 1.13 0.21 0.00 0.00 0.21 0.00 2.00 51.67 0.00 2.2860 13.300 29.40 0.00 0.00 0.00 6.27 0.93 1.13 0.21 0.00 0.00 0.21 0.00 2.00 52.62 0.00 2.3061 13.200 29.40 0.00 0.00 0.00 6.27 0.93 1.13 0.21 0.00 0.00 0.21 0.00 2.00 53.57 0.00 2.3162 13.100 29.40 0.00 0.00 0.00 6.27 0.93 1.13 0.21 0.00 0.00 0.21 0.00 2.00 54.52 0.00 2.3363 13.000 29.40 0.00 0.00 0.00 6.27 0.93 1.13 0.21 0.00 0.00 0.21 0.00 2.00 55.48 0.00 2.3564 12.900 29.40 0.00 0.00 0.00 6.27 0.93 1.13 0.21 0.00 0.00 0.21 0.00 2.00 56.43 0.00 2.3765 12.800 29.40 0.00 0.00 0.00 6.27 0.92 1.12 0.21 0.00 0.00 0.21 0.00 2.00 57.38 0.00 2.3966 12.700 29.40 0.00 0.00 0.00 6.27 0.92 1.12 0.21 0.00 0.00 0.21 0.00 2.00 58.33 0.00 2.4167 12.600 29.40 0.00 0.00 0.00 6.27 0.92 1.12 0.21 0.00 0.00 0.21 0.00 2.00 59.29 0.00 2.4368 12.500 29.40 0.00 0.00 0.00 6.27 0.92 1.12 0.21 0.00 0.00 0.21 0.00 2.00 60.24 0.00 2.4569 12.400 29.40 0.00 0.00 0.00 6.27 0.92 1.12 0.21 0.00 0.00 0.21 0.00 2.00 61.19 0.00 2.4770 12.300 29.40 0.00 0.00 0.00 6.27 0.92 1.12 0.21 0.00 0.00 0.21 0.00 2.00 62.14 0.00 2.4871 12.200 29.40 0.00 0.00 0.00 6.27 0.92 1.12 0.21 0.00 0.00 0.21 0.00 2.00 63.10 0.00 2.5072 12.100 29.40 0.00 0.00 0.00 6.27 0.92 1.12 0.21 0.00 0.00 0.21 0.00 2.00 64.05 0.00 2.5273 12.000 29.40 0.00 0.00 0.00 6.27 0.92 1.12 0.21 0.00 0.00 0.21 0.00 2.00 65.00 0.00 2.54
* CM-I = CHLORIDES CM-II = SULFATES NCM = CBOD2MG/L MG/L MG/L
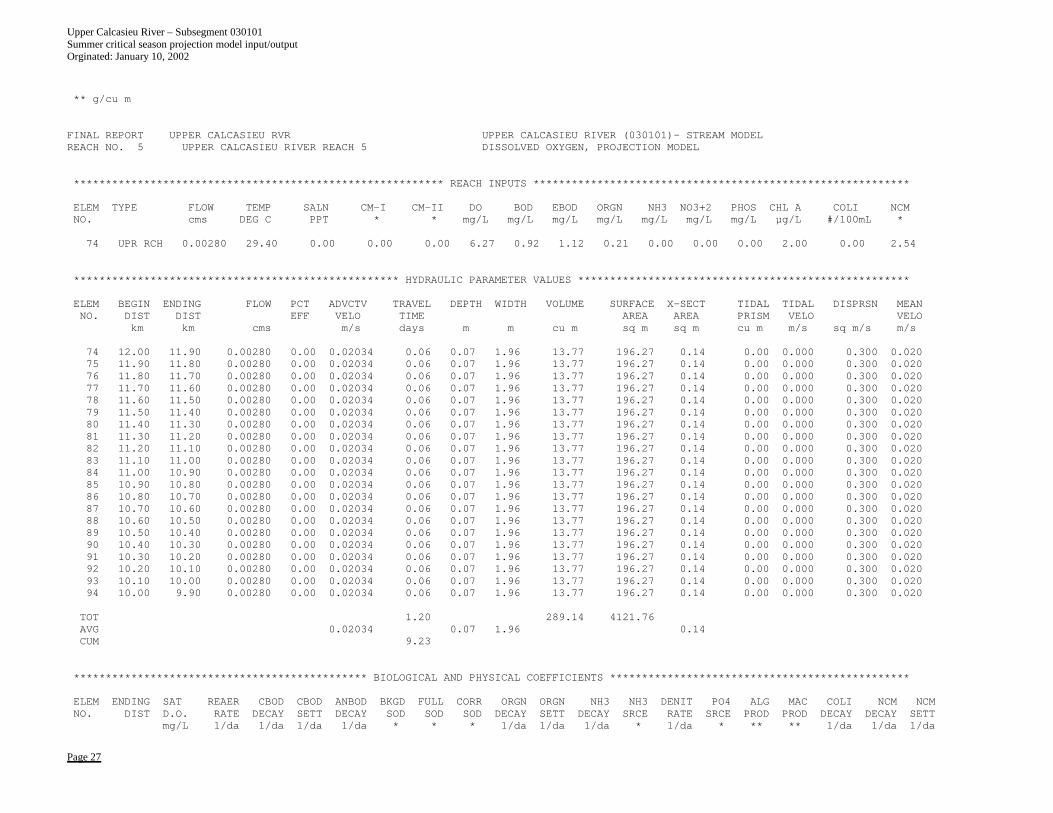
Upper Calcasieu River – Subsegment 030101 Summer critical season projection model input/output Orginated: January 10, 2002
Page 27
** g/cu m
FINAL REPORT UPPER CALCASIEU RVR UPPER CALCASIEU RIVER (030101)- STREAM MODELREACH NO. 5 UPPER CALCASIEU RIVER REACH 5 DISSOLVED OXYGEN, PROJECTION MODEL
********************************************************** REACH INPUTS ***********************************************************
ELEM TYPE FLOW TEMP SALN CM-I CM-II DO BOD EBOD ORGN NH3 NO3+2 PHOS CHL A COLI NCMNO. cms DEG C PPT * * mg/L mg/L mg/L mg/L mg/L mg/L mg/L µg/L #/100mL *
74 UPR RCH 0.00280 29.40 0.00 0.00 0.00 6.27 0.92 1.12 0.21 0.00 0.00 0.00 2.00 0.00 2.54
*************************************************** HYDRAULIC PARAMETER VALUES ****************************************************
ELEM BEGIN ENDING FLOW PCT ADVCTV TRAVEL DEPTH WIDTH VOLUME SURFACE X-SECT TIDAL TIDAL DISPRSN MEANNO. DIST DIST EFF VELO TIME AREA AREA PRISM VELO VELO
km km cms m/s days m m cu m sq m sq m cu m m/s sq m/s m/s
74 12.00 11.90 0.00280 0.00 0.02034 0.06 0.07 1.96 13.77 196.27 0.14 0.00 0.000 0.300 0.02075 11.90 11.80 0.00280 0.00 0.02034 0.06 0.07 1.96 13.77 196.27 0.14 0.00 0.000 0.300 0.02076 11.80 11.70 0.00280 0.00 0.02034 0.06 0.07 1.96 13.77 196.27 0.14 0.00 0.000 0.300 0.02077 11.70 11.60 0.00280 0.00 0.02034 0.06 0.07 1.96 13.77 196.27 0.14 0.00 0.000 0.300 0.02078 11.60 11.50 0.00280 0.00 0.02034 0.06 0.07 1.96 13.77 196.27 0.14 0.00 0.000 0.300 0.02079 11.50 11.40 0.00280 0.00 0.02034 0.06 0.07 1.96 13.77 196.27 0.14 0.00 0.000 0.300 0.02080 11.40 11.30 0.00280 0.00 0.02034 0.06 0.07 1.96 13.77 196.27 0.14 0.00 0.000 0.300 0.02081 11.30 11.20 0.00280 0.00 0.02034 0.06 0.07 1.96 13.77 196.27 0.14 0.00 0.000 0.300 0.02082 11.20 11.10 0.00280 0.00 0.02034 0.06 0.07 1.96 13.77 196.27 0.14 0.00 0.000 0.300 0.02083 11.10 11.00 0.00280 0.00 0.02034 0.06 0.07 1.96 13.77 196.27 0.14 0.00 0.000 0.300 0.02084 11.00 10.90 0.00280 0.00 0.02034 0.06 0.07 1.96 13.77 196.27 0.14 0.00 0.000 0.300 0.02085 10.90 10.80 0.00280 0.00 0.02034 0.06 0.07 1.96 13.77 196.27 0.14 0.00 0.000 0.300 0.02086 10.80 10.70 0.00280 0.00 0.02034 0.06 0.07 1.96 13.77 196.27 0.14 0.00 0.000 0.300 0.02087 10.70 10.60 0.00280 0.00 0.02034 0.06 0.07 1.96 13.77 196.27 0.14 0.00 0.000 0.300 0.02088 10.60 10.50 0.00280 0.00 0.02034 0.06 0.07 1.96 13.77 196.27 0.14 0.00 0.000 0.300 0.02089 10.50 10.40 0.00280 0.00 0.02034 0.06 0.07 1.96 13.77 196.27 0.14 0.00 0.000 0.300 0.02090 10.40 10.30 0.00280 0.00 0.02034 0.06 0.07 1.96 13.77 196.27 0.14 0.00 0.000 0.300 0.02091 10.30 10.20 0.00280 0.00 0.02034 0.06 0.07 1.96 13.77 196.27 0.14 0.00 0.000 0.300 0.02092 10.20 10.10 0.00280 0.00 0.02034 0.06 0.07 1.96 13.77 196.27 0.14 0.00 0.000 0.300 0.02093 10.10 10.00 0.00280 0.00 0.02034 0.06 0.07 1.96 13.77 196.27 0.14 0.00 0.000 0.300 0.02094 10.00 9.90 0.00280 0.00 0.02034 0.06 0.07 1.96 13.77 196.27 0.14 0.00 0.000 0.300 0.020
TOT 1.20 289.14 4121.76AVG 0.02034 0.07 1.96 0.14CUM 9.23
********************************************** BIOLOGICAL AND PHYSICAL COEFFICIENTS ***********************************************
ELEM ENDING SAT REAER CBOD CBOD ANBOD BKGD FULL CORR ORGN ORGN NH3 NH3 DENIT PO4 ALG MAC COLI NCM NCMNO. DIST D.O. RATE DECAY SETT DECAY SOD SOD SOD DECAY SETT DECAY SRCE RATE SRCE PROD PROD DECAY DECAY SETT
mg/L 1/da 1/da 1/da 1/da * * * 1/da 1/da 1/da * 1/da * ** ** 1/da 1/da 1/da
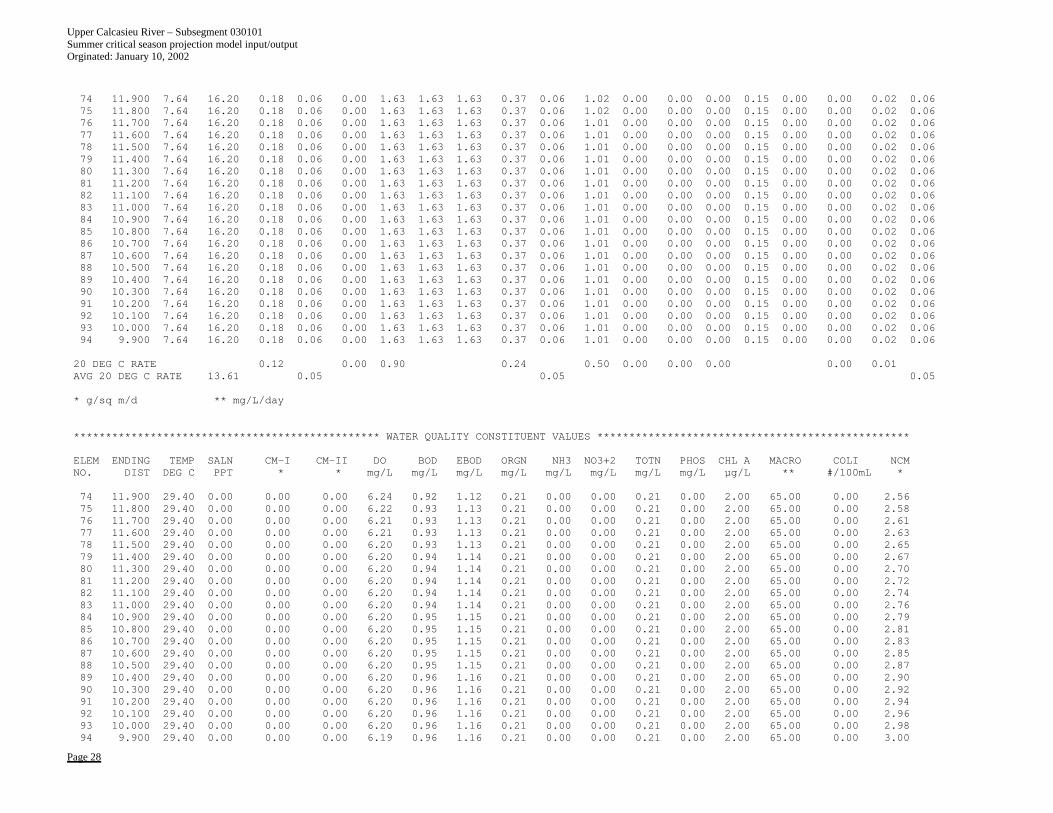
Upper Calcasieu River – Subsegment 030101 Summer critical season projection model input/output Orginated: January 10, 2002
Page 28
74 11.900 7.64 16.20 0.18 0.06 0.00 1.63 1.63 1.63 0.37 0.06 1.02 0.00 0.00 0.00 0.15 0.00 0.00 0.02 0.0675 11.800 7.64 16.20 0.18 0.06 0.00 1.63 1.63 1.63 0.37 0.06 1.02 0.00 0.00 0.00 0.15 0.00 0.00 0.02 0.0676 11.700 7.64 16.20 0.18 0.06 0.00 1.63 1.63 1.63 0.37 0.06 1.01 0.00 0.00 0.00 0.15 0.00 0.00 0.02 0.0677 11.600 7.64 16.20 0.18 0.06 0.00 1.63 1.63 1.63 0.37 0.06 1.01 0.00 0.00 0.00 0.15 0.00 0.00 0.02 0.0678 11.500 7.64 16.20 0.18 0.06 0.00 1.63 1.63 1.63 0.37 0.06 1.01 0.00 0.00 0.00 0.15 0.00 0.00 0.02 0.0679 11.400 7.64 16.20 0.18 0.06 0.00 1.63 1.63 1.63 0.37 0.06 1.01 0.00 0.00 0.00 0.15 0.00 0.00 0.02 0.0680 11.300 7.64 16.20 0.18 0.06 0.00 1.63 1.63 1.63 0.37 0.06 1.01 0.00 0.00 0.00 0.15 0.00 0.00 0.02 0.0681 11.200 7.64 16.20 0.18 0.06 0.00 1.63 1.63 1.63 0.37 0.06 1.01 0.00 0.00 0.00 0.15 0.00 0.00 0.02 0.0682 11.100 7.64 16.20 0.18 0.06 0.00 1.63 1.63 1.63 0.37 0.06 1.01 0.00 0.00 0.00 0.15 0.00 0.00 0.02 0.0683 11.000 7.64 16.20 0.18 0.06 0.00 1.63 1.63 1.63 0.37 0.06 1.01 0.00 0.00 0.00 0.15 0.00 0.00 0.02 0.0684 10.900 7.64 16.20 0.18 0.06 0.00 1.63 1.63 1.63 0.37 0.06 1.01 0.00 0.00 0.00 0.15 0.00 0.00 0.02 0.0685 10.800 7.64 16.20 0.18 0.06 0.00 1.63 1.63 1.63 0.37 0.06 1.01 0.00 0.00 0.00 0.15 0.00 0.00 0.02 0.0686 10.700 7.64 16.20 0.18 0.06 0.00 1.63 1.63 1.63 0.37 0.06 1.01 0.00 0.00 0.00 0.15 0.00 0.00 0.02 0.0687 10.600 7.64 16.20 0.18 0.06 0.00 1.63 1.63 1.63 0.37 0.06 1.01 0.00 0.00 0.00 0.15 0.00 0.00 0.02 0.0688 10.500 7.64 16.20 0.18 0.06 0.00 1.63 1.63 1.63 0.37 0.06 1.01 0.00 0.00 0.00 0.15 0.00 0.00 0.02 0.0689 10.400 7.64 16.20 0.18 0.06 0.00 1.63 1.63 1.63 0.37 0.06 1.01 0.00 0.00 0.00 0.15 0.00 0.00 0.02 0.0690 10.300 7.64 16.20 0.18 0.06 0.00 1.63 1.63 1.63 0.37 0.06 1.01 0.00 0.00 0.00 0.15 0.00 0.00 0.02 0.0691 10.200 7.64 16.20 0.18 0.06 0.00 1.63 1.63 1.63 0.37 0.06 1.01 0.00 0.00 0.00 0.15 0.00 0.00 0.02 0.0692 10.100 7.64 16.20 0.18 0.06 0.00 1.63 1.63 1.63 0.37 0.06 1.01 0.00 0.00 0.00 0.15 0.00 0.00 0.02 0.0693 10.000 7.64 16.20 0.18 0.06 0.00 1.63 1.63 1.63 0.37 0.06 1.01 0.00 0.00 0.00 0.15 0.00 0.00 0.02 0.0694 9.900 7.64 16.20 0.18 0.06 0.00 1.63 1.63 1.63 0.37 0.06 1.01 0.00 0.00 0.00 0.15 0.00 0.00 0.02 0.06
20 DEG C RATE 0.12 0.00 0.90 0.24 0.50 0.00 0.00 0.00 0.00 0.01AVG 20 DEG C RATE 13.61 0.05 0.05 0.05
* g/sq m/d ** mg/L/day
************************************************ WATER QUALITY CONSTITUENT VALUES *************************************************
ELEM ENDING TEMP SALN CM-I CM-II DO BOD EBOD ORGN NH3 NO3+2 TOTN PHOS CHL A MACRO COLI NCMNO. DIST DEG C PPT * * mg/L mg/L mg/L mg/L mg/L mg/L mg/L mg/L µg/L ** #/100mL *
74 11.900 29.40 0.00 0.00 0.00 6.24 0.92 1.12 0.21 0.00 0.00 0.21 0.00 2.00 65.00 0.00 2.5675 11.800 29.40 0.00 0.00 0.00 6.22 0.93 1.13 0.21 0.00 0.00 0.21 0.00 2.00 65.00 0.00 2.5876 11.700 29.40 0.00 0.00 0.00 6.21 0.93 1.13 0.21 0.00 0.00 0.21 0.00 2.00 65.00 0.00 2.6177 11.600 29.40 0.00 0.00 0.00 6.21 0.93 1.13 0.21 0.00 0.00 0.21 0.00 2.00 65.00 0.00 2.6378 11.500 29.40 0.00 0.00 0.00 6.20 0.93 1.13 0.21 0.00 0.00 0.21 0.00 2.00 65.00 0.00 2.6579 11.400 29.40 0.00 0.00 0.00 6.20 0.94 1.14 0.21 0.00 0.00 0.21 0.00 2.00 65.00 0.00 2.6780 11.300 29.40 0.00 0.00 0.00 6.20 0.94 1.14 0.21 0.00 0.00 0.21 0.00 2.00 65.00 0.00 2.7081 11.200 29.40 0.00 0.00 0.00 6.20 0.94 1.14 0.21 0.00 0.00 0.21 0.00 2.00 65.00 0.00 2.7282 11.100 29.40 0.00 0.00 0.00 6.20 0.94 1.14 0.21 0.00 0.00 0.21 0.00 2.00 65.00 0.00 2.7483 11.000 29.40 0.00 0.00 0.00 6.20 0.94 1.14 0.21 0.00 0.00 0.21 0.00 2.00 65.00 0.00 2.7684 10.900 29.40 0.00 0.00 0.00 6.20 0.95 1.15 0.21 0.00 0.00 0.21 0.00 2.00 65.00 0.00 2.7985 10.800 29.40 0.00 0.00 0.00 6.20 0.95 1.15 0.21 0.00 0.00 0.21 0.00 2.00 65.00 0.00 2.8186 10.700 29.40 0.00 0.00 0.00 6.20 0.95 1.15 0.21 0.00 0.00 0.21 0.00 2.00 65.00 0.00 2.8387 10.600 29.40 0.00 0.00 0.00 6.20 0.95 1.15 0.21 0.00 0.00 0.21 0.00 2.00 65.00 0.00 2.8588 10.500 29.40 0.00 0.00 0.00 6.20 0.95 1.15 0.21 0.00 0.00 0.21 0.00 2.00 65.00 0.00 2.8789 10.400 29.40 0.00 0.00 0.00 6.20 0.96 1.16 0.21 0.00 0.00 0.21 0.00 2.00 65.00 0.00 2.9090 10.300 29.40 0.00 0.00 0.00 6.20 0.96 1.16 0.21 0.00 0.00 0.21 0.00 2.00 65.00 0.00 2.9291 10.200 29.40 0.00 0.00 0.00 6.20 0.96 1.16 0.21 0.00 0.00 0.21 0.00 2.00 65.00 0.00 2.9492 10.100 29.40 0.00 0.00 0.00 6.20 0.96 1.16 0.21 0.00 0.00 0.21 0.00 2.00 65.00 0.00 2.9693 10.000 29.40 0.00 0.00 0.00 6.20 0.96 1.16 0.21 0.00 0.00 0.21 0.00 2.00 65.00 0.00 2.9894 9.900 29.40 0.00 0.00 0.00 6.19 0.96 1.16 0.21 0.00 0.00 0.21 0.00 2.00 65.00 0.00 3.00
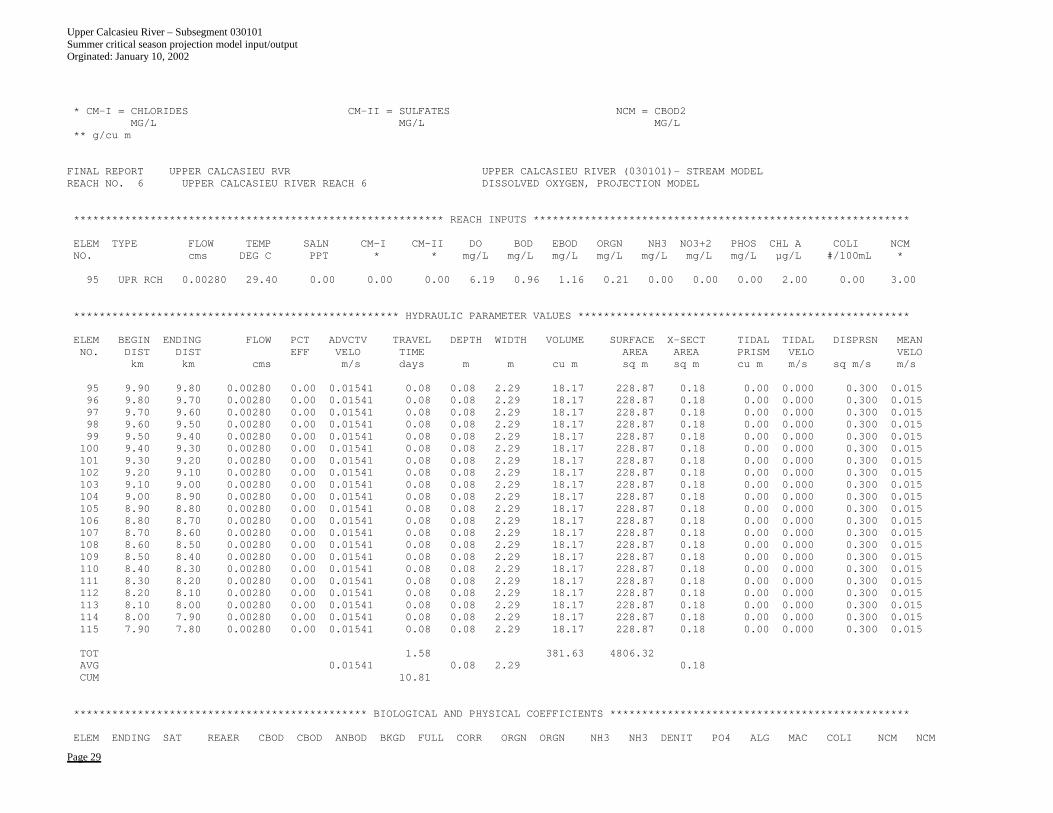
Upper Calcasieu River – Subsegment 030101 Summer critical season projection model input/output Orginated: January 10, 2002
Page 29
* CM-I = CHLORIDES CM-II = SULFATES NCM = CBOD2MG/L MG/L MG/L
** g/cu m
FINAL REPORT UPPER CALCASIEU RVR UPPER CALCASIEU RIVER (030101)- STREAM MODELREACH NO. 6 UPPER CALCASIEU RIVER REACH 6 DISSOLVED OXYGEN, PROJECTION MODEL
********************************************************** REACH INPUTS ***********************************************************
ELEM TYPE FLOW TEMP SALN CM-I CM-II DO BOD EBOD ORGN NH3 NO3+2 PHOS CHL A COLI NCMNO. cms DEG C PPT * * mg/L mg/L mg/L mg/L mg/L mg/L mg/L µg/L #/100mL *
95 UPR RCH 0.00280 29.40 0.00 0.00 0.00 6.19 0.96 1.16 0.21 0.00 0.00 0.00 2.00 0.00 3.00
*************************************************** HYDRAULIC PARAMETER VALUES ****************************************************
ELEM BEGIN ENDING FLOW PCT ADVCTV TRAVEL DEPTH WIDTH VOLUME SURFACE X-SECT TIDAL TIDAL DISPRSN MEANNO. DIST DIST EFF VELO TIME AREA AREA PRISM VELO VELO
km km cms m/s days m m cu m sq m sq m cu m m/s sq m/s m/s
95 9.90 9.80 0.00280 0.00 0.01541 0.08 0.08 2.29 18.17 228.87 0.18 0.00 0.000 0.300 0.01596 9.80 9.70 0.00280 0.00 0.01541 0.08 0.08 2.29 18.17 228.87 0.18 0.00 0.000 0.300 0.01597 9.70 9.60 0.00280 0.00 0.01541 0.08 0.08 2.29 18.17 228.87 0.18 0.00 0.000 0.300 0.01598 9.60 9.50 0.00280 0.00 0.01541 0.08 0.08 2.29 18.17 228.87 0.18 0.00 0.000 0.300 0.01599 9.50 9.40 0.00280 0.00 0.01541 0.08 0.08 2.29 18.17 228.87 0.18 0.00 0.000 0.300 0.015100 9.40 9.30 0.00280 0.00 0.01541 0.08 0.08 2.29 18.17 228.87 0.18 0.00 0.000 0.300 0.015101 9.30 9.20 0.00280 0.00 0.01541 0.08 0.08 2.29 18.17 228.87 0.18 0.00 0.000 0.300 0.015102 9.20 9.10 0.00280 0.00 0.01541 0.08 0.08 2.29 18.17 228.87 0.18 0.00 0.000 0.300 0.015103 9.10 9.00 0.00280 0.00 0.01541 0.08 0.08 2.29 18.17 228.87 0.18 0.00 0.000 0.300 0.015104 9.00 8.90 0.00280 0.00 0.01541 0.08 0.08 2.29 18.17 228.87 0.18 0.00 0.000 0.300 0.015105 8.90 8.80 0.00280 0.00 0.01541 0.08 0.08 2.29 18.17 228.87 0.18 0.00 0.000 0.300 0.015106 8.80 8.70 0.00280 0.00 0.01541 0.08 0.08 2.29 18.17 228.87 0.18 0.00 0.000 0.300 0.015107 8.70 8.60 0.00280 0.00 0.01541 0.08 0.08 2.29 18.17 228.87 0.18 0.00 0.000 0.300 0.015108 8.60 8.50 0.00280 0.00 0.01541 0.08 0.08 2.29 18.17 228.87 0.18 0.00 0.000 0.300 0.015109 8.50 8.40 0.00280 0.00 0.01541 0.08 0.08 2.29 18.17 228.87 0.18 0.00 0.000 0.300 0.015110 8.40 8.30 0.00280 0.00 0.01541 0.08 0.08 2.29 18.17 228.87 0.18 0.00 0.000 0.300 0.015111 8.30 8.20 0.00280 0.00 0.01541 0.08 0.08 2.29 18.17 228.87 0.18 0.00 0.000 0.300 0.015112 8.20 8.10 0.00280 0.00 0.01541 0.08 0.08 2.29 18.17 228.87 0.18 0.00 0.000 0.300 0.015113 8.10 8.00 0.00280 0.00 0.01541 0.08 0.08 2.29 18.17 228.87 0.18 0.00 0.000 0.300 0.015114 8.00 7.90 0.00280 0.00 0.01541 0.08 0.08 2.29 18.17 228.87 0.18 0.00 0.000 0.300 0.015115 7.90 7.80 0.00280 0.00 0.01541 0.08 0.08 2.29 18.17 228.87 0.18 0.00 0.000 0.300 0.015
TOT 1.58 381.63 4806.32AVG 0.01541 0.08 2.29 0.18CUM 10.81
********************************************** BIOLOGICAL AND PHYSICAL COEFFICIENTS ***********************************************
ELEM ENDING SAT REAER CBOD CBOD ANBOD BKGD FULL CORR ORGN ORGN NH3 NH3 DENIT PO4 ALG MAC COLI NCM NCM
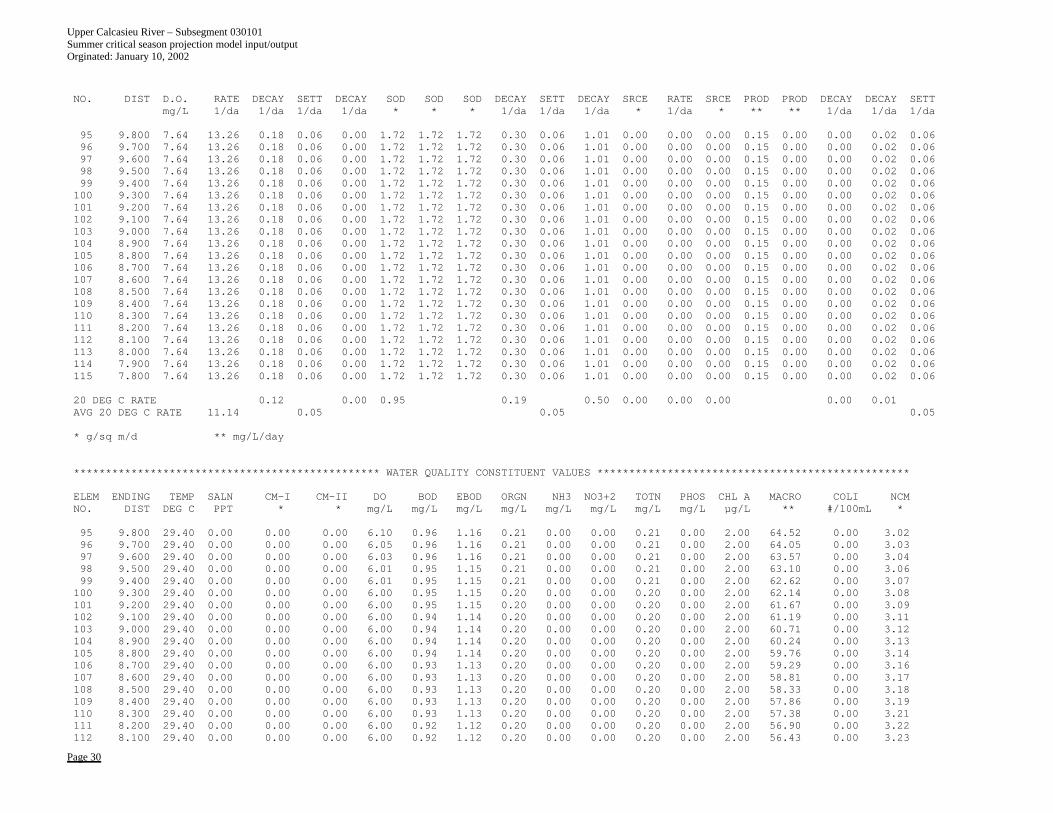
Upper Calcasieu River – Subsegment 030101 Summer critical season projection model input/output Orginated: January 10, 2002
Page 30
NO. DIST D.O. RATE DECAY SETT DECAY SOD SOD SOD DECAY SETT DECAY SRCE RATE SRCE PROD PROD DECAY DECAY SETTmg/L 1/da 1/da 1/da 1/da * * * 1/da 1/da 1/da * 1/da * ** ** 1/da 1/da 1/da
95 9.800 7.64 13.26 0.18 0.06 0.00 1.72 1.72 1.72 0.30 0.06 1.01 0.00 0.00 0.00 0.15 0.00 0.00 0.02 0.0696 9.700 7.64 13.26 0.18 0.06 0.00 1.72 1.72 1.72 0.30 0.06 1.01 0.00 0.00 0.00 0.15 0.00 0.00 0.02 0.0697 9.600 7.64 13.26 0.18 0.06 0.00 1.72 1.72 1.72 0.30 0.06 1.01 0.00 0.00 0.00 0.15 0.00 0.00 0.02 0.0698 9.500 7.64 13.26 0.18 0.06 0.00 1.72 1.72 1.72 0.30 0.06 1.01 0.00 0.00 0.00 0.15 0.00 0.00 0.02 0.0699 9.400 7.64 13.26 0.18 0.06 0.00 1.72 1.72 1.72 0.30 0.06 1.01 0.00 0.00 0.00 0.15 0.00 0.00 0.02 0.06100 9.300 7.64 13.26 0.18 0.06 0.00 1.72 1.72 1.72 0.30 0.06 1.01 0.00 0.00 0.00 0.15 0.00 0.00 0.02 0.06101 9.200 7.64 13.26 0.18 0.06 0.00 1.72 1.72 1.72 0.30 0.06 1.01 0.00 0.00 0.00 0.15 0.00 0.00 0.02 0.06102 9.100 7.64 13.26 0.18 0.06 0.00 1.72 1.72 1.72 0.30 0.06 1.01 0.00 0.00 0.00 0.15 0.00 0.00 0.02 0.06103 9.000 7.64 13.26 0.18 0.06 0.00 1.72 1.72 1.72 0.30 0.06 1.01 0.00 0.00 0.00 0.15 0.00 0.00 0.02 0.06104 8.900 7.64 13.26 0.18 0.06 0.00 1.72 1.72 1.72 0.30 0.06 1.01 0.00 0.00 0.00 0.15 0.00 0.00 0.02 0.06105 8.800 7.64 13.26 0.18 0.06 0.00 1.72 1.72 1.72 0.30 0.06 1.01 0.00 0.00 0.00 0.15 0.00 0.00 0.02 0.06106 8.700 7.64 13.26 0.18 0.06 0.00 1.72 1.72 1.72 0.30 0.06 1.01 0.00 0.00 0.00 0.15 0.00 0.00 0.02 0.06107 8.600 7.64 13.26 0.18 0.06 0.00 1.72 1.72 1.72 0.30 0.06 1.01 0.00 0.00 0.00 0.15 0.00 0.00 0.02 0.06108 8.500 7.64 13.26 0.18 0.06 0.00 1.72 1.72 1.72 0.30 0.06 1.01 0.00 0.00 0.00 0.15 0.00 0.00 0.02 0.06109 8.400 7.64 13.26 0.18 0.06 0.00 1.72 1.72 1.72 0.30 0.06 1.01 0.00 0.00 0.00 0.15 0.00 0.00 0.02 0.06110 8.300 7.64 13.26 0.18 0.06 0.00 1.72 1.72 1.72 0.30 0.06 1.01 0.00 0.00 0.00 0.15 0.00 0.00 0.02 0.06111 8.200 7.64 13.26 0.18 0.06 0.00 1.72 1.72 1.72 0.30 0.06 1.01 0.00 0.00 0.00 0.15 0.00 0.00 0.02 0.06112 8.100 7.64 13.26 0.18 0.06 0.00 1.72 1.72 1.72 0.30 0.06 1.01 0.00 0.00 0.00 0.15 0.00 0.00 0.02 0.06113 8.000 7.64 13.26 0.18 0.06 0.00 1.72 1.72 1.72 0.30 0.06 1.01 0.00 0.00 0.00 0.15 0.00 0.00 0.02 0.06114 7.900 7.64 13.26 0.18 0.06 0.00 1.72 1.72 1.72 0.30 0.06 1.01 0.00 0.00 0.00 0.15 0.00 0.00 0.02 0.06115 7.800 7.64 13.26 0.18 0.06 0.00 1.72 1.72 1.72 0.30 0.06 1.01 0.00 0.00 0.00 0.15 0.00 0.00 0.02 0.06
20 DEG C RATE 0.12 0.00 0.95 0.19 0.50 0.00 0.00 0.00 0.00 0.01AVG 20 DEG C RATE 11.14 0.05 0.05 0.05
* g/sq m/d ** mg/L/day
************************************************ WATER QUALITY CONSTITUENT VALUES *************************************************
ELEM ENDING TEMP SALN CM-I CM-II DO BOD EBOD ORGN NH3 NO3+2 TOTN PHOS CHL A MACRO COLI NCMNO. DIST DEG C PPT * * mg/L mg/L mg/L mg/L mg/L mg/L mg/L mg/L µg/L ** #/100mL *
95 9.800 29.40 0.00 0.00 0.00 6.10 0.96 1.16 0.21 0.00 0.00 0.21 0.00 2.00 64.52 0.00 3.0296 9.700 29.40 0.00 0.00 0.00 6.05 0.96 1.16 0.21 0.00 0.00 0.21 0.00 2.00 64.05 0.00 3.0397 9.600 29.40 0.00 0.00 0.00 6.03 0.96 1.16 0.21 0.00 0.00 0.21 0.00 2.00 63.57 0.00 3.0498 9.500 29.40 0.00 0.00 0.00 6.01 0.95 1.15 0.21 0.00 0.00 0.21 0.00 2.00 63.10 0.00 3.0699 9.400 29.40 0.00 0.00 0.00 6.01 0.95 1.15 0.21 0.00 0.00 0.21 0.00 2.00 62.62 0.00 3.07100 9.300 29.40 0.00 0.00 0.00 6.00 0.95 1.15 0.20 0.00 0.00 0.20 0.00 2.00 62.14 0.00 3.08101 9.200 29.40 0.00 0.00 0.00 6.00 0.95 1.15 0.20 0.00 0.00 0.20 0.00 2.00 61.67 0.00 3.09102 9.100 29.40 0.00 0.00 0.00 6.00 0.94 1.14 0.20 0.00 0.00 0.20 0.00 2.00 61.19 0.00 3.11103 9.000 29.40 0.00 0.00 0.00 6.00 0.94 1.14 0.20 0.00 0.00 0.20 0.00 2.00 60.71 0.00 3.12104 8.900 29.40 0.00 0.00 0.00 6.00 0.94 1.14 0.20 0.00 0.00 0.20 0.00 2.00 60.24 0.00 3.13105 8.800 29.40 0.00 0.00 0.00 6.00 0.94 1.14 0.20 0.00 0.00 0.20 0.00 2.00 59.76 0.00 3.14106 8.700 29.40 0.00 0.00 0.00 6.00 0.93 1.13 0.20 0.00 0.00 0.20 0.00 2.00 59.29 0.00 3.16107 8.600 29.40 0.00 0.00 0.00 6.00 0.93 1.13 0.20 0.00 0.00 0.20 0.00 2.00 58.81 0.00 3.17108 8.500 29.40 0.00 0.00 0.00 6.00 0.93 1.13 0.20 0.00 0.00 0.20 0.00 2.00 58.33 0.00 3.18109 8.400 29.40 0.00 0.00 0.00 6.00 0.93 1.13 0.20 0.00 0.00 0.20 0.00 2.00 57.86 0.00 3.19110 8.300 29.40 0.00 0.00 0.00 6.00 0.93 1.13 0.20 0.00 0.00 0.20 0.00 2.00 57.38 0.00 3.21111 8.200 29.40 0.00 0.00 0.00 6.00 0.92 1.12 0.20 0.00 0.00 0.20 0.00 2.00 56.90 0.00 3.22112 8.100 29.40 0.00 0.00 0.00 6.00 0.92 1.12 0.20 0.00 0.00 0.20 0.00 2.00 56.43 0.00 3.23
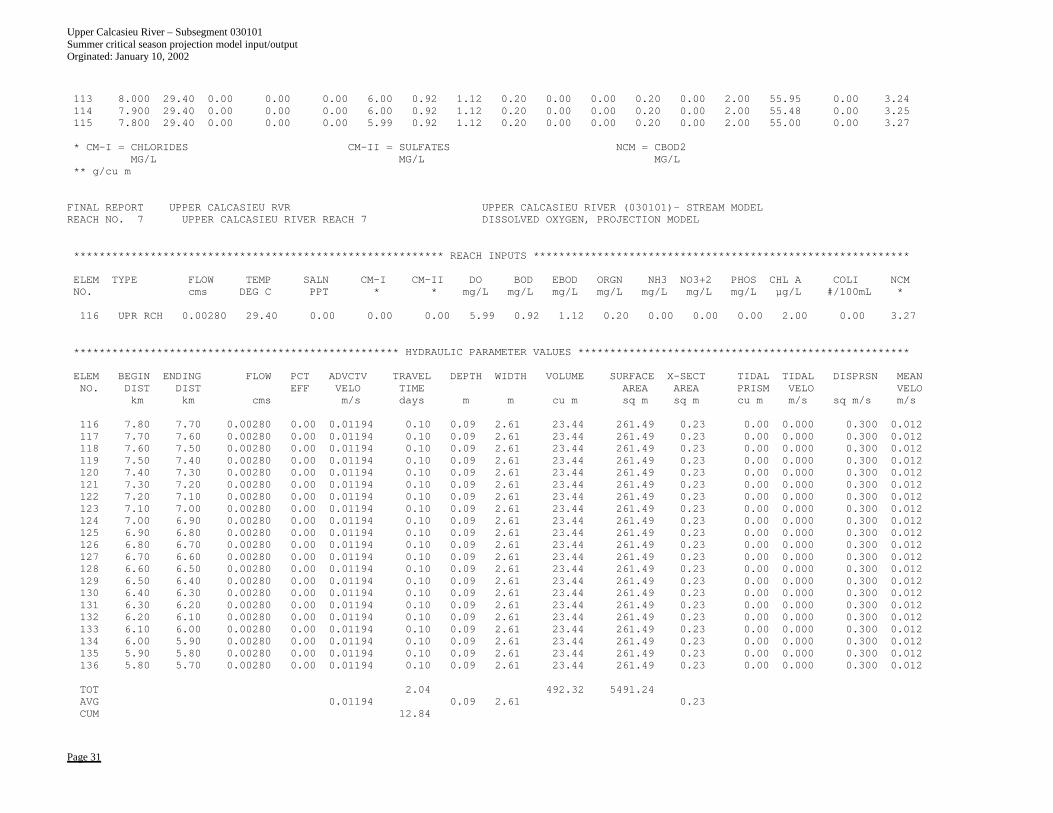
Upper Calcasieu River – Subsegment 030101 Summer critical season projection model input/output Orginated: January 10, 2002
Page 31
113 8.000 29.40 0.00 0.00 0.00 6.00 0.92 1.12 0.20 0.00 0.00 0.20 0.00 2.00 55.95 0.00 3.24114 7.900 29.40 0.00 0.00 0.00 6.00 0.92 1.12 0.20 0.00 0.00 0.20 0.00 2.00 55.48 0.00 3.25115 7.800 29.40 0.00 0.00 0.00 5.99 0.92 1.12 0.20 0.00 0.00 0.20 0.00 2.00 55.00 0.00 3.27
* CM-I = CHLORIDES CM-II = SULFATES NCM = CBOD2MG/L MG/L MG/L
** g/cu m
FINAL REPORT UPPER CALCASIEU RVR UPPER CALCASIEU RIVER (030101)- STREAM MODELREACH NO. 7 UPPER CALCASIEU RIVER REACH 7 DISSOLVED OXYGEN, PROJECTION MODEL
********************************************************** REACH INPUTS ***********************************************************
ELEM TYPE FLOW TEMP SALN CM-I CM-II DO BOD EBOD ORGN NH3 NO3+2 PHOS CHL A COLI NCMNO. cms DEG C PPT * * mg/L mg/L mg/L mg/L mg/L mg/L mg/L µg/L #/100mL *
116 UPR RCH 0.00280 29.40 0.00 0.00 0.00 5.99 0.92 1.12 0.20 0.00 0.00 0.00 2.00 0.00 3.27
*************************************************** HYDRAULIC PARAMETER VALUES ****************************************************
ELEM BEGIN ENDING FLOW PCT ADVCTV TRAVEL DEPTH WIDTH VOLUME SURFACE X-SECT TIDAL TIDAL DISPRSN MEANNO. DIST DIST EFF VELO TIME AREA AREA PRISM VELO VELO
km km cms m/s days m m cu m sq m sq m cu m m/s sq m/s m/s
116 7.80 7.70 0.00280 0.00 0.01194 0.10 0.09 2.61 23.44 261.49 0.23 0.00 0.000 0.300 0.012117 7.70 7.60 0.00280 0.00 0.01194 0.10 0.09 2.61 23.44 261.49 0.23 0.00 0.000 0.300 0.012118 7.60 7.50 0.00280 0.00 0.01194 0.10 0.09 2.61 23.44 261.49 0.23 0.00 0.000 0.300 0.012119 7.50 7.40 0.00280 0.00 0.01194 0.10 0.09 2.61 23.44 261.49 0.23 0.00 0.000 0.300 0.012120 7.40 7.30 0.00280 0.00 0.01194 0.10 0.09 2.61 23.44 261.49 0.23 0.00 0.000 0.300 0.012121 7.30 7.20 0.00280 0.00 0.01194 0.10 0.09 2.61 23.44 261.49 0.23 0.00 0.000 0.300 0.012122 7.20 7.10 0.00280 0.00 0.01194 0.10 0.09 2.61 23.44 261.49 0.23 0.00 0.000 0.300 0.012123 7.10 7.00 0.00280 0.00 0.01194 0.10 0.09 2.61 23.44 261.49 0.23 0.00 0.000 0.300 0.012124 7.00 6.90 0.00280 0.00 0.01194 0.10 0.09 2.61 23.44 261.49 0.23 0.00 0.000 0.300 0.012125 6.90 6.80 0.00280 0.00 0.01194 0.10 0.09 2.61 23.44 261.49 0.23 0.00 0.000 0.300 0.012126 6.80 6.70 0.00280 0.00 0.01194 0.10 0.09 2.61 23.44 261.49 0.23 0.00 0.000 0.300 0.012127 6.70 6.60 0.00280 0.00 0.01194 0.10 0.09 2.61 23.44 261.49 0.23 0.00 0.000 0.300 0.012128 6.60 6.50 0.00280 0.00 0.01194 0.10 0.09 2.61 23.44 261.49 0.23 0.00 0.000 0.300 0.012129 6.50 6.40 0.00280 0.00 0.01194 0.10 0.09 2.61 23.44 261.49 0.23 0.00 0.000 0.300 0.012130 6.40 6.30 0.00280 0.00 0.01194 0.10 0.09 2.61 23.44 261.49 0.23 0.00 0.000 0.300 0.012131 6.30 6.20 0.00280 0.00 0.01194 0.10 0.09 2.61 23.44 261.49 0.23 0.00 0.000 0.300 0.012132 6.20 6.10 0.00280 0.00 0.01194 0.10 0.09 2.61 23.44 261.49 0.23 0.00 0.000 0.300 0.012133 6.10 6.00 0.00280 0.00 0.01194 0.10 0.09 2.61 23.44 261.49 0.23 0.00 0.000 0.300 0.012134 6.00 5.90 0.00280 0.00 0.01194 0.10 0.09 2.61 23.44 261.49 0.23 0.00 0.000 0.300 0.012135 5.90 5.80 0.00280 0.00 0.01194 0.10 0.09 2.61 23.44 261.49 0.23 0.00 0.000 0.300 0.012136 5.80 5.70 0.00280 0.00 0.01194 0.10 0.09 2.61 23.44 261.49 0.23 0.00 0.000 0.300 0.012
TOT 2.04 492.32 5491.24AVG 0.01194 0.09 2.61 0.23CUM 12.84
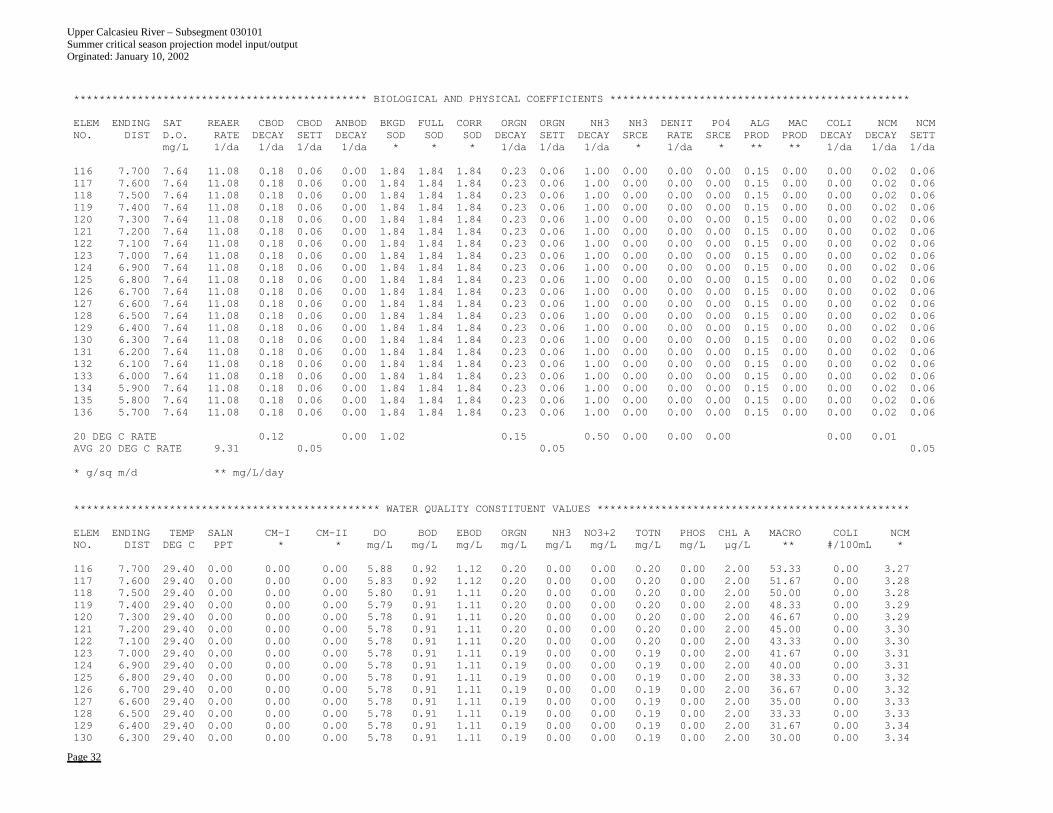
Upper Calcasieu River – Subsegment 030101 Summer critical season projection model input/output Orginated: January 10, 2002
Page 32
********************************************** BIOLOGICAL AND PHYSICAL COEFFICIENTS ***********************************************
ELEM ENDING SAT REAER CBOD CBOD ANBOD BKGD FULL CORR ORGN ORGN NH3 NH3 DENIT PO4 ALG MAC COLI NCM NCMNO. DIST D.O. RATE DECAY SETT DECAY SOD SOD SOD DECAY SETT DECAY SRCE RATE SRCE PROD PROD DECAY DECAY SETT
mg/L 1/da 1/da 1/da 1/da * * * 1/da 1/da 1/da * 1/da * ** ** 1/da 1/da 1/da
116 7.700 7.64 11.08 0.18 0.06 0.00 1.84 1.84 1.84 0.23 0.06 1.00 0.00 0.00 0.00 0.15 0.00 0.00 0.02 0.06117 7.600 7.64 11.08 0.18 0.06 0.00 1.84 1.84 1.84 0.23 0.06 1.00 0.00 0.00 0.00 0.15 0.00 0.00 0.02 0.06118 7.500 7.64 11.08 0.18 0.06 0.00 1.84 1.84 1.84 0.23 0.06 1.00 0.00 0.00 0.00 0.15 0.00 0.00 0.02 0.06119 7.400 7.64 11.08 0.18 0.06 0.00 1.84 1.84 1.84 0.23 0.06 1.00 0.00 0.00 0.00 0.15 0.00 0.00 0.02 0.06120 7.300 7.64 11.08 0.18 0.06 0.00 1.84 1.84 1.84 0.23 0.06 1.00 0.00 0.00 0.00 0.15 0.00 0.00 0.02 0.06121 7.200 7.64 11.08 0.18 0.06 0.00 1.84 1.84 1.84 0.23 0.06 1.00 0.00 0.00 0.00 0.15 0.00 0.00 0.02 0.06122 7.100 7.64 11.08 0.18 0.06 0.00 1.84 1.84 1.84 0.23 0.06 1.00 0.00 0.00 0.00 0.15 0.00 0.00 0.02 0.06123 7.000 7.64 11.08 0.18 0.06 0.00 1.84 1.84 1.84 0.23 0.06 1.00 0.00 0.00 0.00 0.15 0.00 0.00 0.02 0.06124 6.900 7.64 11.08 0.18 0.06 0.00 1.84 1.84 1.84 0.23 0.06 1.00 0.00 0.00 0.00 0.15 0.00 0.00 0.02 0.06125 6.800 7.64 11.08 0.18 0.06 0.00 1.84 1.84 1.84 0.23 0.06 1.00 0.00 0.00 0.00 0.15 0.00 0.00 0.02 0.06126 6.700 7.64 11.08 0.18 0.06 0.00 1.84 1.84 1.84 0.23 0.06 1.00 0.00 0.00 0.00 0.15 0.00 0.00 0.02 0.06127 6.600 7.64 11.08 0.18 0.06 0.00 1.84 1.84 1.84 0.23 0.06 1.00 0.00 0.00 0.00 0.15 0.00 0.00 0.02 0.06128 6.500 7.64 11.08 0.18 0.06 0.00 1.84 1.84 1.84 0.23 0.06 1.00 0.00 0.00 0.00 0.15 0.00 0.00 0.02 0.06129 6.400 7.64 11.08 0.18 0.06 0.00 1.84 1.84 1.84 0.23 0.06 1.00 0.00 0.00 0.00 0.15 0.00 0.00 0.02 0.06130 6.300 7.64 11.08 0.18 0.06 0.00 1.84 1.84 1.84 0.23 0.06 1.00 0.00 0.00 0.00 0.15 0.00 0.00 0.02 0.06131 6.200 7.64 11.08 0.18 0.06 0.00 1.84 1.84 1.84 0.23 0.06 1.00 0.00 0.00 0.00 0.15 0.00 0.00 0.02 0.06132 6.100 7.64 11.08 0.18 0.06 0.00 1.84 1.84 1.84 0.23 0.06 1.00 0.00 0.00 0.00 0.15 0.00 0.00 0.02 0.06133 6.000 7.64 11.08 0.18 0.06 0.00 1.84 1.84 1.84 0.23 0.06 1.00 0.00 0.00 0.00 0.15 0.00 0.00 0.02 0.06134 5.900 7.64 11.08 0.18 0.06 0.00 1.84 1.84 1.84 0.23 0.06 1.00 0.00 0.00 0.00 0.15 0.00 0.00 0.02 0.06135 5.800 7.64 11.08 0.18 0.06 0.00 1.84 1.84 1.84 0.23 0.06 1.00 0.00 0.00 0.00 0.15 0.00 0.00 0.02 0.06136 5.700 7.64 11.08 0.18 0.06 0.00 1.84 1.84 1.84 0.23 0.06 1.00 0.00 0.00 0.00 0.15 0.00 0.00 0.02 0.06
20 DEG C RATE 0.12 0.00 1.02 0.15 0.50 0.00 0.00 0.00 0.00 0.01AVG 20 DEG C RATE 9.31 0.05 0.05 0.05
* g/sq m/d ** mg/L/day
************************************************ WATER QUALITY CONSTITUENT VALUES *************************************************
ELEM ENDING TEMP SALN CM-I CM-II DO BOD EBOD ORGN NH3 NO3+2 TOTN PHOS CHL A MACRO COLI NCMNO. DIST DEG C PPT * * mg/L mg/L mg/L mg/L mg/L mg/L mg/L mg/L µg/L ** #/100mL *
116 7.700 29.40 0.00 0.00 0.00 5.88 0.92 1.12 0.20 0.00 0.00 0.20 0.00 2.00 53.33 0.00 3.27117 7.600 29.40 0.00 0.00 0.00 5.83 0.92 1.12 0.20 0.00 0.00 0.20 0.00 2.00 51.67 0.00 3.28118 7.500 29.40 0.00 0.00 0.00 5.80 0.91 1.11 0.20 0.00 0.00 0.20 0.00 2.00 50.00 0.00 3.28119 7.400 29.40 0.00 0.00 0.00 5.79 0.91 1.11 0.20 0.00 0.00 0.20 0.00 2.00 48.33 0.00 3.29120 7.300 29.40 0.00 0.00 0.00 5.78 0.91 1.11 0.20 0.00 0.00 0.20 0.00 2.00 46.67 0.00 3.29121 7.200 29.40 0.00 0.00 0.00 5.78 0.91 1.11 0.20 0.00 0.00 0.20 0.00 2.00 45.00 0.00 3.30122 7.100 29.40 0.00 0.00 0.00 5.78 0.91 1.11 0.20 0.00 0.00 0.20 0.00 2.00 43.33 0.00 3.30123 7.000 29.40 0.00 0.00 0.00 5.78 0.91 1.11 0.19 0.00 0.00 0.19 0.00 2.00 41.67 0.00 3.31124 6.900 29.40 0.00 0.00 0.00 5.78 0.91 1.11 0.19 0.00 0.00 0.19 0.00 2.00 40.00 0.00 3.31125 6.800 29.40 0.00 0.00 0.00 5.78 0.91 1.11 0.19 0.00 0.00 0.19 0.00 2.00 38.33 0.00 3.32126 6.700 29.40 0.00 0.00 0.00 5.78 0.91 1.11 0.19 0.00 0.00 0.19 0.00 2.00 36.67 0.00 3.32127 6.600 29.40 0.00 0.00 0.00 5.78 0.91 1.11 0.19 0.00 0.00 0.19 0.00 2.00 35.00 0.00 3.33128 6.500 29.40 0.00 0.00 0.00 5.78 0.91 1.11 0.19 0.00 0.00 0.19 0.00 2.00 33.33 0.00 3.33129 6.400 29.40 0.00 0.00 0.00 5.78 0.91 1.11 0.19 0.00 0.00 0.19 0.00 2.00 31.67 0.00 3.34130 6.300 29.40 0.00 0.00 0.00 5.78 0.91 1.11 0.19 0.00 0.00 0.19 0.00 2.00 30.00 0.00 3.34
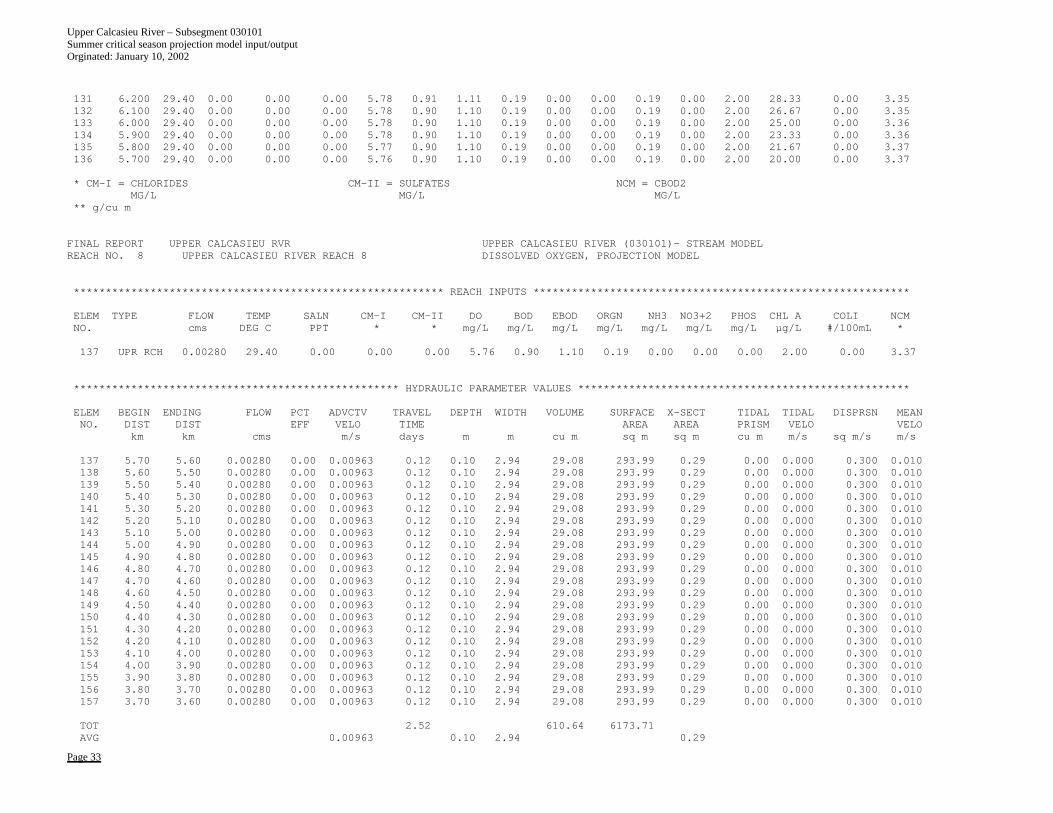
Upper Calcasieu River – Subsegment 030101 Summer critical season projection model input/output Orginated: January 10, 2002
Page 33
131 6.200 29.40 0.00 0.00 0.00 5.78 0.91 1.11 0.19 0.00 0.00 0.19 0.00 2.00 28.33 0.00 3.35132 6.100 29.40 0.00 0.00 0.00 5.78 0.90 1.10 0.19 0.00 0.00 0.19 0.00 2.00 26.67 0.00 3.35133 6.000 29.40 0.00 0.00 0.00 5.78 0.90 1.10 0.19 0.00 0.00 0.19 0.00 2.00 25.00 0.00 3.36134 5.900 29.40 0.00 0.00 0.00 5.78 0.90 1.10 0.19 0.00 0.00 0.19 0.00 2.00 23.33 0.00 3.36135 5.800 29.40 0.00 0.00 0.00 5.77 0.90 1.10 0.19 0.00 0.00 0.19 0.00 2.00 21.67 0.00 3.37136 5.700 29.40 0.00 0.00 0.00 5.76 0.90 1.10 0.19 0.00 0.00 0.19 0.00 2.00 20.00 0.00 3.37
* CM-I = CHLORIDES CM-II = SULFATES NCM = CBOD2MG/L MG/L MG/L
** g/cu m
FINAL REPORT UPPER CALCASIEU RVR UPPER CALCASIEU RIVER (030101)- STREAM MODELREACH NO. 8 UPPER CALCASIEU RIVER REACH 8 DISSOLVED OXYGEN, PROJECTION MODEL
********************************************************** REACH INPUTS ***********************************************************
ELEM TYPE FLOW TEMP SALN CM-I CM-II DO BOD EBOD ORGN NH3 NO3+2 PHOS CHL A COLI NCMNO. cms DEG C PPT * * mg/L mg/L mg/L mg/L mg/L mg/L mg/L µg/L #/100mL *
137 UPR RCH 0.00280 29.40 0.00 0.00 0.00 5.76 0.90 1.10 0.19 0.00 0.00 0.00 2.00 0.00 3.37
*************************************************** HYDRAULIC PARAMETER VALUES ****************************************************
ELEM BEGIN ENDING FLOW PCT ADVCTV TRAVEL DEPTH WIDTH VOLUME SURFACE X-SECT TIDAL TIDAL DISPRSN MEANNO. DIST DIST EFF VELO TIME AREA AREA PRISM VELO VELO
km km cms m/s days m m cu m sq m sq m cu m m/s sq m/s m/s
137 5.70 5.60 0.00280 0.00 0.00963 0.12 0.10 2.94 29.08 293.99 0.29 0.00 0.000 0.300 0.010138 5.60 5.50 0.00280 0.00 0.00963 0.12 0.10 2.94 29.08 293.99 0.29 0.00 0.000 0.300 0.010139 5.50 5.40 0.00280 0.00 0.00963 0.12 0.10 2.94 29.08 293.99 0.29 0.00 0.000 0.300 0.010140 5.40 5.30 0.00280 0.00 0.00963 0.12 0.10 2.94 29.08 293.99 0.29 0.00 0.000 0.300 0.010141 5.30 5.20 0.00280 0.00 0.00963 0.12 0.10 2.94 29.08 293.99 0.29 0.00 0.000 0.300 0.010142 5.20 5.10 0.00280 0.00 0.00963 0.12 0.10 2.94 29.08 293.99 0.29 0.00 0.000 0.300 0.010143 5.10 5.00 0.00280 0.00 0.00963 0.12 0.10 2.94 29.08 293.99 0.29 0.00 0.000 0.300 0.010144 5.00 4.90 0.00280 0.00 0.00963 0.12 0.10 2.94 29.08 293.99 0.29 0.00 0.000 0.300 0.010145 4.90 4.80 0.00280 0.00 0.00963 0.12 0.10 2.94 29.08 293.99 0.29 0.00 0.000 0.300 0.010146 4.80 4.70 0.00280 0.00 0.00963 0.12 0.10 2.94 29.08 293.99 0.29 0.00 0.000 0.300 0.010147 4.70 4.60 0.00280 0.00 0.00963 0.12 0.10 2.94 29.08 293.99 0.29 0.00 0.000 0.300 0.010148 4.60 4.50 0.00280 0.00 0.00963 0.12 0.10 2.94 29.08 293.99 0.29 0.00 0.000 0.300 0.010149 4.50 4.40 0.00280 0.00 0.00963 0.12 0.10 2.94 29.08 293.99 0.29 0.00 0.000 0.300 0.010150 4.40 4.30 0.00280 0.00 0.00963 0.12 0.10 2.94 29.08 293.99 0.29 0.00 0.000 0.300 0.010151 4.30 4.20 0.00280 0.00 0.00963 0.12 0.10 2.94 29.08 293.99 0.29 0.00 0.000 0.300 0.010152 4.20 4.10 0.00280 0.00 0.00963 0.12 0.10 2.94 29.08 293.99 0.29 0.00 0.000 0.300 0.010153 4.10 4.00 0.00280 0.00 0.00963 0.12 0.10 2.94 29.08 293.99 0.29 0.00 0.000 0.300 0.010154 4.00 3.90 0.00280 0.00 0.00963 0.12 0.10 2.94 29.08 293.99 0.29 0.00 0.000 0.300 0.010155 3.90 3.80 0.00280 0.00 0.00963 0.12 0.10 2.94 29.08 293.99 0.29 0.00 0.000 0.300 0.010156 3.80 3.70 0.00280 0.00 0.00963 0.12 0.10 2.94 29.08 293.99 0.29 0.00 0.000 0.300 0.010157 3.70 3.60 0.00280 0.00 0.00963 0.12 0.10 2.94 29.08 293.99 0.29 0.00 0.000 0.300 0.010
TOT 2.52 610.64 6173.71AVG 0.00963 0.10 2.94 0.29
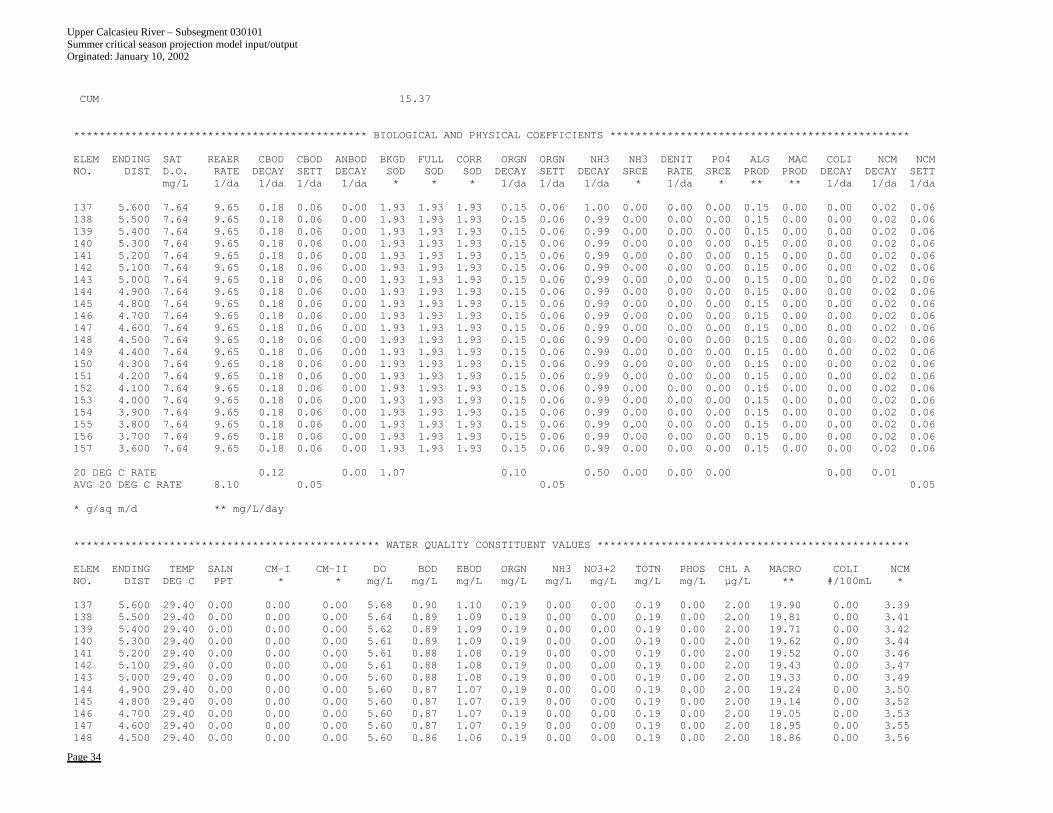
Upper Calcasieu River – Subsegment 030101 Summer critical season projection model input/output Orginated: January 10, 2002
Page 34
CUM 15.37
********************************************** BIOLOGICAL AND PHYSICAL COEFFICIENTS ***********************************************
ELEM ENDING SAT REAER CBOD CBOD ANBOD BKGD FULL CORR ORGN ORGN NH3 NH3 DENIT PO4 ALG MAC COLI NCM NCMNO. DIST D.O. RATE DECAY SETT DECAY SOD SOD SOD DECAY SETT DECAY SRCE RATE SRCE PROD PROD DECAY DECAY SETT
mg/L 1/da 1/da 1/da 1/da * * * 1/da 1/da 1/da * 1/da * ** ** 1/da 1/da 1/da
137 5.600 7.64 9.65 0.18 0.06 0.00 1.93 1.93 1.93 0.15 0.06 1.00 0.00 0.00 0.00 0.15 0.00 0.00 0.02 0.06138 5.500 7.64 9.65 0.18 0.06 0.00 1.93 1.93 1.93 0.15 0.06 0.99 0.00 0.00 0.00 0.15 0.00 0.00 0.02 0.06139 5.400 7.64 9.65 0.18 0.06 0.00 1.93 1.93 1.93 0.15 0.06 0.99 0.00 0.00 0.00 0.15 0.00 0.00 0.02 0.06140 5.300 7.64 9.65 0.18 0.06 0.00 1.93 1.93 1.93 0.15 0.06 0.99 0.00 0.00 0.00 0.15 0.00 0.00 0.02 0.06141 5.200 7.64 9.65 0.18 0.06 0.00 1.93 1.93 1.93 0.15 0.06 0.99 0.00 0.00 0.00 0.15 0.00 0.00 0.02 0.06142 5.100 7.64 9.65 0.18 0.06 0.00 1.93 1.93 1.93 0.15 0.06 0.99 0.00 0.00 0.00 0.15 0.00 0.00 0.02 0.06143 5.000 7.64 9.65 0.18 0.06 0.00 1.93 1.93 1.93 0.15 0.06 0.99 0.00 0.00 0.00 0.15 0.00 0.00 0.02 0.06144 4.900 7.64 9.65 0.18 0.06 0.00 1.93 1.93 1.93 0.15 0.06 0.99 0.00 0.00 0.00 0.15 0.00 0.00 0.02 0.06145 4.800 7.64 9.65 0.18 0.06 0.00 1.93 1.93 1.93 0.15 0.06 0.99 0.00 0.00 0.00 0.15 0.00 0.00 0.02 0.06146 4.700 7.64 9.65 0.18 0.06 0.00 1.93 1.93 1.93 0.15 0.06 0.99 0.00 0.00 0.00 0.15 0.00 0.00 0.02 0.06147 4.600 7.64 9.65 0.18 0.06 0.00 1.93 1.93 1.93 0.15 0.06 0.99 0.00 0.00 0.00 0.15 0.00 0.00 0.02 0.06148 4.500 7.64 9.65 0.18 0.06 0.00 1.93 1.93 1.93 0.15 0.06 0.99 0.00 0.00 0.00 0.15 0.00 0.00 0.02 0.06149 4.400 7.64 9.65 0.18 0.06 0.00 1.93 1.93 1.93 0.15 0.06 0.99 0.00 0.00 0.00 0.15 0.00 0.00 0.02 0.06150 4.300 7.64 9.65 0.18 0.06 0.00 1.93 1.93 1.93 0.15 0.06 0.99 0.00 0.00 0.00 0.15 0.00 0.00 0.02 0.06151 4.200 7.64 9.65 0.18 0.06 0.00 1.93 1.93 1.93 0.15 0.06 0.99 0.00 0.00 0.00 0.15 0.00 0.00 0.02 0.06152 4.100 7.64 9.65 0.18 0.06 0.00 1.93 1.93 1.93 0.15 0.06 0.99 0.00 0.00 0.00 0.15 0.00 0.00 0.02 0.06153 4.000 7.64 9.65 0.18 0.06 0.00 1.93 1.93 1.93 0.15 0.06 0.99 0.00 0.00 0.00 0.15 0.00 0.00 0.02 0.06154 3.900 7.64 9.65 0.18 0.06 0.00 1.93 1.93 1.93 0.15 0.06 0.99 0.00 0.00 0.00 0.15 0.00 0.00 0.02 0.06155 3.800 7.64 9.65 0.18 0.06 0.00 1.93 1.93 1.93 0.15 0.06 0.99 0.00 0.00 0.00 0.15 0.00 0.00 0.02 0.06156 3.700 7.64 9.65 0.18 0.06 0.00 1.93 1.93 1.93 0.15 0.06 0.99 0.00 0.00 0.00 0.15 0.00 0.00 0.02 0.06157 3.600 7.64 9.65 0.18 0.06 0.00 1.93 1.93 1.93 0.15 0.06 0.99 0.00 0.00 0.00 0.15 0.00 0.00 0.02 0.06
20 DEG C RATE 0.12 0.00 1.07 0.10 0.50 0.00 0.00 0.00 0.00 0.01AVG 20 DEG C RATE 8.10 0.05 0.05 0.05
* g/sq m/d ** mg/L/day
************************************************ WATER QUALITY CONSTITUENT VALUES *************************************************
ELEM ENDING TEMP SALN CM-I CM-II DO BOD EBOD ORGN NH3 NO3+2 TOTN PHOS CHL A MACRO COLI NCMNO. DIST DEG C PPT * * mg/L mg/L mg/L mg/L mg/L mg/L mg/L mg/L µg/L ** #/100mL *
137 5.600 29.40 0.00 0.00 0.00 5.68 0.90 1.10 0.19 0.00 0.00 0.19 0.00 2.00 19.90 0.00 3.39138 5.500 29.40 0.00 0.00 0.00 5.64 0.89 1.09 0.19 0.00 0.00 0.19 0.00 2.00 19.81 0.00 3.41139 5.400 29.40 0.00 0.00 0.00 5.62 0.89 1.09 0.19 0.00 0.00 0.19 0.00 2.00 19.71 0.00 3.42140 5.300 29.40 0.00 0.00 0.00 5.61 0.89 1.09 0.19 0.00 0.00 0.19 0.00 2.00 19.62 0.00 3.44141 5.200 29.40 0.00 0.00 0.00 5.61 0.88 1.08 0.19 0.00 0.00 0.19 0.00 2.00 19.52 0.00 3.46142 5.100 29.40 0.00 0.00 0.00 5.61 0.88 1.08 0.19 0.00 0.00 0.19 0.00 2.00 19.43 0.00 3.47143 5.000 29.40 0.00 0.00 0.00 5.60 0.88 1.08 0.19 0.00 0.00 0.19 0.00 2.00 19.33 0.00 3.49144 4.900 29.40 0.00 0.00 0.00 5.60 0.87 1.07 0.19 0.00 0.00 0.19 0.00 2.00 19.24 0.00 3.50145 4.800 29.40 0.00 0.00 0.00 5.60 0.87 1.07 0.19 0.00 0.00 0.19 0.00 2.00 19.14 0.00 3.52146 4.700 29.40 0.00 0.00 0.00 5.60 0.87 1.07 0.19 0.00 0.00 0.19 0.00 2.00 19.05 0.00 3.53147 4.600 29.40 0.00 0.00 0.00 5.60 0.87 1.07 0.19 0.00 0.00 0.19 0.00 2.00 18.95 0.00 3.55148 4.500 29.40 0.00 0.00 0.00 5.60 0.86 1.06 0.19 0.00 0.00 0.19 0.00 2.00 18.86 0.00 3.56
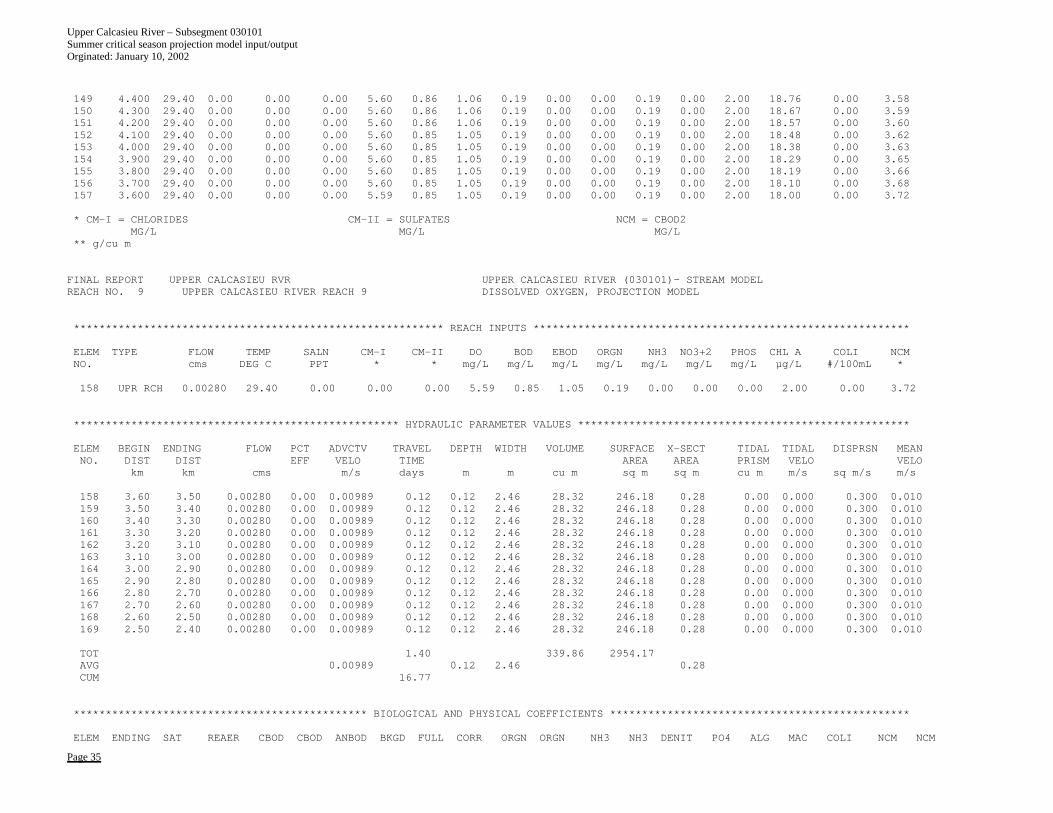
Upper Calcasieu River – Subsegment 030101 Summer critical season projection model input/output Orginated: January 10, 2002
Page 35
149 4.400 29.40 0.00 0.00 0.00 5.60 0.86 1.06 0.19 0.00 0.00 0.19 0.00 2.00 18.76 0.00 3.58150 4.300 29.40 0.00 0.00 0.00 5.60 0.86 1.06 0.19 0.00 0.00 0.19 0.00 2.00 18.67 0.00 3.59151 4.200 29.40 0.00 0.00 0.00 5.60 0.86 1.06 0.19 0.00 0.00 0.19 0.00 2.00 18.57 0.00 3.60152 4.100 29.40 0.00 0.00 0.00 5.60 0.85 1.05 0.19 0.00 0.00 0.19 0.00 2.00 18.48 0.00 3.62153 4.000 29.40 0.00 0.00 0.00 5.60 0.85 1.05 0.19 0.00 0.00 0.19 0.00 2.00 18.38 0.00 3.63154 3.900 29.40 0.00 0.00 0.00 5.60 0.85 1.05 0.19 0.00 0.00 0.19 0.00 2.00 18.29 0.00 3.65155 3.800 29.40 0.00 0.00 0.00 5.60 0.85 1.05 0.19 0.00 0.00 0.19 0.00 2.00 18.19 0.00 3.66156 3.700 29.40 0.00 0.00 0.00 5.60 0.85 1.05 0.19 0.00 0.00 0.19 0.00 2.00 18.10 0.00 3.68157 3.600 29.40 0.00 0.00 0.00 5.59 0.85 1.05 0.19 0.00 0.00 0.19 0.00 2.00 18.00 0.00 3.72
* CM-I = CHLORIDES CM-II = SULFATES NCM = CBOD2MG/L MG/L MG/L
** g/cu m
FINAL REPORT UPPER CALCASIEU RVR UPPER CALCASIEU RIVER (030101)- STREAM MODELREACH NO. 9 UPPER CALCASIEU RIVER REACH 9 DISSOLVED OXYGEN, PROJECTION MODEL
********************************************************** REACH INPUTS ***********************************************************
ELEM TYPE FLOW TEMP SALN CM-I CM-II DO BOD EBOD ORGN NH3 NO3+2 PHOS CHL A COLI NCMNO. cms DEG C PPT * * mg/L mg/L mg/L mg/L mg/L mg/L mg/L µg/L #/100mL *
158 UPR RCH 0.00280 29.40 0.00 0.00 0.00 5.59 0.85 1.05 0.19 0.00 0.00 0.00 2.00 0.00 3.72
*************************************************** HYDRAULIC PARAMETER VALUES ****************************************************
ELEM BEGIN ENDING FLOW PCT ADVCTV TRAVEL DEPTH WIDTH VOLUME SURFACE X-SECT TIDAL TIDAL DISPRSN MEANNO. DIST DIST EFF VELO TIME AREA AREA PRISM VELO VELO
km km cms m/s days m m cu m sq m sq m cu m m/s sq m/s m/s
158 3.60 3.50 0.00280 0.00 0.00989 0.12 0.12 2.46 28.32 246.18 0.28 0.00 0.000 0.300 0.010159 3.50 3.40 0.00280 0.00 0.00989 0.12 0.12 2.46 28.32 246.18 0.28 0.00 0.000 0.300 0.010160 3.40 3.30 0.00280 0.00 0.00989 0.12 0.12 2.46 28.32 246.18 0.28 0.00 0.000 0.300 0.010161 3.30 3.20 0.00280 0.00 0.00989 0.12 0.12 2.46 28.32 246.18 0.28 0.00 0.000 0.300 0.010162 3.20 3.10 0.00280 0.00 0.00989 0.12 0.12 2.46 28.32 246.18 0.28 0.00 0.000 0.300 0.010163 3.10 3.00 0.00280 0.00 0.00989 0.12 0.12 2.46 28.32 246.18 0.28 0.00 0.000 0.300 0.010164 3.00 2.90 0.00280 0.00 0.00989 0.12 0.12 2.46 28.32 246.18 0.28 0.00 0.000 0.300 0.010165 2.90 2.80 0.00280 0.00 0.00989 0.12 0.12 2.46 28.32 246.18 0.28 0.00 0.000 0.300 0.010166 2.80 2.70 0.00280 0.00 0.00989 0.12 0.12 2.46 28.32 246.18 0.28 0.00 0.000 0.300 0.010167 2.70 2.60 0.00280 0.00 0.00989 0.12 0.12 2.46 28.32 246.18 0.28 0.00 0.000 0.300 0.010168 2.60 2.50 0.00280 0.00 0.00989 0.12 0.12 2.46 28.32 246.18 0.28 0.00 0.000 0.300 0.010169 2.50 2.40 0.00280 0.00 0.00989 0.12 0.12 2.46 28.32 246.18 0.28 0.00 0.000 0.300 0.010
TOT 1.40 339.86 2954.17AVG 0.00989 0.12 2.46 0.28CUM 16.77
********************************************** BIOLOGICAL AND PHYSICAL COEFFICIENTS ***********************************************
ELEM ENDING SAT REAER CBOD CBOD ANBOD BKGD FULL CORR ORGN ORGN NH3 NH3 DENIT PO4 ALG MAC COLI NCM NCM
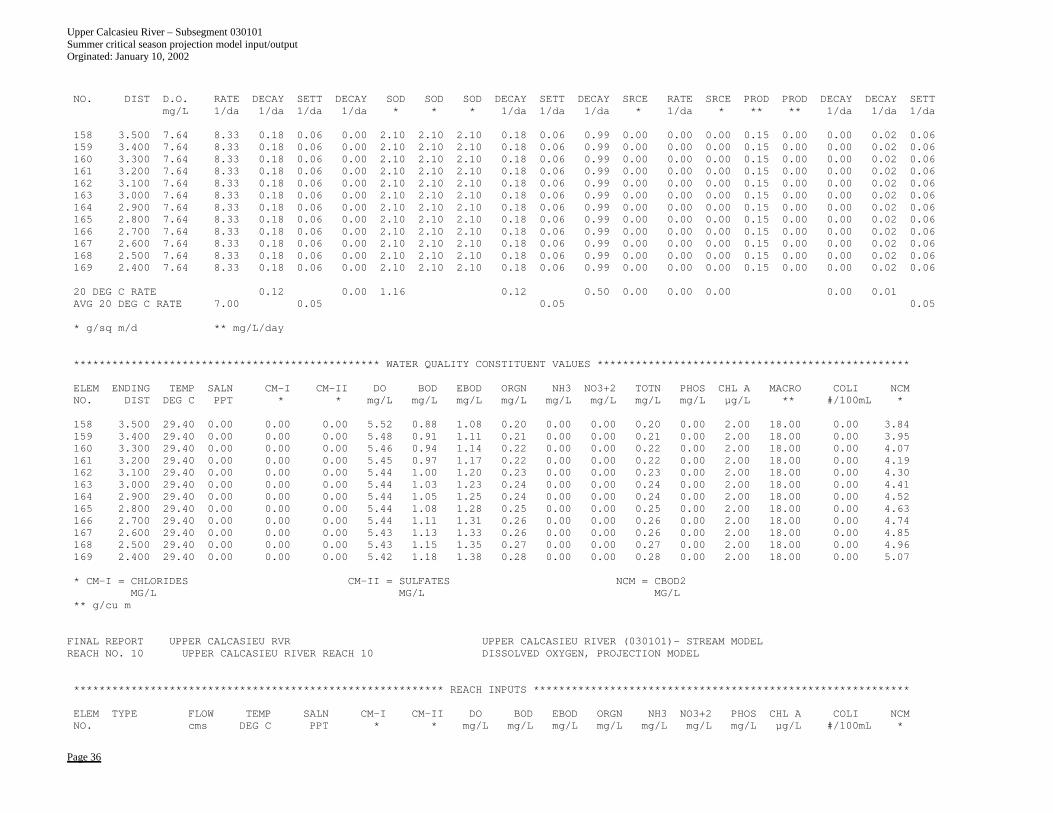
Upper Calcasieu River – Subsegment 030101 Summer critical season projection model input/output Orginated: January 10, 2002
Page 36
NO. DIST D.O. RATE DECAY SETT DECAY SOD SOD SOD DECAY SETT DECAY SRCE RATE SRCE PROD PROD DECAY DECAY SETTmg/L 1/da 1/da 1/da 1/da * * * 1/da 1/da 1/da * 1/da * ** ** 1/da 1/da 1/da
158 3.500 7.64 8.33 0.18 0.06 0.00 2.10 2.10 2.10 0.18 0.06 0.99 0.00 0.00 0.00 0.15 0.00 0.00 0.02 0.06159 3.400 7.64 8.33 0.18 0.06 0.00 2.10 2.10 2.10 0.18 0.06 0.99 0.00 0.00 0.00 0.15 0.00 0.00 0.02 0.06160 3.300 7.64 8.33 0.18 0.06 0.00 2.10 2.10 2.10 0.18 0.06 0.99 0.00 0.00 0.00 0.15 0.00 0.00 0.02 0.06161 3.200 7.64 8.33 0.18 0.06 0.00 2.10 2.10 2.10 0.18 0.06 0.99 0.00 0.00 0.00 0.15 0.00 0.00 0.02 0.06162 3.100 7.64 8.33 0.18 0.06 0.00 2.10 2.10 2.10 0.18 0.06 0.99 0.00 0.00 0.00 0.15 0.00 0.00 0.02 0.06163 3.000 7.64 8.33 0.18 0.06 0.00 2.10 2.10 2.10 0.18 0.06 0.99 0.00 0.00 0.00 0.15 0.00 0.00 0.02 0.06164 2.900 7.64 8.33 0.18 0.06 0.00 2.10 2.10 2.10 0.18 0.06 0.99 0.00 0.00 0.00 0.15 0.00 0.00 0.02 0.06165 2.800 7.64 8.33 0.18 0.06 0.00 2.10 2.10 2.10 0.18 0.06 0.99 0.00 0.00 0.00 0.15 0.00 0.00 0.02 0.06166 2.700 7.64 8.33 0.18 0.06 0.00 2.10 2.10 2.10 0.18 0.06 0.99 0.00 0.00 0.00 0.15 0.00 0.00 0.02 0.06167 2.600 7.64 8.33 0.18 0.06 0.00 2.10 2.10 2.10 0.18 0.06 0.99 0.00 0.00 0.00 0.15 0.00 0.00 0.02 0.06168 2.500 7.64 8.33 0.18 0.06 0.00 2.10 2.10 2.10 0.18 0.06 0.99 0.00 0.00 0.00 0.15 0.00 0.00 0.02 0.06169 2.400 7.64 8.33 0.18 0.06 0.00 2.10 2.10 2.10 0.18 0.06 0.99 0.00 0.00 0.00 0.15 0.00 0.00 0.02 0.06
20 DEG C RATE 0.12 0.00 1.16 0.12 0.50 0.00 0.00 0.00 0.00 0.01AVG 20 DEG C RATE 7.00 0.05 0.05 0.05
* g/sq m/d ** mg/L/day
************************************************ WATER QUALITY CONSTITUENT VALUES *************************************************
ELEM ENDING TEMP SALN CM-I CM-II DO BOD EBOD ORGN NH3 NO3+2 TOTN PHOS CHL A MACRO COLI NCMNO. DIST DEG C PPT * * mg/L mg/L mg/L mg/L mg/L mg/L mg/L mg/L µg/L ** #/100mL *
158 3.500 29.40 0.00 0.00 0.00 5.52 0.88 1.08 0.20 0.00 0.00 0.20 0.00 2.00 18.00 0.00 3.84159 3.400 29.40 0.00 0.00 0.00 5.48 0.91 1.11 0.21 0.00 0.00 0.21 0.00 2.00 18.00 0.00 3.95160 3.300 29.40 0.00 0.00 0.00 5.46 0.94 1.14 0.22 0.00 0.00 0.22 0.00 2.00 18.00 0.00 4.07161 3.200 29.40 0.00 0.00 0.00 5.45 0.97 1.17 0.22 0.00 0.00 0.22 0.00 2.00 18.00 0.00 4.19162 3.100 29.40 0.00 0.00 0.00 5.44 1.00 1.20 0.23 0.00 0.00 0.23 0.00 2.00 18.00 0.00 4.30163 3.000 29.40 0.00 0.00 0.00 5.44 1.03 1.23 0.24 0.00 0.00 0.24 0.00 2.00 18.00 0.00 4.41164 2.900 29.40 0.00 0.00 0.00 5.44 1.05 1.25 0.24 0.00 0.00 0.24 0.00 2.00 18.00 0.00 4.52165 2.800 29.40 0.00 0.00 0.00 5.44 1.08 1.28 0.25 0.00 0.00 0.25 0.00 2.00 18.00 0.00 4.63166 2.700 29.40 0.00 0.00 0.00 5.44 1.11 1.31 0.26 0.00 0.00 0.26 0.00 2.00 18.00 0.00 4.74167 2.600 29.40 0.00 0.00 0.00 5.43 1.13 1.33 0.26 0.00 0.00 0.26 0.00 2.00 18.00 0.00 4.85168 2.500 29.40 0.00 0.00 0.00 5.43 1.15 1.35 0.27 0.00 0.00 0.27 0.00 2.00 18.00 0.00 4.96169 2.400 29.40 0.00 0.00 0.00 5.42 1.18 1.38 0.28 0.00 0.00 0.28 0.00 2.00 18.00 0.00 5.07
* CM-I = CHLORIDES CM-II = SULFATES NCM = CBOD2MG/L MG/L MG/L
** g/cu m
FINAL REPORT UPPER CALCASIEU RVR UPPER CALCASIEU RIVER (030101)- STREAM MODELREACH NO. 10 UPPER CALCASIEU RIVER REACH 10 DISSOLVED OXYGEN, PROJECTION MODEL
********************************************************** REACH INPUTS ***********************************************************
ELEM TYPE FLOW TEMP SALN CM-I CM-II DO BOD EBOD ORGN NH3 NO3+2 PHOS CHL A COLI NCMNO. cms DEG C PPT * * mg/L mg/L mg/L mg/L mg/L mg/L mg/L µg/L #/100mL *
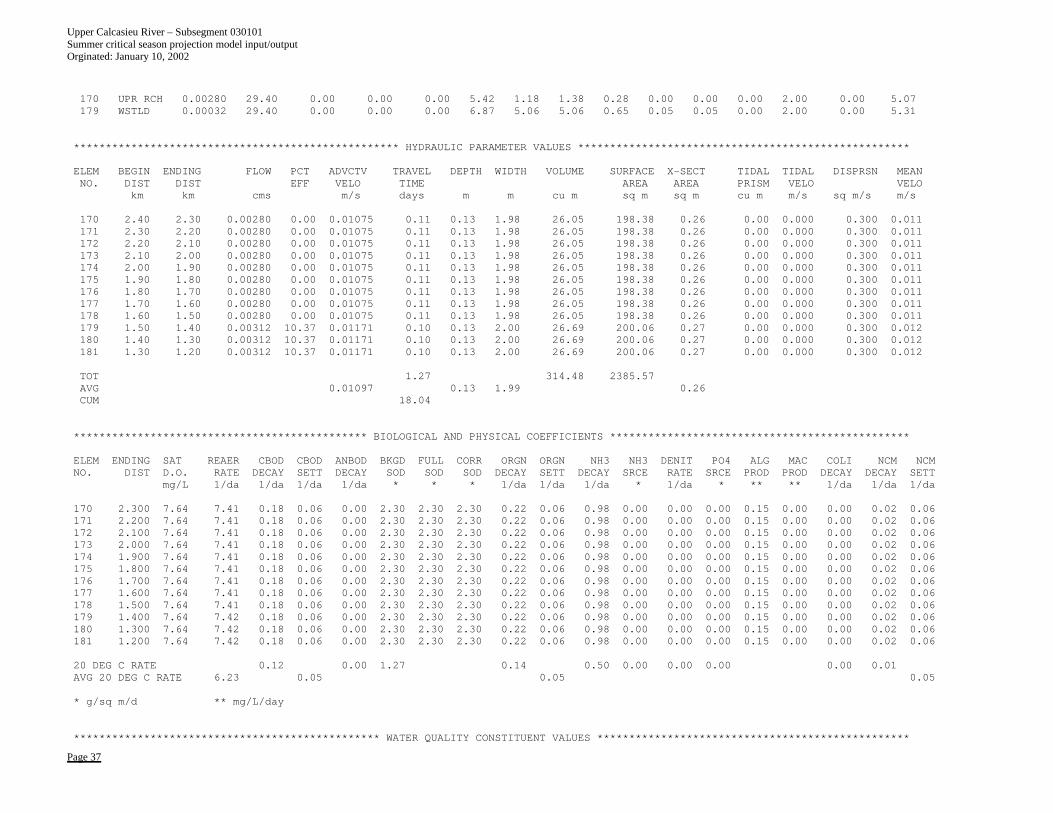
Upper Calcasieu River – Subsegment 030101 Summer critical season projection model input/output Orginated: January 10, 2002
Page 37
170 UPR RCH 0.00280 29.40 0.00 0.00 0.00 5.42 1.18 1.38 0.28 0.00 0.00 0.00 2.00 0.00 5.07179 WSTLD 0.00032 29.40 0.00 0.00 0.00 6.87 5.06 5.06 0.65 0.05 0.05 0.00 2.00 0.00 5.31
*************************************************** HYDRAULIC PARAMETER VALUES ****************************************************
ELEM BEGIN ENDING FLOW PCT ADVCTV TRAVEL DEPTH WIDTH VOLUME SURFACE X-SECT TIDAL TIDAL DISPRSN MEANNO. DIST DIST EFF VELO TIME AREA AREA PRISM VELO VELO
km km cms m/s days m m cu m sq m sq m cu m m/s sq m/s m/s
170 2.40 2.30 0.00280 0.00 0.01075 0.11 0.13 1.98 26.05 198.38 0.26 0.00 0.000 0.300 0.011171 2.30 2.20 0.00280 0.00 0.01075 0.11 0.13 1.98 26.05 198.38 0.26 0.00 0.000 0.300 0.011172 2.20 2.10 0.00280 0.00 0.01075 0.11 0.13 1.98 26.05 198.38 0.26 0.00 0.000 0.300 0.011173 2.10 2.00 0.00280 0.00 0.01075 0.11 0.13 1.98 26.05 198.38 0.26 0.00 0.000 0.300 0.011174 2.00 1.90 0.00280 0.00 0.01075 0.11 0.13 1.98 26.05 198.38 0.26 0.00 0.000 0.300 0.011175 1.90 1.80 0.00280 0.00 0.01075 0.11 0.13 1.98 26.05 198.38 0.26 0.00 0.000 0.300 0.011176 1.80 1.70 0.00280 0.00 0.01075 0.11 0.13 1.98 26.05 198.38 0.26 0.00 0.000 0.300 0.011177 1.70 1.60 0.00280 0.00 0.01075 0.11 0.13 1.98 26.05 198.38 0.26 0.00 0.000 0.300 0.011178 1.60 1.50 0.00280 0.00 0.01075 0.11 0.13 1.98 26.05 198.38 0.26 0.00 0.000 0.300 0.011179 1.50 1.40 0.00312 10.37 0.01171 0.10 0.13 2.00 26.69 200.06 0.27 0.00 0.000 0.300 0.012180 1.40 1.30 0.00312 10.37 0.01171 0.10 0.13 2.00 26.69 200.06 0.27 0.00 0.000 0.300 0.012181 1.30 1.20 0.00312 10.37 0.01171 0.10 0.13 2.00 26.69 200.06 0.27 0.00 0.000 0.300 0.012
TOT 1.27 314.48 2385.57AVG 0.01097 0.13 1.99 0.26CUM 18.04
********************************************** BIOLOGICAL AND PHYSICAL COEFFICIENTS ***********************************************
ELEM ENDING SAT REAER CBOD CBOD ANBOD BKGD FULL CORR ORGN ORGN NH3 NH3 DENIT PO4 ALG MAC COLI NCM NCMNO. DIST D.O. RATE DECAY SETT DECAY SOD SOD SOD DECAY SETT DECAY SRCE RATE SRCE PROD PROD DECAY DECAY SETT
mg/L 1/da 1/da 1/da 1/da * * * 1/da 1/da 1/da * 1/da * ** ** 1/da 1/da 1/da
170 2.300 7.64 7.41 0.18 0.06 0.00 2.30 2.30 2.30 0.22 0.06 0.98 0.00 0.00 0.00 0.15 0.00 0.00 0.02 0.06171 2.200 7.64 7.41 0.18 0.06 0.00 2.30 2.30 2.30 0.22 0.06 0.98 0.00 0.00 0.00 0.15 0.00 0.00 0.02 0.06172 2.100 7.64 7.41 0.18 0.06 0.00 2.30 2.30 2.30 0.22 0.06 0.98 0.00 0.00 0.00 0.15 0.00 0.00 0.02 0.06173 2.000 7.64 7.41 0.18 0.06 0.00 2.30 2.30 2.30 0.22 0.06 0.98 0.00 0.00 0.00 0.15 0.00 0.00 0.02 0.06174 1.900 7.64 7.41 0.18 0.06 0.00 2.30 2.30 2.30 0.22 0.06 0.98 0.00 0.00 0.00 0.15 0.00 0.00 0.02 0.06175 1.800 7.64 7.41 0.18 0.06 0.00 2.30 2.30 2.30 0.22 0.06 0.98 0.00 0.00 0.00 0.15 0.00 0.00 0.02 0.06176 1.700 7.64 7.41 0.18 0.06 0.00 2.30 2.30 2.30 0.22 0.06 0.98 0.00 0.00 0.00 0.15 0.00 0.00 0.02 0.06177 1.600 7.64 7.41 0.18 0.06 0.00 2.30 2.30 2.30 0.22 0.06 0.98 0.00 0.00 0.00 0.15 0.00 0.00 0.02 0.06178 1.500 7.64 7.41 0.18 0.06 0.00 2.30 2.30 2.30 0.22 0.06 0.98 0.00 0.00 0.00 0.15 0.00 0.00 0.02 0.06179 1.400 7.64 7.42 0.18 0.06 0.00 2.30 2.30 2.30 0.22 0.06 0.98 0.00 0.00 0.00 0.15 0.00 0.00 0.02 0.06180 1.300 7.64 7.42 0.18 0.06 0.00 2.30 2.30 2.30 0.22 0.06 0.98 0.00 0.00 0.00 0.15 0.00 0.00 0.02 0.06181 1.200 7.64 7.42 0.18 0.06 0.00 2.30 2.30 2.30 0.22 0.06 0.98 0.00 0.00 0.00 0.15 0.00 0.00 0.02 0.06
20 DEG C RATE 0.12 0.00 1.27 0.14 0.50 0.00 0.00 0.00 0.00 0.01AVG 20 DEG C RATE 6.23 0.05 0.05 0.05
* g/sq m/d ** mg/L/day
************************************************ WATER QUALITY CONSTITUENT VALUES *************************************************
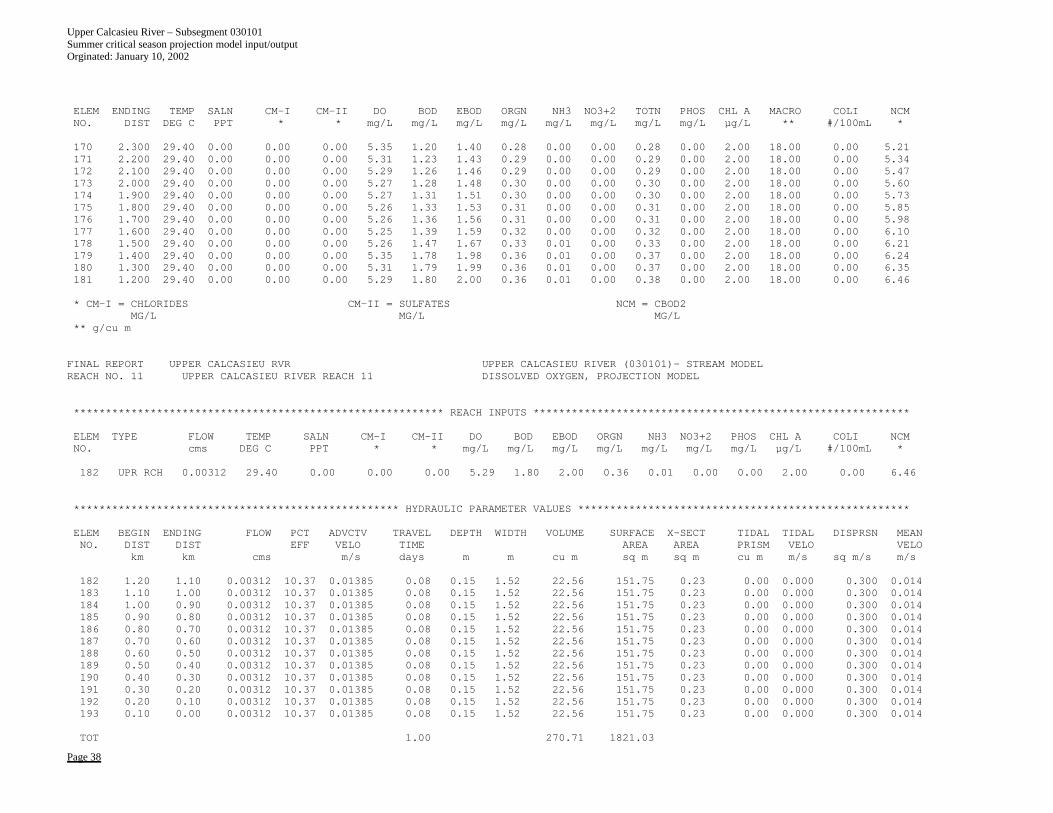
Upper Calcasieu River – Subsegment 030101 Summer critical season projection model input/output Orginated: January 10, 2002
Page 38
ELEM ENDING TEMP SALN CM-I CM-II DO BOD EBOD ORGN NH3 NO3+2 TOTN PHOS CHL A MACRO COLI NCMNO. DIST DEG C PPT * * mg/L mg/L mg/L mg/L mg/L mg/L mg/L mg/L µg/L ** #/100mL *
170 2.300 29.40 0.00 0.00 0.00 5.35 1.20 1.40 0.28 0.00 0.00 0.28 0.00 2.00 18.00 0.00 5.21171 2.200 29.40 0.00 0.00 0.00 5.31 1.23 1.43 0.29 0.00 0.00 0.29 0.00 2.00 18.00 0.00 5.34172 2.100 29.40 0.00 0.00 0.00 5.29 1.26 1.46 0.29 0.00 0.00 0.29 0.00 2.00 18.00 0.00 5.47173 2.000 29.40 0.00 0.00 0.00 5.27 1.28 1.48 0.30 0.00 0.00 0.30 0.00 2.00 18.00 0.00 5.60174 1.900 29.40 0.00 0.00 0.00 5.27 1.31 1.51 0.30 0.00 0.00 0.30 0.00 2.00 18.00 0.00 5.73175 1.800 29.40 0.00 0.00 0.00 5.26 1.33 1.53 0.31 0.00 0.00 0.31 0.00 2.00 18.00 0.00 5.85176 1.700 29.40 0.00 0.00 0.00 5.26 1.36 1.56 0.31 0.00 0.00 0.31 0.00 2.00 18.00 0.00 5.98177 1.600 29.40 0.00 0.00 0.00 5.25 1.39 1.59 0.32 0.00 0.00 0.32 0.00 2.00 18.00 0.00 6.10178 1.500 29.40 0.00 0.00 0.00 5.26 1.47 1.67 0.33 0.01 0.00 0.33 0.00 2.00 18.00 0.00 6.21179 1.400 29.40 0.00 0.00 0.00 5.35 1.78 1.98 0.36 0.01 0.00 0.37 0.00 2.00 18.00 0.00 6.24180 1.300 29.40 0.00 0.00 0.00 5.31 1.79 1.99 0.36 0.01 0.00 0.37 0.00 2.00 18.00 0.00 6.35181 1.200 29.40 0.00 0.00 0.00 5.29 1.80 2.00 0.36 0.01 0.00 0.38 0.00 2.00 18.00 0.00 6.46
* CM-I = CHLORIDES CM-II = SULFATES NCM = CBOD2MG/L MG/L MG/L
** g/cu m
FINAL REPORT UPPER CALCASIEU RVR UPPER CALCASIEU RIVER (030101)- STREAM MODELREACH NO. 11 UPPER CALCASIEU RIVER REACH 11 DISSOLVED OXYGEN, PROJECTION MODEL
********************************************************** REACH INPUTS ***********************************************************
ELEM TYPE FLOW TEMP SALN CM-I CM-II DO BOD EBOD ORGN NH3 NO3+2 PHOS CHL A COLI NCMNO. cms DEG C PPT * * mg/L mg/L mg/L mg/L mg/L mg/L mg/L µg/L #/100mL *
182 UPR RCH 0.00312 29.40 0.00 0.00 0.00 5.29 1.80 2.00 0.36 0.01 0.00 0.00 2.00 0.00 6.46
*************************************************** HYDRAULIC PARAMETER VALUES ****************************************************
ELEM BEGIN ENDING FLOW PCT ADVCTV TRAVEL DEPTH WIDTH VOLUME SURFACE X-SECT TIDAL TIDAL DISPRSN MEANNO. DIST DIST EFF VELO TIME AREA AREA PRISM VELO VELO
km km cms m/s days m m cu m sq m sq m cu m m/s sq m/s m/s
182 1.20 1.10 0.00312 10.37 0.01385 0.08 0.15 1.52 22.56 151.75 0.23 0.00 0.000 0.300 0.014183 1.10 1.00 0.00312 10.37 0.01385 0.08 0.15 1.52 22.56 151.75 0.23 0.00 0.000 0.300 0.014184 1.00 0.90 0.00312 10.37 0.01385 0.08 0.15 1.52 22.56 151.75 0.23 0.00 0.000 0.300 0.014185 0.90 0.80 0.00312 10.37 0.01385 0.08 0.15 1.52 22.56 151.75 0.23 0.00 0.000 0.300 0.014186 0.80 0.70 0.00312 10.37 0.01385 0.08 0.15 1.52 22.56 151.75 0.23 0.00 0.000 0.300 0.014187 0.70 0.60 0.00312 10.37 0.01385 0.08 0.15 1.52 22.56 151.75 0.23 0.00 0.000 0.300 0.014188 0.60 0.50 0.00312 10.37 0.01385 0.08 0.15 1.52 22.56 151.75 0.23 0.00 0.000 0.300 0.014189 0.50 0.40 0.00312 10.37 0.01385 0.08 0.15 1.52 22.56 151.75 0.23 0.00 0.000 0.300 0.014190 0.40 0.30 0.00312 10.37 0.01385 0.08 0.15 1.52 22.56 151.75 0.23 0.00 0.000 0.300 0.014191 0.30 0.20 0.00312 10.37 0.01385 0.08 0.15 1.52 22.56 151.75 0.23 0.00 0.000 0.300 0.014192 0.20 0.10 0.00312 10.37 0.01385 0.08 0.15 1.52 22.56 151.75 0.23 0.00 0.000 0.300 0.014193 0.10 0.00 0.00312 10.37 0.01385 0.08 0.15 1.52 22.56 151.75 0.23 0.00 0.000 0.300 0.014
TOT 1.00 270.71 1821.03
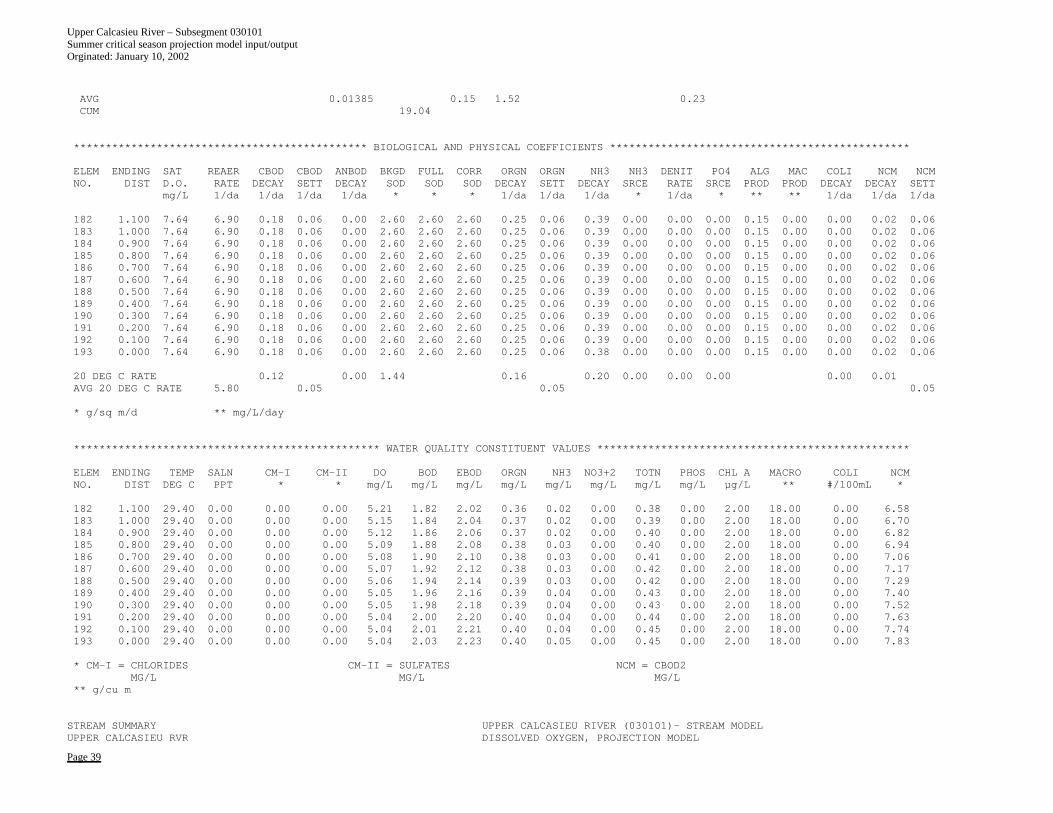
Upper Calcasieu River – Subsegment 030101 Summer critical season projection model input/output Orginated: January 10, 2002
Page 39
AVG 0.01385 0.15 1.52 0.23CUM 19.04
********************************************** BIOLOGICAL AND PHYSICAL COEFFICIENTS ***********************************************
ELEM ENDING SAT REAER CBOD CBOD ANBOD BKGD FULL CORR ORGN ORGN NH3 NH3 DENIT PO4 ALG MAC COLI NCM NCMNO. DIST D.O. RATE DECAY SETT DECAY SOD SOD SOD DECAY SETT DECAY SRCE RATE SRCE PROD PROD DECAY DECAY SETT
mg/L 1/da 1/da 1/da 1/da * * * 1/da 1/da 1/da * 1/da * ** ** 1/da 1/da 1/da
182 1.100 7.64 6.90 0.18 0.06 0.00 2.60 2.60 2.60 0.25 0.06 0.39 0.00 0.00 0.00 0.15 0.00 0.00 0.02 0.06183 1.000 7.64 6.90 0.18 0.06 0.00 2.60 2.60 2.60 0.25 0.06 0.39 0.00 0.00 0.00 0.15 0.00 0.00 0.02 0.06184 0.900 7.64 6.90 0.18 0.06 0.00 2.60 2.60 2.60 0.25 0.06 0.39 0.00 0.00 0.00 0.15 0.00 0.00 0.02 0.06185 0.800 7.64 6.90 0.18 0.06 0.00 2.60 2.60 2.60 0.25 0.06 0.39 0.00 0.00 0.00 0.15 0.00 0.00 0.02 0.06186 0.700 7.64 6.90 0.18 0.06 0.00 2.60 2.60 2.60 0.25 0.06 0.39 0.00 0.00 0.00 0.15 0.00 0.00 0.02 0.06187 0.600 7.64 6.90 0.18 0.06 0.00 2.60 2.60 2.60 0.25 0.06 0.39 0.00 0.00 0.00 0.15 0.00 0.00 0.02 0.06188 0.500 7.64 6.90 0.18 0.06 0.00 2.60 2.60 2.60 0.25 0.06 0.39 0.00 0.00 0.00 0.15 0.00 0.00 0.02 0.06189 0.400 7.64 6.90 0.18 0.06 0.00 2.60 2.60 2.60 0.25 0.06 0.39 0.00 0.00 0.00 0.15 0.00 0.00 0.02 0.06190 0.300 7.64 6.90 0.18 0.06 0.00 2.60 2.60 2.60 0.25 0.06 0.39 0.00 0.00 0.00 0.15 0.00 0.00 0.02 0.06191 0.200 7.64 6.90 0.18 0.06 0.00 2.60 2.60 2.60 0.25 0.06 0.39 0.00 0.00 0.00 0.15 0.00 0.00 0.02 0.06192 0.100 7.64 6.90 0.18 0.06 0.00 2.60 2.60 2.60 0.25 0.06 0.39 0.00 0.00 0.00 0.15 0.00 0.00 0.02 0.06193 0.000 7.64 6.90 0.18 0.06 0.00 2.60 2.60 2.60 0.25 0.06 0.38 0.00 0.00 0.00 0.15 0.00 0.00 0.02 0.06
20 DEG C RATE 0.12 0.00 1.44 0.16 0.20 0.00 0.00 0.00 0.00 0.01AVG 20 DEG C RATE 5.80 0.05 0.05 0.05
* g/sq m/d ** mg/L/day
************************************************ WATER QUALITY CONSTITUENT VALUES *************************************************
ELEM ENDING TEMP SALN CM-I CM-II DO BOD EBOD ORGN NH3 NO3+2 TOTN PHOS CHL A MACRO COLI NCMNO. DIST DEG C PPT * * mg/L mg/L mg/L mg/L mg/L mg/L mg/L mg/L µg/L ** #/100mL *
182 1.100 29.40 0.00 0.00 0.00 5.21 1.82 2.02 0.36 0.02 0.00 0.38 0.00 2.00 18.00 0.00 6.58183 1.000 29.40 0.00 0.00 0.00 5.15 1.84 2.04 0.37 0.02 0.00 0.39 0.00 2.00 18.00 0.00 6.70184 0.900 29.40 0.00 0.00 0.00 5.12 1.86 2.06 0.37 0.02 0.00 0.40 0.00 2.00 18.00 0.00 6.82185 0.800 29.40 0.00 0.00 0.00 5.09 1.88 2.08 0.38 0.03 0.00 0.40 0.00 2.00 18.00 0.00 6.94186 0.700 29.40 0.00 0.00 0.00 5.08 1.90 2.10 0.38 0.03 0.00 0.41 0.00 2.00 18.00 0.00 7.06187 0.600 29.40 0.00 0.00 0.00 5.07 1.92 2.12 0.38 0.03 0.00 0.42 0.00 2.00 18.00 0.00 7.17188 0.500 29.40 0.00 0.00 0.00 5.06 1.94 2.14 0.39 0.03 0.00 0.42 0.00 2.00 18.00 0.00 7.29189 0.400 29.40 0.00 0.00 0.00 5.05 1.96 2.16 0.39 0.04 0.00 0.43 0.00 2.00 18.00 0.00 7.40190 0.300 29.40 0.00 0.00 0.00 5.05 1.98 2.18 0.39 0.04 0.00 0.43 0.00 2.00 18.00 0.00 7.52191 0.200 29.40 0.00 0.00 0.00 5.04 2.00 2.20 0.40 0.04 0.00 0.44 0.00 2.00 18.00 0.00 7.63192 0.100 29.40 0.00 0.00 0.00 5.04 2.01 2.21 0.40 0.04 0.00 0.45 0.00 2.00 18.00 0.00 7.74193 0.000 29.40 0.00 0.00 0.00 5.04 2.03 2.23 0.40 0.05 0.00 0.45 0.00 2.00 18.00 0.00 7.83
* CM-I = CHLORIDES CM-II = SULFATES NCM = CBOD2MG/L MG/L MG/L
** g/cu m
STREAM SUMMARY UPPER CALCASIEU RIVER (030101)- STREAM MODELUPPER CALCASIEU RVR DISSOLVED OXYGEN, PROJECTION MODEL
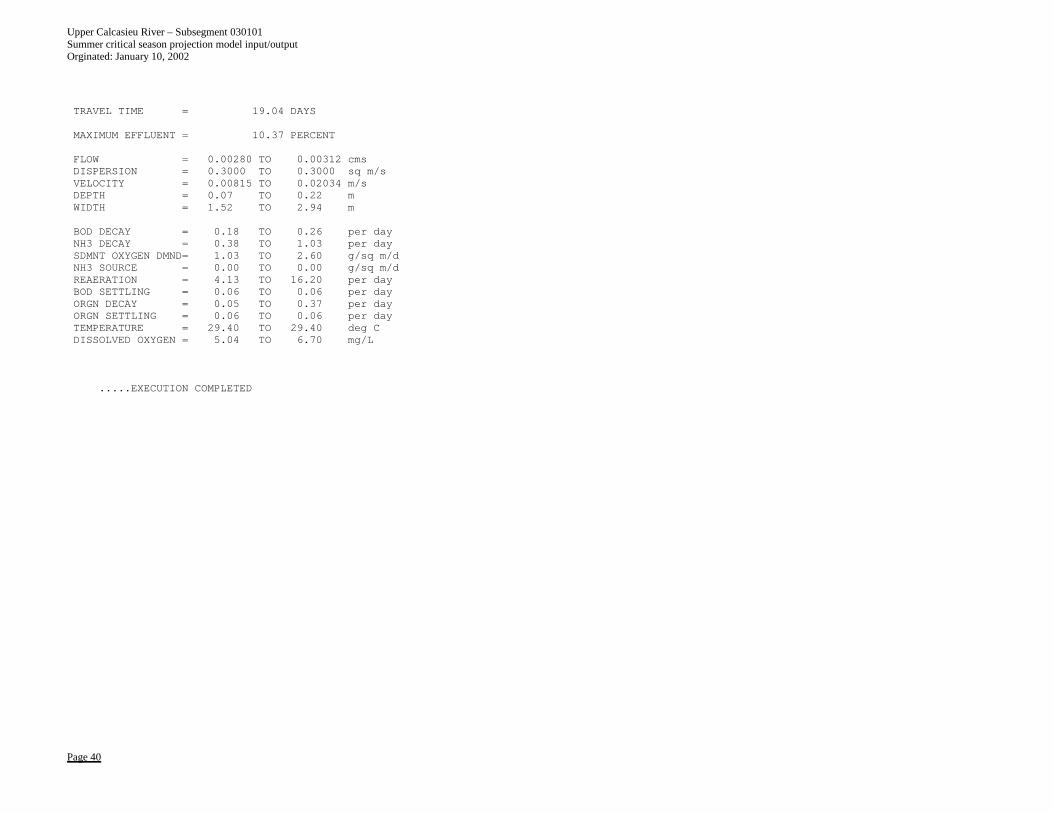
Upper Calcasieu River – Subsegment 030101 Summer critical season projection model input/output Orginated: January 10, 2002
Page 40
TRAVEL TIME = 19.04 DAYS
MAXIMUM EFFLUENT = 10.37 PERCENT
FLOW = 0.00280 TO 0.00312 cmsDISPERSION = 0.3000 TO 0.3000 sq m/sVELOCITY = 0.00815 TO 0.02034 m/sDEPTH = 0.07 TO 0.22 mWIDTH = 1.52 TO 2.94 m
BOD DECAY = 0.18 TO 0.26 per dayNH3 DECAY = 0.38 TO 1.03 per daySDMNT OXYGEN DMND= 1.03 TO 2.60 g/sq m/dNH3 SOURCE = 0.00 TO 0.00 g/sq m/dREAERATION = 4.13 TO 16.20 per dayBOD SETTLING = 0.06 TO 0.06 per dayORGN DECAY = 0.05 TO 0.37 per dayORGN SETTLING = 0.06 TO 0.06 per dayTEMPERATURE = 29.40 TO 29.40 deg CDISSOLVED OXYGEN = 5.04 TO 6.70 mg/L
.....EXECUTION COMPLETED
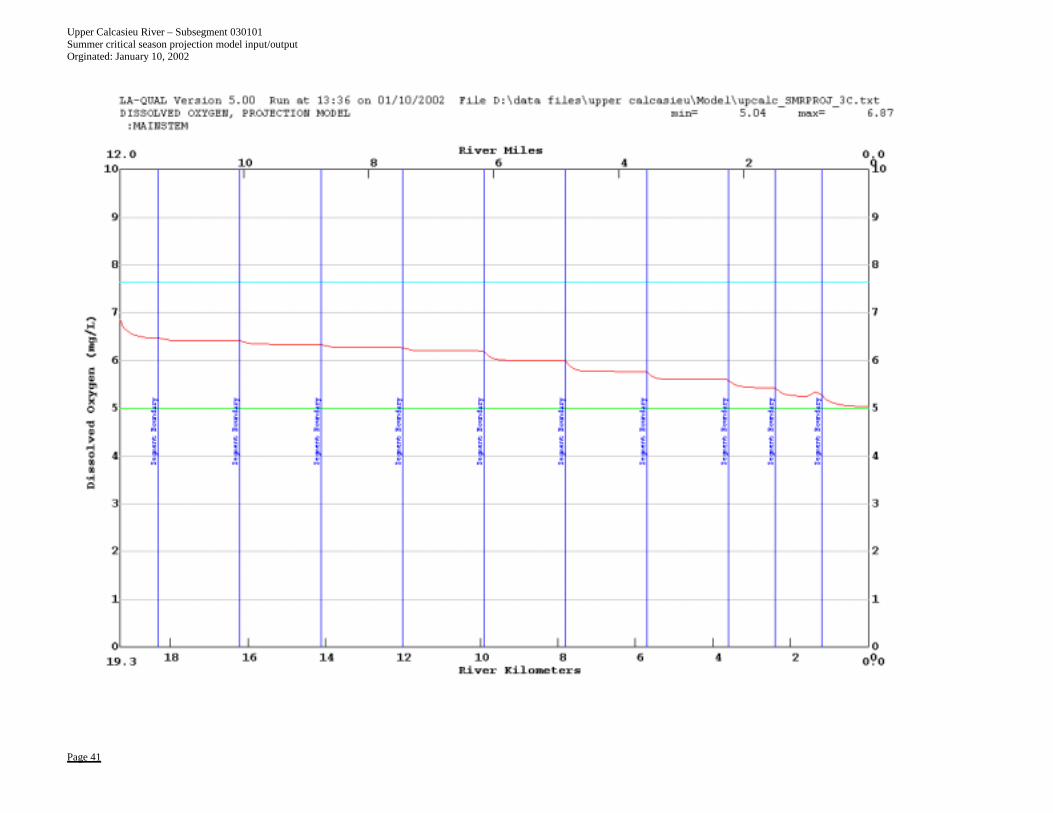
Upper Calcasieu River – Subsegment 030101 Summer critical season projection model input/output Orginated: January 10, 2002
Page 41
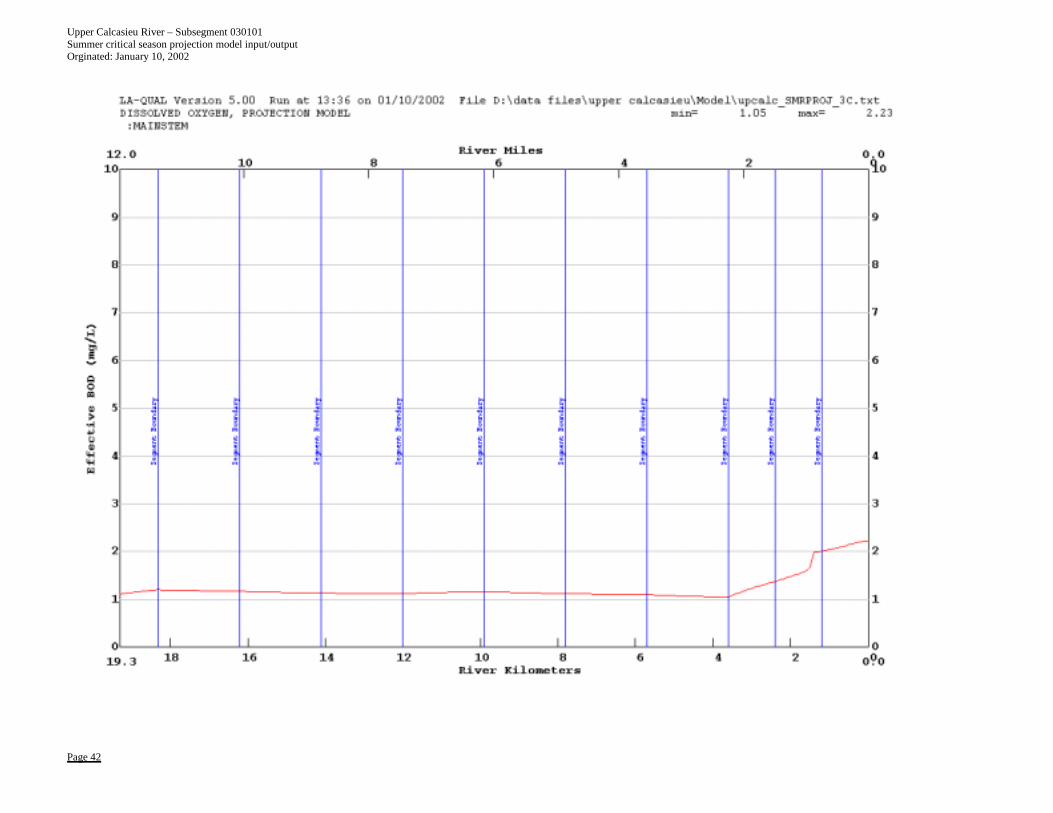
Upper Calcasieu River – Subsegment 030101 Summer critical season projection model input/output Orginated: January 10, 2002
Page 42

Upper Calcasieu River – Subsegment 030101 Summer critical season projection model input/output Orginated: January 10, 2002
Page 43
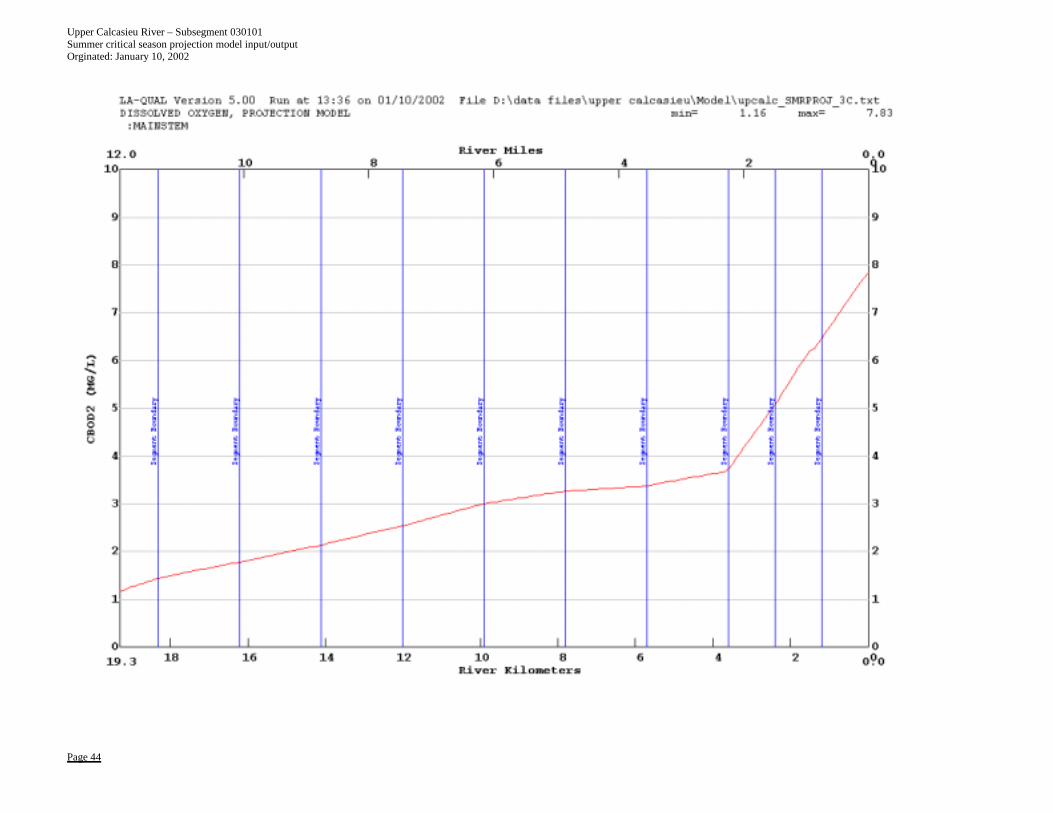
Upper Calcasieu River – Subsegment 030101 Summer critical season projection model input/output Orginated: January 10, 2002
Page 44
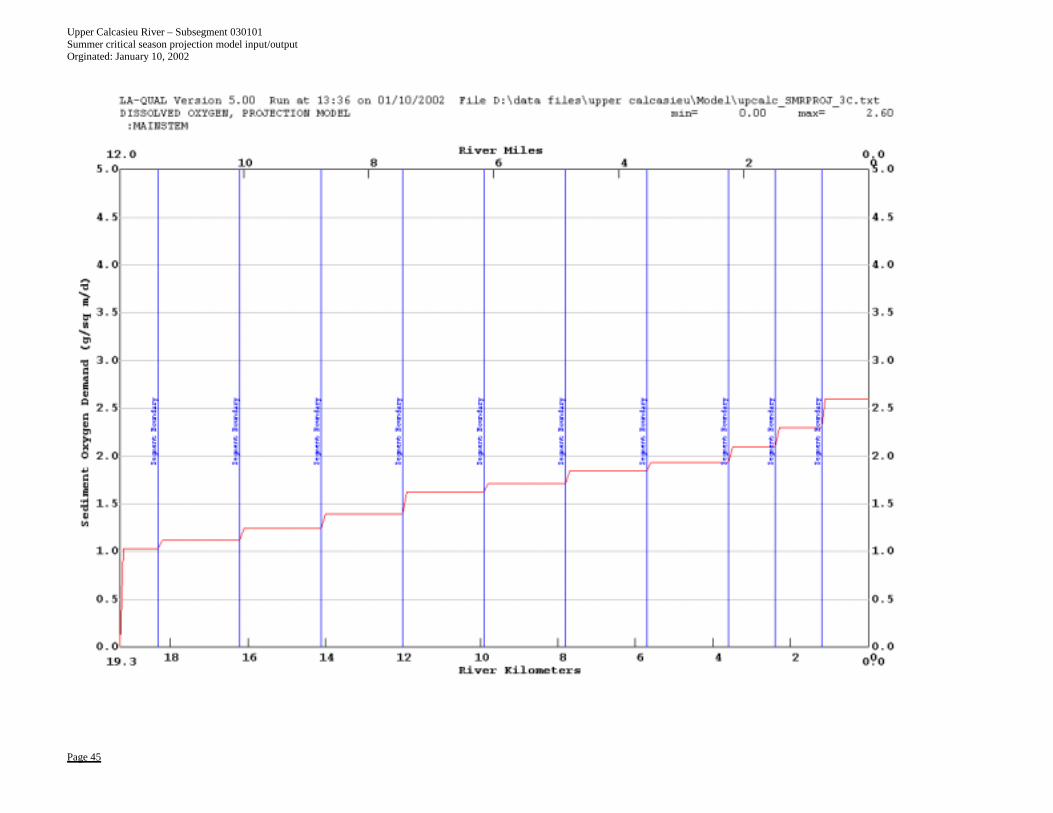
Upper Calcasieu River – Subsegment 030101 Summer critical season projection model input/output Orginated: January 10, 2002
Page 45

Upper Calcasieu River Watershed TMDL for Dissolved Oxygen Subsegment 080808 Originated: January 9, 2002
33
Appendix B3
Projection Model Development
Summer projection model justifications
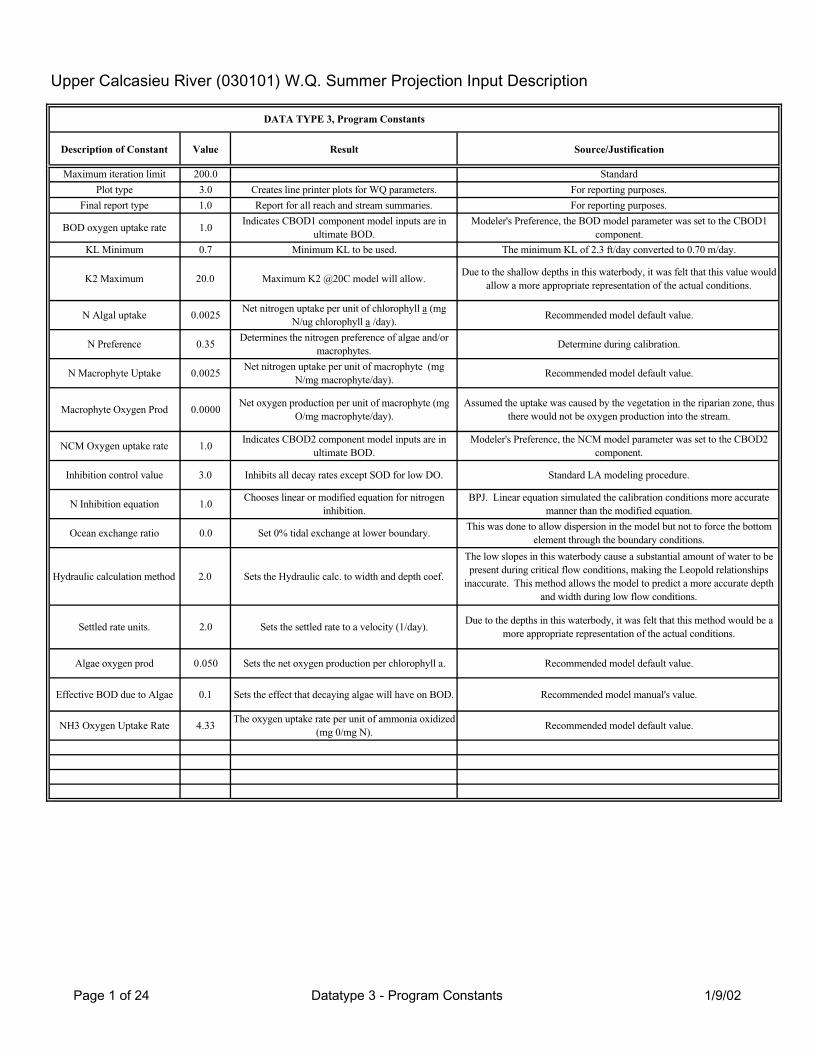
Upper Calcasieu River (030101) W.Q. Summer Projection Input Description
DATA TYPE 3, Program Constants
Description of Constant Value Result Source/Justification
Maximum iteration limit 200.0 Standard
Plot type 3.0 Creates line printer plots for WQ parameters. For reporting purposes.
Final report type 1.0 Report for all reach and stream summaries. For reporting purposes.
BOD oxygen uptake rate 1.0Indicates CBOD1 component model inputs are in
ultimate BOD.
Modeler's Preference, the BOD model parameter was set to the CBOD1
component.
KL Minimum 0.7 Minimum KL to be used. The minimum KL of 2.3 ft/day converted to 0.70 m/day.
K2 Maximum 20.0 Maximum K2 @20C model will allow.Due to the shallow depths in this waterbody, it was felt that this value would
allow a more appropriate representation of the actual conditions.
N Algal uptake 0.0025Net nitrogen uptake per unit of chlorophyll a (mg
N/ug chlorophyll a /day).Recommended model default value.
N Preference 0.35Determines the nitrogen preference of algae and/or
macrophytes.Determine during calibration.
N Macrophyte Uptake 0.0025Net nitrogen uptake per unit of macrophyte (mg
N/mg macrophyte/day).Recommended model default value.
Macrophyte Oxygen Prod 0.0000Net oxygen production per unit of macrophyte (mg
O/mg macrophyte/day).
Assumed the uptake was caused by the vegetation in the riparian zone, thus
there would not be oxygen production into the stream.
NCM Oxygen uptake rate 1.0Indicates CBOD2 component model inputs are in
ultimate BOD.
Modeler's Preference, the NCM model parameter was set to the CBOD2
component.
Inhibition control value 3.0 Inhibits all decay rates except SOD for low DO. Standard LA modeling procedure.
N Inhibition equation 1.0Chooses linear or modified equation for nitrogen
inhibition.
BPJ. Linear equation simulated the calibration conditions more accurate
manner than the modified equation.
Ocean exchange ratio 0.0 Set 0% tidal exchange at lower boundary.This was done to allow dispersion in the model but not to force the bottom
element through the boundary conditions.
Hydraulic calculation method 2.0 Sets the Hydraulic calc. to width and depth coef.
The low slopes in this waterbody cause a substantial amount of water to be
present during critical flow conditions, making the Leopold relationships
inaccurate. This method allows the model to predict a more accurate depth
and width during low flow conditions.
Settled rate units. 2.0 Sets the settled rate to a velocity (1/day).Due to the depths in this waterbody, it was felt that this method would be a
more appropriate representation of the actual conditions.
Algae oxygen prod 0.050 Sets the net oxygen production per chlorophyll a. Recommended model default value.
Effective BOD due to Algae 0.1 Sets the effect that decaying algae will have on BOD. Recommended model manual's value.
NH3 Oxygen Uptake Rate 4.33The oxygen uptake rate per unit of ammonia oxidized
(mg 0/mg N).Recommended model default value.
Page 1 of 24 Datatype 3 - Program Constants 1/9/02
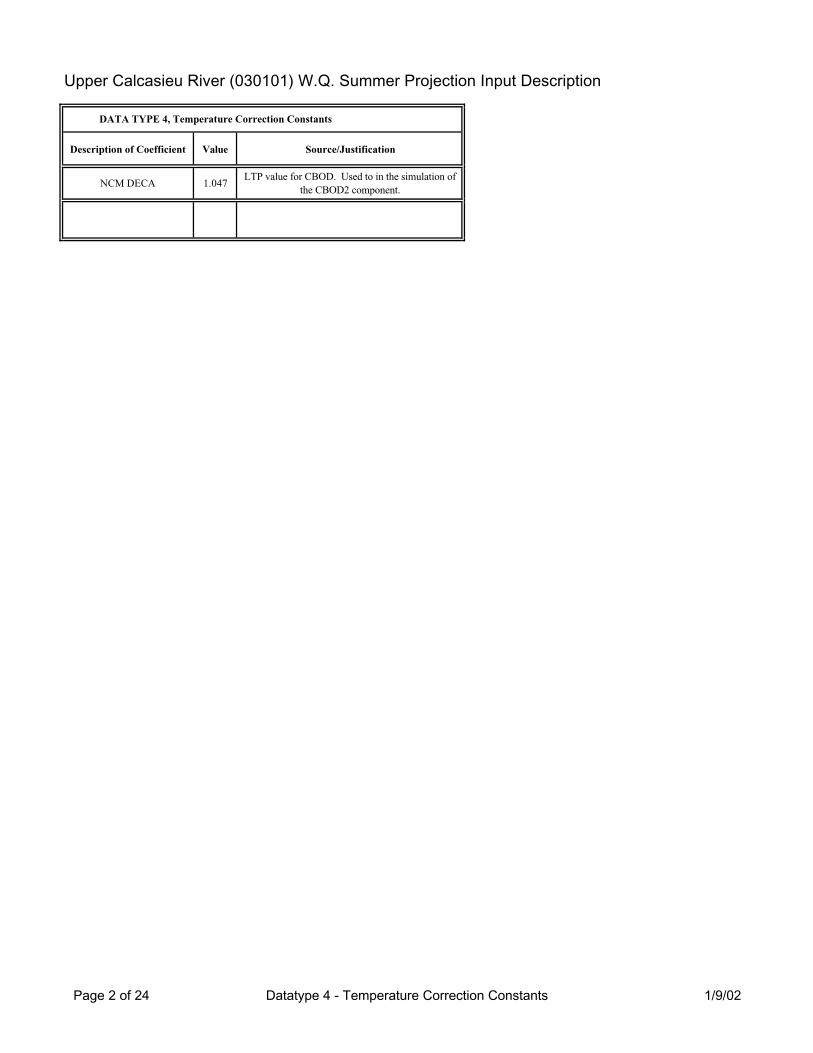
Upper Calcasieu River (030101) W.Q. Summer Projection Input Description
DATA TYPE 4, Temperature Correction Constants
Description of Coefficient Value Source/Justification
NCM DECA 1.047LTP value for CBOD. Used to in the simulation of
the CBOD2 component.
Page 2 of 24 Datatype 4 - Temperature Correction Constants 1/9/02
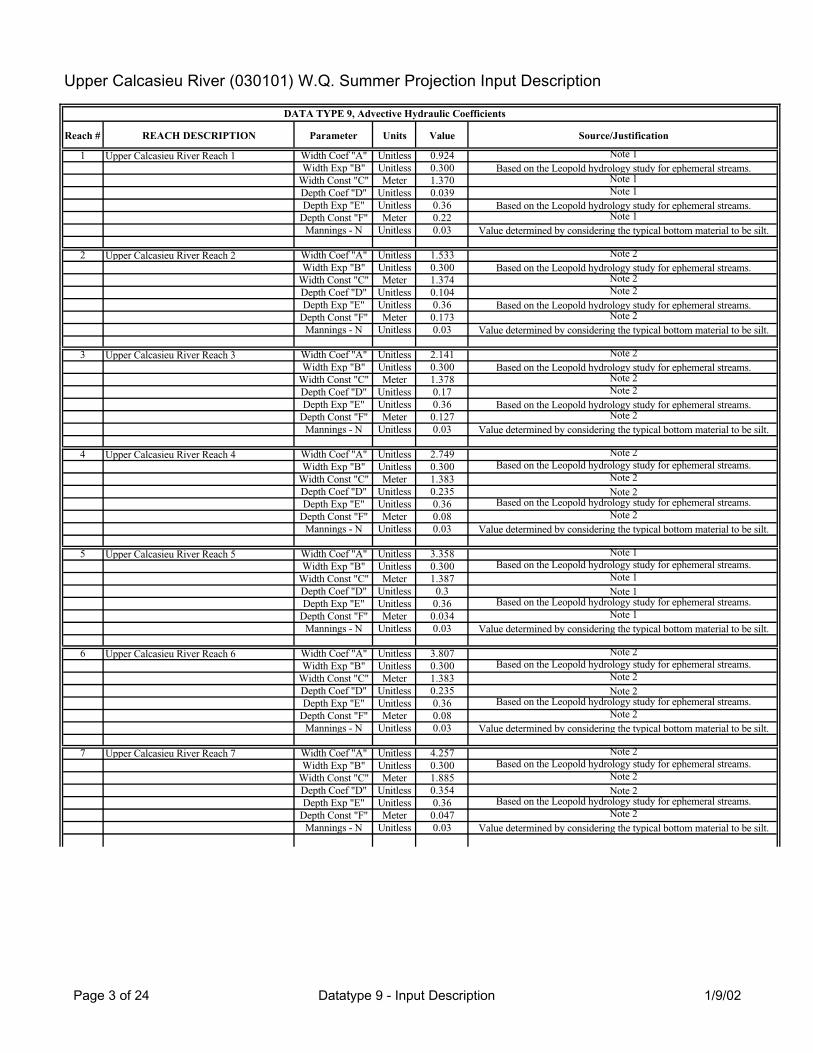
Upper Calcasieu River (030101) W.Q. Summer Projection Input Description
DATA TYPE 9, Advective Hydraulic Coefficients
Reach # REACH DESCRIPTION Parameter Units Value Source/Justification
1 Upper Calcasieu River Reach 1 Width Coef "A" Unitless 0.924 Note 1
Width Exp "B" Unitless 0.300 Based on the Leopold hydrology study for ephemeral streams.
Width Const "C" Meter 1.370 Note 1
Depth Coef "D" Unitless 0.039 Note 1
Depth Exp "E" Unitless 0.36 Based on the Leopold hydrology study for ephemeral streams.
Depth Const "F" Meter 0.22 Note 1
Mannings - N Unitless 0.03 Value determined by considering the typical bottom material to be silt.
2 Upper Calcasieu River Reach 2 Width Coef "A" Unitless 1.533 Note 2
Width Exp "B" Unitless 0.300 Based on the Leopold hydrology study for ephemeral streams.
Width Const "C" Meter 1.374 Note 2
Depth Coef "D" Unitless 0.104 Note 2
Depth Exp "E" Unitless 0.36 Based on the Leopold hydrology study for ephemeral streams.
Depth Const "F" Meter 0.173 Note 2
Mannings - N Unitless 0.03 Value determined by considering the typical bottom material to be silt.
3 Upper Calcasieu River Reach 3 Width Coef "A" Unitless 2.141 Note 2
Width Exp "B" Unitless 0.300 Based on the Leopold hydrology study for ephemeral streams.
Width Const "C" Meter 1.378 Note 2
Depth Coef "D" Unitless 0.17 Note 2
Depth Exp "E" Unitless 0.36 Based on the Leopold hydrology study for ephemeral streams.
Depth Const "F" Meter 0.127 Note 2
Mannings - N Unitless 0.03 Value determined by considering the typical bottom material to be silt.
4 Upper Calcasieu River Reach 4 Width Coef "A" Unitless 2.749 Note 2
Width Exp "B" Unitless 0.300 Based on the Leopold hydrology study for ephemeral streams.
Width Const "C" Meter 1.383 Note 2
Depth Coef "D" Unitless 0.235 Note 2
Depth Exp "E" Unitless 0.36 Based on the Leopold hydrology study for ephemeral streams.
Depth Const "F" Meter 0.08 Note 2
Mannings - N Unitless 0.03 Value determined by considering the typical bottom material to be silt.
5 Upper Calcasieu River Reach 5 Width Coef "A" Unitless 3.358 Note 1
Width Exp "B" Unitless 0.300 Based on the Leopold hydrology study for ephemeral streams.
Width Const "C" Meter 1.387 Note 1
Depth Coef "D" Unitless 0.3 Note 1
Depth Exp "E" Unitless 0.36 Based on the Leopold hydrology study for ephemeral streams.
Depth Const "F" Meter 0.034 Note 1
Mannings - N Unitless 0.03 Value determined by considering the typical bottom material to be silt.
6 Upper Calcasieu River Reach 6 Width Coef "A" Unitless 3.807 Note 2
Width Exp "B" Unitless 0.300 Based on the Leopold hydrology study for ephemeral streams.
Width Const "C" Meter 1.383 Note 2
Depth Coef "D" Unitless 0.235 Note 2
Depth Exp "E" Unitless 0.36 Based on the Leopold hydrology study for ephemeral streams.
Depth Const "F" Meter 0.08 Note 2
Mannings - N Unitless 0.03 Value determined by considering the typical bottom material to be silt.
7 Upper Calcasieu River Reach 7 Width Coef "A" Unitless 4.257 Note 2
Width Exp "B" Unitless 0.300 Based on the Leopold hydrology study for ephemeral streams.
Width Const "C" Meter 1.885 Note 2
Depth Coef "D" Unitless 0.354 Note 2
Depth Exp "E" Unitless 0.36 Based on the Leopold hydrology study for ephemeral streams.
Depth Const "F" Meter 0.047 Note 2
Mannings - N Unitless 0.03 Value determined by considering the typical bottom material to be silt.
Page 3 of 24 Datatype 9 - Input Description 1/9/02
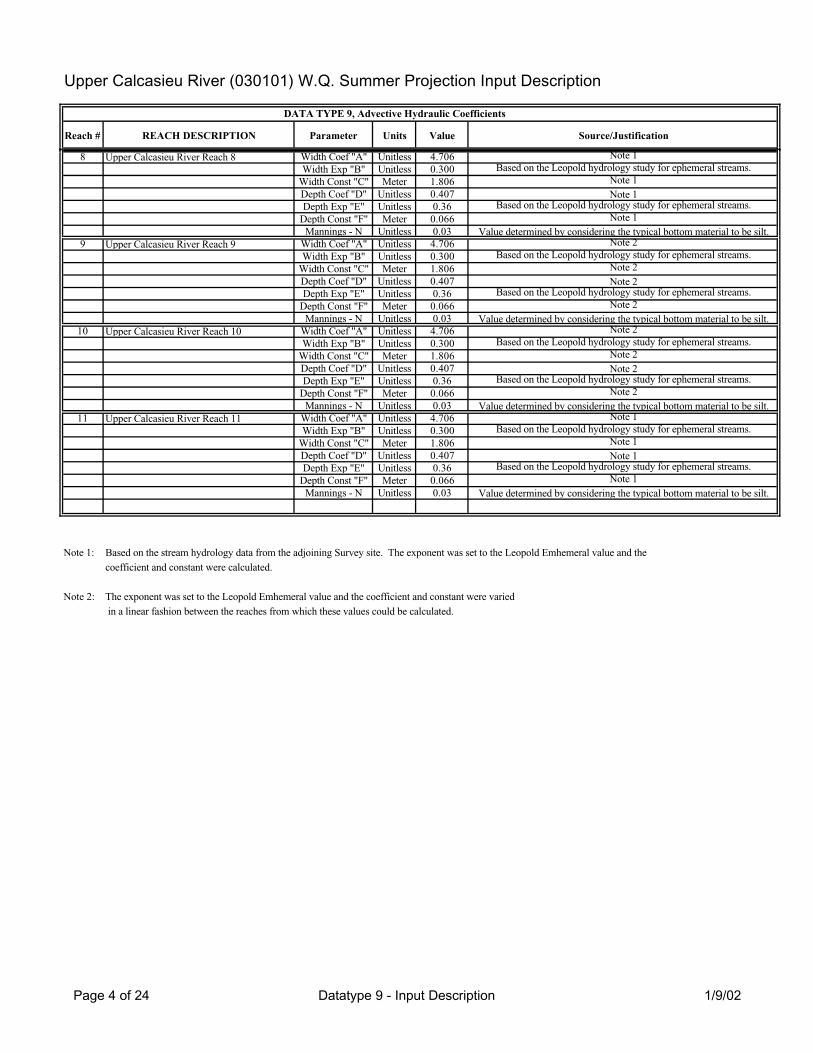
Upper Calcasieu River (030101) W.Q. Summer Projection Input Description
DATA TYPE 9, Advective Hydraulic Coefficients
Reach # REACH DESCRIPTION Parameter Units Value Source/Justification
8 Upper Calcasieu River Reach 8 Width Coef "A" Unitless 4.706 Note 1
Width Exp "B" Unitless 0.300 Based on the Leopold hydrology study for ephemeral streams.
Width Const "C" Meter 1.806 Note 1
Depth Coef "D" Unitless 0.407 Note 1
Depth Exp "E" Unitless 0.36 Based on the Leopold hydrology study for ephemeral streams.
Depth Const "F" Meter 0.066 Note 1
Mannings - N Unitless 0.03 Value determined by considering the typical bottom material to be silt.
9 Upper Calcasieu River Reach 9 Width Coef "A" Unitless 4.706 Note 2
Width Exp "B" Unitless 0.300 Based on the Leopold hydrology study for ephemeral streams.
Width Const "C" Meter 1.806 Note 2
Depth Coef "D" Unitless 0.407 Note 2
Depth Exp "E" Unitless 0.36 Based on the Leopold hydrology study for ephemeral streams.
Depth Const "F" Meter 0.066 Note 2
Mannings - N Unitless 0.03 Value determined by considering the typical bottom material to be silt.
10 Upper Calcasieu River Reach 10 Width Coef "A" Unitless 4.706 Note 2
Width Exp "B" Unitless 0.300 Based on the Leopold hydrology study for ephemeral streams.
Width Const "C" Meter 1.806 Note 2
Depth Coef "D" Unitless 0.407 Note 2
Depth Exp "E" Unitless 0.36 Based on the Leopold hydrology study for ephemeral streams.
Depth Const "F" Meter 0.066 Note 2
Mannings - N Unitless 0.03 Value determined by considering the typical bottom material to be silt.
11 Upper Calcasieu River Reach 11 Width Coef "A" Unitless 4.706 Note 1
Width Exp "B" Unitless 0.300 Based on the Leopold hydrology study for ephemeral streams.
Width Const "C" Meter 1.806 Note 1
Depth Coef "D" Unitless 0.407 Note 1
Depth Exp "E" Unitless 0.36 Based on the Leopold hydrology study for ephemeral streams.
Depth Const "F" Meter 0.066 Note 1
Mannings - N Unitless 0.03 Value determined by considering the typical bottom material to be silt.
Note 1: DBased on the stream hydrology data from the adjoining Survey site. The exponent was set to the Leopold Emhemeral value and the
coefficient and constant were calculated.
Note 2: The exponent was set to the Leopold Emhemeral value and the coefficient and constant were varied
in a linear fashion between the reaches from which these values could be calculated.
Page 4 of 24 Datatype 9 - Input Description 1/9/02
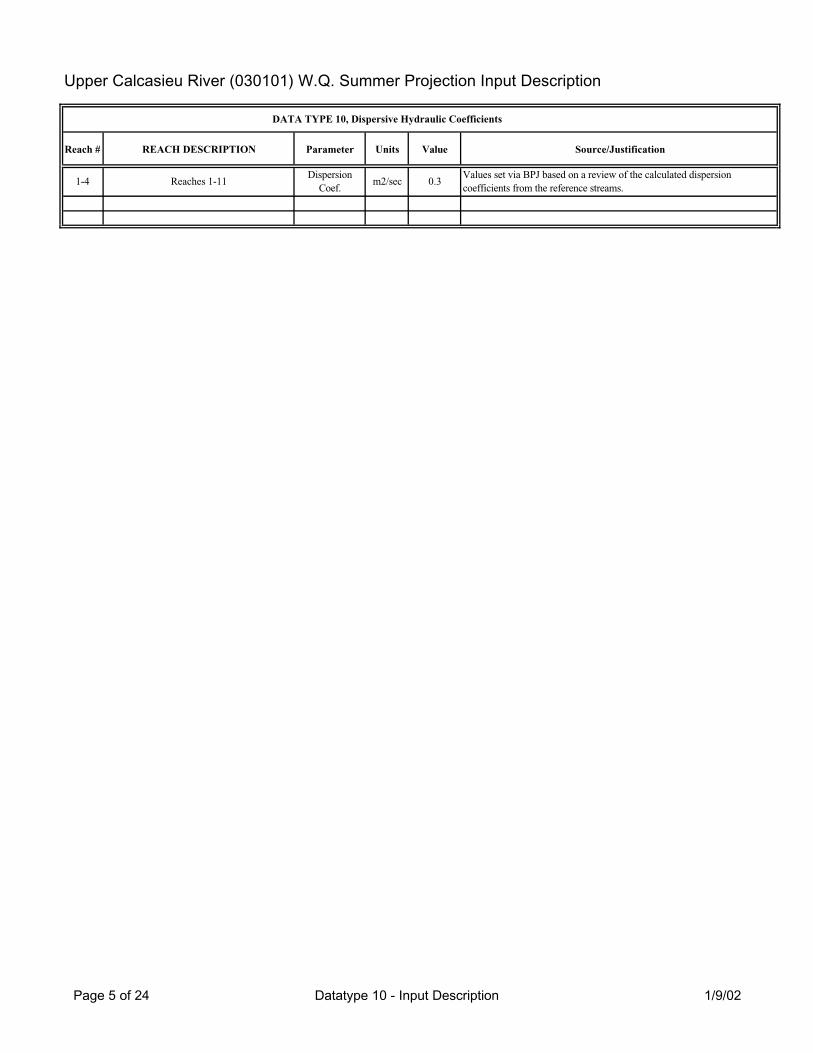
Upper Calcasieu River (030101) W.Q. Summer Projection Input Description
DATA TYPE 10, Dispersive Hydraulic Coefficients
Reach # REACH DESCRIPTION Parameter Units Value Source/Justification
1-4 Reaches 1-11Dispersion
Coef.m2/sec 0.3
Values set via BPJ based on a review of the calculated dispersion
coefficients from the reference streams.
Page 5 of 24 Datatype 10 - Input Description 1/9/02
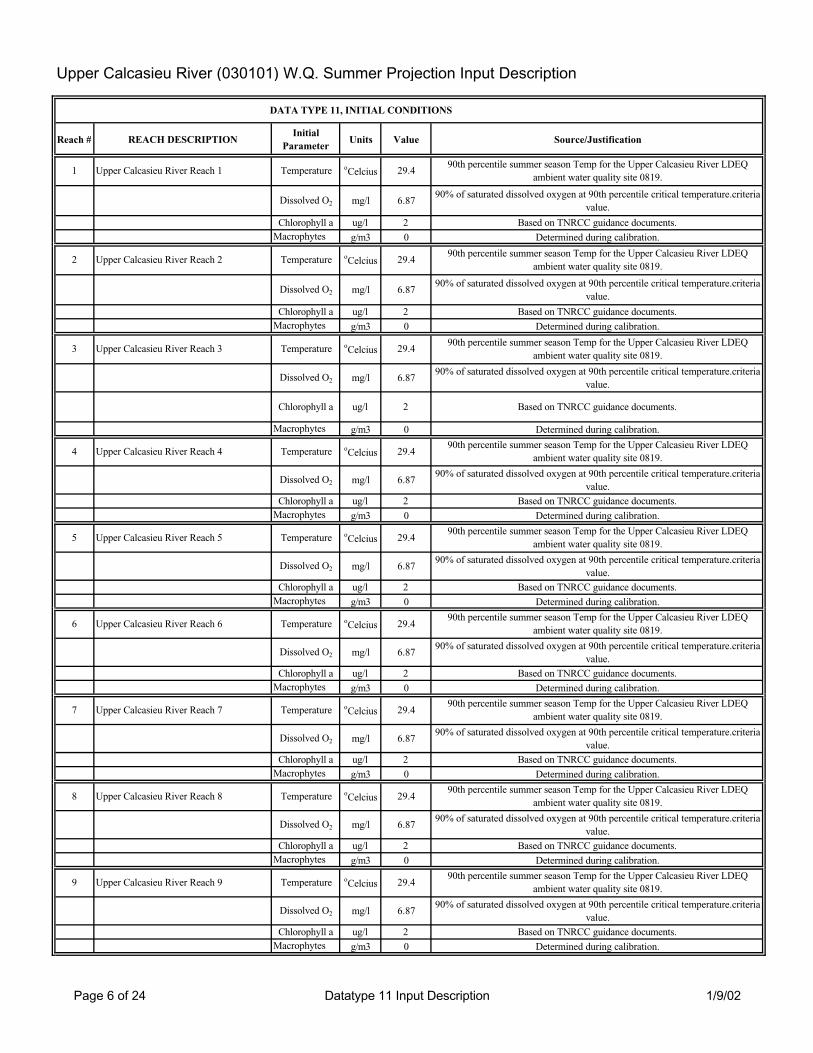
Upper Calcasieu River (030101) W.Q. Summer Projection Input Description
DATA TYPE 11, INITIAL CONDITIONS
Reach # REACH DESCRIPTIONInitial
ParameterUnits Value Source/Justification
1 Upper Calcasieu River Reach 1 Temperature oCelcius 29.4
90th percentile summer season Temp for the Upper Calcasieu River LDEQ
ambient water quality site 0819.
Dissolved O2 mg/l 6.8790% of saturated dissolved oxygen at 90th percentile critical temperature.criteria
value.
Chlorophyll a ug/l 2 Based on TNRCC guidance documents.
Macrophytes g/m3 0 Determined during calibration.
2 Upper Calcasieu River Reach 2 Temperature oCelcius 29.4
90th percentile summer season Temp for the Upper Calcasieu River LDEQ
ambient water quality site 0819.
Dissolved O2 mg/l 6.8790% of saturated dissolved oxygen at 90th percentile critical temperature.criteria
value.
Chlorophyll a ug/l 2 Based on TNRCC guidance documents.
Macrophytes g/m3 0 Determined during calibration.
3 Upper Calcasieu River Reach 3 Temperature oCelcius 29.4
90th percentile summer season Temp for the Upper Calcasieu River LDEQ
ambient water quality site 0819.
Dissolved O2 mg/l 6.8790% of saturated dissolved oxygen at 90th percentile critical temperature.criteria
value.
Chlorophyll a ug/l 2 Based on TNRCC guidance documents.
Macrophytes g/m3 0 Determined during calibration.
4 Upper Calcasieu River Reach 4 Temperature oCelcius 29.4
90th percentile summer season Temp for the Upper Calcasieu River LDEQ
ambient water quality site 0819.
Dissolved O2 mg/l 6.8790% of saturated dissolved oxygen at 90th percentile critical temperature.criteria
value.
Chlorophyll a ug/l 2 Based on TNRCC guidance documents.
Macrophytes g/m3 0 Determined during calibration.
5 Upper Calcasieu River Reach 5 Temperature oCelcius 29.4
90th percentile summer season Temp for the Upper Calcasieu River LDEQ
ambient water quality site 0819.
Dissolved O2 mg/l 6.8790% of saturated dissolved oxygen at 90th percentile critical temperature.criteria
value.
Chlorophyll a ug/l 2 Based on TNRCC guidance documents.
Macrophytes g/m3 0 Determined during calibration.
6 Upper Calcasieu River Reach 6 Temperature oCelcius 29.4
90th percentile summer season Temp for the Upper Calcasieu River LDEQ
ambient water quality site 0819.
Dissolved O2 mg/l 6.8790% of saturated dissolved oxygen at 90th percentile critical temperature.criteria
value.
Chlorophyll a ug/l 2 Based on TNRCC guidance documents.
Macrophytes g/m3 0 Determined during calibration.
7 Upper Calcasieu River Reach 7 Temperature oCelcius 29.4
90th percentile summer season Temp for the Upper Calcasieu River LDEQ
ambient water quality site 0819.
Dissolved O2 mg/l 6.8790% of saturated dissolved oxygen at 90th percentile critical temperature.criteria
value.
Chlorophyll a ug/l 2 Based on TNRCC guidance documents.
Macrophytes g/m3 0 Determined during calibration.
8 Upper Calcasieu River Reach 8 Temperature oCelcius 29.4
90th percentile summer season Temp for the Upper Calcasieu River LDEQ
ambient water quality site 0819.
Dissolved O2 mg/l 6.8790% of saturated dissolved oxygen at 90th percentile critical temperature.criteria
value.
Chlorophyll a ug/l 2 Based on TNRCC guidance documents.
Macrophytes g/m3 0 Determined during calibration.
9 Upper Calcasieu River Reach 9 Temperature oCelcius 29.4
90th percentile summer season Temp for the Upper Calcasieu River LDEQ
ambient water quality site 0819.
Dissolved O2 mg/l 6.8790% of saturated dissolved oxygen at 90th percentile critical temperature.criteria
value.
Chlorophyll a ug/l 2 Based on TNRCC guidance documents.
Macrophytes g/m3 0 Determined during calibration.
Page 6 of 24 Datatype 11 Input Description 1/9/02
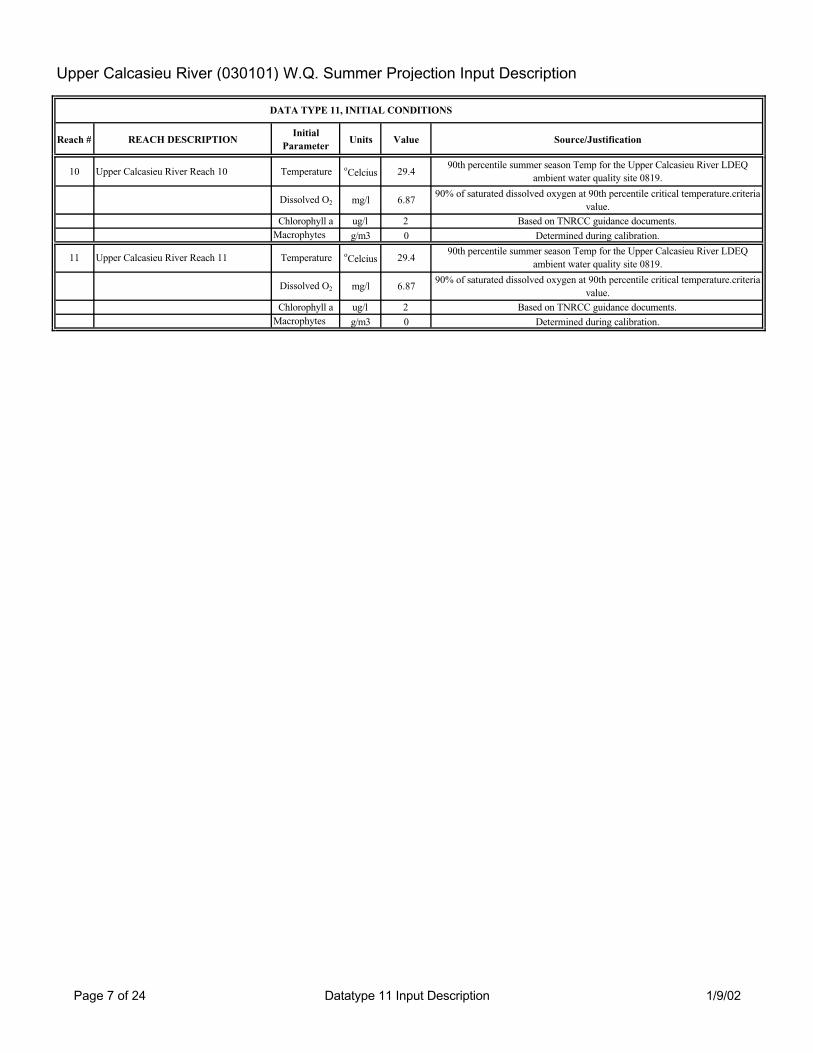
Upper Calcasieu River (030101) W.Q. Summer Projection Input Description
DATA TYPE 11, INITIAL CONDITIONS
Reach # REACH DESCRIPTIONInitial
ParameterUnits Value Source/Justification
10 Upper Calcasieu River Reach 10 Temperature oCelcius 29.4
90th percentile summer season Temp for the Upper Calcasieu River LDEQ
ambient water quality site 0819.
Dissolved O2 mg/l 6.8790% of saturated dissolved oxygen at 90th percentile critical temperature.criteria
value.
Chlorophyll a ug/l 2 Based on TNRCC guidance documents.
Macrophytes g/m3 0 Determined during calibration.
11 Upper Calcasieu River Reach 11 Temperature oCelcius 29.4
90th percentile summer season Temp for the Upper Calcasieu River LDEQ
ambient water quality site 0819.
Dissolved O2 mg/l 6.8790% of saturated dissolved oxygen at 90th percentile critical temperature.criteria
value.
Chlorophyll a ug/l 2 Based on TNRCC guidance documents.
Macrophytes g/m3 0 Determined during calibration.
Page 7 of 24 Datatype 11 Input Description 1/9/02

Upper Calcasieu River (030101) W.Q. Summer Projection Input Description
DATA TYPE 12, Reaeration, Sediment Oxygen Demand and BOD Coeff.
Reach # REACH DESCRIPTION Parameter Units Value Source/Justification
1 Upper Calcasieu River Reach 1 K2 option Unitless 15 The velocity and depths are within the range of the Louisiana Equations limits.
Oxygen Transfer coef. m/day 0.7 The minimum KL of 2.3 ft/day converted to 0.70 m/day.
Background SOD g/m2-day 0.57 Based on a 82.5% decrease in total nonpoint loading.
Aerobic BOD decay 1/day 0.17CBOD1 component. BPJ based on the measured values from the July,2001
survey site data.
BOD Settling rate 1/day 0.05Based on the LTP suggested CBOD settling rate for advance treatment
discharges.
2 Upper Calcasieu River Reach 2 K2 option Unitless 15 The velocity and depths are within the range of the Louisiana Equations limits.
Oxygen Transfer coef. m/day 0.7 The minimum KL of 2.3 ft/day converted to 0.70 m/day.
Background SOD g/m2-day 0.62 Based on a 82.5% decrease in total nonpoint loading.
Aerobic BOD decay 1/day 0.158CBOD1 component. BPJ based on the measured values from the July,2001
survey site data.
BOD Settling rate 1/day 0.05Based on the LTP suggested CBOD settling rate for advance treatment
discharges.
3 Upper Calcasieu River Reach 3 K2 option Unitless 15 The velocity and depths are within the range of the Louisiana Equations limits.
Oxygen Transfer coef. m/day 0.7 The minimum KL of 2.3 ft/day converted to 0.70 m/day.
Background SOD g/m2-day 0.69 Based on a 82.5% decrease in total nonpoint loading.
Aerobic BOD decay 1/day 0.145CBOD1 component. BPJ based on the measured values from the July,2001
survey site data.
BOD Settling rate 1/day 0.05Based on the LTP suggested CBOD settling rate for advance treatment
discharges.
4 Upper Calcasieu River Reach 4 K2 option Unitless 12 The velocity and depths are within the range of the Texas Equations limits.
Oxygen Transfer coef. m/day 0.7 The minimum KL of 2.3 ft/day converted to 0.70 m/day.
Background SOD g/m2-day 0.77 Based on a 82.5% decrease in total nonpoint loading.
Aerobic BOD decay 1/day 0.133CBOD1 component. BPJ based on the measured values from the July,2001
survey site data.
BOD Settling rate 1/day 0.05Based on the LTP suggested CBOD settling rate for advance treatment
discharges.
5 Upper Calcasieu River Reach 5 K2 option Unitless 12 The velocity and depths are within the range of the Texas Equations limits.
Oxygen Transfer coef. m/day 0.7 The minimum KL of 2.3 ft/day converted to 0.70 m/day.
Background SOD g/m2-day 0.90 Based on a 82.5% decrease in total nonpoint loading.
Aerobic BOD decay 1/day 0.12CBOD1 component. BPJ based on the measured values from the July,2001
survey site data.
BOD Settling rate 1/day 0.05Based on the LTP suggested CBOD settling rate for advance treatment
discharges.
6 Upper Calcasieu River Reach 6 K2 option Unitless 12 The velocity and depths are within the range of the Texas Equations limits.
Oxygen Transfer coef. m/day 0.7 The minimum KL of 2.3 ft/day converted to 0.70 m/day.
Background SOD g/m2-day 0.95 Based on a 82.5% decrease in total nonpoint loading.
Aerobic BOD decay 1/day 0.12CBOD1 component. BPJ based on the measured values from the July,2001
survey site data.
BOD Settling rate 1/day 0.05Based on the LTP suggested CBOD settling rate for advance treatment
discharges.
Page 8 of 24 Datatype 12 Input Description 1/9/02

Upper Calcasieu River (030101) W.Q. Summer Projection Input Description
DATA TYPE 12, Reaeration, Sediment Oxygen Demand and BOD Coeff.
Reach # REACH DESCRIPTION Parameter Units Value Source/Justification
7 Upper Calcasieu River Reach 7 K2 option Unitless 12 The velocity and depths are within the range of the Texas Equations limits.
Oxygen Transfer coef. m/day 0.7 The minimum KL of 2.3 ft/day converted to 0.70 m/day.
Background SOD g/m2-day 1.02 Based on a 82.5% decrease in total nonpoint loading.
Aerobic BOD decay 1/day 0.12CBOD1 component. BPJ based on the measured values from the July,2001
survey site data.
BOD Settling rate 1/day 0.05Based on the LTP suggested CBOD settling rate for advance treatment
discharges.
8 Upper Calcasieu River Reach 8 K2 option Unitless 12 The velocity and depths are within the range of the Texas Equations limits.
Oxygen Transfer coef. m/day 0.7 The minimum KL of 2.3 ft/day converted to 0.70 m/day.
Background SOD g/m2-day 1.07 Based on a 82.5% decrease in total nonpoint loading.
Aerobic BOD decay 1/day 0.12CBOD1 component. BPJ based on the measured values from the July,2001
survey site data.
BOD Settling rate 1/day 0.05Based on the LTP suggested CBOD settling rate for advance treatment
discharges.
9 Upper Calcasieu River Reach 9 K2 option Unitless 12 The velocity and depths are within the range of the Texas Equations limits.
Oxygen Transfer coef. m/day 0.7 The minimum KL of 2.3 ft/day converted to 0.70 m/day.
Background SOD g/m2-day 1.16 Based on a 82.5% decrease in total nonpoint loading.
Aerobic BOD decay 1/day 0.12CBOD1 component. BPJ based on the measured values from the July,2001
survey site data.
BOD Settling rate 1/day 0.05Based on the LTP suggested CBOD settling rate for advance treatment
discharges.
10 Upper Calcasieu River Reach 10 K2 option Unitless 12 The velocity and depths are within the range of the Texas Equations limits.
Oxygen Transfer coef. m/day 0.7 The minimum KL of 2.3 ft/day converted to 0.70 m/day.
Background SOD g/m2-day 1.27 Based on a 82.5% decrease in total nonpoint loading.
Aerobic BOD decay 1/day 0.12CBOD1 component. BPJ based on the measured values from the July,2001
survey site data.
BOD Settling rate 1/day 0.05Based on the LTP suggested CBOD settling rate for advance treatment
discharges.
11 Upper Calcasieu River Reach 11 K2 option Unitless 12 The velocity and depths are within the range of the Texas Equations limits.
Oxygen Transfer coef. m/day 0.7 The minimum KL of 2.3 ft/day converted to 0.70 m/day.
Background SOD g/m2-day 1.44 Based on a 82.5% decrease in total nonpoint loading.
Aerobic BOD decay 1/day 0.12CBOD1 component. BPJ based on the measured values from the July,2001
survey site data.
BOD Settling rate 1/day 0.05Based on the LTP suggested CBOD settling rate for advance treatment
discharges.
Note: Upon review of the measured CBOD daily values it became apparent that there were two distinct CBOD components, which had varying ultimate values as well as
decay rates and lag times. The first component started its decay almost immediately while the second component had substantial lag times ranging. The total CBOD
curves presented in Appendix C5 is the sum of the two first order equations, which were derived using the Microsoft Excel Solver and were based on the measured daily
CBOD values. These two CBOD components were modeled separately as BOD and Nonconservative Material (NCM) in the LAQUAL model.
Page 9 of 24 Datatype 12 Input Description 1/9/02

Upper Calcasieu River (030101) W.Q. Summer Projection Input Description
DATA TYPE 13, Nitrogen and Phosphorus
Reach # REACH DESCRIPTION Parameter Units Value Source/Justification
1 Upper Calcasieu River Reach 1Organic Nitrogen decay
rate1/day 0.03
Value based on the NBOD rates, that were measured in the July, 2001
survey site data.
Organic Nitrogen
settling rate1/day 0.05
Based on the LTP suggested CBOD settling rate for advance treatment
discharges.
Ammonia Nitrogen
oxidation rate1/day 0.5
BPJ. Maximum value given in EPA's Rates, Constants, and Kinetics
Formulations in Surface Water Quality Modeling (2nd edition). 1985
2 Upper Calcasieu River Reach 2Organic Nitrogen decay
rate1/day 0.083
Value based on the NBOD rates, that were measured in the July, 2001
survey site data.
Organic Nitrogen
settling rate1/day 0.05
Based on the LTP suggested CBOD settling rate for advance treatment
discharges.
Ammonia Nitrogen
oxidation rate1/day 0.5
BPJ. Maximum value given in EPA's Rates, Constants, and Kinetics
Formulations in Surface Water Quality Modeling (2nd edition). 1985
3 Upper Calcasieu River Reach 3Organic Nitrogen decay
rate1/day 0.135
Value based on the NBOD rates, that were measured in the July, 2001
survey site data.
Organic Nitrogen
settling rate1/day 0.05
Based on the LTP suggested CBOD settling rate for advance treatment
discharges.
Ammonia Nitrogen
oxidation rate1/day 0.5
BPJ. Maximum value given in EPA's Rates, Constants, and Kinetics
Formulations in Surface Water Quality Modeling (2nd edition). 1985
4 Upper Calcasieu River Reach 4Organic Nitrogen decay
rate1/day 0.188
Value based on the NBOD rates, that were measured in the July, 2001
survey site data.
Organic Nitrogen
settling rate1/day 0.05
Based on the LTP suggested CBOD settling rate for advance treatment
discharges.
Ammonia Nitrogen
oxidation rate1/day 0.5
BPJ. Maximum value given in EPA's Rates, Constants, and Kinetics
Formulations in Surface Water Quality Modeling (2nd edition). 1985
5 Upper Calcasieu River Reach 4Organic Nitrogen decay
rate1/day 0.24
Value based on the NBOD rates, that were measured in the July, 2001
survey site data.
Organic Nitrogen
settling rate1/day 0.05
Based on the LTP suggested CBOD settling rate for advance treatment
discharges.
Ammonia Nitrogen
oxidation rate1/day 0.5
BPJ. Maximum value given in EPA's Rates, Constants, and Kinetics
Formulations in Surface Water Quality Modeling (2nd edition). 1985
6 Upper Calcasieu River Reach 6Organic Nitrogen decay
rate1/day 0.193
Value based on the NBOD rates, that were measured in the July, 2001
survey site data.
Organic Nitrogen
settling rate1/day 0.05
Based on the LTP suggested CBOD settling rate for advance treatment
discharges.
Ammonia Nitrogen
oxidation rate1/day 0.5
BPJ. Maximum value given in EPA's Rates, Constants, and Kinetics
Formulations in Surface Water Quality Modeling (2nd edition). 1985
7 Upper Calcasieu River Reach 7Organic Nitrogen decay
rate1/day 0.147
Value based on the NBOD rates, that were measured in the July, 2001
survey site data.
Organic Nitrogen
settling rate1/day 0.05
Based on the LTP suggested CBOD settling rate for advance treatment
discharges.
Ammonia Nitrogen
oxidation rate1/day 0.5
BPJ. Maximum value given in EPA's Rates, Constants, and Kinetics
Formulations in Surface Water Quality Modeling (2nd edition). 1985
8 Upper Calcasieu River Reach 8Organic Nitrogen decay
rate1/day 0.1
Value based on the NBOD rates, that were measured in the July, 2001
survey site data.
Organic Nitrogen
settling rate1/day 0.05
Based on the LTP suggested CBOD settling rate for advance treatment
discharges.
Ammonia Nitrogen
oxidation rate1/day 0.5
BPJ. Maximum value given in EPA's Rates, Constants, and Kinetics
Formulations in Surface Water Quality Modeling (2nd edition). 1985
Page 10 of 24 Datatype 13 Input Description 1/9/02

Upper Calcasieu River (030101) W.Q. Summer Projection Input Description
DATA TYPE 13, Nitrogen and Phosphorus
Reach # REACH DESCRIPTION Parameter Units Value Source/Justification
9 Upper Calcasieu River Reach 9Organic Nitrogen decay
rate1/day 0.12
Value based on the NBOD rates, that were measured in the July, 2001
survey site data.
Organic Nitrogen
settling rate1/day 0.05
Based on the LTP suggested CBOD settling rate for advance treatment
discharges.
Ammonia Nitrogen
oxidation rate1/day 0.5
BPJ. Maximum value given in EPA's Rates, Constants, and Kinetics
Formulations in Surface Water Quality Modeling (2nd edition). 1985
10 Upper Calcasieu River Reach 10Organic Nitrogen decay
rate1/day 0.14
Value based on the NBOD rates, that were measured in the July, 2001
survey site data.
Organic Nitrogen
settling rate1/day 0.05
Based on the LTP suggested CBOD settling rate for advance treatment
discharges.
Ammonia Nitrogen
oxidation rate1/day 0.5
BPJ. Maximum value given in EPA's Rates, Constants, and Kinetics
Formulations in Surface Water Quality Modeling (2nd edition). 1985
11 Upper Calcasieu River Reach 11Organic Nitrogen decay
rate1/day 0.16
Value based on the NBOD rates, that were measured in the July, 2001
survey site data.
Organic Nitrogen
settling rate1/day 0.05
Based on the LTP suggested CBOD settling rate for advance treatment
discharges.
Ammonia Nitrogen
oxidation rate1/day 0.5
BPJ. Maximum value given in EPA's Rates, Constants, and Kinetics
Formulations in Surface Water Quality Modeling (2nd edition). 1985
Page 11 of 24 Datatype 13 Input Description 1/9/02

Upper Calcasieu River (030101) W.Q. Summer Projection Input Description
DATA TYPE 15, Coliform and Nonconservative Coefficents
Reach # REACH DESCRIPTION Parameter Units Value Source/Justification
1 Upper Calcasieu River Reach 1 NCM Decay 1/day 0.029Value based on the CBOD2 rates, that were measured in the July, 2001
survey site data.
NCM Settling Rate m/day 0.05Based on the LTP suggested CBOD settling rate for advance treatment
discharges.
2 Upper Calcasieu River Reach 2 NCM Decay 1/day 0.025Value based on the CBOD2 rates, that were measured in the July, 2001
survey site data.
NCM Settling Rate m/day 0.05Based on the LTP suggested CBOD settling rate for advance treatment
discharges.
3 Upper Calcasieu River Reach 3 NCM Decay 1/day 0.021Value based on the CBOD2 rates, that were measured in the July, 2001
survey site data.
NCM Settling Rate m/day 0.05Based on the LTP suggested CBOD settling rate for advance treatment
discharges.
4 Upper Calcasieu River Reach 4 NCM Decay 1/day 0.16Value based on the CBOD2 rates, that were measured in the July, 2001
survey site data.
NCM Settling Rate m/day 0.05Based on the LTP suggested CBOD settling rate for advance treatment
discharges.
5 Upper Calcasieu River Reach 5 NCM Decay 1/day 0.012Value based on the CBOD2 rates, that were measured in the July, 2001
survey site data.
NCM Settling Rate m/day 0.05Based on the LTP suggested CBOD settling rate for advance treatment
discharges.
6 Upper Calcasieu River Reach 6 NCM Decay 1/day 0.012Value based on the CBOD2 rates, that were measured in the July, 2001
survey site data.
NCM Settling Rate m/day 0.05Based on the LTP suggested CBOD settling rate for advance treatment
discharges.
7 Upper Calcasieu River Reach 7 NCM Decay 1/day 0.012Value based on the CBOD2 rates, that were measured in the July, 2001
survey site data.
NCM Settling Rate m/day 0.05Based on the LTP suggested CBOD settling rate for advance treatment
discharges.
8 Upper Calcasieu River Reach 8 NCM Decay 1/day 0.012Value based on the CBOD2 rates, that were measured in the July, 2001
survey site data.
NCM Settling Rate m/day 0.05Based on the LTP suggested CBOD settling rate for advance treatment
discharges.
9 Upper Calcasieu River Reach 9 NCM Decay 1/day 0.012Value based on the CBOD2 rates, that were measured in the July, 2001
survey site data.
NCM Settling Rate m/day 0.05Based on the LTP suggested CBOD settling rate for advance treatment
discharges.
10 Upper Calcasieu River Reach 10 NCM Decay 1/day 0.012Value based on the CBOD2 rates, that were measured in the July, 2001
survey site data.
NCM Settling Rate m/day 0.05Based on the LTP suggested CBOD settling rate for advance treatment
discharges.
11 Upper Calcasieu River Reach 11 NCM Decay 1/day 0.012Value based on the CBOD2 rates, that were measured in the July, 2001
survey site data.
NCM Settling Rate m/day 0.05Based on the LTP suggested CBOD settling rate for advance treatment
discharges.
Note: Upon review of the measured CBOD daily values it became apparent that there were two distinct CBOD components, which had varying ultimate values as
well as decay rates and lag times. The first component started its decay almost immediately while the second component had substantial lag times ranging from
16.65 to 22.23 days. The total CBOD curves presented in Appendix C5 is the sum of the two first order equations, which were derived using the Microsoft Excel
Solver and were based on the measured daily CBOD values. These two CBOD components were modeled separately as BOD and Nonconservative Material
(NCM) in the LAQUAL model.
Page 12 of 24 Datatype 15 Input Description 1/9/02

Upper Calcasieu River (030101) W.Q. Summer Projection Input Description
DATA TYPE 16, Incremental Data for Flow, Temperature, Salinity, and Conservatives
Reach #
REACH DESCRIPTION Parameter Units Value Source/Justification
1Upper Calcasieu River Reach
1Incremental Inflow m
3/s 0.0000 Negated the incremental flow to simulate critical conditions.
Incremental
Temperature
degrees
Celcius29.4
90th percentile summer season Temp for the Upper Calcasieu River LDEQ ambient water
quality site 0819.
2Upper Calcasieu River Reach
2Incremental Inflow m
3/s 0.0000 Negated the incremental flow to simulate critical conditions.
Incremental
Temperature
degrees
Celcius29.4
90th percentile summer season Temp for the Upper Calcasieu River LDEQ ambient water
quality site 0819.
3Upper Calcasieu River Reach
3Incremental Inflow m
3/s 0.0000 Negated the incremental flow to simulate critical conditions.
Incremental
Temperature
degrees
Celcius29.4
90th percentile summer season Temp for the Upper Calcasieu River LDEQ ambient water
quality site 0819.
4Upper Calcasieu River Reach
4Incremental Inflow m
3/s 0.0000 Negated the incremental flow to simulate critical conditions.
Incremental
Temperature
degrees
Celcius29.4
90th percentile summer season Temp for the Upper Calcasieu River LDEQ ambient water
quality site 0819.
5Upper Calcasieu River Reach
5Incremental Inflow m
3/s 0.0000 Negated the incremental flow to simulate critical conditions.
Incremental
Temperature
degrees
Celcius29.4
90th percentile summer season Temp for the Upper Calcasieu River LDEQ ambient water
quality site 0819.
6Upper Calcasieu River Reach
6Incremental Inflow m
3/s 0.0000 Negated the incremental flow to simulate critical conditions.
Incremental
Temperature
degrees
Celcius29.4
90th percentile summer season Temp for the Upper Calcasieu River LDEQ ambient water
quality site 0819.
7Upper Calcasieu River Reach
7Incremental Inflow m
3/s 0.0000 Negated the incremental flow to simulate critical conditions.
Incremental
Temperature
degrees
Celcius29.4
90th percentile summer season Temp for the Upper Calcasieu River LDEQ ambient water
quality site 0819.
8Upper Calcasieu River Reach
8Incremental Inflow m
3/s 0.0000 Negated the incremental flow to simulate critical conditions.
Incremental
Temperature
degrees
Celcius29.4
90th percentile summer season Temp for the Upper Calcasieu River LDEQ ambient water
quality site 0819.
9Upper Calcasieu River Reach
9Incremental Inflow m
3/s 0.0000 Negated the incremental flow to simulate critical conditions.
Incremental
Temperature
degrees
Celcius29.4
90th percentile summer season Temp for the Upper Calcasieu River LDEQ ambient water
quality site 0819.
10Upper Calcasieu River Reach
10Incremental Inflow m
3/s 0.0000 Negated the incremental flow to simulate critical conditions.
Incremental
Temperature
degrees
Celcius29.4
90th percentile summer season Temp for the Upper Calcasieu River LDEQ ambient water
quality site 0819.
11Upper Calcasieu River Reach
11Incremental Inflow m
3/s 0.0000 Negated the incremental flow to simulate critical conditions.
Incremental
Temperature
degrees
Celcius29.4
90th percentile summer season Temp for the Upper Calcasieu River LDEQ ambient water
quality site 0819.
Page 13 of 24 Datatype 16 Input Description 1/9/02
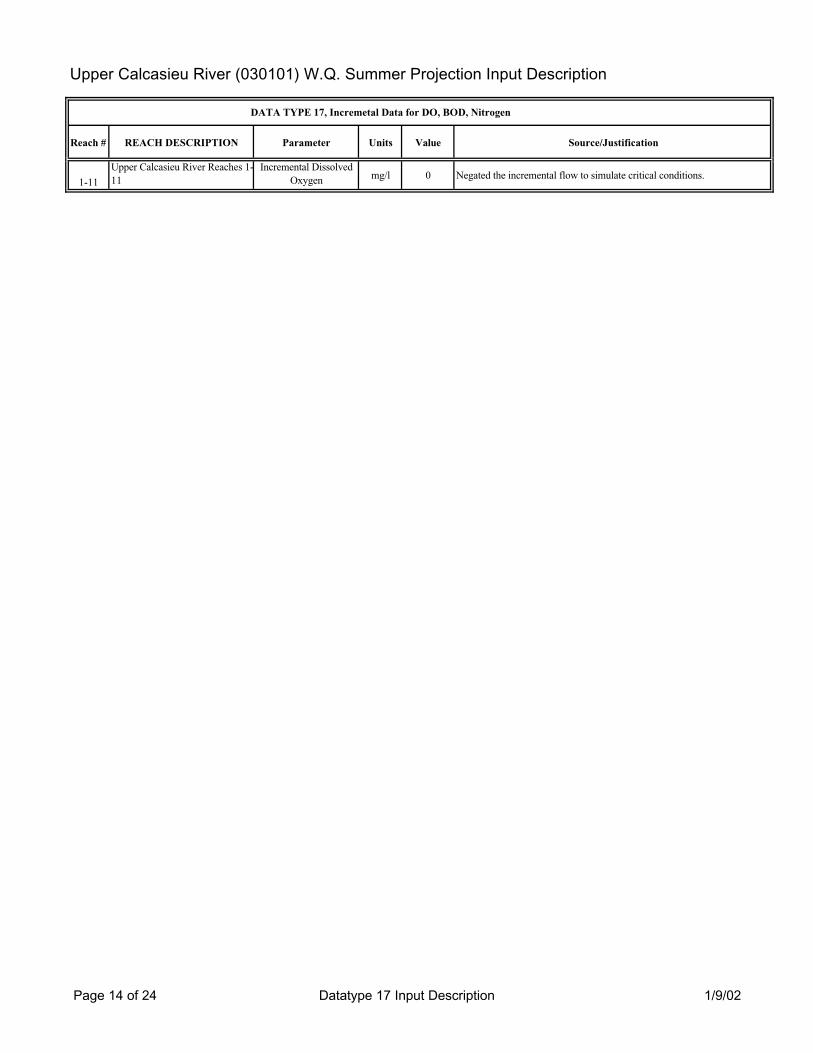
Upper Calcasieu River (030101) W.Q. Summer Projection Input Description
DATA TYPE 17, Incremetal Data for DO, BOD, Nitrogen
Reach # REACH DESCRIPTION Parameter Units Value Source/Justification
1-11
Upper Calcasieu River Reaches 1-
11
Incremental Dissolved
Oxygenmg/l 0 Negated the incremental flow to simulate critical conditions.
Page 14 of 24 Datatype 17 Input Description 1/9/02

Upper Calcasieu River (030101) W.Q. Summer Projection Input Description
DATA TYPE 18, Incremetal Data for Phosphorus, Chlorophyll, Coliform, and Nonconservatives
Reach # REACH DESCRIPTION Parameter Units Value Source/Justification
1-11
Upper Calcasieu River Reaches
1-11 All Negated the incremental flow to simulate critical conditions.
Page 15 of 24 Datatype 18 Input Description 1/9/02
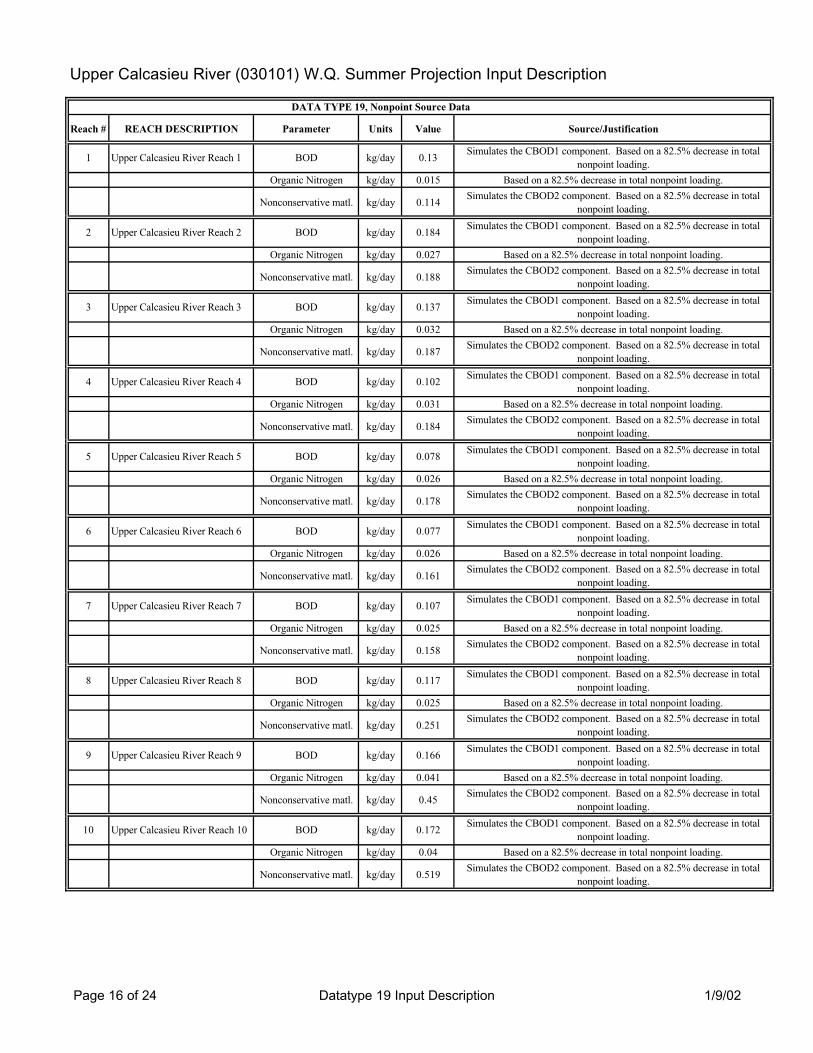
Upper Calcasieu River (030101) W.Q. Summer Projection Input Description
DATA TYPE 19, Nonpoint Source Data
Reach # REACH DESCRIPTION Parameter Units Value Source/Justification
1 Upper Calcasieu River Reach 1 BOD kg/day 0.13Simulates the CBOD1 component. Based on a 82.5% decrease in total
nonpoint loading.
Organic Nitrogen kg/day 0.015 Based on a 82.5% decrease in total nonpoint loading.
Nonconservative matl. kg/day 0.114Simulates the CBOD2 component. Based on a 82.5% decrease in total
nonpoint loading.
2 Upper Calcasieu River Reach 2 BOD kg/day 0.184Simulates the CBOD1 component. Based on a 82.5% decrease in total
nonpoint loading.
Organic Nitrogen kg/day 0.027 Based on a 82.5% decrease in total nonpoint loading.
Nonconservative matl. kg/day 0.188Simulates the CBOD2 component. Based on a 82.5% decrease in total
nonpoint loading.
3 Upper Calcasieu River Reach 3 BOD kg/day 0.137Simulates the CBOD1 component. Based on a 82.5% decrease in total
nonpoint loading.
Organic Nitrogen kg/day 0.032 Based on a 82.5% decrease in total nonpoint loading.
Nonconservative matl. kg/day 0.187Simulates the CBOD2 component. Based on a 82.5% decrease in total
nonpoint loading.
4 Upper Calcasieu River Reach 4 BOD kg/day 0.102Simulates the CBOD1 component. Based on a 82.5% decrease in total
nonpoint loading.
Organic Nitrogen kg/day 0.031 Based on a 82.5% decrease in total nonpoint loading.
Nonconservative matl. kg/day 0.184Simulates the CBOD2 component. Based on a 82.5% decrease in total
nonpoint loading.
5 Upper Calcasieu River Reach 5 BOD kg/day 0.078Simulates the CBOD1 component. Based on a 82.5% decrease in total
nonpoint loading.
Organic Nitrogen kg/day 0.026 Based on a 82.5% decrease in total nonpoint loading.
Nonconservative matl. kg/day 0.178Simulates the CBOD2 component. Based on a 82.5% decrease in total
nonpoint loading.
6 Upper Calcasieu River Reach 6 BOD kg/day 0.077Simulates the CBOD1 component. Based on a 82.5% decrease in total
nonpoint loading.
Organic Nitrogen kg/day 0.026 Based on a 82.5% decrease in total nonpoint loading.
Nonconservative matl. kg/day 0.161Simulates the CBOD2 component. Based on a 82.5% decrease in total
nonpoint loading.
7 Upper Calcasieu River Reach 7 BOD kg/day 0.107Simulates the CBOD1 component. Based on a 82.5% decrease in total
nonpoint loading.
Organic Nitrogen kg/day 0.025 Based on a 82.5% decrease in total nonpoint loading.
Nonconservative matl. kg/day 0.158Simulates the CBOD2 component. Based on a 82.5% decrease in total
nonpoint loading.
8 Upper Calcasieu River Reach 8 BOD kg/day 0.117Simulates the CBOD1 component. Based on a 82.5% decrease in total
nonpoint loading.
Organic Nitrogen kg/day 0.025 Based on a 82.5% decrease in total nonpoint loading.
Nonconservative matl. kg/day 0.251Simulates the CBOD2 component. Based on a 82.5% decrease in total
nonpoint loading.
9 Upper Calcasieu River Reach 9 BOD kg/day 0.166Simulates the CBOD1 component. Based on a 82.5% decrease in total
nonpoint loading.
Organic Nitrogen kg/day 0.041 Based on a 82.5% decrease in total nonpoint loading.
Nonconservative matl. kg/day 0.45Simulates the CBOD2 component. Based on a 82.5% decrease in total
nonpoint loading.
10 Upper Calcasieu River Reach 10 BOD kg/day 0.172Simulates the CBOD1 component. Based on a 82.5% decrease in total
nonpoint loading.
Organic Nitrogen kg/day 0.04 Based on a 82.5% decrease in total nonpoint loading.
Nonconservative matl. kg/day 0.519Simulates the CBOD2 component. Based on a 82.5% decrease in total
nonpoint loading.
Page 16 of 24 Datatype 19 Input Description 1/9/02

Upper Calcasieu River (030101) W.Q. Summer Projection Input Description
DATA TYPE 19, Nonpoint Source Data
Reach # REACH DESCRIPTION Parameter Units Value Source/Justification
11 Upper Calcasieu River Reach 11 BOD kg/day 0.191Simulates the CBOD1 component. Based on a 82.5% decrease in total
nonpoint loading.
Organic Nitrogen kg/day 0.044 Based on a 82.5% decrease in total nonpoint loading.
Nonconservative matl. kg/day 0.537Simulates the CBOD2 component. Based on a 82.5% decrease in total
nonpoint loading.
Note: Upon review of the measured CBOD daily values it became apparent that there were two distinct CBOD components, which had varying ultimate values as well as
decay rates and lag times. The first component started its decay almost immediately while the second component had substantial lag times. The total CBOD curves
presented in Appendix C5 is the sum of the two first order equations, which were derived using the Microsoft Excel Solver and were based on the measured daily CBOD
values. These two CBOD components were modeled separately as BOD (CBOD1) and Nonconservative Material (NCM) (CBOD2) in the LAQUAL model.
Page 17 of 24 Datatype 19 Input Description 1/9/02
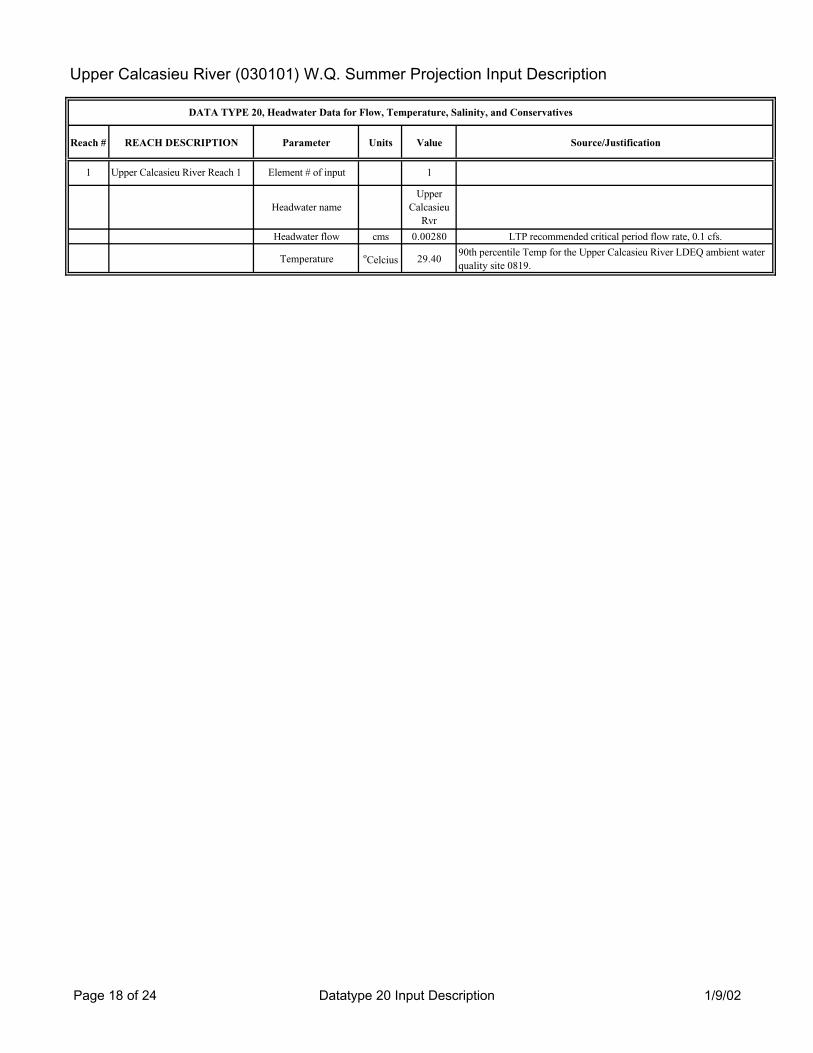
Upper Calcasieu River (030101) W.Q. Summer Projection Input Description
DATA TYPE 20, Headwater Data for Flow, Temperature, Salinity, and Conservatives
Reach # REACH DESCRIPTION Parameter Units Value Source/Justification
1 Upper Calcasieu River Reach 1 Element # of input 1
Headwater name
Upper
Calcasieu
Rvr
Headwater flow cms 0.00280 LTP recommended critical period flow rate, 0.1 cfs.
Temperature oCelcius 29.40
90th percentile Temp for the Upper Calcasieu River LDEQ ambient water
quality site 0819.
Page 18 of 24 Datatype 20 Input Description 1/9/02
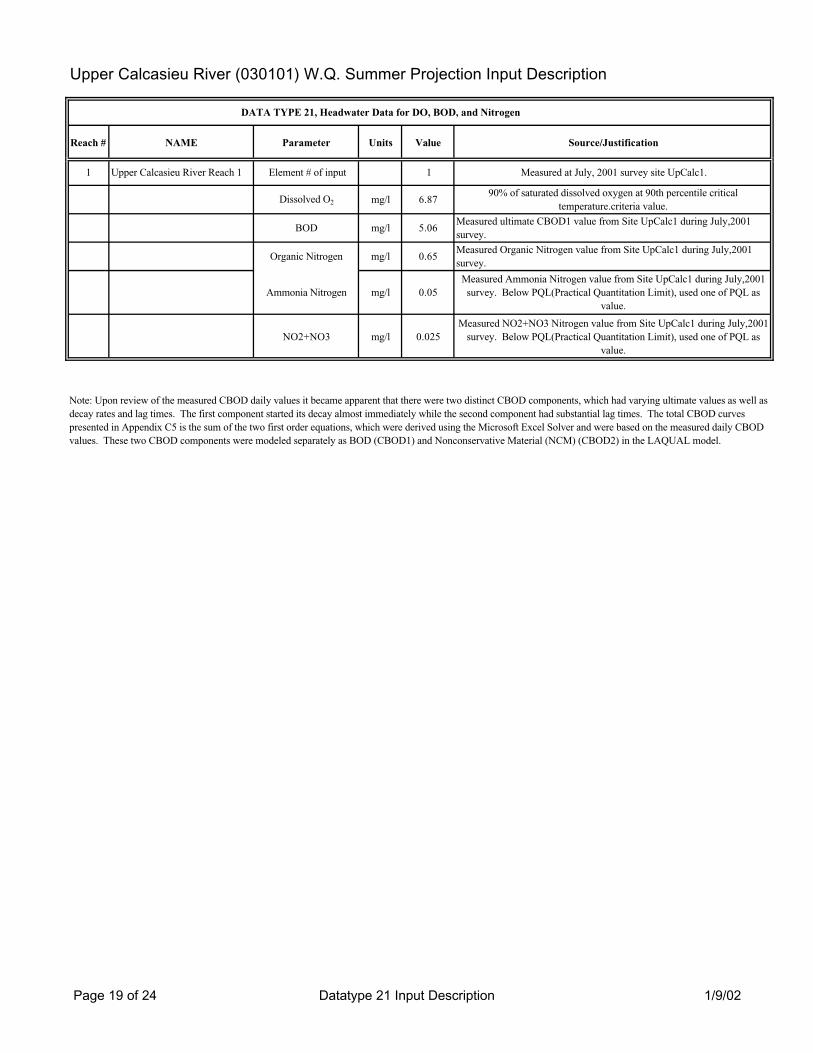
Upper Calcasieu River (030101) W.Q. Summer Projection Input Description
DATA TYPE 21, Headwater Data for DO, BOD, and Nitrogen
Reach # NAME Parameter Units Value Source/Justification
1 Upper Calcasieu River Reach 1 Element # of input 1 Measured at July, 2001 survey site UpCalc1.
Dissolved O2 mg/l 6.8790% of saturated dissolved oxygen at 90th percentile critical
temperature.criteria value.
BOD mg/l 5.06Measured ultimate CBOD1 value from Site UpCalc1 during July,2001
survey.
Organic Nitrogen mg/l 0.65Measured Organic Nitrogen value from Site UpCalc1 during July,2001
survey.
Ammonia Nitrogen mg/l 0.05
Measured Ammonia Nitrogen value from Site UpCalc1 during July,2001
survey. Below PQL(Practical Quantitation Limit), used one of PQL as
value.
NO2+NO3 mg/l 0.025
Measured NO2+NO3 Nitrogen value from Site UpCalc1 during July,2001
survey. Below PQL(Practical Quantitation Limit), used one of PQL as
value.
Note: Upon review of the measured CBOD daily values it became apparent that there were two distinct CBOD components, which had varying ultimate values as well as
decay rates and lag times. The first component started its decay almost immediately while the second component had substantial lag times. The total CBOD curves
presented in Appendix C5 is the sum of the two first order equations, which were derived using the Microsoft Excel Solver and were based on the measured daily CBOD
values. These two CBOD components were modeled separately as BOD (CBOD1) and Nonconservative Material (NCM) (CBOD2) in the LAQUAL model.
Page 19 of 24 Datatype 21 Input Description 1/9/02
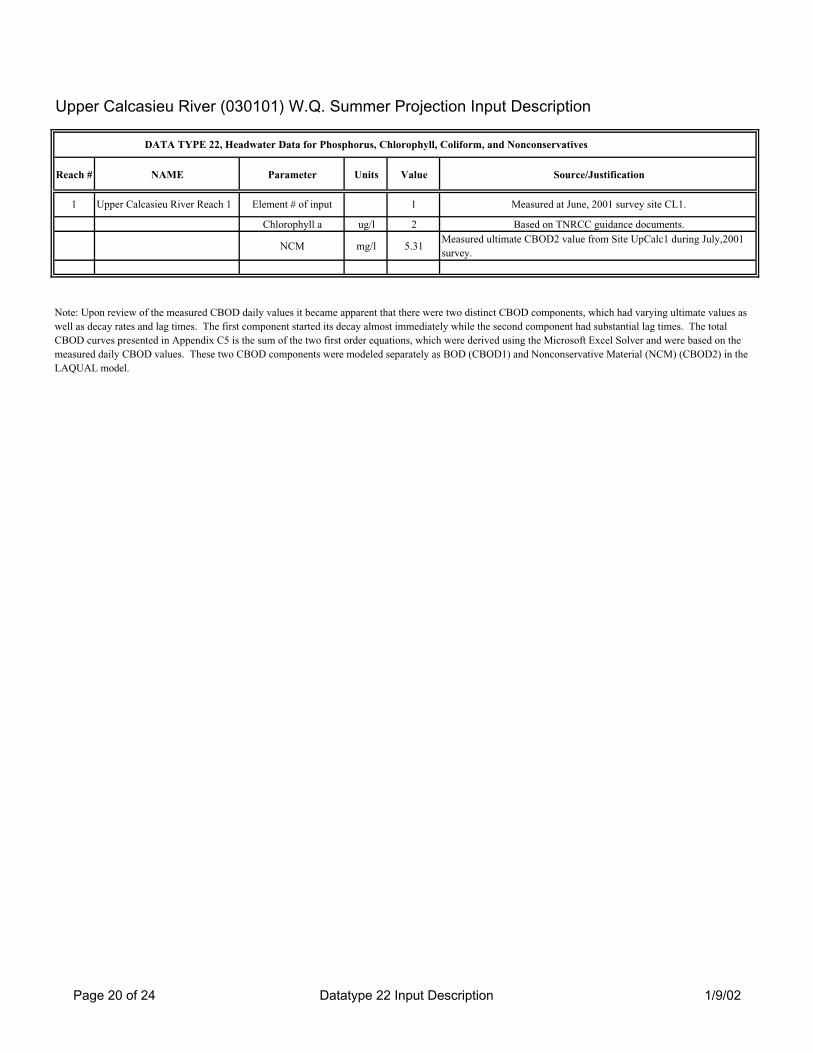
Upper Calcasieu River (030101) W.Q. Summer Projection Input Description
DATA TYPE 22, Headwater Data for Phosphorus, Chlorophyll, Coliform, and Nonconservatives
Reach # NAME Parameter Units Value Source/Justification
1 Upper Calcasieu River Reach 1 Element # of input 1 Measured at June, 2001 survey site CL1.
Chlorophyll a ug/l 2 Based on TNRCC guidance documents.
NCM mg/l 5.31Measured ultimate CBOD2 value from Site UpCalc1 during July,2001
survey.
Note: Upon review of the measured CBOD daily values it became apparent that there were two distinct CBOD components, which had varying ultimate values as
well as decay rates and lag times. The first component started its decay almost immediately while the second component had substantial lag times. The total
CBOD curves presented in Appendix C5 is the sum of the two first order equations, which were derived using the Microsoft Excel Solver and were based on the
measured daily CBOD values. These two CBOD components were modeled separately as BOD (CBOD1) and Nonconservative Material (NCM) (CBOD2) in the
LAQUAL model.
Page 20 of 24 Datatype 22 Input Description 1/9/02
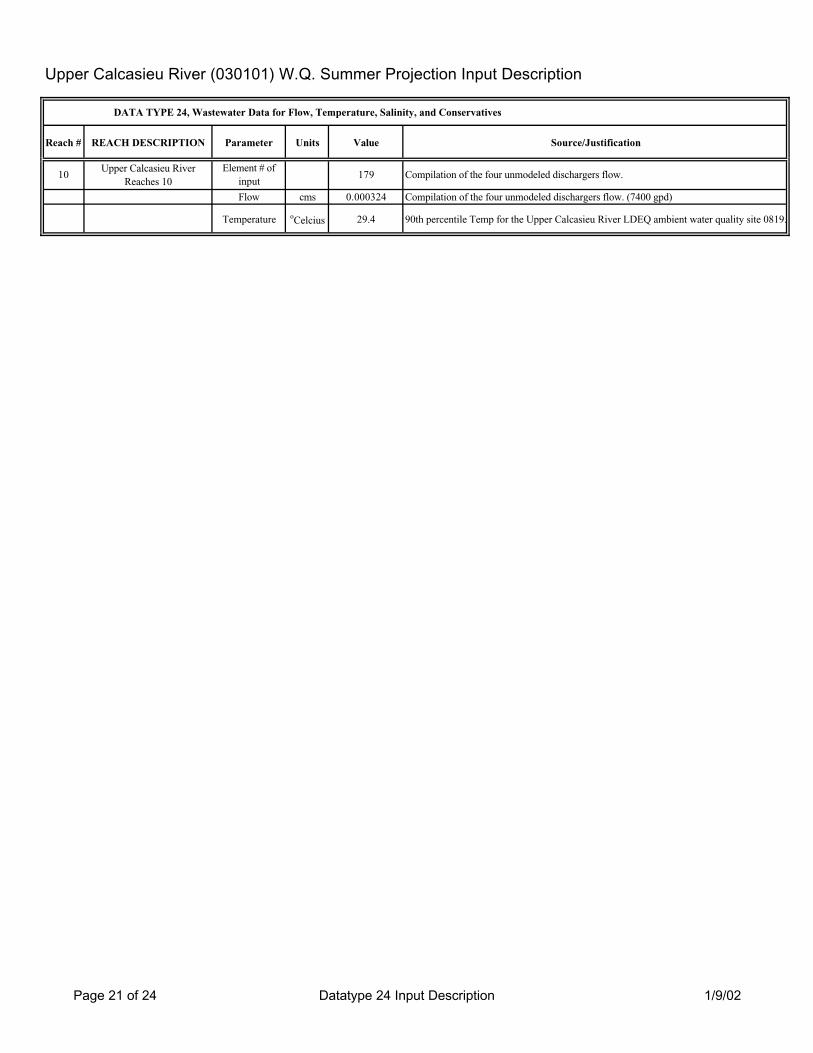
Upper Calcasieu River (030101) W.Q. Summer Projection Input Description
DATA TYPE 24, Wastewater Data for Flow, Temperature, Salinity, and Conservatives
Reach # REACH DESCRIPTION Parameter Units Value Source/Justification
10Upper Calcasieu River
Reaches 10
Element # of
input179 Compilation of the four unmodeled dischargers flow.
Flow cms 0.000324 Compilation of the four unmodeled dischargers flow. (7400 gpd)
Temperature oCelcius 29.4 90th percentile Temp for the Upper Calcasieu River LDEQ ambient water quality site 0819.
Page 21 of 24 Datatype 24 Input Description 1/9/02
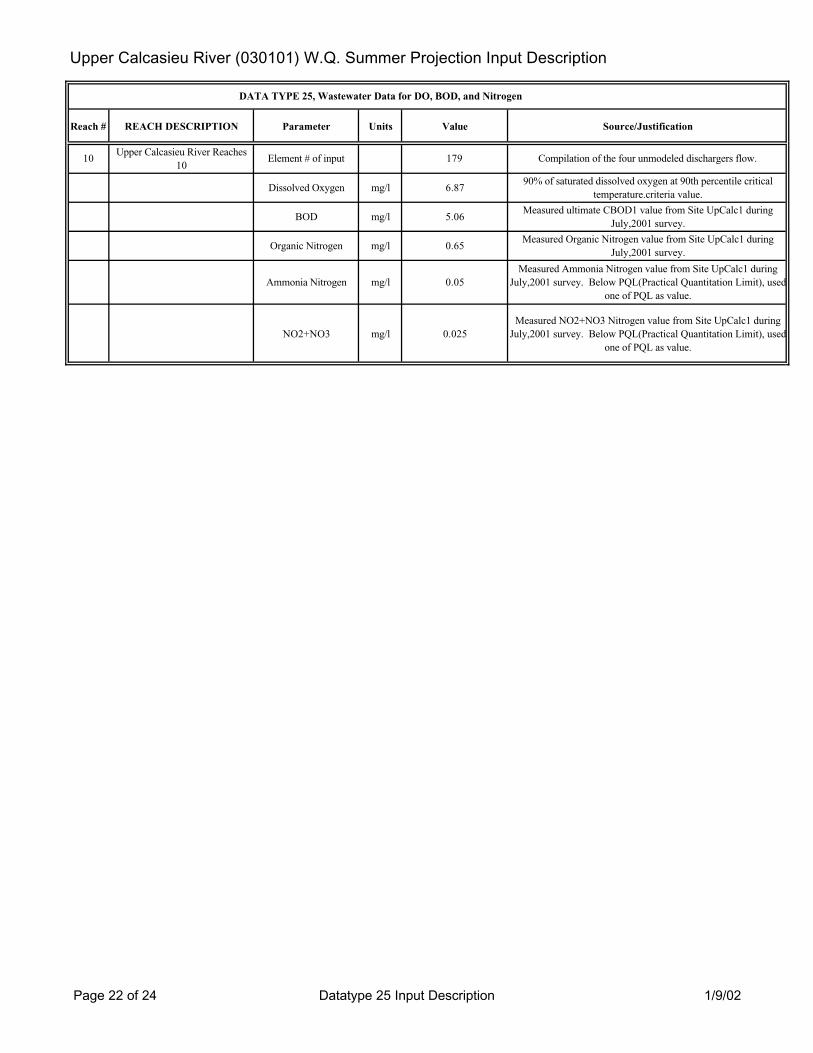
Upper Calcasieu River (030101) W.Q. Summer Projection Input Description
DATA TYPE 25, Wastewater Data for DO, BOD, and Nitrogen
Reach # REACH DESCRIPTION Parameter Units Value Source/Justification
10Upper Calcasieu River Reaches
10Element # of input 179 Compilation of the four unmodeled dischargers flow.
Dissolved Oxygen mg/l 6.8790% of saturated dissolved oxygen at 90th percentile critical
temperature.criteria value.
BOD mg/l 5.06Measured ultimate CBOD1 value from Site UpCalc1 during
July,2001 survey.
Organic Nitrogen mg/l 0.65Measured Organic Nitrogen value from Site UpCalc1 during
July,2001 survey.
Ammonia Nitrogen mg/l 0.05
Measured Ammonia Nitrogen value from Site UpCalc1 during
July,2001 survey. Below PQL(Practical Quantitation Limit), used
one of PQL as value.
NO2+NO3 mg/l 0.025
Measured NO2+NO3 Nitrogen value from Site UpCalc1 during
July,2001 survey. Below PQL(Practical Quantitation Limit), used
one of PQL as value.
Page 22 of 24 Datatype 25 Input Description 1/9/02

Upper Calcasieu River (030101) W.Q. Summer Projection Input Description
DATA TYPE 25, Wastewater Data for DO, BOD, and Nitrogen
Reach # REACH DESCRIPTION Parameter Units Value Source/Justification
10Upper Calcasieu River Reaches
10Element # of input 179 Compilation of the four unmodeled dischargers flow.
Chlorophyll a ug/l 2 Based on TNRCC guidance documents.
NCM mg/l 5.31Measured ultimate CBOD2 value from Site UpCalc1 during
July,2001 survey.
Page 23 of 24 Datatype 26 Input Description 1/9/02
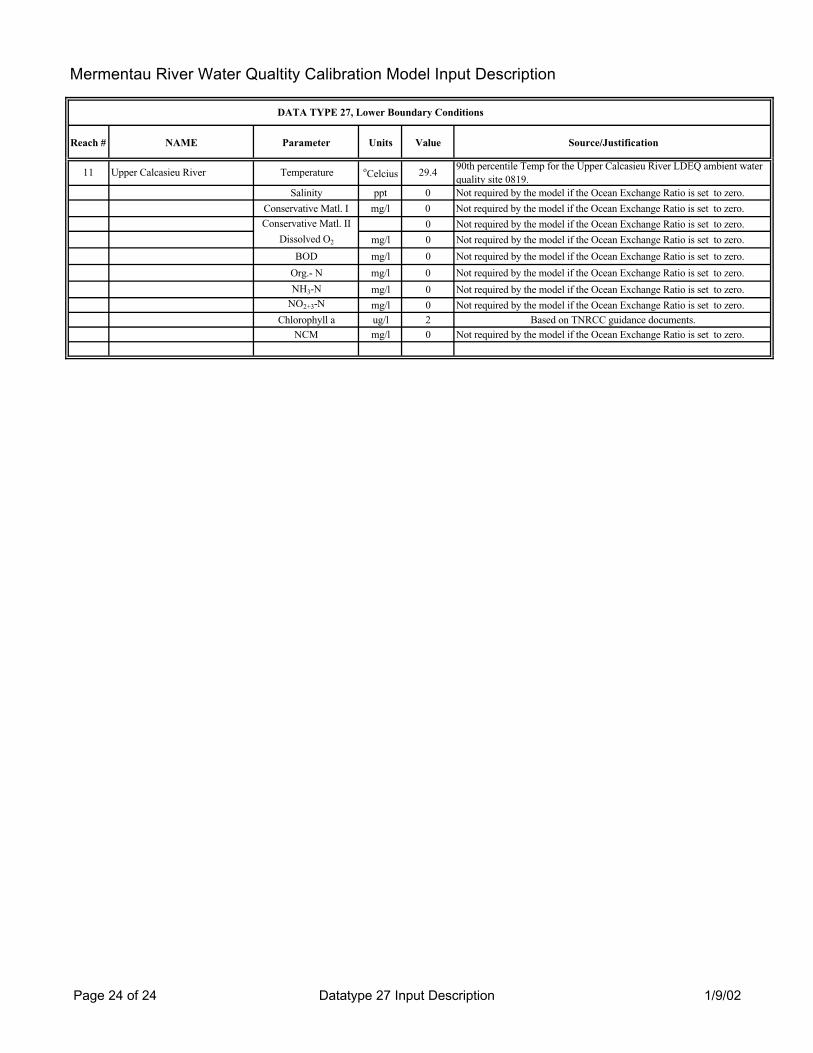
Mermentau River Water Qualtity Calibration Model Input Description
DATA TYPE 27, Lower Boundary Conditions
Reach # NAME Parameter Units Value Source/Justification
11 Upper Calcasieu River Temperature oCelcius 29.4
90th percentile Temp for the Upper Calcasieu River LDEQ ambient water
quality site 0819.
Salinity ppt 0 Not required by the model if the Ocean Exchange Ratio is set to zero.
Conservative Matl. I mg/l 0 Not required by the model if the Ocean Exchange Ratio is set to zero.
Conservative Matl. II 0 Not required by the model if the Ocean Exchange Ratio is set to zero.
Dissolved O2 mg/l 0 Not required by the model if the Ocean Exchange Ratio is set to zero.
BOD mg/l 0 Not required by the model if the Ocean Exchange Ratio is set to zero.
Org.- N mg/l 0 Not required by the model if the Ocean Exchange Ratio is set to zero.
NH3-N mg/l 0 Not required by the model if the Ocean Exchange Ratio is set to zero.
NO2+3-N mg/l 0 Not required by the model if the Ocean Exchange Ratio is set to zero.
Chlorophyll a ug/l 2 Based on TNRCC guidance documents.
NCM mg/l 0 Not required by the model if the Ocean Exchange Ratio is set to zero.
Page 24 of 24 Datatype 27 Input Description 1/9/02

Upper Calcasieu River Watershed TMDL for Dissolved Oxygen Subsegment 080808 Originated: January 9, 2002
34
Appendix B4
Projection Model Development
Winter projection model input/output and graphs
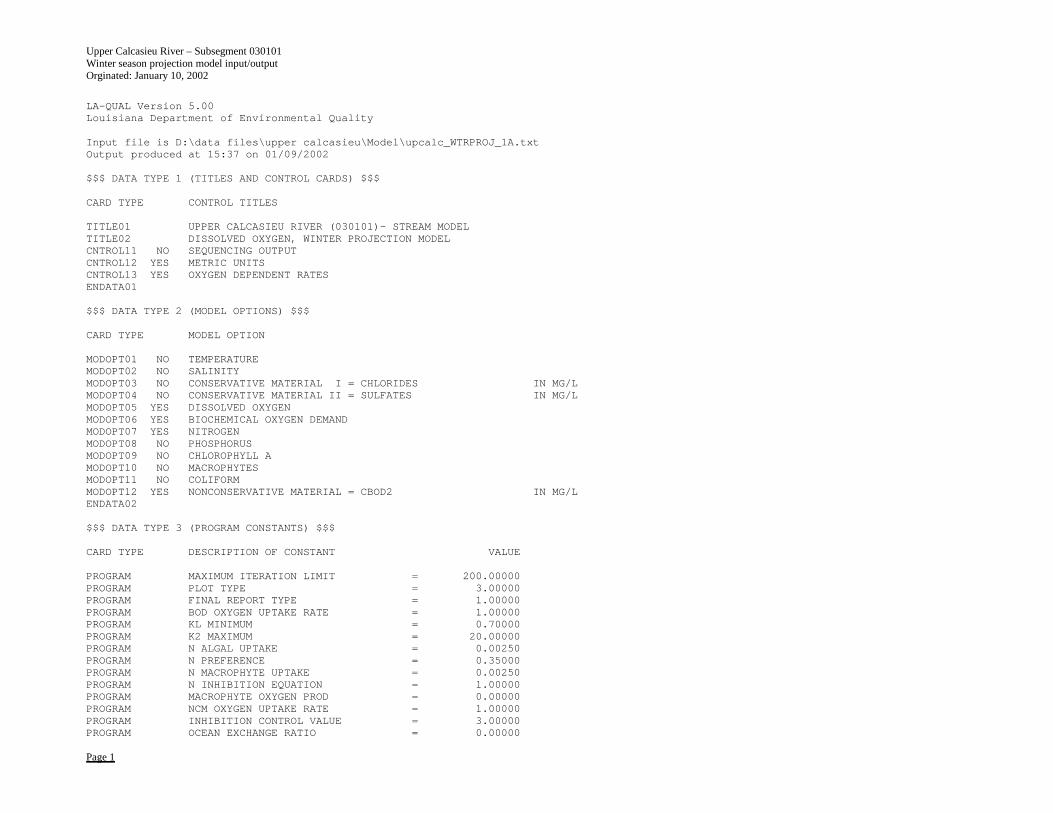
Upper Calcasieu River – Subsegment 030101 Winter season projection model input/output Orginated: January 10, 2002
Page 1
LA-QUAL Version 5.00Louisiana Department of Environmental Quality
Input file is D:\data files\upper calcasieu\Model\upcalc_WTRPROJ_1A.txtOutput produced at 15:37 on 01/09/2002
$$$ DATA TYPE 1 (TITLES AND CONTROL CARDS) $$$
CARD TYPE CONTROL TITLES
TITLE01 UPPER CALCASIEU RIVER (030101)- STREAM MODELTITLE02 DISSOLVED OXYGEN, WINTER PROJECTION MODELCNTROL11 NO SEQUENCING OUTPUTCNTROL12 YES METRIC UNITSCNTROL13 YES OXYGEN DEPENDENT RATESENDATA01
$$$ DATA TYPE 2 (MODEL OPTIONS) $$$
CARD TYPE MODEL OPTION
MODOPT01 NO TEMPERATUREMODOPT02 NO SALINITYMODOPT03 NO CONSERVATIVE MATERIAL I = CHLORIDES IN MG/LMODOPT04 NO CONSERVATIVE MATERIAL II = SULFATES IN MG/LMODOPT05 YES DISSOLVED OXYGENMODOPT06 YES BIOCHEMICAL OXYGEN DEMANDMODOPT07 YES NITROGENMODOPT08 NO PHOSPHORUSMODOPT09 NO CHLOROPHYLL AMODOPT10 NO MACROPHYTESMODOPT11 NO COLIFORMMODOPT12 YES NONCONSERVATIVE MATERIAL = CBOD2 IN MG/LENDATA02
$$$ DATA TYPE 3 (PROGRAM CONSTANTS) $$$
CARD TYPE DESCRIPTION OF CONSTANT VALUE
PROGRAM MAXIMUM ITERATION LIMIT = 200.00000PROGRAM PLOT TYPE = 3.00000PROGRAM FINAL REPORT TYPE = 1.00000PROGRAM BOD OXYGEN UPTAKE RATE = 1.00000PROGRAM KL MINIMUM = 0.70000PROGRAM K2 MAXIMUM = 20.00000PROGRAM N ALGAL UPTAKE = 0.00250PROGRAM N PREFERENCE = 0.35000PROGRAM N MACROPHYTE UPTAKE = 0.00250PROGRAM N INHIBITION EQUATION = 1.00000PROGRAM MACROPHYTE OXYGEN PROD = 0.00000PROGRAM NCM OXYGEN UPTAKE RATE = 1.00000PROGRAM INHIBITION CONTROL VALUE = 3.00000PROGRAM OCEAN EXCHANGE RATIO = 0.00000
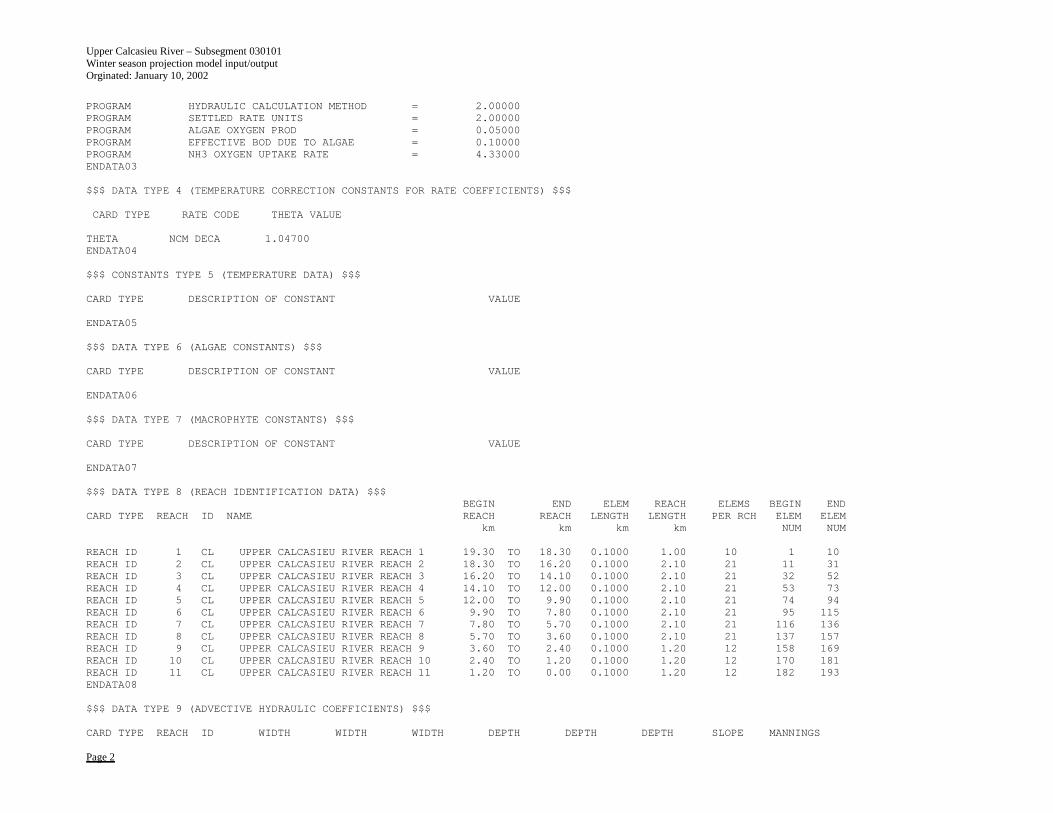
Upper Calcasieu River – Subsegment 030101 Winter season projection model input/output Orginated: January 10, 2002
Page 2
PROGRAM HYDRAULIC CALCULATION METHOD = 2.00000PROGRAM SETTLED RATE UNITS = 2.00000PROGRAM ALGAE OXYGEN PROD = 0.05000PROGRAM EFFECTIVE BOD DUE TO ALGAE = 0.10000PROGRAM NH3 OXYGEN UPTAKE RATE = 4.33000ENDATA03
$$$ DATA TYPE 4 (TEMPERATURE CORRECTION CONSTANTS FOR RATE COEFFICIENTS) $$$
CARD TYPE RATE CODE THETA VALUE
THETA NCM DECA 1.04700ENDATA04
$$$ CONSTANTS TYPE 5 (TEMPERATURE DATA) $$$
CARD TYPE DESCRIPTION OF CONSTANT VALUE
ENDATA05
$$$ DATA TYPE 6 (ALGAE CONSTANTS) $$$
CARD TYPE DESCRIPTION OF CONSTANT VALUE
ENDATA06
$$$ DATA TYPE 7 (MACROPHYTE CONSTANTS) $$$
CARD TYPE DESCRIPTION OF CONSTANT VALUE
ENDATA07
$$$ DATA TYPE 8 (REACH IDENTIFICATION DATA) $$$BEGIN END ELEM REACH ELEMS BEGIN END
CARD TYPE REACH ID NAME REACH REACH LENGTH LENGTH PER RCH ELEM ELEMkm km km km NUM NUM
REACH ID 1 CL UPPER CALCASIEU RIVER REACH 1 19.30 TO 18.30 0.1000 1.00 10 1 10REACH ID 2 CL UPPER CALCASIEU RIVER REACH 2 18.30 TO 16.20 0.1000 2.10 21 11 31REACH ID 3 CL UPPER CALCASIEU RIVER REACH 3 16.20 TO 14.10 0.1000 2.10 21 32 52REACH ID 4 CL UPPER CALCASIEU RIVER REACH 4 14.10 TO 12.00 0.1000 2.10 21 53 73REACH ID 5 CL UPPER CALCASIEU RIVER REACH 5 12.00 TO 9.90 0.1000 2.10 21 74 94REACH ID 6 CL UPPER CALCASIEU RIVER REACH 6 9.90 TO 7.80 0.1000 2.10 21 95 115REACH ID 7 CL UPPER CALCASIEU RIVER REACH 7 7.80 TO 5.70 0.1000 2.10 21 116 136REACH ID 8 CL UPPER CALCASIEU RIVER REACH 8 5.70 TO 3.60 0.1000 2.10 21 137 157REACH ID 9 CL UPPER CALCASIEU RIVER REACH 9 3.60 TO 2.40 0.1000 1.20 12 158 169REACH ID 10 CL UPPER CALCASIEU RIVER REACH 10 2.40 TO 1.20 0.1000 1.20 12 170 181REACH ID 11 CL UPPER CALCASIEU RIVER REACH 11 1.20 TO 0.00 0.1000 1.20 12 182 193ENDATA08
$$$ DATA TYPE 9 (ADVECTIVE HYDRAULIC COEFFICIENTS) $$$
CARD TYPE REACH ID WIDTH WIDTH WIDTH DEPTH DEPTH DEPTH SLOPE MANNINGS
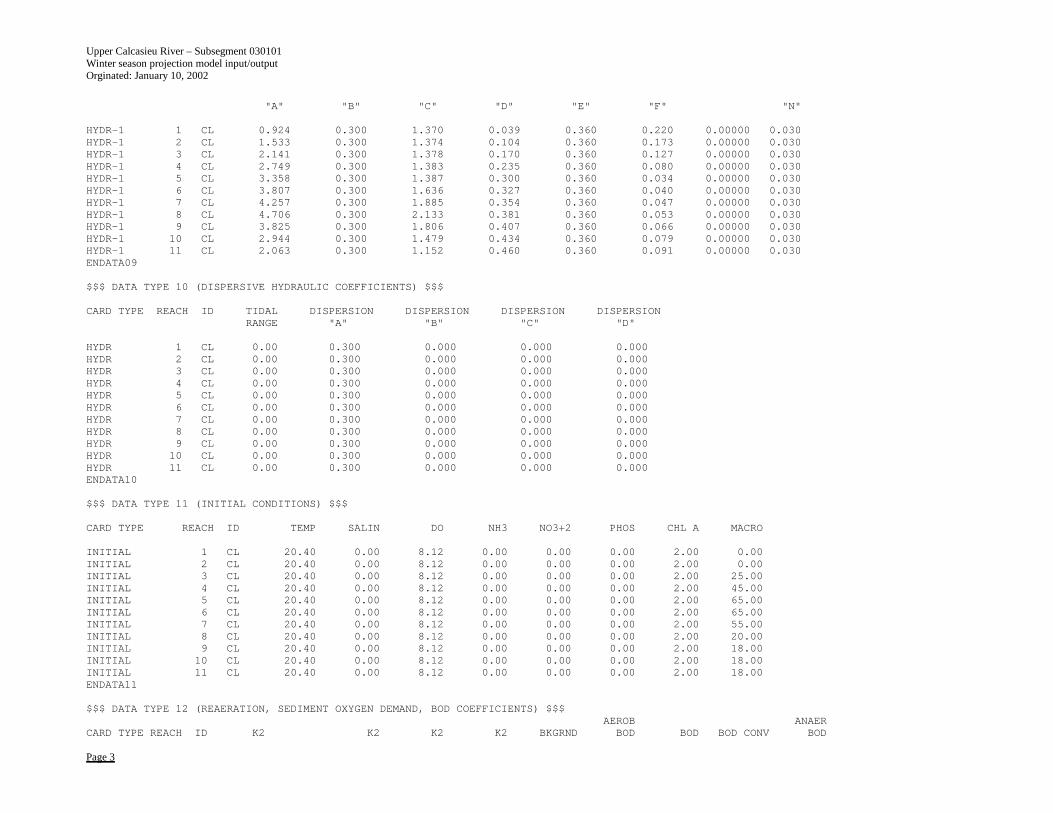
Upper Calcasieu River – Subsegment 030101 Winter season projection model input/output Orginated: January 10, 2002
Page 3
"A" "B" "C" "D" "E" "F" "N"
HYDR-1 1 CL 0.924 0.300 1.370 0.039 0.360 0.220 0.00000 0.030HYDR-1 2 CL 1.533 0.300 1.374 0.104 0.360 0.173 0.00000 0.030HYDR-1 3 CL 2.141 0.300 1.378 0.170 0.360 0.127 0.00000 0.030HYDR-1 4 CL 2.749 0.300 1.383 0.235 0.360 0.080 0.00000 0.030HYDR-1 5 CL 3.358 0.300 1.387 0.300 0.360 0.034 0.00000 0.030HYDR-1 6 CL 3.807 0.300 1.636 0.327 0.360 0.040 0.00000 0.030HYDR-1 7 CL 4.257 0.300 1.885 0.354 0.360 0.047 0.00000 0.030HYDR-1 8 CL 4.706 0.300 2.133 0.381 0.360 0.053 0.00000 0.030HYDR-1 9 CL 3.825 0.300 1.806 0.407 0.360 0.066 0.00000 0.030HYDR-1 10 CL 2.944 0.300 1.479 0.434 0.360 0.079 0.00000 0.030HYDR-1 11 CL 2.063 0.300 1.152 0.460 0.360 0.091 0.00000 0.030ENDATA09
$$$ DATA TYPE 10 (DISPERSIVE HYDRAULIC COEFFICIENTS) $$$
CARD TYPE REACH ID TIDAL DISPERSION DISPERSION DISPERSION DISPERSIONRANGE "A" "B" "C" "D"
HYDR 1 CL 0.00 0.300 0.000 0.000 0.000HYDR 2 CL 0.00 0.300 0.000 0.000 0.000HYDR 3 CL 0.00 0.300 0.000 0.000 0.000HYDR 4 CL 0.00 0.300 0.000 0.000 0.000HYDR 5 CL 0.00 0.300 0.000 0.000 0.000HYDR 6 CL 0.00 0.300 0.000 0.000 0.000HYDR 7 CL 0.00 0.300 0.000 0.000 0.000HYDR 8 CL 0.00 0.300 0.000 0.000 0.000HYDR 9 CL 0.00 0.300 0.000 0.000 0.000HYDR 10 CL 0.00 0.300 0.000 0.000 0.000HYDR 11 CL 0.00 0.300 0.000 0.000 0.000ENDATA10
$$$ DATA TYPE 11 (INITIAL CONDITIONS) $$$
CARD TYPE REACH ID TEMP SALIN DO NH3 NO3+2 PHOS CHL A MACRO
INITIAL 1 CL 20.40 0.00 8.12 0.00 0.00 0.00 2.00 0.00INITIAL 2 CL 20.40 0.00 8.12 0.00 0.00 0.00 2.00 0.00INITIAL 3 CL 20.40 0.00 8.12 0.00 0.00 0.00 2.00 25.00INITIAL 4 CL 20.40 0.00 8.12 0.00 0.00 0.00 2.00 45.00INITIAL 5 CL 20.40 0.00 8.12 0.00 0.00 0.00 2.00 65.00INITIAL 6 CL 20.40 0.00 8.12 0.00 0.00 0.00 2.00 65.00INITIAL 7 CL 20.40 0.00 8.12 0.00 0.00 0.00 2.00 55.00INITIAL 8 CL 20.40 0.00 8.12 0.00 0.00 0.00 2.00 20.00INITIAL 9 CL 20.40 0.00 8.12 0.00 0.00 0.00 2.00 18.00INITIAL 10 CL 20.40 0.00 8.12 0.00 0.00 0.00 2.00 18.00INITIAL 11 CL 20.40 0.00 8.12 0.00 0.00 0.00 2.00 18.00ENDATA11
$$$ DATA TYPE 12 (REAERATION, SEDIMENT OXYGEN DEMAND, BOD COEFFICIENTS) $$$AEROB ANAER
CARD TYPE REACH ID K2 K2 K2 K2 BKGRND BOD BOD BOD CONV BOD
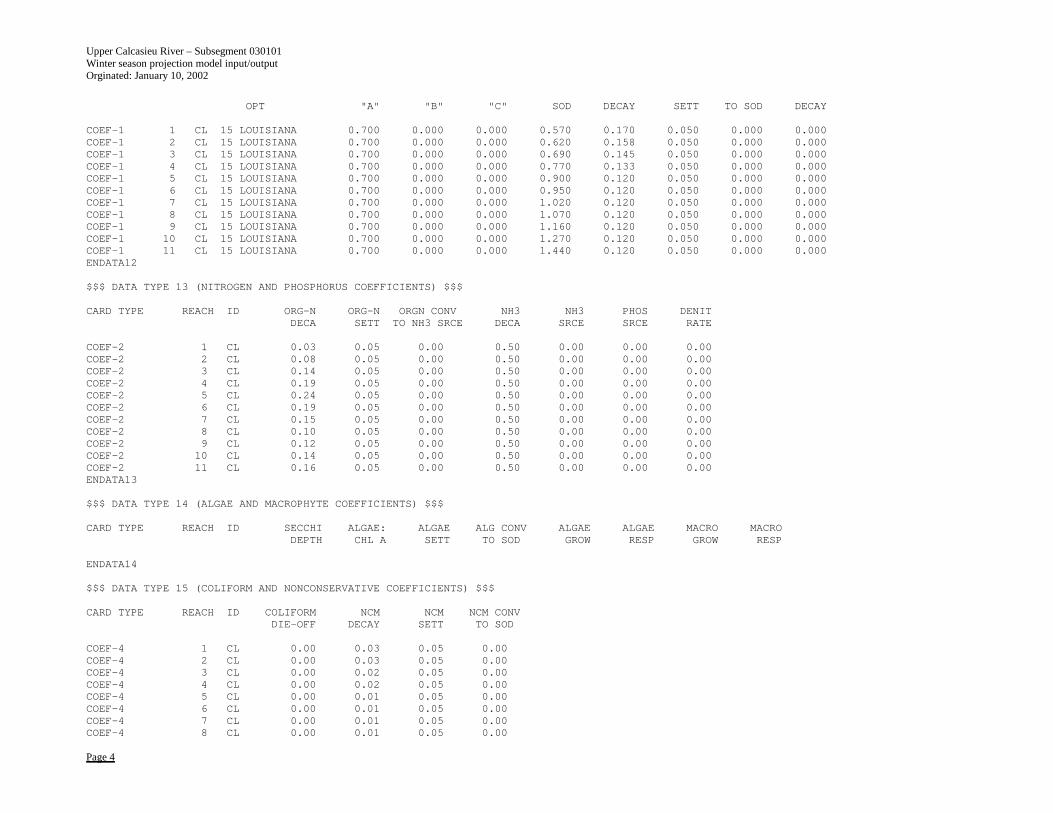
Upper Calcasieu River – Subsegment 030101 Winter season projection model input/output Orginated: January 10, 2002
Page 4
OPT "A" "B" "C" SOD DECAY SETT TO SOD DECAY
COEF-1 1 CL 15 LOUISIANA 0.700 0.000 0.000 0.570 0.170 0.050 0.000 0.000COEF-1 2 CL 15 LOUISIANA 0.700 0.000 0.000 0.620 0.158 0.050 0.000 0.000COEF-1 3 CL 15 LOUISIANA 0.700 0.000 0.000 0.690 0.145 0.050 0.000 0.000COEF-1 4 CL 15 LOUISIANA 0.700 0.000 0.000 0.770 0.133 0.050 0.000 0.000COEF-1 5 CL 15 LOUISIANA 0.700 0.000 0.000 0.900 0.120 0.050 0.000 0.000COEF-1 6 CL 15 LOUISIANA 0.700 0.000 0.000 0.950 0.120 0.050 0.000 0.000COEF-1 7 CL 15 LOUISIANA 0.700 0.000 0.000 1.020 0.120 0.050 0.000 0.000COEF-1 8 CL 15 LOUISIANA 0.700 0.000 0.000 1.070 0.120 0.050 0.000 0.000COEF-1 9 CL 15 LOUISIANA 0.700 0.000 0.000 1.160 0.120 0.050 0.000 0.000COEF-1 10 CL 15 LOUISIANA 0.700 0.000 0.000 1.270 0.120 0.050 0.000 0.000COEF-1 11 CL 15 LOUISIANA 0.700 0.000 0.000 1.440 0.120 0.050 0.000 0.000ENDATA12
$$$ DATA TYPE 13 (NITROGEN AND PHOSPHORUS COEFFICIENTS) $$$
CARD TYPE REACH ID ORG-N ORG-N ORGN CONV NH3 NH3 PHOS DENITDECA SETT TO NH3 SRCE DECA SRCE SRCE RATE
COEF-2 1 CL 0.03 0.05 0.00 0.50 0.00 0.00 0.00COEF-2 2 CL 0.08 0.05 0.00 0.50 0.00 0.00 0.00COEF-2 3 CL 0.14 0.05 0.00 0.50 0.00 0.00 0.00COEF-2 4 CL 0.19 0.05 0.00 0.50 0.00 0.00 0.00COEF-2 5 CL 0.24 0.05 0.00 0.50 0.00 0.00 0.00COEF-2 6 CL 0.19 0.05 0.00 0.50 0.00 0.00 0.00COEF-2 7 CL 0.15 0.05 0.00 0.50 0.00 0.00 0.00COEF-2 8 CL 0.10 0.05 0.00 0.50 0.00 0.00 0.00COEF-2 9 CL 0.12 0.05 0.00 0.50 0.00 0.00 0.00COEF-2 10 CL 0.14 0.05 0.00 0.50 0.00 0.00 0.00COEF-2 11 CL 0.16 0.05 0.00 0.50 0.00 0.00 0.00ENDATA13
$$$ DATA TYPE 14 (ALGAE AND MACROPHYTE COEFFICIENTS) $$$
CARD TYPE REACH ID SECCHI ALGAE: ALGAE ALG CONV ALGAE ALGAE MACRO MACRODEPTH CHL A SETT TO SOD GROW RESP GROW RESP
ENDATA14
$$$ DATA TYPE 15 (COLIFORM AND NONCONSERVATIVE COEFFICIENTS) $$$
CARD TYPE REACH ID COLIFORM NCM NCM NCM CONVDIE-OFF DECAY SETT TO SOD
COEF-4 1 CL 0.00 0.03 0.05 0.00COEF-4 2 CL 0.00 0.03 0.05 0.00COEF-4 3 CL 0.00 0.02 0.05 0.00COEF-4 4 CL 0.00 0.02 0.05 0.00COEF-4 5 CL 0.00 0.01 0.05 0.00COEF-4 6 CL 0.00 0.01 0.05 0.00COEF-4 7 CL 0.00 0.01 0.05 0.00COEF-4 8 CL 0.00 0.01 0.05 0.00
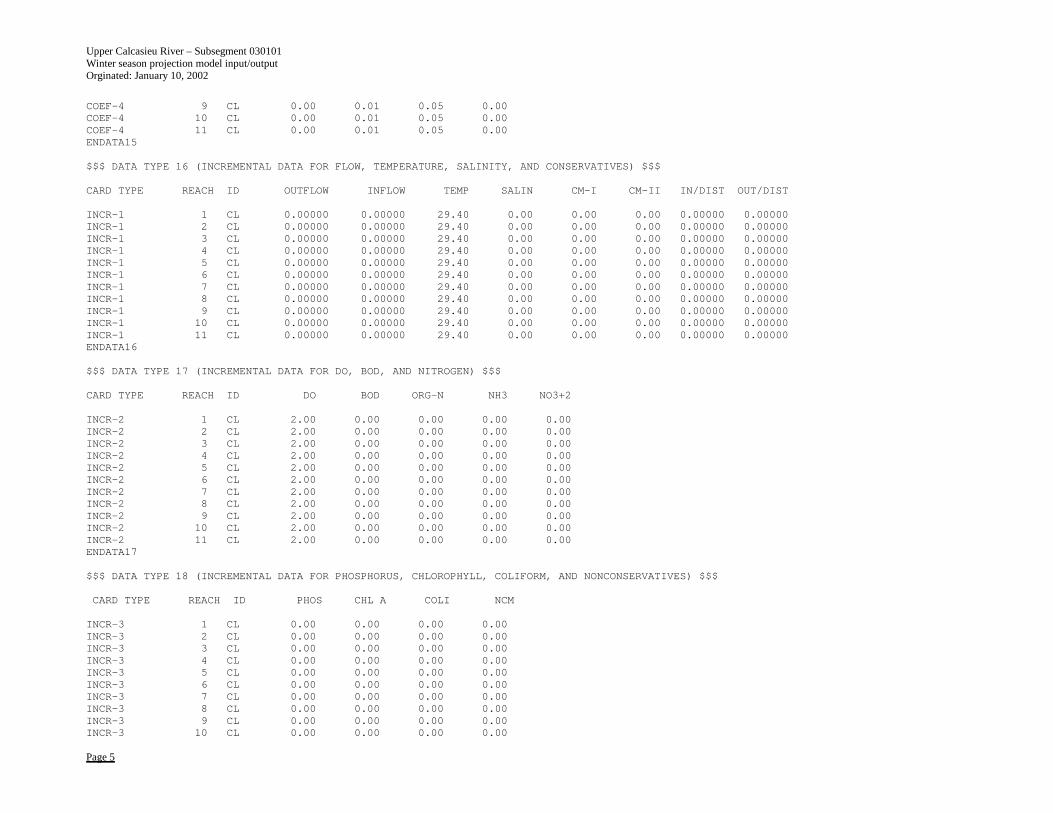
Upper Calcasieu River – Subsegment 030101 Winter season projection model input/output Orginated: January 10, 2002
Page 5
COEF-4 9 CL 0.00 0.01 0.05 0.00COEF-4 10 CL 0.00 0.01 0.05 0.00COEF-4 11 CL 0.00 0.01 0.05 0.00ENDATA15
$$$ DATA TYPE 16 (INCREMENTAL DATA FOR FLOW, TEMPERATURE, SALINITY, AND CONSERVATIVES) $$$
CARD TYPE REACH ID OUTFLOW INFLOW TEMP SALIN CM-I CM-II IN/DIST OUT/DIST
INCR-1 1 CL 0.00000 0.00000 29.40 0.00 0.00 0.00 0.00000 0.00000INCR-1 2 CL 0.00000 0.00000 29.40 0.00 0.00 0.00 0.00000 0.00000INCR-1 3 CL 0.00000 0.00000 29.40 0.00 0.00 0.00 0.00000 0.00000INCR-1 4 CL 0.00000 0.00000 29.40 0.00 0.00 0.00 0.00000 0.00000INCR-1 5 CL 0.00000 0.00000 29.40 0.00 0.00 0.00 0.00000 0.00000INCR-1 6 CL 0.00000 0.00000 29.40 0.00 0.00 0.00 0.00000 0.00000INCR-1 7 CL 0.00000 0.00000 29.40 0.00 0.00 0.00 0.00000 0.00000INCR-1 8 CL 0.00000 0.00000 29.40 0.00 0.00 0.00 0.00000 0.00000INCR-1 9 CL 0.00000 0.00000 29.40 0.00 0.00 0.00 0.00000 0.00000INCR-1 10 CL 0.00000 0.00000 29.40 0.00 0.00 0.00 0.00000 0.00000INCR-1 11 CL 0.00000 0.00000 29.40 0.00 0.00 0.00 0.00000 0.00000ENDATA16
$$$ DATA TYPE 17 (INCREMENTAL DATA FOR DO, BOD, AND NITROGEN) $$$
CARD TYPE REACH ID DO BOD ORG-N NH3 NO3+2
INCR-2 1 CL 2.00 0.00 0.00 0.00 0.00INCR-2 2 CL 2.00 0.00 0.00 0.00 0.00INCR-2 3 CL 2.00 0.00 0.00 0.00 0.00INCR-2 4 CL 2.00 0.00 0.00 0.00 0.00INCR-2 5 CL 2.00 0.00 0.00 0.00 0.00INCR-2 6 CL 2.00 0.00 0.00 0.00 0.00INCR-2 7 CL 2.00 0.00 0.00 0.00 0.00INCR-2 8 CL 2.00 0.00 0.00 0.00 0.00INCR-2 9 CL 2.00 0.00 0.00 0.00 0.00INCR-2 10 CL 2.00 0.00 0.00 0.00 0.00INCR-2 11 CL 2.00 0.00 0.00 0.00 0.00ENDATA17
$$$ DATA TYPE 18 (INCREMENTAL DATA FOR PHOSPHORUS, CHLOROPHYLL, COLIFORM, AND NONCONSERVATIVES) $$$
CARD TYPE REACH ID PHOS CHL A COLI NCM
INCR-3 1 CL 0.00 0.00 0.00 0.00INCR-3 2 CL 0.00 0.00 0.00 0.00INCR-3 3 CL 0.00 0.00 0.00 0.00INCR-3 4 CL 0.00 0.00 0.00 0.00INCR-3 5 CL 0.00 0.00 0.00 0.00INCR-3 6 CL 0.00 0.00 0.00 0.00INCR-3 7 CL 0.00 0.00 0.00 0.00INCR-3 8 CL 0.00 0.00 0.00 0.00INCR-3 9 CL 0.00 0.00 0.00 0.00INCR-3 10 CL 0.00 0.00 0.00 0.00
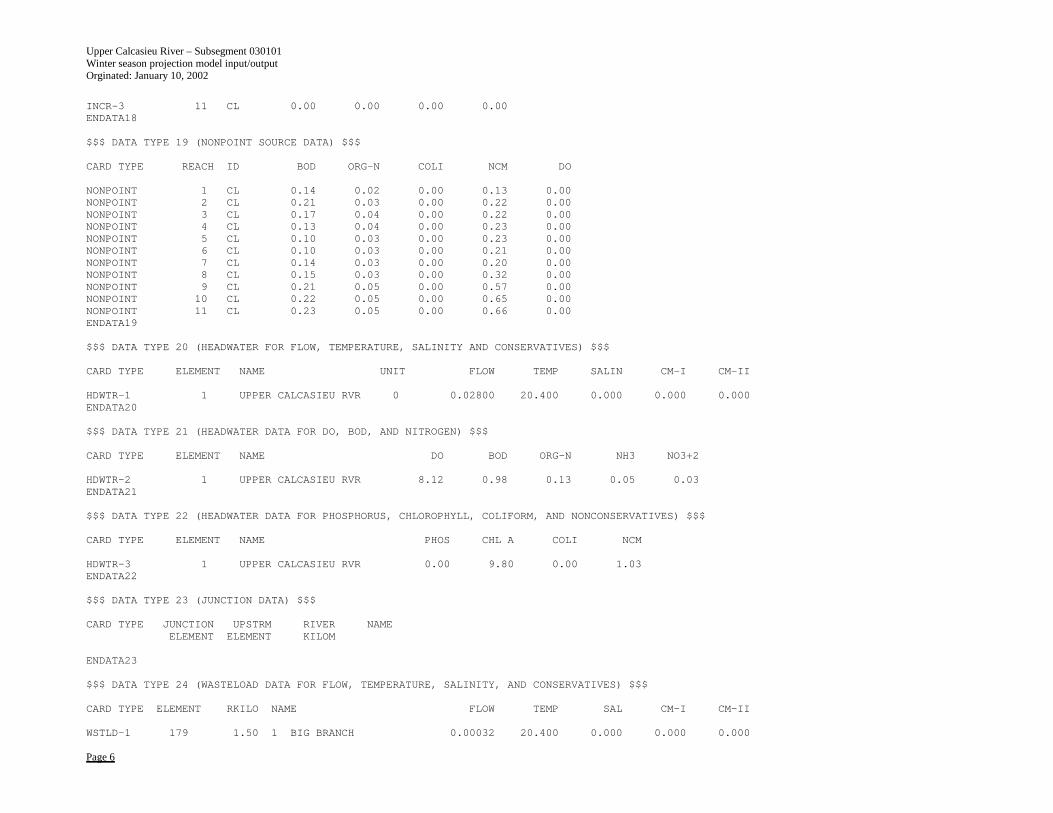
Upper Calcasieu River – Subsegment 030101 Winter season projection model input/output Orginated: January 10, 2002
Page 6
INCR-3 11 CL 0.00 0.00 0.00 0.00ENDATA18
$$$ DATA TYPE 19 (NONPOINT SOURCE DATA) $$$
CARD TYPE REACH ID BOD ORG-N COLI NCM DO
NONPOINT 1 CL 0.14 0.02 0.00 0.13 0.00NONPOINT 2 CL 0.21 0.03 0.00 0.22 0.00NONPOINT 3 CL 0.17 0.04 0.00 0.22 0.00NONPOINT 4 CL 0.13 0.04 0.00 0.23 0.00NONPOINT 5 CL 0.10 0.03 0.00 0.23 0.00NONPOINT 6 CL 0.10 0.03 0.00 0.21 0.00NONPOINT 7 CL 0.14 0.03 0.00 0.20 0.00NONPOINT 8 CL 0.15 0.03 0.00 0.32 0.00NONPOINT 9 CL 0.21 0.05 0.00 0.57 0.00NONPOINT 10 CL 0.22 0.05 0.00 0.65 0.00NONPOINT 11 CL 0.23 0.05 0.00 0.66 0.00ENDATA19
$$$ DATA TYPE 20 (HEADWATER FOR FLOW, TEMPERATURE, SALINITY AND CONSERVATIVES) $$$
CARD TYPE ELEMENT NAME UNIT FLOW TEMP SALIN CM-I CM-II
HDWTR-1 1 UPPER CALCASIEU RVR 0 0.02800 20.400 0.000 0.000 0.000ENDATA20
$$$ DATA TYPE 21 (HEADWATER DATA FOR DO, BOD, AND NITROGEN) $$$
CARD TYPE ELEMENT NAME DO BOD ORG-N NH3 NO3+2
HDWTR-2 1 UPPER CALCASIEU RVR 8.12 0.98 0.13 0.05 0.03ENDATA21
$$$ DATA TYPE 22 (HEADWATER DATA FOR PHOSPHORUS, CHLOROPHYLL, COLIFORM, AND NONCONSERVATIVES) $$$
CARD TYPE ELEMENT NAME PHOS CHL A COLI NCM
HDWTR-3 1 UPPER CALCASIEU RVR 0.00 9.80 0.00 1.03ENDATA22
$$$ DATA TYPE 23 (JUNCTION DATA) $$$
CARD TYPE JUNCTION UPSTRM RIVER NAMEELEMENT ELEMENT KILOM
ENDATA23
$$$ DATA TYPE 24 (WASTELOAD DATA FOR FLOW, TEMPERATURE, SALINITY, AND CONSERVATIVES) $$$
CARD TYPE ELEMENT RKILO NAME FLOW TEMP SAL CM-I CM-II
WSTLD-1 179 1.50 1 BIG BRANCH 0.00032 20.400 0.000 0.000 0.000
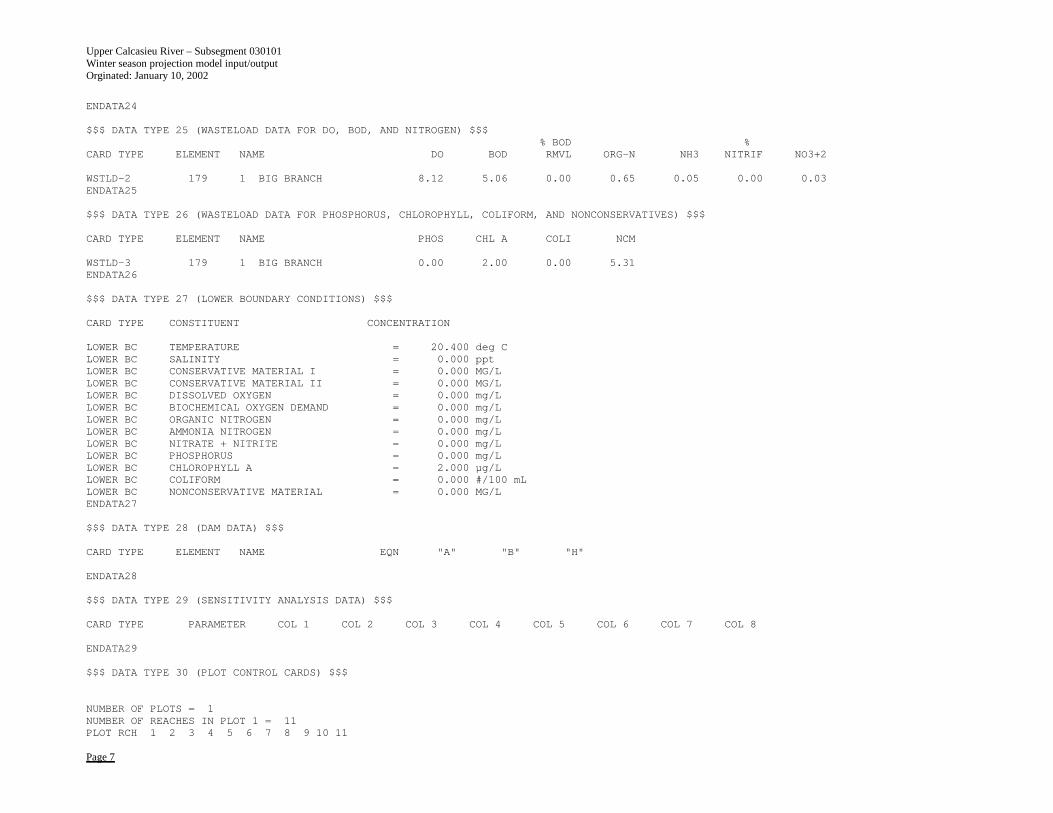
Upper Calcasieu River – Subsegment 030101 Winter season projection model input/output Orginated: January 10, 2002
Page 7
ENDATA24
$$$ DATA TYPE 25 (WASTELOAD DATA FOR DO, BOD, AND NITROGEN) $$$% BOD %
CARD TYPE ELEMENT NAME DO BOD RMVL ORG-N NH3 NITRIF NO3+2
WSTLD-2 179 1 BIG BRANCH 8.12 5.06 0.00 0.65 0.05 0.00 0.03ENDATA25
$$$ DATA TYPE 26 (WASTELOAD DATA FOR PHOSPHORUS, CHLOROPHYLL, COLIFORM, AND NONCONSERVATIVES) $$$
CARD TYPE ELEMENT NAME PHOS CHL A COLI NCM
WSTLD-3 179 1 BIG BRANCH 0.00 2.00 0.00 5.31ENDATA26
$$$ DATA TYPE 27 (LOWER BOUNDARY CONDITIONS) $$$
CARD TYPE CONSTITUENT CONCENTRATION
LOWER BC TEMPERATURE = 20.400 deg CLOWER BC SALINITY = 0.000 pptLOWER BC CONSERVATIVE MATERIAL I = 0.000 MG/LLOWER BC CONSERVATIVE MATERIAL II = 0.000 MG/LLOWER BC DISSOLVED OXYGEN = 0.000 mg/LLOWER BC BIOCHEMICAL OXYGEN DEMAND = 0.000 mg/LLOWER BC ORGANIC NITROGEN = 0.000 mg/LLOWER BC AMMONIA NITROGEN = 0.000 mg/LLOWER BC NITRATE + NITRITE = 0.000 mg/LLOWER BC PHOSPHORUS = 0.000 mg/LLOWER BC CHLOROPHYLL A = 2.000 µg/LLOWER BC COLIFORM = 0.000 #/100 mLLOWER BC NONCONSERVATIVE MATERIAL = 0.000 MG/LENDATA27
$$$ DATA TYPE 28 (DAM DATA) $$$
CARD TYPE ELEMENT NAME EQN "A" "B" "H"
ENDATA28
$$$ DATA TYPE 29 (SENSITIVITY ANALYSIS DATA) $$$
CARD TYPE PARAMETER COL 1 COL 2 COL 3 COL 4 COL 5 COL 6 COL 7 COL 8
ENDATA29
$$$ DATA TYPE 30 (PLOT CONTROL CARDS) $$$
NUMBER OF PLOTS = 1NUMBER OF REACHES IN PLOT 1 = 11PLOT RCH 1 2 3 4 5 6 7 8 9 10 11
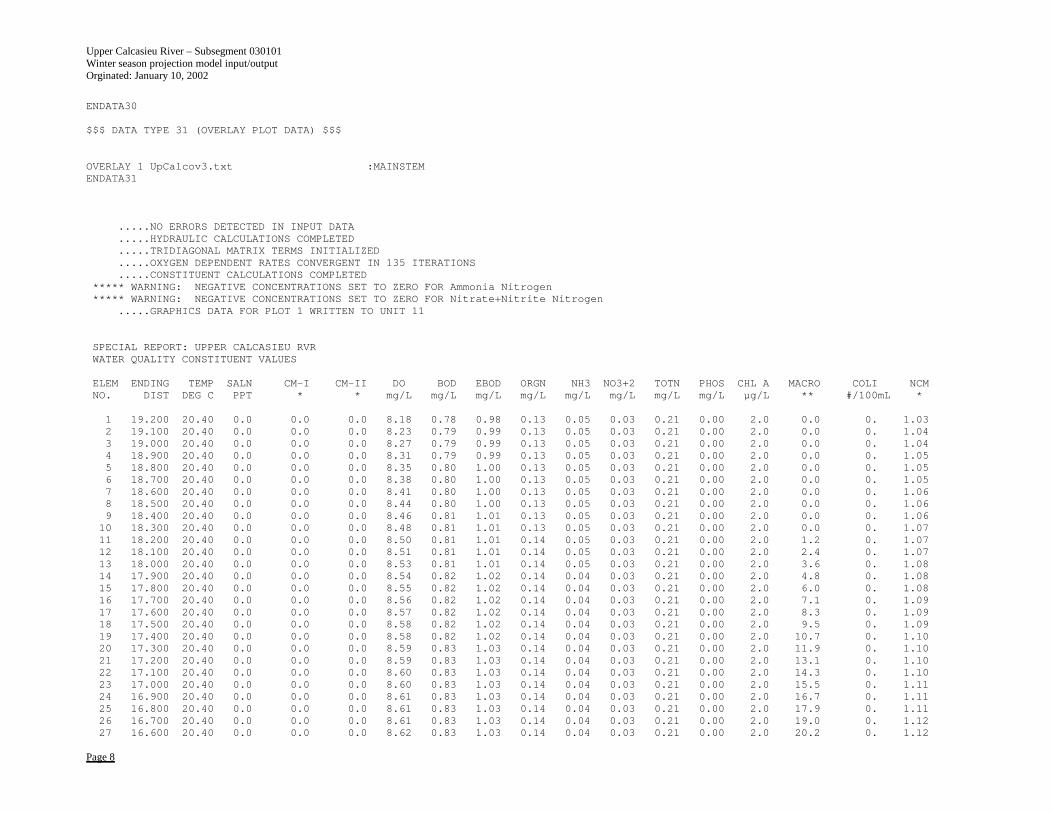
Upper Calcasieu River – Subsegment 030101 Winter season projection model input/output Orginated: January 10, 2002
Page 8
ENDATA30
$$$ DATA TYPE 31 (OVERLAY PLOT DATA) $$$
OVERLAY 1 UpCalcov3.txt :MAINSTEMENDATA31
.....NO ERRORS DETECTED IN INPUT DATA
.....HYDRAULIC CALCULATIONS COMPLETED
.....TRIDIAGONAL MATRIX TERMS INITIALIZED
.....OXYGEN DEPENDENT RATES CONVERGENT IN 135 ITERATIONS
.....CONSTITUENT CALCULATIONS COMPLETED***** WARNING: NEGATIVE CONCENTRATIONS SET TO ZERO FOR Ammonia Nitrogen***** WARNING: NEGATIVE CONCENTRATIONS SET TO ZERO FOR Nitrate+Nitrite Nitrogen
.....GRAPHICS DATA FOR PLOT 1 WRITTEN TO UNIT 11
SPECIAL REPORT: UPPER CALCASIEU RVRWATER QUALITY CONSTITUENT VALUES
ELEM ENDING TEMP SALN CM-I CM-II DO BOD EBOD ORGN NH3 NO3+2 TOTN PHOS CHL A MACRO COLI NCMNO. DIST DEG C PPT * * mg/L mg/L mg/L mg/L mg/L mg/L mg/L mg/L µg/L ** #/100mL *
1 19.200 20.40 0.0 0.0 0.0 8.18 0.78 0.98 0.13 0.05 0.03 0.21 0.00 2.0 0.0 0. 1.032 19.100 20.40 0.0 0.0 0.0 8.23 0.79 0.99 0.13 0.05 0.03 0.21 0.00 2.0 0.0 0. 1.043 19.000 20.40 0.0 0.0 0.0 8.27 0.79 0.99 0.13 0.05 0.03 0.21 0.00 2.0 0.0 0. 1.044 18.900 20.40 0.0 0.0 0.0 8.31 0.79 0.99 0.13 0.05 0.03 0.21 0.00 2.0 0.0 0. 1.055 18.800 20.40 0.0 0.0 0.0 8.35 0.80 1.00 0.13 0.05 0.03 0.21 0.00 2.0 0.0 0. 1.056 18.700 20.40 0.0 0.0 0.0 8.38 0.80 1.00 0.13 0.05 0.03 0.21 0.00 2.0 0.0 0. 1.057 18.600 20.40 0.0 0.0 0.0 8.41 0.80 1.00 0.13 0.05 0.03 0.21 0.00 2.0 0.0 0. 1.068 18.500 20.40 0.0 0.0 0.0 8.44 0.80 1.00 0.13 0.05 0.03 0.21 0.00 2.0 0.0 0. 1.069 18.400 20.40 0.0 0.0 0.0 8.46 0.81 1.01 0.13 0.05 0.03 0.21 0.00 2.0 0.0 0. 1.0610 18.300 20.40 0.0 0.0 0.0 8.48 0.81 1.01 0.13 0.05 0.03 0.21 0.00 2.0 0.0 0. 1.0711 18.200 20.40 0.0 0.0 0.0 8.50 0.81 1.01 0.14 0.05 0.03 0.21 0.00 2.0 1.2 0. 1.0712 18.100 20.40 0.0 0.0 0.0 8.51 0.81 1.01 0.14 0.05 0.03 0.21 0.00 2.0 2.4 0. 1.0713 18.000 20.40 0.0 0.0 0.0 8.53 0.81 1.01 0.14 0.05 0.03 0.21 0.00 2.0 3.6 0. 1.0814 17.900 20.40 0.0 0.0 0.0 8.54 0.82 1.02 0.14 0.04 0.03 0.21 0.00 2.0 4.8 0. 1.0815 17.800 20.40 0.0 0.0 0.0 8.55 0.82 1.02 0.14 0.04 0.03 0.21 0.00 2.0 6.0 0. 1.0816 17.700 20.40 0.0 0.0 0.0 8.56 0.82 1.02 0.14 0.04 0.03 0.21 0.00 2.0 7.1 0. 1.0917 17.600 20.40 0.0 0.0 0.0 8.57 0.82 1.02 0.14 0.04 0.03 0.21 0.00 2.0 8.3 0. 1.0918 17.500 20.40 0.0 0.0 0.0 8.58 0.82 1.02 0.14 0.04 0.03 0.21 0.00 2.0 9.5 0. 1.0919 17.400 20.40 0.0 0.0 0.0 8.58 0.82 1.02 0.14 0.04 0.03 0.21 0.00 2.0 10.7 0. 1.1020 17.300 20.40 0.0 0.0 0.0 8.59 0.83 1.03 0.14 0.04 0.03 0.21 0.00 2.0 11.9 0. 1.1021 17.200 20.40 0.0 0.0 0.0 8.59 0.83 1.03 0.14 0.04 0.03 0.21 0.00 2.0 13.1 0. 1.1022 17.100 20.40 0.0 0.0 0.0 8.60 0.83 1.03 0.14 0.04 0.03 0.21 0.00 2.0 14.3 0. 1.1023 17.000 20.40 0.0 0.0 0.0 8.60 0.83 1.03 0.14 0.04 0.03 0.21 0.00 2.0 15.5 0. 1.1124 16.900 20.40 0.0 0.0 0.0 8.61 0.83 1.03 0.14 0.04 0.03 0.21 0.00 2.0 16.7 0. 1.1125 16.800 20.40 0.0 0.0 0.0 8.61 0.83 1.03 0.14 0.04 0.03 0.21 0.00 2.0 17.9 0. 1.1126 16.700 20.40 0.0 0.0 0.0 8.61 0.83 1.03 0.14 0.04 0.03 0.21 0.00 2.0 19.0 0. 1.1227 16.600 20.40 0.0 0.0 0.0 8.62 0.83 1.03 0.14 0.04 0.03 0.21 0.00 2.0 20.2 0. 1.12
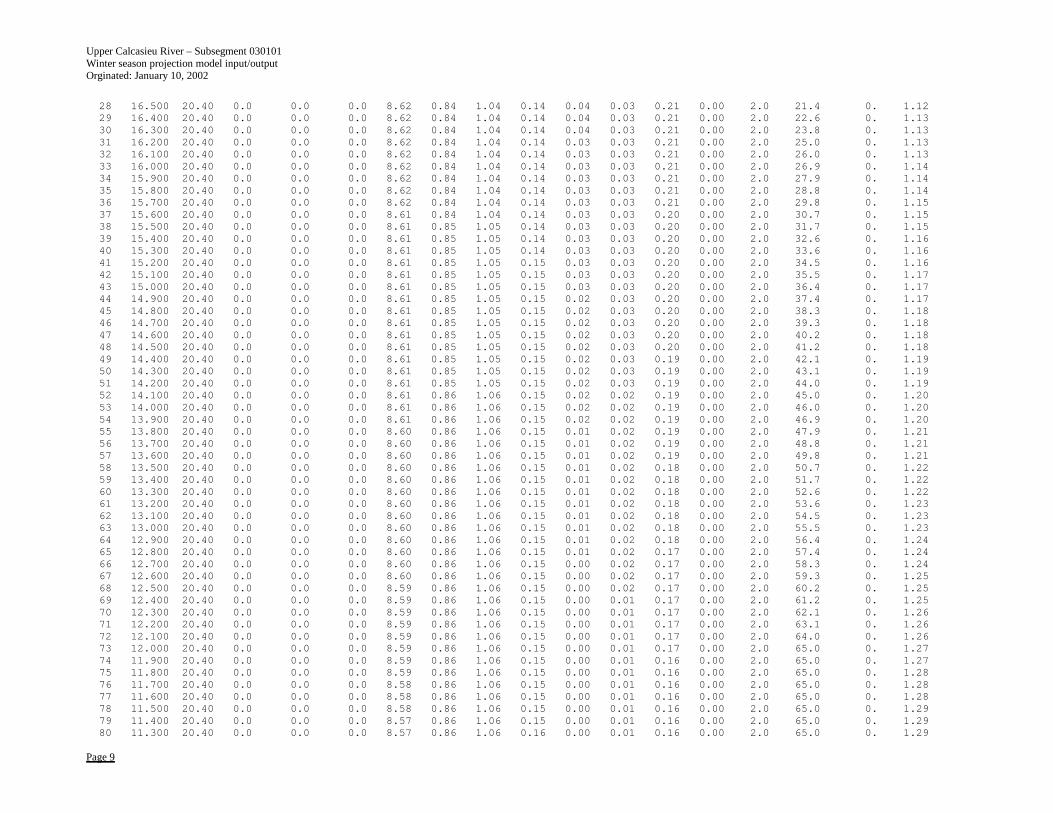
Upper Calcasieu River – Subsegment 030101 Winter season projection model input/output Orginated: January 10, 2002
Page 9
28 16.500 20.40 0.0 0.0 0.0 8.62 0.84 1.04 0.14 0.04 0.03 0.21 0.00 2.0 21.4 0. 1.1229 16.400 20.40 0.0 0.0 0.0 8.62 0.84 1.04 0.14 0.04 0.03 0.21 0.00 2.0 22.6 0. 1.1330 16.300 20.40 0.0 0.0 0.0 8.62 0.84 1.04 0.14 0.04 0.03 0.21 0.00 2.0 23.8 0. 1.1331 16.200 20.40 0.0 0.0 0.0 8.62 0.84 1.04 0.14 0.03 0.03 0.21 0.00 2.0 25.0 0. 1.1332 16.100 20.40 0.0 0.0 0.0 8.62 0.84 1.04 0.14 0.03 0.03 0.21 0.00 2.0 26.0 0. 1.1333 16.000 20.40 0.0 0.0 0.0 8.62 0.84 1.04 0.14 0.03 0.03 0.21 0.00 2.0 26.9 0. 1.1434 15.900 20.40 0.0 0.0 0.0 8.62 0.84 1.04 0.14 0.03 0.03 0.21 0.00 2.0 27.9 0. 1.1435 15.800 20.40 0.0 0.0 0.0 8.62 0.84 1.04 0.14 0.03 0.03 0.21 0.00 2.0 28.8 0. 1.1436 15.700 20.40 0.0 0.0 0.0 8.62 0.84 1.04 0.14 0.03 0.03 0.21 0.00 2.0 29.8 0. 1.1537 15.600 20.40 0.0 0.0 0.0 8.61 0.84 1.04 0.14 0.03 0.03 0.20 0.00 2.0 30.7 0. 1.1538 15.500 20.40 0.0 0.0 0.0 8.61 0.85 1.05 0.14 0.03 0.03 0.20 0.00 2.0 31.7 0. 1.1539 15.400 20.40 0.0 0.0 0.0 8.61 0.85 1.05 0.14 0.03 0.03 0.20 0.00 2.0 32.6 0. 1.1640 15.300 20.40 0.0 0.0 0.0 8.61 0.85 1.05 0.14 0.03 0.03 0.20 0.00 2.0 33.6 0. 1.1641 15.200 20.40 0.0 0.0 0.0 8.61 0.85 1.05 0.15 0.03 0.03 0.20 0.00 2.0 34.5 0. 1.1642 15.100 20.40 0.0 0.0 0.0 8.61 0.85 1.05 0.15 0.03 0.03 0.20 0.00 2.0 35.5 0. 1.1743 15.000 20.40 0.0 0.0 0.0 8.61 0.85 1.05 0.15 0.03 0.03 0.20 0.00 2.0 36.4 0. 1.1744 14.900 20.40 0.0 0.0 0.0 8.61 0.85 1.05 0.15 0.02 0.03 0.20 0.00 2.0 37.4 0. 1.1745 14.800 20.40 0.0 0.0 0.0 8.61 0.85 1.05 0.15 0.02 0.03 0.20 0.00 2.0 38.3 0. 1.1846 14.700 20.40 0.0 0.0 0.0 8.61 0.85 1.05 0.15 0.02 0.03 0.20 0.00 2.0 39.3 0. 1.1847 14.600 20.40 0.0 0.0 0.0 8.61 0.85 1.05 0.15 0.02 0.03 0.20 0.00 2.0 40.2 0. 1.1848 14.500 20.40 0.0 0.0 0.0 8.61 0.85 1.05 0.15 0.02 0.03 0.20 0.00 2.0 41.2 0. 1.1849 14.400 20.40 0.0 0.0 0.0 8.61 0.85 1.05 0.15 0.02 0.03 0.19 0.00 2.0 42.1 0. 1.1950 14.300 20.40 0.0 0.0 0.0 8.61 0.85 1.05 0.15 0.02 0.03 0.19 0.00 2.0 43.1 0. 1.1951 14.200 20.40 0.0 0.0 0.0 8.61 0.85 1.05 0.15 0.02 0.03 0.19 0.00 2.0 44.0 0. 1.1952 14.100 20.40 0.0 0.0 0.0 8.61 0.86 1.06 0.15 0.02 0.02 0.19 0.00 2.0 45.0 0. 1.2053 14.000 20.40 0.0 0.0 0.0 8.61 0.86 1.06 0.15 0.02 0.02 0.19 0.00 2.0 46.0 0. 1.2054 13.900 20.40 0.0 0.0 0.0 8.61 0.86 1.06 0.15 0.02 0.02 0.19 0.00 2.0 46.9 0. 1.2055 13.800 20.40 0.0 0.0 0.0 8.60 0.86 1.06 0.15 0.01 0.02 0.19 0.00 2.0 47.9 0. 1.2156 13.700 20.40 0.0 0.0 0.0 8.60 0.86 1.06 0.15 0.01 0.02 0.19 0.00 2.0 48.8 0. 1.2157 13.600 20.40 0.0 0.0 0.0 8.60 0.86 1.06 0.15 0.01 0.02 0.19 0.00 2.0 49.8 0. 1.2158 13.500 20.40 0.0 0.0 0.0 8.60 0.86 1.06 0.15 0.01 0.02 0.18 0.00 2.0 50.7 0. 1.2259 13.400 20.40 0.0 0.0 0.0 8.60 0.86 1.06 0.15 0.01 0.02 0.18 0.00 2.0 51.7 0. 1.2260 13.300 20.40 0.0 0.0 0.0 8.60 0.86 1.06 0.15 0.01 0.02 0.18 0.00 2.0 52.6 0. 1.2261 13.200 20.40 0.0 0.0 0.0 8.60 0.86 1.06 0.15 0.01 0.02 0.18 0.00 2.0 53.6 0. 1.2362 13.100 20.40 0.0 0.0 0.0 8.60 0.86 1.06 0.15 0.01 0.02 0.18 0.00 2.0 54.5 0. 1.2363 13.000 20.40 0.0 0.0 0.0 8.60 0.86 1.06 0.15 0.01 0.02 0.18 0.00 2.0 55.5 0. 1.2364 12.900 20.40 0.0 0.0 0.0 8.60 0.86 1.06 0.15 0.01 0.02 0.18 0.00 2.0 56.4 0. 1.2465 12.800 20.40 0.0 0.0 0.0 8.60 0.86 1.06 0.15 0.01 0.02 0.17 0.00 2.0 57.4 0. 1.2466 12.700 20.40 0.0 0.0 0.0 8.60 0.86 1.06 0.15 0.00 0.02 0.17 0.00 2.0 58.3 0. 1.2467 12.600 20.40 0.0 0.0 0.0 8.60 0.86 1.06 0.15 0.00 0.02 0.17 0.00 2.0 59.3 0. 1.2568 12.500 20.40 0.0 0.0 0.0 8.59 0.86 1.06 0.15 0.00 0.02 0.17 0.00 2.0 60.2 0. 1.2569 12.400 20.40 0.0 0.0 0.0 8.59 0.86 1.06 0.15 0.00 0.01 0.17 0.00 2.0 61.2 0. 1.2570 12.300 20.40 0.0 0.0 0.0 8.59 0.86 1.06 0.15 0.00 0.01 0.17 0.00 2.0 62.1 0. 1.2671 12.200 20.40 0.0 0.0 0.0 8.59 0.86 1.06 0.15 0.00 0.01 0.17 0.00 2.0 63.1 0. 1.2672 12.100 20.40 0.0 0.0 0.0 8.59 0.86 1.06 0.15 0.00 0.01 0.17 0.00 2.0 64.0 0. 1.2673 12.000 20.40 0.0 0.0 0.0 8.59 0.86 1.06 0.15 0.00 0.01 0.17 0.00 2.0 65.0 0. 1.2774 11.900 20.40 0.0 0.0 0.0 8.59 0.86 1.06 0.15 0.00 0.01 0.16 0.00 2.0 65.0 0. 1.2775 11.800 20.40 0.0 0.0 0.0 8.59 0.86 1.06 0.15 0.00 0.01 0.16 0.00 2.0 65.0 0. 1.2876 11.700 20.40 0.0 0.0 0.0 8.58 0.86 1.06 0.15 0.00 0.01 0.16 0.00 2.0 65.0 0. 1.2877 11.600 20.40 0.0 0.0 0.0 8.58 0.86 1.06 0.15 0.00 0.01 0.16 0.00 2.0 65.0 0. 1.2878 11.500 20.40 0.0 0.0 0.0 8.58 0.86 1.06 0.15 0.00 0.01 0.16 0.00 2.0 65.0 0. 1.2979 11.400 20.40 0.0 0.0 0.0 8.57 0.86 1.06 0.15 0.00 0.01 0.16 0.00 2.0 65.0 0. 1.2980 11.300 20.40 0.0 0.0 0.0 8.57 0.86 1.06 0.16 0.00 0.01 0.16 0.00 2.0 65.0 0. 1.29
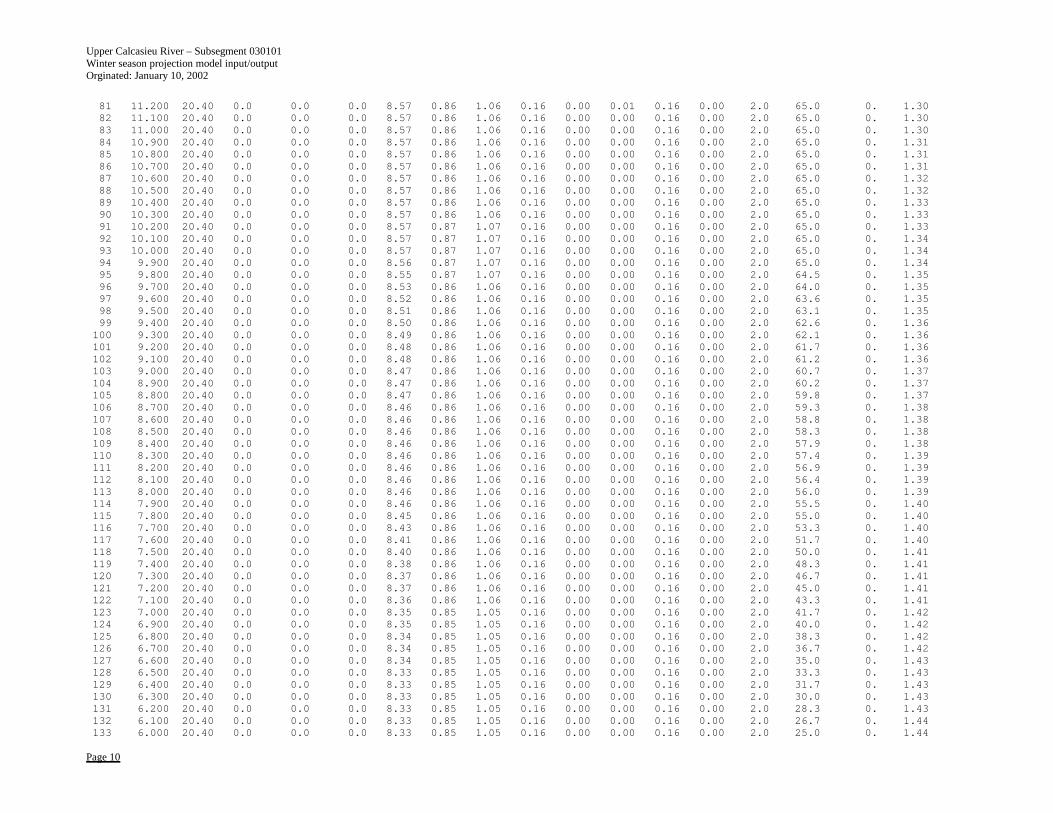
Upper Calcasieu River – Subsegment 030101 Winter season projection model input/output Orginated: January 10, 2002
Page 10
81 11.200 20.40 0.0 0.0 0.0 8.57 0.86 1.06 0.16 0.00 0.01 0.16 0.00 2.0 65.0 0. 1.3082 11.100 20.40 0.0 0.0 0.0 8.57 0.86 1.06 0.16 0.00 0.00 0.16 0.00 2.0 65.0 0. 1.3083 11.000 20.40 0.0 0.0 0.0 8.57 0.86 1.06 0.16 0.00 0.00 0.16 0.00 2.0 65.0 0. 1.3084 10.900 20.40 0.0 0.0 0.0 8.57 0.86 1.06 0.16 0.00 0.00 0.16 0.00 2.0 65.0 0. 1.3185 10.800 20.40 0.0 0.0 0.0 8.57 0.86 1.06 0.16 0.00 0.00 0.16 0.00 2.0 65.0 0. 1.3186 10.700 20.40 0.0 0.0 0.0 8.57 0.86 1.06 0.16 0.00 0.00 0.16 0.00 2.0 65.0 0. 1.3187 10.600 20.40 0.0 0.0 0.0 8.57 0.86 1.06 0.16 0.00 0.00 0.16 0.00 2.0 65.0 0. 1.3288 10.500 20.40 0.0 0.0 0.0 8.57 0.86 1.06 0.16 0.00 0.00 0.16 0.00 2.0 65.0 0. 1.3289 10.400 20.40 0.0 0.0 0.0 8.57 0.86 1.06 0.16 0.00 0.00 0.16 0.00 2.0 65.0 0. 1.3390 10.300 20.40 0.0 0.0 0.0 8.57 0.86 1.06 0.16 0.00 0.00 0.16 0.00 2.0 65.0 0. 1.3391 10.200 20.40 0.0 0.0 0.0 8.57 0.87 1.07 0.16 0.00 0.00 0.16 0.00 2.0 65.0 0. 1.3392 10.100 20.40 0.0 0.0 0.0 8.57 0.87 1.07 0.16 0.00 0.00 0.16 0.00 2.0 65.0 0. 1.3493 10.000 20.40 0.0 0.0 0.0 8.57 0.87 1.07 0.16 0.00 0.00 0.16 0.00 2.0 65.0 0. 1.3494 9.900 20.40 0.0 0.0 0.0 8.56 0.87 1.07 0.16 0.00 0.00 0.16 0.00 2.0 65.0 0. 1.3495 9.800 20.40 0.0 0.0 0.0 8.55 0.87 1.07 0.16 0.00 0.00 0.16 0.00 2.0 64.5 0. 1.3596 9.700 20.40 0.0 0.0 0.0 8.53 0.86 1.06 0.16 0.00 0.00 0.16 0.00 2.0 64.0 0. 1.3597 9.600 20.40 0.0 0.0 0.0 8.52 0.86 1.06 0.16 0.00 0.00 0.16 0.00 2.0 63.6 0. 1.3598 9.500 20.40 0.0 0.0 0.0 8.51 0.86 1.06 0.16 0.00 0.00 0.16 0.00 2.0 63.1 0. 1.3599 9.400 20.40 0.0 0.0 0.0 8.50 0.86 1.06 0.16 0.00 0.00 0.16 0.00 2.0 62.6 0. 1.36100 9.300 20.40 0.0 0.0 0.0 8.49 0.86 1.06 0.16 0.00 0.00 0.16 0.00 2.0 62.1 0. 1.36101 9.200 20.40 0.0 0.0 0.0 8.48 0.86 1.06 0.16 0.00 0.00 0.16 0.00 2.0 61.7 0. 1.36102 9.100 20.40 0.0 0.0 0.0 8.48 0.86 1.06 0.16 0.00 0.00 0.16 0.00 2.0 61.2 0. 1.36103 9.000 20.40 0.0 0.0 0.0 8.47 0.86 1.06 0.16 0.00 0.00 0.16 0.00 2.0 60.7 0. 1.37104 8.900 20.40 0.0 0.0 0.0 8.47 0.86 1.06 0.16 0.00 0.00 0.16 0.00 2.0 60.2 0. 1.37105 8.800 20.40 0.0 0.0 0.0 8.47 0.86 1.06 0.16 0.00 0.00 0.16 0.00 2.0 59.8 0. 1.37106 8.700 20.40 0.0 0.0 0.0 8.46 0.86 1.06 0.16 0.00 0.00 0.16 0.00 2.0 59.3 0. 1.38107 8.600 20.40 0.0 0.0 0.0 8.46 0.86 1.06 0.16 0.00 0.00 0.16 0.00 2.0 58.8 0. 1.38108 8.500 20.40 0.0 0.0 0.0 8.46 0.86 1.06 0.16 0.00 0.00 0.16 0.00 2.0 58.3 0. 1.38109 8.400 20.40 0.0 0.0 0.0 8.46 0.86 1.06 0.16 0.00 0.00 0.16 0.00 2.0 57.9 0. 1.38110 8.300 20.40 0.0 0.0 0.0 8.46 0.86 1.06 0.16 0.00 0.00 0.16 0.00 2.0 57.4 0. 1.39111 8.200 20.40 0.0 0.0 0.0 8.46 0.86 1.06 0.16 0.00 0.00 0.16 0.00 2.0 56.9 0. 1.39112 8.100 20.40 0.0 0.0 0.0 8.46 0.86 1.06 0.16 0.00 0.00 0.16 0.00 2.0 56.4 0. 1.39113 8.000 20.40 0.0 0.0 0.0 8.46 0.86 1.06 0.16 0.00 0.00 0.16 0.00 2.0 56.0 0. 1.39114 7.900 20.40 0.0 0.0 0.0 8.46 0.86 1.06 0.16 0.00 0.00 0.16 0.00 2.0 55.5 0. 1.40115 7.800 20.40 0.0 0.0 0.0 8.45 0.86 1.06 0.16 0.00 0.00 0.16 0.00 2.0 55.0 0. 1.40116 7.700 20.40 0.0 0.0 0.0 8.43 0.86 1.06 0.16 0.00 0.00 0.16 0.00 2.0 53.3 0. 1.40117 7.600 20.40 0.0 0.0 0.0 8.41 0.86 1.06 0.16 0.00 0.00 0.16 0.00 2.0 51.7 0. 1.40118 7.500 20.40 0.0 0.0 0.0 8.40 0.86 1.06 0.16 0.00 0.00 0.16 0.00 2.0 50.0 0. 1.41119 7.400 20.40 0.0 0.0 0.0 8.38 0.86 1.06 0.16 0.00 0.00 0.16 0.00 2.0 48.3 0. 1.41120 7.300 20.40 0.0 0.0 0.0 8.37 0.86 1.06 0.16 0.00 0.00 0.16 0.00 2.0 46.7 0. 1.41121 7.200 20.40 0.0 0.0 0.0 8.37 0.86 1.06 0.16 0.00 0.00 0.16 0.00 2.0 45.0 0. 1.41122 7.100 20.40 0.0 0.0 0.0 8.36 0.86 1.06 0.16 0.00 0.00 0.16 0.00 2.0 43.3 0. 1.41123 7.000 20.40 0.0 0.0 0.0 8.35 0.85 1.05 0.16 0.00 0.00 0.16 0.00 2.0 41.7 0. 1.42124 6.900 20.40 0.0 0.0 0.0 8.35 0.85 1.05 0.16 0.00 0.00 0.16 0.00 2.0 40.0 0. 1.42125 6.800 20.40 0.0 0.0 0.0 8.34 0.85 1.05 0.16 0.00 0.00 0.16 0.00 2.0 38.3 0. 1.42126 6.700 20.40 0.0 0.0 0.0 8.34 0.85 1.05 0.16 0.00 0.00 0.16 0.00 2.0 36.7 0. 1.42127 6.600 20.40 0.0 0.0 0.0 8.34 0.85 1.05 0.16 0.00 0.00 0.16 0.00 2.0 35.0 0. 1.43128 6.500 20.40 0.0 0.0 0.0 8.33 0.85 1.05 0.16 0.00 0.00 0.16 0.00 2.0 33.3 0. 1.43129 6.400 20.40 0.0 0.0 0.0 8.33 0.85 1.05 0.16 0.00 0.00 0.16 0.00 2.0 31.7 0. 1.43130 6.300 20.40 0.0 0.0 0.0 8.33 0.85 1.05 0.16 0.00 0.00 0.16 0.00 2.0 30.0 0. 1.43131 6.200 20.40 0.0 0.0 0.0 8.33 0.85 1.05 0.16 0.00 0.00 0.16 0.00 2.0 28.3 0. 1.43132 6.100 20.40 0.0 0.0 0.0 8.33 0.85 1.05 0.16 0.00 0.00 0.16 0.00 2.0 26.7 0. 1.44133 6.000 20.40 0.0 0.0 0.0 8.33 0.85 1.05 0.16 0.00 0.00 0.16 0.00 2.0 25.0 0. 1.44
Upper Calcasieu River – Subsegment 030101 Winter season projection model input/output Orginated: January 10, 2002
Page 11
134 5.900 20.40 0.0 0.0 0.0 8.33 0.85 1.05 0.16 0.00 0.00 0.16 0.00 2.0 23.3 0. 1.44135 5.800 20.40 0.0 0.0 0.0 8.33 0.85 1.05 0.16 0.00 0.00 0.16 0.00 2.0 21.7 0. 1.44136 5.700 20.40 0.0 0.0 0.0 8.32 0.85 1.05 0.16 0.00 0.00 0.16 0.00 2.0 20.0 0. 1.45137 5.600 20.40 0.0 0.0 0.0 8.30 0.85 1.05 0.16 0.00 0.00 0.16 0.00 2.0 19.9 0. 1.45138 5.500 20.40 0.0 0.0 0.0 8.29 0.85 1.05 0.16 0.00 0.00 0.16 0.00 2.0 19.8 0. 1.45139 5.400 20.40 0.0 0.0 0.0 8.27 0.85 1.05 0.16 0.00 0.00 0.16 0.00 2.0 19.7 0. 1.46140 5.300 20.40 0.0 0.0 0.0 8.26 0.85 1.05 0.16 0.00 0.00 0.16 0.00 2.0 19.6 0. 1.46141 5.200 20.40 0.0 0.0 0.0 8.25 0.85 1.05 0.16 0.00 0.00 0.16 0.00 2.0 19.5 0. 1.47142 5.100 20.40 0.0 0.0 0.0 8.24 0.85 1.05 0.16 0.00 0.00 0.16 0.00 2.0 19.4 0. 1.47143 5.000 20.40 0.0 0.0 0.0 8.24 0.85 1.05 0.16 0.00 0.00 0.16 0.00 2.0 19.3 0. 1.47144 4.900 20.40 0.0 0.0 0.0 8.23 0.85 1.05 0.16 0.00 0.00 0.16 0.00 2.0 19.2 0. 1.48145 4.800 20.40 0.0 0.0 0.0 8.23 0.85 1.05 0.16 0.00 0.00 0.16 0.00 2.0 19.1 0. 1.48146 4.700 20.40 0.0 0.0 0.0 8.22 0.85 1.05 0.16 0.00 0.00 0.16 0.00 2.0 19.0 0. 1.49147 4.600 20.40 0.0 0.0 0.0 8.22 0.84 1.04 0.16 0.00 0.00 0.16 0.00 2.0 19.0 0. 1.49148 4.500 20.40 0.0 0.0 0.0 8.22 0.84 1.04 0.16 0.00 0.00 0.16 0.00 2.0 18.9 0. 1.49149 4.400 20.40 0.0 0.0 0.0 8.22 0.84 1.04 0.16 0.00 0.00 0.16 0.00 2.0 18.8 0. 1.50150 4.300 20.40 0.0 0.0 0.0 8.21 0.84 1.04 0.16 0.00 0.00 0.16 0.00 2.0 18.7 0. 1.50151 4.200 20.40 0.0 0.0 0.0 8.21 0.84 1.04 0.16 0.00 0.00 0.16 0.00 2.0 18.6 0. 1.51152 4.100 20.40 0.0 0.0 0.0 8.21 0.84 1.04 0.16 0.00 0.00 0.16 0.00 2.0 18.5 0. 1.51153 4.000 20.40 0.0 0.0 0.0 8.21 0.84 1.04 0.16 0.00 0.00 0.16 0.00 2.0 18.4 0. 1.51154 3.900 20.40 0.0 0.0 0.0 8.21 0.84 1.04 0.16 0.00 0.00 0.16 0.00 2.0 18.3 0. 1.52155 3.800 20.40 0.0 0.0 0.0 8.21 0.84 1.04 0.16 0.00 0.00 0.16 0.00 2.0 18.2 0. 1.52156 3.700 20.40 0.0 0.0 0.0 8.21 0.84 1.04 0.16 0.00 0.00 0.16 0.00 2.0 18.1 0. 1.53157 3.600 20.40 0.0 0.0 0.0 8.21 0.84 1.04 0.16 0.00 0.00 0.16 0.00 2.0 18.0 0. 1.53158 3.500 20.40 0.0 0.0 0.0 8.20 0.84 1.04 0.16 0.00 0.00 0.16 0.00 2.0 18.0 0. 1.55159 3.400 20.40 0.0 0.0 0.0 8.20 0.85 1.05 0.16 0.00 0.00 0.16 0.00 2.0 18.0 0. 1.56160 3.300 20.40 0.0 0.0 0.0 8.19 0.85 1.05 0.16 0.00 0.00 0.16 0.00 2.0 18.0 0. 1.58161 3.200 20.40 0.0 0.0 0.0 8.19 0.85 1.05 0.16 0.00 0.00 0.16 0.00 2.0 18.0 0. 1.60162 3.100 20.40 0.0 0.0 0.0 8.18 0.86 1.06 0.16 0.00 0.00 0.16 0.00 2.0 18.0 0. 1.62163 3.000 20.40 0.0 0.0 0.0 8.18 0.86 1.06 0.17 0.00 0.00 0.17 0.00 2.0 18.0 0. 1.63164 2.900 20.40 0.0 0.0 0.0 8.18 0.87 1.07 0.17 0.00 0.00 0.17 0.00 2.0 18.0 0. 1.65165 2.800 20.40 0.0 0.0 0.0 8.18 0.87 1.07 0.17 0.00 0.00 0.17 0.00 2.0 18.0 0. 1.67166 2.700 20.40 0.0 0.0 0.0 8.17 0.87 1.07 0.17 0.00 0.00 0.17 0.00 2.0 18.0 0. 1.69167 2.600 20.40 0.0 0.0 0.0 8.17 0.88 1.08 0.17 0.00 0.00 0.17 0.00 2.0 18.0 0. 1.70168 2.500 20.40 0.0 0.0 0.0 8.17 0.88 1.08 0.17 0.00 0.00 0.17 0.00 2.0 18.0 0. 1.72169 2.400 20.40 0.0 0.0 0.0 8.17 0.88 1.08 0.17 0.00 0.00 0.17 0.00 2.0 18.0 0. 1.74170 2.300 20.40 0.0 0.0 0.0 8.17 0.89 1.09 0.17 0.00 0.00 0.17 0.00 2.0 18.0 0. 1.76171 2.200 20.40 0.0 0.0 0.0 8.16 0.89 1.09 0.17 0.00 0.00 0.17 0.00 2.0 18.0 0. 1.78172 2.100 20.40 0.0 0.0 0.0 8.16 0.90 1.10 0.17 0.00 0.00 0.17 0.00 2.0 18.0 0. 1.80173 2.000 20.40 0.0 0.0 0.0 8.16 0.90 1.10 0.18 0.00 0.00 0.18 0.00 2.0 18.0 0. 1.82174 1.900 20.40 0.0 0.0 0.0 8.15 0.91 1.11 0.18 0.00 0.00 0.18 0.00 2.0 18.0 0. 1.84175 1.800 20.40 0.0 0.0 0.0 8.15 0.91 1.11 0.18 0.00 0.00 0.18 0.00 2.0 18.0 0. 1.86176 1.700 20.40 0.0 0.0 0.0 8.15 0.91 1.11 0.18 0.00 0.00 0.18 0.00 2.0 18.0 0. 1.88177 1.600 20.40 0.0 0.0 0.0 8.15 0.92 1.12 0.18 0.00 0.00 0.18 0.00 2.0 18.0 0. 1.90178 1.500 20.40 0.0 0.0 0.0 8.15 0.92 1.12 0.18 0.00 0.00 0.18 0.00 2.0 18.0 0. 1.92179 1.400 20.40 0.0 0.0 0.0 8.15 0.97 1.17 0.19 0.00 0.00 0.19 0.00 2.0 18.0 0. 1.98180 1.300 20.40 0.0 0.0 0.0 8.15 0.98 1.18 0.19 0.00 0.00 0.19 0.00 2.0 18.0 0. 2.00181 1.200 20.40 0.0 0.0 0.0 8.15 0.98 1.18 0.19 0.00 0.00 0.19 0.00 2.0 18.0 0. 2.02182 1.100 20.40 0.0 0.0 0.0 8.14 0.99 1.19 0.19 0.00 0.00 0.19 0.00 2.0 18.0 0. 2.04183 1.000 20.40 0.0 0.0 0.0 8.14 0.99 1.19 0.19 0.00 0.00 0.19 0.00 2.0 18.0 0. 2.06184 0.900 20.40 0.0 0.0 0.0 8.14 1.00 1.20 0.19 0.00 0.00 0.19 0.00 2.0 18.0 0. 2.08185 0.800 20.40 0.0 0.0 0.0 8.14 1.00 1.20 0.19 0.00 0.00 0.19 0.00 2.0 18.0 0. 2.10186 0.700 20.40 0.0 0.0 0.0 8.14 1.01 1.21 0.20 0.00 0.00 0.20 0.00 2.0 18.0 0. 2.12
Upper Calcasieu River – Subsegment 030101 Winter season projection model input/output Orginated: January 10, 2002
Page 12
187 0.600 20.40 0.0 0.0 0.0 8.14 1.01 1.21 0.20 0.00 0.00 0.20 0.00 2.0 18.0 0. 2.14188 0.500 20.40 0.0 0.0 0.0 8.14 1.02 1.22 0.20 0.00 0.00 0.20 0.00 2.0 18.0 0. 2.16189 0.400 20.40 0.0 0.0 0.0 8.14 1.02 1.22 0.20 0.00 0.00 0.20 0.00 2.0 18.0 0. 2.18190 0.300 20.40 0.0 0.0 0.0 8.14 1.03 1.23 0.20 0.00 0.00 0.20 0.00 2.0 18.0 0. 2.20191 0.200 20.40 0.0 0.0 0.0 8.14 1.03 1.23 0.20 0.00 0.00 0.20 0.00 2.0 18.0 0. 2.22192 0.100 20.40 0.0 0.0 0.0 8.14 1.04 1.24 0.20 0.00 0.00 0.20 0.00 2.0 18.0 0. 2.24193 0.000 20.40 0.0 0.0 0.0 8.13 1.04 1.24 0.20 0.00 0.00 0.20 0.00 2.0 18.0 0. 2.26
SPECIAL REPORT: UPPER CALCASIEU RVRBIOLOGICAL AND PHYSICAL COEFFICIENTS
ELEM ENDING SAT REAER CBOD CBOD ANBOD FULL CORR ORGN ORGN NH3 NH3 DENIT PO4 ALG MAC COLI NCM NCMNO. DIST D.O. RATE DECAY SETT DECAY SOD SOD DECAY SETT DECAY SRCE RATE SRCE PROD PROD DECAY DECAY SETT
mg/L 1/da 1/da 1/da 1/da * * 1/da 1/da 1/da * 1/da * ** ** 1/da 1/da 1/da
1 19.200 9.02 7.39 0.17 0.05 0.00 0.58 0.58 0.03 0.05 0.52 0.00 0.00 0.00 0.00 0.03 0.052 19.100 9.02 7.39 0.17 0.05 0.00 0.58 0.58 0.03 0.05 0.52 0.00 0.00 0.00 0.00 0.03 0.053 19.000 9.02 7.39 0.17 0.05 0.00 0.58 0.58 0.03 0.05 0.52 0.00 0.00 0.00 0.00 0.03 0.054 18.900 9.02 7.39 0.17 0.05 0.00 0.58 0.58 0.03 0.05 0.52 0.00 0.00 0.00 0.00 0.03 0.055 18.800 9.02 7.39 0.17 0.05 0.00 0.58 0.58 0.03 0.05 0.52 0.00 0.00 0.00 0.00 0.03 0.056 18.700 9.02 7.39 0.17 0.05 0.00 0.58 0.58 0.03 0.05 0.52 0.00 0.00 0.00 0.00 0.03 0.057 18.600 9.02 7.39 0.17 0.05 0.00 0.58 0.58 0.03 0.05 0.52 0.00 0.00 0.00 0.00 0.03 0.058 18.500 9.02 7.39 0.17 0.05 0.00 0.58 0.58 0.03 0.05 0.52 0.00 0.00 0.00 0.00 0.03 0.059 18.400 9.02 7.39 0.17 0.05 0.00 0.58 0.58 0.03 0.05 0.52 0.00 0.00 0.00 0.00 0.03 0.0510 18.300 9.02 7.39 0.17 0.05 0.00 0.58 0.58 0.03 0.05 0.52 0.00 0.00 0.00 0.00 0.03 0.0511 18.200 9.02 8.54 0.16 0.05 0.00 0.64 0.64 0.08 0.05 0.52 0.00 0.00 0.00 0.00 0.03 0.0512 18.100 9.02 8.54 0.16 0.05 0.00 0.64 0.64 0.08 0.05 0.52 0.00 0.00 0.00 0.00 0.03 0.0513 18.000 9.02 8.54 0.16 0.05 0.00 0.64 0.64 0.08 0.05 0.52 0.00 0.00 0.00 0.00 0.03 0.0514 17.900 9.02 8.54 0.16 0.05 0.00 0.64 0.64 0.08 0.05 0.52 0.00 0.00 0.00 0.00 0.03 0.0515 17.800 9.02 8.54 0.16 0.05 0.00 0.64 0.64 0.08 0.05 0.52 0.00 0.00 0.00 0.00 0.03 0.0516 17.700 9.02 8.54 0.16 0.05 0.00 0.64 0.64 0.08 0.05 0.52 0.00 0.00 0.00 0.00 0.03 0.0517 17.600 9.02 8.54 0.16 0.05 0.00 0.64 0.64 0.08 0.05 0.52 0.00 0.00 0.00 0.00 0.03 0.0518 17.500 9.02 8.54 0.16 0.05 0.00 0.64 0.64 0.08 0.05 0.52 0.00 0.00 0.00 0.00 0.03 0.0519 17.400 9.02 8.54 0.16 0.05 0.00 0.64 0.64 0.08 0.05 0.52 0.00 0.00 0.00 0.00 0.03 0.0520 17.300 9.02 8.54 0.16 0.05 0.00 0.64 0.64 0.08 0.05 0.52 0.00 0.00 0.00 0.00 0.03 0.0521 17.200 9.02 8.54 0.16 0.05 0.00 0.64 0.64 0.08 0.05 0.52 0.00 0.00 0.00 0.00 0.03 0.0522 17.100 9.02 8.54 0.16 0.05 0.00 0.64 0.64 0.08 0.05 0.52 0.00 0.00 0.00 0.00 0.03 0.0523 17.000 9.02 8.54 0.16 0.05 0.00 0.64 0.64 0.08 0.05 0.52 0.00 0.00 0.00 0.00 0.03 0.0524 16.900 9.02 8.54 0.16 0.05 0.00 0.64 0.64 0.08 0.05 0.52 0.00 0.00 0.00 0.00 0.03 0.0525 16.800 9.02 8.54 0.16 0.05 0.00 0.64 0.64 0.08 0.05 0.52 0.00 0.00 0.00 0.00 0.03 0.0526 16.700 9.02 8.54 0.16 0.05 0.00 0.64 0.64 0.08 0.05 0.52 0.00 0.00 0.00 0.00 0.03 0.0527 16.600 9.02 8.54 0.16 0.05 0.00 0.64 0.64 0.08 0.05 0.52 0.00 0.00 0.00 0.00 0.03 0.0528 16.500 9.02 8.54 0.16 0.05 0.00 0.64 0.64 0.08 0.05 0.52 0.00 0.00 0.00 0.00 0.03 0.0529 16.400 9.02 8.54 0.16 0.05 0.00 0.64 0.64 0.08 0.05 0.52 0.00 0.00 0.00 0.00 0.03 0.0530 16.300 9.02 8.54 0.16 0.05 0.00 0.64 0.64 0.08 0.05 0.52 0.00 0.00 0.00 0.00 0.03 0.0531 16.200 9.02 8.54 0.16 0.05 0.00 0.64 0.64 0.08 0.05 0.52 0.00 0.00 0.00 0.00 0.03 0.0532 16.100 9.02 10.16 0.15 0.05 0.00 0.71 0.71 0.14 0.05 0.52 0.00 0.00 0.00 0.00 0.02 0.0533 16.000 9.02 10.16 0.15 0.05 0.00 0.71 0.71 0.14 0.05 0.52 0.00 0.00 0.00 0.00 0.02 0.0534 15.900 9.02 10.16 0.15 0.05 0.00 0.71 0.71 0.14 0.05 0.52 0.00 0.00 0.00 0.00 0.02 0.0535 15.800 9.02 10.16 0.15 0.05 0.00 0.71 0.71 0.14 0.05 0.52 0.00 0.00 0.00 0.00 0.02 0.0536 15.700 9.02 10.16 0.15 0.05 0.00 0.71 0.71 0.14 0.05 0.52 0.00 0.00 0.00 0.00 0.02 0.0537 15.600 9.02 10.16 0.15 0.05 0.00 0.71 0.71 0.14 0.05 0.52 0.00 0.00 0.00 0.00 0.02 0.05
Upper Calcasieu River – Subsegment 030101 Winter season projection model input/output Orginated: January 10, 2002
Page 13
38 15.500 9.02 10.16 0.15 0.05 0.00 0.71 0.71 0.14 0.05 0.52 0.00 0.00 0.00 0.00 0.02 0.0539 15.400 9.02 10.16 0.15 0.05 0.00 0.71 0.71 0.14 0.05 0.52 0.00 0.00 0.00 0.00 0.02 0.0540 15.300 9.02 10.16 0.15 0.05 0.00 0.71 0.71 0.14 0.05 0.52 0.00 0.00 0.00 0.00 0.02 0.0541 15.200 9.02 10.16 0.15 0.05 0.00 0.71 0.71 0.14 0.05 0.52 0.00 0.00 0.00 0.00 0.02 0.0542 15.100 9.02 10.16 0.15 0.05 0.00 0.71 0.71 0.14 0.05 0.52 0.00 0.00 0.00 0.00 0.02 0.0543 15.000 9.02 10.16 0.15 0.05 0.00 0.71 0.71 0.14 0.05 0.52 0.00 0.00 0.00 0.00 0.02 0.0544 14.900 9.02 10.16 0.15 0.05 0.00 0.71 0.71 0.14 0.05 0.52 0.00 0.00 0.00 0.00 0.02 0.0545 14.800 9.02 10.16 0.15 0.05 0.00 0.71 0.71 0.14 0.05 0.52 0.00 0.00 0.00 0.00 0.02 0.0546 14.700 9.02 10.16 0.15 0.05 0.00 0.71 0.71 0.14 0.05 0.52 0.00 0.00 0.00 0.00 0.02 0.0547 14.600 9.02 10.16 0.15 0.05 0.00 0.71 0.71 0.14 0.05 0.52 0.00 0.00 0.00 0.00 0.02 0.0548 14.500 9.02 10.16 0.15 0.05 0.00 0.71 0.71 0.14 0.05 0.52 0.00 0.00 0.00 0.00 0.02 0.0549 14.400 9.02 10.16 0.15 0.05 0.00 0.71 0.71 0.14 0.05 0.52 0.00 0.00 0.00 0.00 0.02 0.0550 14.300 9.02 10.16 0.15 0.05 0.00 0.71 0.71 0.14 0.05 0.52 0.00 0.00 0.00 0.00 0.02 0.0551 14.200 9.02 10.16 0.15 0.05 0.00 0.71 0.71 0.14 0.05 0.52 0.00 0.00 0.00 0.00 0.02 0.0552 14.100 9.02 10.16 0.15 0.05 0.00 0.71 0.71 0.14 0.05 0.52 0.00 0.00 0.00 0.00 0.02 0.0553 14.000 9.02 12.89 0.14 0.05 0.00 0.79 0.79 0.19 0.05 0.52 0.00 0.00 0.00 0.00 0.02 0.0554 13.900 9.02 12.89 0.14 0.05 0.00 0.79 0.79 0.19 0.05 0.52 0.00 0.00 0.00 0.00 0.02 0.0555 13.800 9.02 12.89 0.14 0.05 0.00 0.79 0.79 0.19 0.05 0.52 0.00 0.00 0.00 0.00 0.02 0.0556 13.700 9.02 12.89 0.14 0.05 0.00 0.79 0.79 0.19 0.05 0.52 0.00 0.00 0.00 0.00 0.02 0.0557 13.600 9.02 12.89 0.14 0.05 0.00 0.79 0.79 0.19 0.05 0.52 0.00 0.00 0.00 0.00 0.02 0.0558 13.500 9.02 12.89 0.14 0.05 0.00 0.79 0.79 0.19 0.05 0.52 0.00 0.00 0.00 0.00 0.02 0.0559 13.400 9.02 12.89 0.14 0.05 0.00 0.79 0.79 0.19 0.05 0.52 0.00 0.00 0.00 0.00 0.02 0.0560 13.300 9.02 12.89 0.14 0.05 0.00 0.79 0.79 0.19 0.05 0.52 0.00 0.00 0.00 0.00 0.02 0.0561 13.200 9.02 12.89 0.14 0.05 0.00 0.79 0.79 0.19 0.05 0.52 0.00 0.00 0.00 0.00 0.02 0.0562 13.100 9.02 12.89 0.14 0.05 0.00 0.79 0.79 0.19 0.05 0.52 0.00 0.00 0.00 0.00 0.02 0.0563 13.000 9.02 12.89 0.14 0.05 0.00 0.79 0.79 0.19 0.05 0.52 0.00 0.00 0.00 0.00 0.02 0.0564 12.900 9.02 12.89 0.14 0.05 0.00 0.79 0.79 0.19 0.05 0.52 0.00 0.00 0.00 0.00 0.02 0.0565 12.800 9.02 12.89 0.14 0.05 0.00 0.79 0.79 0.19 0.05 0.52 0.00 0.00 0.00 0.00 0.02 0.0566 12.700 9.02 12.89 0.14 0.05 0.00 0.79 0.79 0.19 0.05 0.52 0.00 0.00 0.00 0.00 0.02 0.0567 12.600 9.02 12.89 0.14 0.05 0.00 0.79 0.79 0.19 0.05 0.52 0.00 0.00 0.00 0.00 0.02 0.0568 12.500 9.02 12.89 0.14 0.05 0.00 0.79 0.79 0.19 0.05 0.52 0.00 0.00 0.00 0.00 0.02 0.0569 12.400 9.02 12.89 0.14 0.05 0.00 0.79 0.79 0.19 0.05 0.52 0.00 0.00 0.00 0.00 0.02 0.0570 12.300 9.02 12.89 0.14 0.05 0.00 0.79 0.79 0.19 0.05 0.52 0.00 0.00 0.00 0.00 0.02 0.0571 12.200 9.02 12.89 0.14 0.05 0.00 0.79 0.79 0.19 0.05 0.52 0.00 0.00 0.00 0.00 0.02 0.0572 12.100 9.02 12.89 0.14 0.05 0.00 0.79 0.79 0.19 0.05 0.52 0.00 0.00 0.00 0.00 0.02 0.0573 12.000 9.02 12.89 0.14 0.05 0.00 0.79 0.79 0.19 0.05 0.52 0.00 0.00 0.00 0.00 0.02 0.0574 11.900 9.02 17.38 0.12 0.05 0.00 0.92 0.92 0.24 0.05 0.52 0.00 0.00 0.00 0.00 0.01 0.0575 11.800 9.02 17.38 0.12 0.05 0.00 0.92 0.92 0.24 0.05 0.52 0.00 0.00 0.00 0.00 0.01 0.0576 11.700 9.02 17.38 0.12 0.05 0.00 0.92 0.92 0.24 0.05 0.52 0.00 0.00 0.00 0.00 0.01 0.0577 11.600 9.02 17.38 0.12 0.05 0.00 0.92 0.92 0.24 0.05 0.52 0.00 0.00 0.00 0.00 0.01 0.0578 11.500 9.02 17.38 0.12 0.05 0.00 0.92 0.92 0.24 0.05 0.52 0.00 0.00 0.00 0.00 0.01 0.0579 11.400 9.02 17.38 0.12 0.05 0.00 0.92 0.92 0.24 0.05 0.52 0.00 0.00 0.00 0.00 0.01 0.0580 11.300 9.02 17.38 0.12 0.05 0.00 0.92 0.92 0.24 0.05 0.52 0.00 0.00 0.00 0.00 0.01 0.0581 11.200 9.02 17.38 0.12 0.05 0.00 0.92 0.92 0.24 0.05 0.52 0.00 0.00 0.00 0.00 0.01 0.0582 11.100 9.02 17.38 0.12 0.05 0.00 0.92 0.92 0.24 0.05 0.52 0.00 0.00 0.00 0.00 0.01 0.0583 11.000 9.02 17.38 0.12 0.05 0.00 0.92 0.92 0.24 0.05 0.52 0.00 0.00 0.00 0.00 0.01 0.0584 10.900 9.02 17.38 0.12 0.05 0.00 0.92 0.92 0.24 0.05 0.52 0.00 0.00 0.00 0.00 0.01 0.0585 10.800 9.02 17.38 0.12 0.05 0.00 0.92 0.92 0.24 0.05 0.52 0.00 0.00 0.00 0.00 0.01 0.0586 10.700 9.02 17.38 0.12 0.05 0.00 0.92 0.92 0.24 0.05 0.52 0.00 0.00 0.00 0.00 0.01 0.0587 10.600 9.02 17.38 0.12 0.05 0.00 0.92 0.92 0.24 0.05 0.52 0.00 0.00 0.00 0.00 0.01 0.0588 10.500 9.02 17.38 0.12 0.05 0.00 0.92 0.92 0.24 0.05 0.52 0.00 0.00 0.00 0.00 0.01 0.0589 10.400 9.02 17.38 0.12 0.05 0.00 0.92 0.92 0.24 0.05 0.52 0.00 0.00 0.00 0.00 0.01 0.0590 10.300 9.02 17.38 0.12 0.05 0.00 0.92 0.92 0.24 0.05 0.52 0.00 0.00 0.00 0.00 0.01 0.05
Upper Calcasieu River – Subsegment 030101 Winter season projection model input/output Orginated: January 10, 2002
Page 14
91 10.200 9.02 17.38 0.12 0.05 0.00 0.92 0.92 0.24 0.05 0.52 0.00 0.00 0.00 0.00 0.01 0.0592 10.100 9.02 17.38 0.12 0.05 0.00 0.92 0.92 0.24 0.05 0.52 0.00 0.00 0.00 0.00 0.01 0.0593 10.000 9.02 17.38 0.12 0.05 0.00 0.92 0.92 0.24 0.05 0.52 0.00 0.00 0.00 0.00 0.01 0.0594 9.900 9.02 17.38 0.12 0.05 0.00 0.92 0.92 0.24 0.05 0.52 0.00 0.00 0.00 0.00 0.01 0.0595 9.800 9.02 13.23 0.12 0.05 0.00 0.97 0.97 0.20 0.05 0.52 0.00 0.00 0.00 0.00 0.01 0.0596 9.700 9.02 13.23 0.12 0.05 0.00 0.97 0.97 0.20 0.05 0.52 0.00 0.00 0.00 0.00 0.01 0.0597 9.600 9.02 13.23 0.12 0.05 0.00 0.97 0.97 0.20 0.05 0.52 0.00 0.00 0.00 0.00 0.01 0.0598 9.500 9.02 13.23 0.12 0.05 0.00 0.97 0.97 0.20 0.05 0.52 0.00 0.00 0.00 0.00 0.01 0.0599 9.400 9.02 13.23 0.12 0.05 0.00 0.97 0.97 0.20 0.05 0.52 0.00 0.00 0.00 0.00 0.01 0.05100 9.300 9.02 13.23 0.12 0.05 0.00 0.97 0.97 0.20 0.05 0.52 0.00 0.00 0.00 0.00 0.01 0.05101 9.200 9.02 13.23 0.12 0.05 0.00 0.97 0.97 0.20 0.05 0.52 0.00 0.00 0.00 0.00 0.01 0.05102 9.100 9.02 13.23 0.12 0.05 0.00 0.97 0.97 0.20 0.05 0.52 0.00 0.00 0.00 0.00 0.01 0.05103 9.000 9.02 13.23 0.12 0.05 0.00 0.97 0.97 0.20 0.05 0.52 0.00 0.00 0.00 0.00 0.01 0.05104 8.900 9.02 13.23 0.12 0.05 0.00 0.97 0.97 0.20 0.05 0.52 0.00 0.00 0.00 0.00 0.01 0.05105 8.800 9.02 13.23 0.12 0.05 0.00 0.97 0.97 0.20 0.05 0.52 0.00 0.00 0.00 0.00 0.01 0.05106 8.700 9.02 13.23 0.12 0.05 0.00 0.97 0.97 0.20 0.05 0.52 0.00 0.00 0.00 0.00 0.01 0.05107 8.600 9.02 13.23 0.12 0.05 0.00 0.97 0.97 0.20 0.05 0.52 0.00 0.00 0.00 0.00 0.01 0.05108 8.500 9.02 13.23 0.12 0.05 0.00 0.97 0.97 0.20 0.05 0.52 0.00 0.00 0.00 0.00 0.01 0.05109 8.400 9.02 13.23 0.12 0.05 0.00 0.97 0.97 0.20 0.05 0.52 0.00 0.00 0.00 0.00 0.01 0.05110 8.300 9.02 13.23 0.12 0.05 0.00 0.97 0.97 0.20 0.05 0.52 0.00 0.00 0.00 0.00 0.01 0.05111 8.200 9.02 13.23 0.12 0.05 0.00 0.97 0.97 0.20 0.05 0.52 0.00 0.00 0.00 0.00 0.01 0.05112 8.100 9.02 13.23 0.12 0.05 0.00 0.97 0.97 0.20 0.05 0.52 0.00 0.00 0.00 0.00 0.01 0.05113 8.000 9.02 13.23 0.12 0.05 0.00 0.97 0.97 0.20 0.05 0.52 0.00 0.00 0.00 0.00 0.01 0.05114 7.900 9.02 13.23 0.12 0.05 0.00 0.97 0.97 0.20 0.05 0.52 0.00 0.00 0.00 0.00 0.01 0.05115 7.800 9.02 13.23 0.12 0.05 0.00 0.97 0.97 0.20 0.05 0.52 0.00 0.00 0.00 0.00 0.01 0.05116 7.700 9.02 10.39 0.12 0.05 0.00 1.05 1.05 0.15 0.05 0.52 0.00 0.00 0.00 0.00 0.01 0.05117 7.600 9.02 10.39 0.12 0.05 0.00 1.05 1.05 0.15 0.05 0.52 0.00 0.00 0.00 0.00 0.01 0.05118 7.500 9.02 10.39 0.12 0.05 0.00 1.05 1.05 0.15 0.05 0.52 0.00 0.00 0.00 0.00 0.01 0.05119 7.400 9.02 10.39 0.12 0.05 0.00 1.05 1.05 0.15 0.05 0.52 0.00 0.00 0.00 0.00 0.01 0.05120 7.300 9.02 10.39 0.12 0.05 0.00 1.05 1.05 0.15 0.05 0.52 0.00 0.00 0.00 0.00 0.01 0.05121 7.200 9.02 10.39 0.12 0.05 0.00 1.05 1.05 0.15 0.05 0.52 0.00 0.00 0.00 0.00 0.01 0.05122 7.100 9.02 10.39 0.12 0.05 0.00 1.05 1.05 0.15 0.05 0.52 0.00 0.00 0.00 0.00 0.01 0.05123 7.000 9.02 10.39 0.12 0.05 0.00 1.05 1.05 0.15 0.05 0.52 0.00 0.00 0.00 0.00 0.01 0.05124 6.900 9.02 10.39 0.12 0.05 0.00 1.05 1.05 0.15 0.05 0.52 0.00 0.00 0.00 0.00 0.01 0.05125 6.800 9.02 10.39 0.12 0.05 0.00 1.05 1.05 0.15 0.05 0.52 0.00 0.00 0.00 0.00 0.01 0.05126 6.700 9.02 10.39 0.12 0.05 0.00 1.05 1.05 0.15 0.05 0.52 0.00 0.00 0.00 0.00 0.01 0.05127 6.600 9.02 10.39 0.12 0.05 0.00 1.05 1.05 0.15 0.05 0.52 0.00 0.00 0.00 0.00 0.01 0.05128 6.500 9.02 10.39 0.12 0.05 0.00 1.05 1.05 0.15 0.05 0.52 0.00 0.00 0.00 0.00 0.01 0.05129 6.400 9.02 10.39 0.12 0.05 0.00 1.05 1.05 0.15 0.05 0.52 0.00 0.00 0.00 0.00 0.01 0.05130 6.300 9.02 10.39 0.12 0.05 0.00 1.05 1.05 0.15 0.05 0.52 0.00 0.00 0.00 0.00 0.01 0.05131 6.200 9.02 10.39 0.12 0.05 0.00 1.05 1.05 0.15 0.05 0.52 0.00 0.00 0.00 0.00 0.01 0.05132 6.100 9.02 10.39 0.12 0.05 0.00 1.05 1.05 0.15 0.05 0.52 0.00 0.00 0.00 0.00 0.01 0.05133 6.000 9.02 10.39 0.12 0.05 0.00 1.05 1.05 0.15 0.05 0.52 0.00 0.00 0.00 0.00 0.01 0.05134 5.900 9.02 10.39 0.12 0.05 0.00 1.05 1.05 0.15 0.05 0.52 0.00 0.00 0.00 0.00 0.01 0.05135 5.800 9.02 10.39 0.12 0.05 0.00 1.05 1.05 0.15 0.05 0.52 0.00 0.00 0.00 0.00 0.01 0.05136 5.700 9.02 10.39 0.12 0.05 0.00 1.05 1.05 0.15 0.05 0.52 0.00 0.00 0.00 0.00 0.01 0.05137 5.600 9.02 8.54 0.12 0.05 0.00 1.10 1.10 0.10 0.05 0.52 0.00 0.00 0.00 0.00 0.01 0.05138 5.500 9.02 8.54 0.12 0.05 0.00 1.10 1.10 0.10 0.05 0.52 0.00 0.00 0.00 0.00 0.01 0.05139 5.400 9.02 8.54 0.12 0.05 0.00 1.10 1.10 0.10 0.05 0.52 0.00 0.00 0.00 0.00 0.01 0.05140 5.300 9.02 8.54 0.12 0.05 0.00 1.10 1.10 0.10 0.05 0.52 0.00 0.00 0.00 0.00 0.01 0.05141 5.200 9.02 8.54 0.12 0.05 0.00 1.10 1.10 0.10 0.05 0.52 0.00 0.00 0.00 0.00 0.01 0.05142 5.100 9.02 8.54 0.12 0.05 0.00 1.10 1.10 0.10 0.05 0.52 0.00 0.00 0.00 0.00 0.01 0.05143 5.000 9.02 8.54 0.12 0.05 0.00 1.10 1.10 0.10 0.05 0.52 0.00 0.00 0.00 0.00 0.01 0.05
Upper Calcasieu River – Subsegment 030101 Winter season projection model input/output Orginated: January 10, 2002
Page 15
144 4.900 9.02 8.54 0.12 0.05 0.00 1.10 1.10 0.10 0.05 0.52 0.00 0.00 0.00 0.00 0.01 0.05145 4.800 9.02 8.54 0.12 0.05 0.00 1.10 1.10 0.10 0.05 0.52 0.00 0.00 0.00 0.00 0.01 0.05146 4.700 9.02 8.54 0.12 0.05 0.00 1.10 1.10 0.10 0.05 0.52 0.00 0.00 0.00 0.00 0.01 0.05147 4.600 9.02 8.54 0.12 0.05 0.00 1.10 1.10 0.10 0.05 0.52 0.00 0.00 0.00 0.00 0.01 0.05148 4.500 9.02 8.54 0.12 0.05 0.00 1.10 1.10 0.10 0.05 0.52 0.00 0.00 0.00 0.00 0.01 0.05149 4.400 9.02 8.54 0.12 0.05 0.00 1.10 1.10 0.10 0.05 0.52 0.00 0.00 0.00 0.00 0.01 0.05150 4.300 9.02 8.54 0.12 0.05 0.00 1.10 1.10 0.10 0.05 0.52 0.00 0.00 0.00 0.00 0.01 0.05151 4.200 9.02 8.54 0.12 0.05 0.00 1.10 1.10 0.10 0.05 0.52 0.00 0.00 0.00 0.00 0.01 0.05152 4.100 9.02 8.54 0.12 0.05 0.00 1.10 1.10 0.10 0.05 0.52 0.00 0.00 0.00 0.00 0.01 0.05153 4.000 9.02 8.54 0.12 0.05 0.00 1.10 1.10 0.10 0.05 0.52 0.00 0.00 0.00 0.00 0.01 0.05154 3.900 9.02 8.54 0.12 0.05 0.00 1.10 1.10 0.10 0.05 0.52 0.00 0.00 0.00 0.00 0.01 0.05155 3.800 9.02 8.54 0.12 0.05 0.00 1.10 1.10 0.10 0.05 0.52 0.00 0.00 0.00 0.00 0.01 0.05156 3.700 9.02 8.54 0.12 0.05 0.00 1.10 1.10 0.10 0.05 0.52 0.00 0.00 0.00 0.00 0.01 0.05157 3.600 9.02 8.54 0.12 0.05 0.00 1.10 1.10 0.10 0.05 0.52 0.00 0.00 0.00 0.00 0.01 0.05158 3.500 9.02 7.82 0.12 0.05 0.00 1.19 1.19 0.12 0.05 0.52 0.00 0.00 0.00 0.00 0.01 0.05159 3.400 9.02 7.82 0.12 0.05 0.00 1.19 1.19 0.12 0.05 0.52 0.00 0.00 0.00 0.00 0.01 0.05160 3.300 9.02 7.82 0.12 0.05 0.00 1.19 1.19 0.12 0.05 0.52 0.00 0.00 0.00 0.00 0.01 0.05161 3.200 9.02 7.82 0.12 0.05 0.00 1.19 1.19 0.12 0.05 0.52 0.00 0.00 0.00 0.00 0.01 0.05162 3.100 9.02 7.82 0.12 0.05 0.00 1.19 1.19 0.12 0.05 0.52 0.00 0.00 0.00 0.00 0.01 0.05163 3.000 9.02 7.82 0.12 0.05 0.00 1.19 1.19 0.12 0.05 0.52 0.00 0.00 0.00 0.00 0.01 0.05164 2.900 9.02 7.82 0.12 0.05 0.00 1.19 1.19 0.12 0.05 0.52 0.00 0.00 0.00 0.00 0.01 0.05165 2.800 9.02 7.82 0.12 0.05 0.00 1.19 1.19 0.12 0.05 0.52 0.00 0.00 0.00 0.00 0.01 0.05166 2.700 9.02 7.82 0.12 0.05 0.00 1.19 1.19 0.12 0.05 0.52 0.00 0.00 0.00 0.00 0.01 0.05167 2.600 9.02 7.82 0.12 0.05 0.00 1.19 1.19 0.12 0.05 0.52 0.00 0.00 0.00 0.00 0.01 0.05168 2.500 9.02 7.82 0.12 0.05 0.00 1.19 1.19 0.12 0.05 0.52 0.00 0.00 0.00 0.00 0.01 0.05169 2.400 9.02 7.82 0.12 0.05 0.00 1.19 1.19 0.12 0.05 0.52 0.00 0.00 0.00 0.00 0.01 0.05170 2.300 9.02 7.47 0.12 0.05 0.00 1.30 1.30 0.14 0.05 0.52 0.00 0.00 0.00 0.00 0.01 0.05171 2.200 9.02 7.47 0.12 0.05 0.00 1.30 1.30 0.14 0.05 0.52 0.00 0.00 0.00 0.00 0.01 0.05172 2.100 9.02 7.47 0.12 0.05 0.00 1.30 1.30 0.14 0.05 0.52 0.00 0.00 0.00 0.00 0.01 0.05173 2.000 9.02 7.47 0.12 0.05 0.00 1.30 1.30 0.14 0.05 0.52 0.00 0.00 0.00 0.00 0.01 0.05174 1.900 9.02 7.47 0.12 0.05 0.00 1.30 1.30 0.14 0.05 0.52 0.00 0.00 0.00 0.00 0.01 0.05175 1.800 9.02 7.47 0.12 0.05 0.00 1.30 1.30 0.14 0.05 0.52 0.00 0.00 0.00 0.00 0.01 0.05176 1.700 9.02 7.47 0.12 0.05 0.00 1.30 1.30 0.14 0.05 0.52 0.00 0.00 0.00 0.00 0.01 0.05177 1.600 9.02 7.47 0.12 0.05 0.00 1.30 1.30 0.14 0.05 0.52 0.00 0.00 0.00 0.00 0.01 0.05178 1.500 9.02 7.47 0.12 0.05 0.00 1.30 1.30 0.14 0.05 0.52 0.00 0.00 0.00 0.00 0.01 0.05179 1.400 9.02 7.48 0.12 0.05 0.00 1.30 1.30 0.14 0.05 0.52 0.00 0.00 0.00 0.00 0.01 0.05180 1.300 9.02 7.48 0.12 0.05 0.00 1.30 1.30 0.14 0.05 0.52 0.00 0.00 0.00 0.00 0.01 0.05181 1.200 9.02 7.48 0.12 0.05 0.00 1.30 1.30 0.14 0.05 0.52 0.00 0.00 0.00 0.00 0.01 0.05182 1.100 9.02 7.66 0.12 0.05 0.00 1.48 1.48 0.16 0.05 0.52 0.00 0.00 0.00 0.00 0.01 0.05183 1.000 9.02 7.66 0.12 0.05 0.00 1.48 1.48 0.16 0.05 0.52 0.00 0.00 0.00 0.00 0.01 0.05184 0.900 9.02 7.66 0.12 0.05 0.00 1.48 1.48 0.16 0.05 0.52 0.00 0.00 0.00 0.00 0.01 0.05185 0.800 9.02 7.66 0.12 0.05 0.00 1.48 1.48 0.16 0.05 0.52 0.00 0.00 0.00 0.00 0.01 0.05186 0.700 9.02 7.66 0.12 0.05 0.00 1.48 1.48 0.16 0.05 0.52 0.00 0.00 0.00 0.00 0.01 0.05187 0.600 9.02 7.66 0.12 0.05 0.00 1.48 1.48 0.16 0.05 0.52 0.00 0.00 0.00 0.00 0.01 0.05188 0.500 9.02 7.66 0.12 0.05 0.00 1.48 1.48 0.16 0.05 0.52 0.00 0.00 0.00 0.00 0.01 0.05189 0.400 9.02 7.66 0.12 0.05 0.00 1.48 1.48 0.16 0.05 0.52 0.00 0.00 0.00 0.00 0.01 0.05190 0.300 9.02 7.66 0.12 0.05 0.00 1.48 1.48 0.16 0.05 0.52 0.00 0.00 0.00 0.00 0.01 0.05191 0.200 9.02 7.66 0.12 0.05 0.00 1.48 1.48 0.16 0.05 0.52 0.00 0.00 0.00 0.00 0.01 0.05192 0.100 9.02 7.66 0.12 0.05 0.00 1.48 1.48 0.16 0.05 0.52 0.00 0.00 0.00 0.00 0.01 0.05193 0.000 9.02 7.66 0.12 0.05 0.00 1.48 1.48 0.16 0.05 0.51 0.00 0.00 0.00 0.00 0.01 0.05
SPECIAL REPORT: UPPER CALCASIEU RVR
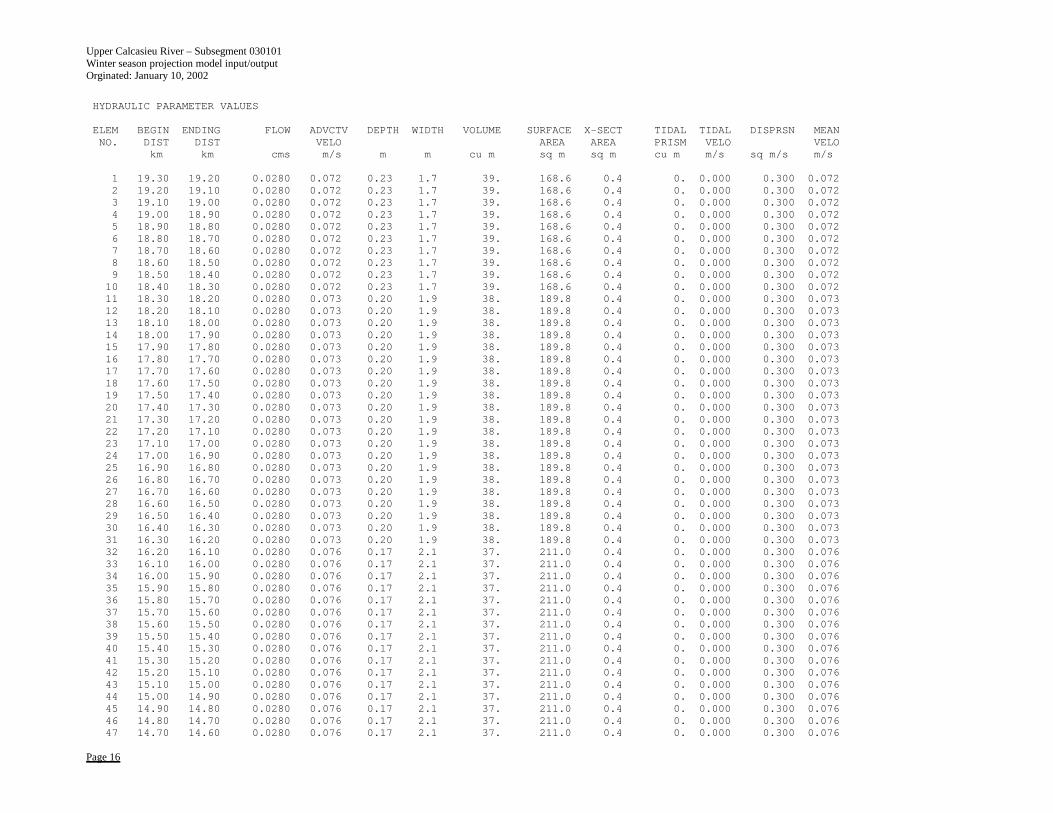
Upper Calcasieu River – Subsegment 030101 Winter season projection model input/output Orginated: January 10, 2002
Page 16
HYDRAULIC PARAMETER VALUES
ELEM BEGIN ENDING FLOW ADVCTV DEPTH WIDTH VOLUME SURFACE X-SECT TIDAL TIDAL DISPRSN MEANNO. DIST DIST VELO AREA AREA PRISM VELO VELO
km km cms m/s m m cu m sq m sq m cu m m/s sq m/s m/s
1 19.30 19.20 0.0280 0.072 0.23 1.7 39. 168.6 0.4 0. 0.000 0.300 0.0722 19.20 19.10 0.0280 0.072 0.23 1.7 39. 168.6 0.4 0. 0.000 0.300 0.0723 19.10 19.00 0.0280 0.072 0.23 1.7 39. 168.6 0.4 0. 0.000 0.300 0.0724 19.00 18.90 0.0280 0.072 0.23 1.7 39. 168.6 0.4 0. 0.000 0.300 0.0725 18.90 18.80 0.0280 0.072 0.23 1.7 39. 168.6 0.4 0. 0.000 0.300 0.0726 18.80 18.70 0.0280 0.072 0.23 1.7 39. 168.6 0.4 0. 0.000 0.300 0.0727 18.70 18.60 0.0280 0.072 0.23 1.7 39. 168.6 0.4 0. 0.000 0.300 0.0728 18.60 18.50 0.0280 0.072 0.23 1.7 39. 168.6 0.4 0. 0.000 0.300 0.0729 18.50 18.40 0.0280 0.072 0.23 1.7 39. 168.6 0.4 0. 0.000 0.300 0.07210 18.40 18.30 0.0280 0.072 0.23 1.7 39. 168.6 0.4 0. 0.000 0.300 0.07211 18.30 18.20 0.0280 0.073 0.20 1.9 38. 189.8 0.4 0. 0.000 0.300 0.07312 18.20 18.10 0.0280 0.073 0.20 1.9 38. 189.8 0.4 0. 0.000 0.300 0.07313 18.10 18.00 0.0280 0.073 0.20 1.9 38. 189.8 0.4 0. 0.000 0.300 0.07314 18.00 17.90 0.0280 0.073 0.20 1.9 38. 189.8 0.4 0. 0.000 0.300 0.07315 17.90 17.80 0.0280 0.073 0.20 1.9 38. 189.8 0.4 0. 0.000 0.300 0.07316 17.80 17.70 0.0280 0.073 0.20 1.9 38. 189.8 0.4 0. 0.000 0.300 0.07317 17.70 17.60 0.0280 0.073 0.20 1.9 38. 189.8 0.4 0. 0.000 0.300 0.07318 17.60 17.50 0.0280 0.073 0.20 1.9 38. 189.8 0.4 0. 0.000 0.300 0.07319 17.50 17.40 0.0280 0.073 0.20 1.9 38. 189.8 0.4 0. 0.000 0.300 0.07320 17.40 17.30 0.0280 0.073 0.20 1.9 38. 189.8 0.4 0. 0.000 0.300 0.07321 17.30 17.20 0.0280 0.073 0.20 1.9 38. 189.8 0.4 0. 0.000 0.300 0.07322 17.20 17.10 0.0280 0.073 0.20 1.9 38. 189.8 0.4 0. 0.000 0.300 0.07323 17.10 17.00 0.0280 0.073 0.20 1.9 38. 189.8 0.4 0. 0.000 0.300 0.07324 17.00 16.90 0.0280 0.073 0.20 1.9 38. 189.8 0.4 0. 0.000 0.300 0.07325 16.90 16.80 0.0280 0.073 0.20 1.9 38. 189.8 0.4 0. 0.000 0.300 0.07326 16.80 16.70 0.0280 0.073 0.20 1.9 38. 189.8 0.4 0. 0.000 0.300 0.07327 16.70 16.60 0.0280 0.073 0.20 1.9 38. 189.8 0.4 0. 0.000 0.300 0.07328 16.60 16.50 0.0280 0.073 0.20 1.9 38. 189.8 0.4 0. 0.000 0.300 0.07329 16.50 16.40 0.0280 0.073 0.20 1.9 38. 189.8 0.4 0. 0.000 0.300 0.07330 16.40 16.30 0.0280 0.073 0.20 1.9 38. 189.8 0.4 0. 0.000 0.300 0.07331 16.30 16.20 0.0280 0.073 0.20 1.9 38. 189.8 0.4 0. 0.000 0.300 0.07332 16.20 16.10 0.0280 0.076 0.17 2.1 37. 211.0 0.4 0. 0.000 0.300 0.07633 16.10 16.00 0.0280 0.076 0.17 2.1 37. 211.0 0.4 0. 0.000 0.300 0.07634 16.00 15.90 0.0280 0.076 0.17 2.1 37. 211.0 0.4 0. 0.000 0.300 0.07635 15.90 15.80 0.0280 0.076 0.17 2.1 37. 211.0 0.4 0. 0.000 0.300 0.07636 15.80 15.70 0.0280 0.076 0.17 2.1 37. 211.0 0.4 0. 0.000 0.300 0.07637 15.70 15.60 0.0280 0.076 0.17 2.1 37. 211.0 0.4 0. 0.000 0.300 0.07638 15.60 15.50 0.0280 0.076 0.17 2.1 37. 211.0 0.4 0. 0.000 0.300 0.07639 15.50 15.40 0.0280 0.076 0.17 2.1 37. 211.0 0.4 0. 0.000 0.300 0.07640 15.40 15.30 0.0280 0.076 0.17 2.1 37. 211.0 0.4 0. 0.000 0.300 0.07641 15.30 15.20 0.0280 0.076 0.17 2.1 37. 211.0 0.4 0. 0.000 0.300 0.07642 15.20 15.10 0.0280 0.076 0.17 2.1 37. 211.0 0.4 0. 0.000 0.300 0.07643 15.10 15.00 0.0280 0.076 0.17 2.1 37. 211.0 0.4 0. 0.000 0.300 0.07644 15.00 14.90 0.0280 0.076 0.17 2.1 37. 211.0 0.4 0. 0.000 0.300 0.07645 14.90 14.80 0.0280 0.076 0.17 2.1 37. 211.0 0.4 0. 0.000 0.300 0.07646 14.80 14.70 0.0280 0.076 0.17 2.1 37. 211.0 0.4 0. 0.000 0.300 0.07647 14.70 14.60 0.0280 0.076 0.17 2.1 37. 211.0 0.4 0. 0.000 0.300 0.076
Upper Calcasieu River – Subsegment 030101 Winter season projection model input/output Orginated: January 10, 2002
Page 17
48 14.60 14.50 0.0280 0.076 0.17 2.1 37. 211.0 0.4 0. 0.000 0.300 0.07649 14.50 14.40 0.0280 0.076 0.17 2.1 37. 211.0 0.4 0. 0.000 0.300 0.07650 14.40 14.30 0.0280 0.076 0.17 2.1 37. 211.0 0.4 0. 0.000 0.300 0.07651 14.30 14.20 0.0280 0.076 0.17 2.1 37. 211.0 0.4 0. 0.000 0.300 0.07652 14.20 14.10 0.0280 0.076 0.17 2.1 37. 211.0 0.4 0. 0.000 0.300 0.07653 14.10 14.00 0.0280 0.083 0.14 2.3 34. 232.3 0.3 0. 0.000 0.300 0.08354 14.00 13.90 0.0280 0.083 0.14 2.3 34. 232.3 0.3 0. 0.000 0.300 0.08355 13.90 13.80 0.0280 0.083 0.14 2.3 34. 232.3 0.3 0. 0.000 0.300 0.08356 13.80 13.70 0.0280 0.083 0.14 2.3 34. 232.3 0.3 0. 0.000 0.300 0.08357 13.70 13.60 0.0280 0.083 0.14 2.3 34. 232.3 0.3 0. 0.000 0.300 0.08358 13.60 13.50 0.0280 0.083 0.14 2.3 34. 232.3 0.3 0. 0.000 0.300 0.08359 13.50 13.40 0.0280 0.083 0.14 2.3 34. 232.3 0.3 0. 0.000 0.300 0.08360 13.40 13.30 0.0280 0.083 0.14 2.3 34. 232.3 0.3 0. 0.000 0.300 0.08361 13.30 13.20 0.0280 0.083 0.14 2.3 34. 232.3 0.3 0. 0.000 0.300 0.08362 13.20 13.10 0.0280 0.083 0.14 2.3 34. 232.3 0.3 0. 0.000 0.300 0.08363 13.10 13.00 0.0280 0.083 0.14 2.3 34. 232.3 0.3 0. 0.000 0.300 0.08364 13.00 12.90 0.0280 0.083 0.14 2.3 34. 232.3 0.3 0. 0.000 0.300 0.08365 12.90 12.80 0.0280 0.083 0.14 2.3 34. 232.3 0.3 0. 0.000 0.300 0.08366 12.80 12.70 0.0280 0.083 0.14 2.3 34. 232.3 0.3 0. 0.000 0.300 0.08367 12.70 12.60 0.0280 0.083 0.14 2.3 34. 232.3 0.3 0. 0.000 0.300 0.08368 12.60 12.50 0.0280 0.083 0.14 2.3 34. 232.3 0.3 0. 0.000 0.300 0.08369 12.50 12.40 0.0280 0.083 0.14 2.3 34. 232.3 0.3 0. 0.000 0.300 0.08370 12.40 12.30 0.0280 0.083 0.14 2.3 34. 232.3 0.3 0. 0.000 0.300 0.08371 12.30 12.20 0.0280 0.083 0.14 2.3 34. 232.3 0.3 0. 0.000 0.300 0.08372 12.20 12.10 0.0280 0.083 0.14 2.3 34. 232.3 0.3 0. 0.000 0.300 0.08373 12.10 12.00 0.0280 0.083 0.14 2.3 34. 232.3 0.3 0. 0.000 0.300 0.08374 12.00 11.90 0.0280 0.095 0.12 2.5 30. 253.6 0.3 0. 0.000 0.300 0.09575 11.90 11.80 0.0280 0.095 0.12 2.5 30. 253.6 0.3 0. 0.000 0.300 0.09576 11.80 11.70 0.0280 0.095 0.12 2.5 30. 253.6 0.3 0. 0.000 0.300 0.09577 11.70 11.60 0.0280 0.095 0.12 2.5 30. 253.6 0.3 0. 0.000 0.300 0.09578 11.60 11.50 0.0280 0.095 0.12 2.5 30. 253.6 0.3 0. 0.000 0.300 0.09579 11.50 11.40 0.0280 0.095 0.12 2.5 30. 253.6 0.3 0. 0.000 0.300 0.09580 11.40 11.30 0.0280 0.095 0.12 2.5 30. 253.6 0.3 0. 0.000 0.300 0.09581 11.30 11.20 0.0280 0.095 0.12 2.5 30. 253.6 0.3 0. 0.000 0.300 0.09582 11.20 11.10 0.0280 0.095 0.12 2.5 30. 253.6 0.3 0. 0.000 0.300 0.09583 11.10 11.00 0.0280 0.095 0.12 2.5 30. 253.6 0.3 0. 0.000 0.300 0.09584 11.00 10.90 0.0280 0.095 0.12 2.5 30. 253.6 0.3 0. 0.000 0.300 0.09585 10.90 10.80 0.0280 0.095 0.12 2.5 30. 253.6 0.3 0. 0.000 0.300 0.09586 10.80 10.70 0.0280 0.095 0.12 2.5 30. 253.6 0.3 0. 0.000 0.300 0.09587 10.70 10.60 0.0280 0.095 0.12 2.5 30. 253.6 0.3 0. 0.000 0.300 0.09588 10.60 10.50 0.0280 0.095 0.12 2.5 30. 253.6 0.3 0. 0.000 0.300 0.09589 10.50 10.40 0.0280 0.095 0.12 2.5 30. 253.6 0.3 0. 0.000 0.300 0.09590 10.40 10.30 0.0280 0.095 0.12 2.5 30. 253.6 0.3 0. 0.000 0.300 0.09591 10.30 10.20 0.0280 0.095 0.12 2.5 30. 253.6 0.3 0. 0.000 0.300 0.09592 10.20 10.10 0.0280 0.095 0.12 2.5 30. 253.6 0.3 0. 0.000 0.300 0.09593 10.10 10.00 0.0280 0.095 0.12 2.5 30. 253.6 0.3 0. 0.000 0.300 0.09594 10.00 9.90 0.0280 0.095 0.12 2.5 30. 253.6 0.3 0. 0.000 0.300 0.09595 9.90 9.80 0.0280 0.073 0.13 2.9 38. 293.8 0.4 0. 0.000 0.300 0.07396 9.80 9.70 0.0280 0.073 0.13 2.9 38. 293.8 0.4 0. 0.000 0.300 0.07397 9.70 9.60 0.0280 0.073 0.13 2.9 38. 293.8 0.4 0. 0.000 0.300 0.07398 9.60 9.50 0.0280 0.073 0.13 2.9 38. 293.8 0.4 0. 0.000 0.300 0.07399 9.50 9.40 0.0280 0.073 0.13 2.9 38. 293.8 0.4 0. 0.000 0.300 0.073100 9.40 9.30 0.0280 0.073 0.13 2.9 38. 293.8 0.4 0. 0.000 0.300 0.073
Upper Calcasieu River – Subsegment 030101 Winter season projection model input/output Orginated: January 10, 2002
Page 18
101 9.30 9.20 0.0280 0.073 0.13 2.9 38. 293.8 0.4 0. 0.000 0.300 0.073102 9.20 9.10 0.0280 0.073 0.13 2.9 38. 293.8 0.4 0. 0.000 0.300 0.073103 9.10 9.00 0.0280 0.073 0.13 2.9 38. 293.8 0.4 0. 0.000 0.300 0.073104 9.00 8.90 0.0280 0.073 0.13 2.9 38. 293.8 0.4 0. 0.000 0.300 0.073105 8.90 8.80 0.0280 0.073 0.13 2.9 38. 293.8 0.4 0. 0.000 0.300 0.073106 8.80 8.70 0.0280 0.073 0.13 2.9 38. 293.8 0.4 0. 0.000 0.300 0.073107 8.70 8.60 0.0280 0.073 0.13 2.9 38. 293.8 0.4 0. 0.000 0.300 0.073108 8.60 8.50 0.0280 0.073 0.13 2.9 38. 293.8 0.4 0. 0.000 0.300 0.073109 8.50 8.40 0.0280 0.073 0.13 2.9 38. 293.8 0.4 0. 0.000 0.300 0.073110 8.40 8.30 0.0280 0.073 0.13 2.9 38. 293.8 0.4 0. 0.000 0.300 0.073111 8.30 8.20 0.0280 0.073 0.13 2.9 38. 293.8 0.4 0. 0.000 0.300 0.073112 8.20 8.10 0.0280 0.073 0.13 2.9 38. 293.8 0.4 0. 0.000 0.300 0.073113 8.10 8.00 0.0280 0.073 0.13 2.9 38. 293.8 0.4 0. 0.000 0.300 0.073114 8.00 7.90 0.0280 0.073 0.13 2.9 38. 293.8 0.4 0. 0.000 0.300 0.073115 7.90 7.80 0.0280 0.073 0.13 2.9 38. 293.8 0.4 0. 0.000 0.300 0.073116 7.80 7.70 0.0280 0.058 0.14 3.3 48. 334.1 0.5 0. 0.000 0.300 0.058117 7.70 7.60 0.0280 0.058 0.14 3.3 48. 334.1 0.5 0. 0.000 0.300 0.058118 7.60 7.50 0.0280 0.058 0.14 3.3 48. 334.1 0.5 0. 0.000 0.300 0.058119 7.50 7.40 0.0280 0.058 0.14 3.3 48. 334.1 0.5 0. 0.000 0.300 0.058120 7.40 7.30 0.0280 0.058 0.14 3.3 48. 334.1 0.5 0. 0.000 0.300 0.058121 7.30 7.20 0.0280 0.058 0.14 3.3 48. 334.1 0.5 0. 0.000 0.300 0.058122 7.20 7.10 0.0280 0.058 0.14 3.3 48. 334.1 0.5 0. 0.000 0.300 0.058123 7.10 7.00 0.0280 0.058 0.14 3.3 48. 334.1 0.5 0. 0.000 0.300 0.058124 7.00 6.90 0.0280 0.058 0.14 3.3 48. 334.1 0.5 0. 0.000 0.300 0.058125 6.90 6.80 0.0280 0.058 0.14 3.3 48. 334.1 0.5 0. 0.000 0.300 0.058126 6.80 6.70 0.0280 0.058 0.14 3.3 48. 334.1 0.5 0. 0.000 0.300 0.058127 6.70 6.60 0.0280 0.058 0.14 3.3 48. 334.1 0.5 0. 0.000 0.300 0.058128 6.60 6.50 0.0280 0.058 0.14 3.3 48. 334.1 0.5 0. 0.000 0.300 0.058129 6.50 6.40 0.0280 0.058 0.14 3.3 48. 334.1 0.5 0. 0.000 0.300 0.058130 6.40 6.30 0.0280 0.058 0.14 3.3 48. 334.1 0.5 0. 0.000 0.300 0.058131 6.30 6.20 0.0280 0.058 0.14 3.3 48. 334.1 0.5 0. 0.000 0.300 0.058132 6.20 6.10 0.0280 0.058 0.14 3.3 48. 334.1 0.5 0. 0.000 0.300 0.058133 6.10 6.00 0.0280 0.058 0.14 3.3 48. 334.1 0.5 0. 0.000 0.300 0.058134 6.00 5.90 0.0280 0.058 0.14 3.3 48. 334.1 0.5 0. 0.000 0.300 0.058135 5.90 5.80 0.0280 0.058 0.14 3.3 48. 334.1 0.5 0. 0.000 0.300 0.058136 5.80 5.70 0.0280 0.058 0.14 3.3 48. 334.1 0.5 0. 0.000 0.300 0.058137 5.70 5.60 0.0280 0.047 0.16 3.7 59. 374.3 0.6 0. 0.000 0.300 0.047138 5.60 5.50 0.0280 0.047 0.16 3.7 59. 374.3 0.6 0. 0.000 0.300 0.047139 5.50 5.40 0.0280 0.047 0.16 3.7 59. 374.3 0.6 0. 0.000 0.300 0.047140 5.40 5.30 0.0280 0.047 0.16 3.7 59. 374.3 0.6 0. 0.000 0.300 0.047141 5.30 5.20 0.0280 0.047 0.16 3.7 59. 374.3 0.6 0. 0.000 0.300 0.047142 5.20 5.10 0.0280 0.047 0.16 3.7 59. 374.3 0.6 0. 0.000 0.300 0.047143 5.10 5.00 0.0280 0.047 0.16 3.7 59. 374.3 0.6 0. 0.000 0.300 0.047144 5.00 4.90 0.0280 0.047 0.16 3.7 59. 374.3 0.6 0. 0.000 0.300 0.047145 4.90 4.80 0.0280 0.047 0.16 3.7 59. 374.3 0.6 0. 0.000 0.300 0.047146 4.80 4.70 0.0280 0.047 0.16 3.7 59. 374.3 0.6 0. 0.000 0.300 0.047147 4.70 4.60 0.0280 0.047 0.16 3.7 59. 374.3 0.6 0. 0.000 0.300 0.047148 4.60 4.50 0.0280 0.047 0.16 3.7 59. 374.3 0.6 0. 0.000 0.300 0.047149 4.50 4.40 0.0280 0.047 0.16 3.7 59. 374.3 0.6 0. 0.000 0.300 0.047150 4.40 4.30 0.0280 0.047 0.16 3.7 59. 374.3 0.6 0. 0.000 0.300 0.047151 4.30 4.20 0.0280 0.047 0.16 3.7 59. 374.3 0.6 0. 0.000 0.300 0.047152 4.20 4.10 0.0280 0.047 0.16 3.7 59. 374.3 0.6 0. 0.000 0.300 0.047153 4.10 4.00 0.0280 0.047 0.16 3.7 59. 374.3 0.6 0. 0.000 0.300 0.047
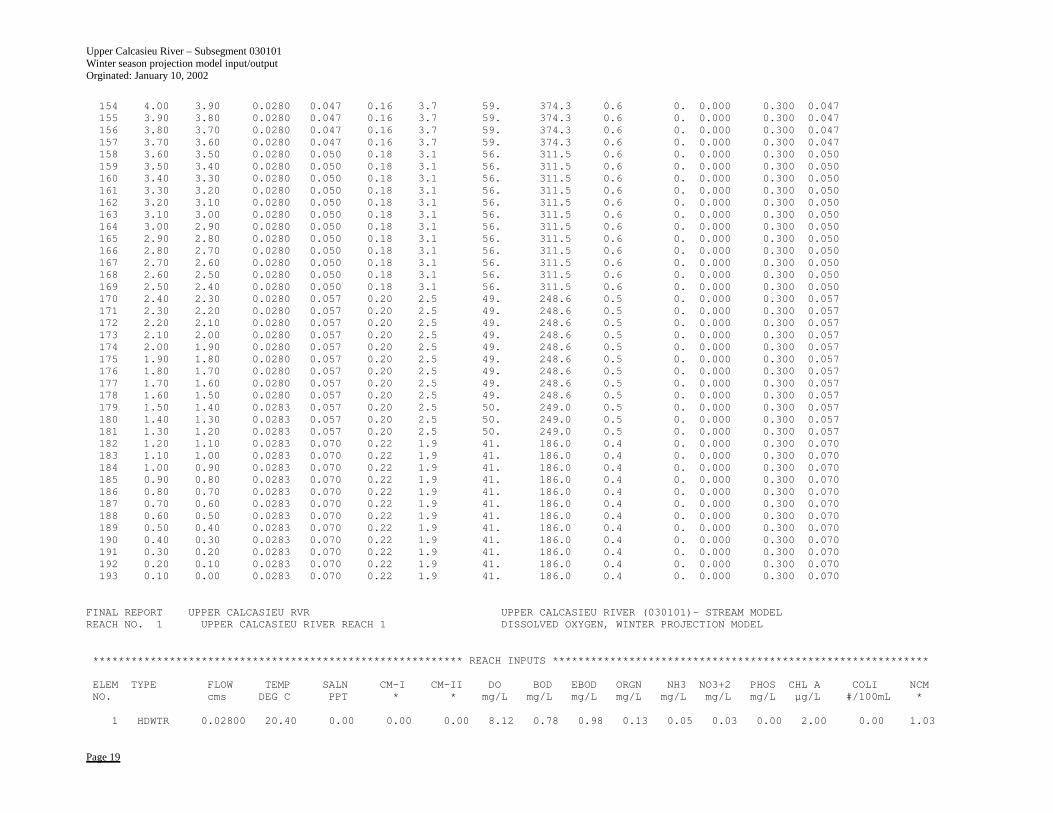
Upper Calcasieu River – Subsegment 030101 Winter season projection model input/output Orginated: January 10, 2002
Page 19
154 4.00 3.90 0.0280 0.047 0.16 3.7 59. 374.3 0.6 0. 0.000 0.300 0.047155 3.90 3.80 0.0280 0.047 0.16 3.7 59. 374.3 0.6 0. 0.000 0.300 0.047156 3.80 3.70 0.0280 0.047 0.16 3.7 59. 374.3 0.6 0. 0.000 0.300 0.047157 3.70 3.60 0.0280 0.047 0.16 3.7 59. 374.3 0.6 0. 0.000 0.300 0.047158 3.60 3.50 0.0280 0.050 0.18 3.1 56. 311.5 0.6 0. 0.000 0.300 0.050159 3.50 3.40 0.0280 0.050 0.18 3.1 56. 311.5 0.6 0. 0.000 0.300 0.050160 3.40 3.30 0.0280 0.050 0.18 3.1 56. 311.5 0.6 0. 0.000 0.300 0.050161 3.30 3.20 0.0280 0.050 0.18 3.1 56. 311.5 0.6 0. 0.000 0.300 0.050162 3.20 3.10 0.0280 0.050 0.18 3.1 56. 311.5 0.6 0. 0.000 0.300 0.050163 3.10 3.00 0.0280 0.050 0.18 3.1 56. 311.5 0.6 0. 0.000 0.300 0.050164 3.00 2.90 0.0280 0.050 0.18 3.1 56. 311.5 0.6 0. 0.000 0.300 0.050165 2.90 2.80 0.0280 0.050 0.18 3.1 56. 311.5 0.6 0. 0.000 0.300 0.050166 2.80 2.70 0.0280 0.050 0.18 3.1 56. 311.5 0.6 0. 0.000 0.300 0.050167 2.70 2.60 0.0280 0.050 0.18 3.1 56. 311.5 0.6 0. 0.000 0.300 0.050168 2.60 2.50 0.0280 0.050 0.18 3.1 56. 311.5 0.6 0. 0.000 0.300 0.050169 2.50 2.40 0.0280 0.050 0.18 3.1 56. 311.5 0.6 0. 0.000 0.300 0.050170 2.40 2.30 0.0280 0.057 0.20 2.5 49. 248.6 0.5 0. 0.000 0.300 0.057171 2.30 2.20 0.0280 0.057 0.20 2.5 49. 248.6 0.5 0. 0.000 0.300 0.057172 2.20 2.10 0.0280 0.057 0.20 2.5 49. 248.6 0.5 0. 0.000 0.300 0.057173 2.10 2.00 0.0280 0.057 0.20 2.5 49. 248.6 0.5 0. 0.000 0.300 0.057174 2.00 1.90 0.0280 0.057 0.20 2.5 49. 248.6 0.5 0. 0.000 0.300 0.057175 1.90 1.80 0.0280 0.057 0.20 2.5 49. 248.6 0.5 0. 0.000 0.300 0.057176 1.80 1.70 0.0280 0.057 0.20 2.5 49. 248.6 0.5 0. 0.000 0.300 0.057177 1.70 1.60 0.0280 0.057 0.20 2.5 49. 248.6 0.5 0. 0.000 0.300 0.057178 1.60 1.50 0.0280 0.057 0.20 2.5 49. 248.6 0.5 0. 0.000 0.300 0.057179 1.50 1.40 0.0283 0.057 0.20 2.5 50. 249.0 0.5 0. 0.000 0.300 0.057180 1.40 1.30 0.0283 0.057 0.20 2.5 50. 249.0 0.5 0. 0.000 0.300 0.057181 1.30 1.20 0.0283 0.057 0.20 2.5 50. 249.0 0.5 0. 0.000 0.300 0.057182 1.20 1.10 0.0283 0.070 0.22 1.9 41. 186.0 0.4 0. 0.000 0.300 0.070183 1.10 1.00 0.0283 0.070 0.22 1.9 41. 186.0 0.4 0. 0.000 0.300 0.070184 1.00 0.90 0.0283 0.070 0.22 1.9 41. 186.0 0.4 0. 0.000 0.300 0.070185 0.90 0.80 0.0283 0.070 0.22 1.9 41. 186.0 0.4 0. 0.000 0.300 0.070186 0.80 0.70 0.0283 0.070 0.22 1.9 41. 186.0 0.4 0. 0.000 0.300 0.070187 0.70 0.60 0.0283 0.070 0.22 1.9 41. 186.0 0.4 0. 0.000 0.300 0.070188 0.60 0.50 0.0283 0.070 0.22 1.9 41. 186.0 0.4 0. 0.000 0.300 0.070189 0.50 0.40 0.0283 0.070 0.22 1.9 41. 186.0 0.4 0. 0.000 0.300 0.070190 0.40 0.30 0.0283 0.070 0.22 1.9 41. 186.0 0.4 0. 0.000 0.300 0.070191 0.30 0.20 0.0283 0.070 0.22 1.9 41. 186.0 0.4 0. 0.000 0.300 0.070192 0.20 0.10 0.0283 0.070 0.22 1.9 41. 186.0 0.4 0. 0.000 0.300 0.070193 0.10 0.00 0.0283 0.070 0.22 1.9 41. 186.0 0.4 0. 0.000 0.300 0.070
FINAL REPORT UPPER CALCASIEU RVR UPPER CALCASIEU RIVER (030101)- STREAM MODELREACH NO. 1 UPPER CALCASIEU RIVER REACH 1 DISSOLVED OXYGEN, WINTER PROJECTION MODEL
********************************************************** REACH INPUTS ***********************************************************
ELEM TYPE FLOW TEMP SALN CM-I CM-II DO BOD EBOD ORGN NH3 NO3+2 PHOS CHL A COLI NCMNO. cms DEG C PPT * * mg/L mg/L mg/L mg/L mg/L mg/L mg/L µg/L #/100mL *
1 HDWTR 0.02800 20.40 0.00 0.00 0.00 8.12 0.78 0.98 0.13 0.05 0.03 0.00 2.00 0.00 1.03
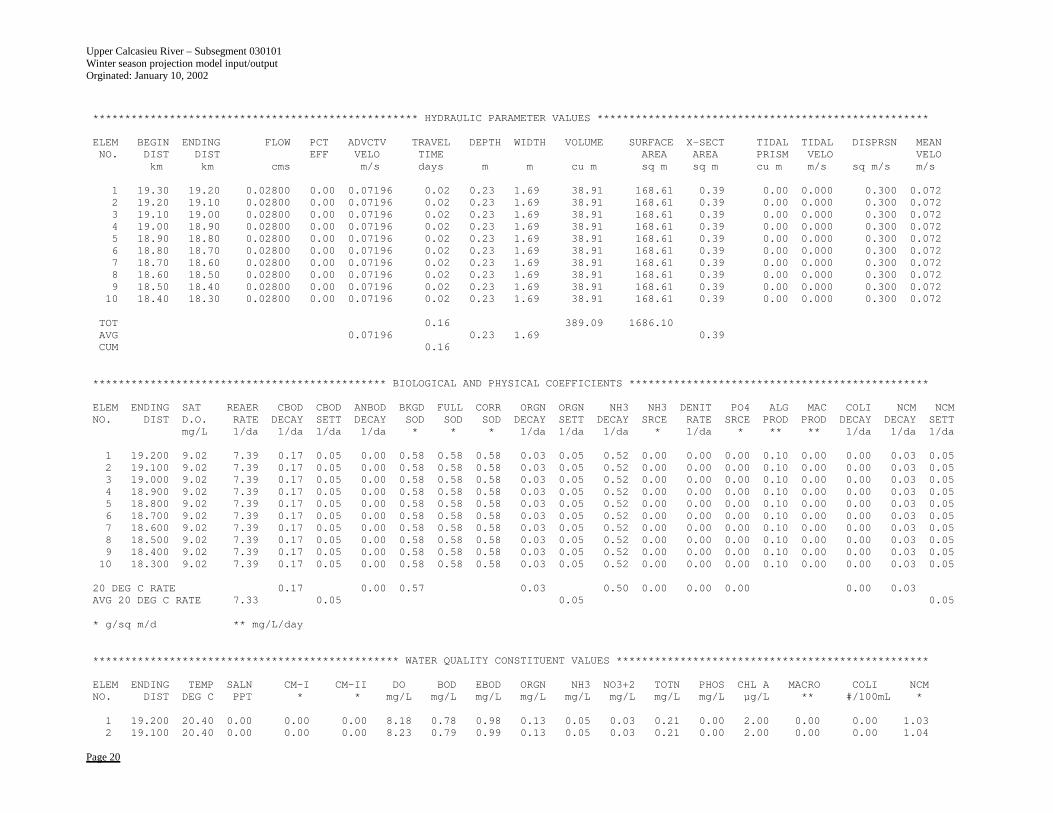
Upper Calcasieu River – Subsegment 030101 Winter season projection model input/output Orginated: January 10, 2002
Page 20
*************************************************** HYDRAULIC PARAMETER VALUES ****************************************************
ELEM BEGIN ENDING FLOW PCT ADVCTV TRAVEL DEPTH WIDTH VOLUME SURFACE X-SECT TIDAL TIDAL DISPRSN MEANNO. DIST DIST EFF VELO TIME AREA AREA PRISM VELO VELO
km km cms m/s days m m cu m sq m sq m cu m m/s sq m/s m/s
1 19.30 19.20 0.02800 0.00 0.07196 0.02 0.23 1.69 38.91 168.61 0.39 0.00 0.000 0.300 0.0722 19.20 19.10 0.02800 0.00 0.07196 0.02 0.23 1.69 38.91 168.61 0.39 0.00 0.000 0.300 0.0723 19.10 19.00 0.02800 0.00 0.07196 0.02 0.23 1.69 38.91 168.61 0.39 0.00 0.000 0.300 0.0724 19.00 18.90 0.02800 0.00 0.07196 0.02 0.23 1.69 38.91 168.61 0.39 0.00 0.000 0.300 0.0725 18.90 18.80 0.02800 0.00 0.07196 0.02 0.23 1.69 38.91 168.61 0.39 0.00 0.000 0.300 0.0726 18.80 18.70 0.02800 0.00 0.07196 0.02 0.23 1.69 38.91 168.61 0.39 0.00 0.000 0.300 0.0727 18.70 18.60 0.02800 0.00 0.07196 0.02 0.23 1.69 38.91 168.61 0.39 0.00 0.000 0.300 0.0728 18.60 18.50 0.02800 0.00 0.07196 0.02 0.23 1.69 38.91 168.61 0.39 0.00 0.000 0.300 0.0729 18.50 18.40 0.02800 0.00 0.07196 0.02 0.23 1.69 38.91 168.61 0.39 0.00 0.000 0.300 0.07210 18.40 18.30 0.02800 0.00 0.07196 0.02 0.23 1.69 38.91 168.61 0.39 0.00 0.000 0.300 0.072
TOT 0.16 389.09 1686.10AVG 0.07196 0.23 1.69 0.39CUM 0.16
********************************************** BIOLOGICAL AND PHYSICAL COEFFICIENTS ***********************************************
ELEM ENDING SAT REAER CBOD CBOD ANBOD BKGD FULL CORR ORGN ORGN NH3 NH3 DENIT PO4 ALG MAC COLI NCM NCMNO. DIST D.O. RATE DECAY SETT DECAY SOD SOD SOD DECAY SETT DECAY SRCE RATE SRCE PROD PROD DECAY DECAY SETT
mg/L 1/da 1/da 1/da 1/da * * * 1/da 1/da 1/da * 1/da * ** ** 1/da 1/da 1/da
1 19.200 9.02 7.39 0.17 0.05 0.00 0.58 0.58 0.58 0.03 0.05 0.52 0.00 0.00 0.00 0.10 0.00 0.00 0.03 0.052 19.100 9.02 7.39 0.17 0.05 0.00 0.58 0.58 0.58 0.03 0.05 0.52 0.00 0.00 0.00 0.10 0.00 0.00 0.03 0.053 19.000 9.02 7.39 0.17 0.05 0.00 0.58 0.58 0.58 0.03 0.05 0.52 0.00 0.00 0.00 0.10 0.00 0.00 0.03 0.054 18.900 9.02 7.39 0.17 0.05 0.00 0.58 0.58 0.58 0.03 0.05 0.52 0.00 0.00 0.00 0.10 0.00 0.00 0.03 0.055 18.800 9.02 7.39 0.17 0.05 0.00 0.58 0.58 0.58 0.03 0.05 0.52 0.00 0.00 0.00 0.10 0.00 0.00 0.03 0.056 18.700 9.02 7.39 0.17 0.05 0.00 0.58 0.58 0.58 0.03 0.05 0.52 0.00 0.00 0.00 0.10 0.00 0.00 0.03 0.057 18.600 9.02 7.39 0.17 0.05 0.00 0.58 0.58 0.58 0.03 0.05 0.52 0.00 0.00 0.00 0.10 0.00 0.00 0.03 0.058 18.500 9.02 7.39 0.17 0.05 0.00 0.58 0.58 0.58 0.03 0.05 0.52 0.00 0.00 0.00 0.10 0.00 0.00 0.03 0.059 18.400 9.02 7.39 0.17 0.05 0.00 0.58 0.58 0.58 0.03 0.05 0.52 0.00 0.00 0.00 0.10 0.00 0.00 0.03 0.0510 18.300 9.02 7.39 0.17 0.05 0.00 0.58 0.58 0.58 0.03 0.05 0.52 0.00 0.00 0.00 0.10 0.00 0.00 0.03 0.05
20 DEG C RATE 0.17 0.00 0.57 0.03 0.50 0.00 0.00 0.00 0.00 0.03AVG 20 DEG C RATE 7.33 0.05 0.05 0.05
* g/sq m/d ** mg/L/day
************************************************ WATER QUALITY CONSTITUENT VALUES *************************************************
ELEM ENDING TEMP SALN CM-I CM-II DO BOD EBOD ORGN NH3 NO3+2 TOTN PHOS CHL A MACRO COLI NCMNO. DIST DEG C PPT * * mg/L mg/L mg/L mg/L mg/L mg/L mg/L mg/L µg/L ** #/100mL *
1 19.200 20.40 0.00 0.00 0.00 8.18 0.78 0.98 0.13 0.05 0.03 0.21 0.00 2.00 0.00 0.00 1.032 19.100 20.40 0.00 0.00 0.00 8.23 0.79 0.99 0.13 0.05 0.03 0.21 0.00 2.00 0.00 0.00 1.04
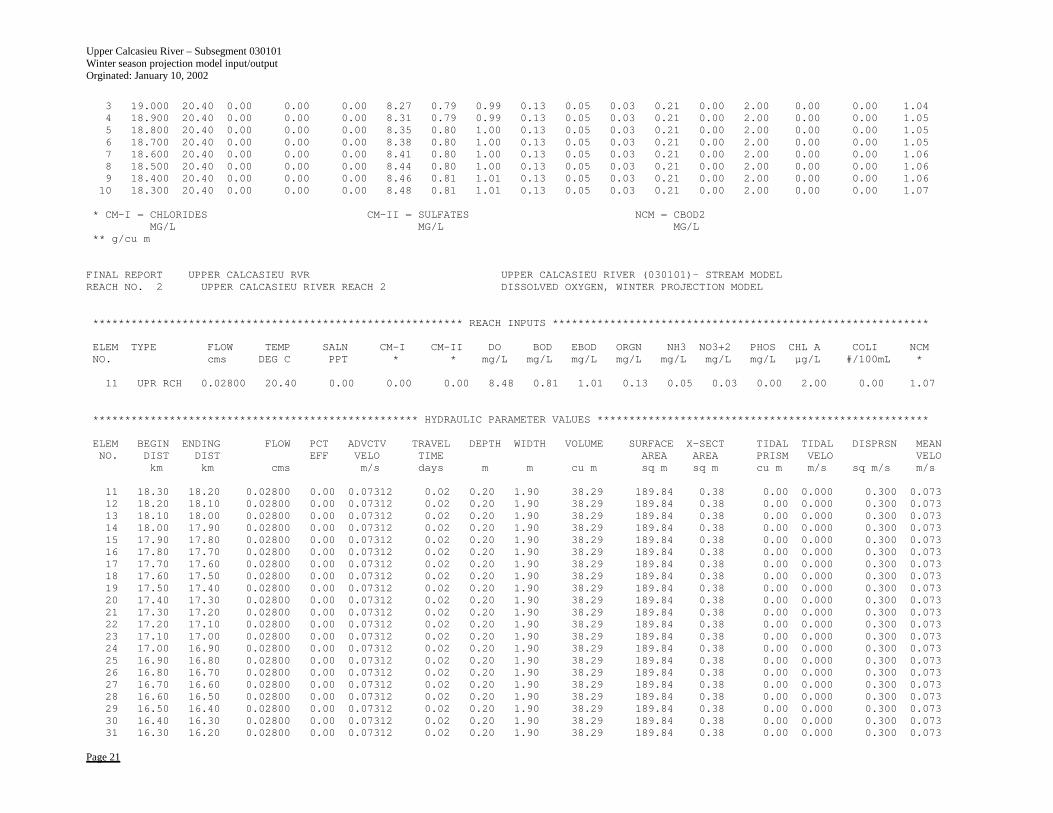
Upper Calcasieu River – Subsegment 030101 Winter season projection model input/output Orginated: January 10, 2002
Page 21
3 19.000 20.40 0.00 0.00 0.00 8.27 0.79 0.99 0.13 0.05 0.03 0.21 0.00 2.00 0.00 0.00 1.044 18.900 20.40 0.00 0.00 0.00 8.31 0.79 0.99 0.13 0.05 0.03 0.21 0.00 2.00 0.00 0.00 1.055 18.800 20.40 0.00 0.00 0.00 8.35 0.80 1.00 0.13 0.05 0.03 0.21 0.00 2.00 0.00 0.00 1.056 18.700 20.40 0.00 0.00 0.00 8.38 0.80 1.00 0.13 0.05 0.03 0.21 0.00 2.00 0.00 0.00 1.057 18.600 20.40 0.00 0.00 0.00 8.41 0.80 1.00 0.13 0.05 0.03 0.21 0.00 2.00 0.00 0.00 1.068 18.500 20.40 0.00 0.00 0.00 8.44 0.80 1.00 0.13 0.05 0.03 0.21 0.00 2.00 0.00 0.00 1.069 18.400 20.40 0.00 0.00 0.00 8.46 0.81 1.01 0.13 0.05 0.03 0.21 0.00 2.00 0.00 0.00 1.0610 18.300 20.40 0.00 0.00 0.00 8.48 0.81 1.01 0.13 0.05 0.03 0.21 0.00 2.00 0.00 0.00 1.07
* CM-I = CHLORIDES CM-II = SULFATES NCM = CBOD2MG/L MG/L MG/L
** g/cu m
FINAL REPORT UPPER CALCASIEU RVR UPPER CALCASIEU RIVER (030101)- STREAM MODELREACH NO. 2 UPPER CALCASIEU RIVER REACH 2 DISSOLVED OXYGEN, WINTER PROJECTION MODEL
********************************************************** REACH INPUTS ***********************************************************
ELEM TYPE FLOW TEMP SALN CM-I CM-II DO BOD EBOD ORGN NH3 NO3+2 PHOS CHL A COLI NCMNO. cms DEG C PPT * * mg/L mg/L mg/L mg/L mg/L mg/L mg/L µg/L #/100mL *
11 UPR RCH 0.02800 20.40 0.00 0.00 0.00 8.48 0.81 1.01 0.13 0.05 0.03 0.00 2.00 0.00 1.07
*************************************************** HYDRAULIC PARAMETER VALUES ****************************************************
ELEM BEGIN ENDING FLOW PCT ADVCTV TRAVEL DEPTH WIDTH VOLUME SURFACE X-SECT TIDAL TIDAL DISPRSN MEANNO. DIST DIST EFF VELO TIME AREA AREA PRISM VELO VELO
km km cms m/s days m m cu m sq m sq m cu m m/s sq m/s m/s
11 18.30 18.20 0.02800 0.00 0.07312 0.02 0.20 1.90 38.29 189.84 0.38 0.00 0.000 0.300 0.07312 18.20 18.10 0.02800 0.00 0.07312 0.02 0.20 1.90 38.29 189.84 0.38 0.00 0.000 0.300 0.07313 18.10 18.00 0.02800 0.00 0.07312 0.02 0.20 1.90 38.29 189.84 0.38 0.00 0.000 0.300 0.07314 18.00 17.90 0.02800 0.00 0.07312 0.02 0.20 1.90 38.29 189.84 0.38 0.00 0.000 0.300 0.07315 17.90 17.80 0.02800 0.00 0.07312 0.02 0.20 1.90 38.29 189.84 0.38 0.00 0.000 0.300 0.07316 17.80 17.70 0.02800 0.00 0.07312 0.02 0.20 1.90 38.29 189.84 0.38 0.00 0.000 0.300 0.07317 17.70 17.60 0.02800 0.00 0.07312 0.02 0.20 1.90 38.29 189.84 0.38 0.00 0.000 0.300 0.07318 17.60 17.50 0.02800 0.00 0.07312 0.02 0.20 1.90 38.29 189.84 0.38 0.00 0.000 0.300 0.07319 17.50 17.40 0.02800 0.00 0.07312 0.02 0.20 1.90 38.29 189.84 0.38 0.00 0.000 0.300 0.07320 17.40 17.30 0.02800 0.00 0.07312 0.02 0.20 1.90 38.29 189.84 0.38 0.00 0.000 0.300 0.07321 17.30 17.20 0.02800 0.00 0.07312 0.02 0.20 1.90 38.29 189.84 0.38 0.00 0.000 0.300 0.07322 17.20 17.10 0.02800 0.00 0.07312 0.02 0.20 1.90 38.29 189.84 0.38 0.00 0.000 0.300 0.07323 17.10 17.00 0.02800 0.00 0.07312 0.02 0.20 1.90 38.29 189.84 0.38 0.00 0.000 0.300 0.07324 17.00 16.90 0.02800 0.00 0.07312 0.02 0.20 1.90 38.29 189.84 0.38 0.00 0.000 0.300 0.07325 16.90 16.80 0.02800 0.00 0.07312 0.02 0.20 1.90 38.29 189.84 0.38 0.00 0.000 0.300 0.07326 16.80 16.70 0.02800 0.00 0.07312 0.02 0.20 1.90 38.29 189.84 0.38 0.00 0.000 0.300 0.07327 16.70 16.60 0.02800 0.00 0.07312 0.02 0.20 1.90 38.29 189.84 0.38 0.00 0.000 0.300 0.07328 16.60 16.50 0.02800 0.00 0.07312 0.02 0.20 1.90 38.29 189.84 0.38 0.00 0.000 0.300 0.07329 16.50 16.40 0.02800 0.00 0.07312 0.02 0.20 1.90 38.29 189.84 0.38 0.00 0.000 0.300 0.07330 16.40 16.30 0.02800 0.00 0.07312 0.02 0.20 1.90 38.29 189.84 0.38 0.00 0.000 0.300 0.07331 16.30 16.20 0.02800 0.00 0.07312 0.02 0.20 1.90 38.29 189.84 0.38 0.00 0.000 0.300 0.073
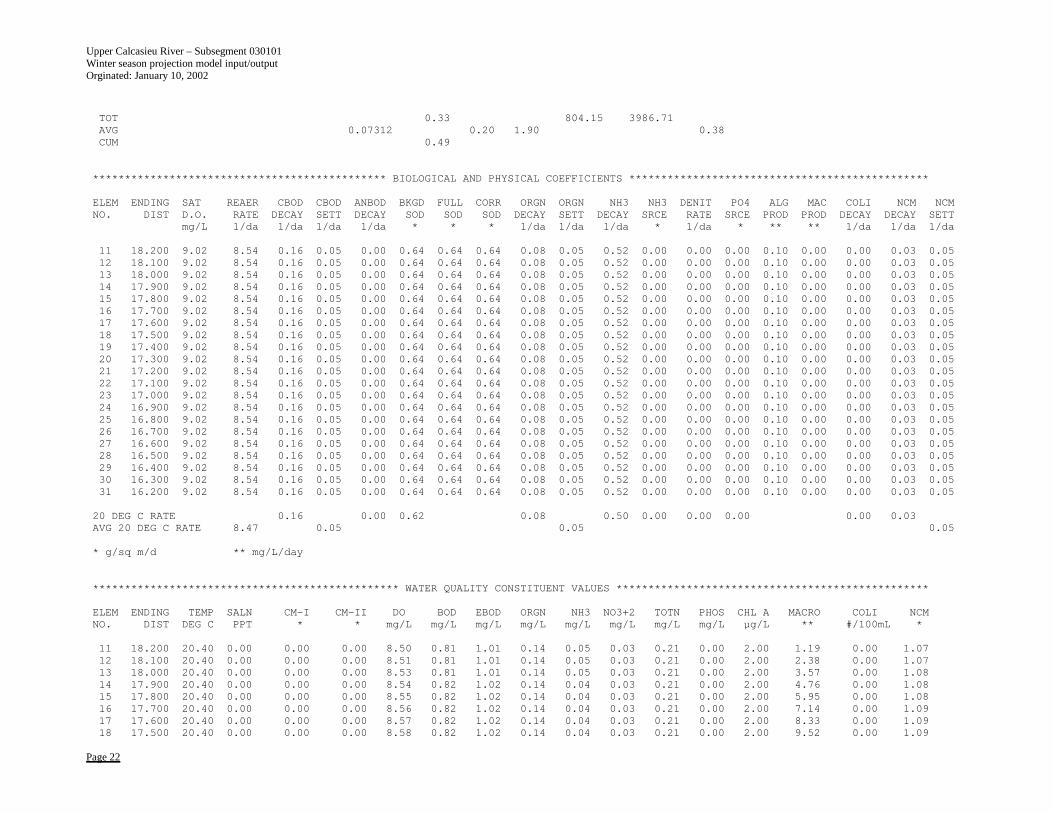
Upper Calcasieu River – Subsegment 030101 Winter season projection model input/output Orginated: January 10, 2002
Page 22
TOT 0.33 804.15 3986.71AVG 0.07312 0.20 1.90 0.38CUM 0.49
********************************************** BIOLOGICAL AND PHYSICAL COEFFICIENTS ***********************************************
ELEM ENDING SAT REAER CBOD CBOD ANBOD BKGD FULL CORR ORGN ORGN NH3 NH3 DENIT PO4 ALG MAC COLI NCM NCMNO. DIST D.O. RATE DECAY SETT DECAY SOD SOD SOD DECAY SETT DECAY SRCE RATE SRCE PROD PROD DECAY DECAY SETT
mg/L 1/da 1/da 1/da 1/da * * * 1/da 1/da 1/da * 1/da * ** ** 1/da 1/da 1/da
11 18.200 9.02 8.54 0.16 0.05 0.00 0.64 0.64 0.64 0.08 0.05 0.52 0.00 0.00 0.00 0.10 0.00 0.00 0.03 0.0512 18.100 9.02 8.54 0.16 0.05 0.00 0.64 0.64 0.64 0.08 0.05 0.52 0.00 0.00 0.00 0.10 0.00 0.00 0.03 0.0513 18.000 9.02 8.54 0.16 0.05 0.00 0.64 0.64 0.64 0.08 0.05 0.52 0.00 0.00 0.00 0.10 0.00 0.00 0.03 0.0514 17.900 9.02 8.54 0.16 0.05 0.00 0.64 0.64 0.64 0.08 0.05 0.52 0.00 0.00 0.00 0.10 0.00 0.00 0.03 0.0515 17.800 9.02 8.54 0.16 0.05 0.00 0.64 0.64 0.64 0.08 0.05 0.52 0.00 0.00 0.00 0.10 0.00 0.00 0.03 0.0516 17.700 9.02 8.54 0.16 0.05 0.00 0.64 0.64 0.64 0.08 0.05 0.52 0.00 0.00 0.00 0.10 0.00 0.00 0.03 0.0517 17.600 9.02 8.54 0.16 0.05 0.00 0.64 0.64 0.64 0.08 0.05 0.52 0.00 0.00 0.00 0.10 0.00 0.00 0.03 0.0518 17.500 9.02 8.54 0.16 0.05 0.00 0.64 0.64 0.64 0.08 0.05 0.52 0.00 0.00 0.00 0.10 0.00 0.00 0.03 0.0519 17.400 9.02 8.54 0.16 0.05 0.00 0.64 0.64 0.64 0.08 0.05 0.52 0.00 0.00 0.00 0.10 0.00 0.00 0.03 0.0520 17.300 9.02 8.54 0.16 0.05 0.00 0.64 0.64 0.64 0.08 0.05 0.52 0.00 0.00 0.00 0.10 0.00 0.00 0.03 0.0521 17.200 9.02 8.54 0.16 0.05 0.00 0.64 0.64 0.64 0.08 0.05 0.52 0.00 0.00 0.00 0.10 0.00 0.00 0.03 0.0522 17.100 9.02 8.54 0.16 0.05 0.00 0.64 0.64 0.64 0.08 0.05 0.52 0.00 0.00 0.00 0.10 0.00 0.00 0.03 0.0523 17.000 9.02 8.54 0.16 0.05 0.00 0.64 0.64 0.64 0.08 0.05 0.52 0.00 0.00 0.00 0.10 0.00 0.00 0.03 0.0524 16.900 9.02 8.54 0.16 0.05 0.00 0.64 0.64 0.64 0.08 0.05 0.52 0.00 0.00 0.00 0.10 0.00 0.00 0.03 0.0525 16.800 9.02 8.54 0.16 0.05 0.00 0.64 0.64 0.64 0.08 0.05 0.52 0.00 0.00 0.00 0.10 0.00 0.00 0.03 0.0526 16.700 9.02 8.54 0.16 0.05 0.00 0.64 0.64 0.64 0.08 0.05 0.52 0.00 0.00 0.00 0.10 0.00 0.00 0.03 0.0527 16.600 9.02 8.54 0.16 0.05 0.00 0.64 0.64 0.64 0.08 0.05 0.52 0.00 0.00 0.00 0.10 0.00 0.00 0.03 0.0528 16.500 9.02 8.54 0.16 0.05 0.00 0.64 0.64 0.64 0.08 0.05 0.52 0.00 0.00 0.00 0.10 0.00 0.00 0.03 0.0529 16.400 9.02 8.54 0.16 0.05 0.00 0.64 0.64 0.64 0.08 0.05 0.52 0.00 0.00 0.00 0.10 0.00 0.00 0.03 0.0530 16.300 9.02 8.54 0.16 0.05 0.00 0.64 0.64 0.64 0.08 0.05 0.52 0.00 0.00 0.00 0.10 0.00 0.00 0.03 0.0531 16.200 9.02 8.54 0.16 0.05 0.00 0.64 0.64 0.64 0.08 0.05 0.52 0.00 0.00 0.00 0.10 0.00 0.00 0.03 0.05
20 DEG C RATE 0.16 0.00 0.62 0.08 0.50 0.00 0.00 0.00 0.00 0.03AVG 20 DEG C RATE 8.47 0.05 0.05 0.05
* g/sq m/d ** mg/L/day
************************************************ WATER QUALITY CONSTITUENT VALUES *************************************************
ELEM ENDING TEMP SALN CM-I CM-II DO BOD EBOD ORGN NH3 NO3+2 TOTN PHOS CHL A MACRO COLI NCMNO. DIST DEG C PPT * * mg/L mg/L mg/L mg/L mg/L mg/L mg/L mg/L µg/L ** #/100mL *
11 18.200 20.40 0.00 0.00 0.00 8.50 0.81 1.01 0.14 0.05 0.03 0.21 0.00 2.00 1.19 0.00 1.0712 18.100 20.40 0.00 0.00 0.00 8.51 0.81 1.01 0.14 0.05 0.03 0.21 0.00 2.00 2.38 0.00 1.0713 18.000 20.40 0.00 0.00 0.00 8.53 0.81 1.01 0.14 0.05 0.03 0.21 0.00 2.00 3.57 0.00 1.0814 17.900 20.40 0.00 0.00 0.00 8.54 0.82 1.02 0.14 0.04 0.03 0.21 0.00 2.00 4.76 0.00 1.0815 17.800 20.40 0.00 0.00 0.00 8.55 0.82 1.02 0.14 0.04 0.03 0.21 0.00 2.00 5.95 0.00 1.0816 17.700 20.40 0.00 0.00 0.00 8.56 0.82 1.02 0.14 0.04 0.03 0.21 0.00 2.00 7.14 0.00 1.0917 17.600 20.40 0.00 0.00 0.00 8.57 0.82 1.02 0.14 0.04 0.03 0.21 0.00 2.00 8.33 0.00 1.0918 17.500 20.40 0.00 0.00 0.00 8.58 0.82 1.02 0.14 0.04 0.03 0.21 0.00 2.00 9.52 0.00 1.09
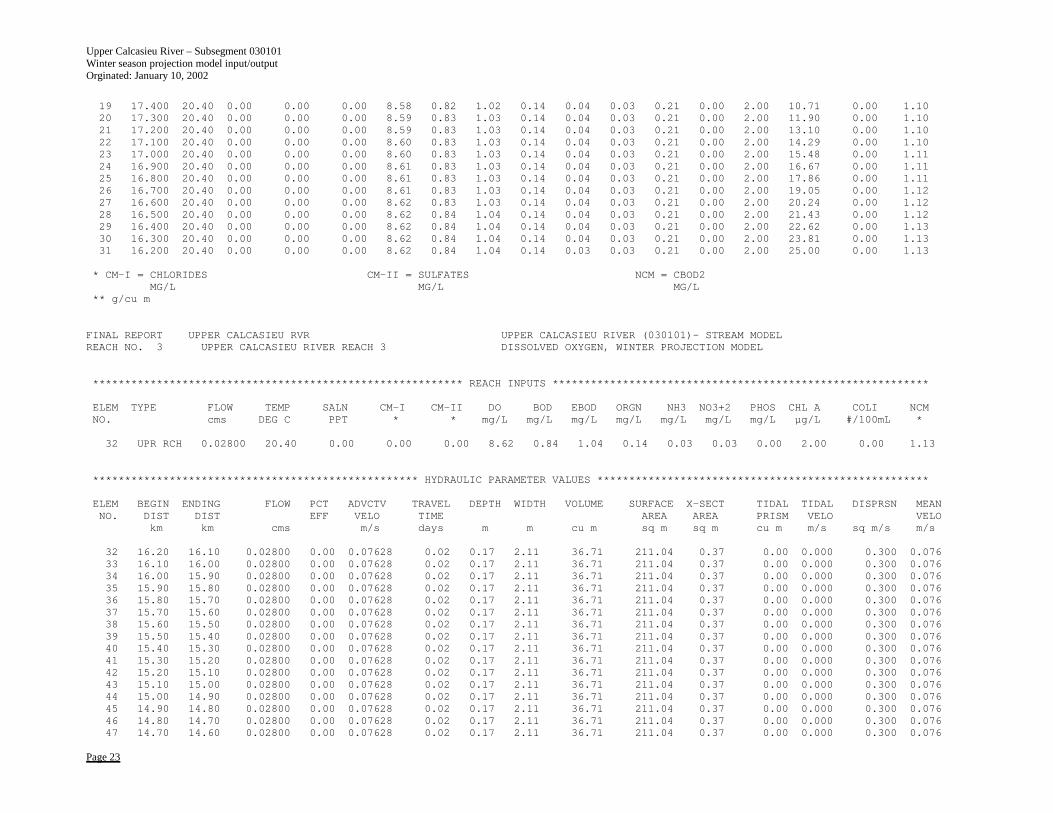
Upper Calcasieu River – Subsegment 030101 Winter season projection model input/output Orginated: January 10, 2002
Page 23
19 17.400 20.40 0.00 0.00 0.00 8.58 0.82 1.02 0.14 0.04 0.03 0.21 0.00 2.00 10.71 0.00 1.1020 17.300 20.40 0.00 0.00 0.00 8.59 0.83 1.03 0.14 0.04 0.03 0.21 0.00 2.00 11.90 0.00 1.1021 17.200 20.40 0.00 0.00 0.00 8.59 0.83 1.03 0.14 0.04 0.03 0.21 0.00 2.00 13.10 0.00 1.1022 17.100 20.40 0.00 0.00 0.00 8.60 0.83 1.03 0.14 0.04 0.03 0.21 0.00 2.00 14.29 0.00 1.1023 17.000 20.40 0.00 0.00 0.00 8.60 0.83 1.03 0.14 0.04 0.03 0.21 0.00 2.00 15.48 0.00 1.1124 16.900 20.40 0.00 0.00 0.00 8.61 0.83 1.03 0.14 0.04 0.03 0.21 0.00 2.00 16.67 0.00 1.1125 16.800 20.40 0.00 0.00 0.00 8.61 0.83 1.03 0.14 0.04 0.03 0.21 0.00 2.00 17.86 0.00 1.1126 16.700 20.40 0.00 0.00 0.00 8.61 0.83 1.03 0.14 0.04 0.03 0.21 0.00 2.00 19.05 0.00 1.1227 16.600 20.40 0.00 0.00 0.00 8.62 0.83 1.03 0.14 0.04 0.03 0.21 0.00 2.00 20.24 0.00 1.1228 16.500 20.40 0.00 0.00 0.00 8.62 0.84 1.04 0.14 0.04 0.03 0.21 0.00 2.00 21.43 0.00 1.1229 16.400 20.40 0.00 0.00 0.00 8.62 0.84 1.04 0.14 0.04 0.03 0.21 0.00 2.00 22.62 0.00 1.1330 16.300 20.40 0.00 0.00 0.00 8.62 0.84 1.04 0.14 0.04 0.03 0.21 0.00 2.00 23.81 0.00 1.1331 16.200 20.40 0.00 0.00 0.00 8.62 0.84 1.04 0.14 0.03 0.03 0.21 0.00 2.00 25.00 0.00 1.13
* CM-I = CHLORIDES CM-II = SULFATES NCM = CBOD2MG/L MG/L MG/L
** g/cu m
FINAL REPORT UPPER CALCASIEU RVR UPPER CALCASIEU RIVER (030101)- STREAM MODELREACH NO. 3 UPPER CALCASIEU RIVER REACH 3 DISSOLVED OXYGEN, WINTER PROJECTION MODEL
********************************************************** REACH INPUTS ***********************************************************
ELEM TYPE FLOW TEMP SALN CM-I CM-II DO BOD EBOD ORGN NH3 NO3+2 PHOS CHL A COLI NCMNO. cms DEG C PPT * * mg/L mg/L mg/L mg/L mg/L mg/L mg/L µg/L #/100mL *
32 UPR RCH 0.02800 20.40 0.00 0.00 0.00 8.62 0.84 1.04 0.14 0.03 0.03 0.00 2.00 0.00 1.13
*************************************************** HYDRAULIC PARAMETER VALUES ****************************************************
ELEM BEGIN ENDING FLOW PCT ADVCTV TRAVEL DEPTH WIDTH VOLUME SURFACE X-SECT TIDAL TIDAL DISPRSN MEANNO. DIST DIST EFF VELO TIME AREA AREA PRISM VELO VELO
km km cms m/s days m m cu m sq m sq m cu m m/s sq m/s m/s
32 16.20 16.10 0.02800 0.00 0.07628 0.02 0.17 2.11 36.71 211.04 0.37 0.00 0.000 0.300 0.07633 16.10 16.00 0.02800 0.00 0.07628 0.02 0.17 2.11 36.71 211.04 0.37 0.00 0.000 0.300 0.07634 16.00 15.90 0.02800 0.00 0.07628 0.02 0.17 2.11 36.71 211.04 0.37 0.00 0.000 0.300 0.07635 15.90 15.80 0.02800 0.00 0.07628 0.02 0.17 2.11 36.71 211.04 0.37 0.00 0.000 0.300 0.07636 15.80 15.70 0.02800 0.00 0.07628 0.02 0.17 2.11 36.71 211.04 0.37 0.00 0.000 0.300 0.07637 15.70 15.60 0.02800 0.00 0.07628 0.02 0.17 2.11 36.71 211.04 0.37 0.00 0.000 0.300 0.07638 15.60 15.50 0.02800 0.00 0.07628 0.02 0.17 2.11 36.71 211.04 0.37 0.00 0.000 0.300 0.07639 15.50 15.40 0.02800 0.00 0.07628 0.02 0.17 2.11 36.71 211.04 0.37 0.00 0.000 0.300 0.07640 15.40 15.30 0.02800 0.00 0.07628 0.02 0.17 2.11 36.71 211.04 0.37 0.00 0.000 0.300 0.07641 15.30 15.20 0.02800 0.00 0.07628 0.02 0.17 2.11 36.71 211.04 0.37 0.00 0.000 0.300 0.07642 15.20 15.10 0.02800 0.00 0.07628 0.02 0.17 2.11 36.71 211.04 0.37 0.00 0.000 0.300 0.07643 15.10 15.00 0.02800 0.00 0.07628 0.02 0.17 2.11 36.71 211.04 0.37 0.00 0.000 0.300 0.07644 15.00 14.90 0.02800 0.00 0.07628 0.02 0.17 2.11 36.71 211.04 0.37 0.00 0.000 0.300 0.07645 14.90 14.80 0.02800 0.00 0.07628 0.02 0.17 2.11 36.71 211.04 0.37 0.00 0.000 0.300 0.07646 14.80 14.70 0.02800 0.00 0.07628 0.02 0.17 2.11 36.71 211.04 0.37 0.00 0.000 0.300 0.07647 14.70 14.60 0.02800 0.00 0.07628 0.02 0.17 2.11 36.71 211.04 0.37 0.00 0.000 0.300 0.076
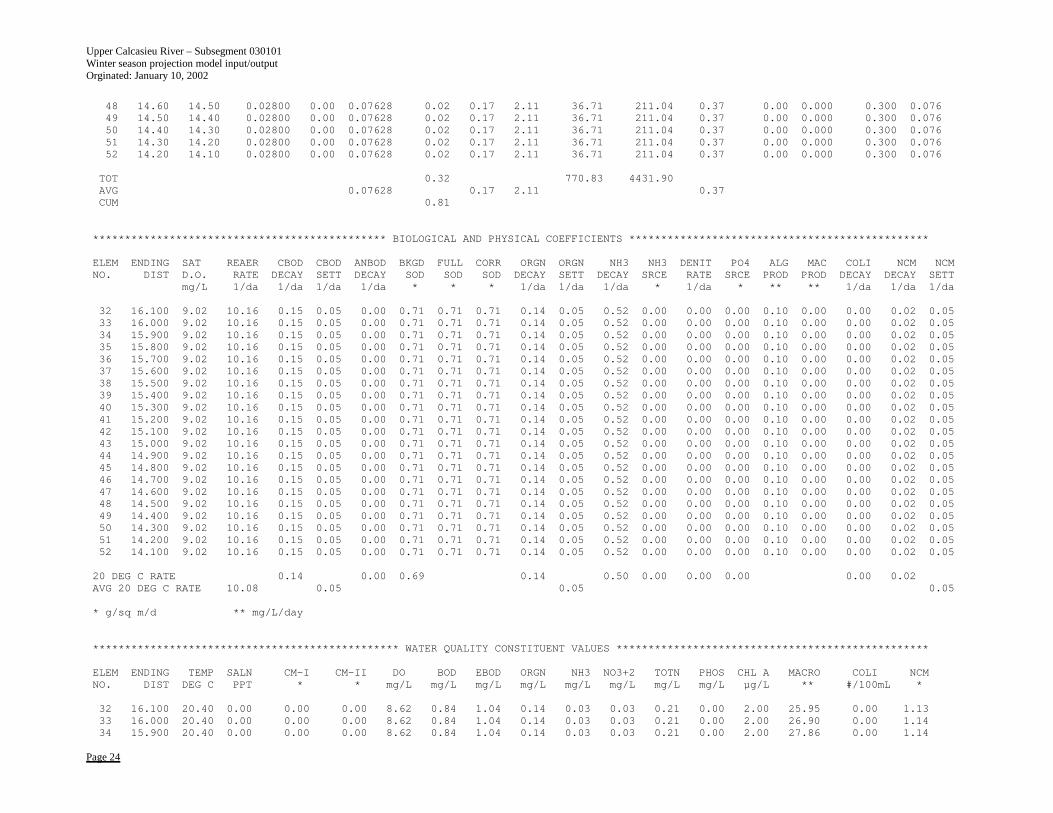
Upper Calcasieu River – Subsegment 030101 Winter season projection model input/output Orginated: January 10, 2002
Page 24
48 14.60 14.50 0.02800 0.00 0.07628 0.02 0.17 2.11 36.71 211.04 0.37 0.00 0.000 0.300 0.07649 14.50 14.40 0.02800 0.00 0.07628 0.02 0.17 2.11 36.71 211.04 0.37 0.00 0.000 0.300 0.07650 14.40 14.30 0.02800 0.00 0.07628 0.02 0.17 2.11 36.71 211.04 0.37 0.00 0.000 0.300 0.07651 14.30 14.20 0.02800 0.00 0.07628 0.02 0.17 2.11 36.71 211.04 0.37 0.00 0.000 0.300 0.07652 14.20 14.10 0.02800 0.00 0.07628 0.02 0.17 2.11 36.71 211.04 0.37 0.00 0.000 0.300 0.076
TOT 0.32 770.83 4431.90AVG 0.07628 0.17 2.11 0.37CUM 0.81
********************************************** BIOLOGICAL AND PHYSICAL COEFFICIENTS ***********************************************
ELEM ENDING SAT REAER CBOD CBOD ANBOD BKGD FULL CORR ORGN ORGN NH3 NH3 DENIT PO4 ALG MAC COLI NCM NCMNO. DIST D.O. RATE DECAY SETT DECAY SOD SOD SOD DECAY SETT DECAY SRCE RATE SRCE PROD PROD DECAY DECAY SETT
mg/L 1/da 1/da 1/da 1/da * * * 1/da 1/da 1/da * 1/da * ** ** 1/da 1/da 1/da
32 16.100 9.02 10.16 0.15 0.05 0.00 0.71 0.71 0.71 0.14 0.05 0.52 0.00 0.00 0.00 0.10 0.00 0.00 0.02 0.0533 16.000 9.02 10.16 0.15 0.05 0.00 0.71 0.71 0.71 0.14 0.05 0.52 0.00 0.00 0.00 0.10 0.00 0.00 0.02 0.0534 15.900 9.02 10.16 0.15 0.05 0.00 0.71 0.71 0.71 0.14 0.05 0.52 0.00 0.00 0.00 0.10 0.00 0.00 0.02 0.0535 15.800 9.02 10.16 0.15 0.05 0.00 0.71 0.71 0.71 0.14 0.05 0.52 0.00 0.00 0.00 0.10 0.00 0.00 0.02 0.0536 15.700 9.02 10.16 0.15 0.05 0.00 0.71 0.71 0.71 0.14 0.05 0.52 0.00 0.00 0.00 0.10 0.00 0.00 0.02 0.0537 15.600 9.02 10.16 0.15 0.05 0.00 0.71 0.71 0.71 0.14 0.05 0.52 0.00 0.00 0.00 0.10 0.00 0.00 0.02 0.0538 15.500 9.02 10.16 0.15 0.05 0.00 0.71 0.71 0.71 0.14 0.05 0.52 0.00 0.00 0.00 0.10 0.00 0.00 0.02 0.0539 15.400 9.02 10.16 0.15 0.05 0.00 0.71 0.71 0.71 0.14 0.05 0.52 0.00 0.00 0.00 0.10 0.00 0.00 0.02 0.0540 15.300 9.02 10.16 0.15 0.05 0.00 0.71 0.71 0.71 0.14 0.05 0.52 0.00 0.00 0.00 0.10 0.00 0.00 0.02 0.0541 15.200 9.02 10.16 0.15 0.05 0.00 0.71 0.71 0.71 0.14 0.05 0.52 0.00 0.00 0.00 0.10 0.00 0.00 0.02 0.0542 15.100 9.02 10.16 0.15 0.05 0.00 0.71 0.71 0.71 0.14 0.05 0.52 0.00 0.00 0.00 0.10 0.00 0.00 0.02 0.0543 15.000 9.02 10.16 0.15 0.05 0.00 0.71 0.71 0.71 0.14 0.05 0.52 0.00 0.00 0.00 0.10 0.00 0.00 0.02 0.0544 14.900 9.02 10.16 0.15 0.05 0.00 0.71 0.71 0.71 0.14 0.05 0.52 0.00 0.00 0.00 0.10 0.00 0.00 0.02 0.0545 14.800 9.02 10.16 0.15 0.05 0.00 0.71 0.71 0.71 0.14 0.05 0.52 0.00 0.00 0.00 0.10 0.00 0.00 0.02 0.0546 14.700 9.02 10.16 0.15 0.05 0.00 0.71 0.71 0.71 0.14 0.05 0.52 0.00 0.00 0.00 0.10 0.00 0.00 0.02 0.0547 14.600 9.02 10.16 0.15 0.05 0.00 0.71 0.71 0.71 0.14 0.05 0.52 0.00 0.00 0.00 0.10 0.00 0.00 0.02 0.0548 14.500 9.02 10.16 0.15 0.05 0.00 0.71 0.71 0.71 0.14 0.05 0.52 0.00 0.00 0.00 0.10 0.00 0.00 0.02 0.0549 14.400 9.02 10.16 0.15 0.05 0.00 0.71 0.71 0.71 0.14 0.05 0.52 0.00 0.00 0.00 0.10 0.00 0.00 0.02 0.0550 14.300 9.02 10.16 0.15 0.05 0.00 0.71 0.71 0.71 0.14 0.05 0.52 0.00 0.00 0.00 0.10 0.00 0.00 0.02 0.0551 14.200 9.02 10.16 0.15 0.05 0.00 0.71 0.71 0.71 0.14 0.05 0.52 0.00 0.00 0.00 0.10 0.00 0.00 0.02 0.0552 14.100 9.02 10.16 0.15 0.05 0.00 0.71 0.71 0.71 0.14 0.05 0.52 0.00 0.00 0.00 0.10 0.00 0.00 0.02 0.05
20 DEG C RATE 0.14 0.00 0.69 0.14 0.50 0.00 0.00 0.00 0.00 0.02AVG 20 DEG C RATE 10.08 0.05 0.05 0.05
* g/sq m/d ** mg/L/day
************************************************ WATER QUALITY CONSTITUENT VALUES *************************************************
ELEM ENDING TEMP SALN CM-I CM-II DO BOD EBOD ORGN NH3 NO3+2 TOTN PHOS CHL A MACRO COLI NCMNO. DIST DEG C PPT * * mg/L mg/L mg/L mg/L mg/L mg/L mg/L mg/L µg/L ** #/100mL *
32 16.100 20.40 0.00 0.00 0.00 8.62 0.84 1.04 0.14 0.03 0.03 0.21 0.00 2.00 25.95 0.00 1.1333 16.000 20.40 0.00 0.00 0.00 8.62 0.84 1.04 0.14 0.03 0.03 0.21 0.00 2.00 26.90 0.00 1.1434 15.900 20.40 0.00 0.00 0.00 8.62 0.84 1.04 0.14 0.03 0.03 0.21 0.00 2.00 27.86 0.00 1.14
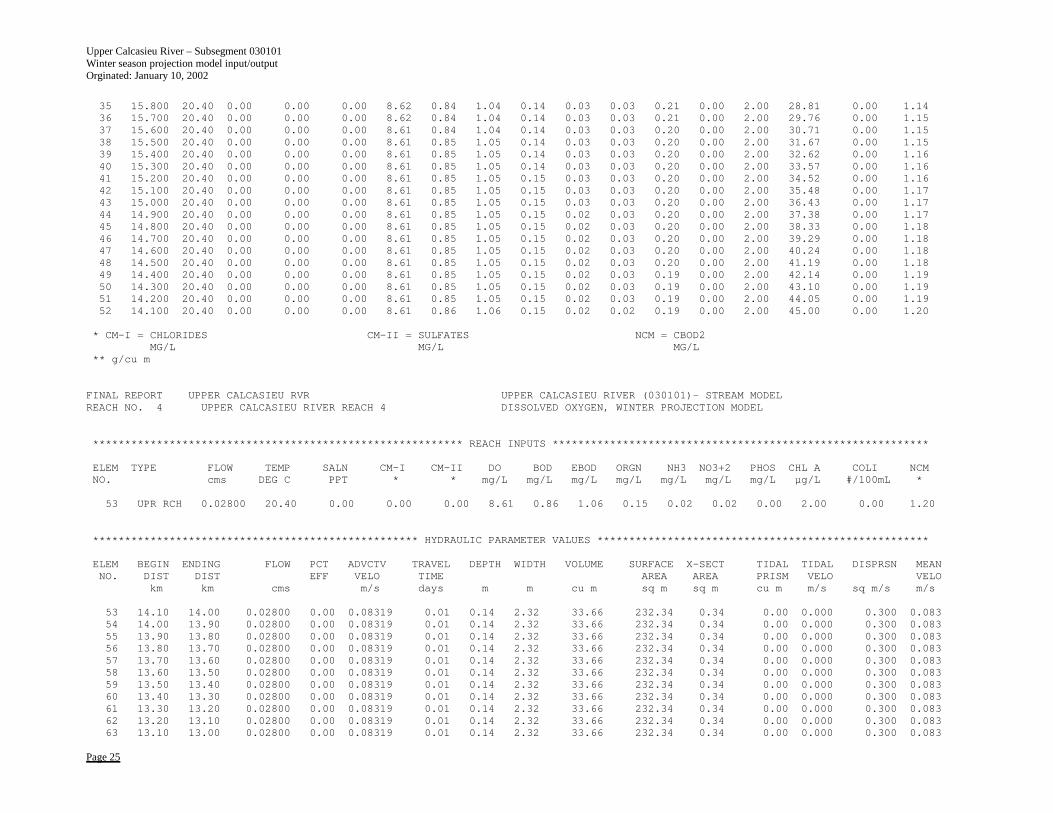
Upper Calcasieu River – Subsegment 030101 Winter season projection model input/output Orginated: January 10, 2002
Page 25
35 15.800 20.40 0.00 0.00 0.00 8.62 0.84 1.04 0.14 0.03 0.03 0.21 0.00 2.00 28.81 0.00 1.1436 15.700 20.40 0.00 0.00 0.00 8.62 0.84 1.04 0.14 0.03 0.03 0.21 0.00 2.00 29.76 0.00 1.1537 15.600 20.40 0.00 0.00 0.00 8.61 0.84 1.04 0.14 0.03 0.03 0.20 0.00 2.00 30.71 0.00 1.1538 15.500 20.40 0.00 0.00 0.00 8.61 0.85 1.05 0.14 0.03 0.03 0.20 0.00 2.00 31.67 0.00 1.1539 15.400 20.40 0.00 0.00 0.00 8.61 0.85 1.05 0.14 0.03 0.03 0.20 0.00 2.00 32.62 0.00 1.1640 15.300 20.40 0.00 0.00 0.00 8.61 0.85 1.05 0.14 0.03 0.03 0.20 0.00 2.00 33.57 0.00 1.1641 15.200 20.40 0.00 0.00 0.00 8.61 0.85 1.05 0.15 0.03 0.03 0.20 0.00 2.00 34.52 0.00 1.1642 15.100 20.40 0.00 0.00 0.00 8.61 0.85 1.05 0.15 0.03 0.03 0.20 0.00 2.00 35.48 0.00 1.1743 15.000 20.40 0.00 0.00 0.00 8.61 0.85 1.05 0.15 0.03 0.03 0.20 0.00 2.00 36.43 0.00 1.1744 14.900 20.40 0.00 0.00 0.00 8.61 0.85 1.05 0.15 0.02 0.03 0.20 0.00 2.00 37.38 0.00 1.1745 14.800 20.40 0.00 0.00 0.00 8.61 0.85 1.05 0.15 0.02 0.03 0.20 0.00 2.00 38.33 0.00 1.1846 14.700 20.40 0.00 0.00 0.00 8.61 0.85 1.05 0.15 0.02 0.03 0.20 0.00 2.00 39.29 0.00 1.1847 14.600 20.40 0.00 0.00 0.00 8.61 0.85 1.05 0.15 0.02 0.03 0.20 0.00 2.00 40.24 0.00 1.1848 14.500 20.40 0.00 0.00 0.00 8.61 0.85 1.05 0.15 0.02 0.03 0.20 0.00 2.00 41.19 0.00 1.1849 14.400 20.40 0.00 0.00 0.00 8.61 0.85 1.05 0.15 0.02 0.03 0.19 0.00 2.00 42.14 0.00 1.1950 14.300 20.40 0.00 0.00 0.00 8.61 0.85 1.05 0.15 0.02 0.03 0.19 0.00 2.00 43.10 0.00 1.1951 14.200 20.40 0.00 0.00 0.00 8.61 0.85 1.05 0.15 0.02 0.03 0.19 0.00 2.00 44.05 0.00 1.1952 14.100 20.40 0.00 0.00 0.00 8.61 0.86 1.06 0.15 0.02 0.02 0.19 0.00 2.00 45.00 0.00 1.20
* CM-I = CHLORIDES CM-II = SULFATES NCM = CBOD2MG/L MG/L MG/L
** g/cu m
FINAL REPORT UPPER CALCASIEU RVR UPPER CALCASIEU RIVER (030101)- STREAM MODELREACH NO. 4 UPPER CALCASIEU RIVER REACH 4 DISSOLVED OXYGEN, WINTER PROJECTION MODEL
********************************************************** REACH INPUTS ***********************************************************
ELEM TYPE FLOW TEMP SALN CM-I CM-II DO BOD EBOD ORGN NH3 NO3+2 PHOS CHL A COLI NCMNO. cms DEG C PPT * * mg/L mg/L mg/L mg/L mg/L mg/L mg/L µg/L #/100mL *
53 UPR RCH 0.02800 20.40 0.00 0.00 0.00 8.61 0.86 1.06 0.15 0.02 0.02 0.00 2.00 0.00 1.20
*************************************************** HYDRAULIC PARAMETER VALUES ****************************************************
ELEM BEGIN ENDING FLOW PCT ADVCTV TRAVEL DEPTH WIDTH VOLUME SURFACE X-SECT TIDAL TIDAL DISPRSN MEANNO. DIST DIST EFF VELO TIME AREA AREA PRISM VELO VELO
km km cms m/s days m m cu m sq m sq m cu m m/s sq m/s m/s
53 14.10 14.00 0.02800 0.00 0.08319 0.01 0.14 2.32 33.66 232.34 0.34 0.00 0.000 0.300 0.08354 14.00 13.90 0.02800 0.00 0.08319 0.01 0.14 2.32 33.66 232.34 0.34 0.00 0.000 0.300 0.08355 13.90 13.80 0.02800 0.00 0.08319 0.01 0.14 2.32 33.66 232.34 0.34 0.00 0.000 0.300 0.08356 13.80 13.70 0.02800 0.00 0.08319 0.01 0.14 2.32 33.66 232.34 0.34 0.00 0.000 0.300 0.08357 13.70 13.60 0.02800 0.00 0.08319 0.01 0.14 2.32 33.66 232.34 0.34 0.00 0.000 0.300 0.08358 13.60 13.50 0.02800 0.00 0.08319 0.01 0.14 2.32 33.66 232.34 0.34 0.00 0.000 0.300 0.08359 13.50 13.40 0.02800 0.00 0.08319 0.01 0.14 2.32 33.66 232.34 0.34 0.00 0.000 0.300 0.08360 13.40 13.30 0.02800 0.00 0.08319 0.01 0.14 2.32 33.66 232.34 0.34 0.00 0.000 0.300 0.08361 13.30 13.20 0.02800 0.00 0.08319 0.01 0.14 2.32 33.66 232.34 0.34 0.00 0.000 0.300 0.08362 13.20 13.10 0.02800 0.00 0.08319 0.01 0.14 2.32 33.66 232.34 0.34 0.00 0.000 0.300 0.08363 13.10 13.00 0.02800 0.00 0.08319 0.01 0.14 2.32 33.66 232.34 0.34 0.00 0.000 0.300 0.083
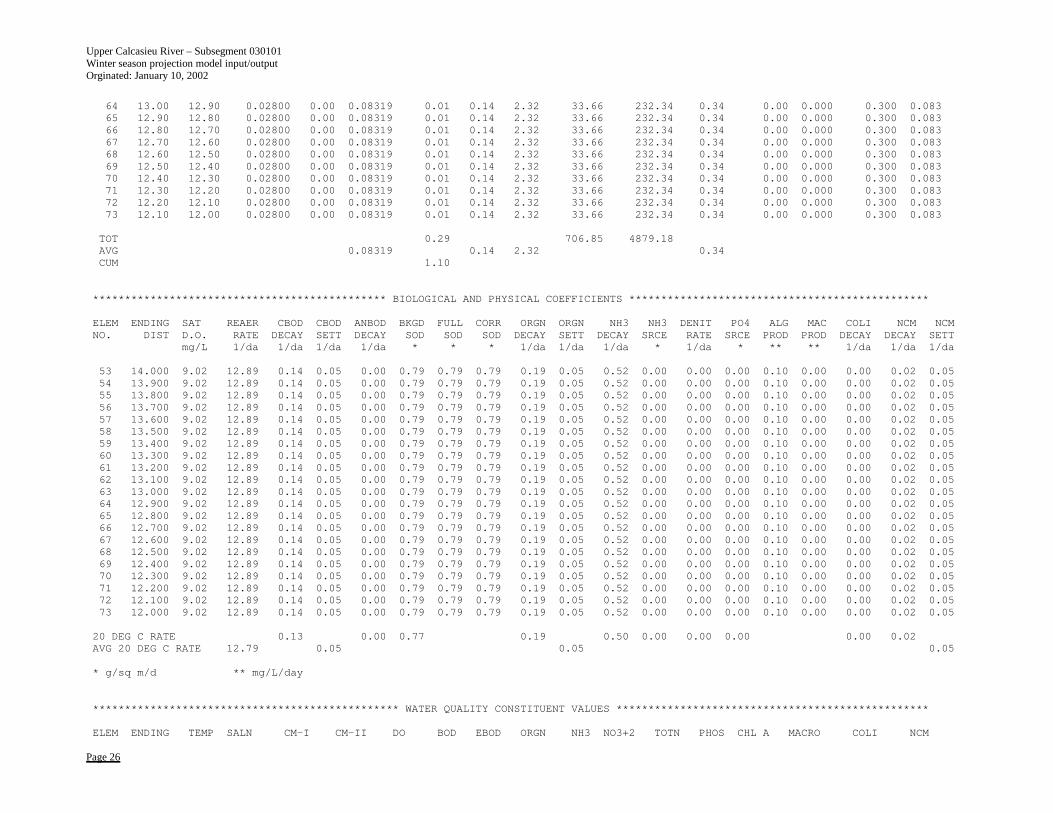
Upper Calcasieu River – Subsegment 030101 Winter season projection model input/output Orginated: January 10, 2002
Page 26
64 13.00 12.90 0.02800 0.00 0.08319 0.01 0.14 2.32 33.66 232.34 0.34 0.00 0.000 0.300 0.08365 12.90 12.80 0.02800 0.00 0.08319 0.01 0.14 2.32 33.66 232.34 0.34 0.00 0.000 0.300 0.08366 12.80 12.70 0.02800 0.00 0.08319 0.01 0.14 2.32 33.66 232.34 0.34 0.00 0.000 0.300 0.08367 12.70 12.60 0.02800 0.00 0.08319 0.01 0.14 2.32 33.66 232.34 0.34 0.00 0.000 0.300 0.08368 12.60 12.50 0.02800 0.00 0.08319 0.01 0.14 2.32 33.66 232.34 0.34 0.00 0.000 0.300 0.08369 12.50 12.40 0.02800 0.00 0.08319 0.01 0.14 2.32 33.66 232.34 0.34 0.00 0.000 0.300 0.08370 12.40 12.30 0.02800 0.00 0.08319 0.01 0.14 2.32 33.66 232.34 0.34 0.00 0.000 0.300 0.08371 12.30 12.20 0.02800 0.00 0.08319 0.01 0.14 2.32 33.66 232.34 0.34 0.00 0.000 0.300 0.08372 12.20 12.10 0.02800 0.00 0.08319 0.01 0.14 2.32 33.66 232.34 0.34 0.00 0.000 0.300 0.08373 12.10 12.00 0.02800 0.00 0.08319 0.01 0.14 2.32 33.66 232.34 0.34 0.00 0.000 0.300 0.083
TOT 0.29 706.85 4879.18AVG 0.08319 0.14 2.32 0.34CUM 1.10
********************************************** BIOLOGICAL AND PHYSICAL COEFFICIENTS ***********************************************
ELEM ENDING SAT REAER CBOD CBOD ANBOD BKGD FULL CORR ORGN ORGN NH3 NH3 DENIT PO4 ALG MAC COLI NCM NCMNO. DIST D.O. RATE DECAY SETT DECAY SOD SOD SOD DECAY SETT DECAY SRCE RATE SRCE PROD PROD DECAY DECAY SETT
mg/L 1/da 1/da 1/da 1/da * * * 1/da 1/da 1/da * 1/da * ** ** 1/da 1/da 1/da
53 14.000 9.02 12.89 0.14 0.05 0.00 0.79 0.79 0.79 0.19 0.05 0.52 0.00 0.00 0.00 0.10 0.00 0.00 0.02 0.0554 13.900 9.02 12.89 0.14 0.05 0.00 0.79 0.79 0.79 0.19 0.05 0.52 0.00 0.00 0.00 0.10 0.00 0.00 0.02 0.0555 13.800 9.02 12.89 0.14 0.05 0.00 0.79 0.79 0.79 0.19 0.05 0.52 0.00 0.00 0.00 0.10 0.00 0.00 0.02 0.0556 13.700 9.02 12.89 0.14 0.05 0.00 0.79 0.79 0.79 0.19 0.05 0.52 0.00 0.00 0.00 0.10 0.00 0.00 0.02 0.0557 13.600 9.02 12.89 0.14 0.05 0.00 0.79 0.79 0.79 0.19 0.05 0.52 0.00 0.00 0.00 0.10 0.00 0.00 0.02 0.0558 13.500 9.02 12.89 0.14 0.05 0.00 0.79 0.79 0.79 0.19 0.05 0.52 0.00 0.00 0.00 0.10 0.00 0.00 0.02 0.0559 13.400 9.02 12.89 0.14 0.05 0.00 0.79 0.79 0.79 0.19 0.05 0.52 0.00 0.00 0.00 0.10 0.00 0.00 0.02 0.0560 13.300 9.02 12.89 0.14 0.05 0.00 0.79 0.79 0.79 0.19 0.05 0.52 0.00 0.00 0.00 0.10 0.00 0.00 0.02 0.0561 13.200 9.02 12.89 0.14 0.05 0.00 0.79 0.79 0.79 0.19 0.05 0.52 0.00 0.00 0.00 0.10 0.00 0.00 0.02 0.0562 13.100 9.02 12.89 0.14 0.05 0.00 0.79 0.79 0.79 0.19 0.05 0.52 0.00 0.00 0.00 0.10 0.00 0.00 0.02 0.0563 13.000 9.02 12.89 0.14 0.05 0.00 0.79 0.79 0.79 0.19 0.05 0.52 0.00 0.00 0.00 0.10 0.00 0.00 0.02 0.0564 12.900 9.02 12.89 0.14 0.05 0.00 0.79 0.79 0.79 0.19 0.05 0.52 0.00 0.00 0.00 0.10 0.00 0.00 0.02 0.0565 12.800 9.02 12.89 0.14 0.05 0.00 0.79 0.79 0.79 0.19 0.05 0.52 0.00 0.00 0.00 0.10 0.00 0.00 0.02 0.0566 12.700 9.02 12.89 0.14 0.05 0.00 0.79 0.79 0.79 0.19 0.05 0.52 0.00 0.00 0.00 0.10 0.00 0.00 0.02 0.0567 12.600 9.02 12.89 0.14 0.05 0.00 0.79 0.79 0.79 0.19 0.05 0.52 0.00 0.00 0.00 0.10 0.00 0.00 0.02 0.0568 12.500 9.02 12.89 0.14 0.05 0.00 0.79 0.79 0.79 0.19 0.05 0.52 0.00 0.00 0.00 0.10 0.00 0.00 0.02 0.0569 12.400 9.02 12.89 0.14 0.05 0.00 0.79 0.79 0.79 0.19 0.05 0.52 0.00 0.00 0.00 0.10 0.00 0.00 0.02 0.0570 12.300 9.02 12.89 0.14 0.05 0.00 0.79 0.79 0.79 0.19 0.05 0.52 0.00 0.00 0.00 0.10 0.00 0.00 0.02 0.0571 12.200 9.02 12.89 0.14 0.05 0.00 0.79 0.79 0.79 0.19 0.05 0.52 0.00 0.00 0.00 0.10 0.00 0.00 0.02 0.0572 12.100 9.02 12.89 0.14 0.05 0.00 0.79 0.79 0.79 0.19 0.05 0.52 0.00 0.00 0.00 0.10 0.00 0.00 0.02 0.0573 12.000 9.02 12.89 0.14 0.05 0.00 0.79 0.79 0.79 0.19 0.05 0.52 0.00 0.00 0.00 0.10 0.00 0.00 0.02 0.05
20 DEG C RATE 0.13 0.00 0.77 0.19 0.50 0.00 0.00 0.00 0.00 0.02AVG 20 DEG C RATE 12.79 0.05 0.05 0.05
* g/sq m/d ** mg/L/day
************************************************ WATER QUALITY CONSTITUENT VALUES *************************************************
ELEM ENDING TEMP SALN CM-I CM-II DO BOD EBOD ORGN NH3 NO3+2 TOTN PHOS CHL A MACRO COLI NCM
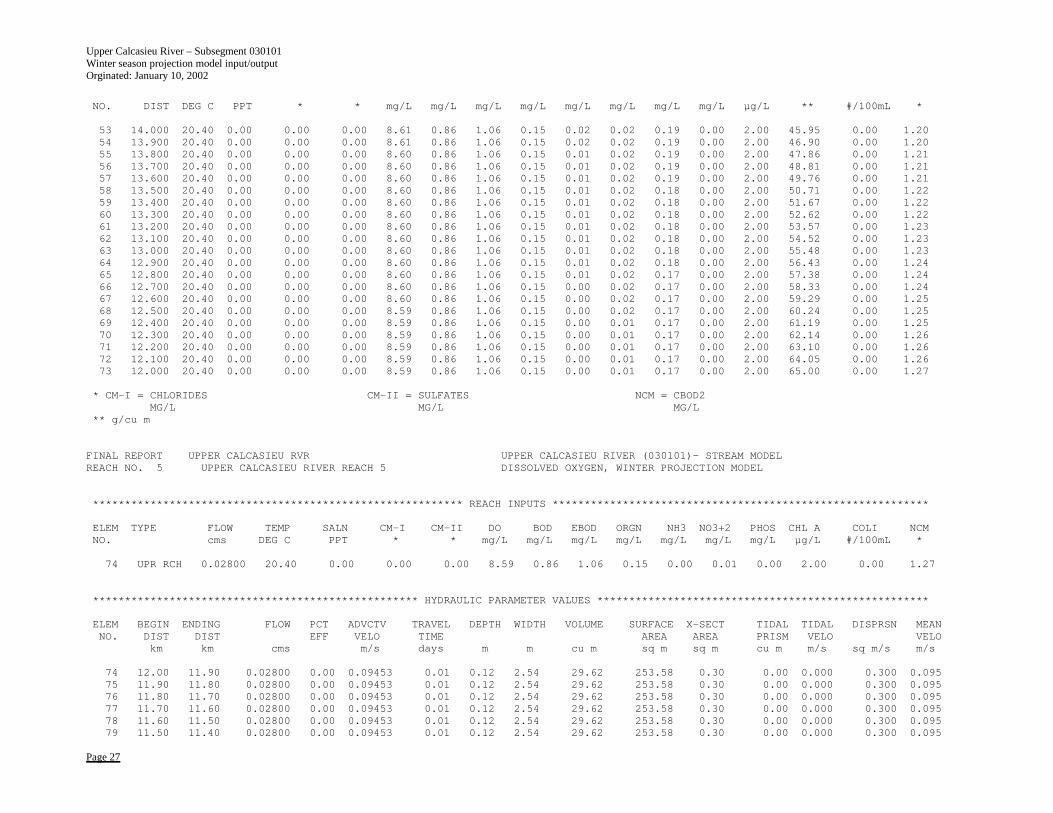
Upper Calcasieu River – Subsegment 030101 Winter season projection model input/output Orginated: January 10, 2002
Page 27
NO. DIST DEG C PPT * * mg/L mg/L mg/L mg/L mg/L mg/L mg/L mg/L µg/L ** #/100mL *
53 14.000 20.40 0.00 0.00 0.00 8.61 0.86 1.06 0.15 0.02 0.02 0.19 0.00 2.00 45.95 0.00 1.2054 13.900 20.40 0.00 0.00 0.00 8.61 0.86 1.06 0.15 0.02 0.02 0.19 0.00 2.00 46.90 0.00 1.2055 13.800 20.40 0.00 0.00 0.00 8.60 0.86 1.06 0.15 0.01 0.02 0.19 0.00 2.00 47.86 0.00 1.2156 13.700 20.40 0.00 0.00 0.00 8.60 0.86 1.06 0.15 0.01 0.02 0.19 0.00 2.00 48.81 0.00 1.2157 13.600 20.40 0.00 0.00 0.00 8.60 0.86 1.06 0.15 0.01 0.02 0.19 0.00 2.00 49.76 0.00 1.2158 13.500 20.40 0.00 0.00 0.00 8.60 0.86 1.06 0.15 0.01 0.02 0.18 0.00 2.00 50.71 0.00 1.2259 13.400 20.40 0.00 0.00 0.00 8.60 0.86 1.06 0.15 0.01 0.02 0.18 0.00 2.00 51.67 0.00 1.2260 13.300 20.40 0.00 0.00 0.00 8.60 0.86 1.06 0.15 0.01 0.02 0.18 0.00 2.00 52.62 0.00 1.2261 13.200 20.40 0.00 0.00 0.00 8.60 0.86 1.06 0.15 0.01 0.02 0.18 0.00 2.00 53.57 0.00 1.2362 13.100 20.40 0.00 0.00 0.00 8.60 0.86 1.06 0.15 0.01 0.02 0.18 0.00 2.00 54.52 0.00 1.2363 13.000 20.40 0.00 0.00 0.00 8.60 0.86 1.06 0.15 0.01 0.02 0.18 0.00 2.00 55.48 0.00 1.2364 12.900 20.40 0.00 0.00 0.00 8.60 0.86 1.06 0.15 0.01 0.02 0.18 0.00 2.00 56.43 0.00 1.2465 12.800 20.40 0.00 0.00 0.00 8.60 0.86 1.06 0.15 0.01 0.02 0.17 0.00 2.00 57.38 0.00 1.2466 12.700 20.40 0.00 0.00 0.00 8.60 0.86 1.06 0.15 0.00 0.02 0.17 0.00 2.00 58.33 0.00 1.2467 12.600 20.40 0.00 0.00 0.00 8.60 0.86 1.06 0.15 0.00 0.02 0.17 0.00 2.00 59.29 0.00 1.2568 12.500 20.40 0.00 0.00 0.00 8.59 0.86 1.06 0.15 0.00 0.02 0.17 0.00 2.00 60.24 0.00 1.2569 12.400 20.40 0.00 0.00 0.00 8.59 0.86 1.06 0.15 0.00 0.01 0.17 0.00 2.00 61.19 0.00 1.2570 12.300 20.40 0.00 0.00 0.00 8.59 0.86 1.06 0.15 0.00 0.01 0.17 0.00 2.00 62.14 0.00 1.2671 12.200 20.40 0.00 0.00 0.00 8.59 0.86 1.06 0.15 0.00 0.01 0.17 0.00 2.00 63.10 0.00 1.2672 12.100 20.40 0.00 0.00 0.00 8.59 0.86 1.06 0.15 0.00 0.01 0.17 0.00 2.00 64.05 0.00 1.2673 12.000 20.40 0.00 0.00 0.00 8.59 0.86 1.06 0.15 0.00 0.01 0.17 0.00 2.00 65.00 0.00 1.27
* CM-I = CHLORIDES CM-II = SULFATES NCM = CBOD2MG/L MG/L MG/L
** g/cu m
FINAL REPORT UPPER CALCASIEU RVR UPPER CALCASIEU RIVER (030101)- STREAM MODELREACH NO. 5 UPPER CALCASIEU RIVER REACH 5 DISSOLVED OXYGEN, WINTER PROJECTION MODEL
********************************************************** REACH INPUTS ***********************************************************
ELEM TYPE FLOW TEMP SALN CM-I CM-II DO BOD EBOD ORGN NH3 NO3+2 PHOS CHL A COLI NCMNO. cms DEG C PPT * * mg/L mg/L mg/L mg/L mg/L mg/L mg/L µg/L #/100mL *
74 UPR RCH 0.02800 20.40 0.00 0.00 0.00 8.59 0.86 1.06 0.15 0.00 0.01 0.00 2.00 0.00 1.27
*************************************************** HYDRAULIC PARAMETER VALUES ****************************************************
ELEM BEGIN ENDING FLOW PCT ADVCTV TRAVEL DEPTH WIDTH VOLUME SURFACE X-SECT TIDAL TIDAL DISPRSN MEANNO. DIST DIST EFF VELO TIME AREA AREA PRISM VELO VELO
km km cms m/s days m m cu m sq m sq m cu m m/s sq m/s m/s
74 12.00 11.90 0.02800 0.00 0.09453 0.01 0.12 2.54 29.62 253.58 0.30 0.00 0.000 0.300 0.09575 11.90 11.80 0.02800 0.00 0.09453 0.01 0.12 2.54 29.62 253.58 0.30 0.00 0.000 0.300 0.09576 11.80 11.70 0.02800 0.00 0.09453 0.01 0.12 2.54 29.62 253.58 0.30 0.00 0.000 0.300 0.09577 11.70 11.60 0.02800 0.00 0.09453 0.01 0.12 2.54 29.62 253.58 0.30 0.00 0.000 0.300 0.09578 11.60 11.50 0.02800 0.00 0.09453 0.01 0.12 2.54 29.62 253.58 0.30 0.00 0.000 0.300 0.09579 11.50 11.40 0.02800 0.00 0.09453 0.01 0.12 2.54 29.62 253.58 0.30 0.00 0.000 0.300 0.095
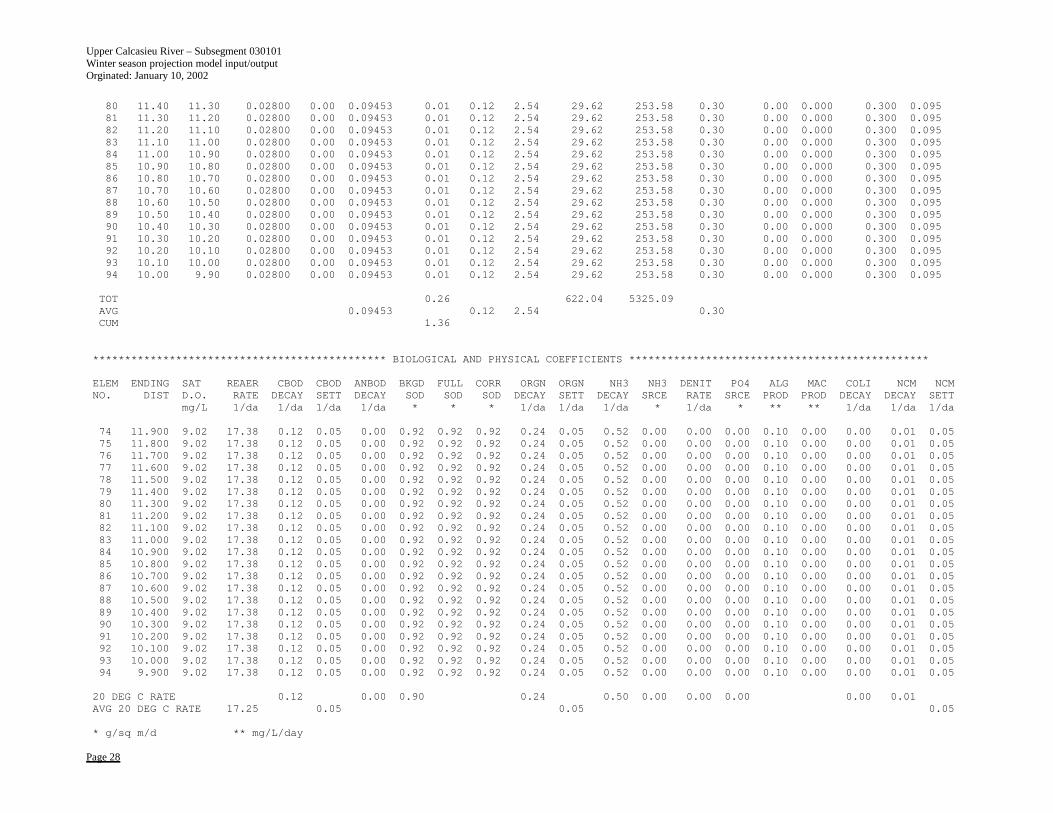
Upper Calcasieu River – Subsegment 030101 Winter season projection model input/output Orginated: January 10, 2002
Page 28
80 11.40 11.30 0.02800 0.00 0.09453 0.01 0.12 2.54 29.62 253.58 0.30 0.00 0.000 0.300 0.09581 11.30 11.20 0.02800 0.00 0.09453 0.01 0.12 2.54 29.62 253.58 0.30 0.00 0.000 0.300 0.09582 11.20 11.10 0.02800 0.00 0.09453 0.01 0.12 2.54 29.62 253.58 0.30 0.00 0.000 0.300 0.09583 11.10 11.00 0.02800 0.00 0.09453 0.01 0.12 2.54 29.62 253.58 0.30 0.00 0.000 0.300 0.09584 11.00 10.90 0.02800 0.00 0.09453 0.01 0.12 2.54 29.62 253.58 0.30 0.00 0.000 0.300 0.09585 10.90 10.80 0.02800 0.00 0.09453 0.01 0.12 2.54 29.62 253.58 0.30 0.00 0.000 0.300 0.09586 10.80 10.70 0.02800 0.00 0.09453 0.01 0.12 2.54 29.62 253.58 0.30 0.00 0.000 0.300 0.09587 10.70 10.60 0.02800 0.00 0.09453 0.01 0.12 2.54 29.62 253.58 0.30 0.00 0.000 0.300 0.09588 10.60 10.50 0.02800 0.00 0.09453 0.01 0.12 2.54 29.62 253.58 0.30 0.00 0.000 0.300 0.09589 10.50 10.40 0.02800 0.00 0.09453 0.01 0.12 2.54 29.62 253.58 0.30 0.00 0.000 0.300 0.09590 10.40 10.30 0.02800 0.00 0.09453 0.01 0.12 2.54 29.62 253.58 0.30 0.00 0.000 0.300 0.09591 10.30 10.20 0.02800 0.00 0.09453 0.01 0.12 2.54 29.62 253.58 0.30 0.00 0.000 0.300 0.09592 10.20 10.10 0.02800 0.00 0.09453 0.01 0.12 2.54 29.62 253.58 0.30 0.00 0.000 0.300 0.09593 10.10 10.00 0.02800 0.00 0.09453 0.01 0.12 2.54 29.62 253.58 0.30 0.00 0.000 0.300 0.09594 10.00 9.90 0.02800 0.00 0.09453 0.01 0.12 2.54 29.62 253.58 0.30 0.00 0.000 0.300 0.095
TOT 0.26 622.04 5325.09AVG 0.09453 0.12 2.54 0.30CUM 1.36
********************************************** BIOLOGICAL AND PHYSICAL COEFFICIENTS ***********************************************
ELEM ENDING SAT REAER CBOD CBOD ANBOD BKGD FULL CORR ORGN ORGN NH3 NH3 DENIT PO4 ALG MAC COLI NCM NCMNO. DIST D.O. RATE DECAY SETT DECAY SOD SOD SOD DECAY SETT DECAY SRCE RATE SRCE PROD PROD DECAY DECAY SETT
mg/L 1/da 1/da 1/da 1/da * * * 1/da 1/da 1/da * 1/da * ** ** 1/da 1/da 1/da
74 11.900 9.02 17.38 0.12 0.05 0.00 0.92 0.92 0.92 0.24 0.05 0.52 0.00 0.00 0.00 0.10 0.00 0.00 0.01 0.0575 11.800 9.02 17.38 0.12 0.05 0.00 0.92 0.92 0.92 0.24 0.05 0.52 0.00 0.00 0.00 0.10 0.00 0.00 0.01 0.0576 11.700 9.02 17.38 0.12 0.05 0.00 0.92 0.92 0.92 0.24 0.05 0.52 0.00 0.00 0.00 0.10 0.00 0.00 0.01 0.0577 11.600 9.02 17.38 0.12 0.05 0.00 0.92 0.92 0.92 0.24 0.05 0.52 0.00 0.00 0.00 0.10 0.00 0.00 0.01 0.0578 11.500 9.02 17.38 0.12 0.05 0.00 0.92 0.92 0.92 0.24 0.05 0.52 0.00 0.00 0.00 0.10 0.00 0.00 0.01 0.0579 11.400 9.02 17.38 0.12 0.05 0.00 0.92 0.92 0.92 0.24 0.05 0.52 0.00 0.00 0.00 0.10 0.00 0.00 0.01 0.0580 11.300 9.02 17.38 0.12 0.05 0.00 0.92 0.92 0.92 0.24 0.05 0.52 0.00 0.00 0.00 0.10 0.00 0.00 0.01 0.0581 11.200 9.02 17.38 0.12 0.05 0.00 0.92 0.92 0.92 0.24 0.05 0.52 0.00 0.00 0.00 0.10 0.00 0.00 0.01 0.0582 11.100 9.02 17.38 0.12 0.05 0.00 0.92 0.92 0.92 0.24 0.05 0.52 0.00 0.00 0.00 0.10 0.00 0.00 0.01 0.0583 11.000 9.02 17.38 0.12 0.05 0.00 0.92 0.92 0.92 0.24 0.05 0.52 0.00 0.00 0.00 0.10 0.00 0.00 0.01 0.0584 10.900 9.02 17.38 0.12 0.05 0.00 0.92 0.92 0.92 0.24 0.05 0.52 0.00 0.00 0.00 0.10 0.00 0.00 0.01 0.0585 10.800 9.02 17.38 0.12 0.05 0.00 0.92 0.92 0.92 0.24 0.05 0.52 0.00 0.00 0.00 0.10 0.00 0.00 0.01 0.0586 10.700 9.02 17.38 0.12 0.05 0.00 0.92 0.92 0.92 0.24 0.05 0.52 0.00 0.00 0.00 0.10 0.00 0.00 0.01 0.0587 10.600 9.02 17.38 0.12 0.05 0.00 0.92 0.92 0.92 0.24 0.05 0.52 0.00 0.00 0.00 0.10 0.00 0.00 0.01 0.0588 10.500 9.02 17.38 0.12 0.05 0.00 0.92 0.92 0.92 0.24 0.05 0.52 0.00 0.00 0.00 0.10 0.00 0.00 0.01 0.0589 10.400 9.02 17.38 0.12 0.05 0.00 0.92 0.92 0.92 0.24 0.05 0.52 0.00 0.00 0.00 0.10 0.00 0.00 0.01 0.0590 10.300 9.02 17.38 0.12 0.05 0.00 0.92 0.92 0.92 0.24 0.05 0.52 0.00 0.00 0.00 0.10 0.00 0.00 0.01 0.0591 10.200 9.02 17.38 0.12 0.05 0.00 0.92 0.92 0.92 0.24 0.05 0.52 0.00 0.00 0.00 0.10 0.00 0.00 0.01 0.0592 10.100 9.02 17.38 0.12 0.05 0.00 0.92 0.92 0.92 0.24 0.05 0.52 0.00 0.00 0.00 0.10 0.00 0.00 0.01 0.0593 10.000 9.02 17.38 0.12 0.05 0.00 0.92 0.92 0.92 0.24 0.05 0.52 0.00 0.00 0.00 0.10 0.00 0.00 0.01 0.0594 9.900 9.02 17.38 0.12 0.05 0.00 0.92 0.92 0.92 0.24 0.05 0.52 0.00 0.00 0.00 0.10 0.00 0.00 0.01 0.05
20 DEG C RATE 0.12 0.00 0.90 0.24 0.50 0.00 0.00 0.00 0.00 0.01AVG 20 DEG C RATE 17.25 0.05 0.05 0.05
* g/sq m/d ** mg/L/day
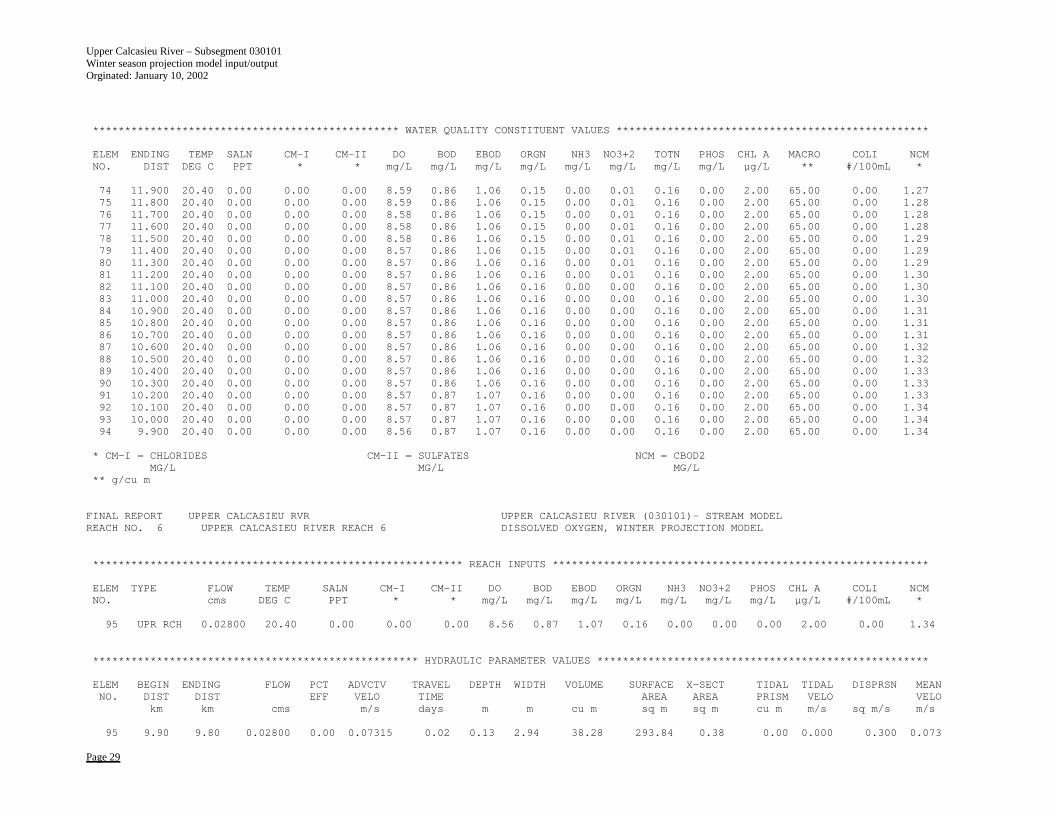
Upper Calcasieu River – Subsegment 030101 Winter season projection model input/output Orginated: January 10, 2002
Page 29
************************************************ WATER QUALITY CONSTITUENT VALUES *************************************************
ELEM ENDING TEMP SALN CM-I CM-II DO BOD EBOD ORGN NH3 NO3+2 TOTN PHOS CHL A MACRO COLI NCMNO. DIST DEG C PPT * * mg/L mg/L mg/L mg/L mg/L mg/L mg/L mg/L µg/L ** #/100mL *
74 11.900 20.40 0.00 0.00 0.00 8.59 0.86 1.06 0.15 0.00 0.01 0.16 0.00 2.00 65.00 0.00 1.2775 11.800 20.40 0.00 0.00 0.00 8.59 0.86 1.06 0.15 0.00 0.01 0.16 0.00 2.00 65.00 0.00 1.2876 11.700 20.40 0.00 0.00 0.00 8.58 0.86 1.06 0.15 0.00 0.01 0.16 0.00 2.00 65.00 0.00 1.2877 11.600 20.40 0.00 0.00 0.00 8.58 0.86 1.06 0.15 0.00 0.01 0.16 0.00 2.00 65.00 0.00 1.2878 11.500 20.40 0.00 0.00 0.00 8.58 0.86 1.06 0.15 0.00 0.01 0.16 0.00 2.00 65.00 0.00 1.2979 11.400 20.40 0.00 0.00 0.00 8.57 0.86 1.06 0.15 0.00 0.01 0.16 0.00 2.00 65.00 0.00 1.2980 11.300 20.40 0.00 0.00 0.00 8.57 0.86 1.06 0.16 0.00 0.01 0.16 0.00 2.00 65.00 0.00 1.2981 11.200 20.40 0.00 0.00 0.00 8.57 0.86 1.06 0.16 0.00 0.01 0.16 0.00 2.00 65.00 0.00 1.3082 11.100 20.40 0.00 0.00 0.00 8.57 0.86 1.06 0.16 0.00 0.00 0.16 0.00 2.00 65.00 0.00 1.3083 11.000 20.40 0.00 0.00 0.00 8.57 0.86 1.06 0.16 0.00 0.00 0.16 0.00 2.00 65.00 0.00 1.3084 10.900 20.40 0.00 0.00 0.00 8.57 0.86 1.06 0.16 0.00 0.00 0.16 0.00 2.00 65.00 0.00 1.3185 10.800 20.40 0.00 0.00 0.00 8.57 0.86 1.06 0.16 0.00 0.00 0.16 0.00 2.00 65.00 0.00 1.3186 10.700 20.40 0.00 0.00 0.00 8.57 0.86 1.06 0.16 0.00 0.00 0.16 0.00 2.00 65.00 0.00 1.3187 10.600 20.40 0.00 0.00 0.00 8.57 0.86 1.06 0.16 0.00 0.00 0.16 0.00 2.00 65.00 0.00 1.3288 10.500 20.40 0.00 0.00 0.00 8.57 0.86 1.06 0.16 0.00 0.00 0.16 0.00 2.00 65.00 0.00 1.3289 10.400 20.40 0.00 0.00 0.00 8.57 0.86 1.06 0.16 0.00 0.00 0.16 0.00 2.00 65.00 0.00 1.3390 10.300 20.40 0.00 0.00 0.00 8.57 0.86 1.06 0.16 0.00 0.00 0.16 0.00 2.00 65.00 0.00 1.3391 10.200 20.40 0.00 0.00 0.00 8.57 0.87 1.07 0.16 0.00 0.00 0.16 0.00 2.00 65.00 0.00 1.3392 10.100 20.40 0.00 0.00 0.00 8.57 0.87 1.07 0.16 0.00 0.00 0.16 0.00 2.00 65.00 0.00 1.3493 10.000 20.40 0.00 0.00 0.00 8.57 0.87 1.07 0.16 0.00 0.00 0.16 0.00 2.00 65.00 0.00 1.3494 9.900 20.40 0.00 0.00 0.00 8.56 0.87 1.07 0.16 0.00 0.00 0.16 0.00 2.00 65.00 0.00 1.34
* CM-I = CHLORIDES CM-II = SULFATES NCM = CBOD2MG/L MG/L MG/L
** g/cu m
FINAL REPORT UPPER CALCASIEU RVR UPPER CALCASIEU RIVER (030101)- STREAM MODELREACH NO. 6 UPPER CALCASIEU RIVER REACH 6 DISSOLVED OXYGEN, WINTER PROJECTION MODEL
********************************************************** REACH INPUTS ***********************************************************
ELEM TYPE FLOW TEMP SALN CM-I CM-II DO BOD EBOD ORGN NH3 NO3+2 PHOS CHL A COLI NCMNO. cms DEG C PPT * * mg/L mg/L mg/L mg/L mg/L mg/L mg/L µg/L #/100mL *
95 UPR RCH 0.02800 20.40 0.00 0.00 0.00 8.56 0.87 1.07 0.16 0.00 0.00 0.00 2.00 0.00 1.34
*************************************************** HYDRAULIC PARAMETER VALUES ****************************************************
ELEM BEGIN ENDING FLOW PCT ADVCTV TRAVEL DEPTH WIDTH VOLUME SURFACE X-SECT TIDAL TIDAL DISPRSN MEANNO. DIST DIST EFF VELO TIME AREA AREA PRISM VELO VELO
km km cms m/s days m m cu m sq m sq m cu m m/s sq m/s m/s
95 9.90 9.80 0.02800 0.00 0.07315 0.02 0.13 2.94 38.28 293.84 0.38 0.00 0.000 0.300 0.073
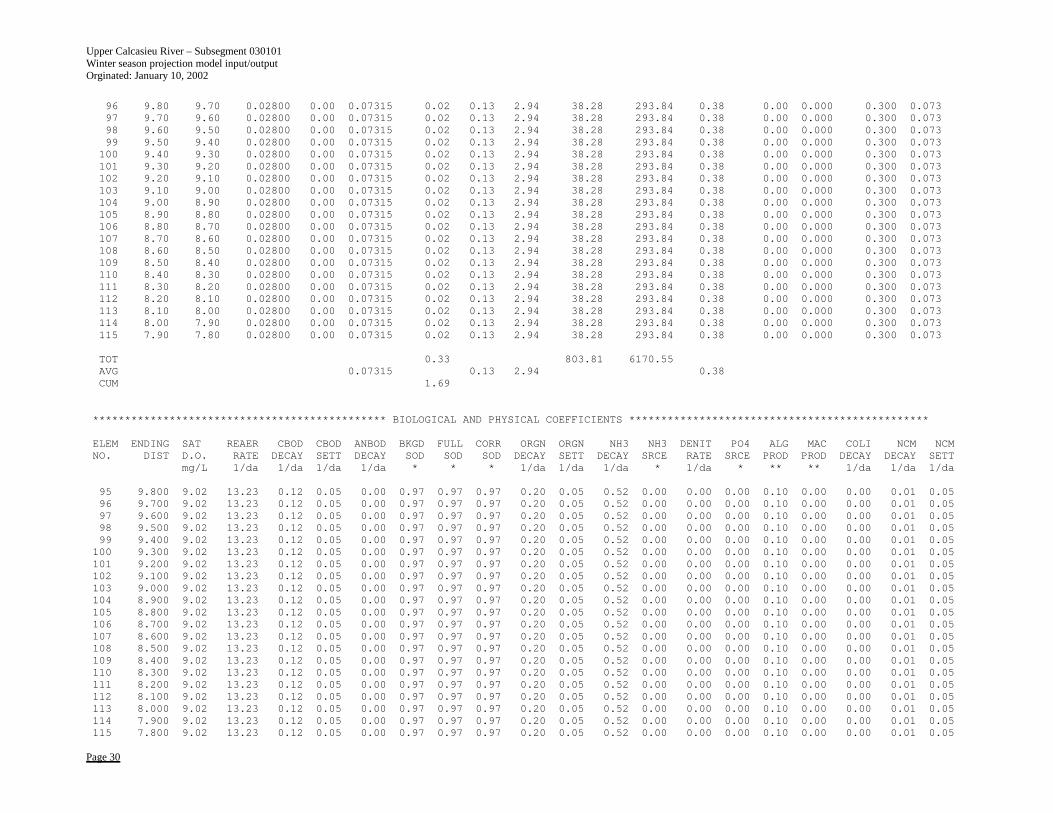
Upper Calcasieu River – Subsegment 030101 Winter season projection model input/output Orginated: January 10, 2002
Page 30
96 9.80 9.70 0.02800 0.00 0.07315 0.02 0.13 2.94 38.28 293.84 0.38 0.00 0.000 0.300 0.07397 9.70 9.60 0.02800 0.00 0.07315 0.02 0.13 2.94 38.28 293.84 0.38 0.00 0.000 0.300 0.07398 9.60 9.50 0.02800 0.00 0.07315 0.02 0.13 2.94 38.28 293.84 0.38 0.00 0.000 0.300 0.07399 9.50 9.40 0.02800 0.00 0.07315 0.02 0.13 2.94 38.28 293.84 0.38 0.00 0.000 0.300 0.073100 9.40 9.30 0.02800 0.00 0.07315 0.02 0.13 2.94 38.28 293.84 0.38 0.00 0.000 0.300 0.073101 9.30 9.20 0.02800 0.00 0.07315 0.02 0.13 2.94 38.28 293.84 0.38 0.00 0.000 0.300 0.073102 9.20 9.10 0.02800 0.00 0.07315 0.02 0.13 2.94 38.28 293.84 0.38 0.00 0.000 0.300 0.073103 9.10 9.00 0.02800 0.00 0.07315 0.02 0.13 2.94 38.28 293.84 0.38 0.00 0.000 0.300 0.073104 9.00 8.90 0.02800 0.00 0.07315 0.02 0.13 2.94 38.28 293.84 0.38 0.00 0.000 0.300 0.073105 8.90 8.80 0.02800 0.00 0.07315 0.02 0.13 2.94 38.28 293.84 0.38 0.00 0.000 0.300 0.073106 8.80 8.70 0.02800 0.00 0.07315 0.02 0.13 2.94 38.28 293.84 0.38 0.00 0.000 0.300 0.073107 8.70 8.60 0.02800 0.00 0.07315 0.02 0.13 2.94 38.28 293.84 0.38 0.00 0.000 0.300 0.073108 8.60 8.50 0.02800 0.00 0.07315 0.02 0.13 2.94 38.28 293.84 0.38 0.00 0.000 0.300 0.073109 8.50 8.40 0.02800 0.00 0.07315 0.02 0.13 2.94 38.28 293.84 0.38 0.00 0.000 0.300 0.073110 8.40 8.30 0.02800 0.00 0.07315 0.02 0.13 2.94 38.28 293.84 0.38 0.00 0.000 0.300 0.073111 8.30 8.20 0.02800 0.00 0.07315 0.02 0.13 2.94 38.28 293.84 0.38 0.00 0.000 0.300 0.073112 8.20 8.10 0.02800 0.00 0.07315 0.02 0.13 2.94 38.28 293.84 0.38 0.00 0.000 0.300 0.073113 8.10 8.00 0.02800 0.00 0.07315 0.02 0.13 2.94 38.28 293.84 0.38 0.00 0.000 0.300 0.073114 8.00 7.90 0.02800 0.00 0.07315 0.02 0.13 2.94 38.28 293.84 0.38 0.00 0.000 0.300 0.073115 7.90 7.80 0.02800 0.00 0.07315 0.02 0.13 2.94 38.28 293.84 0.38 0.00 0.000 0.300 0.073
TOT 0.33 803.81 6170.55AVG 0.07315 0.13 2.94 0.38CUM 1.69
********************************************** BIOLOGICAL AND PHYSICAL COEFFICIENTS ***********************************************
ELEM ENDING SAT REAER CBOD CBOD ANBOD BKGD FULL CORR ORGN ORGN NH3 NH3 DENIT PO4 ALG MAC COLI NCM NCMNO. DIST D.O. RATE DECAY SETT DECAY SOD SOD SOD DECAY SETT DECAY SRCE RATE SRCE PROD PROD DECAY DECAY SETT
mg/L 1/da 1/da 1/da 1/da * * * 1/da 1/da 1/da * 1/da * ** ** 1/da 1/da 1/da
95 9.800 9.02 13.23 0.12 0.05 0.00 0.97 0.97 0.97 0.20 0.05 0.52 0.00 0.00 0.00 0.10 0.00 0.00 0.01 0.0596 9.700 9.02 13.23 0.12 0.05 0.00 0.97 0.97 0.97 0.20 0.05 0.52 0.00 0.00 0.00 0.10 0.00 0.00 0.01 0.0597 9.600 9.02 13.23 0.12 0.05 0.00 0.97 0.97 0.97 0.20 0.05 0.52 0.00 0.00 0.00 0.10 0.00 0.00 0.01 0.0598 9.500 9.02 13.23 0.12 0.05 0.00 0.97 0.97 0.97 0.20 0.05 0.52 0.00 0.00 0.00 0.10 0.00 0.00 0.01 0.0599 9.400 9.02 13.23 0.12 0.05 0.00 0.97 0.97 0.97 0.20 0.05 0.52 0.00 0.00 0.00 0.10 0.00 0.00 0.01 0.05100 9.300 9.02 13.23 0.12 0.05 0.00 0.97 0.97 0.97 0.20 0.05 0.52 0.00 0.00 0.00 0.10 0.00 0.00 0.01 0.05101 9.200 9.02 13.23 0.12 0.05 0.00 0.97 0.97 0.97 0.20 0.05 0.52 0.00 0.00 0.00 0.10 0.00 0.00 0.01 0.05102 9.100 9.02 13.23 0.12 0.05 0.00 0.97 0.97 0.97 0.20 0.05 0.52 0.00 0.00 0.00 0.10 0.00 0.00 0.01 0.05103 9.000 9.02 13.23 0.12 0.05 0.00 0.97 0.97 0.97 0.20 0.05 0.52 0.00 0.00 0.00 0.10 0.00 0.00 0.01 0.05104 8.900 9.02 13.23 0.12 0.05 0.00 0.97 0.97 0.97 0.20 0.05 0.52 0.00 0.00 0.00 0.10 0.00 0.00 0.01 0.05105 8.800 9.02 13.23 0.12 0.05 0.00 0.97 0.97 0.97 0.20 0.05 0.52 0.00 0.00 0.00 0.10 0.00 0.00 0.01 0.05106 8.700 9.02 13.23 0.12 0.05 0.00 0.97 0.97 0.97 0.20 0.05 0.52 0.00 0.00 0.00 0.10 0.00 0.00 0.01 0.05107 8.600 9.02 13.23 0.12 0.05 0.00 0.97 0.97 0.97 0.20 0.05 0.52 0.00 0.00 0.00 0.10 0.00 0.00 0.01 0.05108 8.500 9.02 13.23 0.12 0.05 0.00 0.97 0.97 0.97 0.20 0.05 0.52 0.00 0.00 0.00 0.10 0.00 0.00 0.01 0.05109 8.400 9.02 13.23 0.12 0.05 0.00 0.97 0.97 0.97 0.20 0.05 0.52 0.00 0.00 0.00 0.10 0.00 0.00 0.01 0.05110 8.300 9.02 13.23 0.12 0.05 0.00 0.97 0.97 0.97 0.20 0.05 0.52 0.00 0.00 0.00 0.10 0.00 0.00 0.01 0.05111 8.200 9.02 13.23 0.12 0.05 0.00 0.97 0.97 0.97 0.20 0.05 0.52 0.00 0.00 0.00 0.10 0.00 0.00 0.01 0.05112 8.100 9.02 13.23 0.12 0.05 0.00 0.97 0.97 0.97 0.20 0.05 0.52 0.00 0.00 0.00 0.10 0.00 0.00 0.01 0.05113 8.000 9.02 13.23 0.12 0.05 0.00 0.97 0.97 0.97 0.20 0.05 0.52 0.00 0.00 0.00 0.10 0.00 0.00 0.01 0.05114 7.900 9.02 13.23 0.12 0.05 0.00 0.97 0.97 0.97 0.20 0.05 0.52 0.00 0.00 0.00 0.10 0.00 0.00 0.01 0.05115 7.800 9.02 13.23 0.12 0.05 0.00 0.97 0.97 0.97 0.20 0.05 0.52 0.00 0.00 0.00 0.10 0.00 0.00 0.01 0.05

Upper Calcasieu River – Subsegment 030101 Winter season projection model input/output Orginated: January 10, 2002
Page 31
20 DEG C RATE 0.12 0.00 0.95 0.19 0.50 0.00 0.00 0.00 0.00 0.01AVG 20 DEG C RATE 13.12 0.05 0.05 0.05
* g/sq m/d ** mg/L/day
************************************************ WATER QUALITY CONSTITUENT VALUES *************************************************
ELEM ENDING TEMP SALN CM-I CM-II DO BOD EBOD ORGN NH3 NO3+2 TOTN PHOS CHL A MACRO COLI NCMNO. DIST DEG C PPT * * mg/L mg/L mg/L mg/L mg/L mg/L mg/L mg/L µg/L ** #/100mL *
95 9.800 20.40 0.00 0.00 0.00 8.55 0.87 1.07 0.16 0.00 0.00 0.16 0.00 2.00 64.52 0.00 1.3596 9.700 20.40 0.00 0.00 0.00 8.53 0.86 1.06 0.16 0.00 0.00 0.16 0.00 2.00 64.05 0.00 1.3597 9.600 20.40 0.00 0.00 0.00 8.52 0.86 1.06 0.16 0.00 0.00 0.16 0.00 2.00 63.57 0.00 1.3598 9.500 20.40 0.00 0.00 0.00 8.51 0.86 1.06 0.16 0.00 0.00 0.16 0.00 2.00 63.10 0.00 1.3599 9.400 20.40 0.00 0.00 0.00 8.50 0.86 1.06 0.16 0.00 0.00 0.16 0.00 2.00 62.62 0.00 1.36100 9.300 20.40 0.00 0.00 0.00 8.49 0.86 1.06 0.16 0.00 0.00 0.16 0.00 2.00 62.14 0.00 1.36101 9.200 20.40 0.00 0.00 0.00 8.48 0.86 1.06 0.16 0.00 0.00 0.16 0.00 2.00 61.67 0.00 1.36102 9.100 20.40 0.00 0.00 0.00 8.48 0.86 1.06 0.16 0.00 0.00 0.16 0.00 2.00 61.19 0.00 1.36103 9.000 20.40 0.00 0.00 0.00 8.47 0.86 1.06 0.16 0.00 0.00 0.16 0.00 2.00 60.71 0.00 1.37104 8.900 20.40 0.00 0.00 0.00 8.47 0.86 1.06 0.16 0.00 0.00 0.16 0.00 2.00 60.24 0.00 1.37105 8.800 20.40 0.00 0.00 0.00 8.47 0.86 1.06 0.16 0.00 0.00 0.16 0.00 2.00 59.76 0.00 1.37106 8.700 20.40 0.00 0.00 0.00 8.46 0.86 1.06 0.16 0.00 0.00 0.16 0.00 2.00 59.29 0.00 1.38107 8.600 20.40 0.00 0.00 0.00 8.46 0.86 1.06 0.16 0.00 0.00 0.16 0.00 2.00 58.81 0.00 1.38108 8.500 20.40 0.00 0.00 0.00 8.46 0.86 1.06 0.16 0.00 0.00 0.16 0.00 2.00 58.33 0.00 1.38109 8.400 20.40 0.00 0.00 0.00 8.46 0.86 1.06 0.16 0.00 0.00 0.16 0.00 2.00 57.86 0.00 1.38110 8.300 20.40 0.00 0.00 0.00 8.46 0.86 1.06 0.16 0.00 0.00 0.16 0.00 2.00 57.38 0.00 1.39111 8.200 20.40 0.00 0.00 0.00 8.46 0.86 1.06 0.16 0.00 0.00 0.16 0.00 2.00 56.90 0.00 1.39112 8.100 20.40 0.00 0.00 0.00 8.46 0.86 1.06 0.16 0.00 0.00 0.16 0.00 2.00 56.43 0.00 1.39113 8.000 20.40 0.00 0.00 0.00 8.46 0.86 1.06 0.16 0.00 0.00 0.16 0.00 2.00 55.95 0.00 1.39114 7.900 20.40 0.00 0.00 0.00 8.46 0.86 1.06 0.16 0.00 0.00 0.16 0.00 2.00 55.48 0.00 1.40115 7.800 20.40 0.00 0.00 0.00 8.45 0.86 1.06 0.16 0.00 0.00 0.16 0.00 2.00 55.00 0.00 1.40
* CM-I = CHLORIDES CM-II = SULFATES NCM = CBOD2MG/L MG/L MG/L
** g/cu m
FINAL REPORT UPPER CALCASIEU RVR UPPER CALCASIEU RIVER (030101)- STREAM MODELREACH NO. 7 UPPER CALCASIEU RIVER REACH 7 DISSOLVED OXYGEN, WINTER PROJECTION MODEL
********************************************************** REACH INPUTS ***********************************************************
ELEM TYPE FLOW TEMP SALN CM-I CM-II DO BOD EBOD ORGN NH3 NO3+2 PHOS CHL A COLI NCMNO. cms DEG C PPT * * mg/L mg/L mg/L mg/L mg/L mg/L mg/L µg/L #/100mL *
116 UPR RCH 0.02800 20.40 0.00 0.00 0.00 8.45 0.86 1.06 0.16 0.00 0.00 0.00 2.00 0.00 1.40
*************************************************** HYDRAULIC PARAMETER VALUES ****************************************************
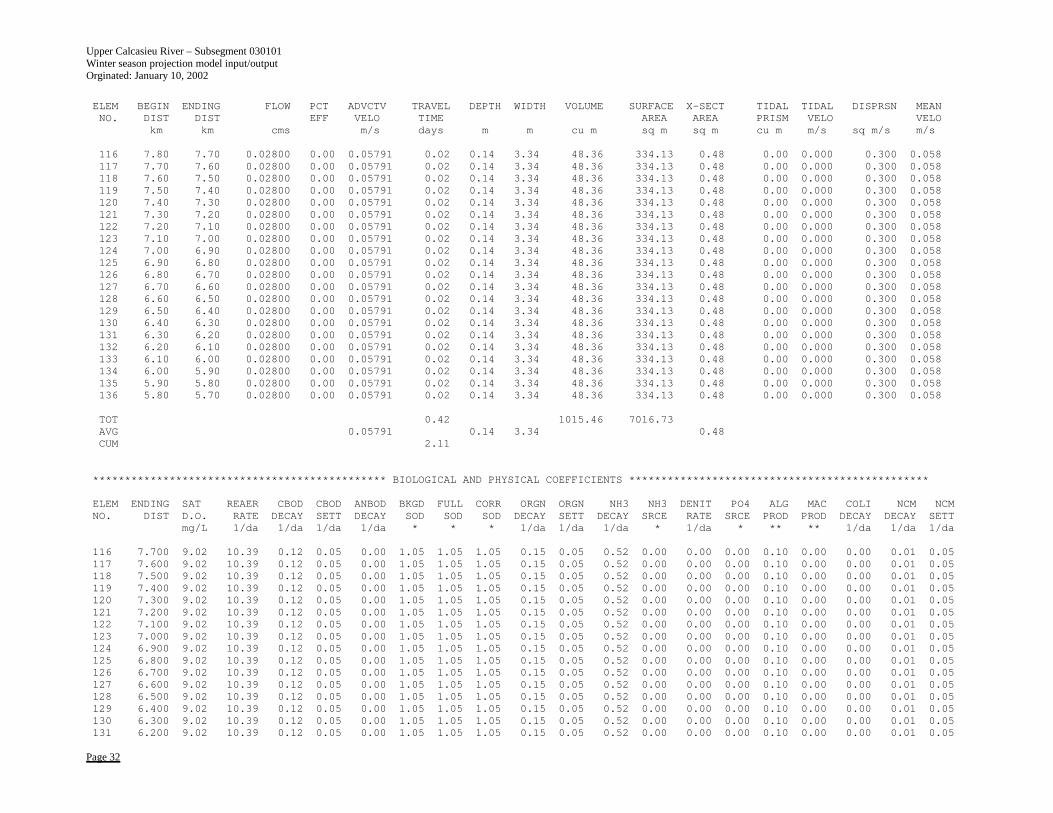
Upper Calcasieu River – Subsegment 030101 Winter season projection model input/output Orginated: January 10, 2002
Page 32
ELEM BEGIN ENDING FLOW PCT ADVCTV TRAVEL DEPTH WIDTH VOLUME SURFACE X-SECT TIDAL TIDAL DISPRSN MEANNO. DIST DIST EFF VELO TIME AREA AREA PRISM VELO VELO
km km cms m/s days m m cu m sq m sq m cu m m/s sq m/s m/s
116 7.80 7.70 0.02800 0.00 0.05791 0.02 0.14 3.34 48.36 334.13 0.48 0.00 0.000 0.300 0.058117 7.70 7.60 0.02800 0.00 0.05791 0.02 0.14 3.34 48.36 334.13 0.48 0.00 0.000 0.300 0.058118 7.60 7.50 0.02800 0.00 0.05791 0.02 0.14 3.34 48.36 334.13 0.48 0.00 0.000 0.300 0.058119 7.50 7.40 0.02800 0.00 0.05791 0.02 0.14 3.34 48.36 334.13 0.48 0.00 0.000 0.300 0.058120 7.40 7.30 0.02800 0.00 0.05791 0.02 0.14 3.34 48.36 334.13 0.48 0.00 0.000 0.300 0.058121 7.30 7.20 0.02800 0.00 0.05791 0.02 0.14 3.34 48.36 334.13 0.48 0.00 0.000 0.300 0.058122 7.20 7.10 0.02800 0.00 0.05791 0.02 0.14 3.34 48.36 334.13 0.48 0.00 0.000 0.300 0.058123 7.10 7.00 0.02800 0.00 0.05791 0.02 0.14 3.34 48.36 334.13 0.48 0.00 0.000 0.300 0.058124 7.00 6.90 0.02800 0.00 0.05791 0.02 0.14 3.34 48.36 334.13 0.48 0.00 0.000 0.300 0.058125 6.90 6.80 0.02800 0.00 0.05791 0.02 0.14 3.34 48.36 334.13 0.48 0.00 0.000 0.300 0.058126 6.80 6.70 0.02800 0.00 0.05791 0.02 0.14 3.34 48.36 334.13 0.48 0.00 0.000 0.300 0.058127 6.70 6.60 0.02800 0.00 0.05791 0.02 0.14 3.34 48.36 334.13 0.48 0.00 0.000 0.300 0.058128 6.60 6.50 0.02800 0.00 0.05791 0.02 0.14 3.34 48.36 334.13 0.48 0.00 0.000 0.300 0.058129 6.50 6.40 0.02800 0.00 0.05791 0.02 0.14 3.34 48.36 334.13 0.48 0.00 0.000 0.300 0.058130 6.40 6.30 0.02800 0.00 0.05791 0.02 0.14 3.34 48.36 334.13 0.48 0.00 0.000 0.300 0.058131 6.30 6.20 0.02800 0.00 0.05791 0.02 0.14 3.34 48.36 334.13 0.48 0.00 0.000 0.300 0.058132 6.20 6.10 0.02800 0.00 0.05791 0.02 0.14 3.34 48.36 334.13 0.48 0.00 0.000 0.300 0.058133 6.10 6.00 0.02800 0.00 0.05791 0.02 0.14 3.34 48.36 334.13 0.48 0.00 0.000 0.300 0.058134 6.00 5.90 0.02800 0.00 0.05791 0.02 0.14 3.34 48.36 334.13 0.48 0.00 0.000 0.300 0.058135 5.90 5.80 0.02800 0.00 0.05791 0.02 0.14 3.34 48.36 334.13 0.48 0.00 0.000 0.300 0.058136 5.80 5.70 0.02800 0.00 0.05791 0.02 0.14 3.34 48.36 334.13 0.48 0.00 0.000 0.300 0.058
TOT 0.42 1015.46 7016.73AVG 0.05791 0.14 3.34 0.48CUM 2.11
********************************************** BIOLOGICAL AND PHYSICAL COEFFICIENTS ***********************************************
ELEM ENDING SAT REAER CBOD CBOD ANBOD BKGD FULL CORR ORGN ORGN NH3 NH3 DENIT PO4 ALG MAC COLI NCM NCMNO. DIST D.O. RATE DECAY SETT DECAY SOD SOD SOD DECAY SETT DECAY SRCE RATE SRCE PROD PROD DECAY DECAY SETT
mg/L 1/da 1/da 1/da 1/da * * * 1/da 1/da 1/da * 1/da * ** ** 1/da 1/da 1/da
116 7.700 9.02 10.39 0.12 0.05 0.00 1.05 1.05 1.05 0.15 0.05 0.52 0.00 0.00 0.00 0.10 0.00 0.00 0.01 0.05117 7.600 9.02 10.39 0.12 0.05 0.00 1.05 1.05 1.05 0.15 0.05 0.52 0.00 0.00 0.00 0.10 0.00 0.00 0.01 0.05118 7.500 9.02 10.39 0.12 0.05 0.00 1.05 1.05 1.05 0.15 0.05 0.52 0.00 0.00 0.00 0.10 0.00 0.00 0.01 0.05119 7.400 9.02 10.39 0.12 0.05 0.00 1.05 1.05 1.05 0.15 0.05 0.52 0.00 0.00 0.00 0.10 0.00 0.00 0.01 0.05120 7.300 9.02 10.39 0.12 0.05 0.00 1.05 1.05 1.05 0.15 0.05 0.52 0.00 0.00 0.00 0.10 0.00 0.00 0.01 0.05121 7.200 9.02 10.39 0.12 0.05 0.00 1.05 1.05 1.05 0.15 0.05 0.52 0.00 0.00 0.00 0.10 0.00 0.00 0.01 0.05122 7.100 9.02 10.39 0.12 0.05 0.00 1.05 1.05 1.05 0.15 0.05 0.52 0.00 0.00 0.00 0.10 0.00 0.00 0.01 0.05123 7.000 9.02 10.39 0.12 0.05 0.00 1.05 1.05 1.05 0.15 0.05 0.52 0.00 0.00 0.00 0.10 0.00 0.00 0.01 0.05124 6.900 9.02 10.39 0.12 0.05 0.00 1.05 1.05 1.05 0.15 0.05 0.52 0.00 0.00 0.00 0.10 0.00 0.00 0.01 0.05125 6.800 9.02 10.39 0.12 0.05 0.00 1.05 1.05 1.05 0.15 0.05 0.52 0.00 0.00 0.00 0.10 0.00 0.00 0.01 0.05126 6.700 9.02 10.39 0.12 0.05 0.00 1.05 1.05 1.05 0.15 0.05 0.52 0.00 0.00 0.00 0.10 0.00 0.00 0.01 0.05127 6.600 9.02 10.39 0.12 0.05 0.00 1.05 1.05 1.05 0.15 0.05 0.52 0.00 0.00 0.00 0.10 0.00 0.00 0.01 0.05128 6.500 9.02 10.39 0.12 0.05 0.00 1.05 1.05 1.05 0.15 0.05 0.52 0.00 0.00 0.00 0.10 0.00 0.00 0.01 0.05129 6.400 9.02 10.39 0.12 0.05 0.00 1.05 1.05 1.05 0.15 0.05 0.52 0.00 0.00 0.00 0.10 0.00 0.00 0.01 0.05130 6.300 9.02 10.39 0.12 0.05 0.00 1.05 1.05 1.05 0.15 0.05 0.52 0.00 0.00 0.00 0.10 0.00 0.00 0.01 0.05131 6.200 9.02 10.39 0.12 0.05 0.00 1.05 1.05 1.05 0.15 0.05 0.52 0.00 0.00 0.00 0.10 0.00 0.00 0.01 0.05
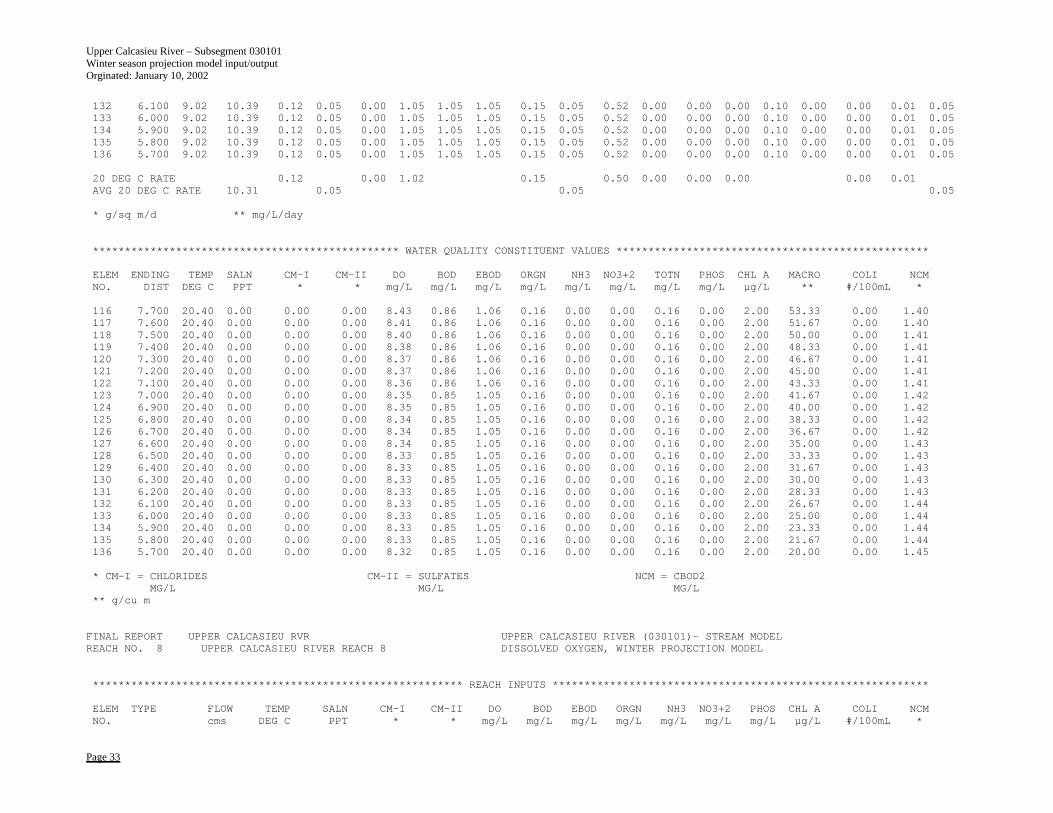
Upper Calcasieu River – Subsegment 030101 Winter season projection model input/output Orginated: January 10, 2002
Page 33
132 6.100 9.02 10.39 0.12 0.05 0.00 1.05 1.05 1.05 0.15 0.05 0.52 0.00 0.00 0.00 0.10 0.00 0.00 0.01 0.05133 6.000 9.02 10.39 0.12 0.05 0.00 1.05 1.05 1.05 0.15 0.05 0.52 0.00 0.00 0.00 0.10 0.00 0.00 0.01 0.05134 5.900 9.02 10.39 0.12 0.05 0.00 1.05 1.05 1.05 0.15 0.05 0.52 0.00 0.00 0.00 0.10 0.00 0.00 0.01 0.05135 5.800 9.02 10.39 0.12 0.05 0.00 1.05 1.05 1.05 0.15 0.05 0.52 0.00 0.00 0.00 0.10 0.00 0.00 0.01 0.05136 5.700 9.02 10.39 0.12 0.05 0.00 1.05 1.05 1.05 0.15 0.05 0.52 0.00 0.00 0.00 0.10 0.00 0.00 0.01 0.05
20 DEG C RATE 0.12 0.00 1.02 0.15 0.50 0.00 0.00 0.00 0.00 0.01AVG 20 DEG C RATE 10.31 0.05 0.05 0.05
* g/sq m/d ** mg/L/day
************************************************ WATER QUALITY CONSTITUENT VALUES *************************************************
ELEM ENDING TEMP SALN CM-I CM-II DO BOD EBOD ORGN NH3 NO3+2 TOTN PHOS CHL A MACRO COLI NCMNO. DIST DEG C PPT * * mg/L mg/L mg/L mg/L mg/L mg/L mg/L mg/L µg/L ** #/100mL *
116 7.700 20.40 0.00 0.00 0.00 8.43 0.86 1.06 0.16 0.00 0.00 0.16 0.00 2.00 53.33 0.00 1.40117 7.600 20.40 0.00 0.00 0.00 8.41 0.86 1.06 0.16 0.00 0.00 0.16 0.00 2.00 51.67 0.00 1.40118 7.500 20.40 0.00 0.00 0.00 8.40 0.86 1.06 0.16 0.00 0.00 0.16 0.00 2.00 50.00 0.00 1.41119 7.400 20.40 0.00 0.00 0.00 8.38 0.86 1.06 0.16 0.00 0.00 0.16 0.00 2.00 48.33 0.00 1.41120 7.300 20.40 0.00 0.00 0.00 8.37 0.86 1.06 0.16 0.00 0.00 0.16 0.00 2.00 46.67 0.00 1.41121 7.200 20.40 0.00 0.00 0.00 8.37 0.86 1.06 0.16 0.00 0.00 0.16 0.00 2.00 45.00 0.00 1.41122 7.100 20.40 0.00 0.00 0.00 8.36 0.86 1.06 0.16 0.00 0.00 0.16 0.00 2.00 43.33 0.00 1.41123 7.000 20.40 0.00 0.00 0.00 8.35 0.85 1.05 0.16 0.00 0.00 0.16 0.00 2.00 41.67 0.00 1.42124 6.900 20.40 0.00 0.00 0.00 8.35 0.85 1.05 0.16 0.00 0.00 0.16 0.00 2.00 40.00 0.00 1.42125 6.800 20.40 0.00 0.00 0.00 8.34 0.85 1.05 0.16 0.00 0.00 0.16 0.00 2.00 38.33 0.00 1.42126 6.700 20.40 0.00 0.00 0.00 8.34 0.85 1.05 0.16 0.00 0.00 0.16 0.00 2.00 36.67 0.00 1.42127 6.600 20.40 0.00 0.00 0.00 8.34 0.85 1.05 0.16 0.00 0.00 0.16 0.00 2.00 35.00 0.00 1.43128 6.500 20.40 0.00 0.00 0.00 8.33 0.85 1.05 0.16 0.00 0.00 0.16 0.00 2.00 33.33 0.00 1.43129 6.400 20.40 0.00 0.00 0.00 8.33 0.85 1.05 0.16 0.00 0.00 0.16 0.00 2.00 31.67 0.00 1.43130 6.300 20.40 0.00 0.00 0.00 8.33 0.85 1.05 0.16 0.00 0.00 0.16 0.00 2.00 30.00 0.00 1.43131 6.200 20.40 0.00 0.00 0.00 8.33 0.85 1.05 0.16 0.00 0.00 0.16 0.00 2.00 28.33 0.00 1.43132 6.100 20.40 0.00 0.00 0.00 8.33 0.85 1.05 0.16 0.00 0.00 0.16 0.00 2.00 26.67 0.00 1.44133 6.000 20.40 0.00 0.00 0.00 8.33 0.85 1.05 0.16 0.00 0.00 0.16 0.00 2.00 25.00 0.00 1.44134 5.900 20.40 0.00 0.00 0.00 8.33 0.85 1.05 0.16 0.00 0.00 0.16 0.00 2.00 23.33 0.00 1.44135 5.800 20.40 0.00 0.00 0.00 8.33 0.85 1.05 0.16 0.00 0.00 0.16 0.00 2.00 21.67 0.00 1.44136 5.700 20.40 0.00 0.00 0.00 8.32 0.85 1.05 0.16 0.00 0.00 0.16 0.00 2.00 20.00 0.00 1.45
* CM-I = CHLORIDES CM-II = SULFATES NCM = CBOD2MG/L MG/L MG/L
** g/cu m
FINAL REPORT UPPER CALCASIEU RVR UPPER CALCASIEU RIVER (030101)- STREAM MODELREACH NO. 8 UPPER CALCASIEU RIVER REACH 8 DISSOLVED OXYGEN, WINTER PROJECTION MODEL
********************************************************** REACH INPUTS ***********************************************************
ELEM TYPE FLOW TEMP SALN CM-I CM-II DO BOD EBOD ORGN NH3 NO3+2 PHOS CHL A COLI NCMNO. cms DEG C PPT * * mg/L mg/L mg/L mg/L mg/L mg/L mg/L µg/L #/100mL *
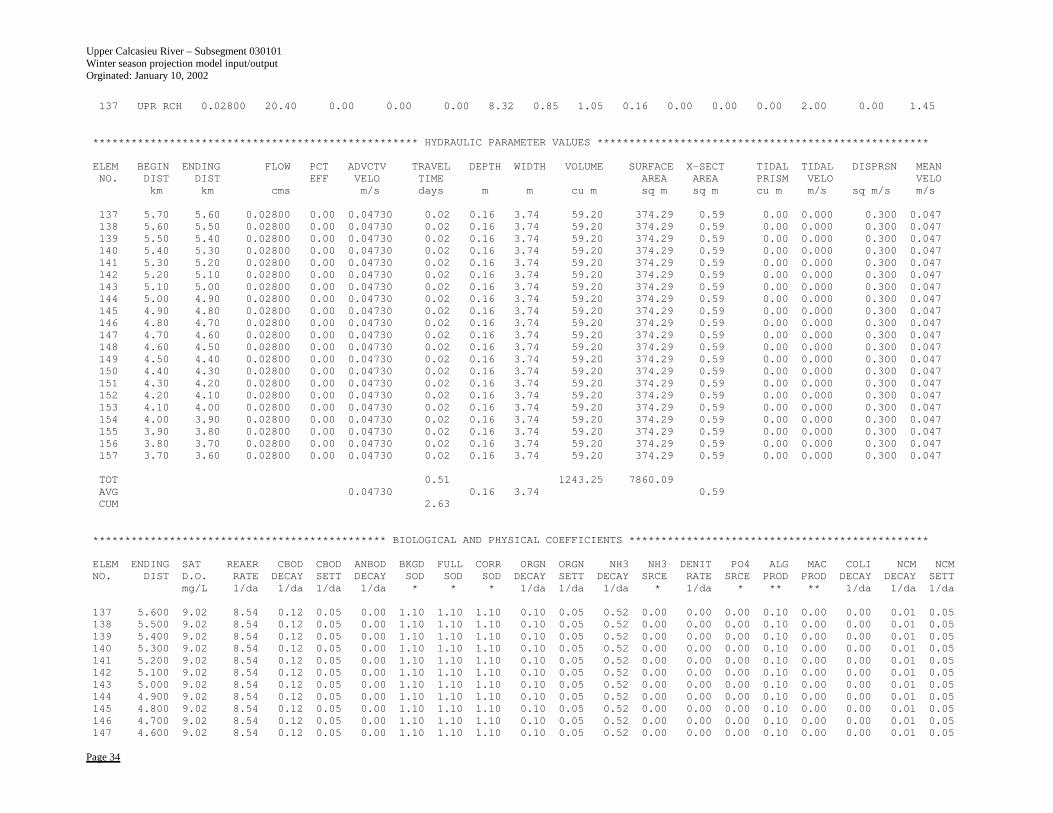
Upper Calcasieu River – Subsegment 030101 Winter season projection model input/output Orginated: January 10, 2002
Page 34
137 UPR RCH 0.02800 20.40 0.00 0.00 0.00 8.32 0.85 1.05 0.16 0.00 0.00 0.00 2.00 0.00 1.45
*************************************************** HYDRAULIC PARAMETER VALUES ****************************************************
ELEM BEGIN ENDING FLOW PCT ADVCTV TRAVEL DEPTH WIDTH VOLUME SURFACE X-SECT TIDAL TIDAL DISPRSN MEANNO. DIST DIST EFF VELO TIME AREA AREA PRISM VELO VELO
km km cms m/s days m m cu m sq m sq m cu m m/s sq m/s m/s
137 5.70 5.60 0.02800 0.00 0.04730 0.02 0.16 3.74 59.20 374.29 0.59 0.00 0.000 0.300 0.047138 5.60 5.50 0.02800 0.00 0.04730 0.02 0.16 3.74 59.20 374.29 0.59 0.00 0.000 0.300 0.047139 5.50 5.40 0.02800 0.00 0.04730 0.02 0.16 3.74 59.20 374.29 0.59 0.00 0.000 0.300 0.047140 5.40 5.30 0.02800 0.00 0.04730 0.02 0.16 3.74 59.20 374.29 0.59 0.00 0.000 0.300 0.047141 5.30 5.20 0.02800 0.00 0.04730 0.02 0.16 3.74 59.20 374.29 0.59 0.00 0.000 0.300 0.047142 5.20 5.10 0.02800 0.00 0.04730 0.02 0.16 3.74 59.20 374.29 0.59 0.00 0.000 0.300 0.047143 5.10 5.00 0.02800 0.00 0.04730 0.02 0.16 3.74 59.20 374.29 0.59 0.00 0.000 0.300 0.047144 5.00 4.90 0.02800 0.00 0.04730 0.02 0.16 3.74 59.20 374.29 0.59 0.00 0.000 0.300 0.047145 4.90 4.80 0.02800 0.00 0.04730 0.02 0.16 3.74 59.20 374.29 0.59 0.00 0.000 0.300 0.047146 4.80 4.70 0.02800 0.00 0.04730 0.02 0.16 3.74 59.20 374.29 0.59 0.00 0.000 0.300 0.047147 4.70 4.60 0.02800 0.00 0.04730 0.02 0.16 3.74 59.20 374.29 0.59 0.00 0.000 0.300 0.047148 4.60 4.50 0.02800 0.00 0.04730 0.02 0.16 3.74 59.20 374.29 0.59 0.00 0.000 0.300 0.047149 4.50 4.40 0.02800 0.00 0.04730 0.02 0.16 3.74 59.20 374.29 0.59 0.00 0.000 0.300 0.047150 4.40 4.30 0.02800 0.00 0.04730 0.02 0.16 3.74 59.20 374.29 0.59 0.00 0.000 0.300 0.047151 4.30 4.20 0.02800 0.00 0.04730 0.02 0.16 3.74 59.20 374.29 0.59 0.00 0.000 0.300 0.047152 4.20 4.10 0.02800 0.00 0.04730 0.02 0.16 3.74 59.20 374.29 0.59 0.00 0.000 0.300 0.047153 4.10 4.00 0.02800 0.00 0.04730 0.02 0.16 3.74 59.20 374.29 0.59 0.00 0.000 0.300 0.047154 4.00 3.90 0.02800 0.00 0.04730 0.02 0.16 3.74 59.20 374.29 0.59 0.00 0.000 0.300 0.047155 3.90 3.80 0.02800 0.00 0.04730 0.02 0.16 3.74 59.20 374.29 0.59 0.00 0.000 0.300 0.047156 3.80 3.70 0.02800 0.00 0.04730 0.02 0.16 3.74 59.20 374.29 0.59 0.00 0.000 0.300 0.047157 3.70 3.60 0.02800 0.00 0.04730 0.02 0.16 3.74 59.20 374.29 0.59 0.00 0.000 0.300 0.047
TOT 0.51 1243.25 7860.09AVG 0.04730 0.16 3.74 0.59CUM 2.63
********************************************** BIOLOGICAL AND PHYSICAL COEFFICIENTS ***********************************************
ELEM ENDING SAT REAER CBOD CBOD ANBOD BKGD FULL CORR ORGN ORGN NH3 NH3 DENIT PO4 ALG MAC COLI NCM NCMNO. DIST D.O. RATE DECAY SETT DECAY SOD SOD SOD DECAY SETT DECAY SRCE RATE SRCE PROD PROD DECAY DECAY SETT
mg/L 1/da 1/da 1/da 1/da * * * 1/da 1/da 1/da * 1/da * ** ** 1/da 1/da 1/da
137 5.600 9.02 8.54 0.12 0.05 0.00 1.10 1.10 1.10 0.10 0.05 0.52 0.00 0.00 0.00 0.10 0.00 0.00 0.01 0.05138 5.500 9.02 8.54 0.12 0.05 0.00 1.10 1.10 1.10 0.10 0.05 0.52 0.00 0.00 0.00 0.10 0.00 0.00 0.01 0.05139 5.400 9.02 8.54 0.12 0.05 0.00 1.10 1.10 1.10 0.10 0.05 0.52 0.00 0.00 0.00 0.10 0.00 0.00 0.01 0.05140 5.300 9.02 8.54 0.12 0.05 0.00 1.10 1.10 1.10 0.10 0.05 0.52 0.00 0.00 0.00 0.10 0.00 0.00 0.01 0.05141 5.200 9.02 8.54 0.12 0.05 0.00 1.10 1.10 1.10 0.10 0.05 0.52 0.00 0.00 0.00 0.10 0.00 0.00 0.01 0.05142 5.100 9.02 8.54 0.12 0.05 0.00 1.10 1.10 1.10 0.10 0.05 0.52 0.00 0.00 0.00 0.10 0.00 0.00 0.01 0.05143 5.000 9.02 8.54 0.12 0.05 0.00 1.10 1.10 1.10 0.10 0.05 0.52 0.00 0.00 0.00 0.10 0.00 0.00 0.01 0.05144 4.900 9.02 8.54 0.12 0.05 0.00 1.10 1.10 1.10 0.10 0.05 0.52 0.00 0.00 0.00 0.10 0.00 0.00 0.01 0.05145 4.800 9.02 8.54 0.12 0.05 0.00 1.10 1.10 1.10 0.10 0.05 0.52 0.00 0.00 0.00 0.10 0.00 0.00 0.01 0.05146 4.700 9.02 8.54 0.12 0.05 0.00 1.10 1.10 1.10 0.10 0.05 0.52 0.00 0.00 0.00 0.10 0.00 0.00 0.01 0.05147 4.600 9.02 8.54 0.12 0.05 0.00 1.10 1.10 1.10 0.10 0.05 0.52 0.00 0.00 0.00 0.10 0.00 0.00 0.01 0.05
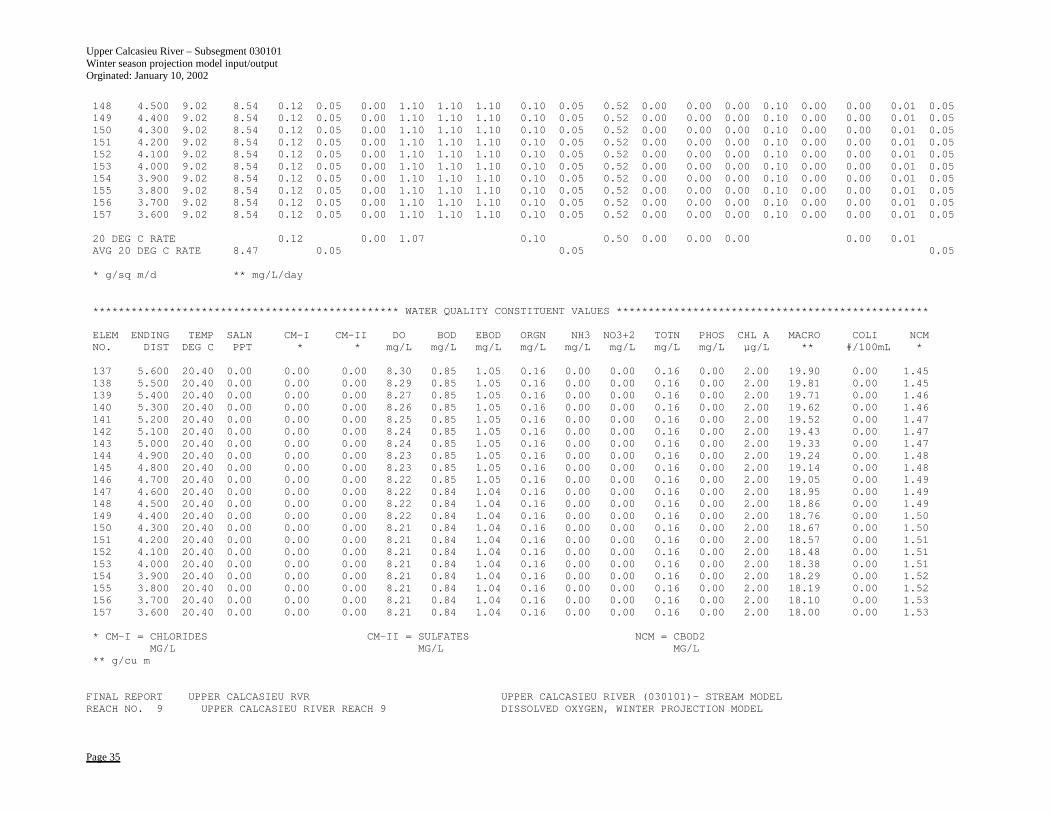
Upper Calcasieu River – Subsegment 030101 Winter season projection model input/output Orginated: January 10, 2002
Page 35
148 4.500 9.02 8.54 0.12 0.05 0.00 1.10 1.10 1.10 0.10 0.05 0.52 0.00 0.00 0.00 0.10 0.00 0.00 0.01 0.05149 4.400 9.02 8.54 0.12 0.05 0.00 1.10 1.10 1.10 0.10 0.05 0.52 0.00 0.00 0.00 0.10 0.00 0.00 0.01 0.05150 4.300 9.02 8.54 0.12 0.05 0.00 1.10 1.10 1.10 0.10 0.05 0.52 0.00 0.00 0.00 0.10 0.00 0.00 0.01 0.05151 4.200 9.02 8.54 0.12 0.05 0.00 1.10 1.10 1.10 0.10 0.05 0.52 0.00 0.00 0.00 0.10 0.00 0.00 0.01 0.05152 4.100 9.02 8.54 0.12 0.05 0.00 1.10 1.10 1.10 0.10 0.05 0.52 0.00 0.00 0.00 0.10 0.00 0.00 0.01 0.05153 4.000 9.02 8.54 0.12 0.05 0.00 1.10 1.10 1.10 0.10 0.05 0.52 0.00 0.00 0.00 0.10 0.00 0.00 0.01 0.05154 3.900 9.02 8.54 0.12 0.05 0.00 1.10 1.10 1.10 0.10 0.05 0.52 0.00 0.00 0.00 0.10 0.00 0.00 0.01 0.05155 3.800 9.02 8.54 0.12 0.05 0.00 1.10 1.10 1.10 0.10 0.05 0.52 0.00 0.00 0.00 0.10 0.00 0.00 0.01 0.05156 3.700 9.02 8.54 0.12 0.05 0.00 1.10 1.10 1.10 0.10 0.05 0.52 0.00 0.00 0.00 0.10 0.00 0.00 0.01 0.05157 3.600 9.02 8.54 0.12 0.05 0.00 1.10 1.10 1.10 0.10 0.05 0.52 0.00 0.00 0.00 0.10 0.00 0.00 0.01 0.05
20 DEG C RATE 0.12 0.00 1.07 0.10 0.50 0.00 0.00 0.00 0.00 0.01AVG 20 DEG C RATE 8.47 0.05 0.05 0.05
* g/sq m/d ** mg/L/day
************************************************ WATER QUALITY CONSTITUENT VALUES *************************************************
ELEM ENDING TEMP SALN CM-I CM-II DO BOD EBOD ORGN NH3 NO3+2 TOTN PHOS CHL A MACRO COLI NCMNO. DIST DEG C PPT * * mg/L mg/L mg/L mg/L mg/L mg/L mg/L mg/L µg/L ** #/100mL *
137 5.600 20.40 0.00 0.00 0.00 8.30 0.85 1.05 0.16 0.00 0.00 0.16 0.00 2.00 19.90 0.00 1.45138 5.500 20.40 0.00 0.00 0.00 8.29 0.85 1.05 0.16 0.00 0.00 0.16 0.00 2.00 19.81 0.00 1.45139 5.400 20.40 0.00 0.00 0.00 8.27 0.85 1.05 0.16 0.00 0.00 0.16 0.00 2.00 19.71 0.00 1.46140 5.300 20.40 0.00 0.00 0.00 8.26 0.85 1.05 0.16 0.00 0.00 0.16 0.00 2.00 19.62 0.00 1.46141 5.200 20.40 0.00 0.00 0.00 8.25 0.85 1.05 0.16 0.00 0.00 0.16 0.00 2.00 19.52 0.00 1.47142 5.100 20.40 0.00 0.00 0.00 8.24 0.85 1.05 0.16 0.00 0.00 0.16 0.00 2.00 19.43 0.00 1.47143 5.000 20.40 0.00 0.00 0.00 8.24 0.85 1.05 0.16 0.00 0.00 0.16 0.00 2.00 19.33 0.00 1.47144 4.900 20.40 0.00 0.00 0.00 8.23 0.85 1.05 0.16 0.00 0.00 0.16 0.00 2.00 19.24 0.00 1.48145 4.800 20.40 0.00 0.00 0.00 8.23 0.85 1.05 0.16 0.00 0.00 0.16 0.00 2.00 19.14 0.00 1.48146 4.700 20.40 0.00 0.00 0.00 8.22 0.85 1.05 0.16 0.00 0.00 0.16 0.00 2.00 19.05 0.00 1.49147 4.600 20.40 0.00 0.00 0.00 8.22 0.84 1.04 0.16 0.00 0.00 0.16 0.00 2.00 18.95 0.00 1.49148 4.500 20.40 0.00 0.00 0.00 8.22 0.84 1.04 0.16 0.00 0.00 0.16 0.00 2.00 18.86 0.00 1.49149 4.400 20.40 0.00 0.00 0.00 8.22 0.84 1.04 0.16 0.00 0.00 0.16 0.00 2.00 18.76 0.00 1.50150 4.300 20.40 0.00 0.00 0.00 8.21 0.84 1.04 0.16 0.00 0.00 0.16 0.00 2.00 18.67 0.00 1.50151 4.200 20.40 0.00 0.00 0.00 8.21 0.84 1.04 0.16 0.00 0.00 0.16 0.00 2.00 18.57 0.00 1.51152 4.100 20.40 0.00 0.00 0.00 8.21 0.84 1.04 0.16 0.00 0.00 0.16 0.00 2.00 18.48 0.00 1.51153 4.000 20.40 0.00 0.00 0.00 8.21 0.84 1.04 0.16 0.00 0.00 0.16 0.00 2.00 18.38 0.00 1.51154 3.900 20.40 0.00 0.00 0.00 8.21 0.84 1.04 0.16 0.00 0.00 0.16 0.00 2.00 18.29 0.00 1.52155 3.800 20.40 0.00 0.00 0.00 8.21 0.84 1.04 0.16 0.00 0.00 0.16 0.00 2.00 18.19 0.00 1.52156 3.700 20.40 0.00 0.00 0.00 8.21 0.84 1.04 0.16 0.00 0.00 0.16 0.00 2.00 18.10 0.00 1.53157 3.600 20.40 0.00 0.00 0.00 8.21 0.84 1.04 0.16 0.00 0.00 0.16 0.00 2.00 18.00 0.00 1.53
* CM-I = CHLORIDES CM-II = SULFATES NCM = CBOD2MG/L MG/L MG/L
** g/cu m
FINAL REPORT UPPER CALCASIEU RVR UPPER CALCASIEU RIVER (030101)- STREAM MODELREACH NO. 9 UPPER CALCASIEU RIVER REACH 9 DISSOLVED OXYGEN, WINTER PROJECTION MODEL
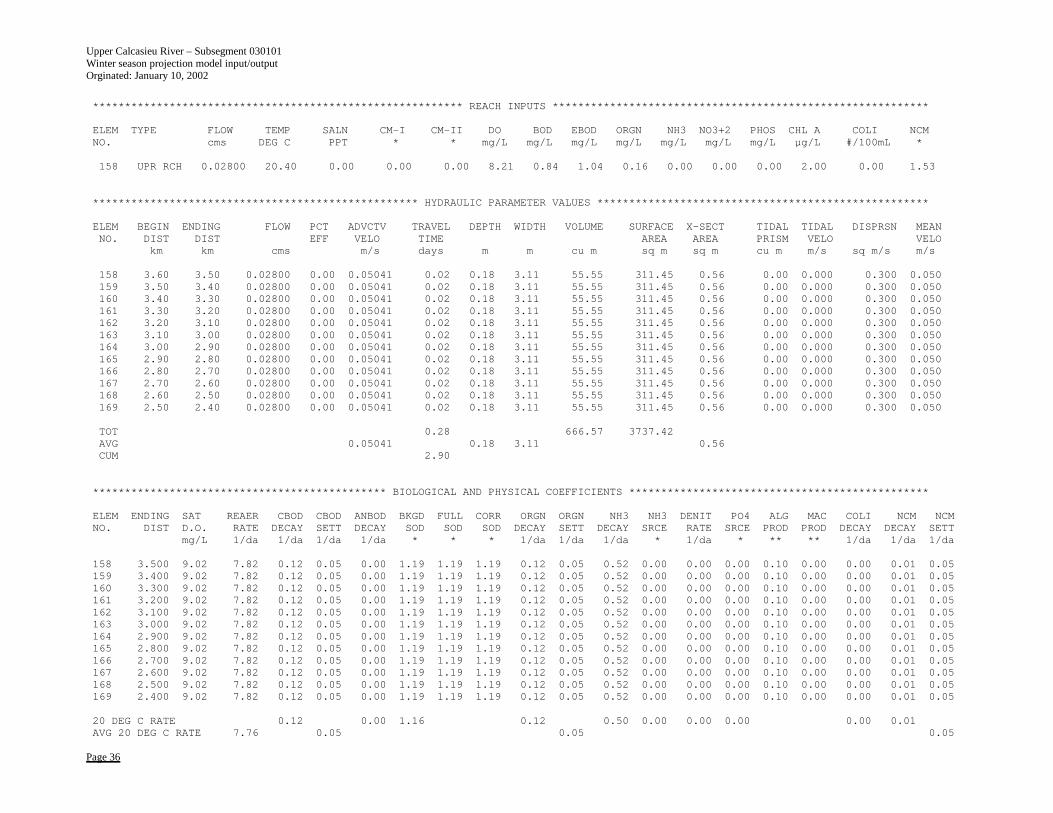
Upper Calcasieu River – Subsegment 030101 Winter season projection model input/output Orginated: January 10, 2002
Page 36
********************************************************** REACH INPUTS ***********************************************************
ELEM TYPE FLOW TEMP SALN CM-I CM-II DO BOD EBOD ORGN NH3 NO3+2 PHOS CHL A COLI NCMNO. cms DEG C PPT * * mg/L mg/L mg/L mg/L mg/L mg/L mg/L µg/L #/100mL *
158 UPR RCH 0.02800 20.40 0.00 0.00 0.00 8.21 0.84 1.04 0.16 0.00 0.00 0.00 2.00 0.00 1.53
*************************************************** HYDRAULIC PARAMETER VALUES ****************************************************
ELEM BEGIN ENDING FLOW PCT ADVCTV TRAVEL DEPTH WIDTH VOLUME SURFACE X-SECT TIDAL TIDAL DISPRSN MEANNO. DIST DIST EFF VELO TIME AREA AREA PRISM VELO VELO
km km cms m/s days m m cu m sq m sq m cu m m/s sq m/s m/s
158 3.60 3.50 0.02800 0.00 0.05041 0.02 0.18 3.11 55.55 311.45 0.56 0.00 0.000 0.300 0.050159 3.50 3.40 0.02800 0.00 0.05041 0.02 0.18 3.11 55.55 311.45 0.56 0.00 0.000 0.300 0.050160 3.40 3.30 0.02800 0.00 0.05041 0.02 0.18 3.11 55.55 311.45 0.56 0.00 0.000 0.300 0.050161 3.30 3.20 0.02800 0.00 0.05041 0.02 0.18 3.11 55.55 311.45 0.56 0.00 0.000 0.300 0.050162 3.20 3.10 0.02800 0.00 0.05041 0.02 0.18 3.11 55.55 311.45 0.56 0.00 0.000 0.300 0.050163 3.10 3.00 0.02800 0.00 0.05041 0.02 0.18 3.11 55.55 311.45 0.56 0.00 0.000 0.300 0.050164 3.00 2.90 0.02800 0.00 0.05041 0.02 0.18 3.11 55.55 311.45 0.56 0.00 0.000 0.300 0.050165 2.90 2.80 0.02800 0.00 0.05041 0.02 0.18 3.11 55.55 311.45 0.56 0.00 0.000 0.300 0.050166 2.80 2.70 0.02800 0.00 0.05041 0.02 0.18 3.11 55.55 311.45 0.56 0.00 0.000 0.300 0.050167 2.70 2.60 0.02800 0.00 0.05041 0.02 0.18 3.11 55.55 311.45 0.56 0.00 0.000 0.300 0.050168 2.60 2.50 0.02800 0.00 0.05041 0.02 0.18 3.11 55.55 311.45 0.56 0.00 0.000 0.300 0.050169 2.50 2.40 0.02800 0.00 0.05041 0.02 0.18 3.11 55.55 311.45 0.56 0.00 0.000 0.300 0.050
TOT 0.28 666.57 3737.42AVG 0.05041 0.18 3.11 0.56CUM 2.90
********************************************** BIOLOGICAL AND PHYSICAL COEFFICIENTS ***********************************************
ELEM ENDING SAT REAER CBOD CBOD ANBOD BKGD FULL CORR ORGN ORGN NH3 NH3 DENIT PO4 ALG MAC COLI NCM NCMNO. DIST D.O. RATE DECAY SETT DECAY SOD SOD SOD DECAY SETT DECAY SRCE RATE SRCE PROD PROD DECAY DECAY SETT
mg/L 1/da 1/da 1/da 1/da * * * 1/da 1/da 1/da * 1/da * ** ** 1/da 1/da 1/da
158 3.500 9.02 7.82 0.12 0.05 0.00 1.19 1.19 1.19 0.12 0.05 0.52 0.00 0.00 0.00 0.10 0.00 0.00 0.01 0.05159 3.400 9.02 7.82 0.12 0.05 0.00 1.19 1.19 1.19 0.12 0.05 0.52 0.00 0.00 0.00 0.10 0.00 0.00 0.01 0.05160 3.300 9.02 7.82 0.12 0.05 0.00 1.19 1.19 1.19 0.12 0.05 0.52 0.00 0.00 0.00 0.10 0.00 0.00 0.01 0.05161 3.200 9.02 7.82 0.12 0.05 0.00 1.19 1.19 1.19 0.12 0.05 0.52 0.00 0.00 0.00 0.10 0.00 0.00 0.01 0.05162 3.100 9.02 7.82 0.12 0.05 0.00 1.19 1.19 1.19 0.12 0.05 0.52 0.00 0.00 0.00 0.10 0.00 0.00 0.01 0.05163 3.000 9.02 7.82 0.12 0.05 0.00 1.19 1.19 1.19 0.12 0.05 0.52 0.00 0.00 0.00 0.10 0.00 0.00 0.01 0.05164 2.900 9.02 7.82 0.12 0.05 0.00 1.19 1.19 1.19 0.12 0.05 0.52 0.00 0.00 0.00 0.10 0.00 0.00 0.01 0.05165 2.800 9.02 7.82 0.12 0.05 0.00 1.19 1.19 1.19 0.12 0.05 0.52 0.00 0.00 0.00 0.10 0.00 0.00 0.01 0.05166 2.700 9.02 7.82 0.12 0.05 0.00 1.19 1.19 1.19 0.12 0.05 0.52 0.00 0.00 0.00 0.10 0.00 0.00 0.01 0.05167 2.600 9.02 7.82 0.12 0.05 0.00 1.19 1.19 1.19 0.12 0.05 0.52 0.00 0.00 0.00 0.10 0.00 0.00 0.01 0.05168 2.500 9.02 7.82 0.12 0.05 0.00 1.19 1.19 1.19 0.12 0.05 0.52 0.00 0.00 0.00 0.10 0.00 0.00 0.01 0.05169 2.400 9.02 7.82 0.12 0.05 0.00 1.19 1.19 1.19 0.12 0.05 0.52 0.00 0.00 0.00 0.10 0.00 0.00 0.01 0.05
20 DEG C RATE 0.12 0.00 1.16 0.12 0.50 0.00 0.00 0.00 0.00 0.01AVG 20 DEG C RATE 7.76 0.05 0.05 0.05
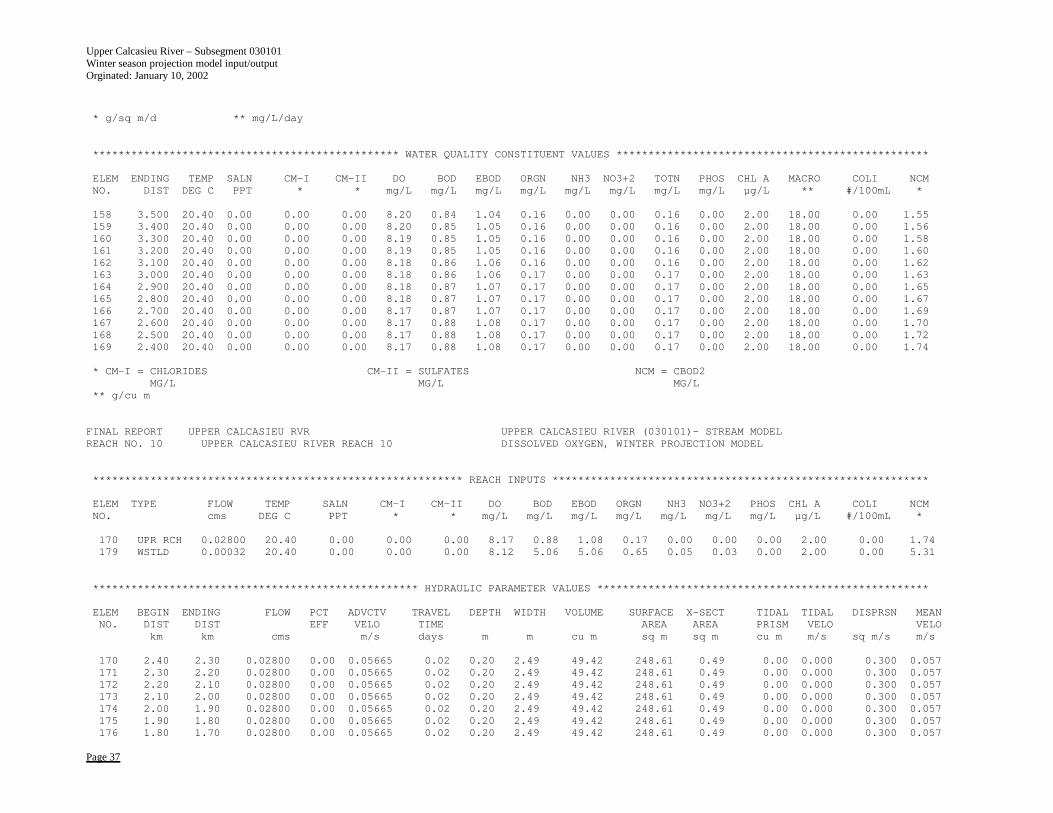
Upper Calcasieu River – Subsegment 030101 Winter season projection model input/output Orginated: January 10, 2002
Page 37
* g/sq m/d ** mg/L/day
************************************************ WATER QUALITY CONSTITUENT VALUES *************************************************
ELEM ENDING TEMP SALN CM-I CM-II DO BOD EBOD ORGN NH3 NO3+2 TOTN PHOS CHL A MACRO COLI NCMNO. DIST DEG C PPT * * mg/L mg/L mg/L mg/L mg/L mg/L mg/L mg/L µg/L ** #/100mL *
158 3.500 20.40 0.00 0.00 0.00 8.20 0.84 1.04 0.16 0.00 0.00 0.16 0.00 2.00 18.00 0.00 1.55159 3.400 20.40 0.00 0.00 0.00 8.20 0.85 1.05 0.16 0.00 0.00 0.16 0.00 2.00 18.00 0.00 1.56160 3.300 20.40 0.00 0.00 0.00 8.19 0.85 1.05 0.16 0.00 0.00 0.16 0.00 2.00 18.00 0.00 1.58161 3.200 20.40 0.00 0.00 0.00 8.19 0.85 1.05 0.16 0.00 0.00 0.16 0.00 2.00 18.00 0.00 1.60162 3.100 20.40 0.00 0.00 0.00 8.18 0.86 1.06 0.16 0.00 0.00 0.16 0.00 2.00 18.00 0.00 1.62163 3.000 20.40 0.00 0.00 0.00 8.18 0.86 1.06 0.17 0.00 0.00 0.17 0.00 2.00 18.00 0.00 1.63164 2.900 20.40 0.00 0.00 0.00 8.18 0.87 1.07 0.17 0.00 0.00 0.17 0.00 2.00 18.00 0.00 1.65165 2.800 20.40 0.00 0.00 0.00 8.18 0.87 1.07 0.17 0.00 0.00 0.17 0.00 2.00 18.00 0.00 1.67166 2.700 20.40 0.00 0.00 0.00 8.17 0.87 1.07 0.17 0.00 0.00 0.17 0.00 2.00 18.00 0.00 1.69167 2.600 20.40 0.00 0.00 0.00 8.17 0.88 1.08 0.17 0.00 0.00 0.17 0.00 2.00 18.00 0.00 1.70168 2.500 20.40 0.00 0.00 0.00 8.17 0.88 1.08 0.17 0.00 0.00 0.17 0.00 2.00 18.00 0.00 1.72169 2.400 20.40 0.00 0.00 0.00 8.17 0.88 1.08 0.17 0.00 0.00 0.17 0.00 2.00 18.00 0.00 1.74
* CM-I = CHLORIDES CM-II = SULFATES NCM = CBOD2MG/L MG/L MG/L
** g/cu m
FINAL REPORT UPPER CALCASIEU RVR UPPER CALCASIEU RIVER (030101)- STREAM MODELREACH NO. 10 UPPER CALCASIEU RIVER REACH 10 DISSOLVED OXYGEN, WINTER PROJECTION MODEL
********************************************************** REACH INPUTS ***********************************************************
ELEM TYPE FLOW TEMP SALN CM-I CM-II DO BOD EBOD ORGN NH3 NO3+2 PHOS CHL A COLI NCMNO. cms DEG C PPT * * mg/L mg/L mg/L mg/L mg/L mg/L mg/L µg/L #/100mL *
170 UPR RCH 0.02800 20.40 0.00 0.00 0.00 8.17 0.88 1.08 0.17 0.00 0.00 0.00 2.00 0.00 1.74179 WSTLD 0.00032 20.40 0.00 0.00 0.00 8.12 5.06 5.06 0.65 0.05 0.03 0.00 2.00 0.00 5.31
*************************************************** HYDRAULIC PARAMETER VALUES ****************************************************
ELEM BEGIN ENDING FLOW PCT ADVCTV TRAVEL DEPTH WIDTH VOLUME SURFACE X-SECT TIDAL TIDAL DISPRSN MEANNO. DIST DIST EFF VELO TIME AREA AREA PRISM VELO VELO
km km cms m/s days m m cu m sq m sq m cu m m/s sq m/s m/s
170 2.40 2.30 0.02800 0.00 0.05665 0.02 0.20 2.49 49.42 248.61 0.49 0.00 0.000 0.300 0.057171 2.30 2.20 0.02800 0.00 0.05665 0.02 0.20 2.49 49.42 248.61 0.49 0.00 0.000 0.300 0.057172 2.20 2.10 0.02800 0.00 0.05665 0.02 0.20 2.49 49.42 248.61 0.49 0.00 0.000 0.300 0.057173 2.10 2.00 0.02800 0.00 0.05665 0.02 0.20 2.49 49.42 248.61 0.49 0.00 0.000 0.300 0.057174 2.00 1.90 0.02800 0.00 0.05665 0.02 0.20 2.49 49.42 248.61 0.49 0.00 0.000 0.300 0.057175 1.90 1.80 0.02800 0.00 0.05665 0.02 0.20 2.49 49.42 248.61 0.49 0.00 0.000 0.300 0.057176 1.80 1.70 0.02800 0.00 0.05665 0.02 0.20 2.49 49.42 248.61 0.49 0.00 0.000 0.300 0.057
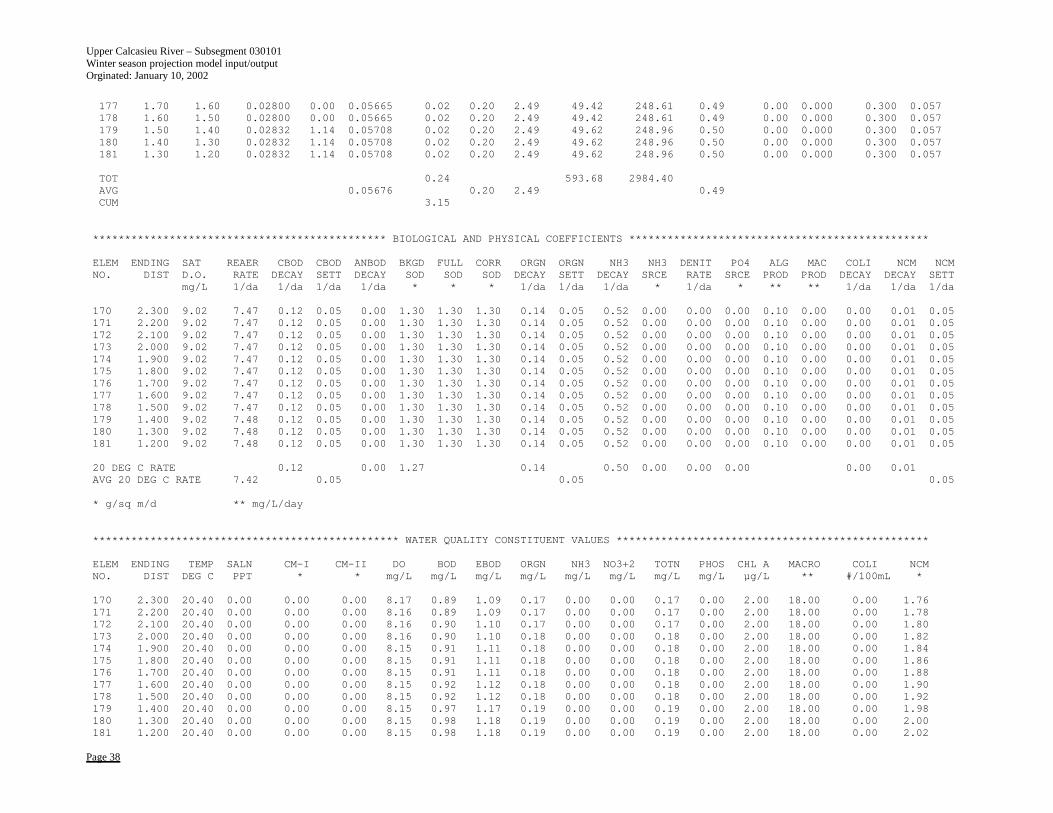
Upper Calcasieu River – Subsegment 030101 Winter season projection model input/output Orginated: January 10, 2002
Page 38
177 1.70 1.60 0.02800 0.00 0.05665 0.02 0.20 2.49 49.42 248.61 0.49 0.00 0.000 0.300 0.057178 1.60 1.50 0.02800 0.00 0.05665 0.02 0.20 2.49 49.42 248.61 0.49 0.00 0.000 0.300 0.057179 1.50 1.40 0.02832 1.14 0.05708 0.02 0.20 2.49 49.62 248.96 0.50 0.00 0.000 0.300 0.057180 1.40 1.30 0.02832 1.14 0.05708 0.02 0.20 2.49 49.62 248.96 0.50 0.00 0.000 0.300 0.057181 1.30 1.20 0.02832 1.14 0.05708 0.02 0.20 2.49 49.62 248.96 0.50 0.00 0.000 0.300 0.057
TOT 0.24 593.68 2984.40AVG 0.05676 0.20 2.49 0.49CUM 3.15
********************************************** BIOLOGICAL AND PHYSICAL COEFFICIENTS ***********************************************
ELEM ENDING SAT REAER CBOD CBOD ANBOD BKGD FULL CORR ORGN ORGN NH3 NH3 DENIT PO4 ALG MAC COLI NCM NCMNO. DIST D.O. RATE DECAY SETT DECAY SOD SOD SOD DECAY SETT DECAY SRCE RATE SRCE PROD PROD DECAY DECAY SETT
mg/L 1/da 1/da 1/da 1/da * * * 1/da 1/da 1/da * 1/da * ** ** 1/da 1/da 1/da
170 2.300 9.02 7.47 0.12 0.05 0.00 1.30 1.30 1.30 0.14 0.05 0.52 0.00 0.00 0.00 0.10 0.00 0.00 0.01 0.05171 2.200 9.02 7.47 0.12 0.05 0.00 1.30 1.30 1.30 0.14 0.05 0.52 0.00 0.00 0.00 0.10 0.00 0.00 0.01 0.05172 2.100 9.02 7.47 0.12 0.05 0.00 1.30 1.30 1.30 0.14 0.05 0.52 0.00 0.00 0.00 0.10 0.00 0.00 0.01 0.05173 2.000 9.02 7.47 0.12 0.05 0.00 1.30 1.30 1.30 0.14 0.05 0.52 0.00 0.00 0.00 0.10 0.00 0.00 0.01 0.05174 1.900 9.02 7.47 0.12 0.05 0.00 1.30 1.30 1.30 0.14 0.05 0.52 0.00 0.00 0.00 0.10 0.00 0.00 0.01 0.05175 1.800 9.02 7.47 0.12 0.05 0.00 1.30 1.30 1.30 0.14 0.05 0.52 0.00 0.00 0.00 0.10 0.00 0.00 0.01 0.05176 1.700 9.02 7.47 0.12 0.05 0.00 1.30 1.30 1.30 0.14 0.05 0.52 0.00 0.00 0.00 0.10 0.00 0.00 0.01 0.05177 1.600 9.02 7.47 0.12 0.05 0.00 1.30 1.30 1.30 0.14 0.05 0.52 0.00 0.00 0.00 0.10 0.00 0.00 0.01 0.05178 1.500 9.02 7.47 0.12 0.05 0.00 1.30 1.30 1.30 0.14 0.05 0.52 0.00 0.00 0.00 0.10 0.00 0.00 0.01 0.05179 1.400 9.02 7.48 0.12 0.05 0.00 1.30 1.30 1.30 0.14 0.05 0.52 0.00 0.00 0.00 0.10 0.00 0.00 0.01 0.05180 1.300 9.02 7.48 0.12 0.05 0.00 1.30 1.30 1.30 0.14 0.05 0.52 0.00 0.00 0.00 0.10 0.00 0.00 0.01 0.05181 1.200 9.02 7.48 0.12 0.05 0.00 1.30 1.30 1.30 0.14 0.05 0.52 0.00 0.00 0.00 0.10 0.00 0.00 0.01 0.05
20 DEG C RATE 0.12 0.00 1.27 0.14 0.50 0.00 0.00 0.00 0.00 0.01AVG 20 DEG C RATE 7.42 0.05 0.05 0.05
* g/sq m/d ** mg/L/day
************************************************ WATER QUALITY CONSTITUENT VALUES *************************************************
ELEM ENDING TEMP SALN CM-I CM-II DO BOD EBOD ORGN NH3 NO3+2 TOTN PHOS CHL A MACRO COLI NCMNO. DIST DEG C PPT * * mg/L mg/L mg/L mg/L mg/L mg/L mg/L mg/L µg/L ** #/100mL *
170 2.300 20.40 0.00 0.00 0.00 8.17 0.89 1.09 0.17 0.00 0.00 0.17 0.00 2.00 18.00 0.00 1.76171 2.200 20.40 0.00 0.00 0.00 8.16 0.89 1.09 0.17 0.00 0.00 0.17 0.00 2.00 18.00 0.00 1.78172 2.100 20.40 0.00 0.00 0.00 8.16 0.90 1.10 0.17 0.00 0.00 0.17 0.00 2.00 18.00 0.00 1.80173 2.000 20.40 0.00 0.00 0.00 8.16 0.90 1.10 0.18 0.00 0.00 0.18 0.00 2.00 18.00 0.00 1.82174 1.900 20.40 0.00 0.00 0.00 8.15 0.91 1.11 0.18 0.00 0.00 0.18 0.00 2.00 18.00 0.00 1.84175 1.800 20.40 0.00 0.00 0.00 8.15 0.91 1.11 0.18 0.00 0.00 0.18 0.00 2.00 18.00 0.00 1.86176 1.700 20.40 0.00 0.00 0.00 8.15 0.91 1.11 0.18 0.00 0.00 0.18 0.00 2.00 18.00 0.00 1.88177 1.600 20.40 0.00 0.00 0.00 8.15 0.92 1.12 0.18 0.00 0.00 0.18 0.00 2.00 18.00 0.00 1.90178 1.500 20.40 0.00 0.00 0.00 8.15 0.92 1.12 0.18 0.00 0.00 0.18 0.00 2.00 18.00 0.00 1.92179 1.400 20.40 0.00 0.00 0.00 8.15 0.97 1.17 0.19 0.00 0.00 0.19 0.00 2.00 18.00 0.00 1.98180 1.300 20.40 0.00 0.00 0.00 8.15 0.98 1.18 0.19 0.00 0.00 0.19 0.00 2.00 18.00 0.00 2.00181 1.200 20.40 0.00 0.00 0.00 8.15 0.98 1.18 0.19 0.00 0.00 0.19 0.00 2.00 18.00 0.00 2.02
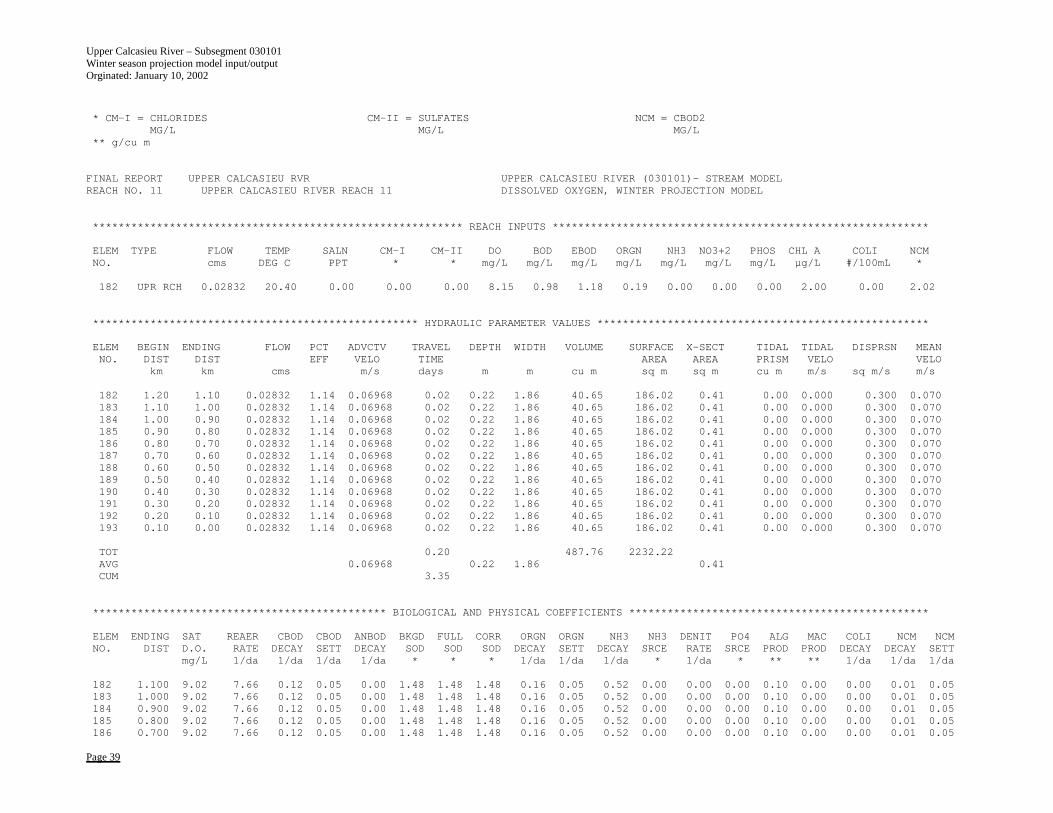
Upper Calcasieu River – Subsegment 030101 Winter season projection model input/output Orginated: January 10, 2002
Page 39
* CM-I = CHLORIDES CM-II = SULFATES NCM = CBOD2MG/L MG/L MG/L
** g/cu m
FINAL REPORT UPPER CALCASIEU RVR UPPER CALCASIEU RIVER (030101)- STREAM MODELREACH NO. 11 UPPER CALCASIEU RIVER REACH 11 DISSOLVED OXYGEN, WINTER PROJECTION MODEL
********************************************************** REACH INPUTS ***********************************************************
ELEM TYPE FLOW TEMP SALN CM-I CM-II DO BOD EBOD ORGN NH3 NO3+2 PHOS CHL A COLI NCMNO. cms DEG C PPT * * mg/L mg/L mg/L mg/L mg/L mg/L mg/L µg/L #/100mL *
182 UPR RCH 0.02832 20.40 0.00 0.00 0.00 8.15 0.98 1.18 0.19 0.00 0.00 0.00 2.00 0.00 2.02
*************************************************** HYDRAULIC PARAMETER VALUES ****************************************************
ELEM BEGIN ENDING FLOW PCT ADVCTV TRAVEL DEPTH WIDTH VOLUME SURFACE X-SECT TIDAL TIDAL DISPRSN MEANNO. DIST DIST EFF VELO TIME AREA AREA PRISM VELO VELO
km km cms m/s days m m cu m sq m sq m cu m m/s sq m/s m/s
182 1.20 1.10 0.02832 1.14 0.06968 0.02 0.22 1.86 40.65 186.02 0.41 0.00 0.000 0.300 0.070183 1.10 1.00 0.02832 1.14 0.06968 0.02 0.22 1.86 40.65 186.02 0.41 0.00 0.000 0.300 0.070184 1.00 0.90 0.02832 1.14 0.06968 0.02 0.22 1.86 40.65 186.02 0.41 0.00 0.000 0.300 0.070185 0.90 0.80 0.02832 1.14 0.06968 0.02 0.22 1.86 40.65 186.02 0.41 0.00 0.000 0.300 0.070186 0.80 0.70 0.02832 1.14 0.06968 0.02 0.22 1.86 40.65 186.02 0.41 0.00 0.000 0.300 0.070187 0.70 0.60 0.02832 1.14 0.06968 0.02 0.22 1.86 40.65 186.02 0.41 0.00 0.000 0.300 0.070188 0.60 0.50 0.02832 1.14 0.06968 0.02 0.22 1.86 40.65 186.02 0.41 0.00 0.000 0.300 0.070189 0.50 0.40 0.02832 1.14 0.06968 0.02 0.22 1.86 40.65 186.02 0.41 0.00 0.000 0.300 0.070190 0.40 0.30 0.02832 1.14 0.06968 0.02 0.22 1.86 40.65 186.02 0.41 0.00 0.000 0.300 0.070191 0.30 0.20 0.02832 1.14 0.06968 0.02 0.22 1.86 40.65 186.02 0.41 0.00 0.000 0.300 0.070192 0.20 0.10 0.02832 1.14 0.06968 0.02 0.22 1.86 40.65 186.02 0.41 0.00 0.000 0.300 0.070193 0.10 0.00 0.02832 1.14 0.06968 0.02 0.22 1.86 40.65 186.02 0.41 0.00 0.000 0.300 0.070
TOT 0.20 487.76 2232.22AVG 0.06968 0.22 1.86 0.41CUM 3.35
********************************************** BIOLOGICAL AND PHYSICAL COEFFICIENTS ***********************************************
ELEM ENDING SAT REAER CBOD CBOD ANBOD BKGD FULL CORR ORGN ORGN NH3 NH3 DENIT PO4 ALG MAC COLI NCM NCMNO. DIST D.O. RATE DECAY SETT DECAY SOD SOD SOD DECAY SETT DECAY SRCE RATE SRCE PROD PROD DECAY DECAY SETT
mg/L 1/da 1/da 1/da 1/da * * * 1/da 1/da 1/da * 1/da * ** ** 1/da 1/da 1/da
182 1.100 9.02 7.66 0.12 0.05 0.00 1.48 1.48 1.48 0.16 0.05 0.52 0.00 0.00 0.00 0.10 0.00 0.00 0.01 0.05183 1.000 9.02 7.66 0.12 0.05 0.00 1.48 1.48 1.48 0.16 0.05 0.52 0.00 0.00 0.00 0.10 0.00 0.00 0.01 0.05184 0.900 9.02 7.66 0.12 0.05 0.00 1.48 1.48 1.48 0.16 0.05 0.52 0.00 0.00 0.00 0.10 0.00 0.00 0.01 0.05185 0.800 9.02 7.66 0.12 0.05 0.00 1.48 1.48 1.48 0.16 0.05 0.52 0.00 0.00 0.00 0.10 0.00 0.00 0.01 0.05186 0.700 9.02 7.66 0.12 0.05 0.00 1.48 1.48 1.48 0.16 0.05 0.52 0.00 0.00 0.00 0.10 0.00 0.00 0.01 0.05
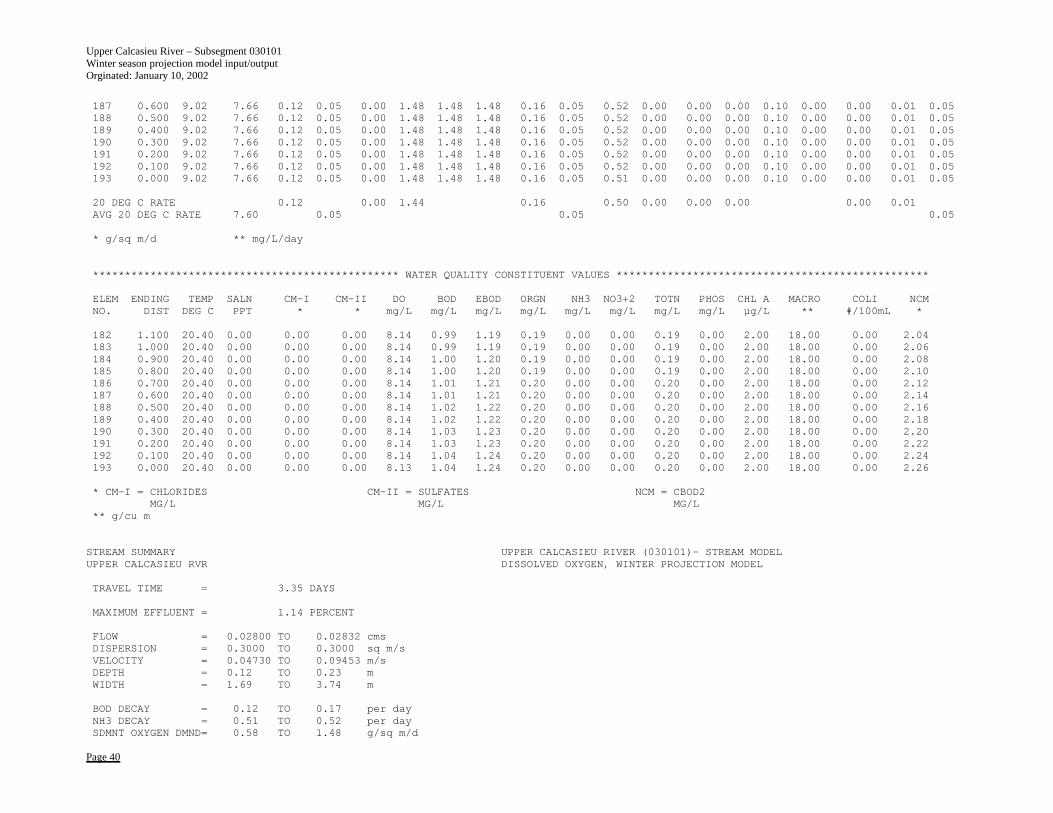
Upper Calcasieu River – Subsegment 030101 Winter season projection model input/output Orginated: January 10, 2002
Page 40
187 0.600 9.02 7.66 0.12 0.05 0.00 1.48 1.48 1.48 0.16 0.05 0.52 0.00 0.00 0.00 0.10 0.00 0.00 0.01 0.05188 0.500 9.02 7.66 0.12 0.05 0.00 1.48 1.48 1.48 0.16 0.05 0.52 0.00 0.00 0.00 0.10 0.00 0.00 0.01 0.05189 0.400 9.02 7.66 0.12 0.05 0.00 1.48 1.48 1.48 0.16 0.05 0.52 0.00 0.00 0.00 0.10 0.00 0.00 0.01 0.05190 0.300 9.02 7.66 0.12 0.05 0.00 1.48 1.48 1.48 0.16 0.05 0.52 0.00 0.00 0.00 0.10 0.00 0.00 0.01 0.05191 0.200 9.02 7.66 0.12 0.05 0.00 1.48 1.48 1.48 0.16 0.05 0.52 0.00 0.00 0.00 0.10 0.00 0.00 0.01 0.05192 0.100 9.02 7.66 0.12 0.05 0.00 1.48 1.48 1.48 0.16 0.05 0.52 0.00 0.00 0.00 0.10 0.00 0.00 0.01 0.05193 0.000 9.02 7.66 0.12 0.05 0.00 1.48 1.48 1.48 0.16 0.05 0.51 0.00 0.00 0.00 0.10 0.00 0.00 0.01 0.05
20 DEG C RATE 0.12 0.00 1.44 0.16 0.50 0.00 0.00 0.00 0.00 0.01AVG 20 DEG C RATE 7.60 0.05 0.05 0.05
* g/sq m/d ** mg/L/day
************************************************ WATER QUALITY CONSTITUENT VALUES *************************************************
ELEM ENDING TEMP SALN CM-I CM-II DO BOD EBOD ORGN NH3 NO3+2 TOTN PHOS CHL A MACRO COLI NCMNO. DIST DEG C PPT * * mg/L mg/L mg/L mg/L mg/L mg/L mg/L mg/L µg/L ** #/100mL *
182 1.100 20.40 0.00 0.00 0.00 8.14 0.99 1.19 0.19 0.00 0.00 0.19 0.00 2.00 18.00 0.00 2.04183 1.000 20.40 0.00 0.00 0.00 8.14 0.99 1.19 0.19 0.00 0.00 0.19 0.00 2.00 18.00 0.00 2.06184 0.900 20.40 0.00 0.00 0.00 8.14 1.00 1.20 0.19 0.00 0.00 0.19 0.00 2.00 18.00 0.00 2.08185 0.800 20.40 0.00 0.00 0.00 8.14 1.00 1.20 0.19 0.00 0.00 0.19 0.00 2.00 18.00 0.00 2.10186 0.700 20.40 0.00 0.00 0.00 8.14 1.01 1.21 0.20 0.00 0.00 0.20 0.00 2.00 18.00 0.00 2.12187 0.600 20.40 0.00 0.00 0.00 8.14 1.01 1.21 0.20 0.00 0.00 0.20 0.00 2.00 18.00 0.00 2.14188 0.500 20.40 0.00 0.00 0.00 8.14 1.02 1.22 0.20 0.00 0.00 0.20 0.00 2.00 18.00 0.00 2.16189 0.400 20.40 0.00 0.00 0.00 8.14 1.02 1.22 0.20 0.00 0.00 0.20 0.00 2.00 18.00 0.00 2.18190 0.300 20.40 0.00 0.00 0.00 8.14 1.03 1.23 0.20 0.00 0.00 0.20 0.00 2.00 18.00 0.00 2.20191 0.200 20.40 0.00 0.00 0.00 8.14 1.03 1.23 0.20 0.00 0.00 0.20 0.00 2.00 18.00 0.00 2.22192 0.100 20.40 0.00 0.00 0.00 8.14 1.04 1.24 0.20 0.00 0.00 0.20 0.00 2.00 18.00 0.00 2.24193 0.000 20.40 0.00 0.00 0.00 8.13 1.04 1.24 0.20 0.00 0.00 0.20 0.00 2.00 18.00 0.00 2.26
* CM-I = CHLORIDES CM-II = SULFATES NCM = CBOD2MG/L MG/L MG/L
** g/cu m
STREAM SUMMARY UPPER CALCASIEU RIVER (030101)- STREAM MODELUPPER CALCASIEU RVR DISSOLVED OXYGEN, WINTER PROJECTION MODEL
TRAVEL TIME = 3.35 DAYS
MAXIMUM EFFLUENT = 1.14 PERCENT
FLOW = 0.02800 TO 0.02832 cmsDISPERSION = 0.3000 TO 0.3000 sq m/sVELOCITY = 0.04730 TO 0.09453 m/sDEPTH = 0.12 TO 0.23 mWIDTH = 1.69 TO 3.74 m
BOD DECAY = 0.12 TO 0.17 per dayNH3 DECAY = 0.51 TO 0.52 per daySDMNT OXYGEN DMND= 0.58 TO 1.48 g/sq m/d
Upper Calcasieu River – Subsegment 030101 Winter season projection model input/output Orginated: January 10, 2002
Page 41
NH3 SOURCE = 0.00 TO 0.00 g/sq m/dREAERATION = 7.39 TO 17.38 per dayBOD SETTLING = 0.05 TO 0.05 per dayORGN DECAY = 0.03 TO 0.24 per dayORGN SETTLING = 0.05 TO 0.05 per day
TEMPERATURE = 20.40 TO 20.40 deg CDISSOLVED OXYGEN = 8.13 TO 8.62 mg/L
.....EXECUTION COMPLETED
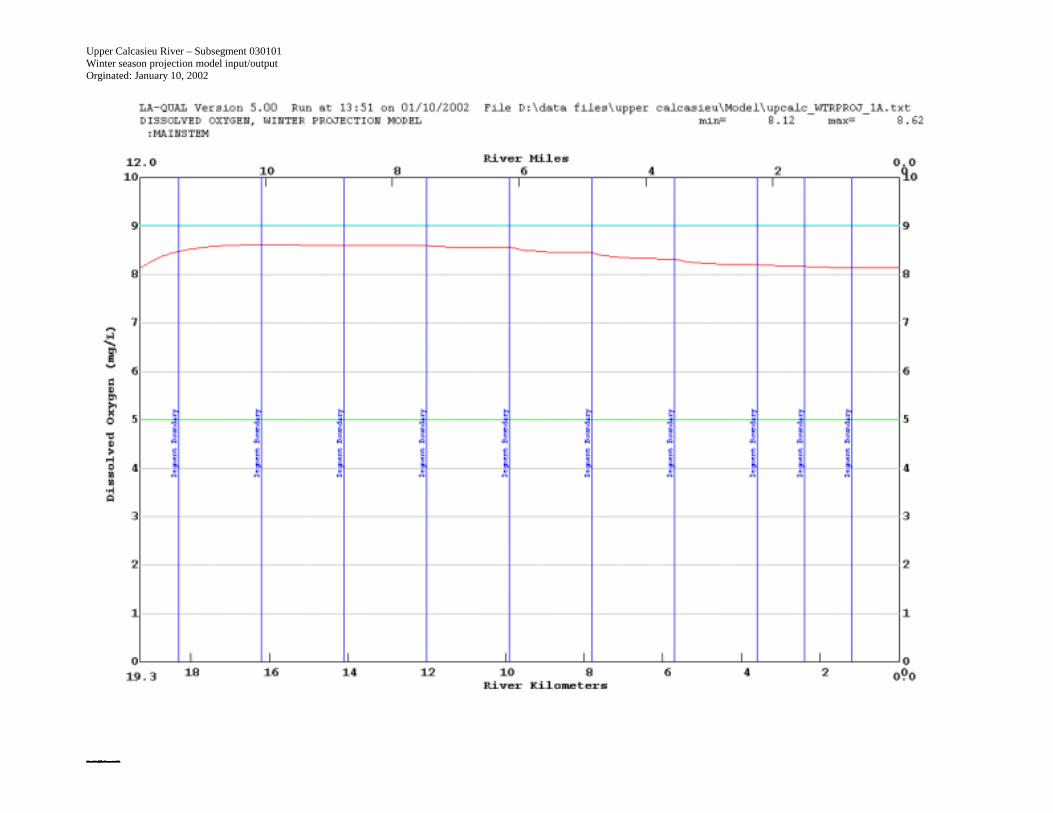
Upper Calcasieu River – Subsegment 030101 Winter season projection model input/output Orginated: January 10, 2002
Page 42

Upper Calcasieu River – Subsegment 030101 Winter season projection model input/output Orginated: January 10, 2002
Page 43
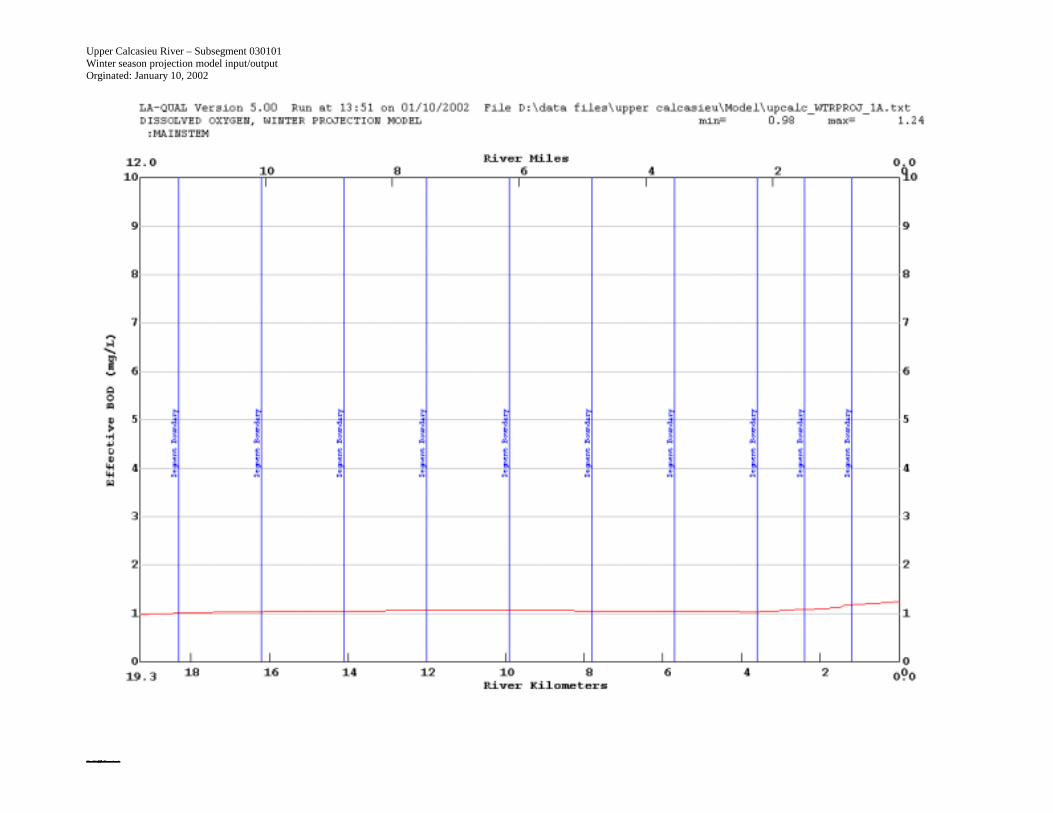
Upper Calcasieu River – Subsegment 030101 Winter season projection model input/output Orginated: January 10, 2002
Page 44
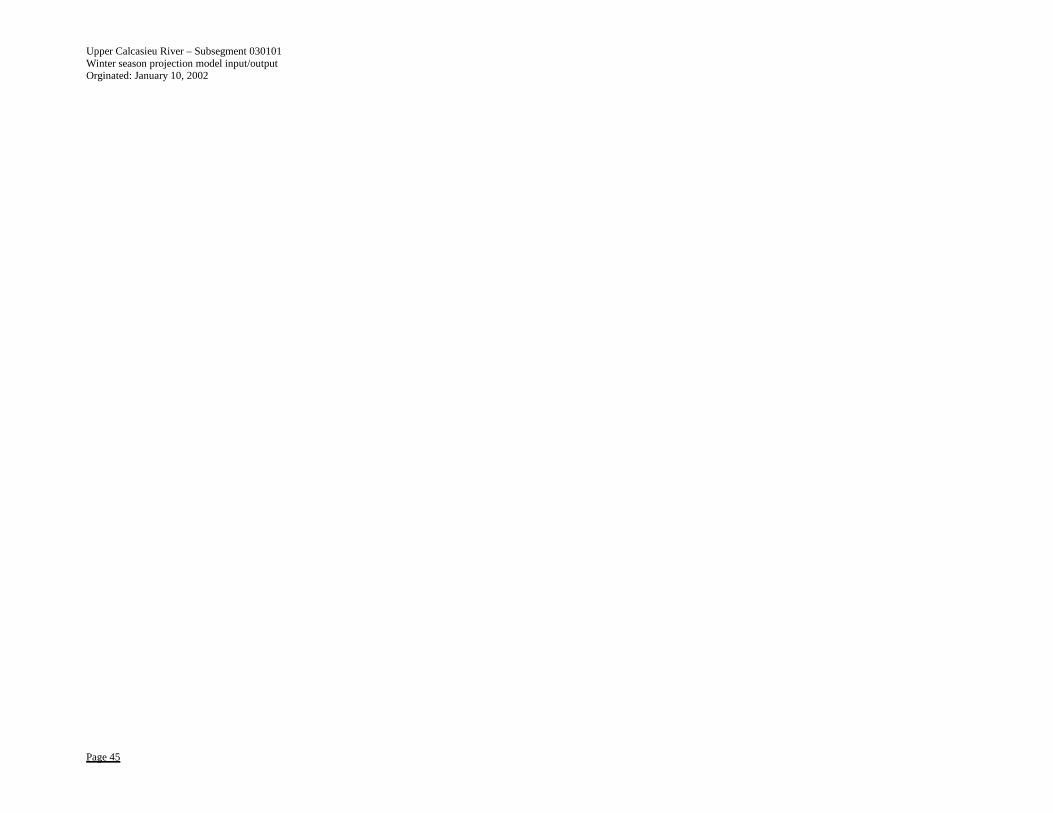
Upper Calcasieu River – Subsegment 030101 Winter season projection model input/output Orginated: January 10, 2002
Page 45

Upper Calcasieu River – Subsegment 030101 Winter season projection model input/output Orginated: January 10, 2002
Page 46

Upper Calcasieu River – Subsegment 030101 Winter season projection model input/output Orginated: January 10, 2002
Page 47
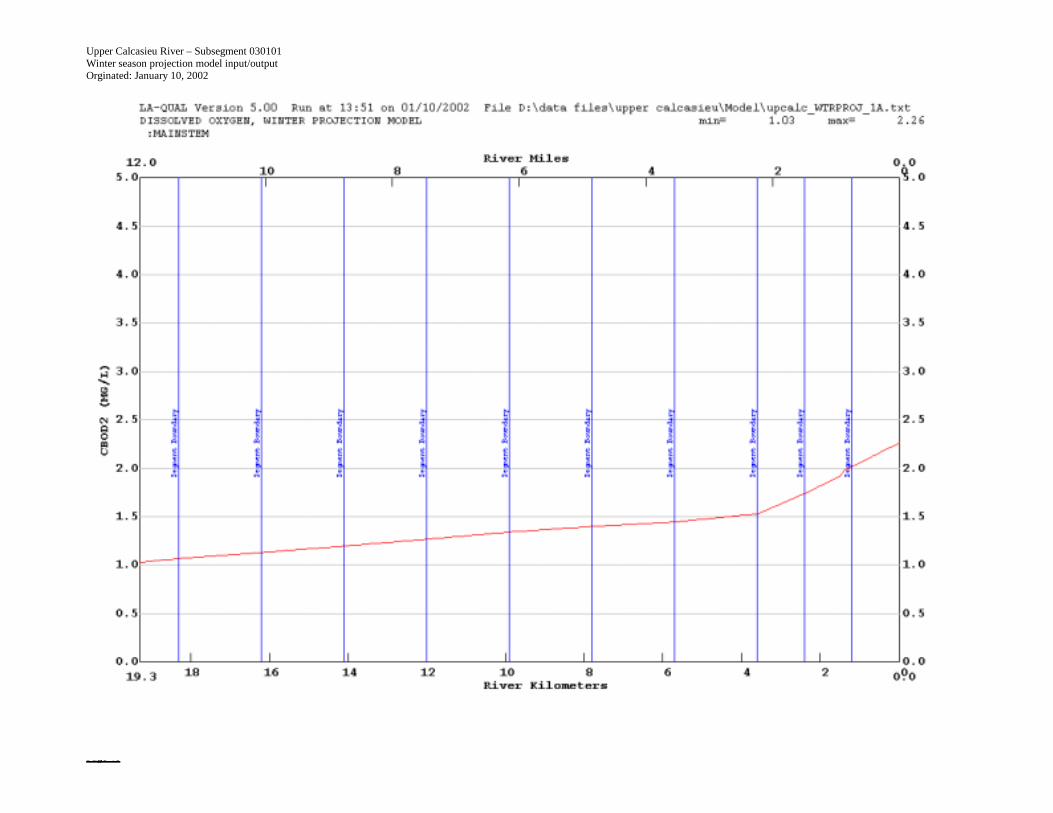
Upper Calcasieu River – Subsegment 030101 Winter season projection model input/output Orginated: January 10, 2002
Page 48

Upper Calcasieu River – Subsegment 030101 Winter season projection model input/output Orginated: January 10, 2002
Page 49
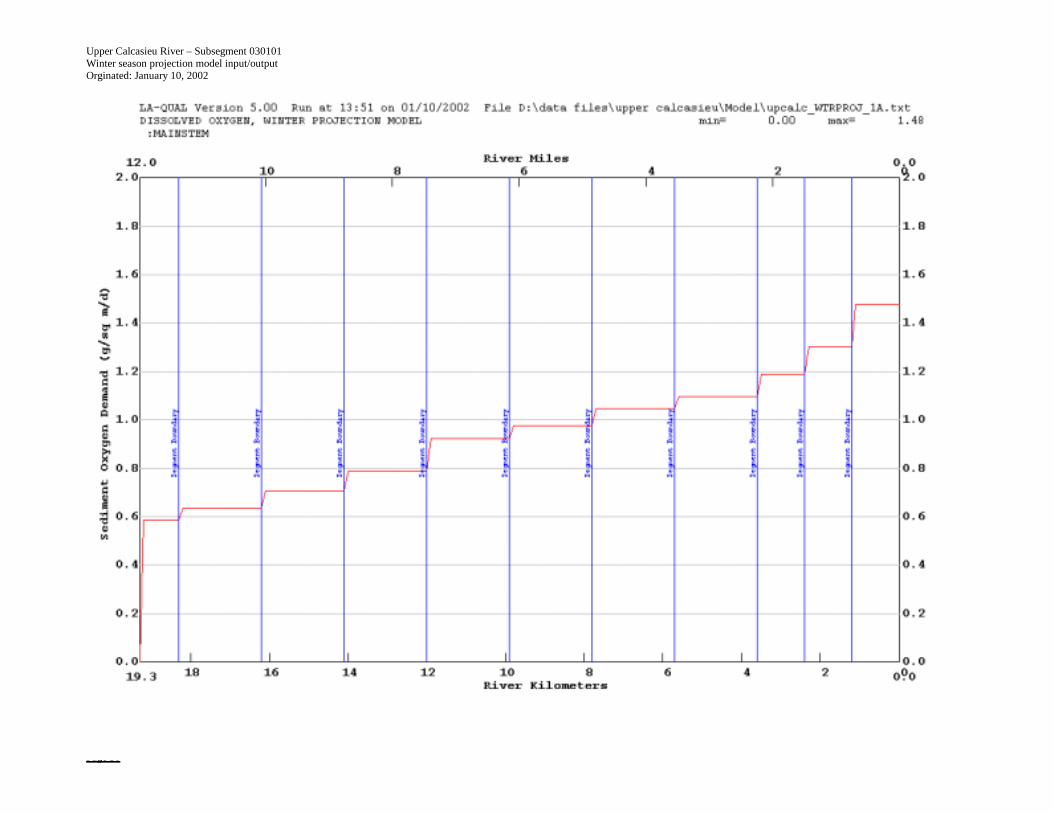
Upper Calcasieu River – Subsegment 030101 Winter season projection model input/output Orginated: January 10, 2002
Page 50

Upper Calcasieu River Watershed TMDL for Dissolved Oxygen Subsegment 080808 Originated: January 9, 2002
35
Appendix B5
Projection Model Development
Winter projection model justifications
Upper Calcasieu River (030101) W.Q. Winter Projection Input Description
DATA TYPE 3, Program Constants
Description of Constant Value Result Source/Justification
Maximum iteration limit 200.0 Standard
Plot type 3.0 Creates line printer plots for WQ parameters. For reporting purposes.
Final report type 1.0 Report for all reach and stream summaries. For reporting purposes.
BOD oxygen uptake rate 1.0Indicates CBOD1 component model inputs are in
ultimate BOD.
Modeler's Preference, the BOD model parameter was set to the CBOD1
component.
KL Minimum 0.7 Minimum KL to be used. The minimum KL of 2.3 ft/day converted to 0.70 m/day.
K2 Maximum 20.0 Maximum K2 @20C model will allow.Due to the shallow depths in this waterbody, it was felt that this value would
allow a more appropriate representation of the actual conditions.
N Algal uptake 0.0025Net nitrogen uptake per unit of chlorophyll a (mg
N/ug chlorophyll a /day).Recommended model default value.
N Preference 0.35Determines the nitrogen preference of algae and/or
macrophytes.Determine during calibration.
N Macrophyte Uptake 0.0025Net nitrogen uptake per unit of macrophyte (mg
N/mg macrophyte/day).Recommended model default value.
Macrophyte Oxygen Prod 0.0000Net oxygen production per unit of macrophyte (mg
O/mg macrophyte/day).
Assumed the uptake was caused by the vegetation in the riparian zone, thus
there would not be oxygen production into the stream.
NCM Oxygen uptake rate 1.0Indicates CBOD2 component model inputs are in
ultimate BOD.
Modeler's Preference, the NCM model parameter was set to the CBOD2
component.
Inhibition control value 3.0 Inhibits all decay rates except SOD for low DO. Standard LA modeling procedure.
N Inhibition equation 1.0Chooses linear or modified equation for nitrogen
inhibition.
BPJ. Linear equation simulated the calibration conditions more accurate
manner than the modified equation.
Ocean exchange ratio 0.0 Set 0% tidal exchange at lower boundary.This was done to allow dispersion in the model but not to force the bottom
element through the boundary conditions.
Hydraulic calculation method 2.0 Sets the Hydraulic calc. to width and depth coef.
The low slopes in this waterbody cause a substantial amount of water to be
present during critical flow conditions, making the Leopold relationships
inaccurate. This method allows the model to predict a more accurate depth
and width during low flow conditions.
Settled rate units. 2.0 Sets the settled rate to a velocity (1/day).Due to the depths in this waterbody, it was felt that this method would be a
more appropriate representation of the actual conditions.
Algae oxygen prod 0.050 Sets the net oxygen production per chlorophyll a. Recommended model default value.
Effective BOD due to Algae 0.1 Sets the effect that decaying algae will have on BOD. Recommended model manual's value.
NH3 Oxygen Uptake Rate 4.33The oxygen uptake rate per unit of ammonia oxidized
(mg 0/mg N).Recommended model default value.
Page 1 of 24 Datatype 3 - Program Constants 1/9/02

Upper Calcasieu River (030101) W.Q. Winter Projection Input Description
DATA TYPE 4, Temperature Correction Constants
Description of Coefficient Value Source/Justification
NCM DECA 1.047LTP value for CBOD. Used to in the simulation of
the CBOD2 component.
Page 2 of 24 Datatype 4 - Temperature Correction Constants 1/9/02
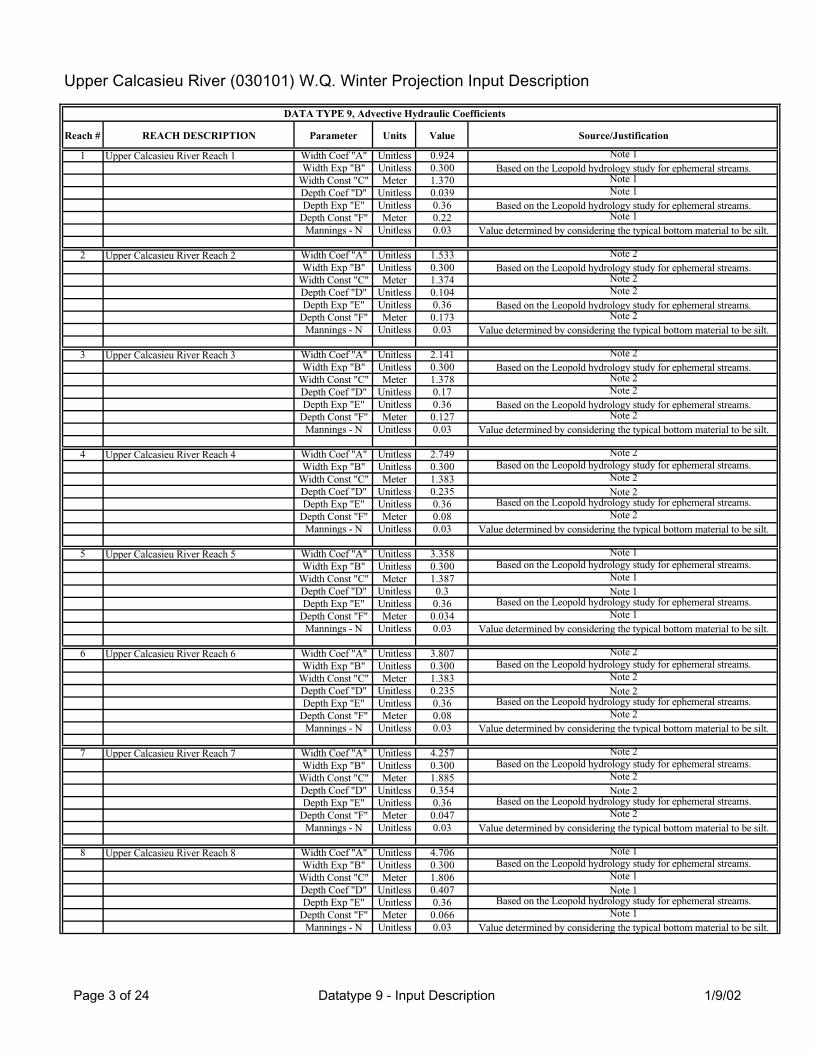
Upper Calcasieu River (030101) W.Q. Winter Projection Input Description
DATA TYPE 9, Advective Hydraulic Coefficients
Reach # REACH DESCRIPTION Parameter Units Value Source/Justification
1 Upper Calcasieu River Reach 1 Width Coef "A" Unitless 0.924 Note 1
Width Exp "B" Unitless 0.300 Based on the Leopold hydrology study for ephemeral streams.
Width Const "C" Meter 1.370 Note 1
Depth Coef "D" Unitless 0.039 Note 1
Depth Exp "E" Unitless 0.36 Based on the Leopold hydrology study for ephemeral streams.
Depth Const "F" Meter 0.22 Note 1
Mannings - N Unitless 0.03 Value determined by considering the typical bottom material to be silt.
2 Upper Calcasieu River Reach 2 Width Coef "A" Unitless 1.533 Note 2
Width Exp "B" Unitless 0.300 Based on the Leopold hydrology study for ephemeral streams.
Width Const "C" Meter 1.374 Note 2
Depth Coef "D" Unitless 0.104 Note 2
Depth Exp "E" Unitless 0.36 Based on the Leopold hydrology study for ephemeral streams.
Depth Const "F" Meter 0.173 Note 2
Mannings - N Unitless 0.03 Value determined by considering the typical bottom material to be silt.
3 Upper Calcasieu River Reach 3 Width Coef "A" Unitless 2.141 Note 2
Width Exp "B" Unitless 0.300 Based on the Leopold hydrology study for ephemeral streams.
Width Const "C" Meter 1.378 Note 2
Depth Coef "D" Unitless 0.17 Note 2
Depth Exp "E" Unitless 0.36 Based on the Leopold hydrology study for ephemeral streams.
Depth Const "F" Meter 0.127 Note 2
Mannings - N Unitless 0.03 Value determined by considering the typical bottom material to be silt.
4 Upper Calcasieu River Reach 4 Width Coef "A" Unitless 2.749 Note 2
Width Exp "B" Unitless 0.300 Based on the Leopold hydrology study for ephemeral streams.
Width Const "C" Meter 1.383 Note 2
Depth Coef "D" Unitless 0.235 Note 2
Depth Exp "E" Unitless 0.36 Based on the Leopold hydrology study for ephemeral streams.
Depth Const "F" Meter 0.08 Note 2
Mannings - N Unitless 0.03 Value determined by considering the typical bottom material to be silt.
5 Upper Calcasieu River Reach 5 Width Coef "A" Unitless 3.358 Note 1
Width Exp "B" Unitless 0.300 Based on the Leopold hydrology study for ephemeral streams.
Width Const "C" Meter 1.387 Note 1
Depth Coef "D" Unitless 0.3 Note 1
Depth Exp "E" Unitless 0.36 Based on the Leopold hydrology study for ephemeral streams.
Depth Const "F" Meter 0.034 Note 1
Mannings - N Unitless 0.03 Value determined by considering the typical bottom material to be silt.
6 Upper Calcasieu River Reach 6 Width Coef "A" Unitless 3.807 Note 2
Width Exp "B" Unitless 0.300 Based on the Leopold hydrology study for ephemeral streams.
Width Const "C" Meter 1.383 Note 2
Depth Coef "D" Unitless 0.235 Note 2
Depth Exp "E" Unitless 0.36 Based on the Leopold hydrology study for ephemeral streams.
Depth Const "F" Meter 0.08 Note 2
Mannings - N Unitless 0.03 Value determined by considering the typical bottom material to be silt.
7 Upper Calcasieu River Reach 7 Width Coef "A" Unitless 4.257 Note 2
Width Exp "B" Unitless 0.300 Based on the Leopold hydrology study for ephemeral streams.
Width Const "C" Meter 1.885 Note 2
Depth Coef "D" Unitless 0.354 Note 2
Depth Exp "E" Unitless 0.36 Based on the Leopold hydrology study for ephemeral streams.
Depth Const "F" Meter 0.047 Note 2
Mannings - N Unitless 0.03 Value determined by considering the typical bottom material to be silt.
8 Upper Calcasieu River Reach 8 Width Coef "A" Unitless 4.706 Note 1
Width Exp "B" Unitless 0.300 Based on the Leopold hydrology study for ephemeral streams.
Width Const "C" Meter 1.806 Note 1
Depth Coef "D" Unitless 0.407 Note 1
Depth Exp "E" Unitless 0.36 Based on the Leopold hydrology study for ephemeral streams.
Depth Const "F" Meter 0.066 Note 1
Mannings - N Unitless 0.03 Value determined by considering the typical bottom material to be silt.
Page 3 of 24 Datatype 9 - Input Description 1/9/02
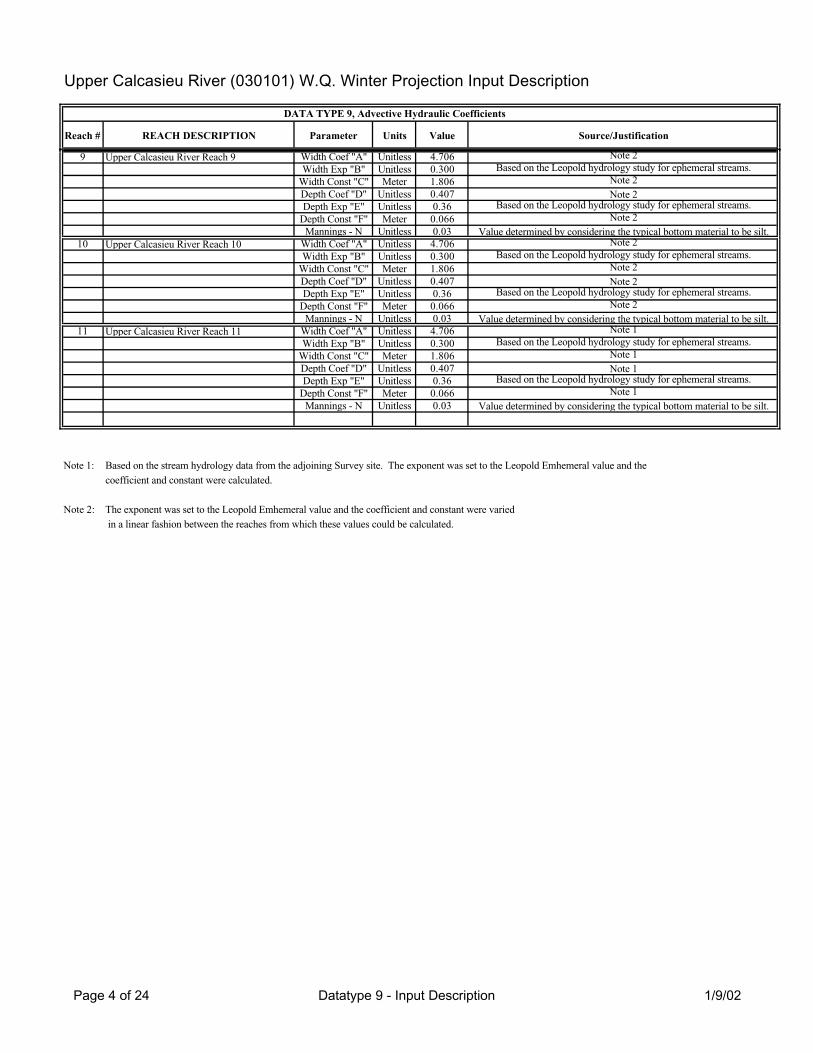
Upper Calcasieu River (030101) W.Q. Winter Projection Input Description
DATA TYPE 9, Advective Hydraulic Coefficients
Reach # REACH DESCRIPTION Parameter Units Value Source/Justification
9 Upper Calcasieu River Reach 9 Width Coef "A" Unitless 4.706 Note 2
Width Exp "B" Unitless 0.300 Based on the Leopold hydrology study for ephemeral streams.
Width Const "C" Meter 1.806 Note 2
Depth Coef "D" Unitless 0.407 Note 2
Depth Exp "E" Unitless 0.36 Based on the Leopold hydrology study for ephemeral streams.
Depth Const "F" Meter 0.066 Note 2
Mannings - N Unitless 0.03 Value determined by considering the typical bottom material to be silt.
10 Upper Calcasieu River Reach 10 Width Coef "A" Unitless 4.706 Note 2
Width Exp "B" Unitless 0.300 Based on the Leopold hydrology study for ephemeral streams.
Width Const "C" Meter 1.806 Note 2
Depth Coef "D" Unitless 0.407 Note 2
Depth Exp "E" Unitless 0.36 Based on the Leopold hydrology study for ephemeral streams.
Depth Const "F" Meter 0.066 Note 2
Mannings - N Unitless 0.03 Value determined by considering the typical bottom material to be silt.
11 Upper Calcasieu River Reach 11 Width Coef "A" Unitless 4.706 Note 1
Width Exp "B" Unitless 0.300 Based on the Leopold hydrology study for ephemeral streams.
Width Const "C" Meter 1.806 Note 1
Depth Coef "D" Unitless 0.407 Note 1
Depth Exp "E" Unitless 0.36 Based on the Leopold hydrology study for ephemeral streams.
Depth Const "F" Meter 0.066 Note 1
Mannings - N Unitless 0.03 Value determined by considering the typical bottom material to be silt.
Note 1: DBased on the stream hydrology data from the adjoining Survey site. The exponent was set to the Leopold Emhemeral value and the
coefficient and constant were calculated.
Note 2: The exponent was set to the Leopold Emhemeral value and the coefficient and constant were varied
in a linear fashion between the reaches from which these values could be calculated.
Page 4 of 24 Datatype 9 - Input Description 1/9/02
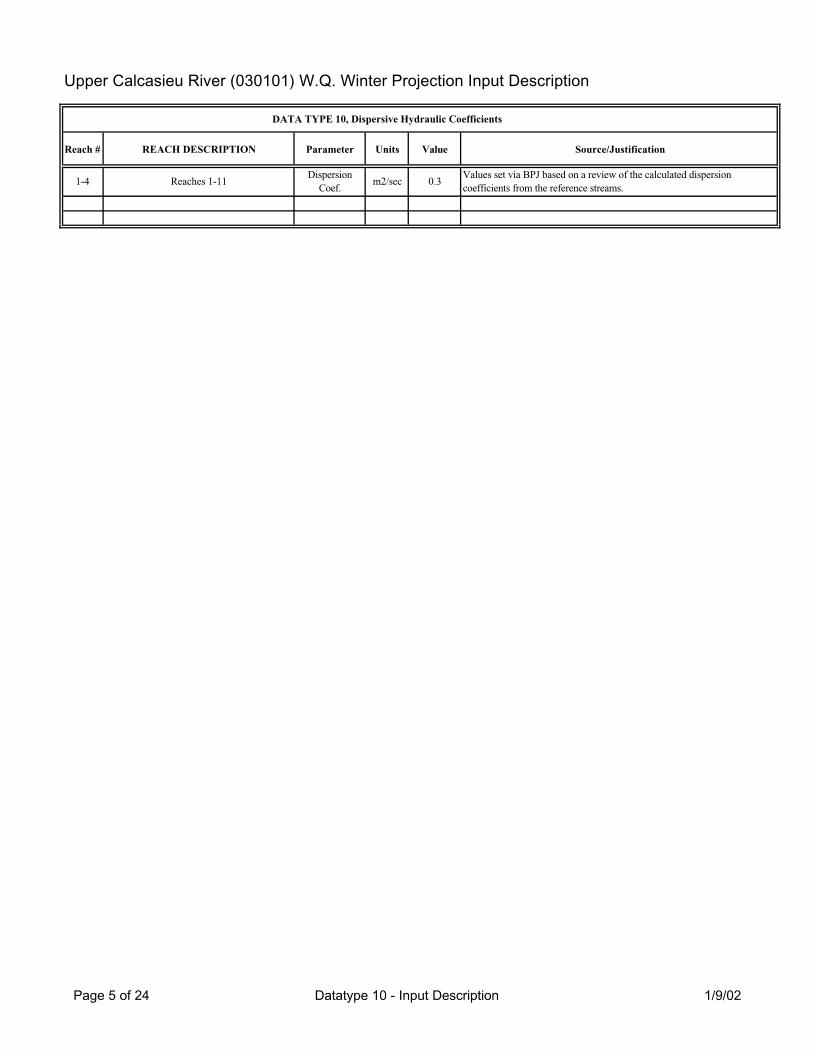
Upper Calcasieu River (030101) W.Q. Winter Projection Input Description
DATA TYPE 10, Dispersive Hydraulic Coefficients
Reach # REACH DESCRIPTION Parameter Units Value Source/Justification
1-4 Reaches 1-11Dispersion
Coef.m2/sec 0.3
Values set via BPJ based on a review of the calculated dispersion
coefficients from the reference streams.
Page 5 of 24 Datatype 10 - Input Description 1/9/02
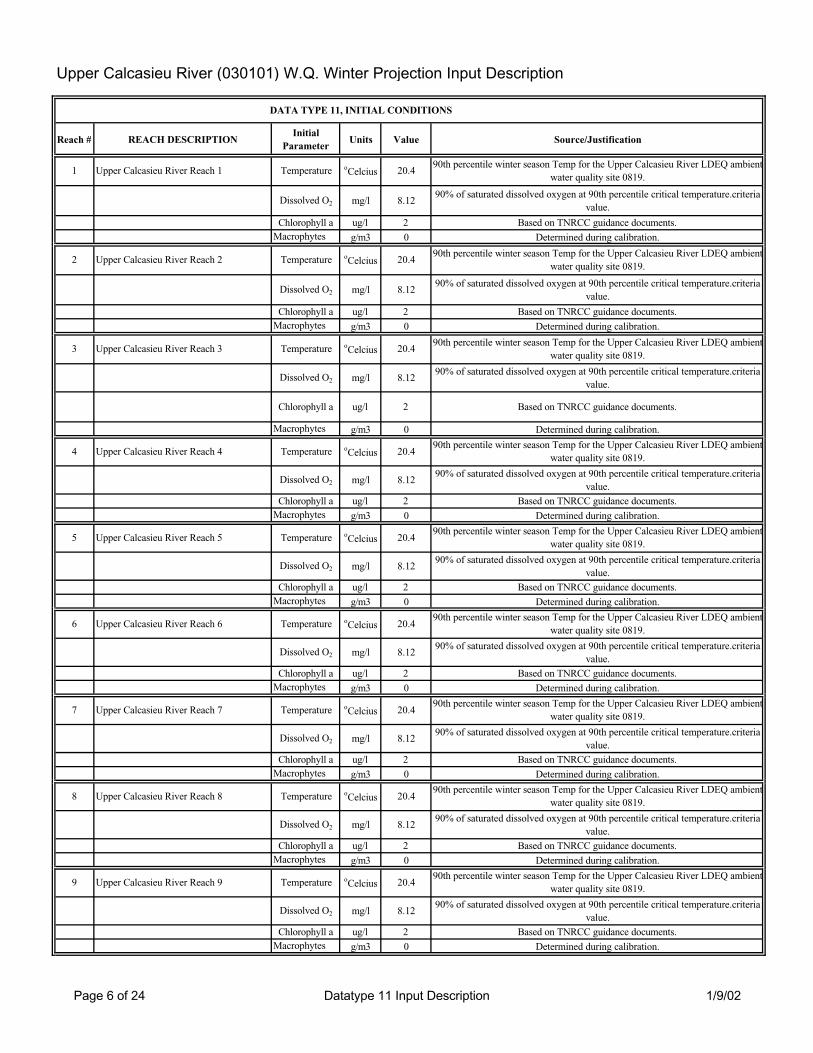
Upper Calcasieu River (030101) W.Q. Winter Projection Input Description
DATA TYPE 11, INITIAL CONDITIONS
Reach # REACH DESCRIPTIONInitial
ParameterUnits Value Source/Justification
1 Upper Calcasieu River Reach 1 Temperature oCelcius 20.4
90th percentile winter season Temp for the Upper Calcasieu River LDEQ ambient
water quality site 0819.
Dissolved O2 mg/l 8.1290% of saturated dissolved oxygen at 90th percentile critical temperature.criteria
value.
Chlorophyll a ug/l 2 Based on TNRCC guidance documents.
Macrophytes g/m3 0 Determined during calibration.
2 Upper Calcasieu River Reach 2 Temperature oCelcius 20.4
90th percentile winter season Temp for the Upper Calcasieu River LDEQ ambient
water quality site 0819.
Dissolved O2 mg/l 8.1290% of saturated dissolved oxygen at 90th percentile critical temperature.criteria
value.
Chlorophyll a ug/l 2 Based on TNRCC guidance documents.
Macrophytes g/m3 0 Determined during calibration.
3 Upper Calcasieu River Reach 3 Temperature oCelcius 20.4
90th percentile winter season Temp for the Upper Calcasieu River LDEQ ambient
water quality site 0819.
Dissolved O2 mg/l 8.1290% of saturated dissolved oxygen at 90th percentile critical temperature.criteria
value.
Chlorophyll a ug/l 2 Based on TNRCC guidance documents.
Macrophytes g/m3 0 Determined during calibration.
4 Upper Calcasieu River Reach 4 Temperature oCelcius 20.4
90th percentile winter season Temp for the Upper Calcasieu River LDEQ ambient
water quality site 0819.
Dissolved O2 mg/l 8.1290% of saturated dissolved oxygen at 90th percentile critical temperature.criteria
value.
Chlorophyll a ug/l 2 Based on TNRCC guidance documents.
Macrophytes g/m3 0 Determined during calibration.
5 Upper Calcasieu River Reach 5 Temperature oCelcius 20.4
90th percentile winter season Temp for the Upper Calcasieu River LDEQ ambient
water quality site 0819.
Dissolved O2 mg/l 8.1290% of saturated dissolved oxygen at 90th percentile critical temperature.criteria
value.
Chlorophyll a ug/l 2 Based on TNRCC guidance documents.
Macrophytes g/m3 0 Determined during calibration.
6 Upper Calcasieu River Reach 6 Temperature oCelcius 20.4
90th percentile winter season Temp for the Upper Calcasieu River LDEQ ambient
water quality site 0819.
Dissolved O2 mg/l 8.1290% of saturated dissolved oxygen at 90th percentile critical temperature.criteria
value.
Chlorophyll a ug/l 2 Based on TNRCC guidance documents.
Macrophytes g/m3 0 Determined during calibration.
7 Upper Calcasieu River Reach 7 Temperature oCelcius 20.4
90th percentile winter season Temp for the Upper Calcasieu River LDEQ ambient
water quality site 0819.
Dissolved O2 mg/l 8.1290% of saturated dissolved oxygen at 90th percentile critical temperature.criteria
value.
Chlorophyll a ug/l 2 Based on TNRCC guidance documents.
Macrophytes g/m3 0 Determined during calibration.
8 Upper Calcasieu River Reach 8 Temperature oCelcius 20.4
90th percentile winter season Temp for the Upper Calcasieu River LDEQ ambient
water quality site 0819.
Dissolved O2 mg/l 8.1290% of saturated dissolved oxygen at 90th percentile critical temperature.criteria
value.
Chlorophyll a ug/l 2 Based on TNRCC guidance documents.
Macrophytes g/m3 0 Determined during calibration.
9 Upper Calcasieu River Reach 9 Temperature oCelcius 20.4
90th percentile winter season Temp for the Upper Calcasieu River LDEQ ambient
water quality site 0819.
Dissolved O2 mg/l 8.1290% of saturated dissolved oxygen at 90th percentile critical temperature.criteria
value.
Chlorophyll a ug/l 2 Based on TNRCC guidance documents.
Macrophytes g/m3 0 Determined during calibration.
Page 6 of 24 Datatype 11 Input Description 1/9/02

Upper Calcasieu River (030101) W.Q. Winter Projection Input Description
DATA TYPE 11, INITIAL CONDITIONS
Reach # REACH DESCRIPTIONInitial
ParameterUnits Value Source/Justification
10 Upper Calcasieu River Reach 10 Temperature oCelcius 20.4
90th percentile winter season Temp for the Upper Calcasieu River LDEQ ambient
water quality site 0819.
Dissolved O2 mg/l 8.1290% of saturated dissolved oxygen at 90th percentile critical temperature.criteria
value.
Chlorophyll a ug/l 2 Based on TNRCC guidance documents.
Macrophytes g/m3 0 Determined during calibration.
11 Upper Calcasieu River Reach 11 Temperature oCelcius 20.4
90th percentile winter season Temp for the Upper Calcasieu River LDEQ ambient
water quality site 0819.
Dissolved O2 mg/l 8.1290% of saturated dissolved oxygen at 90th percentile critical temperature.criteria
value.
Chlorophyll a ug/l 2 Based on TNRCC guidance documents.
Macrophytes g/m3 0 Determined during calibration.
Page 7 of 24 Datatype 11 Input Description 1/9/02
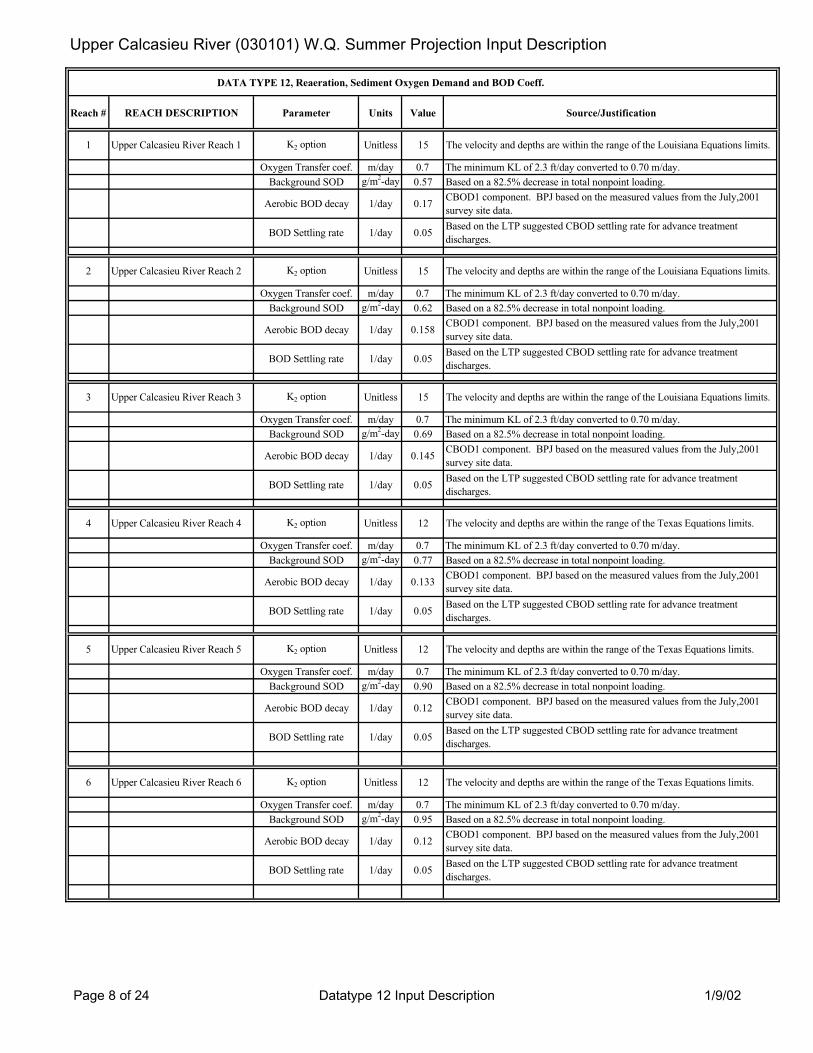
Upper Calcasieu River (030101) W.Q. Summer Projection Input Description
DATA TYPE 12, Reaeration, Sediment Oxygen Demand and BOD Coeff.
Reach # REACH DESCRIPTION Parameter Units Value Source/Justification
1 Upper Calcasieu River Reach 1 K2 option Unitless 15 The velocity and depths are within the range of the Louisiana Equations limits.
Oxygen Transfer coef. m/day 0.7 The minimum KL of 2.3 ft/day converted to 0.70 m/day.
Background SOD g/m2-day 0.57 Based on a 82.5% decrease in total nonpoint loading.
Aerobic BOD decay 1/day 0.17CBOD1 component. BPJ based on the measured values from the July,2001
survey site data.
BOD Settling rate 1/day 0.05Based on the LTP suggested CBOD settling rate for advance treatment
discharges.
2 Upper Calcasieu River Reach 2 K2 option Unitless 15 The velocity and depths are within the range of the Louisiana Equations limits.
Oxygen Transfer coef. m/day 0.7 The minimum KL of 2.3 ft/day converted to 0.70 m/day.
Background SOD g/m2-day 0.62 Based on a 82.5% decrease in total nonpoint loading.
Aerobic BOD decay 1/day 0.158CBOD1 component. BPJ based on the measured values from the July,2001
survey site data.
BOD Settling rate 1/day 0.05Based on the LTP suggested CBOD settling rate for advance treatment
discharges.
3 Upper Calcasieu River Reach 3 K2 option Unitless 15 The velocity and depths are within the range of the Louisiana Equations limits.
Oxygen Transfer coef. m/day 0.7 The minimum KL of 2.3 ft/day converted to 0.70 m/day.
Background SOD g/m2-day 0.69 Based on a 82.5% decrease in total nonpoint loading.
Aerobic BOD decay 1/day 0.145CBOD1 component. BPJ based on the measured values from the July,2001
survey site data.
BOD Settling rate 1/day 0.05Based on the LTP suggested CBOD settling rate for advance treatment
discharges.
4 Upper Calcasieu River Reach 4 K2 option Unitless 12 The velocity and depths are within the range of the Texas Equations limits.
Oxygen Transfer coef. m/day 0.7 The minimum KL of 2.3 ft/day converted to 0.70 m/day.
Background SOD g/m2-day 0.77 Based on a 82.5% decrease in total nonpoint loading.
Aerobic BOD decay 1/day 0.133CBOD1 component. BPJ based on the measured values from the July,2001
survey site data.
BOD Settling rate 1/day 0.05Based on the LTP suggested CBOD settling rate for advance treatment
discharges.
5 Upper Calcasieu River Reach 5 K2 option Unitless 12 The velocity and depths are within the range of the Texas Equations limits.
Oxygen Transfer coef. m/day 0.7 The minimum KL of 2.3 ft/day converted to 0.70 m/day.
Background SOD g/m2-day 0.90 Based on a 82.5% decrease in total nonpoint loading.
Aerobic BOD decay 1/day 0.12CBOD1 component. BPJ based on the measured values from the July,2001
survey site data.
BOD Settling rate 1/day 0.05Based on the LTP suggested CBOD settling rate for advance treatment
discharges.
6 Upper Calcasieu River Reach 6 K2 option Unitless 12 The velocity and depths are within the range of the Texas Equations limits.
Oxygen Transfer coef. m/day 0.7 The minimum KL of 2.3 ft/day converted to 0.70 m/day.
Background SOD g/m2-day 0.95 Based on a 82.5% decrease in total nonpoint loading.
Aerobic BOD decay 1/day 0.12CBOD1 component. BPJ based on the measured values from the July,2001
survey site data.
BOD Settling rate 1/day 0.05Based on the LTP suggested CBOD settling rate for advance treatment
discharges.
Page 8 of 24 Datatype 12 Input Description 1/9/02
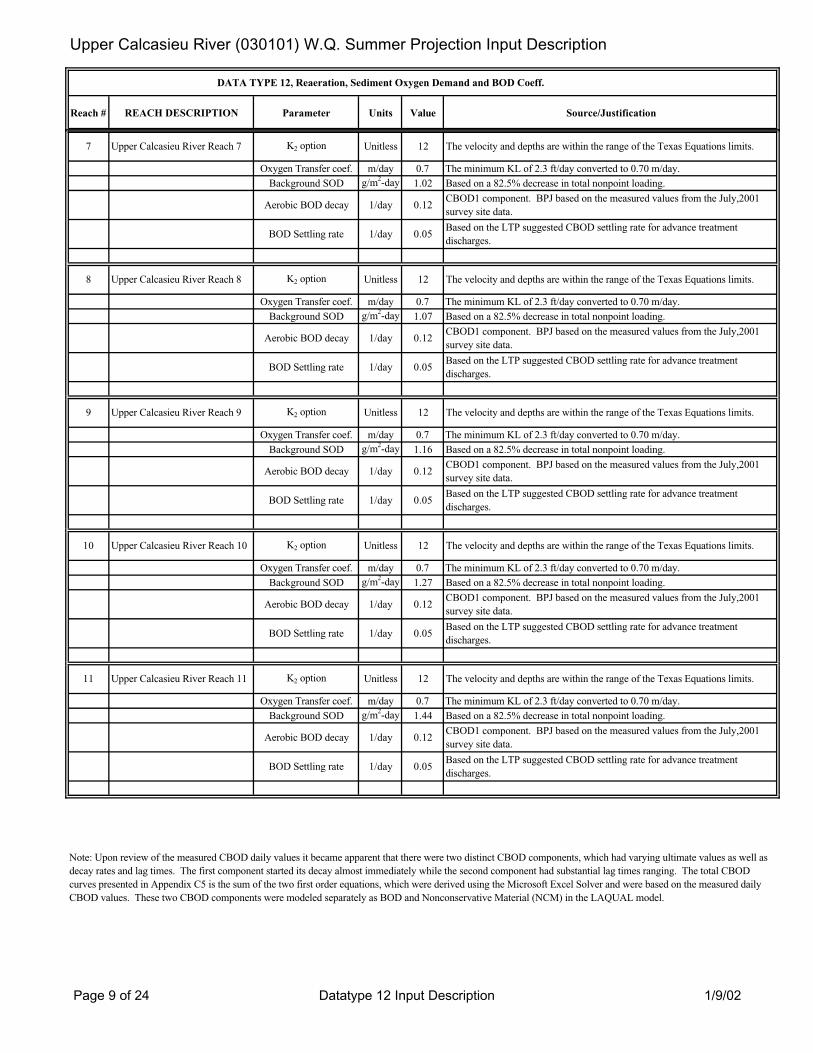
Upper Calcasieu River (030101) W.Q. Summer Projection Input Description
DATA TYPE 12, Reaeration, Sediment Oxygen Demand and BOD Coeff.
Reach # REACH DESCRIPTION Parameter Units Value Source/Justification
7 Upper Calcasieu River Reach 7 K2 option Unitless 12 The velocity and depths are within the range of the Texas Equations limits.
Oxygen Transfer coef. m/day 0.7 The minimum KL of 2.3 ft/day converted to 0.70 m/day.
Background SOD g/m2-day 1.02 Based on a 82.5% decrease in total nonpoint loading.
Aerobic BOD decay 1/day 0.12CBOD1 component. BPJ based on the measured values from the July,2001
survey site data.
BOD Settling rate 1/day 0.05Based on the LTP suggested CBOD settling rate for advance treatment
discharges.
8 Upper Calcasieu River Reach 8 K2 option Unitless 12 The velocity and depths are within the range of the Texas Equations limits.
Oxygen Transfer coef. m/day 0.7 The minimum KL of 2.3 ft/day converted to 0.70 m/day.
Background SOD g/m2-day 1.07 Based on a 82.5% decrease in total nonpoint loading.
Aerobic BOD decay 1/day 0.12CBOD1 component. BPJ based on the measured values from the July,2001
survey site data.
BOD Settling rate 1/day 0.05Based on the LTP suggested CBOD settling rate for advance treatment
discharges.
9 Upper Calcasieu River Reach 9 K2 option Unitless 12 The velocity and depths are within the range of the Texas Equations limits.
Oxygen Transfer coef. m/day 0.7 The minimum KL of 2.3 ft/day converted to 0.70 m/day.
Background SOD g/m2-day 1.16 Based on a 82.5% decrease in total nonpoint loading.
Aerobic BOD decay 1/day 0.12CBOD1 component. BPJ based on the measured values from the July,2001
survey site data.
BOD Settling rate 1/day 0.05Based on the LTP suggested CBOD settling rate for advance treatment
discharges.
10 Upper Calcasieu River Reach 10 K2 option Unitless 12 The velocity and depths are within the range of the Texas Equations limits.
Oxygen Transfer coef. m/day 0.7 The minimum KL of 2.3 ft/day converted to 0.70 m/day.
Background SOD g/m2-day 1.27 Based on a 82.5% decrease in total nonpoint loading.
Aerobic BOD decay 1/day 0.12CBOD1 component. BPJ based on the measured values from the July,2001
survey site data.
BOD Settling rate 1/day 0.05Based on the LTP suggested CBOD settling rate for advance treatment
discharges.
11 Upper Calcasieu River Reach 11 K2 option Unitless 12 The velocity and depths are within the range of the Texas Equations limits.
Oxygen Transfer coef. m/day 0.7 The minimum KL of 2.3 ft/day converted to 0.70 m/day.
Background SOD g/m2-day 1.44 Based on a 82.5% decrease in total nonpoint loading.
Aerobic BOD decay 1/day 0.12CBOD1 component. BPJ based on the measured values from the July,2001
survey site data.
BOD Settling rate 1/day 0.05Based on the LTP suggested CBOD settling rate for advance treatment
discharges.
Note: Upon review of the measured CBOD daily values it became apparent that there were two distinct CBOD components, which had varying ultimate values as well as
decay rates and lag times. The first component started its decay almost immediately while the second component had substantial lag times ranging. The total CBOD
curves presented in Appendix C5 is the sum of the two first order equations, which were derived using the Microsoft Excel Solver and were based on the measured daily
CBOD values. These two CBOD components were modeled separately as BOD and Nonconservative Material (NCM) in the LAQUAL model.
Page 9 of 24 Datatype 12 Input Description 1/9/02
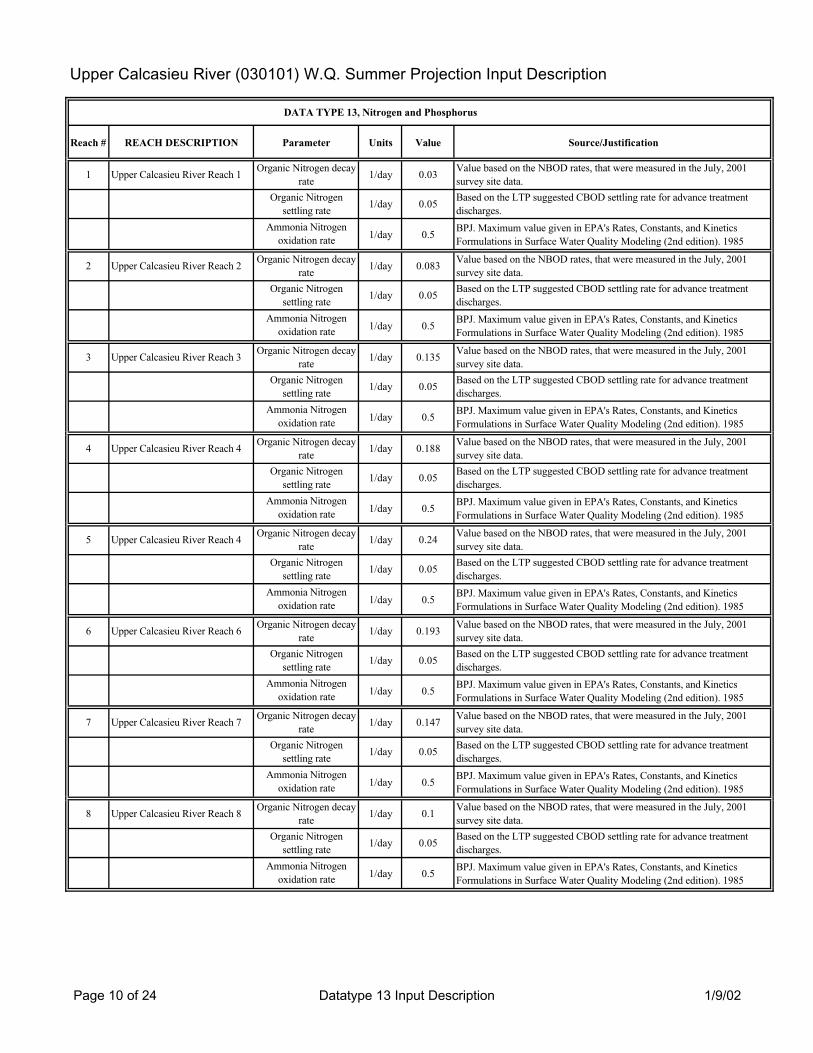
Upper Calcasieu River (030101) W.Q. Summer Projection Input Description
DATA TYPE 13, Nitrogen and Phosphorus
Reach # REACH DESCRIPTION Parameter Units Value Source/Justification
1 Upper Calcasieu River Reach 1Organic Nitrogen decay
rate1/day 0.03
Value based on the NBOD rates, that were measured in the July, 2001
survey site data.
Organic Nitrogen
settling rate1/day 0.05
Based on the LTP suggested CBOD settling rate for advance treatment
discharges.
Ammonia Nitrogen
oxidation rate1/day 0.5
BPJ. Maximum value given in EPA's Rates, Constants, and Kinetics
Formulations in Surface Water Quality Modeling (2nd edition). 1985
2 Upper Calcasieu River Reach 2Organic Nitrogen decay
rate1/day 0.083
Value based on the NBOD rates, that were measured in the July, 2001
survey site data.
Organic Nitrogen
settling rate1/day 0.05
Based on the LTP suggested CBOD settling rate for advance treatment
discharges.
Ammonia Nitrogen
oxidation rate1/day 0.5
BPJ. Maximum value given in EPA's Rates, Constants, and Kinetics
Formulations in Surface Water Quality Modeling (2nd edition). 1985
3 Upper Calcasieu River Reach 3Organic Nitrogen decay
rate1/day 0.135
Value based on the NBOD rates, that were measured in the July, 2001
survey site data.
Organic Nitrogen
settling rate1/day 0.05
Based on the LTP suggested CBOD settling rate for advance treatment
discharges.
Ammonia Nitrogen
oxidation rate1/day 0.5
BPJ. Maximum value given in EPA's Rates, Constants, and Kinetics
Formulations in Surface Water Quality Modeling (2nd edition). 1985
4 Upper Calcasieu River Reach 4Organic Nitrogen decay
rate1/day 0.188
Value based on the NBOD rates, that were measured in the July, 2001
survey site data.
Organic Nitrogen
settling rate1/day 0.05
Based on the LTP suggested CBOD settling rate for advance treatment
discharges.
Ammonia Nitrogen
oxidation rate1/day 0.5
BPJ. Maximum value given in EPA's Rates, Constants, and Kinetics
Formulations in Surface Water Quality Modeling (2nd edition). 1985
5 Upper Calcasieu River Reach 4Organic Nitrogen decay
rate1/day 0.24
Value based on the NBOD rates, that were measured in the July, 2001
survey site data.
Organic Nitrogen
settling rate1/day 0.05
Based on the LTP suggested CBOD settling rate for advance treatment
discharges.
Ammonia Nitrogen
oxidation rate1/day 0.5
BPJ. Maximum value given in EPA's Rates, Constants, and Kinetics
Formulations in Surface Water Quality Modeling (2nd edition). 1985
6 Upper Calcasieu River Reach 6Organic Nitrogen decay
rate1/day 0.193
Value based on the NBOD rates, that were measured in the July, 2001
survey site data.
Organic Nitrogen
settling rate1/day 0.05
Based on the LTP suggested CBOD settling rate for advance treatment
discharges.
Ammonia Nitrogen
oxidation rate1/day 0.5
BPJ. Maximum value given in EPA's Rates, Constants, and Kinetics
Formulations in Surface Water Quality Modeling (2nd edition). 1985
7 Upper Calcasieu River Reach 7Organic Nitrogen decay
rate1/day 0.147
Value based on the NBOD rates, that were measured in the July, 2001
survey site data.
Organic Nitrogen
settling rate1/day 0.05
Based on the LTP suggested CBOD settling rate for advance treatment
discharges.
Ammonia Nitrogen
oxidation rate1/day 0.5
BPJ. Maximum value given in EPA's Rates, Constants, and Kinetics
Formulations in Surface Water Quality Modeling (2nd edition). 1985
8 Upper Calcasieu River Reach 8Organic Nitrogen decay
rate1/day 0.1
Value based on the NBOD rates, that were measured in the July, 2001
survey site data.
Organic Nitrogen
settling rate1/day 0.05
Based on the LTP suggested CBOD settling rate for advance treatment
discharges.
Ammonia Nitrogen
oxidation rate1/day 0.5
BPJ. Maximum value given in EPA's Rates, Constants, and Kinetics
Formulations in Surface Water Quality Modeling (2nd edition). 1985
Page 10 of 24 Datatype 13 Input Description 1/9/02
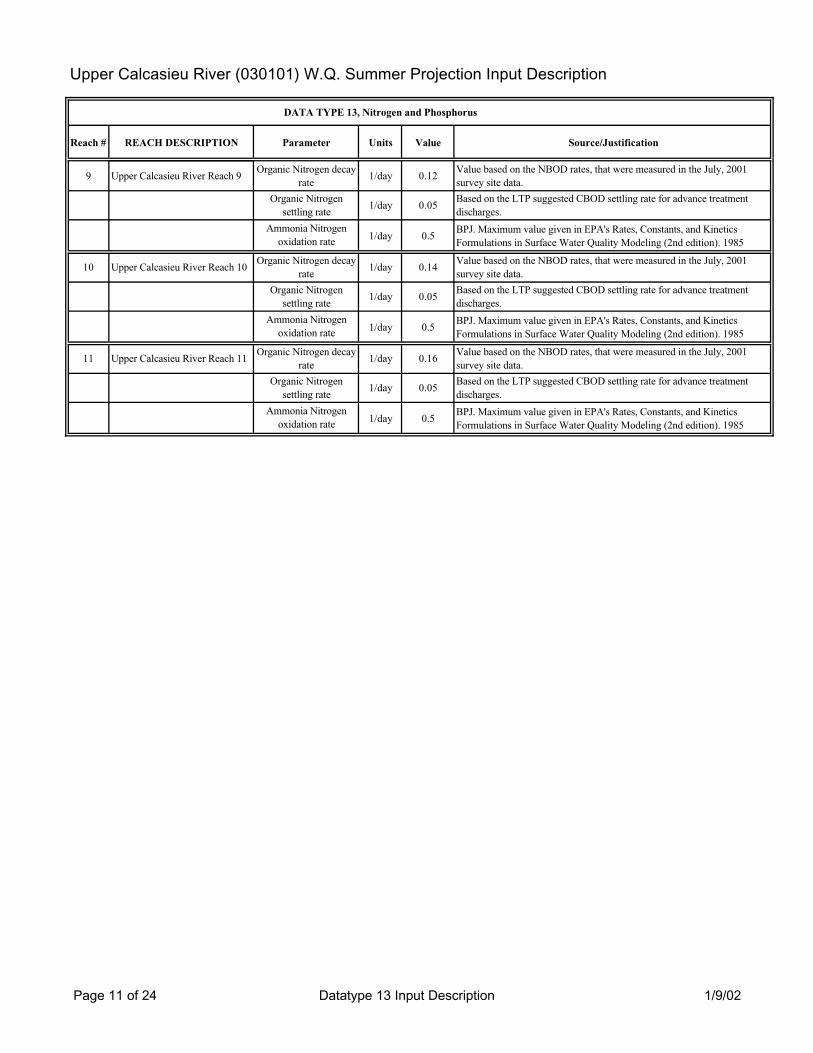
Upper Calcasieu River (030101) W.Q. Summer Projection Input Description
DATA TYPE 13, Nitrogen and Phosphorus
Reach # REACH DESCRIPTION Parameter Units Value Source/Justification
9 Upper Calcasieu River Reach 9Organic Nitrogen decay
rate1/day 0.12
Value based on the NBOD rates, that were measured in the July, 2001
survey site data.
Organic Nitrogen
settling rate1/day 0.05
Based on the LTP suggested CBOD settling rate for advance treatment
discharges.
Ammonia Nitrogen
oxidation rate1/day 0.5
BPJ. Maximum value given in EPA's Rates, Constants, and Kinetics
Formulations in Surface Water Quality Modeling (2nd edition). 1985
10 Upper Calcasieu River Reach 10Organic Nitrogen decay
rate1/day 0.14
Value based on the NBOD rates, that were measured in the July, 2001
survey site data.
Organic Nitrogen
settling rate1/day 0.05
Based on the LTP suggested CBOD settling rate for advance treatment
discharges.
Ammonia Nitrogen
oxidation rate1/day 0.5
BPJ. Maximum value given in EPA's Rates, Constants, and Kinetics
Formulations in Surface Water Quality Modeling (2nd edition). 1985
11 Upper Calcasieu River Reach 11Organic Nitrogen decay
rate1/day 0.16
Value based on the NBOD rates, that were measured in the July, 2001
survey site data.
Organic Nitrogen
settling rate1/day 0.05
Based on the LTP suggested CBOD settling rate for advance treatment
discharges.
Ammonia Nitrogen
oxidation rate1/day 0.5
BPJ. Maximum value given in EPA's Rates, Constants, and Kinetics
Formulations in Surface Water Quality Modeling (2nd edition). 1985
Page 11 of 24 Datatype 13 Input Description 1/9/02
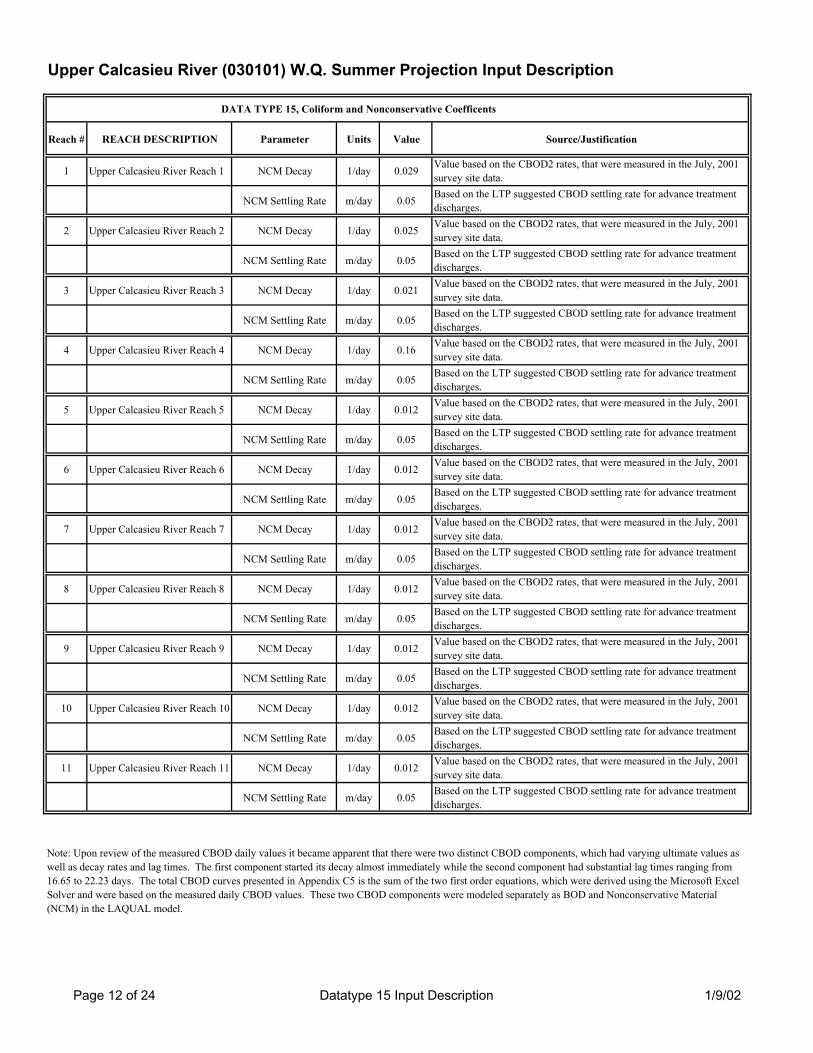
Upper Calcasieu River (030101) W.Q. Summer Projection Input Description
DATA TYPE 15, Coliform and Nonconservative Coefficents
Reach # REACH DESCRIPTION Parameter Units Value Source/Justification
1 Upper Calcasieu River Reach 1 NCM Decay 1/day 0.029Value based on the CBOD2 rates, that were measured in the July, 2001
survey site data.
NCM Settling Rate m/day 0.05Based on the LTP suggested CBOD settling rate for advance treatment
discharges.
2 Upper Calcasieu River Reach 2 NCM Decay 1/day 0.025Value based on the CBOD2 rates, that were measured in the July, 2001
survey site data.
NCM Settling Rate m/day 0.05Based on the LTP suggested CBOD settling rate for advance treatment
discharges.
3 Upper Calcasieu River Reach 3 NCM Decay 1/day 0.021Value based on the CBOD2 rates, that were measured in the July, 2001
survey site data.
NCM Settling Rate m/day 0.05Based on the LTP suggested CBOD settling rate for advance treatment
discharges.
4 Upper Calcasieu River Reach 4 NCM Decay 1/day 0.16Value based on the CBOD2 rates, that were measured in the July, 2001
survey site data.
NCM Settling Rate m/day 0.05Based on the LTP suggested CBOD settling rate for advance treatment
discharges.
5 Upper Calcasieu River Reach 5 NCM Decay 1/day 0.012Value based on the CBOD2 rates, that were measured in the July, 2001
survey site data.
NCM Settling Rate m/day 0.05Based on the LTP suggested CBOD settling rate for advance treatment
discharges.
6 Upper Calcasieu River Reach 6 NCM Decay 1/day 0.012Value based on the CBOD2 rates, that were measured in the July, 2001
survey site data.
NCM Settling Rate m/day 0.05Based on the LTP suggested CBOD settling rate for advance treatment
discharges.
7 Upper Calcasieu River Reach 7 NCM Decay 1/day 0.012Value based on the CBOD2 rates, that were measured in the July, 2001
survey site data.
NCM Settling Rate m/day 0.05Based on the LTP suggested CBOD settling rate for advance treatment
discharges.
8 Upper Calcasieu River Reach 8 NCM Decay 1/day 0.012Value based on the CBOD2 rates, that were measured in the July, 2001
survey site data.
NCM Settling Rate m/day 0.05Based on the LTP suggested CBOD settling rate for advance treatment
discharges.
9 Upper Calcasieu River Reach 9 NCM Decay 1/day 0.012Value based on the CBOD2 rates, that were measured in the July, 2001
survey site data.
NCM Settling Rate m/day 0.05Based on the LTP suggested CBOD settling rate for advance treatment
discharges.
10 Upper Calcasieu River Reach 10 NCM Decay 1/day 0.012Value based on the CBOD2 rates, that were measured in the July, 2001
survey site data.
NCM Settling Rate m/day 0.05Based on the LTP suggested CBOD settling rate for advance treatment
discharges.
11 Upper Calcasieu River Reach 11 NCM Decay 1/day 0.012Value based on the CBOD2 rates, that were measured in the July, 2001
survey site data.
NCM Settling Rate m/day 0.05Based on the LTP suggested CBOD settling rate for advance treatment
discharges.
Note: Upon review of the measured CBOD daily values it became apparent that there were two distinct CBOD components, which had varying ultimate values as
well as decay rates and lag times. The first component started its decay almost immediately while the second component had substantial lag times ranging from
16.65 to 22.23 days. The total CBOD curves presented in Appendix C5 is the sum of the two first order equations, which were derived using the Microsoft Excel
Solver and were based on the measured daily CBOD values. These two CBOD components were modeled separately as BOD and Nonconservative Material
(NCM) in the LAQUAL model.
Page 12 of 24 Datatype 15 Input Description 1/9/02
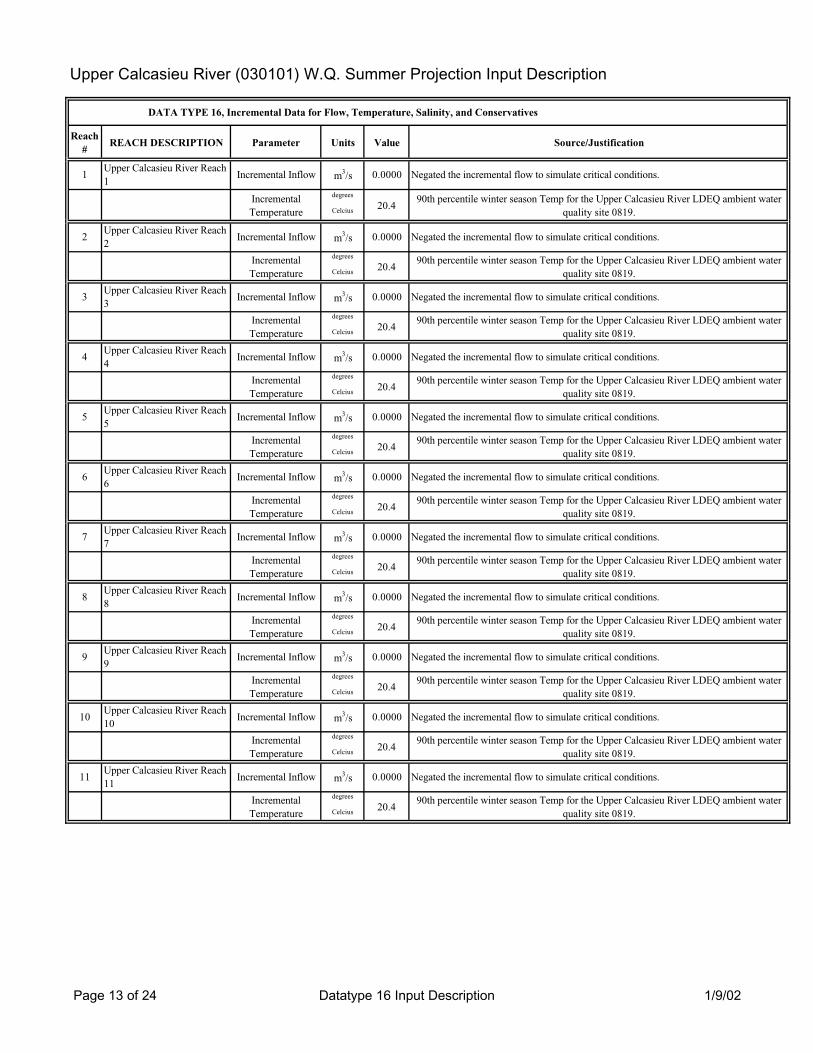
Upper Calcasieu River (030101) W.Q. Summer Projection Input Description
DATA TYPE 16, Incremental Data for Flow, Temperature, Salinity, and Conservatives
Reach #
REACH DESCRIPTION Parameter Units Value Source/Justification
1Upper Calcasieu River Reach
1Incremental Inflow m
3/s 0.0000 Negated the incremental flow to simulate critical conditions.
Incremental
Temperature
degrees
Celcius20.4
90th percentile winter season Temp for the Upper Calcasieu River LDEQ ambient water
quality site 0819.
2Upper Calcasieu River Reach
2Incremental Inflow m
3/s 0.0000 Negated the incremental flow to simulate critical conditions.
Incremental
Temperature
degrees
Celcius20.4
90th percentile winter season Temp for the Upper Calcasieu River LDEQ ambient water
quality site 0819.
3Upper Calcasieu River Reach
3Incremental Inflow m
3/s 0.0000 Negated the incremental flow to simulate critical conditions.
Incremental
Temperature
degrees
Celcius20.4
90th percentile winter season Temp for the Upper Calcasieu River LDEQ ambient water
quality site 0819.
4Upper Calcasieu River Reach
4Incremental Inflow m
3/s 0.0000 Negated the incremental flow to simulate critical conditions.
Incremental
Temperature
degrees
Celcius20.4
90th percentile winter season Temp for the Upper Calcasieu River LDEQ ambient water
quality site 0819.
5Upper Calcasieu River Reach
5Incremental Inflow m
3/s 0.0000 Negated the incremental flow to simulate critical conditions.
Incremental
Temperature
degrees
Celcius20.4
90th percentile winter season Temp for the Upper Calcasieu River LDEQ ambient water
quality site 0819.
6Upper Calcasieu River Reach
6Incremental Inflow m
3/s 0.0000 Negated the incremental flow to simulate critical conditions.
Incremental
Temperature
degrees
Celcius20.4
90th percentile winter season Temp for the Upper Calcasieu River LDEQ ambient water
quality site 0819.
7Upper Calcasieu River Reach
7Incremental Inflow m
3/s 0.0000 Negated the incremental flow to simulate critical conditions.
Incremental
Temperature
degrees
Celcius20.4
90th percentile winter season Temp for the Upper Calcasieu River LDEQ ambient water
quality site 0819.
8Upper Calcasieu River Reach
8Incremental Inflow m
3/s 0.0000 Negated the incremental flow to simulate critical conditions.
Incremental
Temperature
degrees
Celcius20.4
90th percentile winter season Temp for the Upper Calcasieu River LDEQ ambient water
quality site 0819.
9Upper Calcasieu River Reach
9Incremental Inflow m
3/s 0.0000 Negated the incremental flow to simulate critical conditions.
Incremental
Temperature
degrees
Celcius20.4
90th percentile winter season Temp for the Upper Calcasieu River LDEQ ambient water
quality site 0819.
10Upper Calcasieu River Reach
10Incremental Inflow m
3/s 0.0000 Negated the incremental flow to simulate critical conditions.
Incremental
Temperature
degrees
Celcius20.4
90th percentile winter season Temp for the Upper Calcasieu River LDEQ ambient water
quality site 0819.
11Upper Calcasieu River Reach
11Incremental Inflow m
3/s 0.0000 Negated the incremental flow to simulate critical conditions.
Incremental
Temperature
degrees
Celcius20.4
90th percentile winter season Temp for the Upper Calcasieu River LDEQ ambient water
quality site 0819.
Page 13 of 24 Datatype 16 Input Description 1/9/02

Upper Calcasieu River (030101) W.Q. Summer Projection Input Description
DATA TYPE 17, Incremetal Data for DO, BOD, Nitrogen
Reach # REACH DESCRIPTION Parameter Units Value Source/Justification
1-11
Upper Calcasieu River Reaches 1-
11
Incremental Dissolved
Oxygenmg/l 0 Negated the incremental flow to simulate critical conditions.
Page 14 of 24 Datatype 17 Input Description 1/9/02
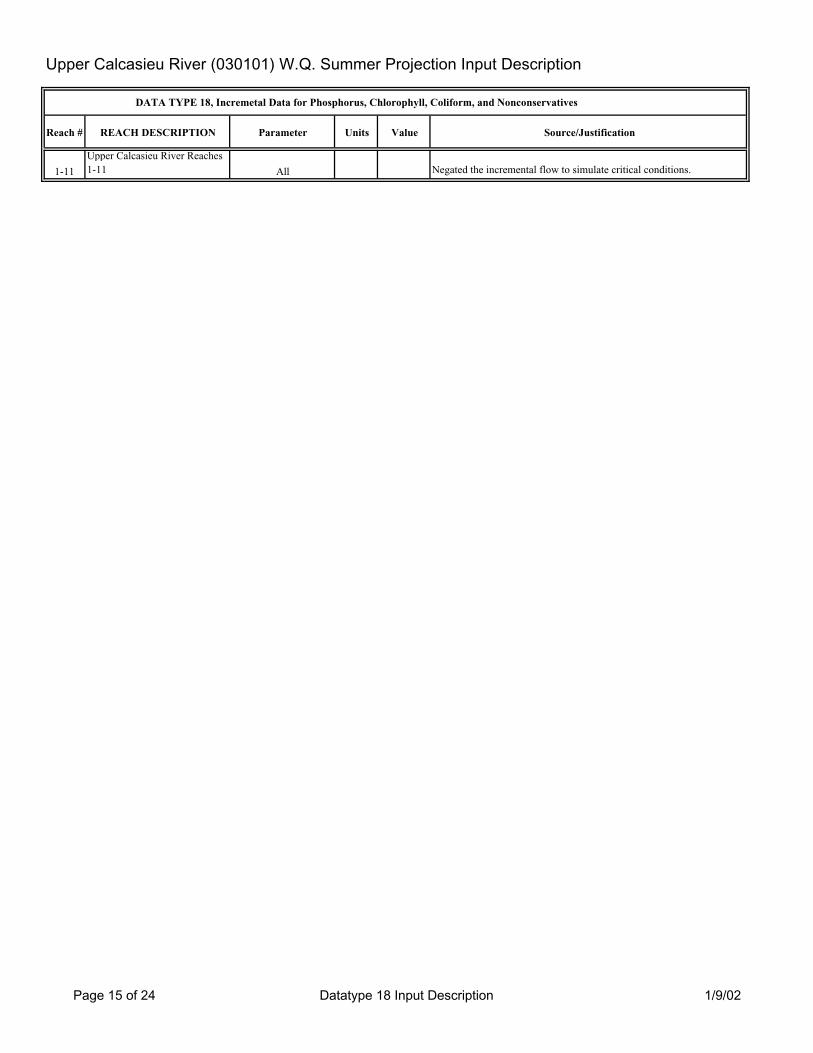
Upper Calcasieu River (030101) W.Q. Summer Projection Input Description
DATA TYPE 18, Incremetal Data for Phosphorus, Chlorophyll, Coliform, and Nonconservatives
Reach # REACH DESCRIPTION Parameter Units Value Source/Justification
1-11
Upper Calcasieu River Reaches
1-11 All Negated the incremental flow to simulate critical conditions.
Page 15 of 24 Datatype 18 Input Description 1/9/02
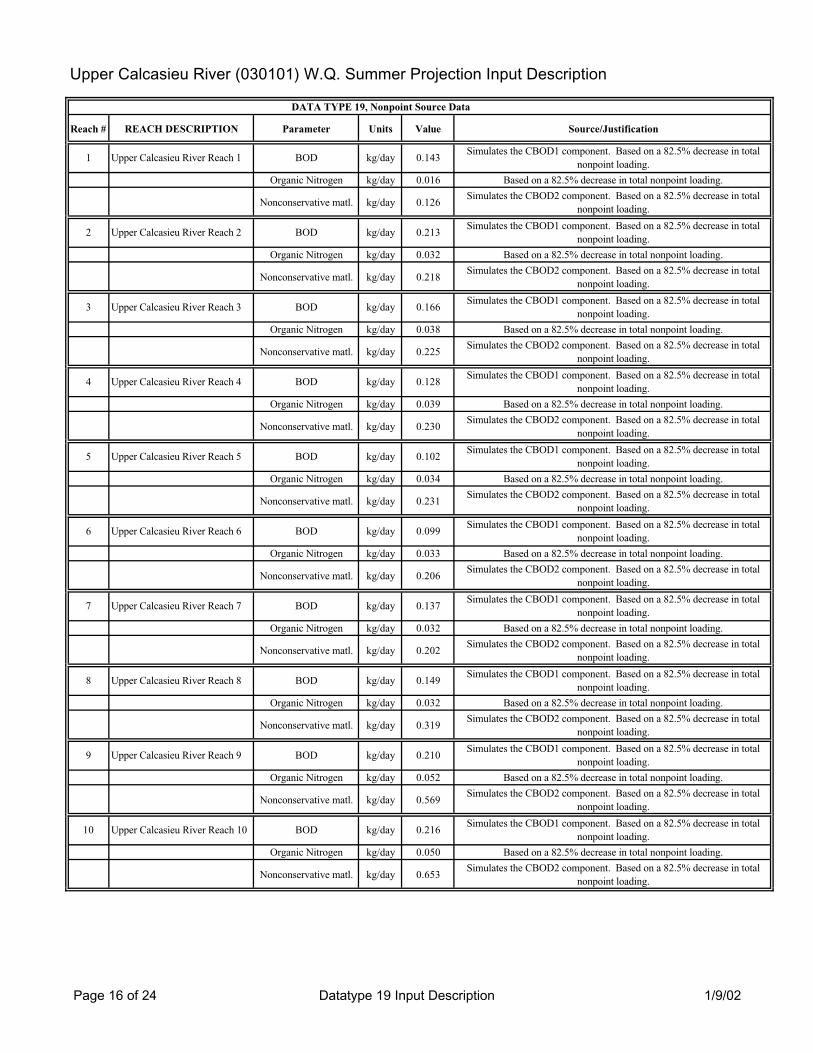
Upper Calcasieu River (030101) W.Q. Summer Projection Input Description
DATA TYPE 19, Nonpoint Source Data
Reach # REACH DESCRIPTION Parameter Units Value Source/Justification
1 Upper Calcasieu River Reach 1 BOD kg/day 0.143Simulates the CBOD1 component. Based on a 82.5% decrease in total
nonpoint loading.
Organic Nitrogen kg/day 0.016 Based on a 82.5% decrease in total nonpoint loading.
Nonconservative matl. kg/day 0.126Simulates the CBOD2 component. Based on a 82.5% decrease in total
nonpoint loading.
2 Upper Calcasieu River Reach 2 BOD kg/day 0.213Simulates the CBOD1 component. Based on a 82.5% decrease in total
nonpoint loading.
Organic Nitrogen kg/day 0.032 Based on a 82.5% decrease in total nonpoint loading.
Nonconservative matl. kg/day 0.218Simulates the CBOD2 component. Based on a 82.5% decrease in total
nonpoint loading.
3 Upper Calcasieu River Reach 3 BOD kg/day 0.166Simulates the CBOD1 component. Based on a 82.5% decrease in total
nonpoint loading.
Organic Nitrogen kg/day 0.038 Based on a 82.5% decrease in total nonpoint loading.
Nonconservative matl. kg/day 0.225Simulates the CBOD2 component. Based on a 82.5% decrease in total
nonpoint loading.
4 Upper Calcasieu River Reach 4 BOD kg/day 0.128Simulates the CBOD1 component. Based on a 82.5% decrease in total
nonpoint loading.
Organic Nitrogen kg/day 0.039 Based on a 82.5% decrease in total nonpoint loading.
Nonconservative matl. kg/day 0.230Simulates the CBOD2 component. Based on a 82.5% decrease in total
nonpoint loading.
5 Upper Calcasieu River Reach 5 BOD kg/day 0.102Simulates the CBOD1 component. Based on a 82.5% decrease in total
nonpoint loading.
Organic Nitrogen kg/day 0.034 Based on a 82.5% decrease in total nonpoint loading.
Nonconservative matl. kg/day 0.231Simulates the CBOD2 component. Based on a 82.5% decrease in total
nonpoint loading.
6 Upper Calcasieu River Reach 6 BOD kg/day 0.099Simulates the CBOD1 component. Based on a 82.5% decrease in total
nonpoint loading.
Organic Nitrogen kg/day 0.033 Based on a 82.5% decrease in total nonpoint loading.
Nonconservative matl. kg/day 0.206Simulates the CBOD2 component. Based on a 82.5% decrease in total
nonpoint loading.
7 Upper Calcasieu River Reach 7 BOD kg/day 0.137Simulates the CBOD1 component. Based on a 82.5% decrease in total
nonpoint loading.
Organic Nitrogen kg/day 0.032 Based on a 82.5% decrease in total nonpoint loading.
Nonconservative matl. kg/day 0.202Simulates the CBOD2 component. Based on a 82.5% decrease in total
nonpoint loading.
8 Upper Calcasieu River Reach 8 BOD kg/day 0.149Simulates the CBOD1 component. Based on a 82.5% decrease in total
nonpoint loading.
Organic Nitrogen kg/day 0.032 Based on a 82.5% decrease in total nonpoint loading.
Nonconservative matl. kg/day 0.319Simulates the CBOD2 component. Based on a 82.5% decrease in total
nonpoint loading.
9 Upper Calcasieu River Reach 9 BOD kg/day 0.210Simulates the CBOD1 component. Based on a 82.5% decrease in total
nonpoint loading.
Organic Nitrogen kg/day 0.052 Based on a 82.5% decrease in total nonpoint loading.
Nonconservative matl. kg/day 0.569Simulates the CBOD2 component. Based on a 82.5% decrease in total
nonpoint loading.
10 Upper Calcasieu River Reach 10 BOD kg/day 0.216Simulates the CBOD1 component. Based on a 82.5% decrease in total
nonpoint loading.
Organic Nitrogen kg/day 0.050 Based on a 82.5% decrease in total nonpoint loading.
Nonconservative matl. kg/day 0.653Simulates the CBOD2 component. Based on a 82.5% decrease in total
nonpoint loading.
Page 16 of 24 Datatype 19 Input Description 1/9/02
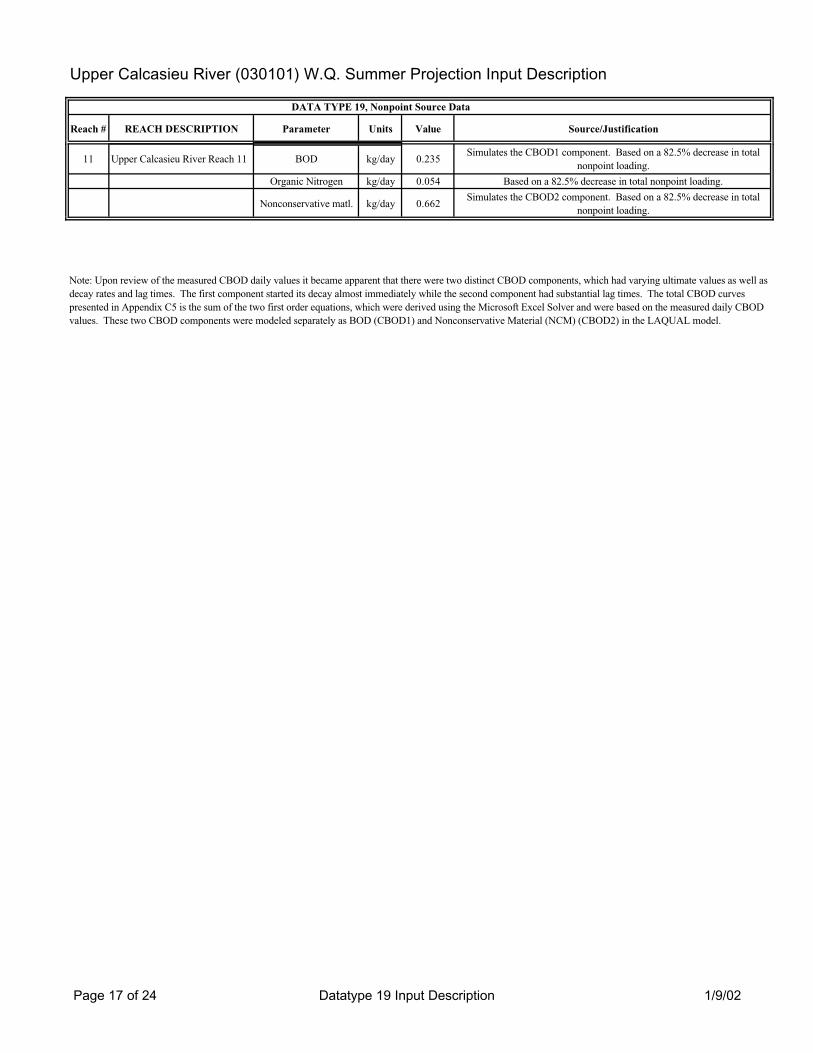
Upper Calcasieu River (030101) W.Q. Summer Projection Input Description
DATA TYPE 19, Nonpoint Source Data
Reach # REACH DESCRIPTION Parameter Units Value Source/Justification
11 Upper Calcasieu River Reach 11 BOD kg/day 0.235Simulates the CBOD1 component. Based on a 82.5% decrease in total
nonpoint loading.
Organic Nitrogen kg/day 0.054 Based on a 82.5% decrease in total nonpoint loading.
Nonconservative matl. kg/day 0.662Simulates the CBOD2 component. Based on a 82.5% decrease in total
nonpoint loading.
Note: Upon review of the measured CBOD daily values it became apparent that there were two distinct CBOD components, which had varying ultimate values as well as
decay rates and lag times. The first component started its decay almost immediately while the second component had substantial lag times. The total CBOD curves
presented in Appendix C5 is the sum of the two first order equations, which were derived using the Microsoft Excel Solver and were based on the measured daily CBOD
values. These two CBOD components were modeled separately as BOD (CBOD1) and Nonconservative Material (NCM) (CBOD2) in the LAQUAL model.
Page 17 of 24 Datatype 19 Input Description 1/9/02
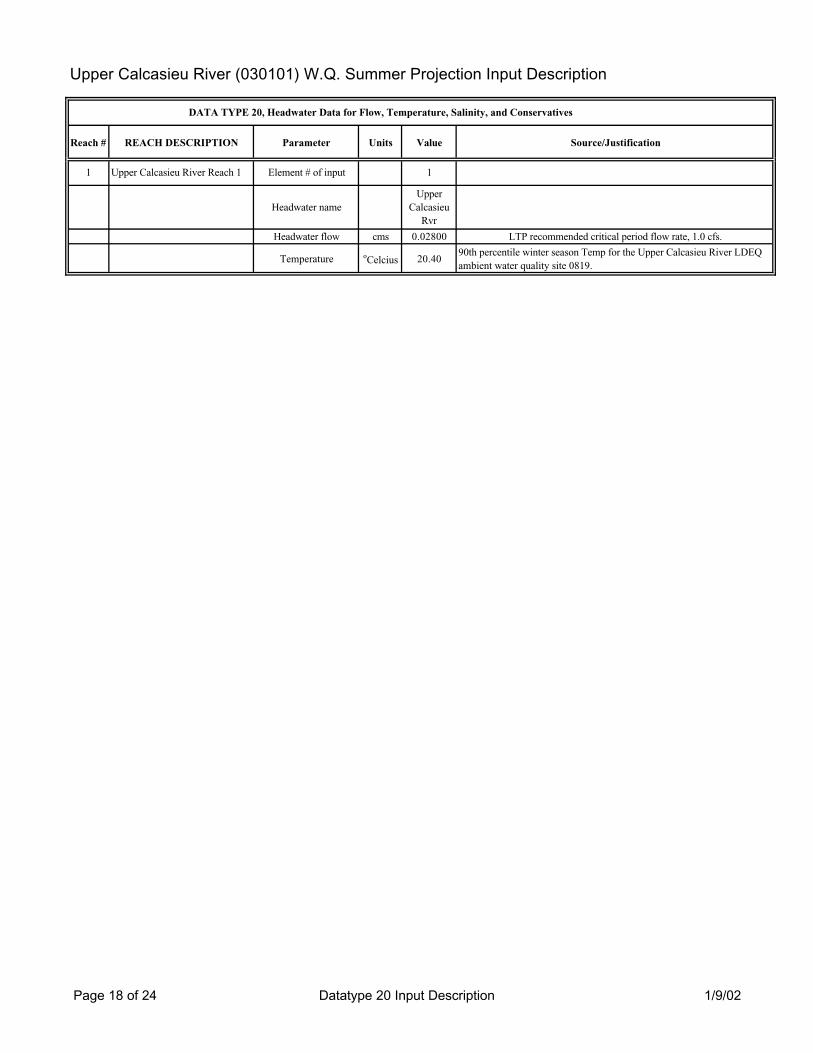
Upper Calcasieu River (030101) W.Q. Summer Projection Input Description
DATA TYPE 20, Headwater Data for Flow, Temperature, Salinity, and Conservatives
Reach # REACH DESCRIPTION Parameter Units Value Source/Justification
1 Upper Calcasieu River Reach 1 Element # of input 1
Headwater name
Upper
Calcasieu
Rvr
Headwater flow cms 0.02800 LTP recommended critical period flow rate, 1.0 cfs.
Temperature oCelcius 20.40
90th percentile winter season Temp for the Upper Calcasieu River LDEQ
ambient water quality site 0819.
Page 18 of 24 Datatype 20 Input Description 1/9/02

Upper Calcasieu River (030101) W.Q. Summer Projection Input Description
DATA TYPE 21, Headwater Data for DO, BOD, and Nitrogen
Reach # NAME Parameter Units Value Source/Justification
1 Upper Calcasieu River Reach 1 Element # of input 1 Measured at July, 2001 survey site UpCalc1.
Dissolved O2 mg/l 8.1290% of saturated dissolved oxygen at 90th percentile critical
temperature.criteria value.
BOD mg/l 5.06Measured ultimate CBOD1 value from Site UpCalc1 during July,2001
survey.
Organic Nitrogen mg/l 0.65Measured Organic Nitrogen value from Site UpCalc1 during July,2001
survey.
Ammonia Nitrogen mg/l 0.05
Measured Ammonia Nitrogen value from Site UpCalc1 during July,2001
survey. Below PQL(Practical Quantitation Limit), used one half of PQL as
value.
NO2+NO3 mg/l 0.025
Measured NO2+NO3 Nitrogen value from Site UpCalc1 during July,2001
survey. Below PQL(Practical Quantitation Limit), used one half of PQL as
value.
Note: Upon review of the measured CBOD daily values it became apparent that there were two distinct CBOD components, which had varying ultimate values as well as
decay rates and lag times. The first component started its decay almost immediately while the second component had substantial lag times. The total CBOD curves
presented in Appendix C5 is the sum of the two first order equations, which were derived using the Microsoft Excel Solver and were based on the measured daily CBOD
values. These two CBOD components were modeled separately as BOD (CBOD1) and Nonconservative Material (NCM) (CBOD2) in the LAQUAL model.
Page 19 of 24 Datatype 21 Input Description 1/9/02

Upper Calcasieu River (030101) W.Q. Summer Projection Input Description
DATA TYPE 22, Headwater Data for Phosphorus, Chlorophyll, Coliform, and Nonconservatives
Reach # NAME Parameter Units Value Source/Justification
1 Upper Calcasieu River Reach 1 Element # of input 1 Measured at June, 2001 survey site CL1.
Chlorophyll a ug/l 2 Based on TNRCC guidance documents.
NCM mg/l 5.31Measured ultimate CBOD2 value from Site UpCalc1 during July,2001
survey.
Note: Upon review of the measured CBOD daily values it became apparent that there were two distinct CBOD components, which had varying ultimate values as
well as decay rates and lag times. The first component started its decay almost immediately while the second component had substantial lag times. The total
CBOD curves presented in Appendix C5 is the sum of the two first order equations, which were derived using the Microsoft Excel Solver and were based on the
measured daily CBOD values. These two CBOD components were modeled separately as BOD (CBOD1) and Nonconservative Material (NCM) (CBOD2) in the
LAQUAL model.
Page 20 of 24 Datatype 22 Input Description 1/9/02
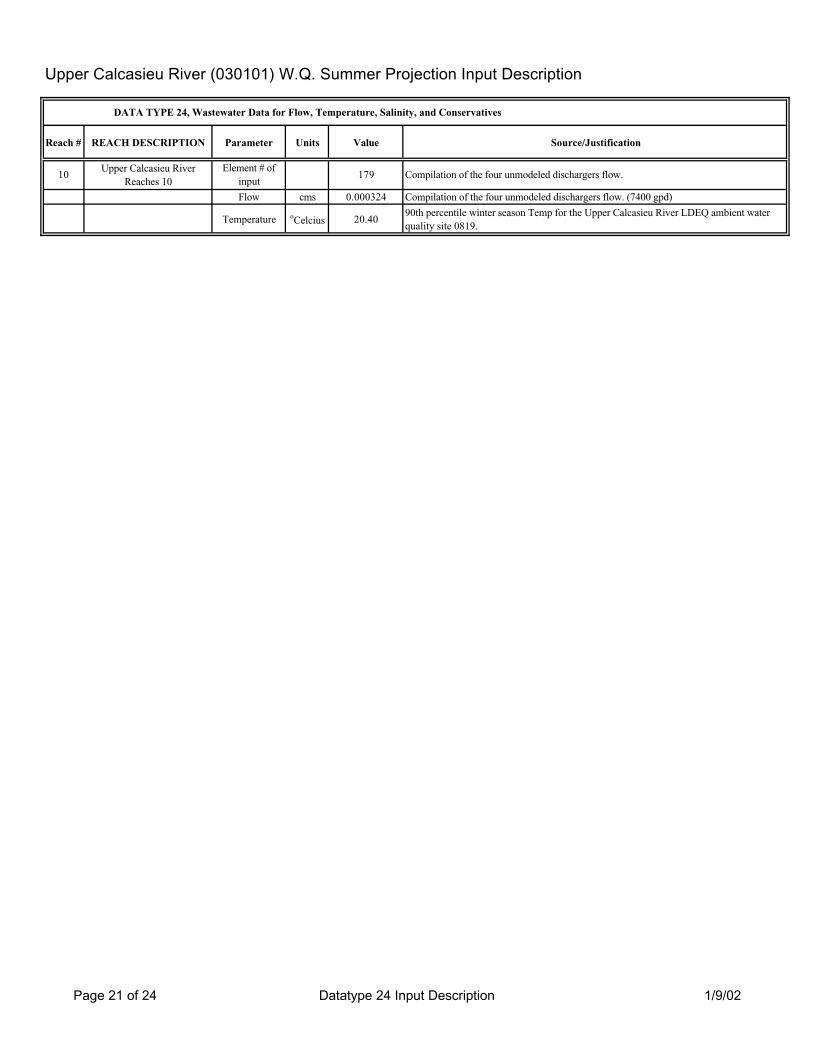
Upper Calcasieu River (030101) W.Q. Summer Projection Input Description
DATA TYPE 24, Wastewater Data for Flow, Temperature, Salinity, and Conservatives
Reach # REACH DESCRIPTION Parameter Units Value Source/Justification
10Upper Calcasieu River
Reaches 10
Element # of
input179 Compilation of the four unmodeled dischargers flow.
Flow cms 0.000324 Compilation of the four unmodeled dischargers flow. (7400 gpd)
Temperature oCelcius 20.40
90th percentile winter season Temp for the Upper Calcasieu River LDEQ ambient water
quality site 0819.
Page 21 of 24 Datatype 24 Input Description 1/9/02

Upper Calcasieu River (030101) W.Q. Summer Projection Input Description
DATA TYPE 25, Wastewater Data for DO, BOD, and Nitrogen
Reach # REACH DESCRIPTION Parameter Units Value Source/Justification
10Upper Calcasieu River Reaches
10Element # of input 179 Compilation of the four unmodeled dischargers flow.
Dissolved Oxygen mg/l 8.1290% of saturated dissolved oxygen at 90th percentile critical
temperature.criteria value.
BOD mg/l 5.06Measured ultimate CBOD1 value from Site UpCalc1 during
July,2001 survey.
Organic Nitrogen mg/l 0.65Measured Organic Nitrogen value from Site UpCalc1 during
July,2001 survey.
Ammonia Nitrogen mg/l 0.05
Measured Ammonia Nitrogen value from Site UpCalc1 during
July,2001 survey. Below PQL(Practical Quantitation Limit), used
one half of PQL as value.
NO2+NO3 mg/l 0.025
Measured NO2+NO3 Nitrogen value from Site UpCalc1 during
July,2001 survey. Below PQL(Practical Quantitation Limit), used
one half of PQL as value.
Page 22 of 24 Datatype 25 Input Description 1/9/02
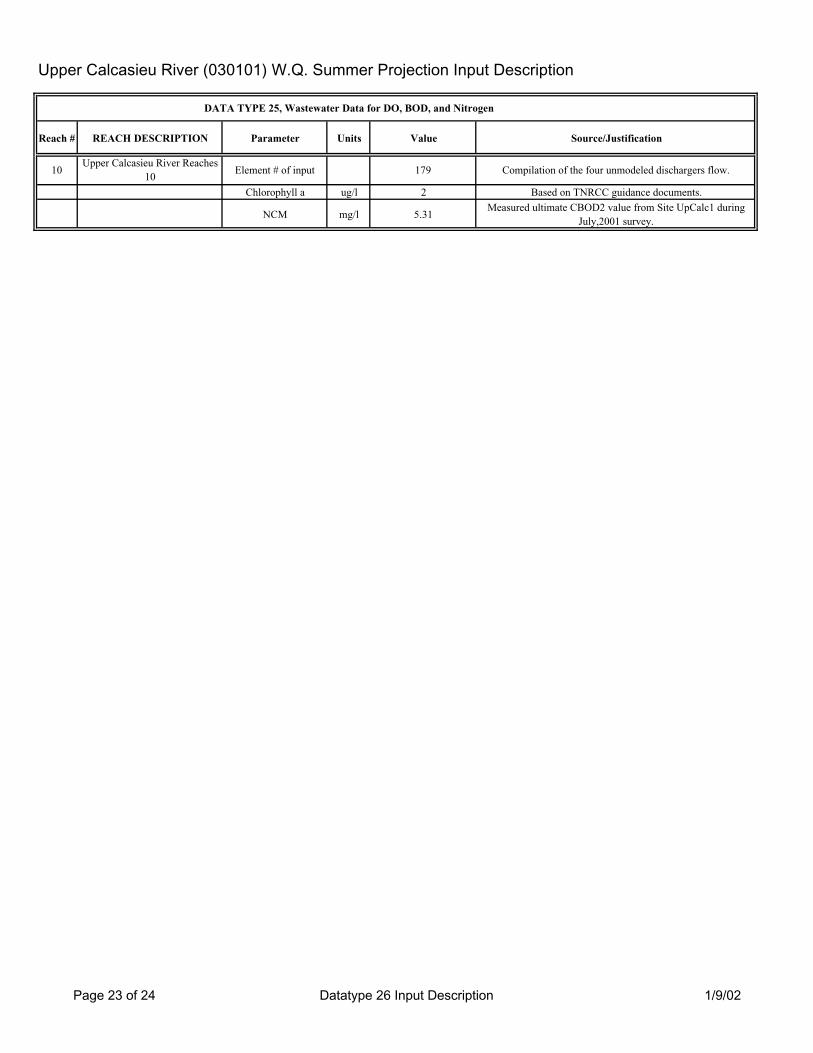
Upper Calcasieu River (030101) W.Q. Summer Projection Input Description
DATA TYPE 25, Wastewater Data for DO, BOD, and Nitrogen
Reach # REACH DESCRIPTION Parameter Units Value Source/Justification
10Upper Calcasieu River Reaches
10Element # of input 179 Compilation of the four unmodeled dischargers flow.
Chlorophyll a ug/l 2 Based on TNRCC guidance documents.
NCM mg/l 5.31Measured ultimate CBOD2 value from Site UpCalc1 during
July,2001 survey.
Page 23 of 24 Datatype 26 Input Description 1/9/02

Mermentau River Water Qualtity Calibration Model Input Description
DATA TYPE 27, Lower Boundary Conditions
Reach # NAME Parameter Units Value Source/Justification
11 Upper Calcasieu River Temperature oCelcius 29.4
90th percentile Temp for the Upper Calcasieu River LDEQ ambient water
quality site 0819.
Salinity ppt 0 Not required by the model if the Ocean Exchange Ratio is set to zero.
Conservative Matl. I mg/l 0 Not required by the model if the Ocean Exchange Ratio is set to zero.
Conservative Matl. II 0 Not required by the model if the Ocean Exchange Ratio is set to zero.
Dissolved O2 mg/l 0 Not required by the model if the Ocean Exchange Ratio is set to zero.
BOD mg/l 0 Not required by the model if the Ocean Exchange Ratio is set to zero.
Org.- N mg/l 0 Not required by the model if the Ocean Exchange Ratio is set to zero.
NH3-N mg/l 0 Not required by the model if the Ocean Exchange Ratio is set to zero.
NO2+3-N mg/l 0 Not required by the model if the Ocean Exchange Ratio is set to zero.
Chlorophyll a ug/l 2 Based on TNRCC guidance documents.
NCM mg/l 0 Not required by the model if the Ocean Exchange Ratio is set to zero.
Page 24 of 24 Datatype 27 Input Description 1/9/02
Upper Calcasieu River Watershed TMDL for Dissolved Oxygen Subsegment 080808 Originated: January 9, 2002
36
Appendix B6
Projection Model Development
Critical temperature DO Saturation calculations
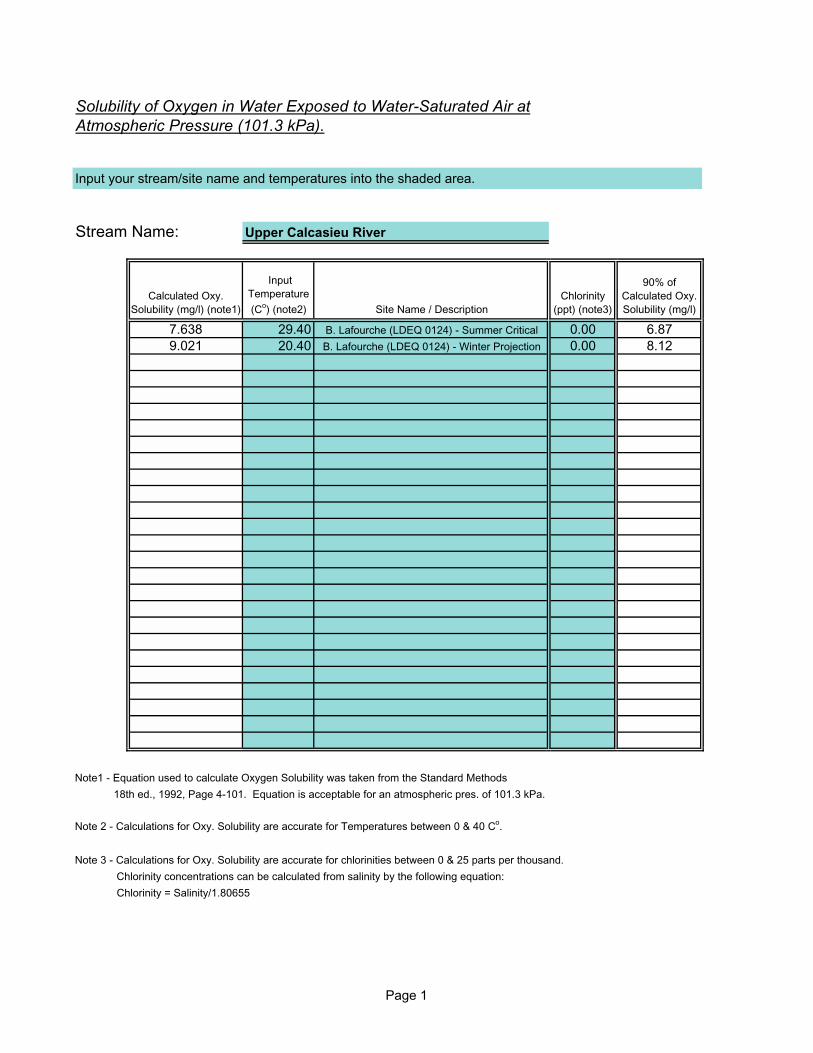
Solubility of Oxygen in Water Exposed to Water-Saturated Air atAtmospheric Pressure (101.3 kPa).
Input your stream/site name and temperatures into the shaded area.
Stream Name: Upper Calcasieu River
Calculated Oxy. Solubility (mg/l) (note1)
Input Temperature (Co) (note2) Site Name / Description
Chlorinity (ppt) (note3)
90% of Calculated Oxy. Solubility (mg/l)
7.638 29.40 B. Lafourche (LDEQ 0124) - Summer Critical 0.00 6.879.021 20.40 B. Lafourche (LDEQ 0124) - Winter Projection 0.00 8.12
Note1 - Equation used to calculate Oxygen Solubility was taken from the Standard Methods
18th ed., 1992, Page 4-101. Equation is acceptable for an atmospheric pres. of 101.3 kPa.
Note 2 - Calculations for Oxy. Solubility are accurate for Temperatures between 0 & 40 Co.
Note 3 - Calculations for Oxy. Solubility are accurate for chlorinities between 0 & 25 parts per thousand.
Chlorinity concentrations can be calculated from salinity by the following equation:
Chlorinity = Salinity/1.80655
Page 1

Page 2
Upper Calcasieu River Watershed TMDL for Dissolved Oxygen Subsegment 080808 Originated: January 9, 2002
37
Appendix C
Survey Data Measurements and Analysis Results
Upper Calcasieu River Watershed TMDL for Dissolved Oxygen Subsegment 080808 Originated: January 9, 2002
38
Appendix C1
Survey Data Measurements and Analysis Results
OVERVIEW OF SURVEY WATER QUALITY DATA
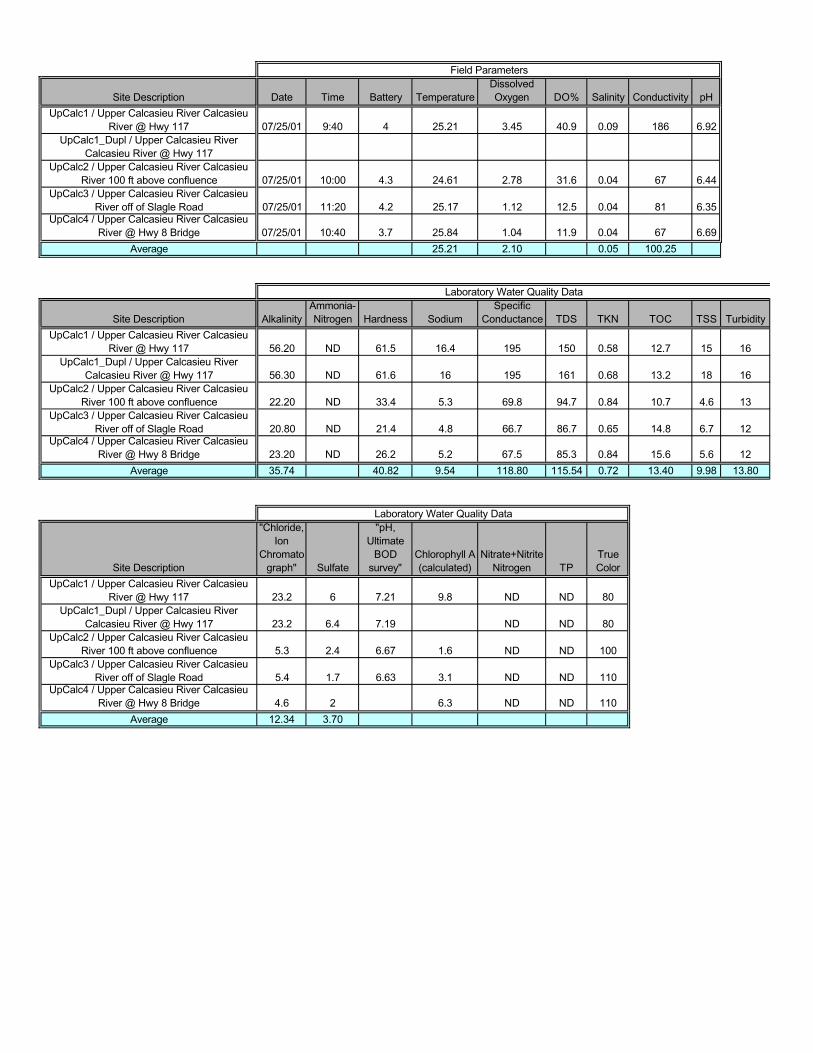
Site Description Date Time Battery TemperatureDissolved Oxygen DO% Salinity Conductivity pH
UpCalc1 / Upper Calcasieu River Calcasieu River @ Hwy 117 07/25/01 9:40 4 25.21 3.45 40.9 0.09 186 6.92
UpCalc1_Dupl / Upper Calcasieu River Calcasieu River @ Hwy 117
UpCalc2 / Upper Calcasieu River Calcasieu River 100 ft above confluence 07/25/01 10:00 4.3 24.61 2.78 31.6 0.04 67 6.44
UpCalc3 / Upper Calcasieu River Calcasieu River off of Slagle Road 07/25/01 11:20 4.2 25.17 1.12 12.5 0.04 81 6.35
UpCalc4 / Upper Calcasieu River Calcasieu River @ Hwy 8 Bridge 07/25/01 10:40 3.7 25.84 1.04 11.9 0.04 67 6.69
Average 25.21 2.10 0.05 100.25
Site Description AlkalinityAmmonia-Nitrogen Hardness Sodium
Specific Conductance TDS TKN TOC TSS Turbidity
UpCalc1 / Upper Calcasieu River Calcasieu River @ Hwy 117 56.20 ND 61.5 16.4 195 150 0.58 12.7 15 16
UpCalc1_Dupl / Upper Calcasieu River Calcasieu River @ Hwy 117 56.30 ND 61.6 16 195 161 0.68 13.2 18 16
UpCalc2 / Upper Calcasieu River Calcasieu River 100 ft above confluence 22.20 ND 33.4 5.3 69.8 94.7 0.84 10.7 4.6 13
UpCalc3 / Upper Calcasieu River Calcasieu River off of Slagle Road 20.80 ND 21.4 4.8 66.7 86.7 0.65 14.8 6.7 12
UpCalc4 / Upper Calcasieu River Calcasieu River @ Hwy 8 Bridge 23.20 ND 26.2 5.2 67.5 85.3 0.84 15.6 5.6 12
Average 35.74 40.82 9.54 118.80 115.54 0.72 13.40 9.98 13.80
Site Description
"Chloride,Ion
Chromatograph" Sulfate
"pH, Ultimate
BOD survey"
Chlorophyll A (calculated)
Nitrate+Nitrite Nitrogen TP
True Color
UpCalc1 / Upper Calcasieu River Calcasieu River @ Hwy 117 23.2 6 7.21 9.8 ND ND 80
UpCalc1_Dupl / Upper Calcasieu River Calcasieu River @ Hwy 117 23.2 6.4 7.19 ND ND 80
UpCalc2 / Upper Calcasieu River Calcasieu River 100 ft above confluence 5.3 2.4 6.67 1.6 ND ND 100
UpCalc3 / Upper Calcasieu River Calcasieu River off of Slagle Road 5.4 1.7 6.63 3.1 ND ND 110
UpCalc4 / Upper Calcasieu River Calcasieu River @ Hwy 8 Bridge 4.6 2 6.3 ND ND 110
Average 12.34 3.70
Field Parameters
Laboratory Water Quality Data
Laboratory Water Quality Data

Upper Calcasieu River Watershed TMDL for Dissolved Oxygen Subsegment 080808 Originated: January 9, 2002
39
Appendix C2
Survey Data Measurements and Analysis Results
Survey cross-sections and discharge sheets
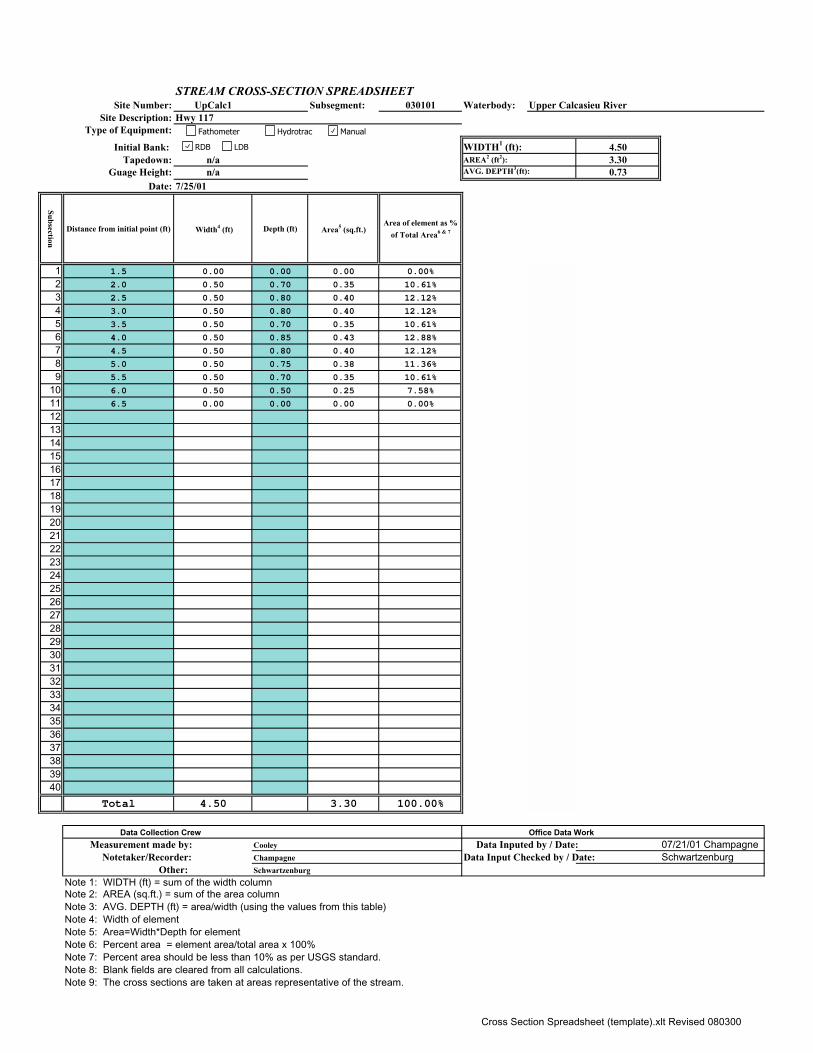
STREAM CROSS-SECTION SPREADSHEETSite Number: UpCalc1 Subsegment: 030101 Waterbody: Upper Calcasieu River
Site Description: Hwy 117Type of Equipment:
Initial Bank: WIDTH1 (ft): 4.50Tapedown: n/a AREA2 (ft2): 3.30
Guage Height: n/a AVG. DEPTH3(ft): 0.73Date: 7/25/01
Subsection
Distance from initial point (ft) Width4 (ft) Depth (ft) Area5 (sq.ft.) Area of element as %
of Total Area6 & 7
1 1.5 0.00 0.00 0.00 0.00%
2 2.0 0.50 0.70 0.35 10.61%
3 2.5 0.50 0.80 0.40 12.12%
4 3.0 0.50 0.80 0.40 12.12%
5 3.5 0.50 0.70 0.35 10.61%
6 4.0 0.50 0.85 0.43 12.88%
7 4.5 0.50 0.80 0.40 12.12%
8 5.0 0.50 0.75 0.38 11.36%
9 5.5 0.50 0.70 0.35 10.61%
10 6.0 0.50 0.50 0.25 7.58%
11 6.5 0.00 0.00 0.00 0.00%
1213141516171819202122232425262728293031323334353637383940
Total 4.50 3.30 100.00%
Data Collection Crew Office Data Work
Measurement made by: Cooley Data Inputed by / Date: 07/21/01 Champagne Notetaker/Recorder: Champagne Data Input Checked by / Date: Schwartzenburg Other: Schwartzenburg
Note 1: WIDTH (ft) = sum of the width columnNote 2: AREA (sq.ft.) = sum of the area columnNote 3: AVG. DEPTH (ft) = area/width (using the values from this table)Note 4: Width of elementNote 5: Area=Width*Depth for elementNote 6: Percent area = element area/total area x 100%Note 7: Percent area should be less than 10% as per USGS standard.Note 8: Blank fields are cleared from all calculations.Note 9: The cross sections are taken at areas representative of the stream.
Fathometer Hydrotrac Manual
RDB LDB
Cross Section Spreadsheet (template).xlt Revised 080300
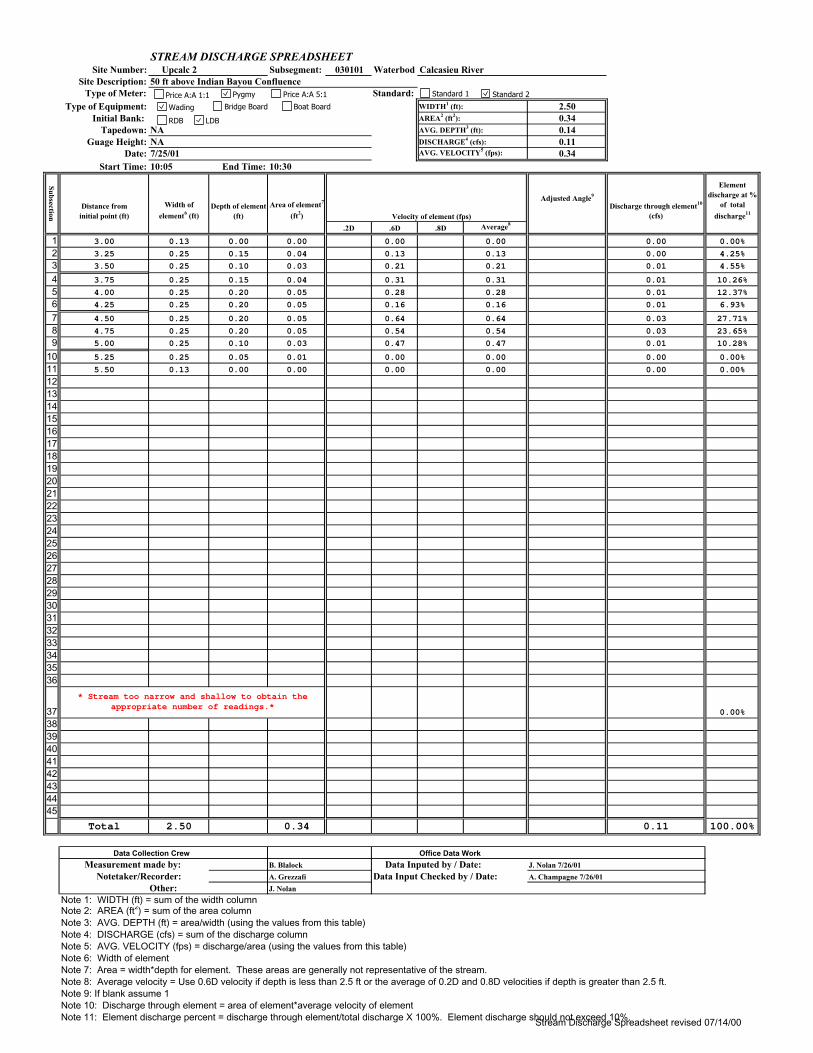
STREAM DISCHARGE SPREADSHEETSite Number: Upcalc 2 Subsegment: 030101 Waterbod Calcasieu River
Site Description: 50 ft above Indian Bayou ConfluenceType of Meter: Standard:
Type of Equipment: WIDTH1 (ft): 2.50Initial Bank: AREA2 (ft2): 0.34
Tapedown: NA AVG. DEPTH3 (ft): 0.14Guage Height: NA DISCHARGE4 (cfs): 0.11
Date: 7/25/01 AVG. VELOCITY5 (fps): 0.34Start Time: 10:05 End Time: 10:30
Subsection
Distance from initial point (ft)
Width of
element6 (ft)Depth of element
(ft)
Area of element7
(ft2) Velocity of element (fps)
Adjusted Angle9
Discharge through element10
(cfs)
Element discharge at %
of total
discharge11
.2D .6D .8D Average8
1 3.00 0.13 0.00 0.00 0.00 0.00 0.00 0.00%
2 3.25 0.25 0.15 0.04 0.13 0.13 0.00 4.25%
3 3.50 0.25 0.10 0.03 0.21 0.21 0.01 4.55%
4 3.75 0.25 0.15 0.04 0.31 0.31 0.01 10.26%
5 4.00 0.25 0.20 0.05 0.28 0.28 0.01 12.37%
6 4.25 0.25 0.20 0.05 0.16 0.16 0.01 6.93%
7 4.50 0.25 0.20 0.05 0.64 0.64 0.03 27.71%
8 4.75 0.25 0.20 0.05 0.54 0.54 0.03 23.65%
9 5.00 0.25 0.10 0.03 0.47 0.47 0.01 10.28%
10 5.25 0.25 0.05 0.01 0.00 0.00 0.00 0.00%
11 5.50 0.13 0.00 0.00 0.00 0.00 0.00 0.00%
12
13
14
15
16
17
18
19
20
21
22
23
24
25
26
27
28
29
30
31
32
33
34
35
36
37 0.00%
38
39404142434445
Total 2.50 0.34 0.11 100.00%
Data Collection Crew Office Data Work
Measurement made by: B. Blalock Data Inputed by / Date: J. Nolan 7/26/01
Notetaker/Recorder: A. Grezzafi Data Input Checked by / Date: A. Champagne 7/26/01
Other: J. Nolan
Note 1: WIDTH (ft) = sum of the width columnNote 2: AREA (ft2) = sum of the area columnNote 3: AVG. DEPTH (ft) = area/width (using the values from this table)Note 4: DISCHARGE (cfs) = sum of the discharge columnNote 5: AVG. VELOCITY (fps) = discharge/area (using the values from this table)Note 6: Width of elementNote 7: Area = width*depth for element. These areas are generally not representative of the stream.Note 8: Average velocity = Use 0.6D velocity if depth is less than 2.5 ft or the average of 0.2D and 0.8D velocities if depth is greater than 2.5 ft. Note 9: If blank assume 1Note 10: Discharge through element = area of element*average velocity of elementNote 11: Element discharge percent = discharge through element/total discharge X 100%. Element discharge should not exceed 10%.
* Stream too narrow and shallow to obtain the appropriate number of readings.*
Price A:A 1:1 Pygmy Price A:A 5:1 Standard 1 Standard 2
Wading Bridge Board Boat Board
RDB LDB
Stream Discharge Spreadsheet revised 07/14/00
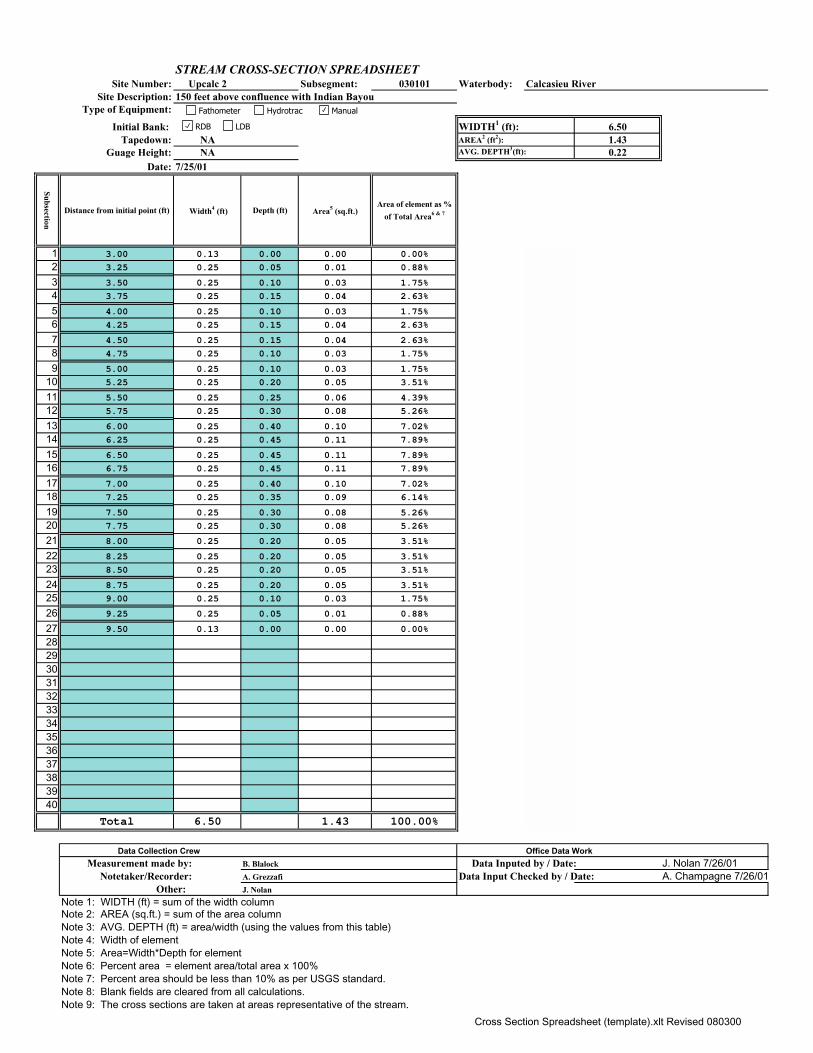
STREAM CROSS-SECTION SPREADSHEETSite Number: Upcalc 2 Subsegment: 030101 Waterbody: Calcasieu River
Site Description: 150 feet above confluence with Indian BayouType of Equipment:
Initial Bank: WIDTH1 (ft): 6.50Tapedown: NA AREA2 (ft2): 1.43
Guage Height: NA AVG. DEPTH3(ft): 0.22Date: 7/25/01
Subsection
Distance from initial point (ft) Width4 (ft) Depth (ft) Area5 (sq.ft.) Area of element as %
of Total Area6 & 7
1 3.00 0.13 0.00 0.00 0.00%
2 3.25 0.25 0.05 0.01 0.88%
3 3.50 0.25 0.10 0.03 1.75%
4 3.75 0.25 0.15 0.04 2.63%
5 4.00 0.25 0.10 0.03 1.75%
6 4.25 0.25 0.15 0.04 2.63%
7 4.50 0.25 0.15 0.04 2.63%
8 4.75 0.25 0.10 0.03 1.75%
9 5.00 0.25 0.10 0.03 1.75%
10 5.25 0.25 0.20 0.05 3.51%
11 5.50 0.25 0.25 0.06 4.39%
12 5.75 0.25 0.30 0.08 5.26%
13 6.00 0.25 0.40 0.10 7.02%
14 6.25 0.25 0.45 0.11 7.89%
15 6.50 0.25 0.45 0.11 7.89%
16 6.75 0.25 0.45 0.11 7.89%
17 7.00 0.25 0.40 0.10 7.02%
18 7.25 0.25 0.35 0.09 6.14%
19 7.50 0.25 0.30 0.08 5.26%
20 7.75 0.25 0.30 0.08 5.26%
21 8.00 0.25 0.20 0.05 3.51%
22 8.25 0.25 0.20 0.05 3.51%
23 8.50 0.25 0.20 0.05 3.51%
24 8.75 0.25 0.20 0.05 3.51%
25 9.00 0.25 0.10 0.03 1.75%
26 9.25 0.25 0.05 0.01 0.88%
27 9.50 0.13 0.00 0.00 0.00%
28293031323334353637383940
Total 6.50 1.43 100.00%
Data Collection Crew Office Data Work
Measurement made by: B. Blalock Data Inputed by / Date: J. Nolan 7/26/01 Notetaker/Recorder: A. Grezzafi Data Input Checked by / Date: A. Champagne 7/26/01 Other: J. Nolan
Note 1: WIDTH (ft) = sum of the width columnNote 2: AREA (sq.ft.) = sum of the area columnNote 3: AVG. DEPTH (ft) = area/width (using the values from this table)Note 4: Width of elementNote 5: Area=Width*Depth for elementNote 6: Percent area = element area/total area x 100%Note 7: Percent area should be less than 10% as per USGS standard.Note 8: Blank fields are cleared from all calculations.Note 9: The cross sections are taken at areas representative of the stream.
Fathometer Hydrotrac Manual
RDB LDB
Cross Section Spreadsheet (template).xlt Revised 080300
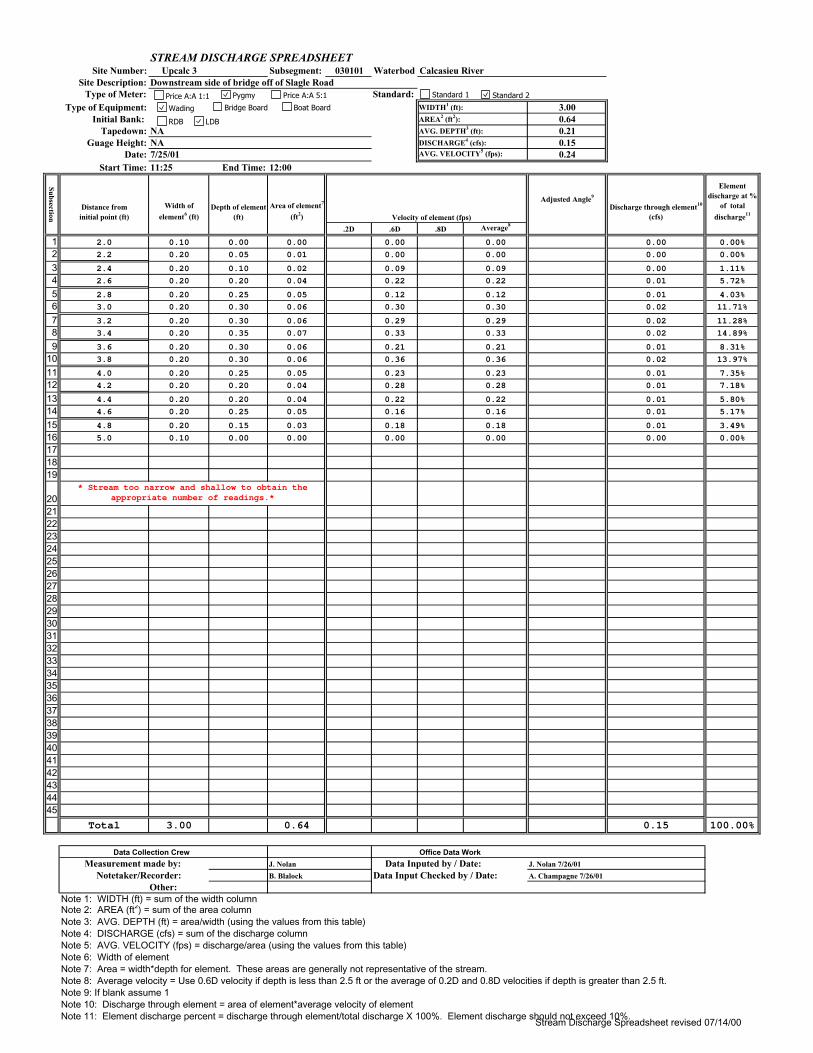
STREAM DISCHARGE SPREADSHEETSite Number: Upcalc 3 Subsegment: 030101 Waterbod Calcasieu River
Site Description: Downstream side of bridge off of Slagle RoadType of Meter: Standard:
Type of Equipment: WIDTH1 (ft): 3.00Initial Bank: AREA2 (ft2): 0.64
Tapedown: NA AVG. DEPTH3 (ft): 0.21Guage Height: NA DISCHARGE4 (cfs): 0.15
Date: 7/25/01 AVG. VELOCITY5 (fps): 0.24Start Time: 11:25 End Time: 12:00
Subsection
Distance from initial point (ft)
Width of
element6 (ft)Depth of element
(ft)
Area of element7
(ft2) Velocity of element (fps)
Adjusted Angle9
Discharge through element10
(cfs)
Element discharge at %
of total
discharge11
.2D .6D .8D Average8
1 2.0 0.10 0.00 0.00 0.00 0.00 0.00 0.00%
2 2.2 0.20 0.05 0.01 0.00 0.00 0.00 0.00%
3 2.4 0.20 0.10 0.02 0.09 0.09 0.00 1.11%
4 2.6 0.20 0.20 0.04 0.22 0.22 0.01 5.72%
5 2.8 0.20 0.25 0.05 0.12 0.12 0.01 4.03%
6 3.0 0.20 0.30 0.06 0.30 0.30 0.02 11.71%
7 3.2 0.20 0.30 0.06 0.29 0.29 0.02 11.28%
8 3.4 0.20 0.35 0.07 0.33 0.33 0.02 14.89%
9 3.6 0.20 0.30 0.06 0.21 0.21 0.01 8.31%
10 3.8 0.20 0.30 0.06 0.36 0.36 0.02 13.97%
11 4.0 0.20 0.25 0.05 0.23 0.23 0.01 7.35%
12 4.2 0.20 0.20 0.04 0.28 0.28 0.01 7.18%
13 4.4 0.20 0.20 0.04 0.22 0.22 0.01 5.80%
14 4.6 0.20 0.25 0.05 0.16 0.16 0.01 5.17%
15 4.8 0.20 0.15 0.03 0.18 0.18 0.01 3.49%
16 5.0 0.10 0.00 0.00 0.00 0.00 0.00 0.00%
17
18
19
2021
22
23
24
25
26
27
28
29
30
31
32
33
34
35
36
37
38
39404142434445
Total 3.00 0.64 0.15 100.00%
Data Collection Crew Office Data Work
Measurement made by: J. Nolan Data Inputed by / Date: J. Nolan 7/26/01
Notetaker/Recorder: B. Blalock Data Input Checked by / Date: A. Champagne 7/26/01
Other:Note 1: WIDTH (ft) = sum of the width columnNote 2: AREA (ft2) = sum of the area columnNote 3: AVG. DEPTH (ft) = area/width (using the values from this table)Note 4: DISCHARGE (cfs) = sum of the discharge columnNote 5: AVG. VELOCITY (fps) = discharge/area (using the values from this table)Note 6: Width of elementNote 7: Area = width*depth for element. These areas are generally not representative of the stream.Note 8: Average velocity = Use 0.6D velocity if depth is less than 2.5 ft or the average of 0.2D and 0.8D velocities if depth is greater than 2.5 ft. Note 9: If blank assume 1Note 10: Discharge through element = area of element*average velocity of elementNote 11: Element discharge percent = discharge through element/total discharge X 100%. Element discharge should not exceed 10%.
* Stream too narrow and shallow to obtain the appropriate number of readings.*
Price A:A 1:1 Pygmy Price A:A 5:1 Standard 1 Standard 2
Wading Bridge Board Boat Board
RDB LDB
Stream Discharge Spreadsheet revised 07/14/00
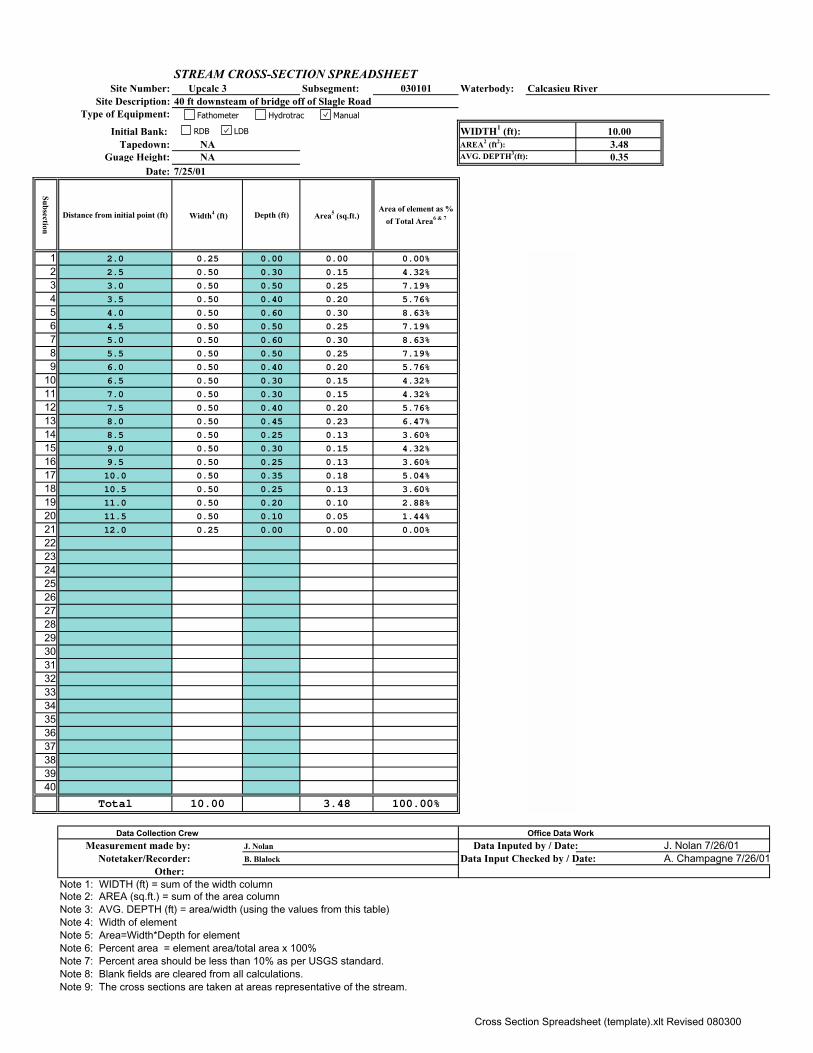
STREAM CROSS-SECTION SPREADSHEETSite Number: Upcalc 3 Subsegment: 030101 Waterbody: Calcasieu River
Site Description: 40 ft downsteam of bridge off of Slagle Road Type of Equipment:
Initial Bank: WIDTH1 (ft): 10.00Tapedown: NA AREA2 (ft2): 3.48
Guage Height: NA AVG. DEPTH3(ft): 0.35Date: 7/25/01
Subsection
Distance from initial point (ft) Width4 (ft) Depth (ft) Area5 (sq.ft.) Area of element as %
of Total Area6 & 7
1 2.0 0.25 0.00 0.00 0.00%
2 2.5 0.50 0.30 0.15 4.32%
3 3.0 0.50 0.50 0.25 7.19%
4 3.5 0.50 0.40 0.20 5.76%
5 4.0 0.50 0.60 0.30 8.63%
6 4.5 0.50 0.50 0.25 7.19%
7 5.0 0.50 0.60 0.30 8.63%
8 5.5 0.50 0.50 0.25 7.19%
9 6.0 0.50 0.40 0.20 5.76%
10 6.5 0.50 0.30 0.15 4.32%
11 7.0 0.50 0.30 0.15 4.32%
12 7.5 0.50 0.40 0.20 5.76%
13 8.0 0.50 0.45 0.23 6.47%
14 8.5 0.50 0.25 0.13 3.60%
15 9.0 0.50 0.30 0.15 4.32%
16 9.5 0.50 0.25 0.13 3.60%
17 10.0 0.50 0.35 0.18 5.04%
18 10.5 0.50 0.25 0.13 3.60%
19 11.0 0.50 0.20 0.10 2.88%
20 11.5 0.50 0.10 0.05 1.44%
21 12.0 0.25 0.00 0.00 0.00%
22232425262728293031323334353637383940
Total 10.00 3.48 100.00%
Data Collection Crew Office Data Work
Measurement made by: J. Nolan Data Inputed by / Date: J. Nolan 7/26/01 Notetaker/Recorder: B. Blalock Data Input Checked by / Date: A. Champagne 7/26/01 Other:Note 1: WIDTH (ft) = sum of the width columnNote 2: AREA (sq.ft.) = sum of the area columnNote 3: AVG. DEPTH (ft) = area/width (using the values from this table)Note 4: Width of elementNote 5: Area=Width*Depth for elementNote 6: Percent area = element area/total area x 100%Note 7: Percent area should be less than 10% as per USGS standard.Note 8: Blank fields are cleared from all calculations.Note 9: The cross sections are taken at areas representative of the stream.
Fathometer Hydrotrac Manual
RDB LDB
Cross Section Spreadsheet (template).xlt Revised 080300
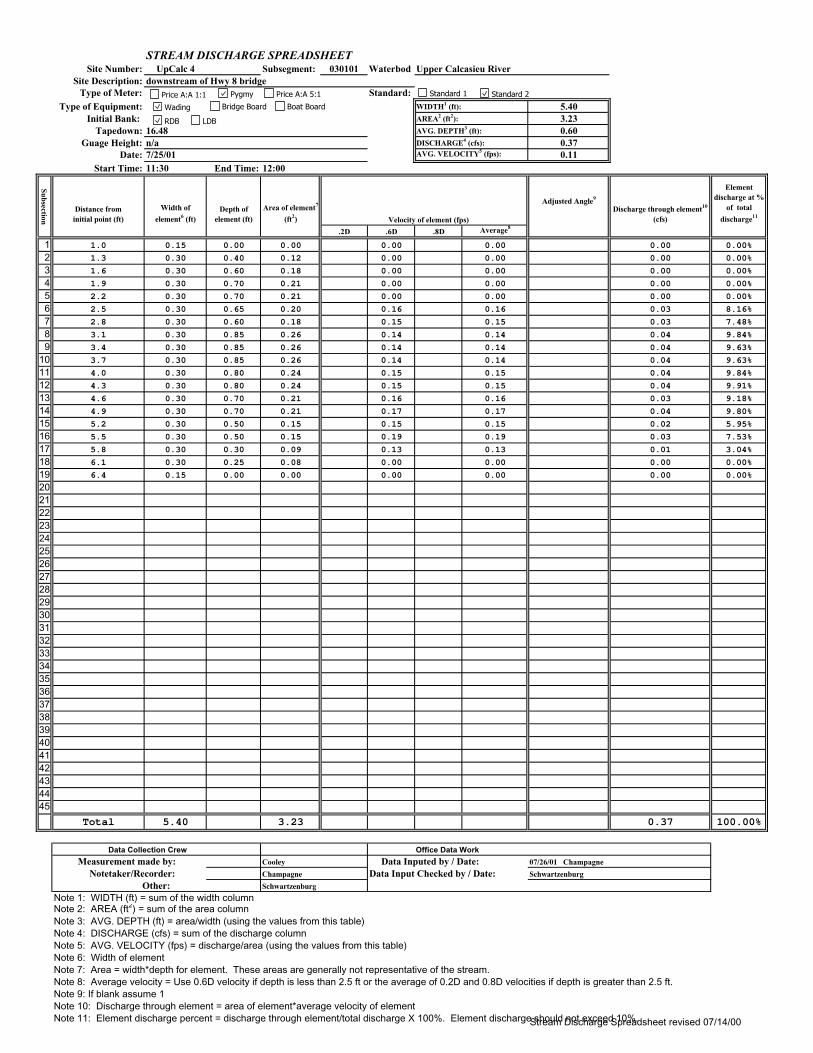
STREAM DISCHARGE SPREADSHEETSite Number: UpCalc 4 Subsegment: 030101 Waterbod Upper Calcasieu River
Site Description: downstream of Hwy 8 bridgeType of Meter: Standard:
Type of Equipment: WIDTH1 (ft): 5.40Initial Bank: AREA2 (ft2): 3.23
Tapedown: 16.48 AVG. DEPTH3 (ft): 0.60Guage Height: n/a DISCHARGE4 (cfs): 0.37
Date: 7/25/01 AVG. VELOCITY5 (fps): 0.11Start Time: 11:30 End Time: 12:00
Subsection
Distance from initial point (ft)
Width of
element6 (ft)Depth of
element (ft)
Area of element7
(ft2) Velocity of element (fps)
Adjusted Angle9
Discharge through element10
(cfs)
Element discharge at %
of total
discharge11
.2D .6D .8D Average8
1 1.0 0.15 0.00 0.00 0.00 0.00 0.00 0.00%
2 1.3 0.30 0.40 0.12 0.00 0.00 0.00 0.00%
3 1.6 0.30 0.60 0.18 0.00 0.00 0.00 0.00%
4 1.9 0.30 0.70 0.21 0.00 0.00 0.00 0.00%
5 2.2 0.30 0.70 0.21 0.00 0.00 0.00 0.00%
6 2.5 0.30 0.65 0.20 0.16 0.16 0.03 8.16%
7 2.8 0.30 0.60 0.18 0.15 0.15 0.03 7.48%
8 3.1 0.30 0.85 0.26 0.14 0.14 0.04 9.84%
9 3.4 0.30 0.85 0.26 0.14 0.14 0.04 9.63%
10 3.7 0.30 0.85 0.26 0.14 0.14 0.04 9.63%
11 4.0 0.30 0.80 0.24 0.15 0.15 0.04 9.84%
12 4.3 0.30 0.80 0.24 0.15 0.15 0.04 9.91%
13 4.6 0.30 0.70 0.21 0.16 0.16 0.03 9.18%
14 4.9 0.30 0.70 0.21 0.17 0.17 0.04 9.80%
15 5.2 0.30 0.50 0.15 0.15 0.15 0.02 5.95%
16 5.5 0.30 0.50 0.15 0.19 0.19 0.03 7.53%
17 5.8 0.30 0.30 0.09 0.13 0.13 0.01 3.04%
18 6.1 0.30 0.25 0.08 0.00 0.00 0.00 0.00%
19 6.4 0.15 0.00 0.00 0.00 0.00 0.00 0.00%
20
21
22
23
24
25
26
27
28
29
30
31
32
33
34
35
36
37
38
39404142434445
Total 5.40 3.23 0.37 100.00%
Data Collection Crew Office Data Work
Measurement made by: Cooley Data Inputed by / Date: 07/26/01 Champagne
Notetaker/Recorder: Champagne Data Input Checked by / Date: Schwartzenburg
Other: Schwartzenburg
Note 1: WIDTH (ft) = sum of the width columnNote 2: AREA (ft2) = sum of the area columnNote 3: AVG. DEPTH (ft) = area/width (using the values from this table)Note 4: DISCHARGE (cfs) = sum of the discharge columnNote 5: AVG. VELOCITY (fps) = discharge/area (using the values from this table)Note 6: Width of elementNote 7: Area = width*depth for element. These areas are generally not representative of the stream.Note 8: Average velocity = Use 0.6D velocity if depth is less than 2.5 ft or the average of 0.2D and 0.8D velocities if depth is greater than 2.5 ft. Note 9: If blank assume 1Note 10: Discharge through element = area of element*average velocity of elementNote 11: Element discharge percent = discharge through element/total discharge X 100%. Element discharge should not exceed 10%.
Price A:A 1:1 Pygmy Price A:A 5:1 Standard 1 Standard 2
Wading Bridge Board Boat Board
RDB LDB
Stream Discharge Spreadsheet revised 07/14/00
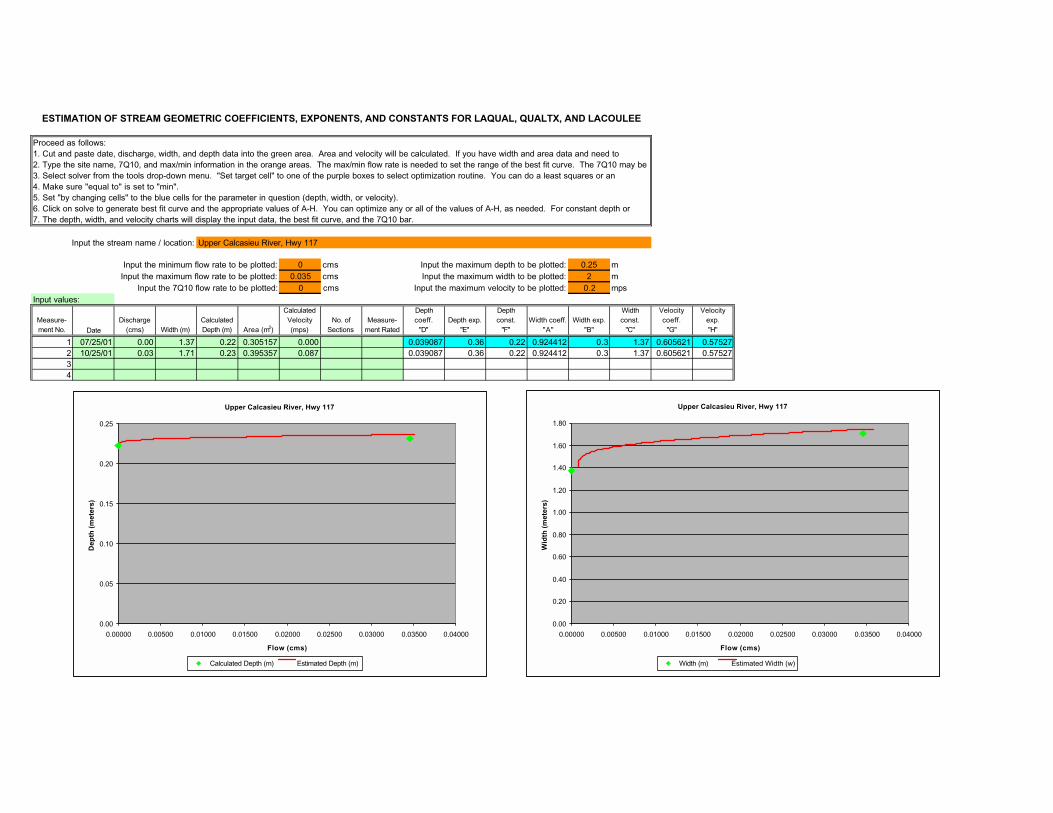
Input the stream name / location:
Input the minimum flow rate to be plotted: 0 cms Input the maximum depth to be plotted: 0.25 mInput the maximum flow rate to be plotted: 0.035 cms Input the maximum width to be plotted: 2 m
Input the 7Q10 flow rate to be plotted: 0 cms Input the maximum velocity to be plotted: 0.2 mpsInput values:
Measure-ment No. Date
Discharge (cms) Width (m)
Calculated Depth (m) Area (m2)
Calculated Velocity (mps)
No. of Sections
Measure- ment Rated
Depth coeff.
"D"Depth exp.
"E"
Depth const.
"F"Width coeff.
"A"Width exp.
"B"
Width const.
"C"
Velocity coeff.
"G"
Velocity exp. "H"
1 07/25/01 0.00 1.37 0.22 0.305157 0.000 0.039087 0.36 0.22 0.924412 0.3 1.37 0.605621 0.575272 10/25/01 0.03 1.71 0.23 0.395357 0.087 0.039087 0.36 0.22 0.924412 0.3 1.37 0.605621 0.5752734
ESTIMATION OF STREAM GEOMETRIC COEFFICIENTS, EXPONENTS, AND CONSTANTS FOR LAQUAL, QUALTX, AND LACOULEE
Proceed as follows:1. Cut and paste date, discharge, width, and depth data into the green area. Area and velocity will be calculated. If you have width and area data and need to 2. Type the site name, 7Q10, and max/min information in the orange areas. The max/min flow rate is needed to set the range of the best fit curve. The 7Q10 may be
7. The depth, width, and velocity charts will display the input data, the best fit curve, and the 7Q10 bar.
Upper Calcasieu River, Hwy 117
3. Select solver from the tools drop-down menu. "Set target cell" to one of the purple boxes to select optimization routine. You can do a least squares or an 4. Make sure "equal to" is set to "min".5. Set "by changing cells" to the blue cells for the parameter in question (depth, width, or velocity).6. Click on solve to generate best fit curve and the appropriate values of A-H. You can optimize any or all of the values of A-H, as needed. For constant depth or
Upper Calcasieu River, Hwy 117
0.00
0.05
0.10
0.15
0.20
0.25
0.00000 0.00500 0.01000 0.01500 0.02000 0.02500 0.03000 0.03500 0.04000
Flow (cms)
Dep
th (
met
ers)
Calculated Depth (m) Estimated Depth (m)
Upper Calcasieu River, Hwy 117
0.00
0.20
0.40
0.60
0.80
1.00
1.20
1.40
1.60
1.80
0.00000 0.00500 0.01000 0.01500 0.02000 0.02500 0.03000 0.03500 0.04000
Flow (cms)
Wid
th (
met
ers)
Width (m) Estimated Width (w)
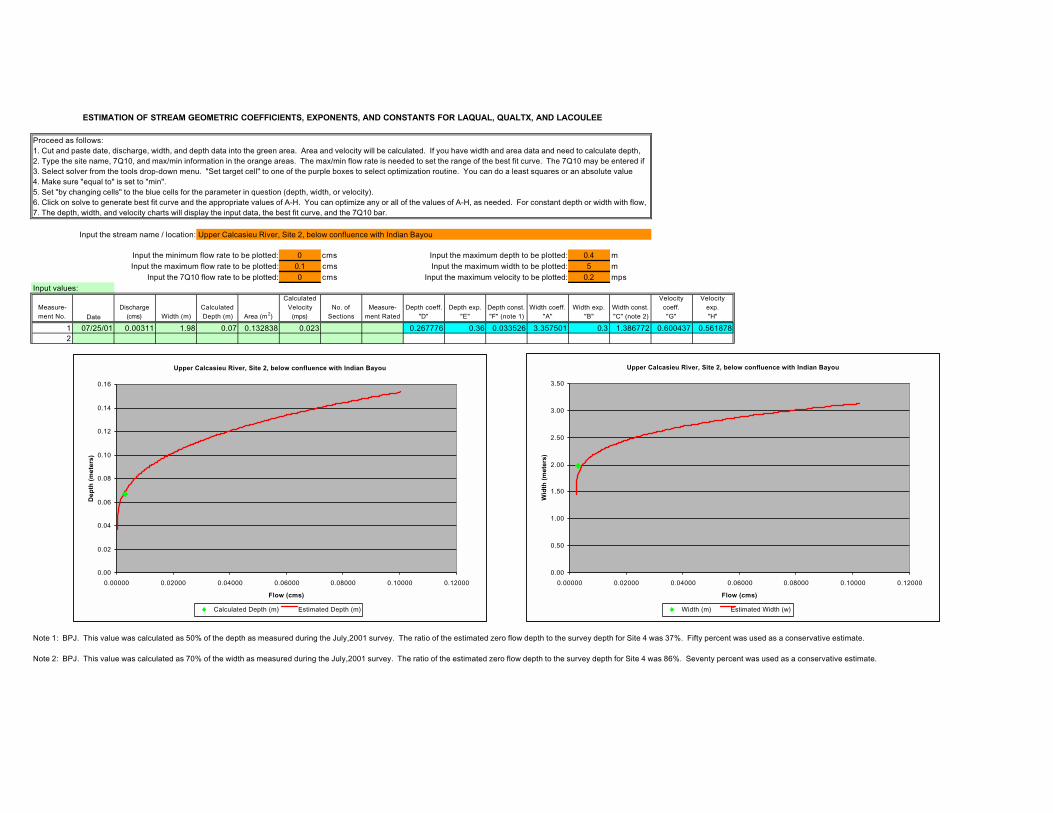
Input the stream name / location:
Input the minimum flow rate to be plotted: 0 cms Input the maximum depth to be plotted: 0.4 mInput the maximum flow rate to be plotted: 0.1 cms Input the maximum width to be plotted: 5 m
Input the 7Q10 flow rate to be plotted: 0 cms Input the maximum velocity to be plotted: 0.2 mpsInput values:
Measure-ment No. Date
Discharge (cms) Width (m)
Calculated Depth (m) Area (m2)
Calculated Velocity
(mps)No. of
SectionsMeasure-
ment RatedDepth coeff.
"D"Depth exp.
"E"Depth const. "F" (note 1)
Width coeff. "A"
Width exp. "B"
Width const. "C" (note 2)
Velocity coeff. "G"
Velocity exp. "H"
1 07/25/01 0.00311 1.98 0.07 0.132838 0.023 0.267776 0.36 0.033526 3.357501 0.3 1.386772 0.600437 0.5618782
Note 1: BPJ. This value was calculated as 50% of the depth as measured during the July,2001 survey. The ratio of the estimated zero flow depth to the survey depth for Site 4 was 37%. Fifty percent was used as a conservative estimate.
Note 2: BPJ. This value was calculated as 70% of the width as measured during the July,2001 survey. The ratio of the estimated zero flow depth to the survey depth for Site 4 was 86%. Seventy percent was used as a conservative estimate.
7. The depth, width, and velocity charts will display the input data, the best fit curve, and the 7Q10 bar.
Upper Calcasieu River, Site 2, below confluence with Indian Bayou
3. Select solver from the tools drop-down menu. "Set target cell" to one of the purple boxes to select optimization routine. You can do a least squares or an absolute value 4. Make sure "equal to" is set to "min".5. Set "by changing cells" to the blue cells for the parameter in question (depth, width, or velocity).6. Click on solve to generate best fit curve and the appropriate values of A-H. You can optimize any or all of the values of A-H, as needed. For constant depth or width with flow,
ESTIMATION OF STREAM GEOMETRIC COEFFICIENTS, EXPONENTS, AND CONSTANTS FOR LAQUAL, QUALTX, AND LACOULEE
Proceed as follows:1. Cut and paste date, discharge, width, and depth data into the green area. Area and velocity will be calculated. If you have width and area data and need to calculate depth, 2. Type the site name, 7Q10, and max/min information in the orange areas. The max/min flow rate is needed to set the range of the best fit curve. The 7Q10 may be entered if
Upper Calcasieu River, Site 2, below confluence with Indian Bayou
0.00
0.02
0.04
0.06
0.08
0.10
0.12
0.14
0.16
0.00000 0.02000 0.04000 0.06000 0.08000 0.10000 0.12000
Flow (cms)
Dep
th (
met
ers)
Calculated Depth (m) Estimated Depth (m)
Upper Calcasieu River, Site 2, below confluence with Indian Bayou
0.00
0.50
1.00
1.50
2.00
2.50
3.00
3.50
0.00000 0.02000 0.04000 0.06000 0.08000 0.10000 0.12000
Flow (cms)
Wid
th (
met
ers)
Width (m) Estimated Width (w)
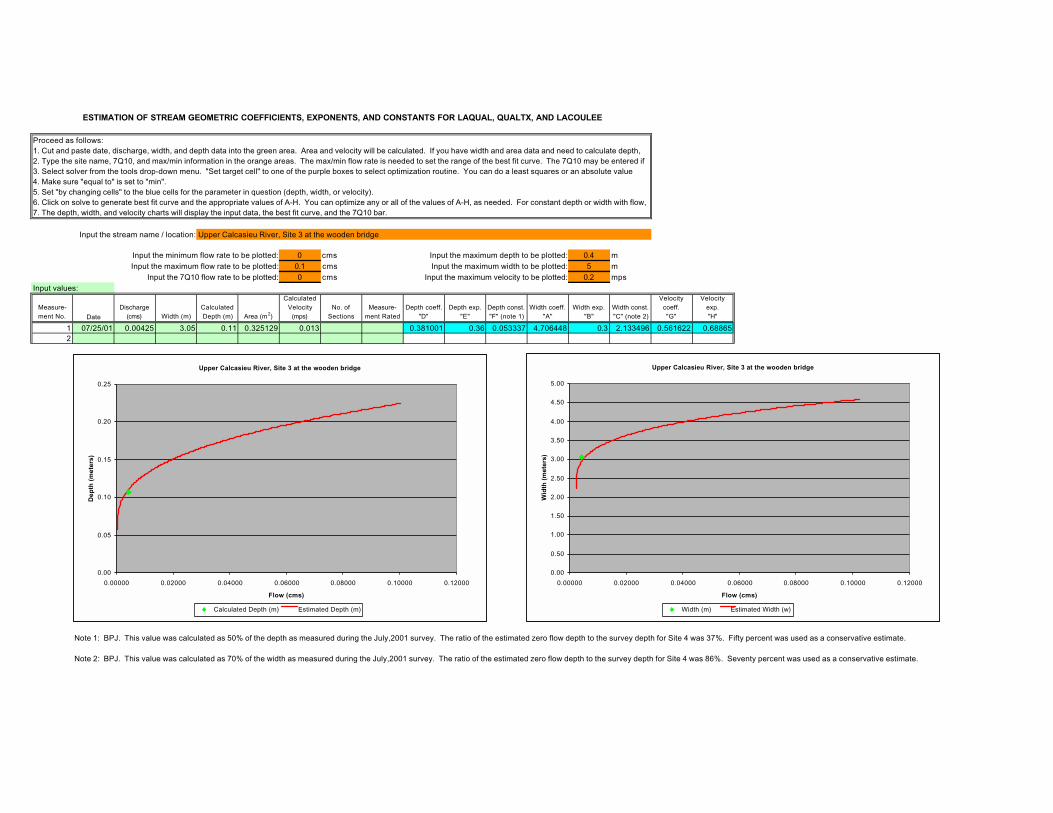
Input the stream name / location:
Input the minimum flow rate to be plotted: 0 cms Input the maximum depth to be plotted: 0.4 mInput the maximum flow rate to be plotted: 0.1 cms Input the maximum width to be plotted: 5 m
Input the 7Q10 flow rate to be plotted: 0 cms Input the maximum velocity to be plotted: 0.2 mpsInput values:
Measure-ment No. Date
Discharge (cms) Width (m)
Calculated Depth (m) Area (m2)
Calculated Velocity
(mps)No. of
SectionsMeasure-
ment RatedDepth coeff.
"D"Depth exp.
"E"Depth const. "F" (note 1)
Width coeff. "A"
Width exp. "B"
Width const. "C" (note 2)
Velocity coeff. "G"
Velocity exp. "H"
1 07/25/01 0.00425 3.05 0.11 0.325129 0.013 0.381001 0.36 0.053337 4.706448 0.3 2.133496 0.561622 0.688652
Note 1: BPJ. This value was calculated as 50% of the depth as measured during the July,2001 survey. The ratio of the estimated zero flow depth to the survey depth for Site 4 was 37%. Fifty percent was used as a conservative estimate.
Note 2: BPJ. This value was calculated as 70% of the width as measured during the July,2001 survey. The ratio of the estimated zero flow depth to the survey depth for Site 4 was 86%. Seventy percent was used as a conservative estimate.
7. The depth, width, and velocity charts will display the input data, the best fit curve, and the 7Q10 bar.
Upper Calcasieu River, Site 3 at the wooden bridge
3. Select solver from the tools drop-down menu. "Set target cell" to one of the purple boxes to select optimization routine. You can do a least squares or an absolute value 4. Make sure "equal to" is set to "min".5. Set "by changing cells" to the blue cells for the parameter in question (depth, width, or velocity).6. Click on solve to generate best fit curve and the appropriate values of A-H. You can optimize any or all of the values of A-H, as needed. For constant depth or width with flow,
ESTIMATION OF STREAM GEOMETRIC COEFFICIENTS, EXPONENTS, AND CONSTANTS FOR LAQUAL, QUALTX, AND LACOULEE
Proceed as follows:1. Cut and paste date, discharge, width, and depth data into the green area. Area and velocity will be calculated. If you have width and area data and need to calculate depth, 2. Type the site name, 7Q10, and max/min information in the orange areas. The max/min flow rate is needed to set the range of the best fit curve. The 7Q10 may be entered if
Upper Calcasieu River, Site 3 at the wooden bridge
0.00
0.05
0.10
0.15
0.20
0.25
0.00000 0.02000 0.04000 0.06000 0.08000 0.10000 0.12000
Flow (cms)
Dep
th (
met
ers)
Calculated Depth (m) Estimated Depth (m)
Upper Calcasieu River, Site 3 at the wooden bridge
0.00
0.50
1.00
1.50
2.00
2.50
3.00
3.50
4.00
4.50
5.00
0.00000 0.02000 0.04000 0.06000 0.08000 0.10000 0.12000
Flow (cms)
Wid
th (
met
ers)
Width (m) Estimated Width (w)
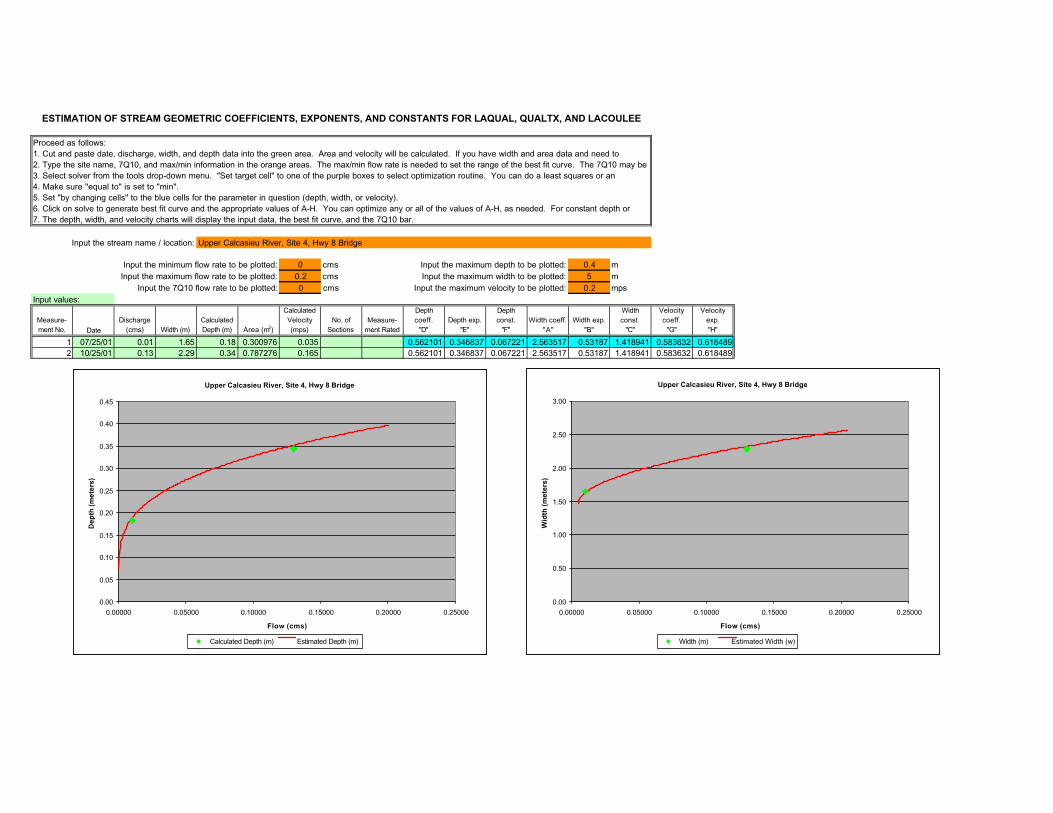
Input the stream name / location:
Input the minimum flow rate to be plotted: 0 cms Input the maximum depth to be plotted: 0.4 mInput the maximum flow rate to be plotted: 0.2 cms Input the maximum width to be plotted: 5 m
Input the 7Q10 flow rate to be plotted: 0 cms Input the maximum velocity to be plotted: 0.2 mpsInput values:
Measure-ment No. Date
Discharge (cms) Width (m)
Calculated Depth (m) Area (m2)
Calculated Velocity (mps)
No. of Sections
Measure- ment Rated
Depth coeff.
"D"Depth exp.
"E"
Depth const.
"F"Width coeff.
"A"Width exp.
"B"
Width const.
"C"
Velocity coeff.
"G"
Velocity exp. "H"
1 07/25/01 0.01 1.65 0.18 0.300976 0.035 0.562101 0.346837 0.067221 2.563517 0.53187 1.418941 0.583632 0.6184892 10/25/01 0.13 2.29 0.34 0.787276 0.165 0.562101 0.346837 0.067221 2.563517 0.53187 1.418941 0.583632 0.618489
ESTIMATION OF STREAM GEOMETRIC COEFFICIENTS, EXPONENTS, AND CONSTANTS FOR LAQUAL, QUALTX, AND LACOULEE
Proceed as follows:1. Cut and paste date, discharge, width, and depth data into the green area. Area and velocity will be calculated. If you have width and area data and need to 2. Type the site name, 7Q10, and max/min information in the orange areas. The max/min flow rate is needed to set the range of the best fit curve. The 7Q10 may be
7. The depth, width, and velocity charts will display the input data, the best fit curve, and the 7Q10 bar.
Upper Calcasieu River, Site 4, Hwy 8 Bridge
3. Select solver from the tools drop-down menu. "Set target cell" to one of the purple boxes to select optimization routine. You can do a least squares or an 4. Make sure "equal to" is set to "min".5. Set "by changing cells" to the blue cells for the parameter in question (depth, width, or velocity).6. Click on solve to generate best fit curve and the appropriate values of A-H. You can optimize any or all of the values of A-H, as needed. For constant depth or
Upper Calcasieu River, Site 4, Hwy 8 Bridge
0.00
0.05
0.10
0.15
0.20
0.25
0.30
0.35
0.40
0.45
0.00000 0.05000 0.10000 0.15000 0.20000 0.25000
Flow (cms)
Dep
th (
met
ers)
Calculated Depth (m) Estimated Depth (m)
Upper Calcasieu River, Site 4, Hwy 8 Bridge
0.00
0.50
1.00
1.50
2.00
2.50
3.00
0.00000 0.05000 0.10000 0.15000 0.20000 0.25000
Flow (cms)
Wid
th (
met
ers)
Width (m) Estimated Width (w)
Upper Calcasieu River Watershed TMDL for Dissolved Oxygen Subsegment 080808 Originated: January 9, 2002
40
Appendix C3
Survey Data Measurements and Analysis Results
SURVEY FIELD NOTES
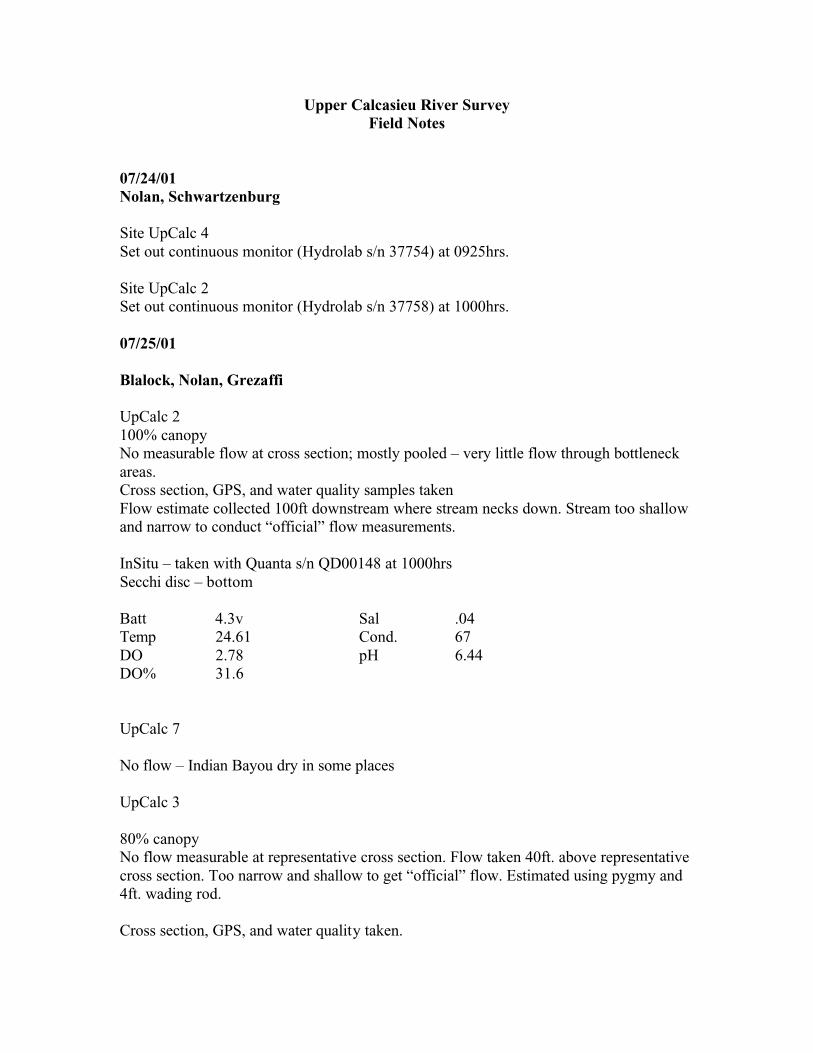
Upper Calcasieu River Survey Field Notes
07/24/01 Nolan, Schwartzenburg Site UpCalc 4
Set out continuous monitor (Hydrolab s/n 37754) at 0925hrs.
Site UpCalc 2
Set out continuous monitor (Hydrolab s/n 37758) at 1000hrs.
07/25/01 Blalock, Nolan, Grezaffi UpCalc 2
100% canopy
No measurable flow at cross section; mostly pooled – very little flow through bottleneck
areas.
Cross section, GPS, and water quality samples taken
Flow estimate collected 100ft downstream where stream necks down. Stream too shallow
and narrow to conduct “official” flow measurements.
InSitu – taken with Quanta s/n QD00148 at 1000hrs
Secchi disc – bottom
Batt 4.3v Sal .04
Temp 24.61 Cond. 67
DO 2.78 pH 6.44
DO% 31.6
UpCalc 7
No flow – Indian Bayou dry in some places
UpCalc 3
80% canopy
No flow measurable at representative cross section. Flow taken 40ft. above representative
cross section. Too narrow and shallow to get “official” flow. Estimated using pygmy and
4ft. wading rod.
Cross section, GPS, and water quality taken.
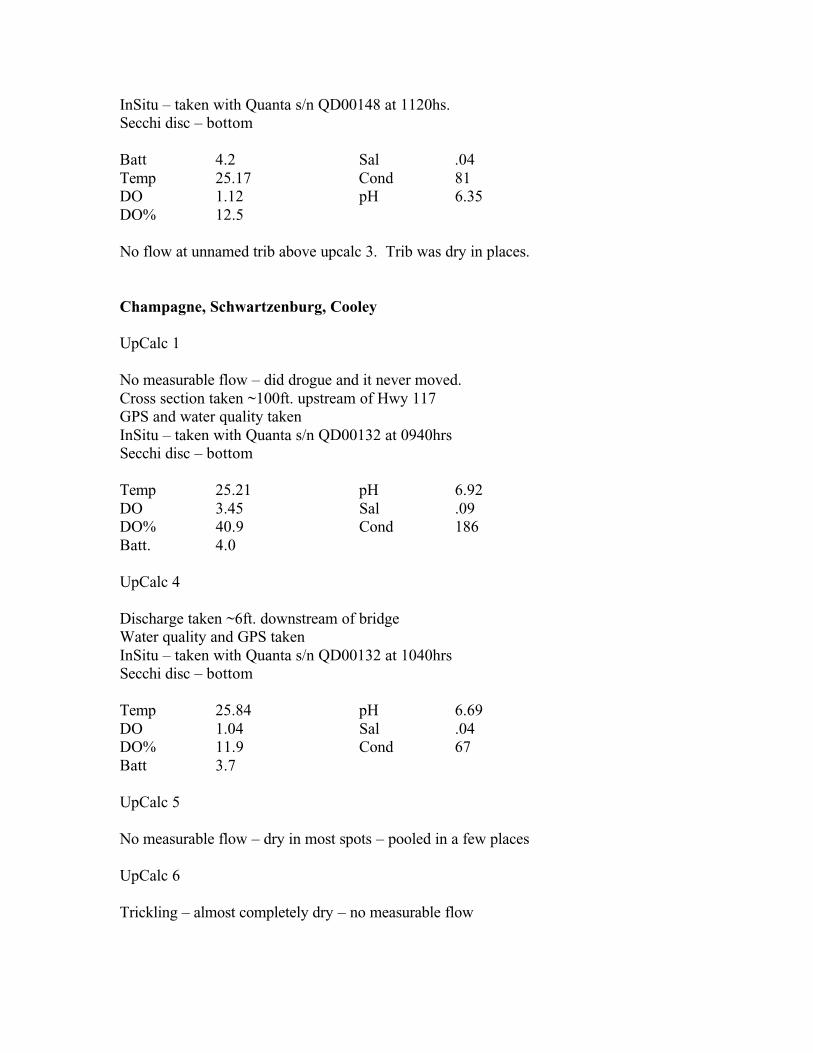
InSitu – taken with Quanta s/n QD00148 at 1120hs.
Secchi disc – bottom
Batt 4.2 Sal .04
Temp 25.17 Cond 81
DO 1.12 pH 6.35
DO% 12.5
No flow at unnamed trib above upcalc 3. Trib was dry in places.
Champagne, Schwartzenburg, Cooley UpCalc 1
No measurable flow – did drogue and it never moved.
Cross section taken ~100ft. upstream of Hwy 117
GPS and water quality taken
InSitu – taken with Quanta s/n QD00132 at 0940hrs
Secchi disc – bottom
Temp 25.21 pH 6.92
DO 3.45 Sal .09
DO% 40.9 Cond 186
Batt. 4.0
UpCalc 4
Discharge taken ~6ft. downstream of bridge
Water quality and GPS taken
InSitu – taken with Quanta s/n QD00132 at 1040hrs
Secchi disc – bottom
Temp 25.84 pH 6.69
DO 1.04 Sal .04
DO% 11.9 Cond 67
Batt 3.7
UpCalc 5
No measurable flow – dry in most spots – pooled in a few places
UpCalc 6
Trickling – almost completely dry – no measurable flow
Upper Calcasieu River Watershed TMDL for Dissolved Oxygen Subsegment 080808 Originated: January 9, 2002
41
Appendix C4
Survey Data Measurements and Analysis Results
Continuous monitor graphs
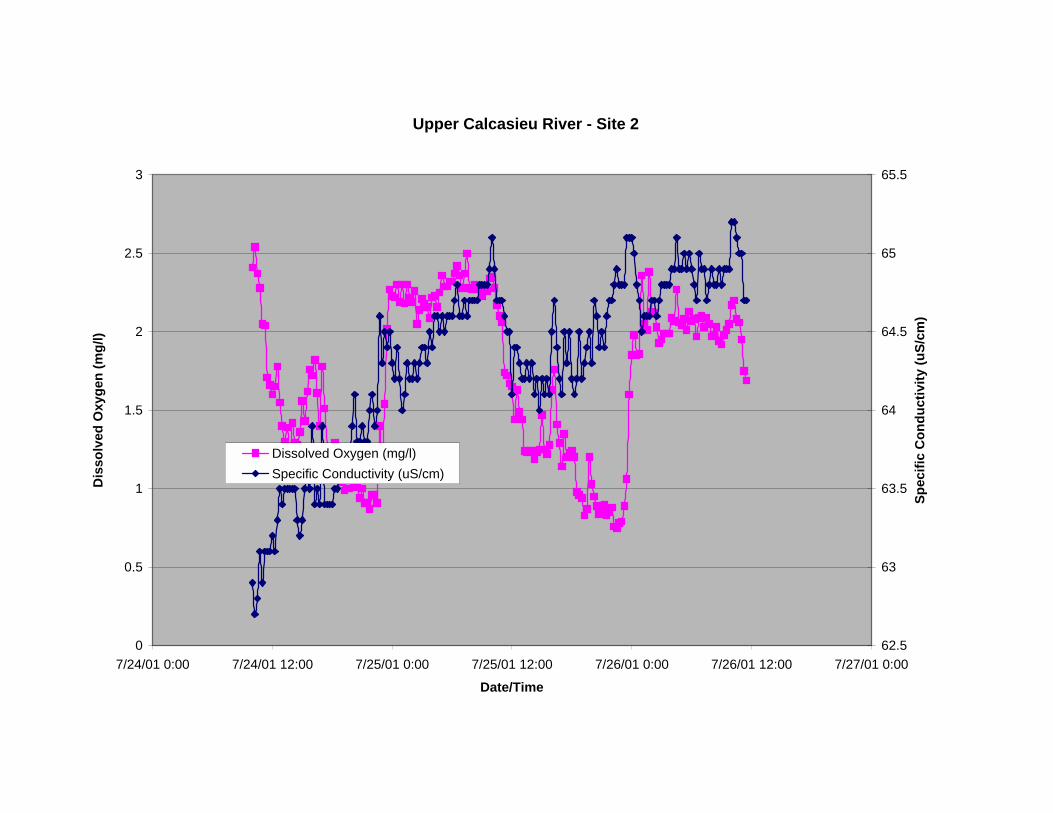
Upper Calcasieu River - Site 2
0
0.5
1
1.5
2
2.5
3
7/24/01 0:00 7/24/01 12:00 7/25/01 0:00 7/25/01 12:00 7/26/01 0:00 7/26/01 12:00 7/27/01 0:00
Date/Time
Dis
solv
ed O
xyge
n (m
g/l)
62.5
63
63.5
64
64.5
65
65.5
Spec
ific
Con
duct
ivity
(uS/
cm)
Dissolved Oxygen (mg/l)Specific Conductivity (uS/cm)
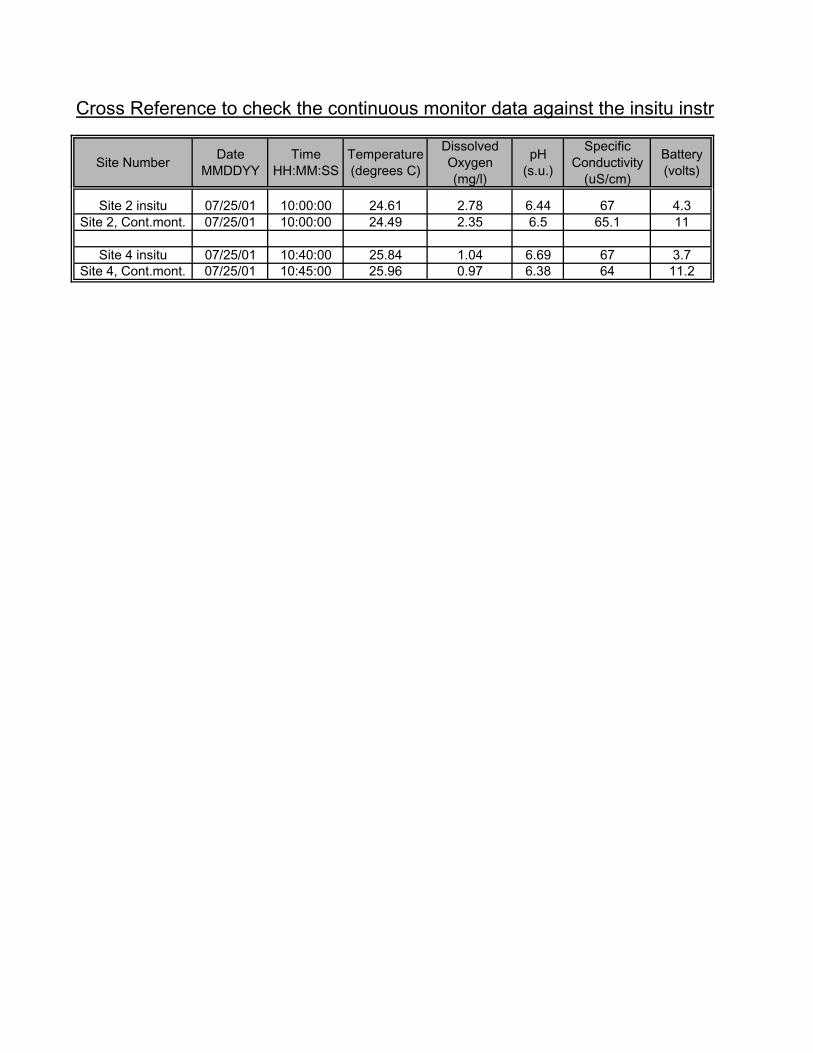
Cross Reference to check the continuous monitor data against the insitu instr
Site NumberDate
MMDDYYTime
HH:MM:SSTemperature (degrees C)
Dissolved Oxygen (mg/l)
pH (s.u.)
Specific Conductivity
(uS/cm)
Battery (volts)
Site 2 insitu 07/25/01 10:00:00 24.61 2.78 6.44 67 4.3Site 2, Cont.mont. 07/25/01 10:00:00 24.49 2.35 6.5 65.1 11
Site 4 insitu 07/25/01 10:40:00 25.84 1.04 6.69 67 3.7Site 4, Cont.mont. 07/25/01 10:45:00 25.96 0.97 6.38 64 11.2

rument.
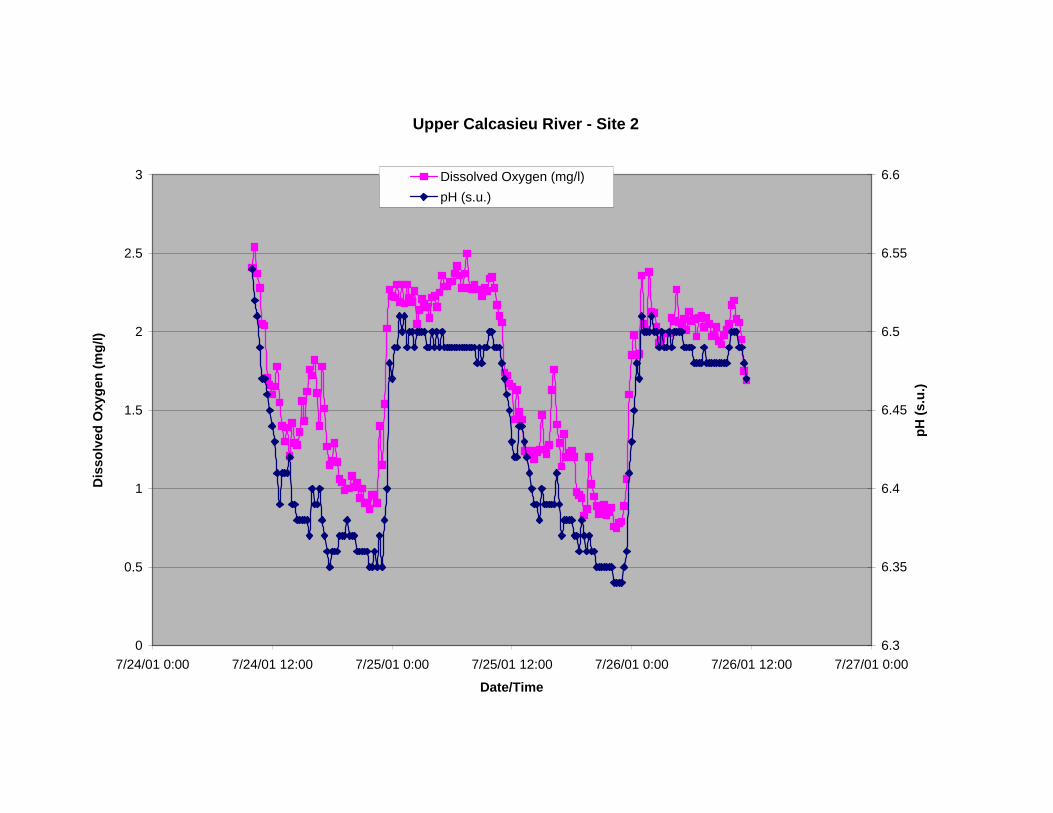
Upper Calcasieu River - Site 2
0
0.5
1
1.5
2
2.5
3
7/24/01 0:00 7/24/01 12:00 7/25/01 0:00 7/25/01 12:00 7/26/01 0:00 7/26/01 12:00 7/27/01 0:00
Date/Time
Dis
solv
ed O
xyge
n (m
g/l)
6.3
6.35
6.4
6.45
6.5
6.55
6.6
pH (s
.u.)
Dissolved Oxygen (mg/l)pH (s.u.)
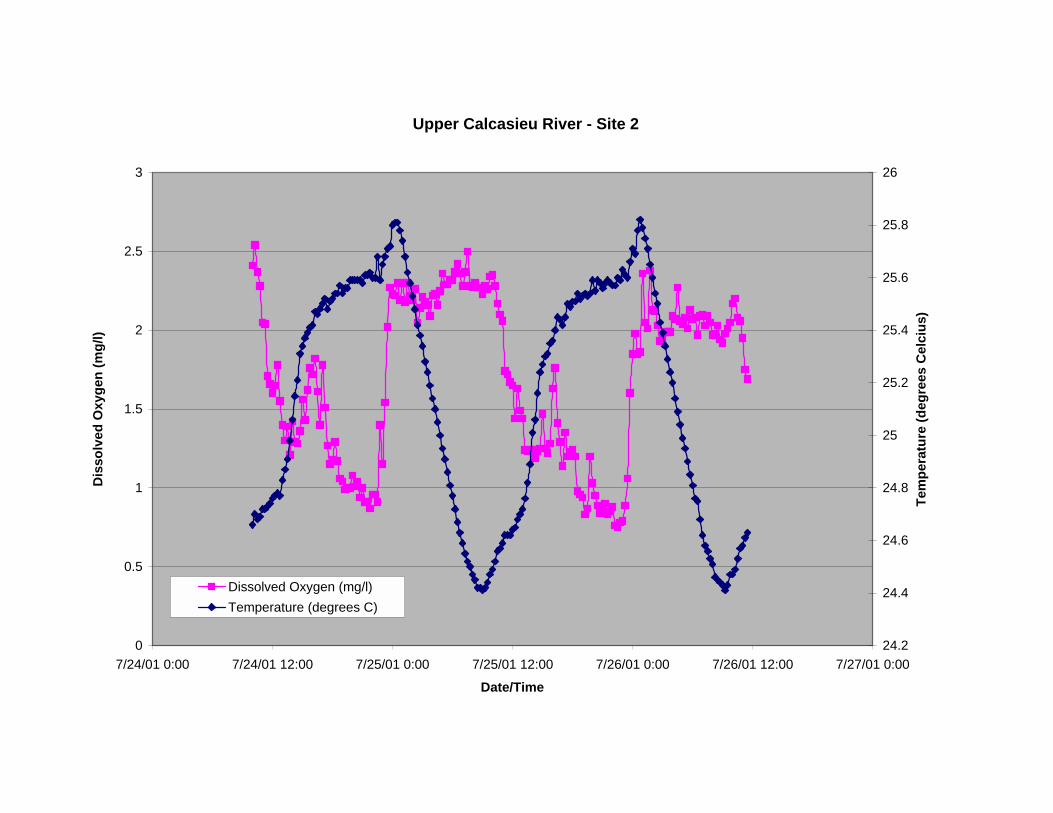
Upper Calcasieu River - Site 2
0
0.5
1
1.5
2
2.5
3
7/24/01 0:00 7/24/01 12:00 7/25/01 0:00 7/25/01 12:00 7/26/01 0:00 7/26/01 12:00 7/27/01 0:00
Date/Time
Dis
solv
ed O
xyge
n (m
g/l)
24.2
24.4
24.6
24.8
25
25.2
25.4
25.6
25.8
26
Tem
pera
ture
(deg
rees
Cel
cius
)
Dissolved Oxygen (mg/l)Temperature (degrees C)
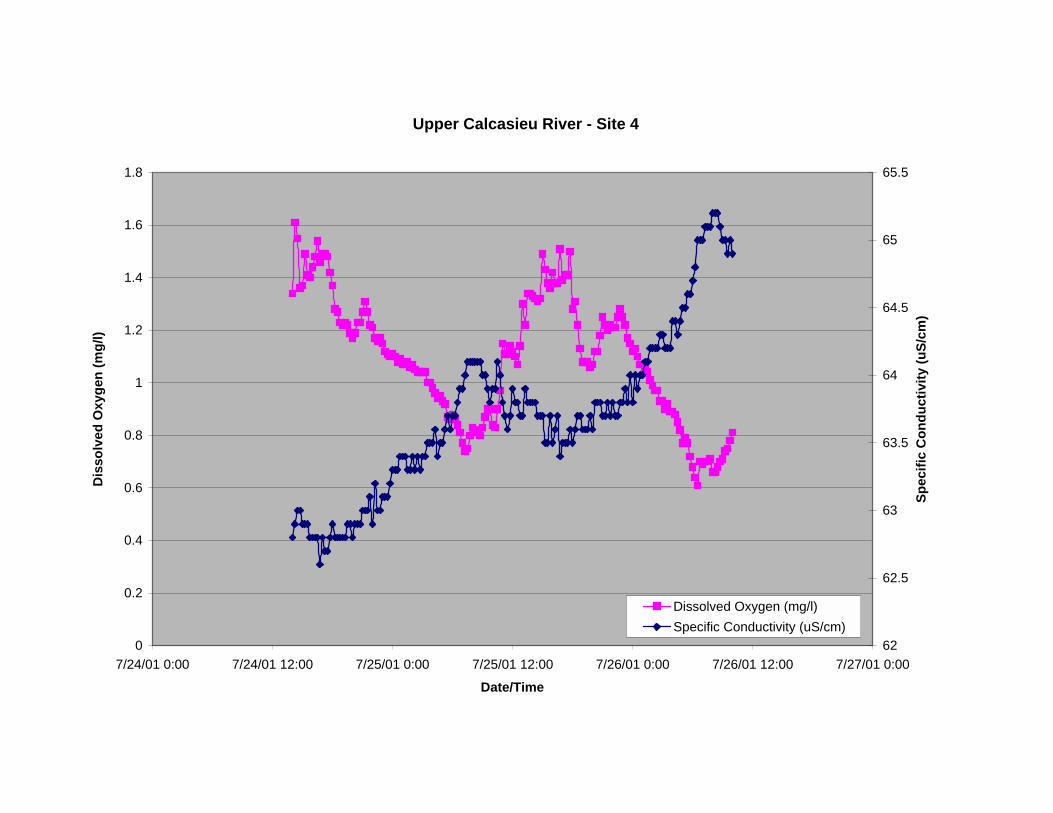
Upper Calcasieu River - Site 4
0
0.2
0.4
0.6
0.8
1
1.2
1.4
1.6
1.8
7/24/01 0:00 7/24/01 12:00 7/25/01 0:00 7/25/01 12:00 7/26/01 0:00 7/26/01 12:00 7/27/01 0:00
Date/Time
Dis
solv
ed O
xyge
n (m
g/l)
62
62.5
63
63.5
64
64.5
65
65.5
Spec
ific
Con
duct
ivity
(uS/
cm)
Dissolved Oxygen (mg/l)Specific Conductivity (uS/cm)
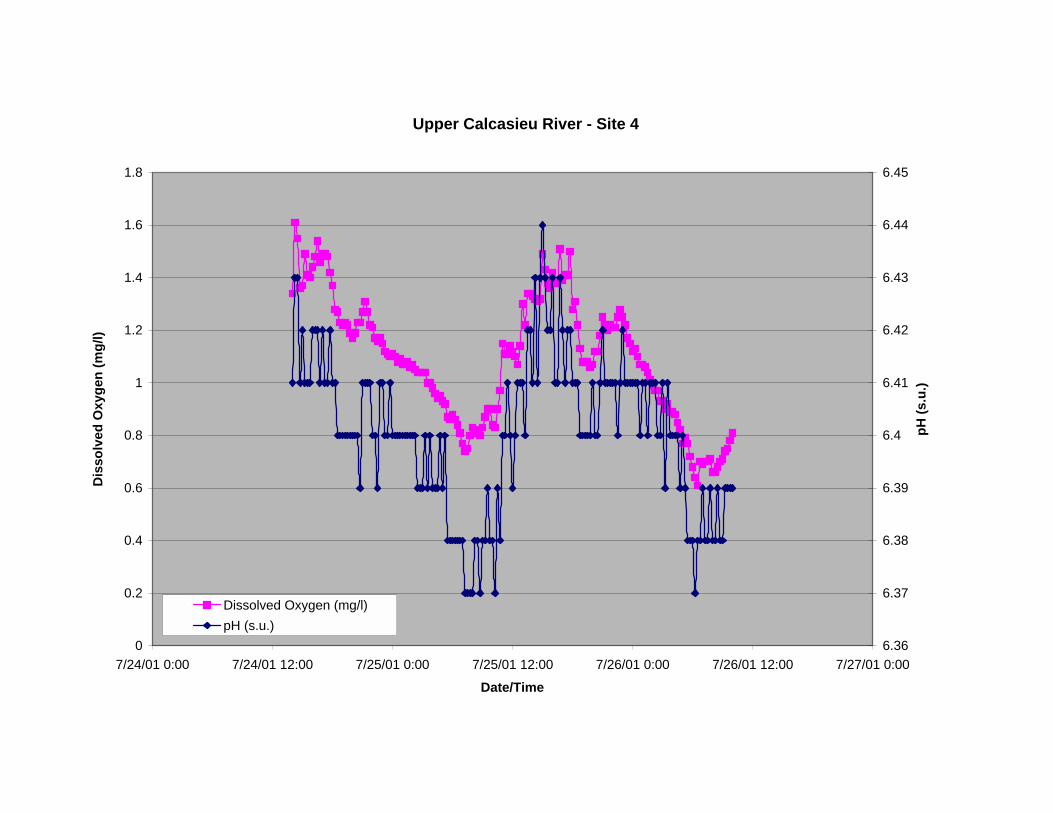
Upper Calcasieu River - Site 4
0
0.2
0.4
0.6
0.8
1
1.2
1.4
1.6
1.8
7/24/01 0:00 7/24/01 12:00 7/25/01 0:00 7/25/01 12:00 7/26/01 0:00 7/26/01 12:00 7/27/01 0:00
Date/Time
Dis
solv
ed O
xyge
n (m
g/l)
6.36
6.37
6.38
6.39
6.4
6.41
6.42
6.43
6.44
6.45
pH (s
.u.)
Dissolved Oxygen (mg/l)pH (s.u.)
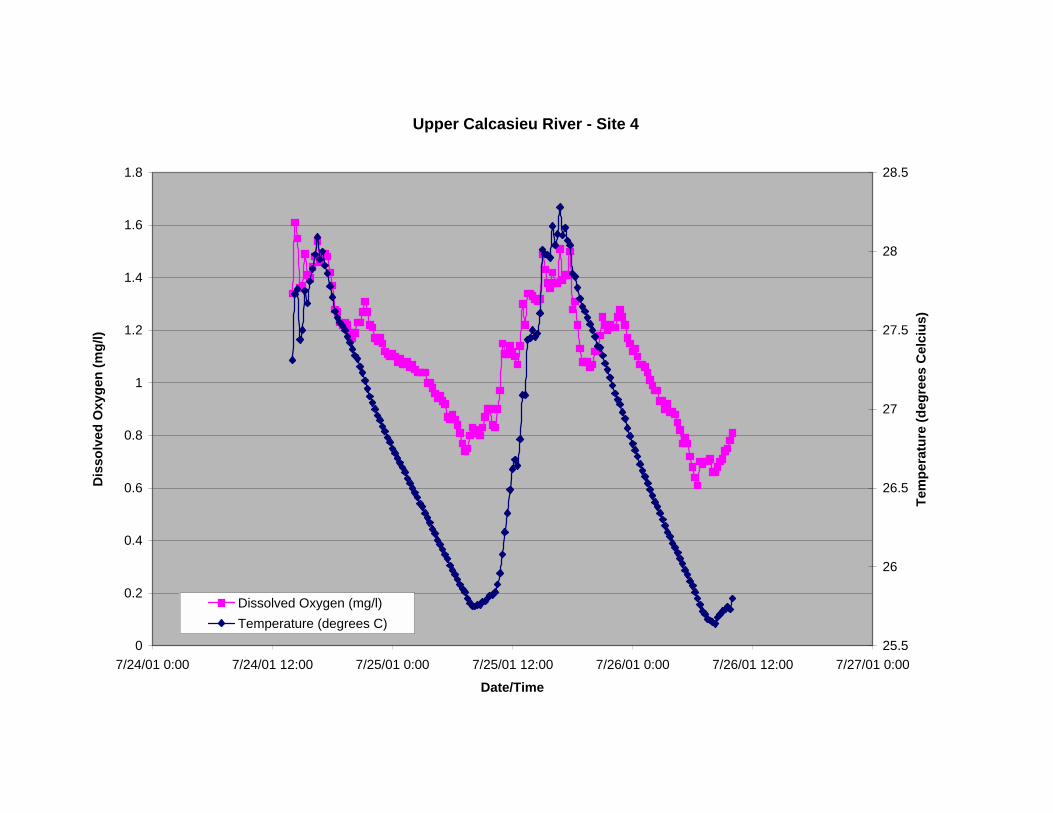
Upper Calcasieu River - Site 4
0
0.2
0.4
0.6
0.8
1
1.2
1.4
1.6
1.8
7/24/01 0:00 7/24/01 12:00 7/25/01 0:00 7/25/01 12:00 7/26/01 0:00 7/26/01 12:00 7/27/01 0:00
Date/Time
Dis
solv
ed O
xyge
n (m
g/l)
25.5
26
26.5
27
27.5
28
28.5
Tem
pera
ture
(deg
rees
Cel
cius
)
Dissolved Oxygen (mg/l)Temperature (degrees C)

Upper Calcasieu River Watershed TMDL for Dissolved Oxygen Subsegment 080808 Originated: January 9, 2002
42
Appendix C5
Historical and Ambient Data
BOD calculation worksheets
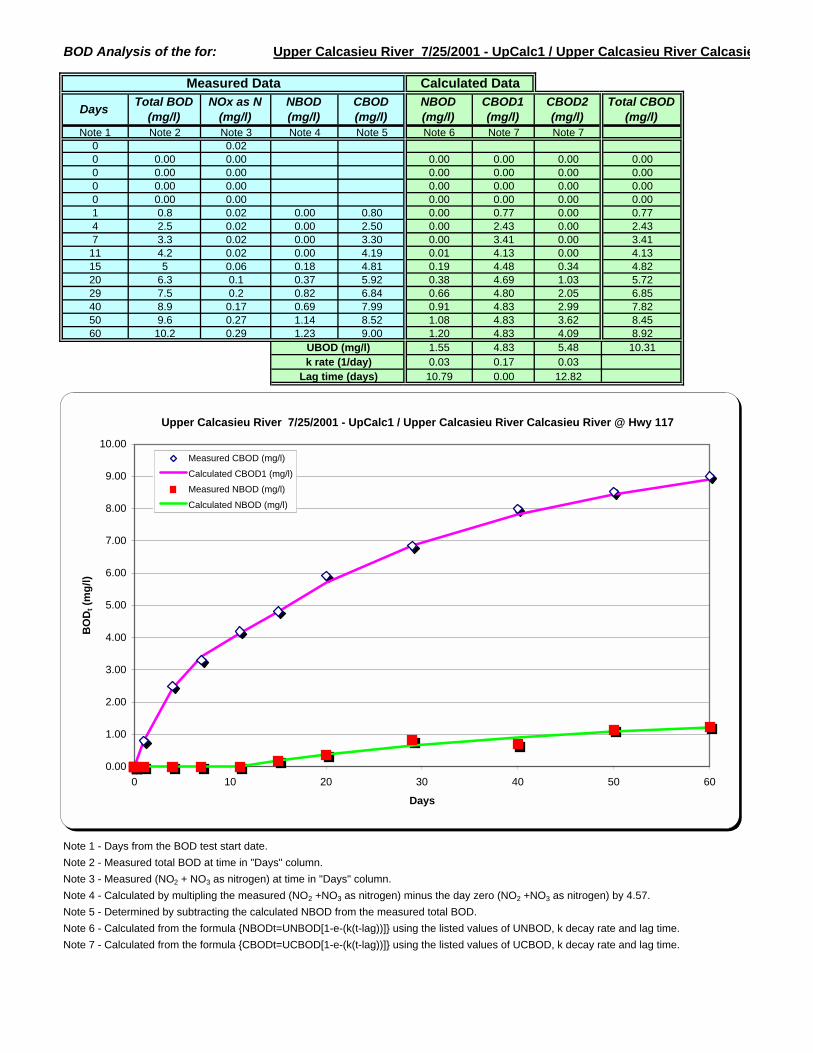
BOD Analysis of the for: Upper Calcasieu River 7/25/2001 - UpCalc1 / Upper Calcasieu River Calcasie
Measured Data Calculated Data
Days Total BOD (mg/l)
NOx as N (mg/l)
NBOD (mg/l)
CBOD (mg/l)
NBOD (mg/l)
CBOD1 (mg/l)
CBOD2 (mg/l)
Total CBOD (mg/l)
Note 1 Note 2 Note 3 Note 4 Note 5 Note 6 Note 7 Note 70 0.020 0.00 0.00 0.00 0.00 0.00 0.000 0.00 0.00 0.00 0.00 0.00 0.000 0.00 0.00 0.00 0.00 0.00 0.000 0.00 0.00 0.00 0.00 0.00 0.001 0.8 0.02 0.00 0.80 0.00 0.77 0.00 0.774 2.5 0.02 0.00 2.50 0.00 2.43 0.00 2.437 3.3 0.02 0.00 3.30 0.00 3.41 0.00 3.41
11 4.2 0.02 0.00 4.19 0.01 4.13 0.00 4.1315 5 0.06 0.18 4.81 0.19 4.48 0.34 4.8220 6.3 0.1 0.37 5.92 0.38 4.69 1.03 5.7229 7.5 0.2 0.82 6.84 0.66 4.80 2.05 6.8540 8.9 0.17 0.69 7.99 0.91 4.83 2.99 7.8250 9.6 0.27 1.14 8.52 1.08 4.83 3.62 8.4560 10.2 0.29 1.23 9.00 1.20 4.83 4.09 8.92
UBOD (mg/l) 1.55 4.83 5.48 10.31k rate (1/day) 0.03 0.17 0.03
Lag time (days) 10.79 0.00 12.82
Note 1 - Days from the BOD test start date.Note 2 - Measured total BOD at time in "Days" column.Note 3 - Measured (NO2 + NO3 as nitrogen) at time in "Days" column.Note 4 - Calculated by multipling the measured (NO2 +NO3 as nitrogen) minus the day zero (NO2 +NO3 as nitrogen) by 4.57.Note 5 - Determined by subtracting the calculated NBOD from the measured total BOD.Note 6 - Calculated from the formula {NBODt=UNBOD[1-e-(k(t-lag))]} using the listed values of UNBOD, k decay rate and lag time.Note 7 - Calculated from the formula {CBODt=UCBOD[1-e-(k(t-lag))]} using the listed values of UCBOD, k decay rate and lag time.
Upper Calcasieu River 7/25/2001 - UpCalc1 / Upper Calcasieu River Calcasieu River @ Hwy 117
0.00
1.00
2.00
3.00
4.00
5.00
6.00
7.00
8.00
9.00
10.00
0 10 20 30 40 50 60
Days
BO
Dt (
mg/
l)
Measured CBOD (mg/l)Calculated CBOD1 (mg/l)Measured NBOD (mg/l)Calculated NBOD (mg/l)

BOD Analysis of the for: Upper Calcasieu River 7/25/2001 - UpCalc1_Dupl / Upper Calcasieu River Ca
Measured Data Calculated Data
Days Total BOD (mg/l)
NOx as N (mg/l)
NBOD (mg/l)
CBOD (mg/l)
NBOD (mg/l)
CBOD1 (mg/l)
CBOD2 (mg/l)
Total CBOD (mg/l)
Note 1 Note 2 Note 3 Note 4 Note 5 Note 6 Note 7 Note 70 0.020 0.00 0.00 0.00 0.00 0.00 0.000 0.00 0.00 0.00 0.00 0.00 0.000 0.00 0.00 0.00 0.00 0.00 0.000 0.00 0.00 0.00 0.00 0.00 0.001 0.9 0.02 0.00 0.90 0.00 0.85 0.00 0.854 2.7 0.02 0.00 2.70 0.00 2.65 0.00 2.657 3.6 0.02 0.00 3.60 0.00 3.72 0.00 3.72
11 4.6 0.02 0.00 4.60 0.00 4.51 0.00 4.5115 5.5 0.05 0.14 5.36 0.14 4.89 0.35 5.2520 6.6 0.09 0.32 6.24 0.36 5.12 1.01 6.1329 7.9 0.21 0.87 7.21 0.69 5.25 1.98 7.2340 9.3 0.19 0.78 8.33 0.97 5.27 2.86 8.1450 10 0.28 1.19 8.84 1.16 5.28 3.45 8.7360 10.5 0.31 1.33 9.21 1.29 5.28 3.88 9.16
UBOD (mg/l) 1.64 5.28 5.14 10.41k rate (1/day) 0.03 0.17 0.03
Lag time (days) 12.25 0.00 12.62
Note 1 - Days from the BOD test start date.Note 2 - Measured total BOD at time in "Days" column.Note 3 - Measured (NO2 + NO3 as nitrogen) at time in "Days" column.Note 4 - Calculated by multipling the measured (NO2 +NO3 as nitrogen) minus the day zero (NO2 +NO3 as nitrogen) by 4.57.Note 5 - Determined by subtracting the calculated NBOD from the measured total BOD.Note 6 - Calculated from the formula {NBODt=UNBOD[1-e-(k(t-lag))]} using the listed values of UNBOD, k decay rate and lag time.Note 7 - Calculated from the formula {CBODt=UCBOD[1-e-(k(t-lag))]} using the listed values of UCBOD, k decay rate and lag time.
Upper Calcasieu River 7/25/2001 - UpCalc1_Dupl / Upper Calcasieu River Calcasieu River @ Hwy117
0.00
1.00
2.00
3.00
4.00
5.00
6.00
7.00
8.00
9.00
10.00
0 10 20 30 40 50 60
Days
BO
Dt (
mg/
l)
Measured CBOD (mg/l)Calculated CBOD1 (mg/l)Measured NBOD (mg/l)Calculated NBOD (mg/l)
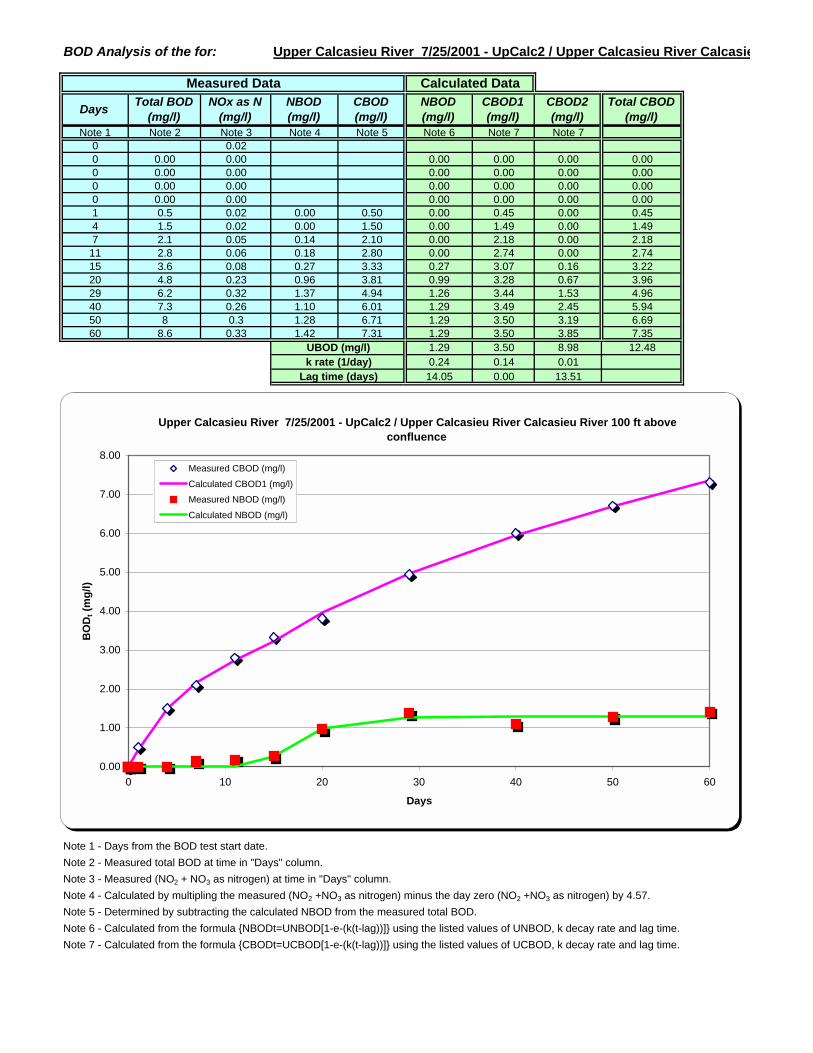
BOD Analysis of the for: Upper Calcasieu River 7/25/2001 - UpCalc2 / Upper Calcasieu River Calcasie
Measured Data Calculated Data
Days Total BOD (mg/l)
NOx as N (mg/l)
NBOD (mg/l)
CBOD (mg/l)
NBOD (mg/l)
CBOD1 (mg/l)
CBOD2 (mg/l)
Total CBOD (mg/l)
Note 1 Note 2 Note 3 Note 4 Note 5 Note 6 Note 7 Note 70 0.020 0.00 0.00 0.00 0.00 0.00 0.000 0.00 0.00 0.00 0.00 0.00 0.000 0.00 0.00 0.00 0.00 0.00 0.000 0.00 0.00 0.00 0.00 0.00 0.001 0.5 0.02 0.00 0.50 0.00 0.45 0.00 0.454 1.5 0.02 0.00 1.50 0.00 1.49 0.00 1.497 2.1 0.05 0.14 2.10 0.00 2.18 0.00 2.18
11 2.8 0.06 0.18 2.80 0.00 2.74 0.00 2.7415 3.6 0.08 0.27 3.33 0.27 3.07 0.16 3.2220 4.8 0.23 0.96 3.81 0.99 3.28 0.67 3.9629 6.2 0.32 1.37 4.94 1.26 3.44 1.53 4.9640 7.3 0.26 1.10 6.01 1.29 3.49 2.45 5.9450 8 0.3 1.28 6.71 1.29 3.50 3.19 6.6960 8.6 0.33 1.42 7.31 1.29 3.50 3.85 7.35
UBOD (mg/l) 1.29 3.50 8.98 12.48k rate (1/day) 0.24 0.14 0.01
Lag time (days) 14.05 0.00 13.51
Note 1 - Days from the BOD test start date.Note 2 - Measured total BOD at time in "Days" column.Note 3 - Measured (NO2 + NO3 as nitrogen) at time in "Days" column.Note 4 - Calculated by multipling the measured (NO2 +NO3 as nitrogen) minus the day zero (NO2 +NO3 as nitrogen) by 4.57.Note 5 - Determined by subtracting the calculated NBOD from the measured total BOD.Note 6 - Calculated from the formula {NBODt=UNBOD[1-e-(k(t-lag))]} using the listed values of UNBOD, k decay rate and lag time.Note 7 - Calculated from the formula {CBODt=UCBOD[1-e-(k(t-lag))]} using the listed values of UCBOD, k decay rate and lag time.
Upper Calcasieu River 7/25/2001 - UpCalc2 / Upper Calcasieu River Calcasieu River 100 ft aboveconfluence
0.00
1.00
2.00
3.00
4.00
5.00
6.00
7.00
8.00
0 10 20 30 40 50 60
Days
BO
Dt (
mg/
l)
Measured CBOD (mg/l)Calculated CBOD1 (mg/l)Measured NBOD (mg/l)Calculated NBOD (mg/l)
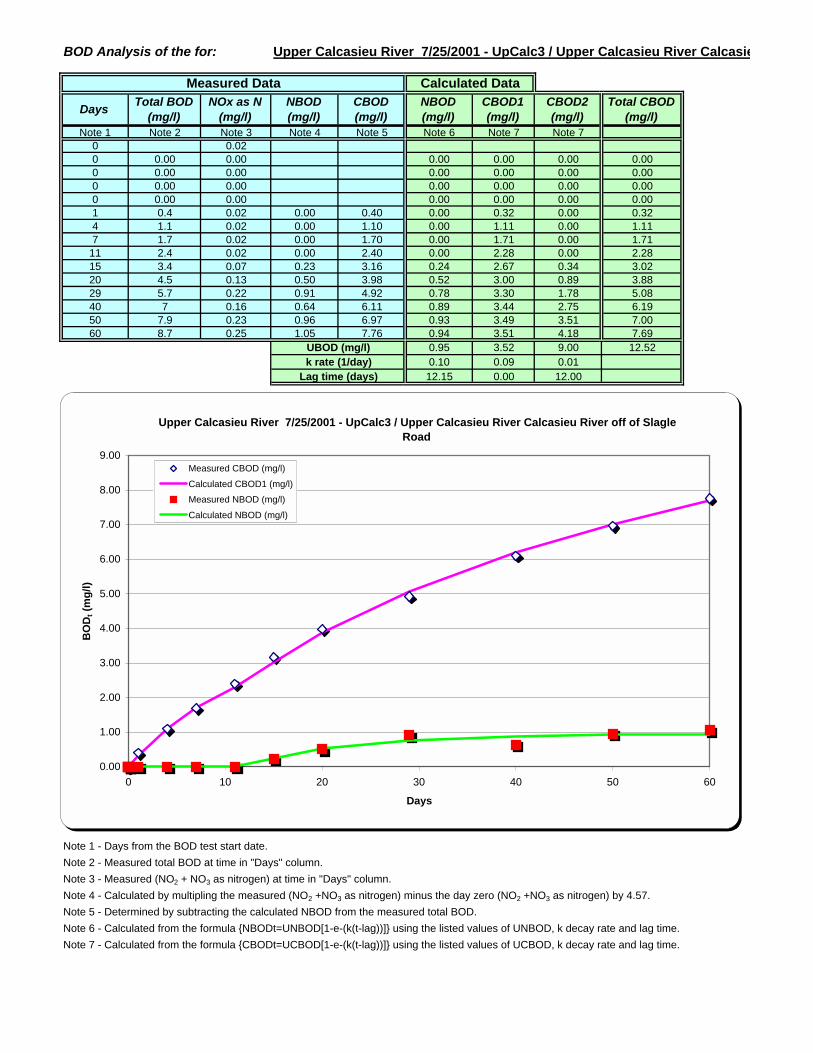
BOD Analysis of the for: Upper Calcasieu River 7/25/2001 - UpCalc3 / Upper Calcasieu River Calcasie
Measured Data Calculated Data
Days Total BOD (mg/l)
NOx as N (mg/l)
NBOD (mg/l)
CBOD (mg/l)
NBOD (mg/l)
CBOD1 (mg/l)
CBOD2 (mg/l)
Total CBOD (mg/l)
Note 1 Note 2 Note 3 Note 4 Note 5 Note 6 Note 7 Note 70 0.020 0.00 0.00 0.00 0.00 0.00 0.000 0.00 0.00 0.00 0.00 0.00 0.000 0.00 0.00 0.00 0.00 0.00 0.000 0.00 0.00 0.00 0.00 0.00 0.001 0.4 0.02 0.00 0.40 0.00 0.32 0.00 0.324 1.1 0.02 0.00 1.10 0.00 1.11 0.00 1.117 1.7 0.02 0.00 1.70 0.00 1.71 0.00 1.71
11 2.4 0.02 0.00 2.40 0.00 2.28 0.00 2.2815 3.4 0.07 0.23 3.16 0.24 2.67 0.34 3.0220 4.5 0.13 0.50 3.98 0.52 3.00 0.89 3.8829 5.7 0.22 0.91 4.92 0.78 3.30 1.78 5.0840 7 0.16 0.64 6.11 0.89 3.44 2.75 6.1950 7.9 0.23 0.96 6.97 0.93 3.49 3.51 7.0060 8.7 0.25 1.05 7.76 0.94 3.51 4.18 7.69
UBOD (mg/l) 0.95 3.52 9.00 12.52k rate (1/day) 0.10 0.09 0.01
Lag time (days) 12.15 0.00 12.00
Note 1 - Days from the BOD test start date.Note 2 - Measured total BOD at time in "Days" column.Note 3 - Measured (NO2 + NO3 as nitrogen) at time in "Days" column.Note 4 - Calculated by multipling the measured (NO2 +NO3 as nitrogen) minus the day zero (NO2 +NO3 as nitrogen) by 4.57.Note 5 - Determined by subtracting the calculated NBOD from the measured total BOD.Note 6 - Calculated from the formula {NBODt=UNBOD[1-e-(k(t-lag))]} using the listed values of UNBOD, k decay rate and lag time.Note 7 - Calculated from the formula {CBODt=UCBOD[1-e-(k(t-lag))]} using the listed values of UCBOD, k decay rate and lag time.
Upper Calcasieu River 7/25/2001 - UpCalc3 / Upper Calcasieu River Calcasieu River off of SlagleRoad
0.00
1.00
2.00
3.00
4.00
5.00
6.00
7.00
8.00
9.00
0 10 20 30 40 50 60
Days
BO
Dt (
mg/
l)
Measured CBOD (mg/l)Calculated CBOD1 (mg/l)Measured NBOD (mg/l)Calculated NBOD (mg/l)

BOD Analysis of the for: Upper Calcasieu River 7/25/2001 - UpCalc4 / Upper Calcasieu River Calcasie
Measured Data Calculated Data
Days Total BOD (mg/l)
NOx as N (mg/l)
NBOD (mg/l)
CBOD (mg/l)
NBOD (mg/l)
CBOD1 (mg/l)
CBOD2 (mg/l)
Total CBOD (mg/l)
Note 1 Note 2 Note 3 Note 4 Note 5 Note 6 Note 7 Note 70 0.020 0.00 0.00 0.00 0.00 0.00 0.000 0.00 0.00 0.00 0.00 0.00 0.000 0.00 0.00 0.00 0.00 0.00 0.000 0.00 0.00 0.00 0.00 0.00 0.001 0.5 0.02 0.00 0.50 0.00 0.54 0.00 0.544 1.9 0.05 0.14 1.90 0.00 1.82 0.00 1.827 2.6 0.02 0.00 2.60 0.00 2.69 0.00 2.69
11 3.7 0.08 0.27 3.45 0.25 3.41 0.00 3.4115 4.8 0.16 0.64 4.08 0.72 3.84 0.20 4.0420 6.0 0.26 1.10 4.99 1.01 4.13 0.83 4.9729 7.4 0.30 1.28 6.21 1.19 4.35 1.89 6.2440 8.7 0.21 0.87 7.46 1.24 4.43 3.04 7.4750 9.7 0.30 1.28 8.45 1.25 4.44 3.98 8.4260 10.5 0.34 1.46 9.25 1.25 4.45 4.82 9.27
UBOD (mg/l) 1.25 4.45 12.18 16.63k rate (1/day) 0.16 0.13 0.01
Lag time (days) 9.58 0.03 13.45
Note 1 - Days from the BOD test start date.Note 2 - Measured total BOD at time in "Days" column.Note 3 - Measured (NO2 + NO3 as nitrogen) at time in "Days" column.Note 4 - Calculated by multipling the measured (NO2 +NO3 as nitrogen) minus the day zero (NO2 +NO3 as nitrogen) by 4.57.Note 5 - Determined by subtracting the calculated NBOD from the measured total BOD.Note 6 - Calculated from the formula {NBODt=UNBOD[1-e-(k(t-lag))]} using the listed values of UNBOD, k decay rate and lag time.Note 7 - Calculated from the formula {CBODt=UCBOD[1-e-(k(t-lag))]} using the listed values of UCBOD, k decay rate and lag time.
Upper Calcasieu River 7/25/2001 - UpCalc4 / Upper Calcasieu River Calcasieu River @ Hwy 8Bridge
0.00
1.00
2.00
3.00
4.00
5.00
6.00
7.00
8.00
9.00
10.00
0 10 20 30 40 50 60
Days
BO
Dt (
mg/
l)
Measured CBOD (mg/l)Calculated CBOD1 (mg/l)Measured NBOD (mg/l)Calculated NBOD (mg/l)
Upper Calcasieu River Watershed TMDL for Dissolved Oxygen Subsegment 080808 Originated: January 9, 2002
43
Appendix D
Historical and Ambient Data

Upper Calcasieu River Watershed TMDL for Dissolved Oxygen Subsegment 080808 Originated: January 9, 2002
44
Appendix D1
Historical and Ambient Data
United States Census Records for Richland Parish
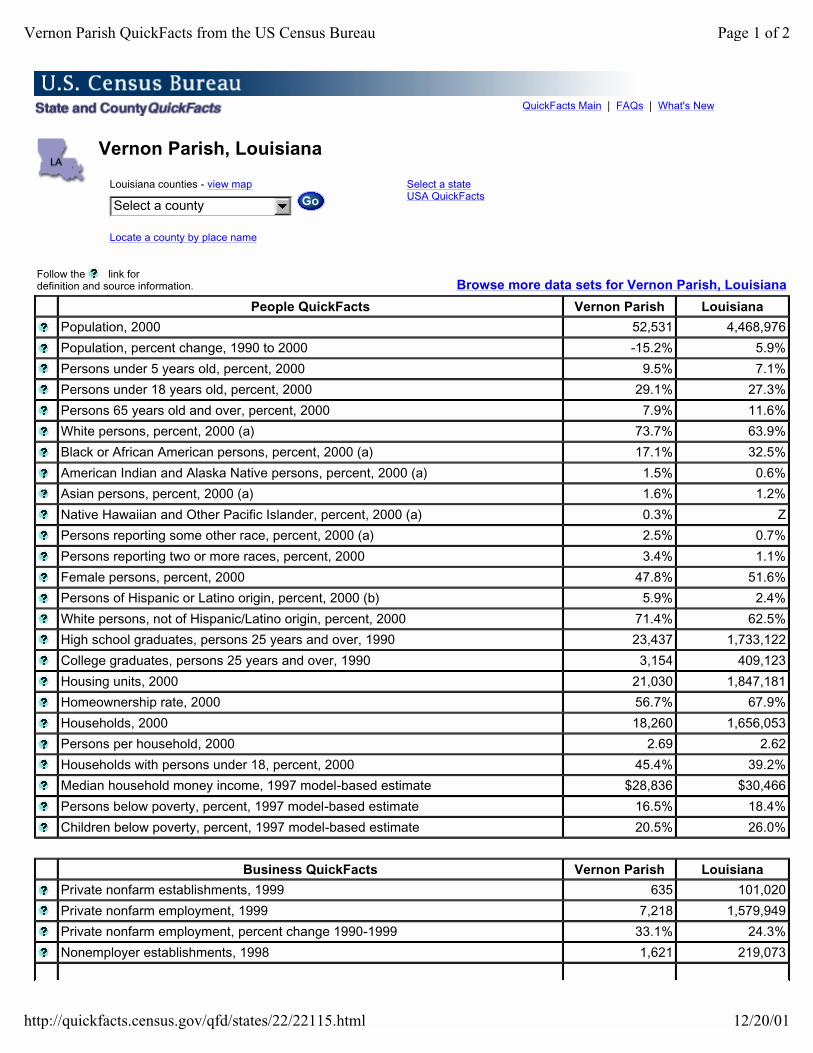
Vernon Parish, Louisiana
QuickFacts Main | FAQs | What's New
Louisiana counties - view map
Locate a county by place name
Select a county
Select a state USA QuickFacts
Follow the link for definition and source information. Browse more data sets for Vernon Parish, Louisiana
People QuickFacts Vernon Parish Louisiana
Population, 2000 52,531 4,468,976
Population, percent change, 1990 to 2000 -15.2% 5.9%
Persons under 5 years old, percent, 2000 9.5% 7.1%
Persons under 18 years old, percent, 2000 29.1% 27.3%
Persons 65 years old and over, percent, 2000 7.9% 11.6%
White persons, percent, 2000 (a) 73.7% 63.9%
Black or African American persons, percent, 2000 (a) 17.1% 32.5%
American Indian and Alaska Native persons, percent, 2000 (a) 1.5% 0.6%
Asian persons, percent, 2000 (a) 1.6% 1.2%
Native Hawaiian and Other Pacific Islander, percent, 2000 (a) 0.3% Z
Persons reporting some other race, percent, 2000 (a) 2.5% 0.7%
Persons reporting two or more races, percent, 2000 3.4% 1.1%
Female persons, percent, 2000 47.8% 51.6%
Persons of Hispanic or Latino origin, percent, 2000 (b) 5.9% 2.4%
White persons, not of Hispanic/Latino origin, percent, 2000 71.4% 62.5%
High school graduates, persons 25 years and over, 1990 23,437 1,733,122
College graduates, persons 25 years and over, 1990 3,154 409,123
Housing units, 2000 21,030 1,847,181
Homeownership rate, 2000 56.7% 67.9%
Households, 2000 18,260 1,656,053
Persons per household, 2000 2.69 2.62
Households with persons under 18, percent, 2000 45.4% 39.2%
Median household money income, 1997 model-based estimate $28,836 $30,466
Persons below poverty, percent, 1997 model-based estimate 16.5% 18.4%
Children below poverty, percent, 1997 model-based estimate 20.5% 26.0%
Business QuickFacts Vernon Parish Louisiana
Private nonfarm establishments, 1999 635 101,020
Private nonfarm employment, 1999 7,218 1,579,949
Private nonfarm employment, percent change 1990-1999 33.1% 24.3%
Nonemployer establishments, 1998 1,621 219,073
Page 1 of 2Vernon Parish QuickFacts from the US Census Bureau
12/20/01http://quickfacts.census.gov/qfd/states/22/22115.html
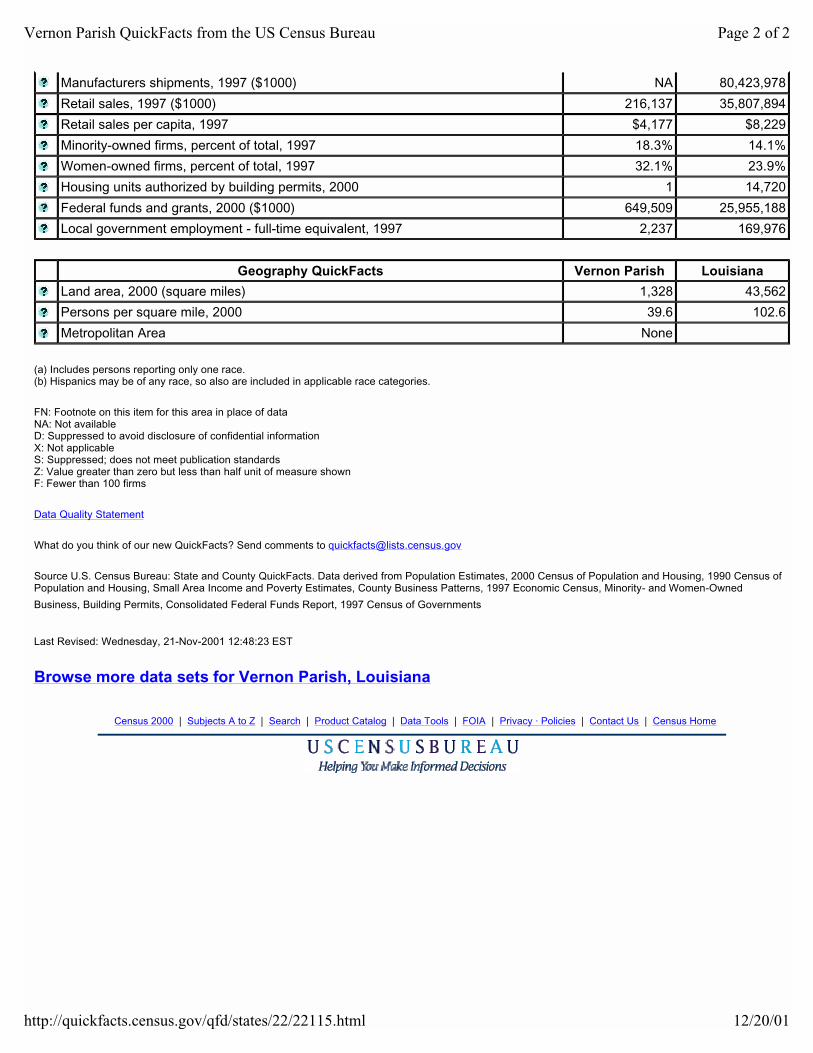
(a) Includes persons reporting only one race. (b) Hispanics may be of any race, so also are included in applicable race categories.
FN: Footnote on this item for this area in place of data NA: Not available D: Suppressed to avoid disclosure of confidential information X: Not applicable S: Suppressed; does not meet publication standards Z: Value greater than zero but less than half unit of measure shown F: Fewer than 100 firms
Data Quality Statement
What do you think of our new QuickFacts? Send comments to [email protected]
Source U.S. Census Bureau: State and County QuickFacts. Data derived from Population Estimates, 2000 Census of Population and Housing, 1990 Census of Population and Housing, Small Area Income and Poverty Estimates, County Business Patterns, 1997 Economic Census, Minority- and Women-Owned
Business, Building Permits, Consolidated Federal Funds Report, 1997 Census of Governments
Last Revised: Wednesday, 21-Nov-2001 12:48:23 EST
Browse more data sets for Vernon Parish, Louisiana
Census 2000 | Subjects A to Z | Search | Product Catalog | Data Tools | FOIA | Privacy · Policies | Contact Us | Census Home
Manufacturers shipments, 1997 ($1000) NA 80,423,978
Retail sales, 1997 ($1000) 216,137 35,807,894
Retail sales per capita, 1997 $4,177 $8,229
Minority-owned firms, percent of total, 1997 18.3% 14.1%
Women-owned firms, percent of total, 1997 32.1% 23.9%
Housing units authorized by building permits, 2000 1 14,720
Federal funds and grants, 2000 ($1000) 649,509 25,955,188
Local government employment - full-time equivalent, 1997 2,237 169,976
Geography QuickFacts Vernon Parish Louisiana
Land area, 2000 (square miles) 1,328 43,562
Persons per square mile, 2000 39.6 102.6
Metropolitan Area None
Page 2 of 2Vernon Parish QuickFacts from the US Census Bureau
12/20/01http://quickfacts.census.gov/qfd/states/22/22115.html
Upper Calcasieu River Watershed TMDL for Dissolved Oxygen Subsegment 080808 Originated: January 9, 2002
45
Appendix D2
Historical and Ambient Data
Ambient data
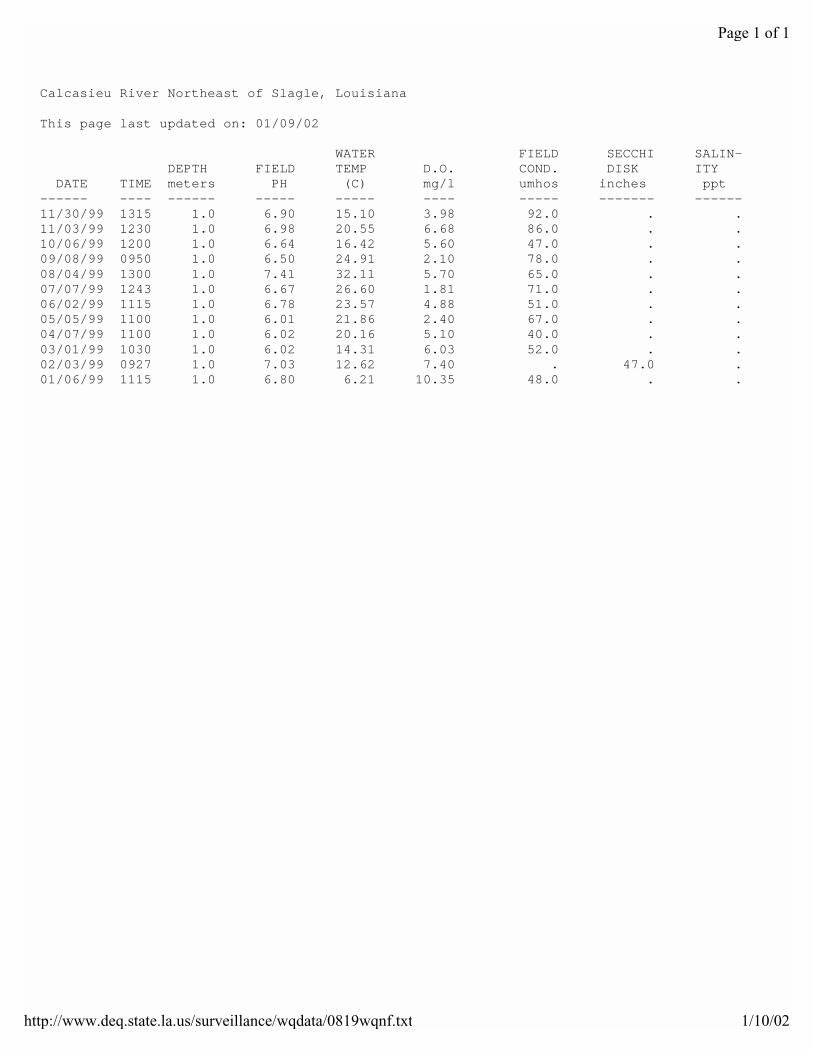
Calcasieu River Northeast of Slagle, Louisiana This page last updated on: 01/09/02 WATER FIELD SECCHI SALIN- DEPTH FIELD TEMP D.O. COND. DISK ITY DATE TIME meters PH (C) mg/l umhos inches ppt ------ ---- ------ ----- ----- ---- ----- ------- ------ 11/30/99 1315 1.0 6.90 15.10 3.98 92.0 . . 11/03/99 1230 1.0 6.98 20.55 6.68 86.0 . . 10/06/99 1200 1.0 6.64 16.42 5.60 47.0 . . 09/08/99 0950 1.0 6.50 24.91 2.10 78.0 . . 08/04/99 1300 1.0 7.41 32.11 5.70 65.0 . . 07/07/99 1243 1.0 6.67 26.60 1.81 71.0 . . 06/02/99 1115 1.0 6.78 23.57 4.88 51.0 . . 05/05/99 1100 1.0 6.01 21.86 2.40 67.0 . . 04/07/99 1100 1.0 6.02 20.16 5.10 40.0 . . 03/01/99 1030 1.0 6.02 14.31 6.03 52.0 . . 02/03/99 0927 1.0 7.03 12.62 7.40 . 47.0 . 01/06/99 1115 1.0 6.80 6.21 10.35 48.0 . .
Page 1 of 1
1/10/02http://www.deq.state.la.us/surveillance/wqdata/0819wqnf.txt
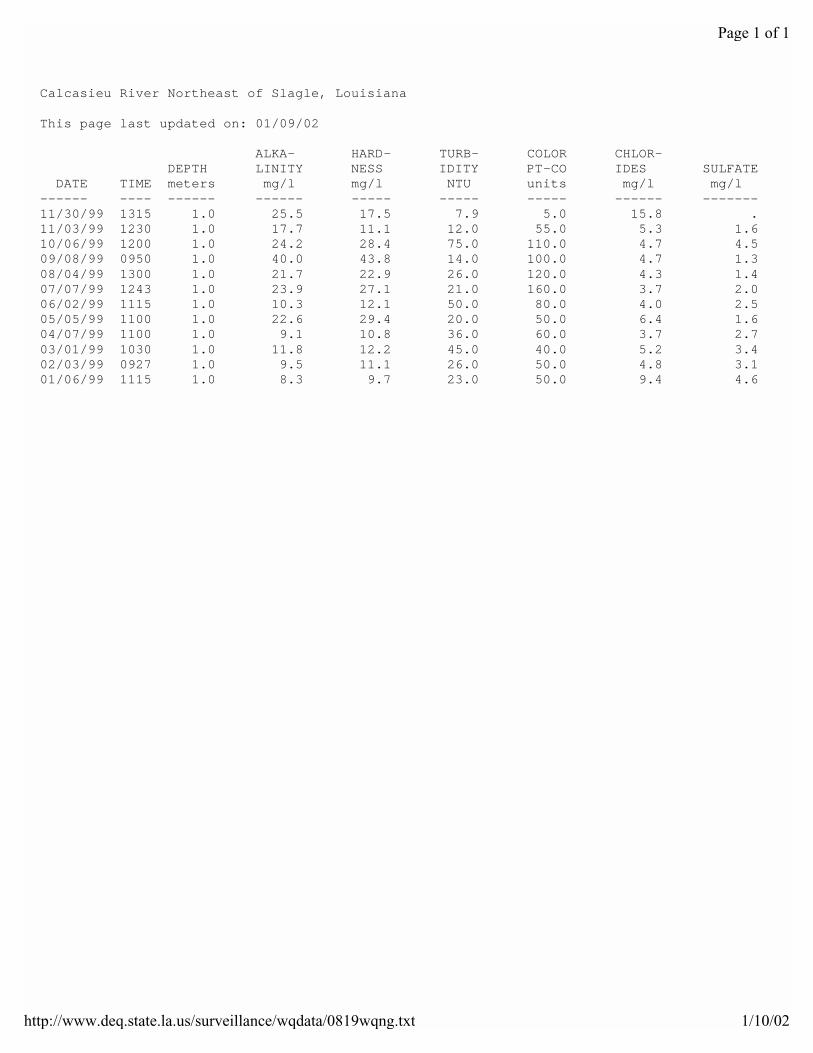
Calcasieu River Northeast of Slagle, Louisiana This page last updated on: 01/09/02 ALKA- HARD- TURB- COLOR CHLOR- DEPTH LINITY NESS IDITY PT-CO IDES SULFATE DATE TIME meters mg/l mg/l NTU units mg/l mg/l ------ ---- ------ ------ ----- ----- ----- ------ ------- 11/30/99 1315 1.0 25.5 17.5 7.9 5.0 15.8 . 11/03/99 1230 1.0 17.7 11.1 12.0 55.0 5.3 1.6 10/06/99 1200 1.0 24.2 28.4 75.0 110.0 4.7 4.5 09/08/99 0950 1.0 40.0 43.8 14.0 100.0 4.7 1.3 08/04/99 1300 1.0 21.7 22.9 26.0 120.0 4.3 1.4 07/07/99 1243 1.0 23.9 27.1 21.0 160.0 3.7 2.0 06/02/99 1115 1.0 10.3 12.1 50.0 80.0 4.0 2.5 05/05/99 1100 1.0 22.6 29.4 20.0 50.0 6.4 1.6 04/07/99 1100 1.0 9.1 10.8 36.0 60.0 3.7 2.7 03/01/99 1030 1.0 11.8 12.2 45.0 40.0 5.2 3.4 02/03/99 0927 1.0 9.5 11.1 26.0 50.0 4.8 3.1 01/06/99 1115 1.0 8.3 9.7 23.0 50.0 9.4 4.6
Page 1 of 1
1/10/02http://www.deq.state.la.us/surveillance/wqdata/0819wqng.txt
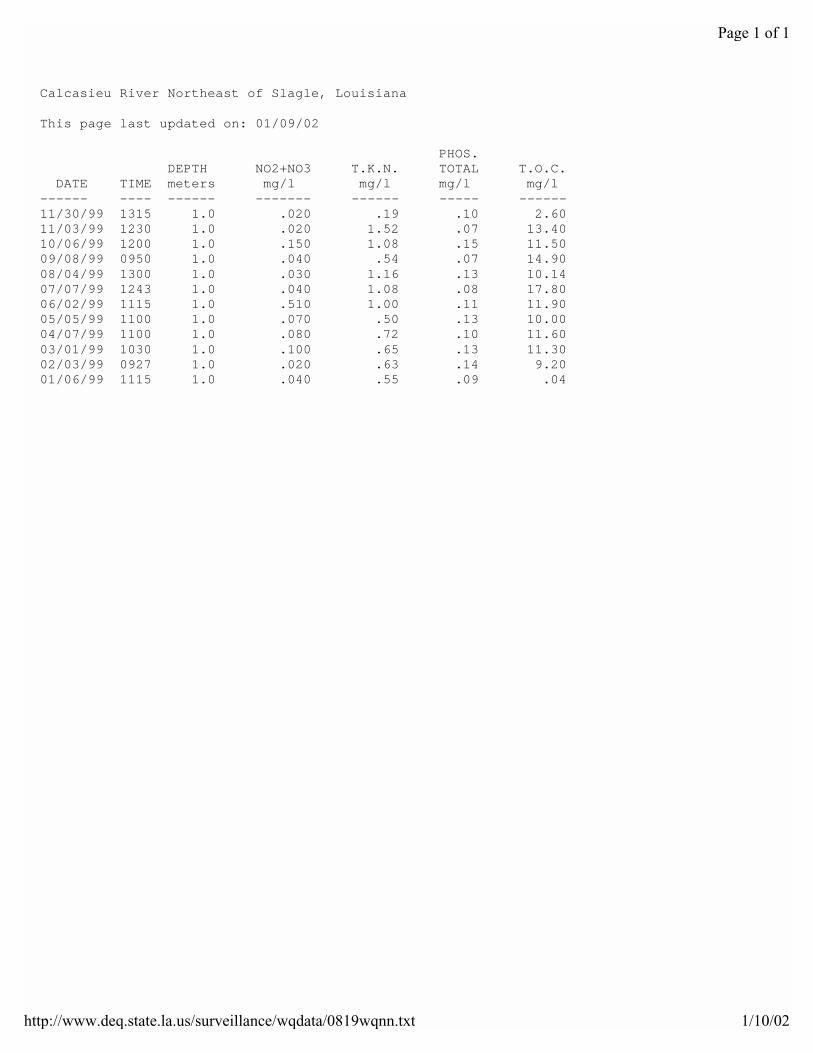
Calcasieu River Northeast of Slagle, Louisiana This page last updated on: 01/09/02 PHOS. DEPTH NO2+NO3 T.K.N. TOTAL T.O.C. DATE TIME meters mg/l mg/l mg/l mg/l ------ ---- ------ ------- ------ ----- ------ 11/30/99 1315 1.0 .020 .19 .10 2.60 11/03/99 1230 1.0 .020 1.52 .07 13.40 10/06/99 1200 1.0 .150 1.08 .15 11.50 09/08/99 0950 1.0 .040 .54 .07 14.90 08/04/99 1300 1.0 .030 1.16 .13 10.14 07/07/99 1243 1.0 .040 1.08 .08 17.80 06/02/99 1115 1.0 .510 1.00 .11 11.90 05/05/99 1100 1.0 .070 .50 .13 10.00 04/07/99 1100 1.0 .080 .72 .10 11.60 03/01/99 1030 1.0 .100 .65 .13 11.30 02/03/99 0927 1.0 .020 .63 .14 9.20 01/06/99 1115 1.0 .040 .55 .09 .04
Page 1 of 1
1/10/02http://www.deq.state.la.us/surveillance/wqdata/0819wqnn.txt
Upper Calcasieu River Watershed TMDL for Dissolved Oxygen Subsegment 080808 Originated: January 9, 2002
46
Appendix D3
Historical and Ambient Data
Subsegment 030101 landuse data
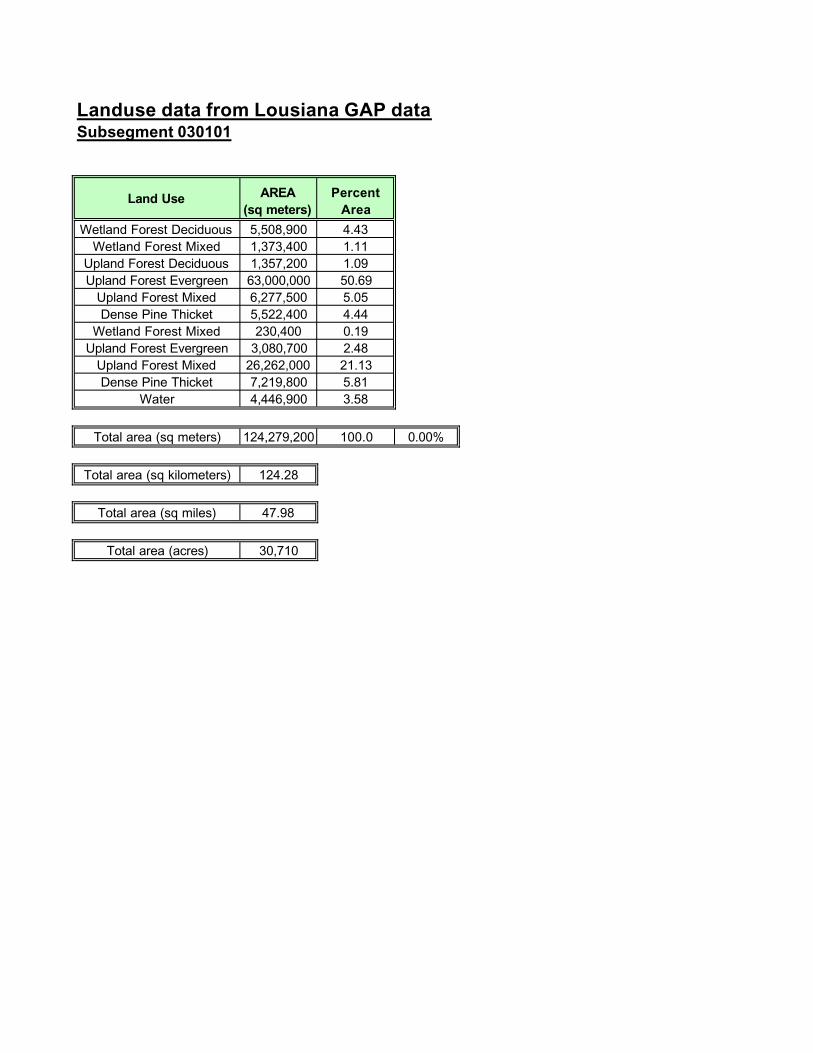
Landuse data from Lousiana GAP dataSubsegment 030101
Land Use AREA (sq meters)
Percent Area
Wetland Forest Deciduous 5,508,900 4.43Wetland Forest Mixed 1,373,400 1.11
Upland Forest Deciduous 1,357,200 1.09Upland Forest Evergreen 63,000,000 50.69
Upland Forest Mixed 6,277,500 5.05Dense Pine Thicket 5,522,400 4.44
Wetland Forest Mixed 230,400 0.19Upland Forest Evergreen 3,080,700 2.48
Upland Forest Mixed 26,262,000 21.13Dense Pine Thicket 7,219,800 5.81
Water 4,446,900 3.58
Total area (sq meters) 124,279,200 100.0 0.00%
Total area (sq kilometers) 124.28
Total area (sq miles) 47.98
Total area (acres) 30,710
Upper Calcasieu River Watershed TMDL for Dissolved Oxygen Subsegment 080808 Originated: January 9, 2002
47
Appendix E
Recommended TMDL
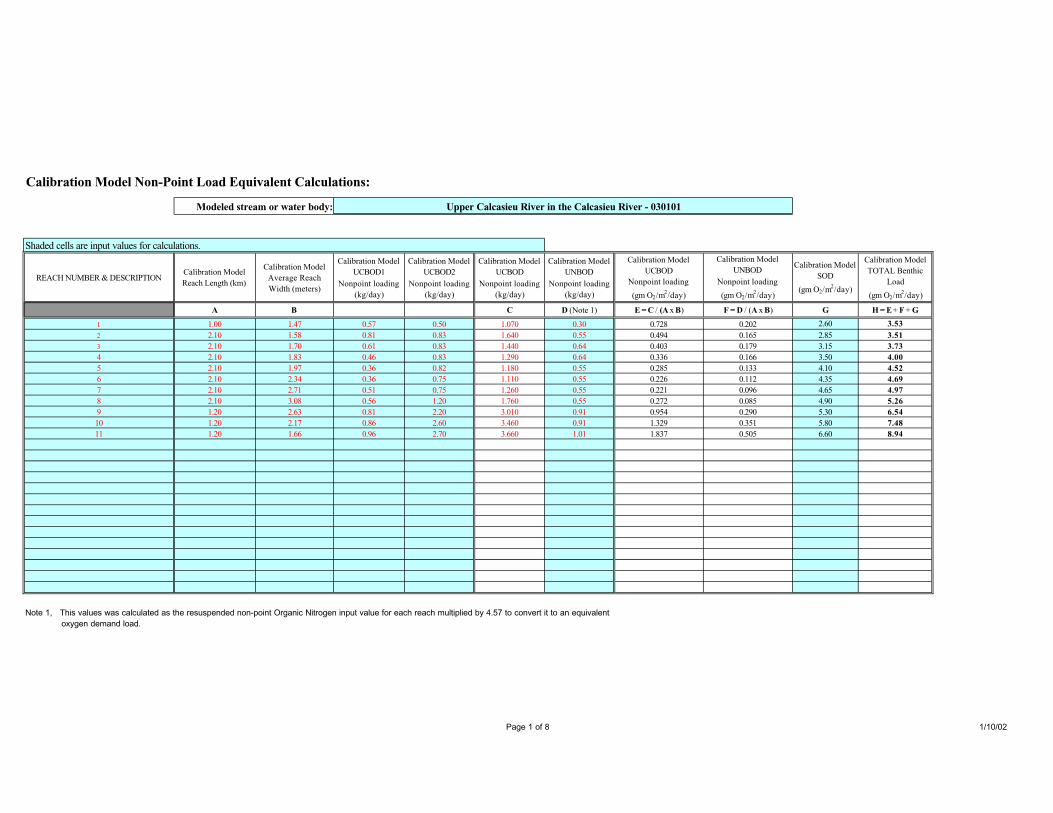
Calibration Model Non-Point Load Equivalent Calculations:
Modeled stream or water body: Upper Calcasieu River in the Calcasieu River - 030101
Shaded cells are input values for calculations.
REACH NUMBER & DESCRIPTIONCalibration Model
Reach Length (km)
Calibration Model
Average Reach
Width (meters)
Calibration Model
UCBOD1
Nonpoint loading
(kg/day)
Calibration Model
UCBOD2
Nonpoint loading
(kg/day)
Calibration Model
UCBOD
Nonpoint loading
(kg/day)
Calibration Model
UNBOD
Nonpoint loading
(kg/day)
Calibration Model
UCBOD
Nonpoint loading
(gm O2/m2/day)
Calibration Model
UNBOD
Nonpoint loading
(gm O2/m2/day)
Calibration Model
SOD
(gm O2/m2/day)
Calibration Model
TOTAL Benthic
Load
(gm O2/m2/day)
A B C D (Note 1) E = C / (A x B) F = D / (A x B) G H = E + F + G
1 1.00 1.47 0.57 0.50 1.070 0.30 0.728 0.202 2.60 3.532 2.10 1.58 0.81 0.83 1.640 0.55 0.494 0.165 2.85 3.513 2.10 1.70 0.61 0.83 1.440 0.64 0.403 0.179 3.15 3.734 2.10 1.83 0.46 0.83 1.290 0.64 0.336 0.166 3.50 4.005 2.10 1.97 0.36 0.82 1.180 0.55 0.285 0.133 4.10 4.526 2.10 2.34 0.36 0.75 1.110 0.55 0.226 0.112 4.35 4.697 2.10 2.71 0.51 0.75 1.260 0.55 0.221 0.096 4.65 4.978 2.10 3.08 0.56 1.20 1.760 0.55 0.272 0.085 4.90 5.269 1.20 2.63 0.81 2.20 3.010 0.91 0.954 0.290 5.30 6.5410 1.20 2.17 0.86 2.60 3.460 0.91 1.329 0.351 5.80 7.4811 1.20 1.66 0.96 2.70 3.660 1.01 1.837 0.505 6.60 8.94
Note 1, This values was calculated as the resuspended non-point Organic Nitrogen input value for each reach multiplied by 4.57 to convert it to an equivalent oxygen demand load.
Page 1 of 8 1/10/02
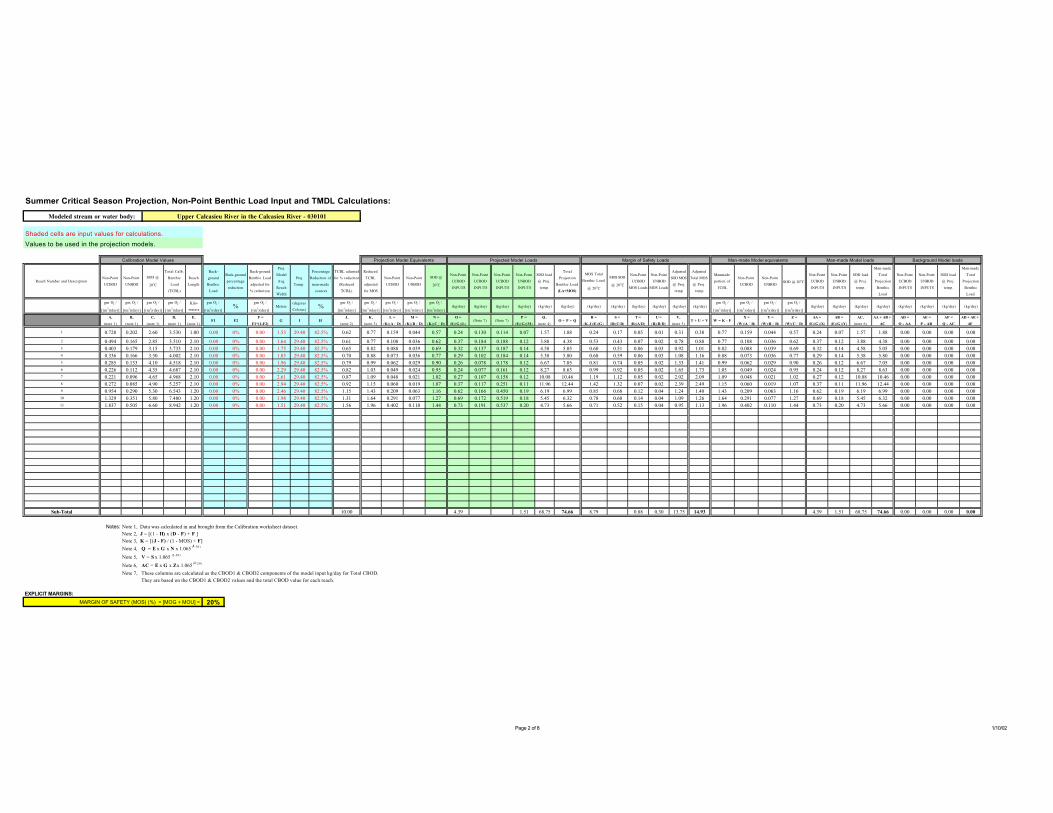
Summer Critical Season Projection, Non-Point Benthic Load Input and TMDL Calculations:
Modeled stream or water body: Upper Calcasieu River in the Calcasieu River - 030101
Shaded cells are input values for calculations.
Values to be used in the projection models.
Calibration Model Values Projection Model Equivalents Projected Model Loads Margin of Safety Loads Man-made Model equivalents Man-made Model loads Background Model loads
Reach Number and DescriptionNon-Point
UCBOD
Non-Point
UNBOD
SOD @
20oC
Total Calb.
Benthic
Load
(TCBL)
Reach
Length
Back-
ground
Benthic
Load
Back-ground
percentage
reduction
Back-ground
Benthic Load
adjusted for
% reduction
Proj.
Model
Avg.
Reach
Width
Proj.
Temp.
Percentage
Reduction of
man-made
sources
TCBL adjusted
for % reduction
(Reduced
TCBL)
Reduced
TCBL
adjusted
for MOS
Non-Point
UCBOD
Non-Point
UNBOD
SOD @
20oC
Non-Point
UCBOD
INPUTS
Non-Point
UCBOD
INPUTS
Non-Point
UCBOD
INPUTS
Non-Point
UNBOD
INPUTS
SOD load
@ Proj.
temp.
Total
Projection
Benthic Load
(LA+MOS)
MOS Total
Benthic Load
@ 20oC
MOS SOD
@ 20oC
Non-Point
UCBOD
MOS Loads
Non-Point
UNBOD
MOS Loads
Adjusted
SOD MOS
@ Proj.
temp
Adjusted
Total MOS
@ Proj.
temp
Manmade
portion of
TCBL
Non-Point
UCBOD
Non-Point
UNBODSOD @ 20
oC
Non-Point
UCBOD
INPUTS
Non-Point
UNBOD
INPUTS
SOD load
@ Proj.
temp.
Man-made
Total
Projection
Benthic
Load
Non-Point
UCBOD
INPUTS
Non-Point
UNBOD
INPUTS
SOD load
@ Proj.
temp.
Man-made
Total
Projection
Benthic
Load
gm O2 /
[(m2)(day)]
gm O2 /
[(m2)(day)]
gm O2 /
[(m2)(day)]
gm O2 /
[(m2)(day)]
Kilo-
meters
gm O2 /
[(m2)(day)]
%gm O2 /
[(m2)(day)]
Meters(degrees
Celcius)%
gm O2 /
[(m2)(day)]
gm O2 /
[(m2)(day)]
gm O2 /
[(m2)(day)]
gm O2 /
[(m2)(day)]
gm O2 /
[(m2)(day)]
(kg/day) (kg/day) (kg/day) (kg/day) (kg/day) (kg/day) (kg/day) (kg/day) (kg/day) (kg/day) (kg/day) (kg/day)gm O2 /
[(m2)(day)]
gm O2 /
[(m2)(day)]
gm O2 /
[(m2)(day)]
gm O2 /
[(m2)(day)]
(kg/day) (kg/day) (kg/day) (kg/day) (kg/day) (kg/day) (kg/day) (kg/day)
A,
(note 1)
B,
(note 1)
C,
(note 1)
D,
(note 1)
E,
(note 1)F1 F2
F =
F1*(1-F2)G I H
J,
(note 2)
K,
(note 3)
L =
(K)(A / D)
M =
(K)(B / D)
N =
(K)(C / D)
O =
(E)(G)(L)(Note 7) (Note 7)
P =
(E)(G)(M)
Q,
(note 4)O + P + Q
R =
(K-J)(E)(G)
S =
(R)(C/D)
T =
(R)(A/D)
U =
(R)(B/D)
V,
(note 5)T + U + V W = K - F
X =
(W)(A / D)
Y =
(W)(B / D)
Z =
(W)(C / D)
AA =
(E)(G)(X)
AB =
(E)(G)(Y)
AC,
(note 6)
AA + AB +
AC
AD =
O - AA
AE =
P - AB
AF =
Q - AC
AD + AE +
AF
1 0.728 0.202 2.60 3.530 1.00 0.00 0% 0.00 1.53 29.40 82.5% 0.62 0.77 0.159 0.044 0.57 0.24 0.130 0.114 0.07 1.57 1.88 0.24 0.17 0.05 0.01 0.31 0.38 0.77 0.159 0.044 0.57 0.24 0.07 1.57 1.88 0.00 0.00 0.00 0.00
2 0.494 0.165 2.85 3.510 2.10 0.00 0% 0.00 1.64 29.40 82.5% 0.61 0.77 0.108 0.036 0.62 0.37 0.184 0.188 0.12 3.88 4.38 0.53 0.43 0.07 0.02 0.78 0.88 0.77 0.108 0.036 0.62 0.37 0.12 3.88 4.38 0.00 0.00 0.00 0.00
3 0.403 0.179 3.15 3.733 2.10 0.00 0% 0.00 1.75 29.40 82.5% 0.65 0.82 0.088 0.039 0.69 0.32 0.137 0.187 0.14 4.58 5.05 0.60 0.51 0.06 0.03 0.92 1.01 0.82 0.088 0.039 0.69 0.32 0.14 4.58 5.05 0.00 0.00 0.00 0.00
4 0.336 0.166 3.50 4.002 2.10 0.00 0% 0.00 1.85 29.40 82.5% 0.70 0.88 0.073 0.036 0.77 0.29 0.102 0.184 0.14 5.38 5.80 0.68 0.59 0.06 0.03 1.08 1.16 0.88 0.073 0.036 0.77 0.29 0.14 5.38 5.80 0.00 0.00 0.00 0.00
5 0.285 0.133 4.10 4.518 2.10 0.00 0% 0.00 1.96 29.40 82.5% 0.79 0.99 0.062 0.029 0.90 0.26 0.078 0.178 0.12 6.67 7.05 0.81 0.74 0.05 0.02 1.33 1.41 0.99 0.062 0.029 0.90 0.26 0.12 6.67 7.05 0.00 0.00 0.00 0.00
6 0.226 0.112 4.35 4.687 2.10 0.00 0% 0.00 2.29 29.40 82.5% 0.82 1.03 0.049 0.024 0.95 0.24 0.077 0.161 0.12 8.27 8.63 0.99 0.92 0.05 0.02 1.65 1.73 1.03 0.049 0.024 0.95 0.24 0.12 8.27 8.63 0.00 0.00 0.00 0.00
7 0.221 0.096 4.65 4.968 2.10 0.00 0% 0.00 2.61 29.40 82.5% 0.87 1.09 0.048 0.021 1.02 0.27 0.107 0.158 0.12 10.08 10.46 1.19 1.12 0.05 0.02 2.02 2.09 1.09 0.048 0.021 1.02 0.27 0.12 10.08 10.46 0.00 0.00 0.00 0.00
8 0.272 0.085 4.90 5.257 2.10 0.00 0% 0.00 2.94 29.40 82.5% 0.92 1.15 0.060 0.019 1.07 0.37 0.117 0.251 0.11 11.96 12.44 1.42 1.32 0.07 0.02 2.39 2.49 1.15 0.060 0.019 1.07 0.37 0.11 11.96 12.44 0.00 0.00 0.00 0.00
9 0.954 0.290 5.30 6.543 1.20 0.00 0% 0.00 2.46 29.40 82.5% 1.15 1.43 0.209 0.063 1.16 0.62 0.166 0.450 0.19 6.19 6.99 0.85 0.68 0.12 0.04 1.24 1.40 1.43 0.209 0.063 1.16 0.62 0.19 6.19 6.99 0.00 0.00 0.00 0.00
10 1.329 0.351 5.80 7.480 1.20 0.00 0% 0.00 1.98 29.40 82.5% 1.31 1.64 0.291 0.077 1.27 0.69 0.172 0.519 0.18 5.45 6.32 0.78 0.60 0.14 0.04 1.09 1.26 1.64 0.291 0.077 1.27 0.69 0.18 5.45 6.32 0.00 0.00 0.00 0.00
11 1.837 0.505 6.60 8.942 1.20 0.00 0% 0.00 1.51 29.40 82.5% 1.56 1.96 0.402 0.110 1.44 0.73 0.191 0.537 0.20 4.73 5.66 0.71 0.52 0.15 0.04 0.95 1.13 1.96 0.402 0.110 1.44 0.73 0.20 4.73 5.66 0.00 0.00 0.00 0.00
Sub-Total 10.00 4.39 1.51 68.75 74.66 8.79 0.88 0.30 13.75 14.93 4.39 1.51 68.75 74.66 0.00 0.00 0.00 0.00
Notes: Note 1, Data was calculated in and brought from the Calibration worksheet dataset.
Note 2, J = [(1 - H) x (D - F) + F ]
Note 3, K = [(J - F) / (1 - MOS) + F]
Note 4, Q = E x G x N x 1.065 (I-20)
Note 5, V = S x 1.065 (I-20)
Note 6, AC = E x G x Z x 1.065 (I-20)
Note 7, These columns are calculated as the CBOD1 & CBOD2 components of the model input kg/day for Total CBOD.
They are based on the CBOD1 & CBOD2 values and the total CBOD value for each reach.
EXPLICIT MARGINS:
MARGIN OF SAFETY (MOS) (%) = [MOG + MOU] = 20%
Page 2 of 8 1/10/02
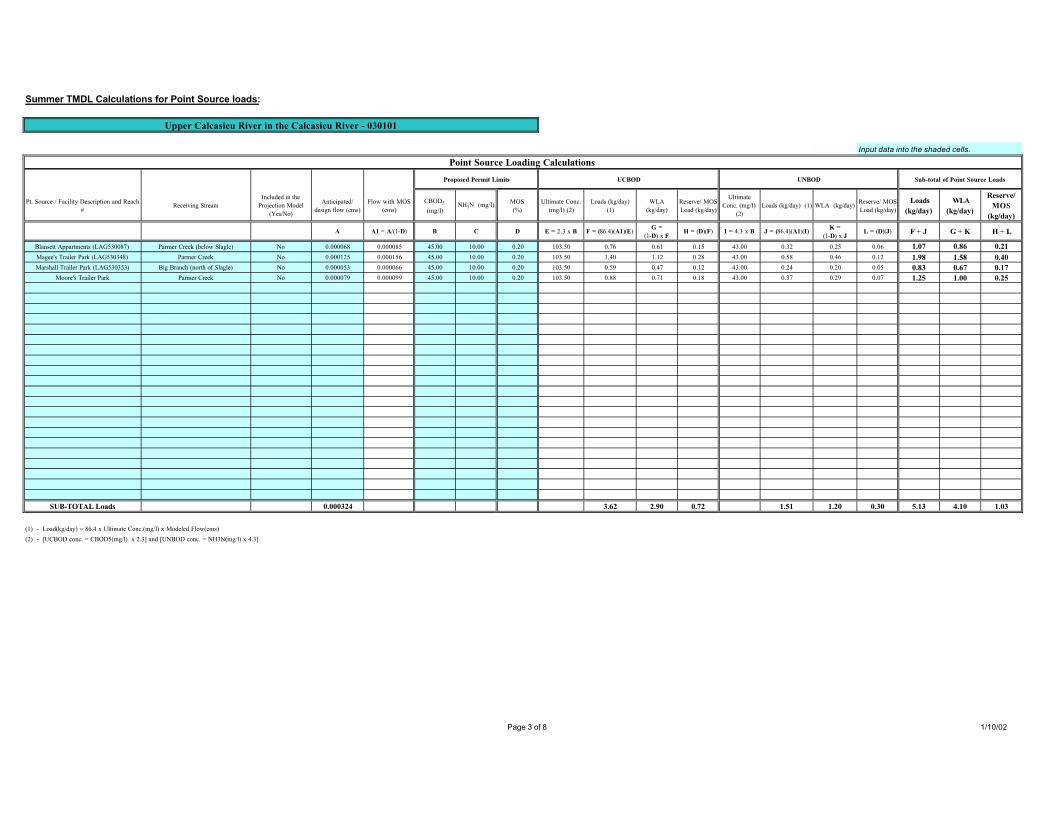
Summer TMDL Calculations for Point Source loads:
Upper Calcasieu River in the Calcasieu River - 030101
Input data into the shaded cells.
Point Source Loading Calculations
Proposed Permit Limits UCBOD UNBOD Sub-total of Point Source Loads
Pt. Source / Facility Description and Reach
#Receiving Stream
Included in the
Projection Model
(Yes/No)
Anticipated/
design flow (cms)
Flow with MOS
(cms)
CBOD5
(mg/l)NH3N (mg/l)
MOS
(%)
Ultimate Conc.
(mg/l) (2)
Loads (kg/day)
(1)
WLA
(kg/day)
Reserve/ MOS
Load (kg/day)
Ultimate
Conc. (mg/l)
(2)
Loads (kg/day) (1) WLA (kg/day)Reserve/ MOS
Load (kg/day)
Loads (kg/day)
WLA (kg/day)
Reserve/ MOS
(kg/day)
A A1 = A/(1-D) B C D E = 2.3 x B F = (86.4)(A1)(E) G =
(1-D) x FH = (D)(F) I = 4.3 x B J = (86.4)(A1)(I)
K = (1-D) x J
L = (D)(J) F + J G + K H + L
Blansett Appartments (LAG530087) Parmer Creek (below Slagle) No 0.000068 0.000085 45.00 10.00 0.20 103.50 0.76 0.61 0.15 43.00 0.32 0.25 0.06 1.07 0.86 0.21Magee's Trailer Park (LAG530348) Parmer Creek No 0.000125 0.000156 45.00 10.00 0.20 103.50 1.40 1.12 0.28 43.00 0.58 0.46 0.12 1.98 1.58 0.40Marshall Trailer Park (LAG530353) Big Branch (north of Slagle) No 0.000053 0.000066 45.00 10.00 0.20 103.50 0.59 0.47 0.12 43.00 0.24 0.20 0.05 0.83 0.67 0.17
Moore's Trailer Park Parmer Creek No 0.000079 0.000099 45.00 10.00 0.20 103.50 0.88 0.71 0.18 43.00 0.37 0.29 0.07 1.25 1.00 0.25
SUB-TOTAL Loads 0.000324 3.62 2.90 0.72 1.51 1.20 0.30 5.13 4.10 1.03
(1) - Load(kg/day) = 86.4 x Ultimate Conc.(mg/l) x Modeled Flow(cms)
(2) - [UCBOD conc. = CBOD5(mg/l) x 2.3] and [UNBOD conc. = NH3N(mg/l) x 4.3]
Page 3 of 8 1/10/02
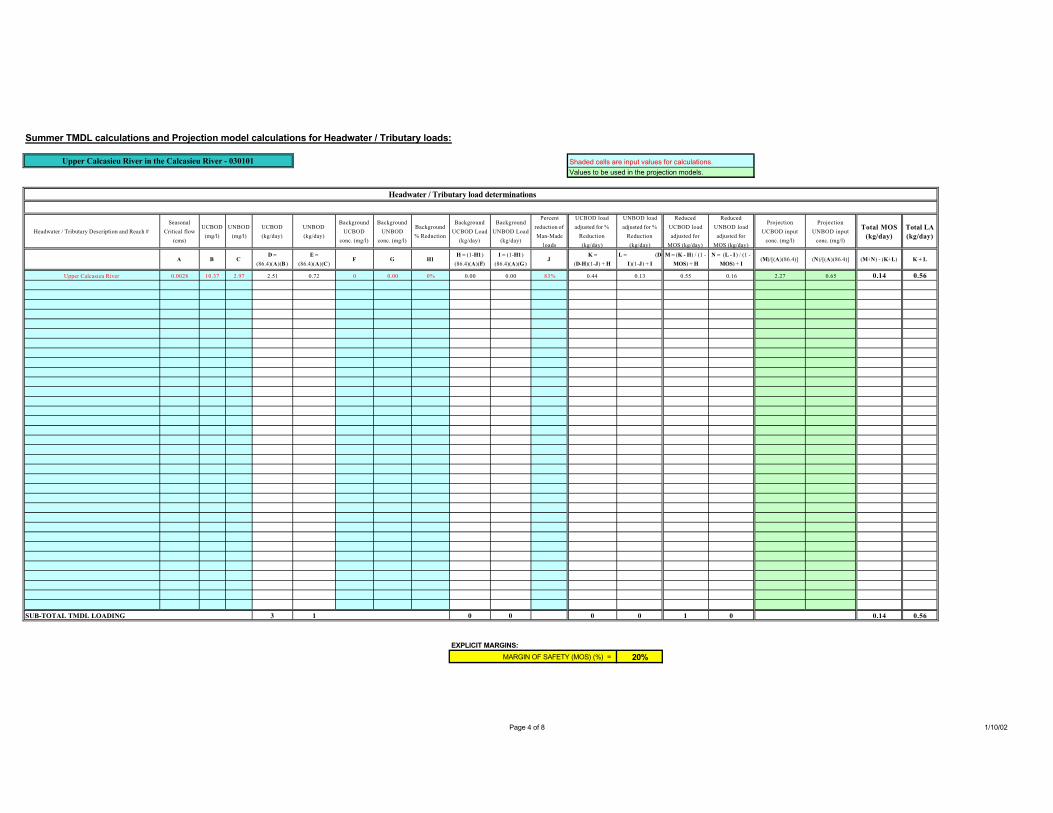
Summer TMDL calculations and Projection model calculations for Headwater / Tributary loads:
Upper Calcasieu River in the Calcasieu River - 030101 Shaded cells are input values for calculations.Values to be used in the projection models.
Headwater / Tributary load determinations
Headwater / Tributary Description and Reach #
Seasonal
Critical flow
(cms)
UCBOD
(mg/l)
UNBOD
(mg/l)
UCBOD
(kg/day)
UNBOD
(kg/day)
Background
UCBOD
conc. (mg/l)
Background
UNBOD
conc. (mg/l)
Background
% Reduction
Background
UCBOD Load
(kg/day)
Background
UNBOD Load
(kg/day)
Percent
reduction of
Man-Made
loads
UCBOD load
adjusted for %
Reduction
(kg/day)
UNBOD load
adjusted for %
Reduction
(kg/day)
Reduced
UCBOD load
adjusted for
MOS (kg/day)
Reduced
UNBOD load
adjusted for
MOS (kg/day)
Projection
UCBOD input
conc. (mg/l)
Projection
UNBOD input
conc. (mg/l)
Total MOS (kg/day)
Total LA (kg/day)
A B CD =
(86.4)(A)(B )
E =
(86.4)(A)(C)F G H1
H = (1-H1)
(86.4)(A)(F)
I = (1-H1)
(86.4)(A)(G )J
K =
(D-H)(1-J) + H
L = (D-
I)(1-J) + I
M = (K - H) / (1 -
MOS) + H
N = (L - I) / (1 -
MOS) + I(M)/[(A)(86.4)] (N)/[(A)(86.4)] (M+N) - (K+L) K + L
Upper Calcasieu River 0.0028 10.37 2.97 2.51 0.72 0 0.00 0% 0.00 0.00 83% 0.44 0.13 0.55 0.16 2.27 0.65 0.14 0.56
SUB-TOTAL TMDL LOADING 3 1 0 0 0 0 1 0 0.14 0.56
EXPLICIT MARGINS:
MARGIN OF SAFETY (MOS) (%) = 20%
Page 4 of 8 1/10/02
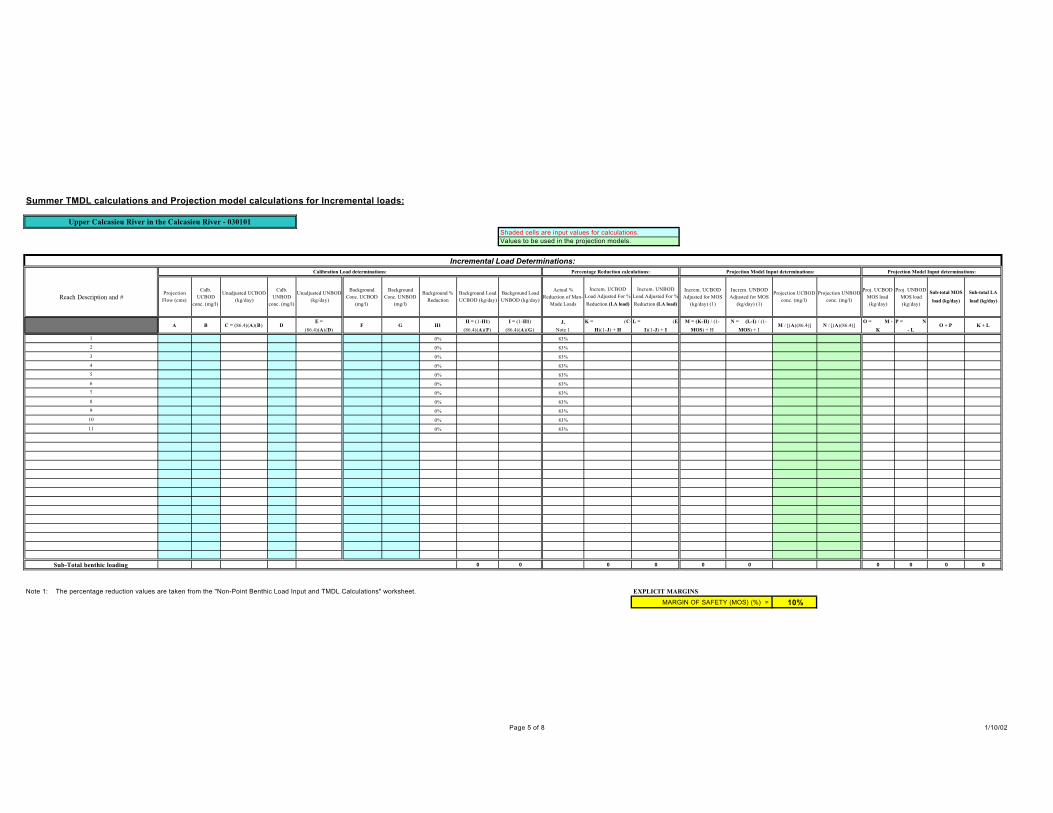
Summer TMDL calculations and Projection model calculations for Incremental loads:
Upper Calcasieu River in the Calcasieu River - 030101Shaded cells are input values for calculations.Values to be used in the projection models.
Incremental Load Determinations:Calibration Load determinations: Percentage Reduction calculations: Projection Model Input determinations: Projection Model Input determinations:
Reach Description and #Projection
Flow (cms)
Calb.
UCBOD
conc. (mg/l)
Unadjusted UCBOD
(kg/day)
Calb.
UNBOD
conc. (mg/l)
Unadjusted UNBOD
(kg/day)
Background
Conc. UCBOD
(mg/l)
Background
Conc. UNBOD
(mg/l)
Background %
Reduction
Background Load
UCBOD (kg/day)
Background Load
UNBOD (kg/day)
Actual %
Reduction of Man-
Made Loads
Increm. UCBOD
Load Adjusted For %
Reduction (LA load)
Increm. UNBOD
Load Adjusted For %
Reduction (LA load)
Increm. UCBOD
Adjusted for MOS
(kg/day) (1)
Increm. UNBOD
Adjusted for MOS
(kg/day) (1)
Projection UCBOD
conc. (mg/l)
Projection UNBOD
conc. (mg/l)
Proj. UCBOD
MOS load
(kg/day)
Proj. UNBOD
MOS load
(kg/day)
Sub-total MOS
load (kg/day)
Sub-total LA
load (kg/day)
A B C = (86.4)(A)(B) DE =
(86.4)(A)(D)F G H1
H = (1-H1)
(86.4)(A)(F)
I = (1-H1)
(86.4)(A)(G)
J,
Note 1
K = (C-
H)(1-J) + H
L = (E-
I)(1-J) + I
M = (K-H) / (1-
MOS) + H
N = (L-I) / (1-
MOS) + IM / [(A)(86.4)] N / [(A)(86.4)]
O = M -
K
P = N
- LO + P K + L
1 0% 83%
2 0% 83%
3 0% 83%
4 0% 83%
5 0% 83%
6 0% 83%
7 0% 83%
8 0% 83%
9 0% 83%
10 0% 83%
11 0% 83%
Sub-Total benthic loading 0 0 0 0 0 0 0 0 0 0
Note 1: The percentage reduction values are taken from the "Non-Point Benthic Load Input and TMDL Calculations" worksheet. EXPLICIT MARGINS:
MARGIN OF SAFETY (MOS) (%) = 10%
Page 5 of 8 1/10/02
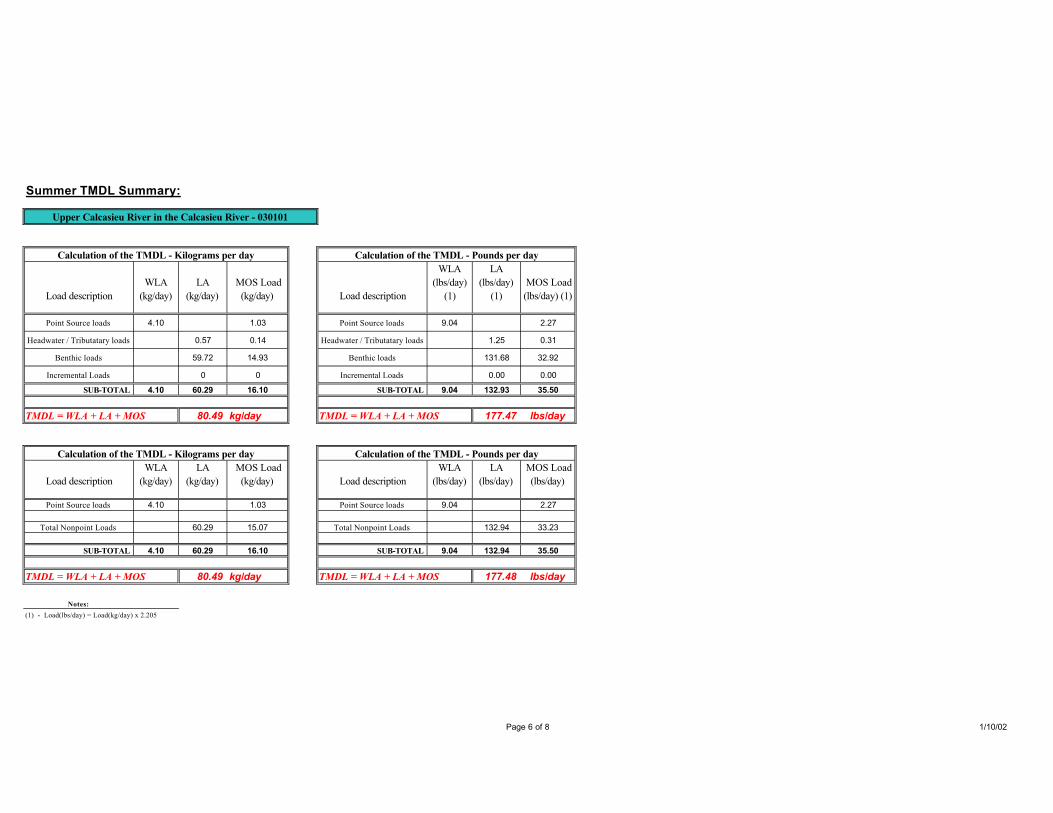
Summer TMDL Summary:
Upper Calcasieu River in the Calcasieu River - 030101
Calculation of the TMDL - Kilograms per day Calculation of the TMDL - Pounds per day
Load description
WLA
(kg/day)
LA
(kg/day)
MOS Load
(kg/day) Load description
WLA
(lbs/day)
(1)
LA
(lbs/day)
(1)
MOS Load
(lbs/day) (1)
Point Source loads 4.10 1.03 Point Source loads 9.04 2.27
Headwater / Tributatary loads 0.57 0.14 Headwater / Tributatary loads 1.25 0.31
Benthic loads 59.72 14.93 Benthic loads 131.68 32.92
Incremental Loads 0 0 Incremental Loads 0.00 0.00
SUB-TOTAL 4.10 60.29 16.10 SUB-TOTAL 9.04 132.93 35.50
TMDL = WLA + LA + MOS 80.49 kg/day TMDL = WLA + LA + MOS 177.47 lbs/day
Calculation of the TMDL - Kilograms per day Calculation of the TMDL - Pounds per day
Load description
WLA
(kg/day)
LA
(kg/day)
MOS Load
(kg/day) Load description
WLA
(lbs/day)
LA
(lbs/day)
MOS Load
(lbs/day)
Point Source loads 4.10 1.03 Point Source loads 9.04 2.27
Total Nonpoint Loads 60.29 15.07 Total Nonpoint Loads 132.94 33.23
SUB-TOTAL 4.10 60.29 16.10 SUB-TOTAL 9.04 132.94 35.50
TMDL = WLA + LA + MOS 80.49 kg/day TMDL = WLA + LA + MOS 177.48 lbs/day
Notes:
(1) - Load(lbs/day) = Load(kg/day) x 2.205
Page 6 of 8 1/10/02
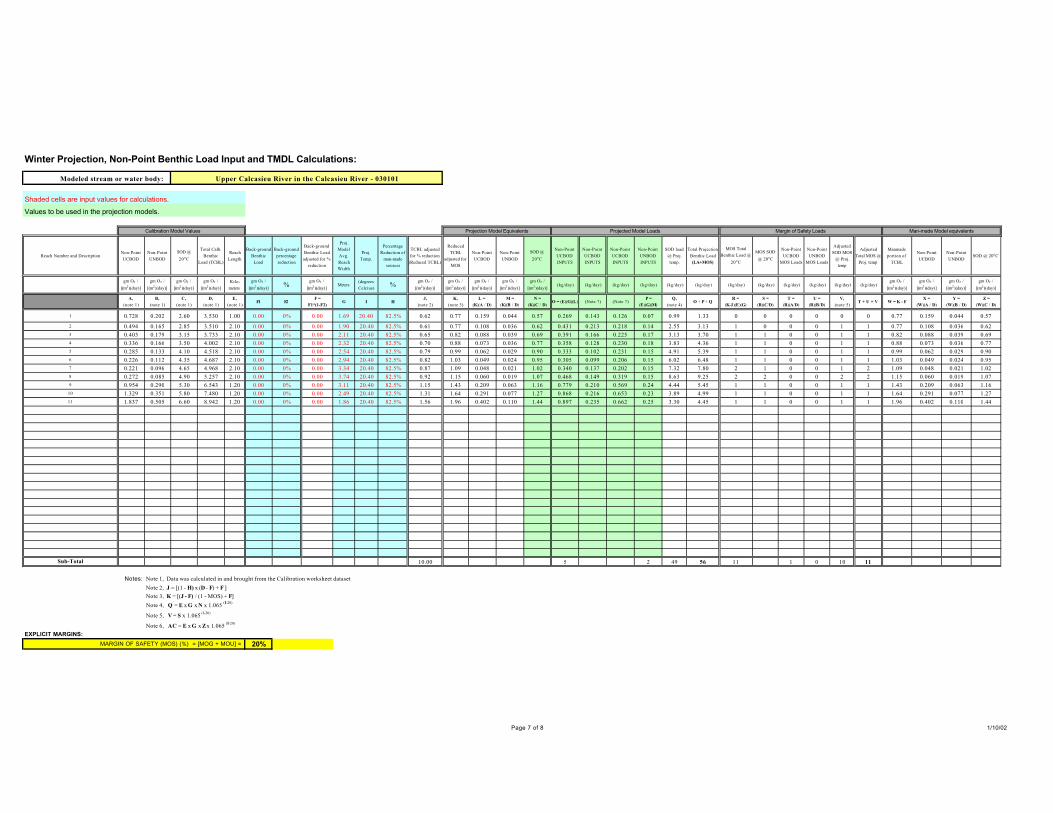
Winter Projection, Non-Point Benthic Load Input and TMDL Calculations:
Modeled stream or water body: Upper Calcasieu River in the Calcasieu River - 030101
Shaded cells are input values for calculations.
Values to be used in the projection models.
Calibration Model Values Projection Model Equivalents Projected Model Loads Margin of Safety Loads Man-made Model equivalents
Reach Number and DescriptionNon-Point
UCBOD
Non-Point
UNBOD
SOD @
20oC
Total Calb.
Benthic
Load (TCBL)
Reach
Length
Back-ground
Benthic
Load
Back-ground
percentage
reduction
Back-ground
Benthic Load
adjusted for %
reduction
Proj.
Model
Avg.
Reach
Width
Proj.
Temp.
Percentage
Reduction of
man-made
sources
TCBL adjusted
for % reduction
(Reduced TCBL)
Reduced
TCBL
adjusted for
MOS
Non-Point
UCBOD
Non-Point
UNBOD
SOD @
20oC
Non-Point
UCBOD
INPUTS
Non-Point
UCBOD
INPUTS
Non-Point
UCBOD
INPUTS
Non-Point
UNBOD
INPUTS
SOD load
@ Proj.
temp.
Total Projection
Benthic Load
(LA+MOS)
MOS Total
Benthic Load @
20oC
MOS SOD
@ 20oC
Non-Point
UCBOD
MOS Loads
Non-Point
UNBOD
MOS Loads
Adjusted
SOD MOS
@ Proj.
temp
Adjusted
Total MOS @
Proj. temp
Manmade
portion of
TCBL
Non-Point
UCBOD
Non-Point
UNBODSOD @ 20oC
gm O2 /
[(m2)(day)]
gm O2 /
[(m2)(day)]
gm O2 /
[(m2)(day)]
gm O2 /
[(m2)(day)]
Kilo-
meters
gm O2 /
[(m2)(day)]%
gm O2 /
[(m2)(day)]Meters
(degrees
Celcius)%
gm O2 /
[(m2)(day)]
gm O2 /
[(m2)(day)]
gm O2 /
[(m2)(day)]
gm O2 /
[(m2)(day)]
gm O2 /
[(m2)(day)] (kg/day) (kg/day) (kg/day) (kg/day) (kg/day) (kg/day) (kg/day) (kg/day) (kg/day) (kg/day) (kg/day) (kg/day)
gm O2 /
[(m2)(day)]
gm O2 /
[(m2)(day)]
gm O2 /
[(m2)(day)]
gm O2 /
[(m2)(day)]
A,
(note 1)
B,
(note 1)
C,
(note 1)
D,
(note 1)
E,
(note 1)F1 F2
F =
F1*(1-F2)G I H
J,
(note 2)
K,
(note 3)
L =
(K)(A / D)
M =
(K)(B / D)
N =
(K)(C / D)O = (E)(G)(L) (Note 7) (Note 7)
P =
(E)(G)(M)
Q,
(note 4)O + P + Q
R =
(K-J)(E)(G)
S =
(R)(C/D)
T =
(R)(A/D)
U =
(R)(B/D)
V,
(note 5)T + U + V W = K - F
X =
(W)(A / D)
Y =
(W)(B / D)
Z =
(W)(C / D)
1 0.728 0.202 2.60 3.530 1.00 0.00 0% 0.00 1.69 20.40 82.5% 0.62 0.77 0.159 0.044 0.57 0.269 0.143 0.126 0.07 0.99 1.33 0 0 0 0 0 0 0.77 0.159 0.044 0.57
2 0.494 0.165 2.85 3.510 2.10 0.00 0% 0.00 1.90 20.40 82.5% 0.61 0.77 0.108 0.036 0.62 0.431 0.213 0.218 0.14 2.55 3.13 1 0 0 0 1 1 0.77 0.108 0.036 0.62
3 0.403 0.179 3.15 3.733 2.10 0.00 0% 0.00 2.11 20.40 82.5% 0.65 0.82 0.088 0.039 0.69 0.391 0.166 0.225 0.17 3.13 3.70 1 1 0 0 1 1 0.82 0.088 0.039 0.69
4 0.336 0.166 3.50 4.002 2.10 0.00 0% 0.00 2.32 20.40 82.5% 0.70 0.88 0.073 0.036 0.77 0.358 0.128 0.230 0.18 3.83 4.36 1 1 0 0 1 1 0.88 0.073 0.036 0.77
5 0.285 0.133 4.10 4.518 2.10 0.00 0% 0.00 2.54 20.40 82.5% 0.79 0.99 0.062 0.029 0.90 0.333 0.102 0.231 0.15 4.91 5.39 1 1 0 0 1 1 0.99 0.062 0.029 0.90
6 0.226 0.112 4.35 4.687 2.10 0.00 0% 0.00 2.94 20.40 82.5% 0.82 1.03 0.049 0.024 0.95 0.305 0.099 0.206 0.15 6.02 6.48 1 1 0 0 1 1 1.03 0.049 0.024 0.95
7 0.221 0.096 4.65 4.968 2.10 0.00 0% 0.00 3.34 20.40 82.5% 0.87 1.09 0.048 0.021 1.02 0.340 0.137 0.202 0.15 7.32 7.80 2 1 0 0 1 2 1.09 0.048 0.021 1.02
8 0.272 0.085 4.90 5.257 2.10 0.00 0% 0.00 3.74 20.40 82.5% 0.92 1.15 0.060 0.019 1.07 0.468 0.149 0.319 0.15 8.63 9.25 2 2 0 0 2 2 1.15 0.060 0.019 1.07
9 0.954 0.290 5.30 6.543 1.20 0.00 0% 0.00 3.11 20.40 82.5% 1.15 1.43 0.209 0.063 1.16 0.779 0.210 0.569 0.24 4.44 5.45 1 1 0 0 1 1 1.43 0.209 0.063 1.16
10 1.329 0.351 5.80 7.480 1.20 0.00 0% 0.00 2.49 20.40 82.5% 1.31 1.64 0.291 0.077 1.27 0.868 0.216 0.653 0.23 3.89 4.99 1 1 0 0 1 1 1.64 0.291 0.077 1.27
11 1.837 0.505 6.60 8.942 1.20 0.00 0% 0.00 1.86 20.40 82.5% 1.56 1.96 0.402 0.110 1.44 0.897 0.235 0.662 0.25 3.30 4.45 1 1 0 0 1 1 1.96 0.402 0.110 1.44
Sub-Total 10.00 5 2 49 56 11 1 0 10 11
Notes: Note 1, Data was calculated in and brought from the Calibration worksheet dataset.
Note 2, J = [(1 - H) x (D - F) + F ]
Note 3, K = [(J - F) / (1 - MOS) + F]
Note 4, Q = E x G x N x 1.065 (I-20)
Note 5, V = S x 1.065 (I-20)
Note 6, AC = E x G x Z x 1.065 (I-20)
EXPLICIT MARGINS:
MARGIN OF SAFETY (MOS) (%) = [MOG + MOU] = 20%
Page 7 of 8 1/10/02
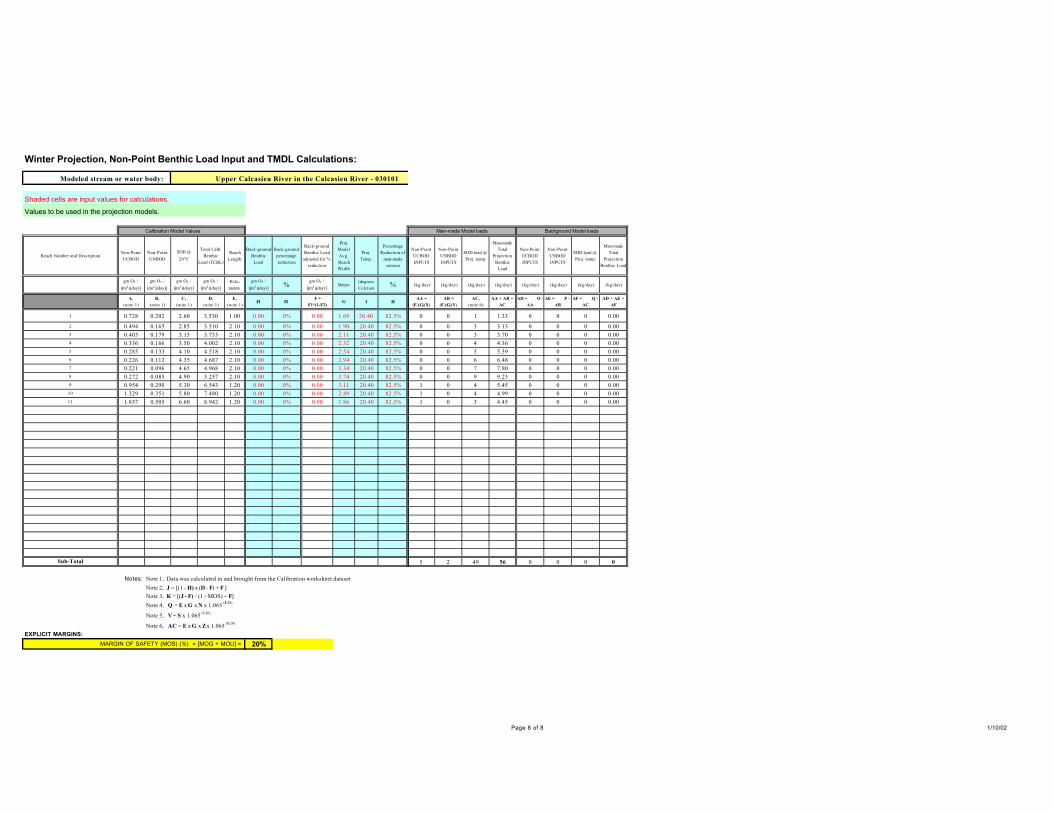
Winter Projection, Non-Point Benthic Load Input and TMDL Calculations:
Modeled stream or water body: Upper Calcasieu River in the Calcasieu River - 030101
Shaded cells are input values for calculations.
Values to be used in the projection models.
Calibration Model Values
Reach Number and DescriptionNon-Point
UCBOD
Non-Point
UNBOD
SOD @
20oC
Total Calb.
Benthic
Load (TCBL)
Reach
Length
Back-ground
Benthic
Load
Back-ground
percentage
reduction
Back-ground
Benthic Load
adjusted for %
reduction
Proj.
Model
Avg.
Reach
Width
Proj.
Temp.
Percentage
Reduction of
man-made
sources
gm O2 /
[(m2)(day)]
gm O2 /
[(m2)(day)]
gm O2 /
[(m2)(day)]
gm O2 /
[(m2)(day)]
Kilo-
meters
gm O2 /
[(m2)(day)]%
gm O2 /
[(m2)(day)]Meters
(degrees
Celcius)%
A,
(note 1)
B,
(note 1)
C,
(note 1)
D,
(note 1)
E,
(note 1)F1 F2
F =
F1*(1-F2)G I H
1 0.728 0.202 2.60 3.530 1.00 0.00 0% 0.00 1.69 20.40 82.5%
2 0.494 0.165 2.85 3.510 2.10 0.00 0% 0.00 1.90 20.40 82.5%
3 0.403 0.179 3.15 3.733 2.10 0.00 0% 0.00 2.11 20.40 82.5%
4 0.336 0.166 3.50 4.002 2.10 0.00 0% 0.00 2.32 20.40 82.5%
5 0.285 0.133 4.10 4.518 2.10 0.00 0% 0.00 2.54 20.40 82.5%
6 0.226 0.112 4.35 4.687 2.10 0.00 0% 0.00 2.94 20.40 82.5%
7 0.221 0.096 4.65 4.968 2.10 0.00 0% 0.00 3.34 20.40 82.5%
8 0.272 0.085 4.90 5.257 2.10 0.00 0% 0.00 3.74 20.40 82.5%
9 0.954 0.290 5.30 6.543 1.20 0.00 0% 0.00 3.11 20.40 82.5%
10 1.329 0.351 5.80 7.480 1.20 0.00 0% 0.00 2.49 20.40 82.5%
11 1.837 0.505 6.60 8.942 1.20 0.00 0% 0.00 1.86 20.40 82.5%
Sub-Total
Notes: Note 1, Data was calculated in and brought from the Calibration worksheet dataset.
Note 2, J = [(1 - H) x (D - F) + F ]
Note 3, K = [(J - F) / (1 - MOS) + F]
Note 4, Q = E x G x N x 1.065 (I-20)
Note 5, V = S x 1.065 (I-20)
Note 6, AC = E x G x Z x 1.065 (I-20)
EXPLICIT MARGINS:
MARGIN OF SAFETY (MOS) (%) = [MOG + MOU] = 20%
Man-made Model loads Background Model loads
Non-Point
UCBOD
INPUTS
Non-Point
UNBOD
INPUTS
SOD load @
Proj. temp.
Man-made
Total
Projection
Benthic
Load
Non-Point
UCBOD
INPUTS
Non-Point
UNBOD
INPUTS
SOD load @
Proj. temp.
Man-made
Total
Projection
Benthic Load
(kg/day) (kg/day) (kg/day) (kg/day) (kg/day) (kg/day) (kg/day) (kg/day)
AA =
(E)(G)(X)
AB =
(E)(G)(Y)
AC,
(note 6)
AA + AB +
AC
AD = O -
AA
AE = P -
AB
AF = Q -
AC
AD + AE +
AF
0 0 1 1.33 0 0 0 0.00
0 0 3 3.13 0 0 0 0.00
0 0 3 3.70 0 0 0 0.00
0 0 4 4.36 0 0 0 0.00
0 0 5 5.39 0 0 0 0.00
0 0 6 6.48 0 0 0 0.00
0 0 7 7.80 0 0 0 0.00
0 0 9 9.25 0 0 0 0.00
1 0 4 5.45 0 0 0 0.00
1 0 4 4.99 0 0 0 0.00
1 0 3 4.45 0 0 0 0.00
5 2 49 56 0 0 0 0
Page 8 of 8 1/10/02

Upper Calcasieu River Watershed TMDL for Dissolved Oxygen Subsegment 080808 Originated: January 9, 2002
48
Appendix F
Maps and Diagrams
Upper Calcasieu River Watershed TMDL for Dissolved Oxygen Subsegment 080808 Originated: January 9, 2002
49
Appendix F1
Maps and Diagrams
Reconnaissance survey digital photographs
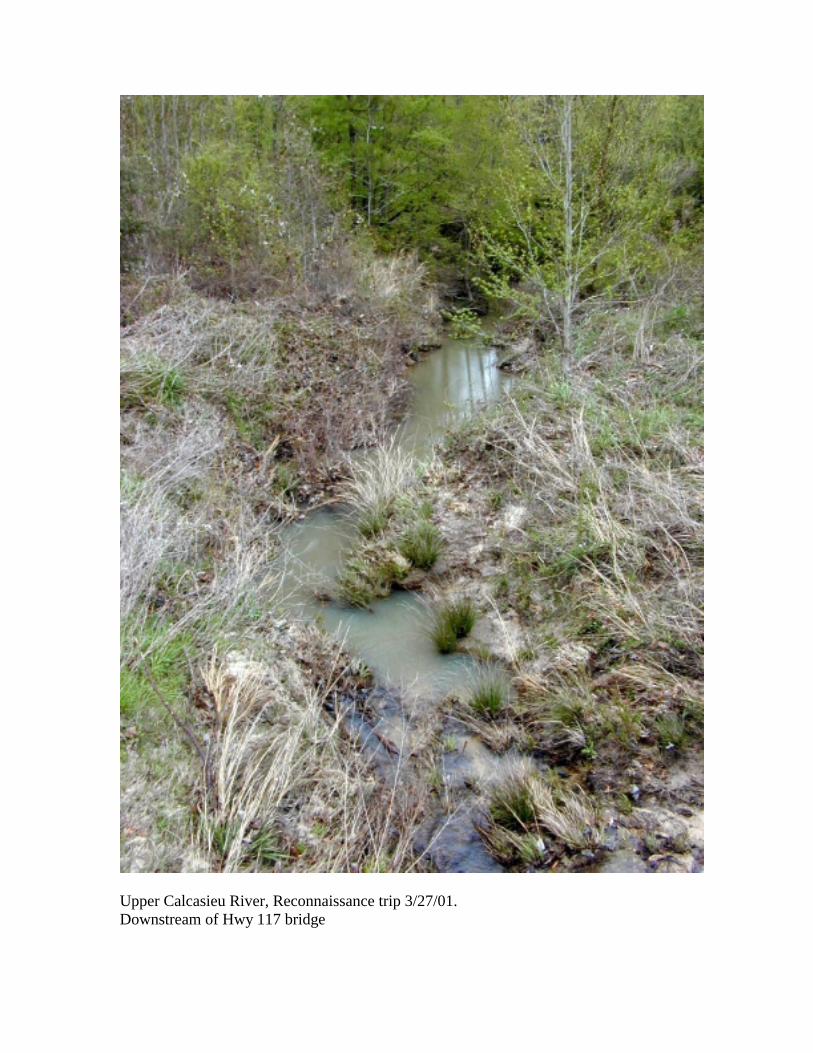
Upper Calcasieu River, Reconnaissance trip 3/27/01. Downstream of Hwy 117 bridge
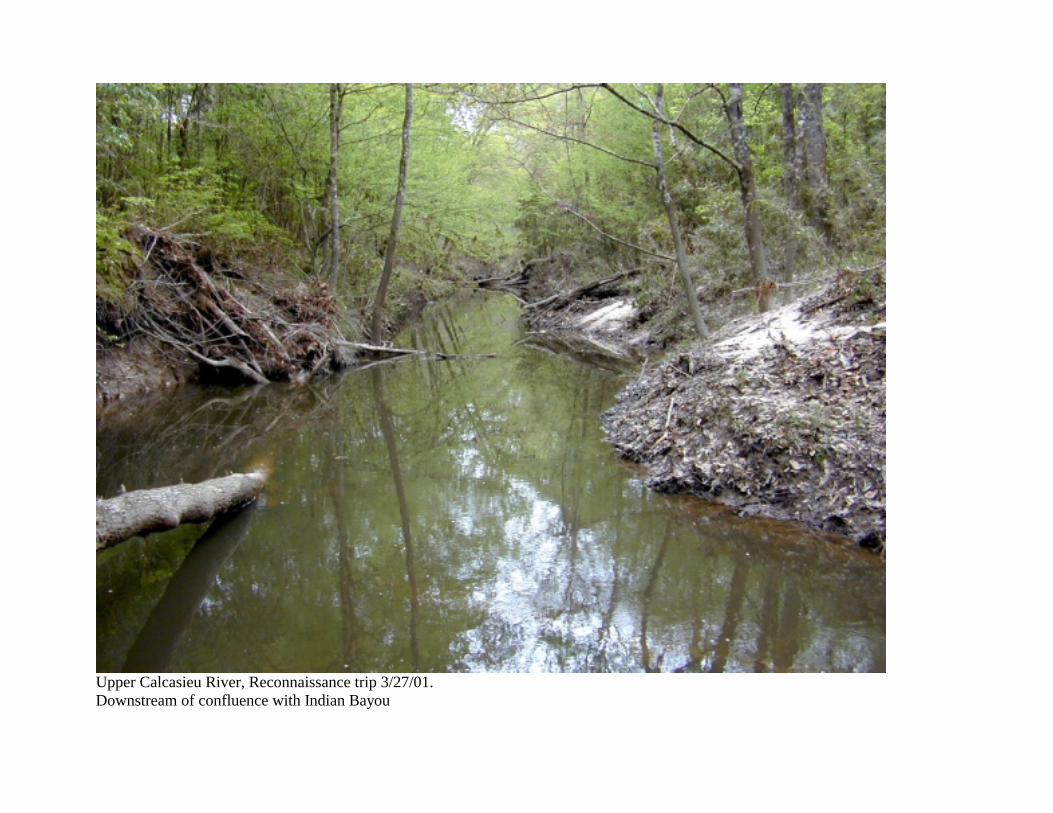
Upper Calcasieu River, Reconnaissance trip 3/27/01. Downstream of confluence with Indian Bayou
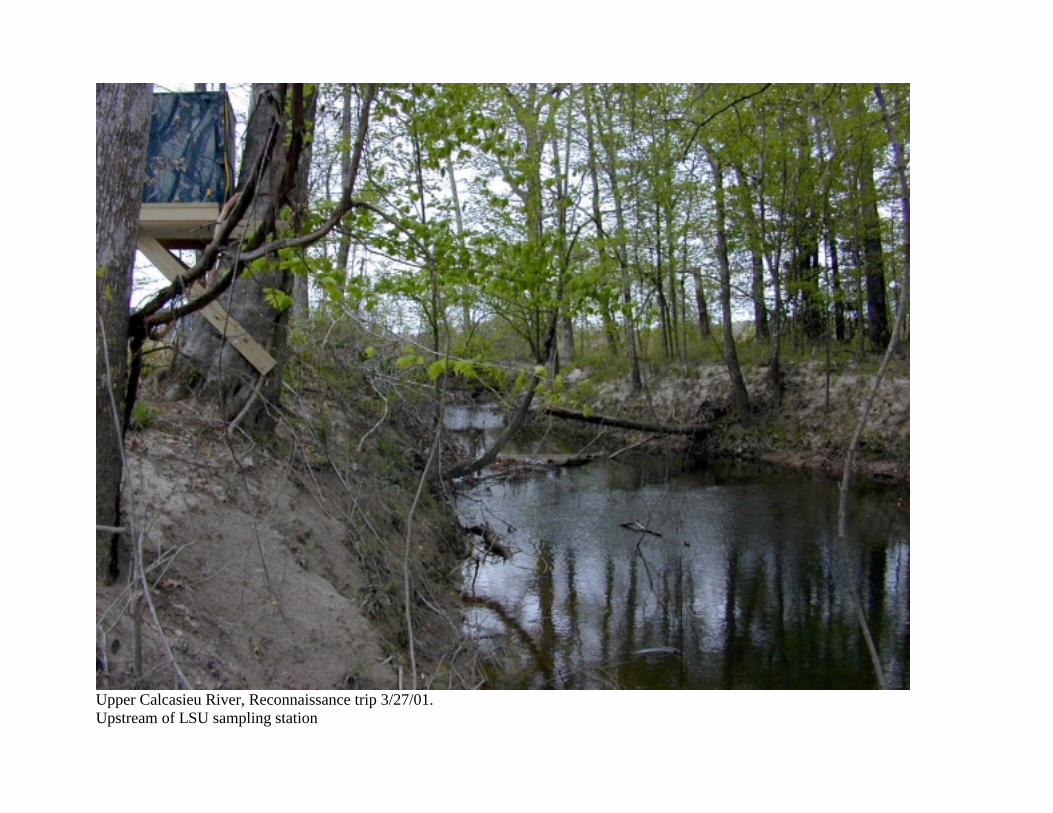
Upper Calcasieu River, Reconnaissance trip 3/27/01. Upstream of LSU sampling station

Upper Calcasieu River, Reconnaissance trip 3/27/01. Upstream of Hwy 8 bridge

Upper Calcasieu River Watershed TMDL for Dissolved Oxygen Subsegment 080808 Originated: January 9, 2002
50
Appendix F2
Maps and Diagrams
ARCVIEW mapping
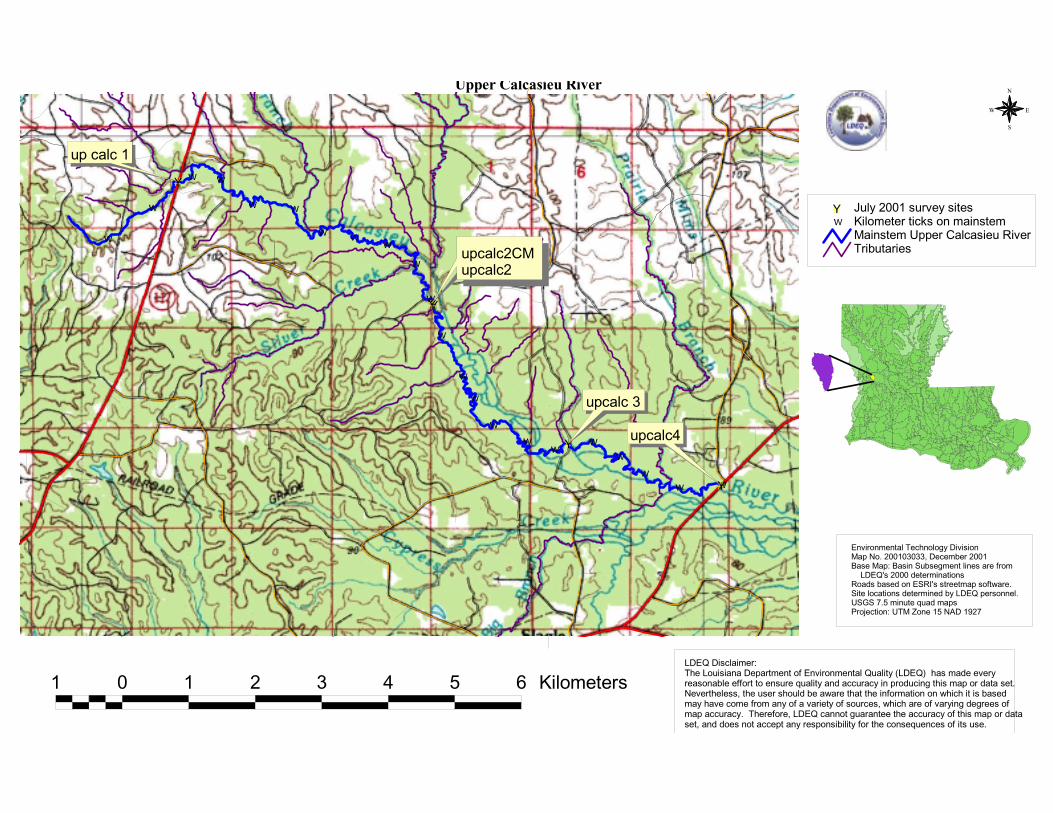
1 0 1 2 3 4 5 6 Kilometers
N
EW
S
Upper Calcasieu River
TributariesMainstem Upper Calcasieu River
'W Kilometer ticks on mainstem#Y July 2001 survey sites
'W'W
'W
'W
'W'W
'W
'W
'W
'W
'W
'W
'W
'W'W
'W
'W'W
'W'W
'W
'W
#Y
#Y#Y
#Y
#Y
up calc 1
upcalc2CMupcalc2
upcalc 3
upcalc4
Environmental Technology DivisionMap No. 200103033, December 2001Base Map: Basin Subsegment lines are from LDEQ's 2000 determinationsRoads based on ESRI's streetmap software.Site locations determined by LDEQ personnel.USGS 7.5 minute quad mapsProjection: UTM Zone 15 NAD 1927
LDEQ Disclaimer:The Louisiana Department of Environmental Quality (LDEQ) has made everyreasonable effort to ensure quality and accuracy in producing this map or data set.Nevertheless, the user should be aware that the information on which it is basedmay have come from any of a variety of sources, which are of varying degrees ofmap accuracy. Therefore, LDEQ cannot guarantee the accuracy of this map or dataset, and does not accept any responsibility for the consequences of its use.
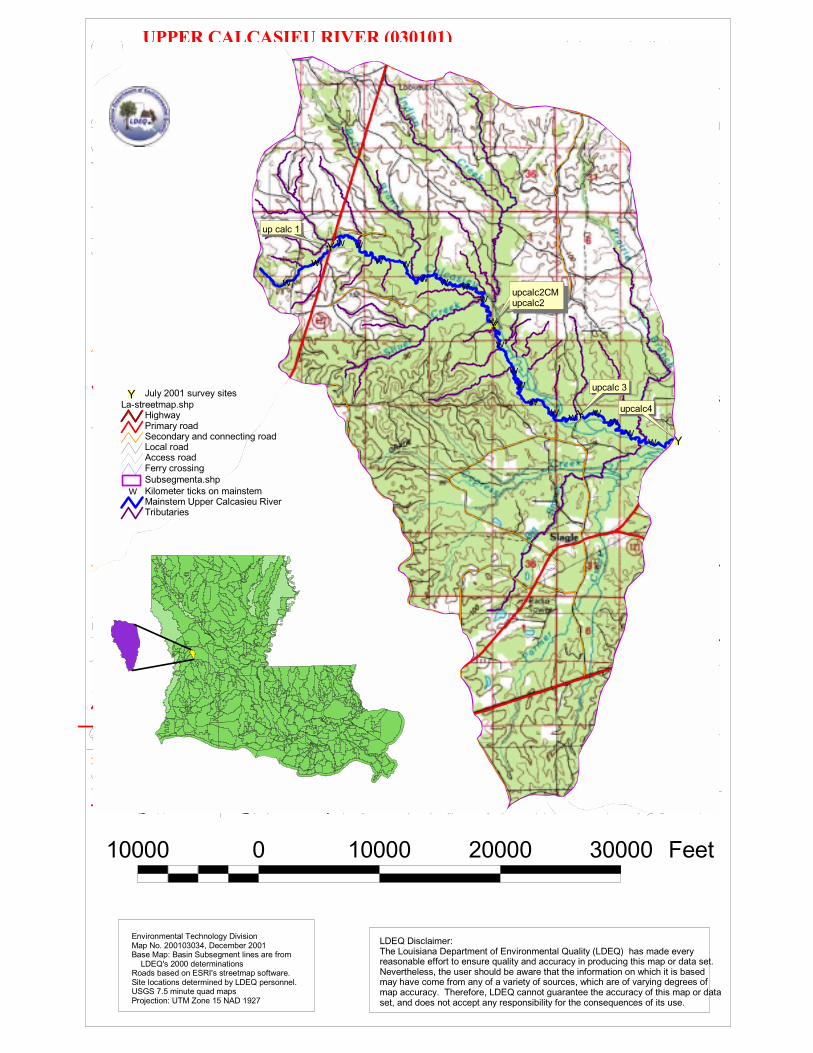
UPPER CALCASIEU RIVER (030101)
'W'W'W
'W'W
'W'W
'W
'W
'W
'W
'W
'W
'W'W'W
'W'W
'W'W
'W
'W
#Y
#Y#Y
#Y
#Y
up calc 1
upcalc2CMupcalc2
upcalc 3
upcalc4
Environmental Technology DivisionMap No. 200103034, December 2001Base Map: Basin Subsegment lines are from LDEQ's 2000 determinationsRoads based on ESRI's streetmap software.Site locations determined by LDEQ personnel.USGS 7.5 minute quad mapsProjection: UTM Zone 15 NAD 1927
LDEQ Disclaimer:The Louisiana Department of Environmental Quality (LDEQ) has made everyreasonable effort to ensure quality and accuracy in producing this map or data set.Nevertheless, the user should be aware that the information on which it is basedmay have come from any of a variety of sources, which are of varying degrees ofmap accuracy. Therefore, LDEQ cannot guarantee the accuracy of this map or dataset, and does not accept any responsibility for the consequences of its use.
10000 0 10000 20000 30000 Feet
TributariesMainstem Upper Calcasieu River
'W Kilometer ticks on mainstemSubsegmenta.shp
La-streetmap.shpHighwayPrimary roadSecondary and connecting roadLocal roadAccess roadFerry crossing
#Y July 2001 survey sites
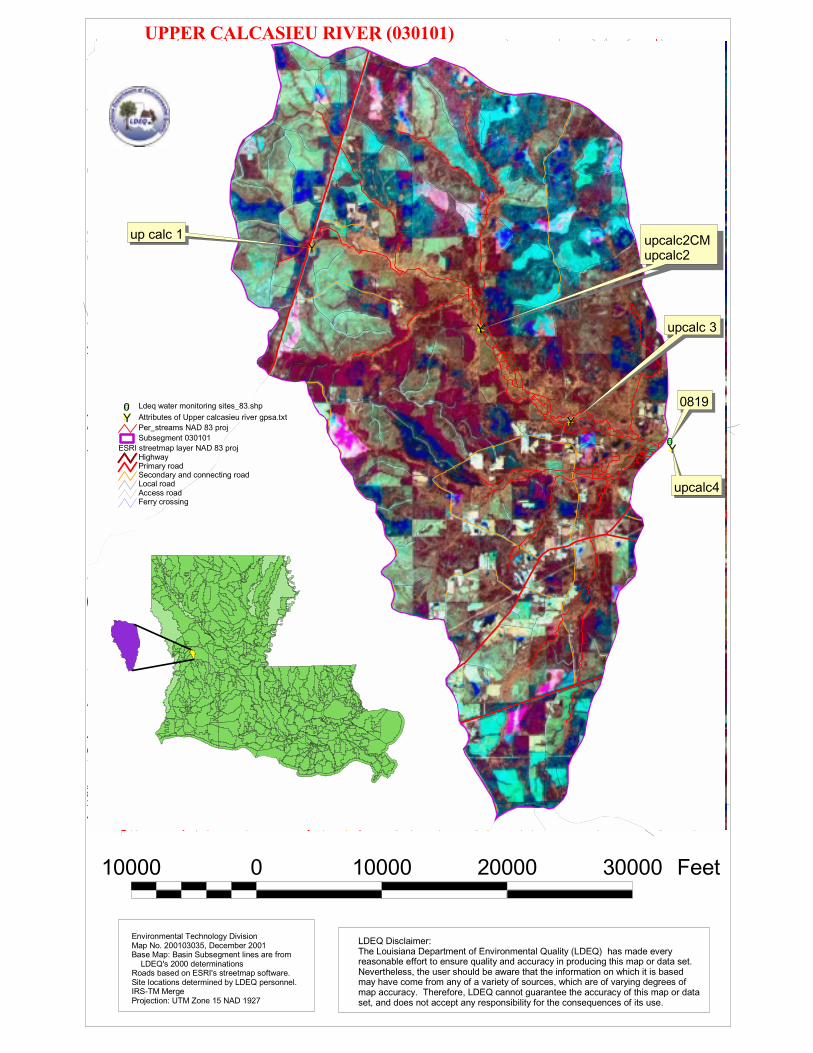
#Y
#Y#Y
#Y
#Y
#0
0819
upcalc4
up calc 1 upcalc2CMupcalc2
upcalc 3
UPPER CALCASIEU RIVER (030101)
LDEQ Disclaimer:The Louisiana Department of Environmental Quality (LDEQ) has made everyreasonable effort to ensure quality and accuracy in producing this map or data set.Nevertheless, the user should be aware that the information on which it is basedmay have come from any of a variety of sources, which are of varying degrees ofmap accuracy. Therefore, LDEQ cannot guarantee the accuracy of this map or dataset, and does not accept any responsibility for the consequences of its use.
Environmental Technology DivisionMap No. 200103035, December 2001Base Map: Basin Subsegment lines are from LDEQ's 2000 determinationsRoads based on ESRI's streetmap software.Site locations determined by LDEQ personnel.IRS-TM MergeProjection: UTM Zone 15 NAD 1927
10000 0 10000 20000 30000 Feet
ESRI streetmap layer NAD 83 projHighwayPrimary roadSecondary and connecting roadLocal roadAccess roadFerry crossing
Subsegment 030101Per_streams NAD 83 proj
#Y Attributes of Upper calcasieu river gpsa.txt#0 Ldeq water monitoring sites_83.shp
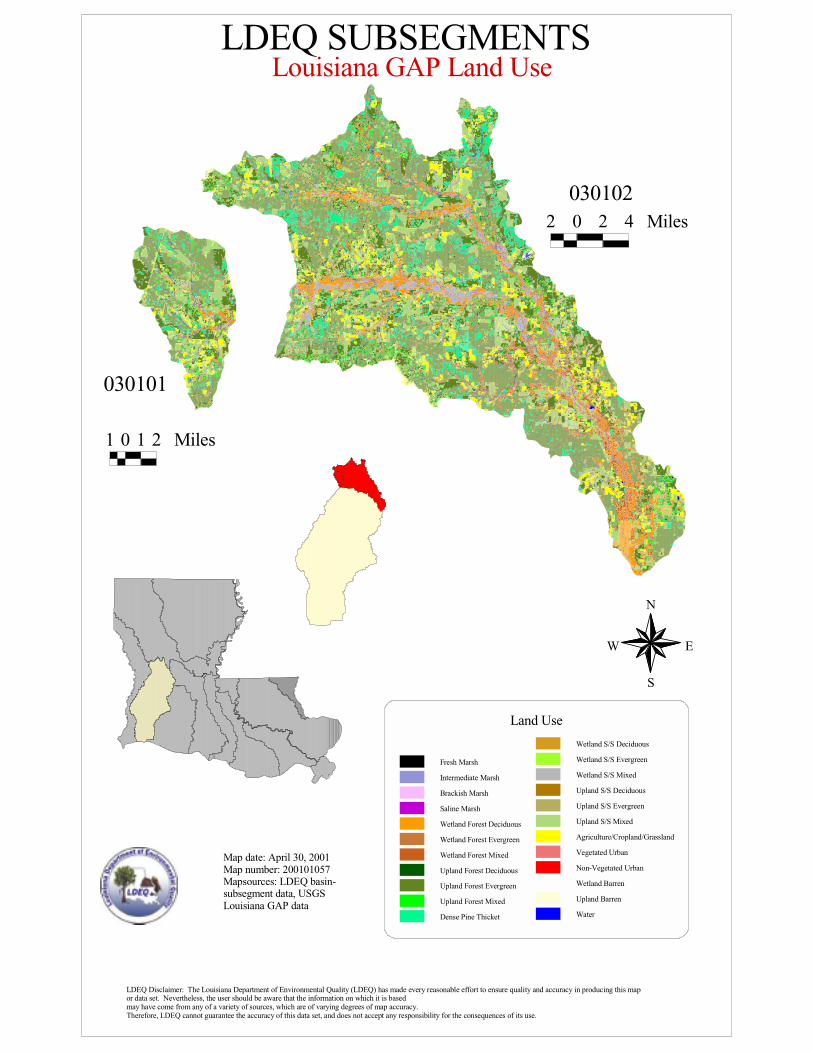
LDEQ SUBSEGMENTSLouisiana GAP Land Use
030101
030102
1 0 1 2 Miles
2 0 2 4 Miles
N
EW
S
Fresh Marsh
Intermediate Marsh
Brackish Marsh
Saline Marsh
Wetland Forest Deciduous
Wetland Forest Evergreen
Wetland Forest Mixed
Upland Forest Deciduous
Upland Forest Evergreen
Upland Forest Mixed
Dense Pine Thicket
Wetland S/S Deciduous
Wetland S/S Evergreen
Wetland S/S Mixed
Upland S/S Deciduous
Upland S/S Evergreen
Upland S/S Mixed
Agriculture/Cropland/Grassland
Vegetated Urban
Non-Vegetated Urban
Wetland Barren
Upland Barren
Water
Land Use
Map date: April 30, 2001Map number: 200101057Mapsources: LDEQ basin-subsegment data, USGSLouisiana GAP data
LDEQ Disclaimer: The Louisiana Department of Environmental Quality (LDEQ) has made every reasonable effort to ensure quality and accuracy in producing this mapor data set. Nevertheless, the user should be aware that the information on which it is based may have come from any of a variety of sources, which are of varying degrees of map accuracy. Therefore, LDEQ cannot guarantee the accuracy of this data set, and does not accept any responsibility for the consequences of its use.

Upper Calcasieu River Watershed TMDL for Dissolved Oxygen Subsegment 080808 Originated: January 9, 2002
51
Appendix F3
Maps and Diagrams
Vector Diagram
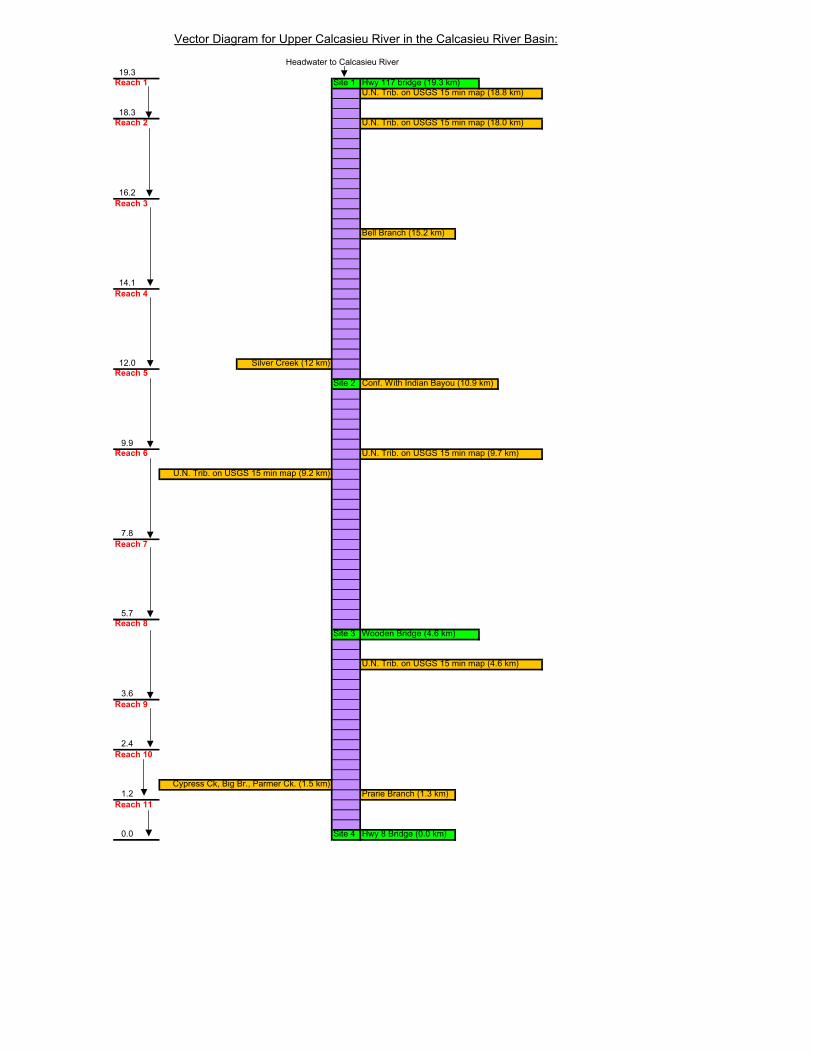
Vector Diagram for Upper Calcasieu River in the Calcasieu River Basin:
Headwater to Calcasieu River19.3
Reach 1 Site 1 Hwy 117 bridge (19.3 km)U.N. Trib. on USGS 15 min map (18.8 km)
18.3Reach 2 U.N. Trib. on USGS 15 min map (18.0 km)
16.2Reach 3
Bell Branch (15.2 km)
14.1Reach 4
12.0 Silver Creek (12 km)Reach 5
Site 2 Conf. With Indian Bayou (10.9 km)
9.9Reach 6 U.N. Trib. on USGS 15 min map (9.7 km)
U.N. Trib. on USGS 15 min map (9.2 km)
7.8Reach 7
5.7Reach 8
Site 3 Wooden Bridge (4.6 km)
U.N. Trib. on USGS 15 min map (4.6 km)
3.6Reach 9
2.4Reach 10
Cypress Ck, Big Br., Parmer Ck. (1.5 km)1.2 Prarie Branch (1.3 km)
Reach 11
0.0 Site 4 Hwy 8 Bridge (0.0 km)


![[Type text] Geographic Response Plan Calcasieu Parish](https://static.cupdf.com/doc/110x72/6247d3b4c87ff269e163e5e8/type-text-geographic-response-plan-calcasieu-parish.jpg)