Updates from the Pelagic Fish Survey and the Nearshoring Monitoring
Program
Eva C. Enders, Colin Charles, Amanda L. Caskenette, and Doug A. Watkinson
in collaboration with theLake Winnipeg Research Consortium &
Manitoba Agriculture and Resource Development and Environment and Climate Change Canada

M.V. Namao
• The monitoring program was initiated in 2002.
• Fish are collected from offshore waters during spring, summer, and fall using the research vessel Namao.
Pelagic Fish Survey

Materials and Methods• 3-m square beam trawl with small mesh net
• Trawl towed randomly at one of three depths: surface, mid-water or deep
• Smaller fish sorted by species and frozen in labeled bags for further processing
• Incidental catch of larger fish measured, weighed, and returned to lake

In the laboratory, specimens are:• identified • sorted into size classes• measured• weighed
Fish processing


Benefits and Applications of the Pelagic Trawl Survey
• Identification of impacts of aquatic invasive species in Lake Winnipeg• long-term dataset on the small fish community provides unique
opportunity to monitor the impact of recent introductions such as Zebra Mussel and Spiny Water Flea.
• Detection of population trends of commercial and recreational fish stocks• Recruitment changes, growth and condition of fish stocks• Distribution and abundance of native and non-native fish species
• Provide data and samples to additional studies • e.g., Stable Isotope Analysis for a Food Web Study
Funding organizations
• Manitoba Agriculture and Resource Development
• Fish and Wildlife Enhancement Fund
• Fisheries Enhancement Fund
• DFO Species at Risk and other Canadian Government funds
Big thanks to ship and field crews!

Central Study Purpose:How do Zebra Mussels affect the LW nearshore food web?

Sampling Locations2018-2020 (every 3 weeks – 5 rounds)
2018 (every 3 weeks – 6 rounds)
2017-2018 (3 rounds)
Sunset Beach Lester Beach Patricia BeachBoulders, rocks, and Sand
Mainly sandy, some boulders and rocks
Sandy
High ZM Suitability Medium ZM Suitability Low ZM Suitability
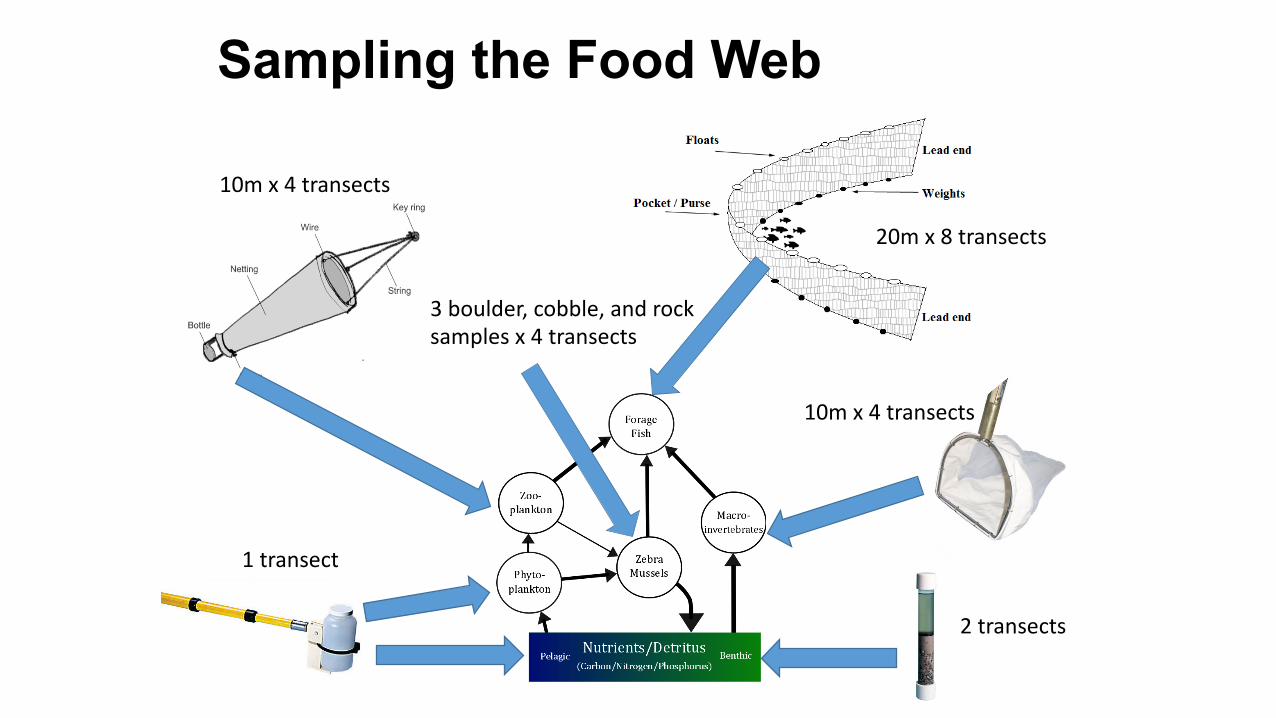
Sampling the Food Web
20m x 8 transects
10m x 4 transects
10m x 4 transects
2 transects
1 transect
3 boulder, cobble, and rocksamples x 4 transects
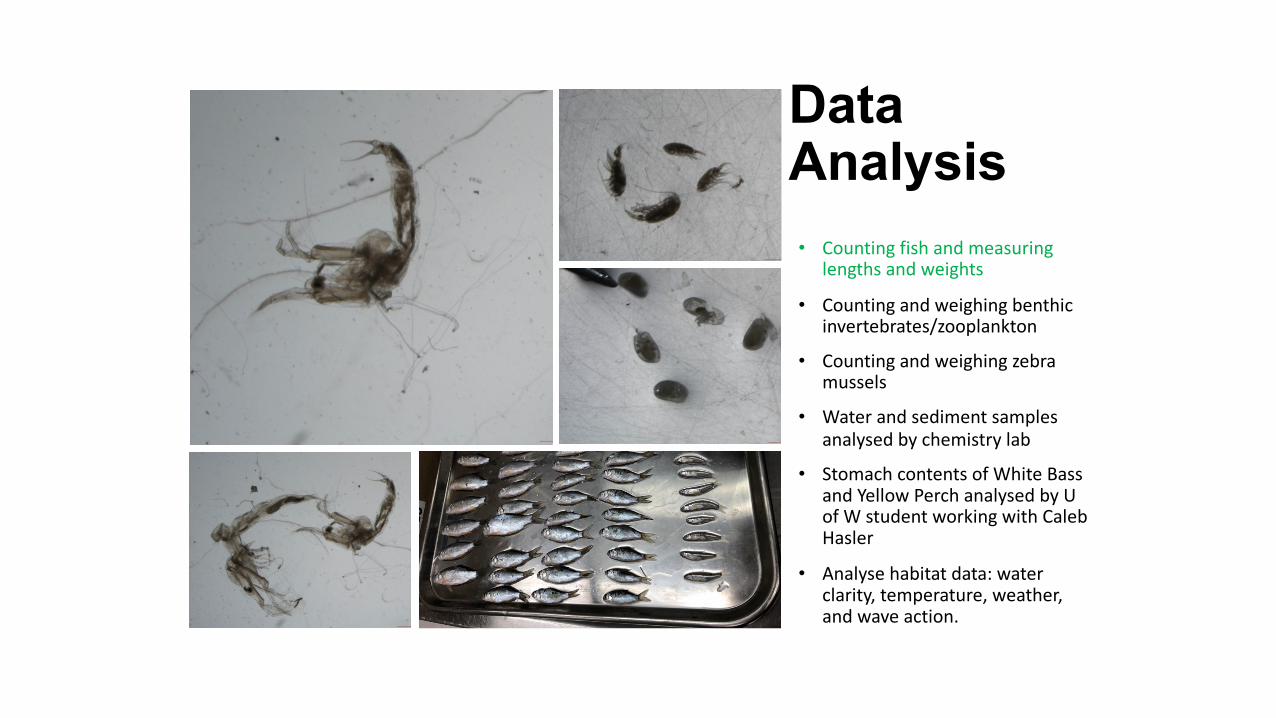
Data Analysis• Counting fish and measuring
lengths and weights
• Counting and weighing benthic invertebrates/zooplankton
• Counting and weighing zebra mussels
• Water and sediment samples analysed by chemistry lab
• Stomach contents of White Bass and Yellow Perch analysed by U of W student working with Caleb Hasler
• Analyse habitat data: water clarity, temperature, weather, and wave action.
0%
20%
40%
60%
80%
100%
Round 1 Round 2 Round 3 Round 4 Round 50%
20%
40%
60%
80%
100%
Round 1 Round 2 Round 3 Round 4 Round 5
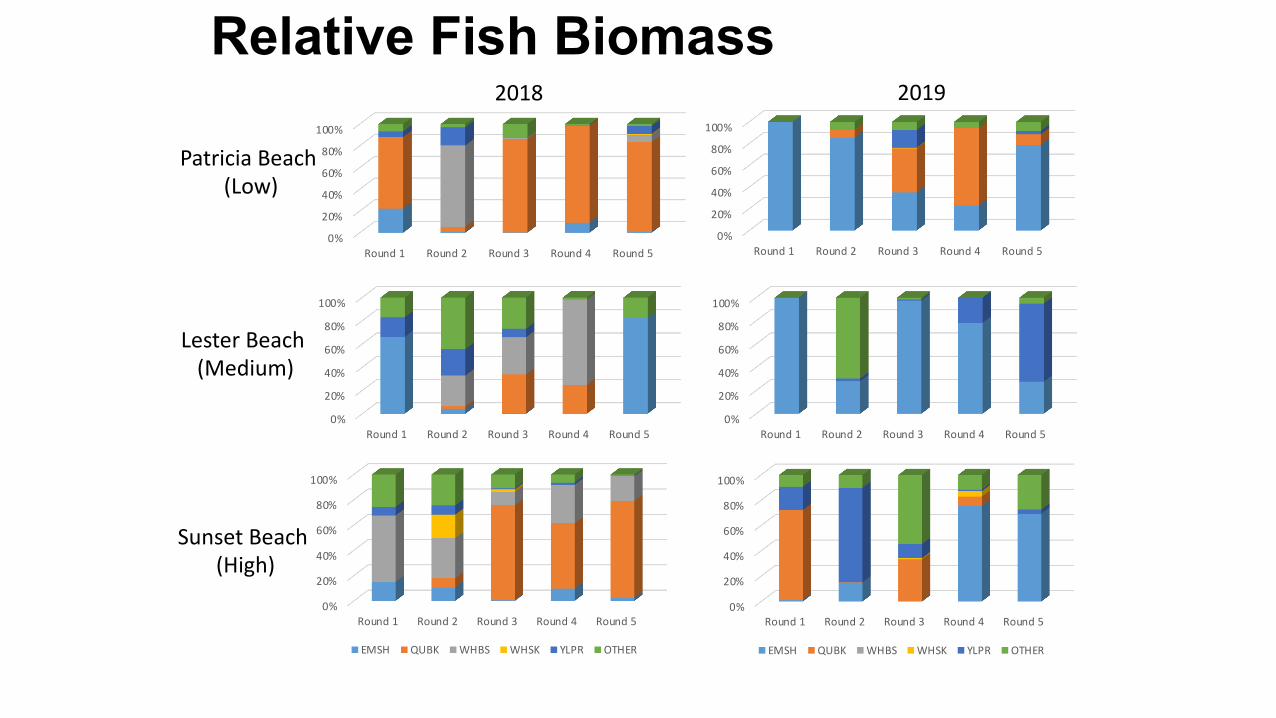
Relative Fish Biomass
Patricia Beach(Low)
2018 2019
Lester Beach(Medium)
Sunset Beach(High)
0%
20%
40%
60%
80%
100%
Round 1 Round 2 Round 3 Round 4 Round 50%
20%
40%
60%
80%
100%
Round 1 Round 2 Round 3 Round 4 Round 5
0%
20%
40%
60%
80%
100%
Round 1 Round 2 Round 3 Round 4 Round 5
EMSH QUBK WHBS WHSK YLPR OTHER
0%
20%
40%
60%
80%
100%
Round 1 Round 2 Round 3 Round 4 Round 5
EMSH QUBK WHBS WHSK YLPR OTHER

Walleye (Sander vitreus) movement and survival over 50 years using multi-state mark recapture
models
Data chapter 1
Nicole Turner M.Sc. Candidate
Supervisor: Dr. Michael Rennie
Turner, N., Charles, C., Watkinson, D., Klein, G., Enders, E.C., Rennie, M.D.
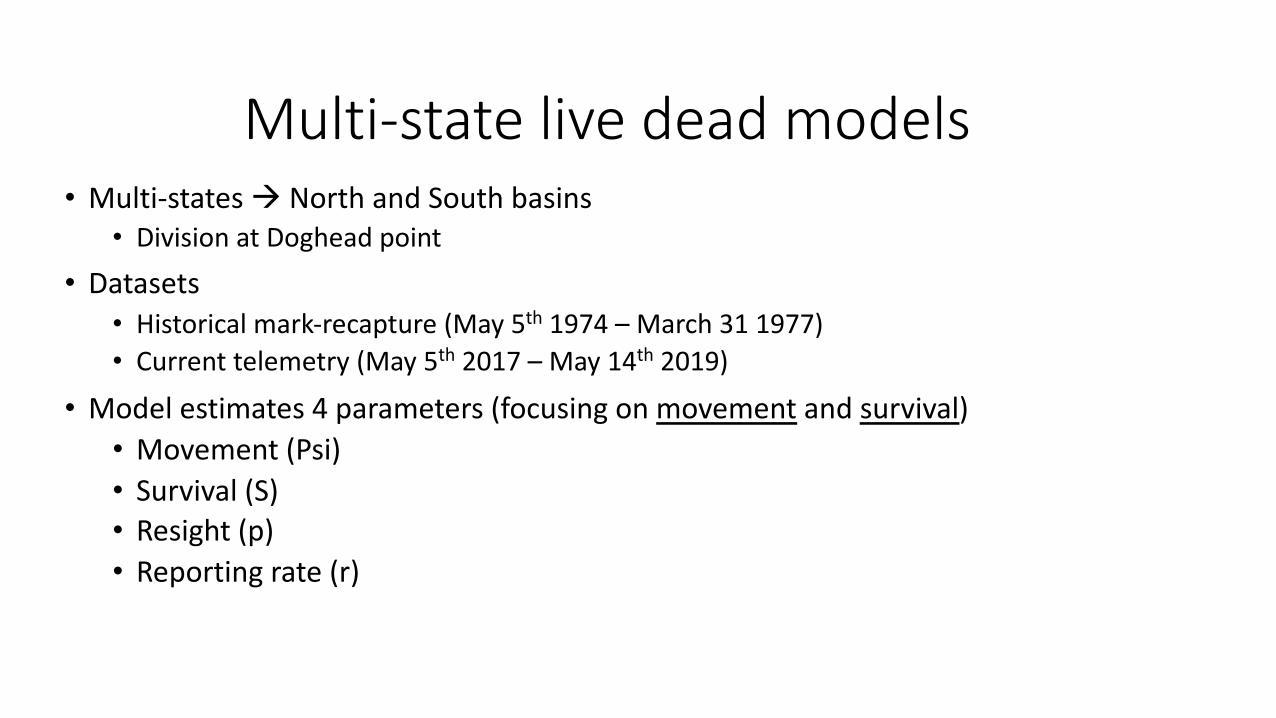
Multi-state live dead models• Multi-states à North and South basins
• Division at Doghead point
• Datasets• Historical mark-recapture (May 5th 1974 – March 31 1977)• Current telemetry (May 5th 2017 – May 14th 2019)
• Model estimates 4 parameters (focusing on movement and survival)• Movement (Psi)• Survival (S)• Resight (p)• Reporting rate (r)

HISTORICAL MODEL RESULTS
Survival (S) Resight(p)
Movement (Psi)
Reporting rate (r)
Npar AICc DeltaAICc weight
- Year Stratum Stratum 8 20900.00 0.000 0.592- Year Year Stratum 9 20902.16 2.15 0.201Year Year Stratum Stratum 10 20902.78 2.77 0.148Year Year Year Stratum 11 20904.84 4.83 0.052

CURRENT MODEL RESULTS
Survival (S) Resight (p) Movement (Psi)
Reporting rate (r)
Npar AICc DeltaAICc weight
Stratum+Season
Stratum Stratum+Season
Stratum 40 19269.76 0.000 9.3e-1
Stratum+Season
Stratum Stratum*Season
Stratum 40 19275.92 6.16 4.3e-2
Season Stratum Stratum*Season
Stratum 31 19279.04 9.28 9.03e-3
Stratum+Season
Stratum Stratum+Season
- 39 19281.60 11.84 2.5e-3
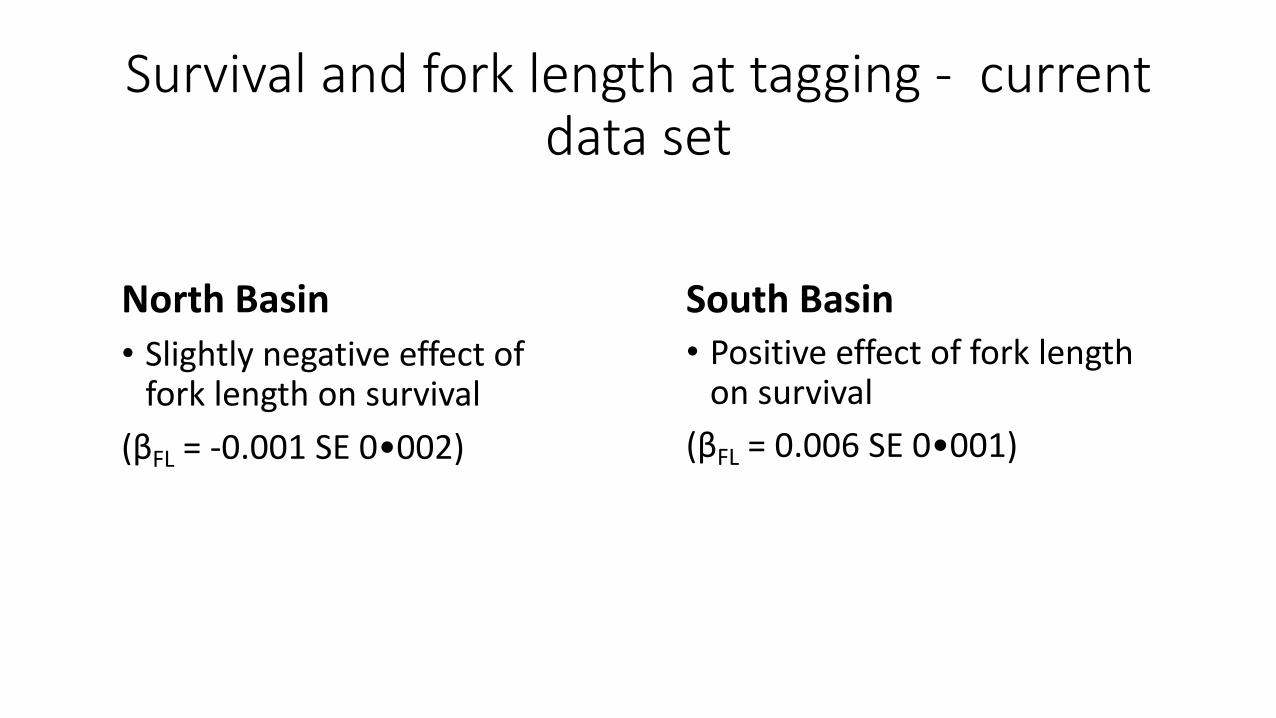
Survival and fork length at tagging - current data set
North Basin• Slightly negative effect of
fork length on survival (βFL = -0.001 SE 0•002)
South Basin• Positive effect of fork length
on survival (βFL = 0.006 SE 0•001)
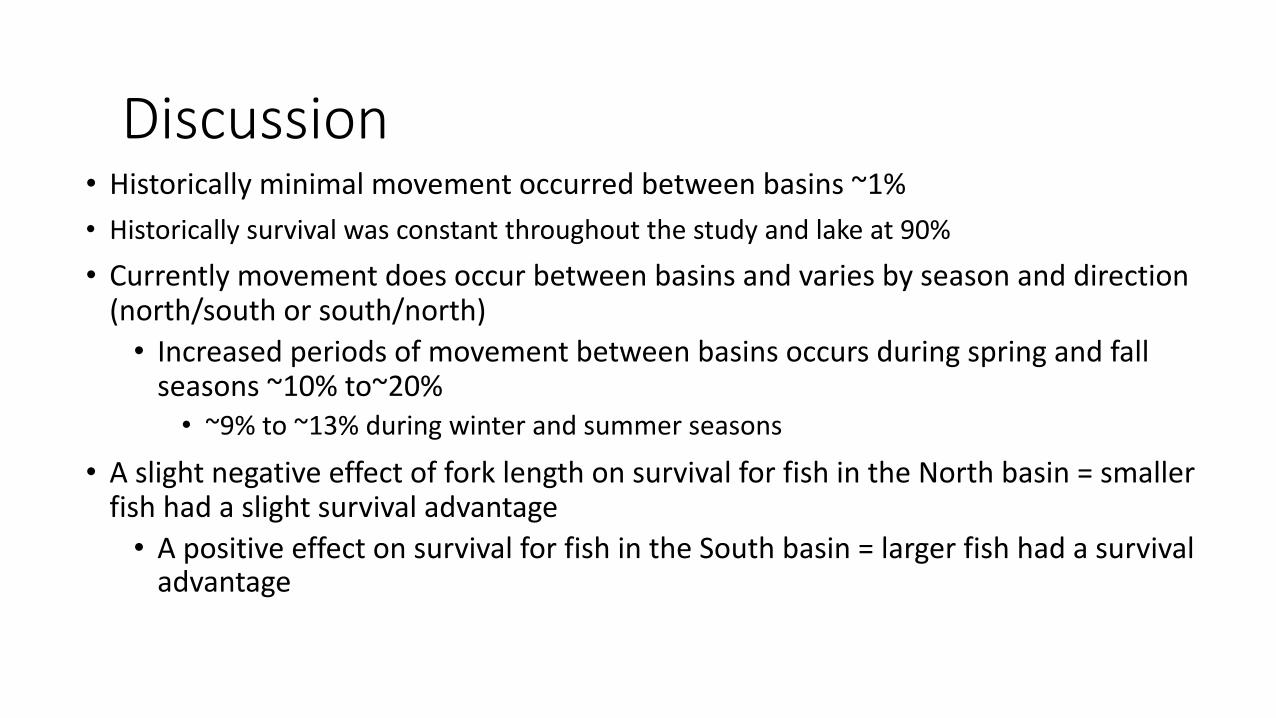
Discussion• Historically minimal movement occurred between basins ~1%• Historically survival was constant throughout the study and lake at 90%
• Currently movement does occur between basins and varies by season and direction (north/south or south/north)• Increased periods of movement between basins occurs during spring and fall
seasons ~10% to~20%• ~9% to ~13% during winter and summer seasons
• A slight negative effect of fork length on survival for fish in the North basin = smaller fish had a slight survival advantage• A positive effect on survival for fish in the South basin = larger fish had a survival
advantage
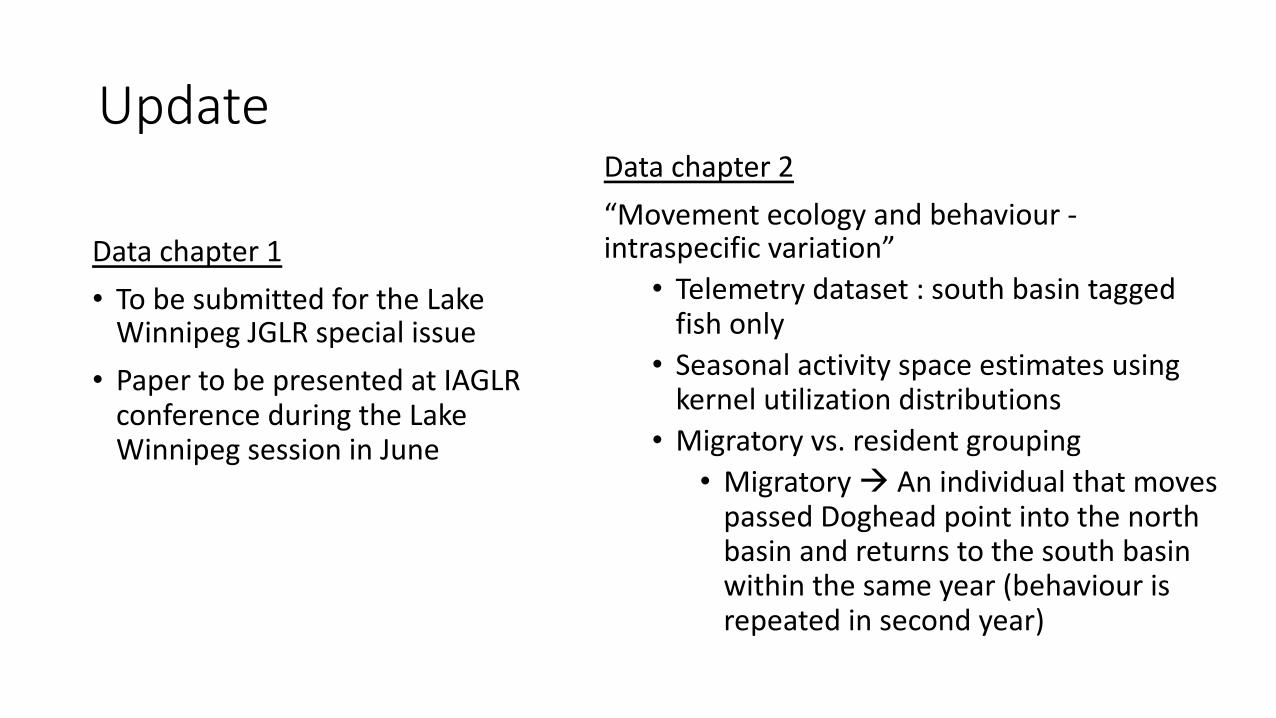
UpdateData chapter 2 “Movement ecology and behaviour -intraspecific variation”• Telemetry dataset : south basin tagged
fish only• Seasonal activity space estimates using
kernel utilization distributions• Migratory vs. resident grouping• Migratory à An individual that moves
passed Doghead point into the north basin and returns to the south basin within the same year (behaviour is repeated in second year)
Data chapter 1 • To be submitted for the Lake
Winnipeg JGLR special issue• Paper to be presented at IAGLR
conference during the Lake Winnipeg session in June
Funding and Acknowledgements
22
Geoff Klein
Dr. Eva EndersDoug WatkinsonDoug LerouxColin CharlesTyana RudolfsenColin KovachikSarah Glowa
Dr. Jen JefferyMatt Thorstensen