Argonne National Laboratory is managed by The University of Chicagofor the U.S. Department of Energy
Updated Energy and Greenhouse Gas Emissions Results of Fuel Ethanol
Michael WangCenter for Transportation ResearchEnergy Systems DivisionArgonne National Laboratory
The 15th International Symposium on Alcohol FuelsSan Diego, CASeptember 26-28, 2005

2
U.S. Fuel Ethanol Production Has Experienced Large Increases, and the Trend Will Continue
0
1000
2000
3000
4000
5000
6000
7000
8000
1980
1981
1982
1983
1984
1985
1986
1987
1988
1989
1990
1991
1992
1993
1994
1995
1996
1997
1998
1999
2000
2001
2002
2003
2004
2005
2006
2007
2008
2009
2010
2011
2012
Mill
ions
of g
allo
ns
Actual ProductionEnergy Bill Requirement
Source: Renewable Fuels Association

3
Argonne Has Conducted Life Cycle Analyses of Transportation Fuels for More Than 25 Years
Its Center for Transportation Research has analyzed energy and emission effects of transportation fuels for DOE since 1980s
With DOE support, Argonne began to develop the GREET model in 1995
GREET is a life cycle model for transportation fuels and vehicletechnologies
It contains more than 85 transportation fuel pathways including four fuel ethanol pathways
GREET is in the public domain; there are more than 2,000 registered users worldwide
Since 1997, Argonne has used GREET to evaluate fuel ethanol’s energy and emission effects; this presentation summarizes updated GREET results for fuel ethanol

4
Comparative Results Between Ethanol and Gasoline Are More Relevant to Policy Debate

5
Even Though Electricity Has a Large Negative Net Energy Balance, There Is No Substitute for Its Main Uses
Coal Mining
CoalTransportation
NGProcessing
NGTransmission
NGRecovery
Coal NG
Diesel FuelElectricity
NG
Diesel Fuel
NGElectricity
LPG, NGLs
NGElectricity
Electricity Generation
Electricity Transmissionand Distribution (8% loss)
1 mm Btu of Electricityat Wall Outlets
Uranium Ore Recovery Petroleum
Recovery
Uranium Petroleum
Uranium OreTransportation
PetroleumTransportation
OtherPetroleumProducts
Residual Oil
ElectricityDiesel Fuel
NG
Uranium Enrichment
Petroleum Refinery
Electricity
Refinery Gas
CoalNG
Uranium Fuel Transportation
Residual Oil TransportationDiesel Fuel
Residual Oil
ElectricityNG
Diesel FuelElectricity
NG
U.S. Electricity Generation:2.34 mm Btu Fossil Energy Input
for each 1.00 mm Btu Electricity Output

6
Energy in Different Fuels Can Have Very Different Qualities
Increase in Energy Quality
Fossil Energy Ratio (FER) = energy in fuel/fossil energy input
10.31
1.36
0.980.81
0.45
0.0
0.5
1.0
1.5
2.0
Cell. EtOH Corn EtOH Coal Gasoline Electricity

7
Accurate Ethanol Energy Analysis Must Account for Increased Productivity in Farming Over Time
Based on historical USDA data; results are 3-year moving averages
0.30
0.35
0.40
0.45
0.50
0.55
0.60
0.65
1965 1970 1975 1980 1985 1990 1995 2000 2005
Bus
hels
/lb. F
ertil
izer
?
Precision farming, etc.?
U.S. Corn Output Per Pound of Fertilizer Has Risen by 70% in The Past 35 Years

8
Improved Technology Has Reduced Energy Use and Operating Costs in Corn Ethanol Plants
Source: from Argonne’s discussions with ethanol plant designers, recent USDA data, and other reported data.
0
10,000
20,000
30,000
40,000
50,000
60,000
70,000
Btu
/Gal
lon
Wet Mill Dry Mill
1980s2000s

9
One-Third of Corn Kernel Mass Ends as Animal Feed (a Co-Product) in Ethanol Plants
Protein
Dis
tille
rs D
ry
Gra
ins
and
Solu
bles
(DD
GS)
EthanolStarch
Carbon Dioxide
Dairy: 46%
Beef: 39%
Poultry: 4%
Swine: 11%
2003 North American DDGS Consumption
Source: Commodity Specialist Co. (in RFA, 2005)

10
Accounting for Animal Feed Is a Critical Factor in Ethanol’s Lifecycle Analysis Allocation Method Wet milling Dry milling Weight 52% 51% Energy content 43% 39% Process energy 36% 41% Market value 30% 24% Displacement ~16% ~20%
• Weight and energy methods are no longer used• Argonne uses the displacement method, the most conservative approach• Some studies do not consider co-products at all

11
Cellulosic Ethanol Plants Will Be Significantly More Efficient than Corn Ethanol Plants
Steam
Biomass Feedstock Pretreatment Fermentation Separation
Power Plant: Gas and/or Steam Turbine Electricity Effluent
Discharge
Emissions
Fuel Ethanol
Wastewater
Emissions Emissions
EmissionsSolid Residue and Methane Wastewater
Treatment
Plants under intensive R&D efforts are designed to use the unfermentable portion of biomass to generate steam and electricity.

12
0.0
0.5
1.0
1.5
2.0
2.5
RFG CornEtOH:
DM
CornEtOH:
WM
Cell.EtOH
RFG CornEtOH:
DM
CornEtOH:
WM
Cell.EtOH
RFG CornEtOH:
DM
CornEtOH:
WM
Cell.EtOH
Btu for Fuel ProductionBtu in Fuel
Energy Effects of Fuel Ethanol Depend on the Type of Energy Being Analyzed
Total Btu Spent for One Btu of Gasoline and Ethanol Available at Fuel Pumps
Total Energy
Fossil Energy
Petroleum Energy

13
Use of Ethanol to Replace Gasoline Results in Fossil Energy and Petroleum Reduction Benefits
2.1% 4.7%
24.3%
52.3%
-3.2% -6.5%
-32.9%
-69.1%
-6.3% -6.3%
-69.5% -70.0%
-80%
-60%
-40%
-20%
0%
20%
40%
60%
E10 GV:CornEtOH
E10 GV:Cell.EtOH
E85FFV:CornEtOH
E85FFV:Cell.EtOH
E10 GV:CornEtOH
E10 GV:Cell.EtOH
E85FFV:CornEtOH
E85FFV:Cell.EtOH
E10 GV:CornEtOH
E10 GV:Cell.EtOH
E85FFV:CornEtOH
E85FFV:Cell.EtOH
Total Energy
Fossil Energy Petroleum Energy
Change in Per-Mile Energy Use by Ethanol Blend to Displace Gasoline

14
Ethanol Blends, Especially E85 Made from Cellulosic Ethanol, Can Significantly Reduce GHG Emissions
Reductions in Per-Mile GHG Emissions by Ethanol Blend to Displace Gasoline
-2% -2%-6%
-23%-17%
-64%
-80%
-60%
-40%
-20%
0%
E10 GV: DMCorn EtOH
E10 GV: WMCorn EtOH
E10 GV: Cell.EtOH
E85 FFV: DMCorn EtOH
E85 FFV: WMCorn EtOH
E85 FFV:Cell. EtOH

15
Corn EtOH Reduces GHGs by 18-29% While Cellulosic EtOHYields 85-86% Reduction, on Per Gallon Basis of EtOH Used
GHG Emission Reductions Per Gallon of Ethanol to Displace An Energy-Equivalent Amount of Gasoline
-26%-18%
-85%
-29%-21%
-86%
-100%
-80%
-60%
-40%
-20%
0%
E10 GV: DMCorn EtOH
E10 GV: WMCorn EtOH
E10 GV: Cell.EtOH
E85 FFV: DMCorn EtOH
E85 FFV: WMCorn EtOH
E85 FFV: Cell.EtOH

16
Most of the Recent Corn EtOH Studies Show a Positive Net Energy Balance
-120,000
-100,000
-80,000
-60,000
-40,000
-20,000
0
20,000
40,000
60,000
1978 1980 1982 1984 1986 1988 1990 1992 1994 1996 1998 2000 2002 2004 2006
Net
Ene
rgy
Val
ue (B
tu/g
allo
n)
Ho
Marland&Turhollow
Pim ente l
Pim ente lKeeney&DeLuca
Lorenz&Morris
Shapouri e t al.
Wang et al.
Agri. Canada
Kim &DaleGraboski
Wang
Pim ente l
Shapouri e t al.
Pim entel&Patzek
Weinblatt e t al.
NR Canada
Cham bers et al.
Patzek
DelucchiKim &Dale
Wan
g
GRE
ET
w/P
imen
tel
Ass
umpt
ions
Energy balance here is defined as Btu content a gallon of ethanol minus fossil energy used to produce a gallon of ethanol
17
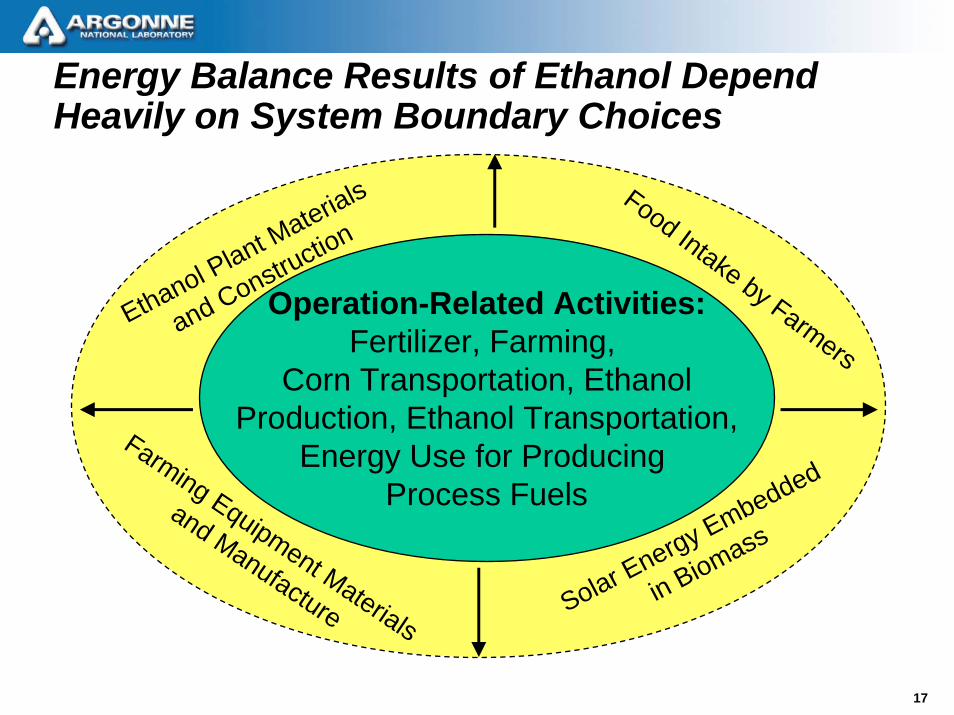
Energy Balance Results of Ethanol Depend Heavily on System Boundary Choices
Operation-Related Activities:Fertilizer, Farming,
Corn Transportation, EthanolProduction, Ethanol Transportation,
Energy Use for Producing Process Fuels
Farming Equipment Materials
and Manufacture
Ethanol Plant Materials
and ConstructionFood Intake by Farmers
Solar Energy Embedded
in Biomass

18
The Debate on Energy Balance Itself May Have Little Practical MeaningThough self evaluation of a fuel’s energy balance is easy to understand, to do so for a fuel in isolation could be arbitraryAll Btus are not created equal. The energy sector has been converting low-value Btus into high-value Btus, with energy lossesSociety has not made energy choice decisions on the basis of energy balance values of individual energy productsIssues of concern, such as petroleum consumption and GHG emissions, should be analyzed directly for fuel alternativesA complete, robust way of evaluating a fuel’s effects is to compare the fuel (e.g., ethanol) with those to be displaced (e.g., gasoline)

19
Most Studies on GHG Emissions Show GHG Emission Reduction by Corn EtOH as Compared to Gasoline
-80%
-60%
-40%
-20%
0%
20%
40%
60%
80%
100%
EPA (1990
): E100
EPA (1990
): E85
Ho (199
0): E10
0
Marland
(199
1): E10
0
Delucch
i (199
1): E10
0
Ahmed
(1994
): E100
Delucch
i (199
6): E95
Wang (1
996):
E100
Wang (1
996):
E85
Wang (1
997):
E85
Agri. C
an. (1
999):
E85
Delucch
i (200
1): E90
Wang (2
003):
E85
Deluchi (2
003):
E90
Wang (2
005):
E100
Kim&Dale
(2005):
E100
NR Can
ada (2
005):
E100
GHG
Cha
nges

20
Of the 11.8 Billion Bushels of Corn Produced in U.S. in 2004, About 12% Was Used for Ethanol Production
The U.S. produced 3.41 billion gallons of fuel ethanol in 2004, equivalent to 2.28 billion gallons of gasoline
In 2003, the U.S. consumed 134 billion gallons of gasoline and 39 billion gallons of on-road diesel fuels
Source: ERS/USDA, 2004, Feed Outlook (in RFA, 2005); EIA
Feed/Residual: 56.4%
Export: 18.5%
Ethanol: 11.7%
High Fructose Corn Syrup: 5.2%
Starch: 2.7%
Sweeteners: 2.2%
Cereal/Other: 1.8%
Beverage/Industrial Alcohol: 1.3%
Seed: 0.2%
U.S. Corn Usage by Segment 2004

21
0
20
40
60
80
100
120
products industry
wastes
Forest growth
Fuel treatm
ents (forestla
nds)
Logging and other residues
Urban wood residues
Fuelwood
Fore
st
A Recent Study by Oak Ridge National Laboratory Concludes 1.3 Billion Tons of Biomass Available in U.S. Per Year
0
100
200
300
400
Perennial crops
Corn stover
Grains to biofuels
Whea t stra
w
Soybeans
Othe r crop re
s idues
Othe r residues
Manures
CRP biomass
Sma ll gra in re
sidues
Mil.
dry
tons
per
yea
r
Total: 998 mil. Dry tonsTotal: 368 mil. Dry tons

22
The Energy Bill Encourages Production of Cellulosic Ethanol
Creates a credit-trading program where 1 gallon of cellulosic ethanol is equal to 2.5 gallons of renewable fuelCreates a program for production of 250 million gallons of cellulosic ethanol in 2013 Creates a Loan Guarantee Program of $250 million per facilityCreates a $650 million Grant Program for cellulosic ethanolCreates an Advanced Biofuels Technologies Program of $550 million
Information is courtesy of the Renewable Fuels Association

23
ConclusionsEnergy balance value for a given energy product alone is not meaningful in evaluating its benefit
Any type of fuel ethanol helps substantially reduce fossil energy and petroleum use, relative to petroleum gasoline
Corn-based fuel ethanol achieves moderate reductions in GHG emissions
Cellulosic ethanol can achieve much greater energy and GHG benefits