Update on the Treatment of Latent M. tuberculosis Infection
Timothy R. Sterling, M.D.March 30, 2016

Objectives
• Discuss current options regarding the treatment of latent TB infection, including recent WHO and upcoming ATS/CDC/IDSA guidelines, to increase provider knowledge and awareness
• Illustrate the treatment effectiveness, tolerability, and safety of treatment modalities for LTBI to enrich provider and patient knowledge to increase treatment compliance.

Treatment of latent M. tuberculosis infection
• Epidemiology of M. tuberculosis infection– Contribution of latent infection to TB disease burden
• TB elimination– Target and projections
• Current treatment regimens– World Health Organization guidelines– ATS/CDC/IDSA guidelines
• M. tuberculosis and HIV– Isoniazid, antiretroviral therapy
Question 1
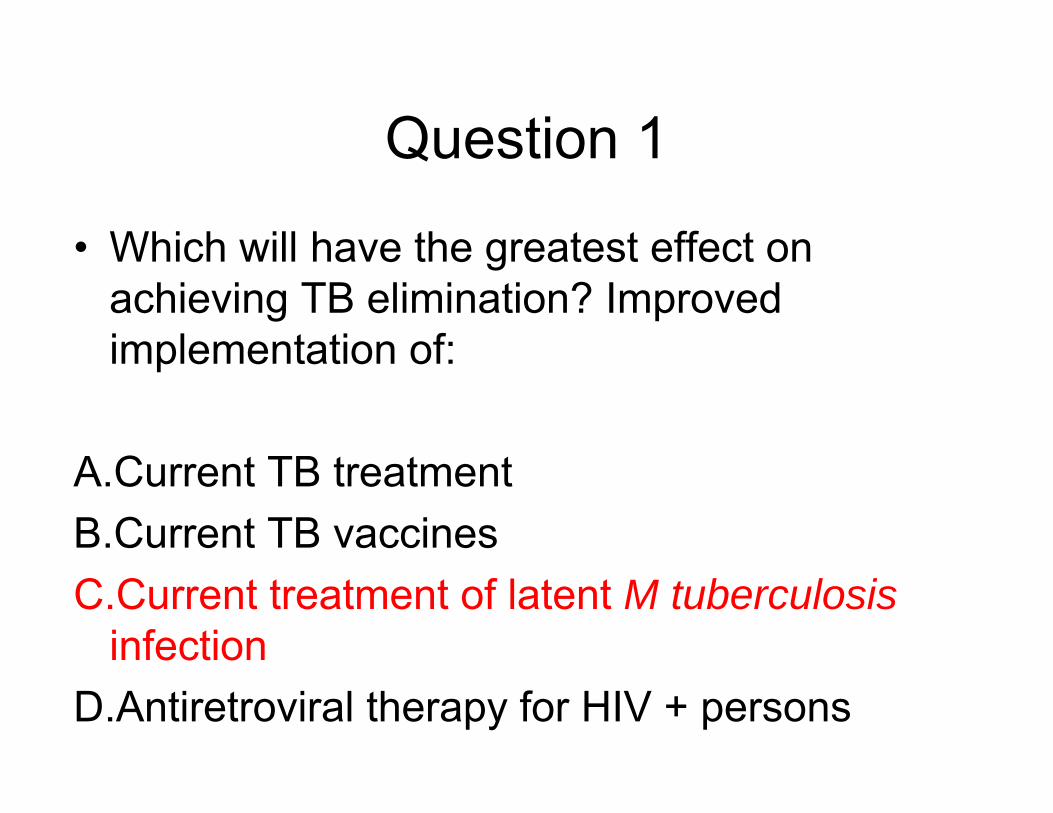
• Which will have the greatest effect on achieving TB elimination? Improved implementation of:
A.Current TB treatmentB.Current TB vaccinesC.Current treatment of latent M tuberculosis
infectionD.Antiretroviral therapy for HIV + persons

Latent M. tuberculosis infection and contribution to TB burden
• The global burden of latent M. tuberculosis infection is enormous.– More than 2 billion people (33%) infected
• Raviglione MD. JAMA 1995;273:220-6. Dye C et al. JAMA 1999;282:677-86
• From this reservoir, millions of people will develop active TB– 100-200 million cases

Prevalence of latent M. tuberculosis infection in the U.S.
2011-2012
Method Estimated Prevalence
Estimated # Persons Infected
TST 4.4 – 4.7% 12,398,000
QuantiFERON-Gold In-tube
4.8 – 5.0% 13,628,000
• Based on the NHANES Survey• Not significantly different than 1999 – 2000• Prevalence in foreign-born: ~18%; U.S.-born: ~2%
Miramontes R. PLoS ONE 2015:10 (11):e0140881Mancuso JD. Am J Respir Crit Care Med 2016 Feb 11.Ghassemieh BJ. Am J Respir Crit Care Med 2016 Feb 18.

Schematic: development of TB infection and disease,
United States—1963
Ferebee SH. Bull Nat Tuberc Assoc 1967;53:4-7.
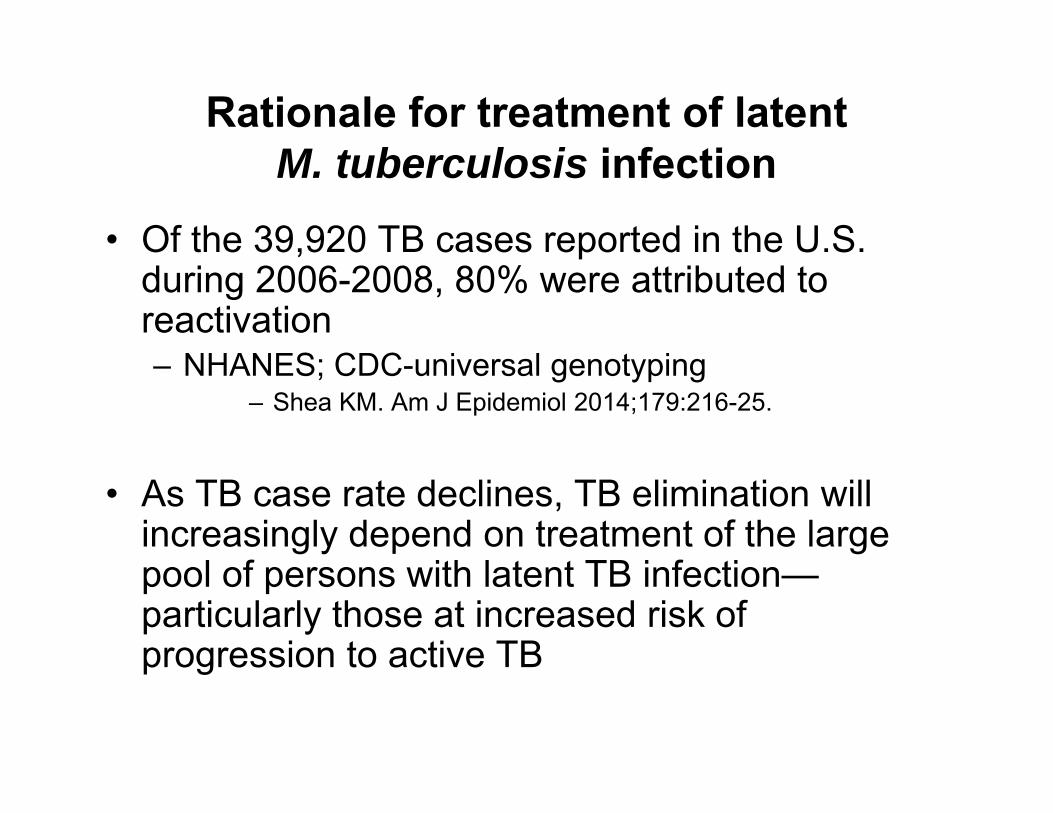
Rationale for treatment of latent M. tuberculosis infection
• Of the 39,920 TB cases reported in the U.S. during 2006-2008, 80% were attributed to reactivation – NHANES; CDC-universal genotyping
– Shea KM. Am J Epidemiol 2014;179:216-25.
• As TB case rate declines, TB elimination will increasingly depend on treatment of the large pool of persons with latent TB infection—particularly those at increased risk of progression to active TB
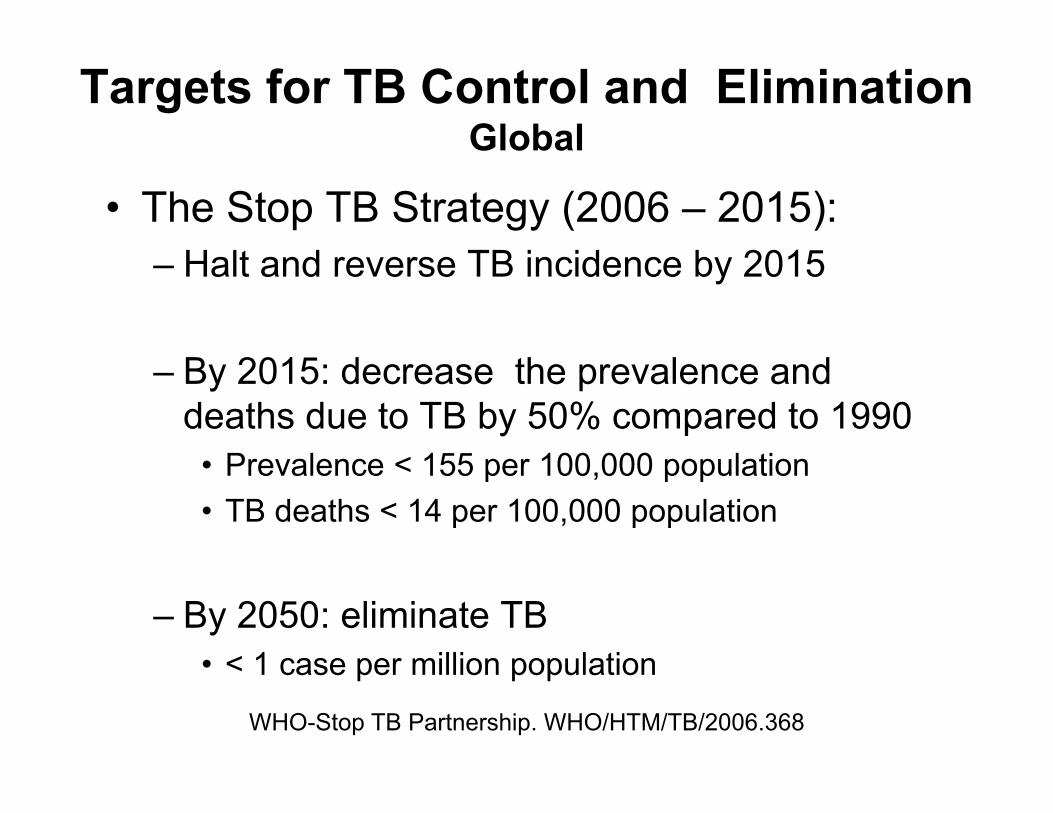
Targets for TB Control and EliminationGlobal
• The Stop TB Strategy (2006 – 2015):– Halt and reverse TB incidence by 2015
– By 2015: decrease the prevalence and deaths due to TB by 50% compared to 1990
• Prevalence < 155 per 100,000 population• TB deaths < 14 per 100,000 population
– By 2050: eliminate TB• < 1 case per million population
WHO-Stop TB Partnership. WHO/HTM/TB/2006.368

Incidence: 9.6 million cases; 133/100,000 populationPrevalence: 42% lower than 1990 (13 million; 174/100,000)Mortality: 47% lower than 1990 (1.5 million; 16/100,000)

Targets for TB Control and EliminationGlobal
• The End TB Strategy (2016 – 2035):
Global Tuberculosis Report 2015. WHO/HTM/TB/2015.22
Indicator Milestone Target
Year 2020 2025 2030 2035
Reduction in # TB deaths compared with 2015
35% 75% 90% 95%
Reduction in TB incidence
compared with 2015
20%<85/100,000
50%<55/100,000
80%<20/100,000
90%<10/100,000
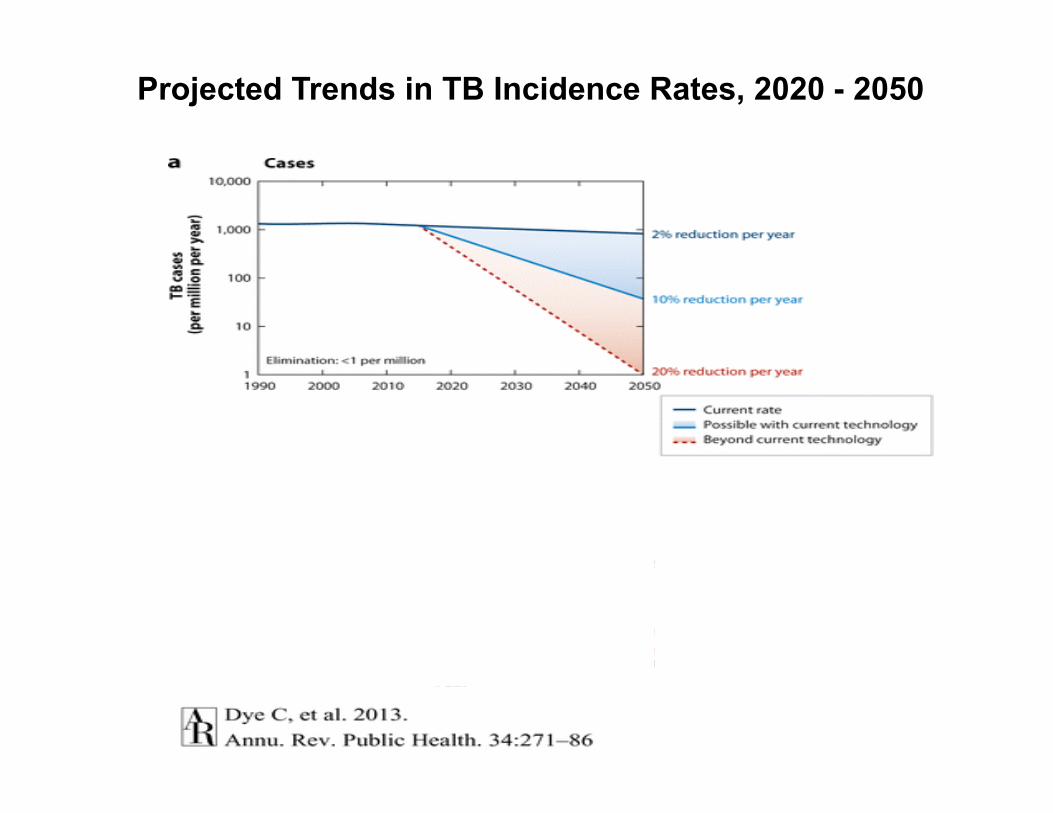
Projected Trends in TB Incidence Rates, 2020 - 2050

Screening for and Treating LTBIEffect on TB incidence
• Identify persons with M. tuberculosis infection• TB risk if IGRA+ vs. IGRA-: pooled IRR: 2.11• TB risk if TST+ vs. TST-: pooled IRR: 1.60
– Rangaka MX. Lancet Infect Dis 2012;12:44-55.• Implies 44-51% of TB patients would be IGRA or TST+• If treatment of LTBI is 65% effective, there would be 29-33% ↓ in TB
incidence if complete coverage– Dowdy DW, Golub JE. Lancet Infect Dis 2012;12:827-8.
• Similar to Bethel, Alaska (30% ↓)– Comstock GW. ARRD 1967;95:935-43.
• Household contact tracing• If performed contact tracing of all household contacts for 5 years and
treated LTBI: 17-27% ↓ in TB incidence– Kassaue P. Am J Respir Crit Care Med 2014;189:845-52.

2015 WHO GuidelinesTreatment of latent tuberculosis
High or middle income countries; TB incidence < 100 / 100,000
• Systematic testing and treatment of latent infection should be performed in:– Persons living with HIV– Adult and child contacts of pulmonary TB– Patients initiating TNF-alpha blockers– Persons on dialysis– Persons who will receive organ or hematologic transplantation– Persons with silicosis
• Test with either an IGRA or tuberculin skin test• Treatment options:
– 6-9 months of INH– 3 months of INH + RPT– 3-4 months of INH + RIF– 3-4 months of RIF
WHO/HTM/TB/2015.01. Getahun H. Eur Repir J 2015;46:1563-76.

0
10
20
30
40
50
60
70
9H 6H 4R
Months of LTBI Treatment
Perc
ent C
ompl
etio
n
Overall treatment completion rate: 47%68 clinics in the U.S. and Canada in 2002
Completion rate increased as regimen duration decreased
Horsburgh CR Chest 2010;137:401-9.
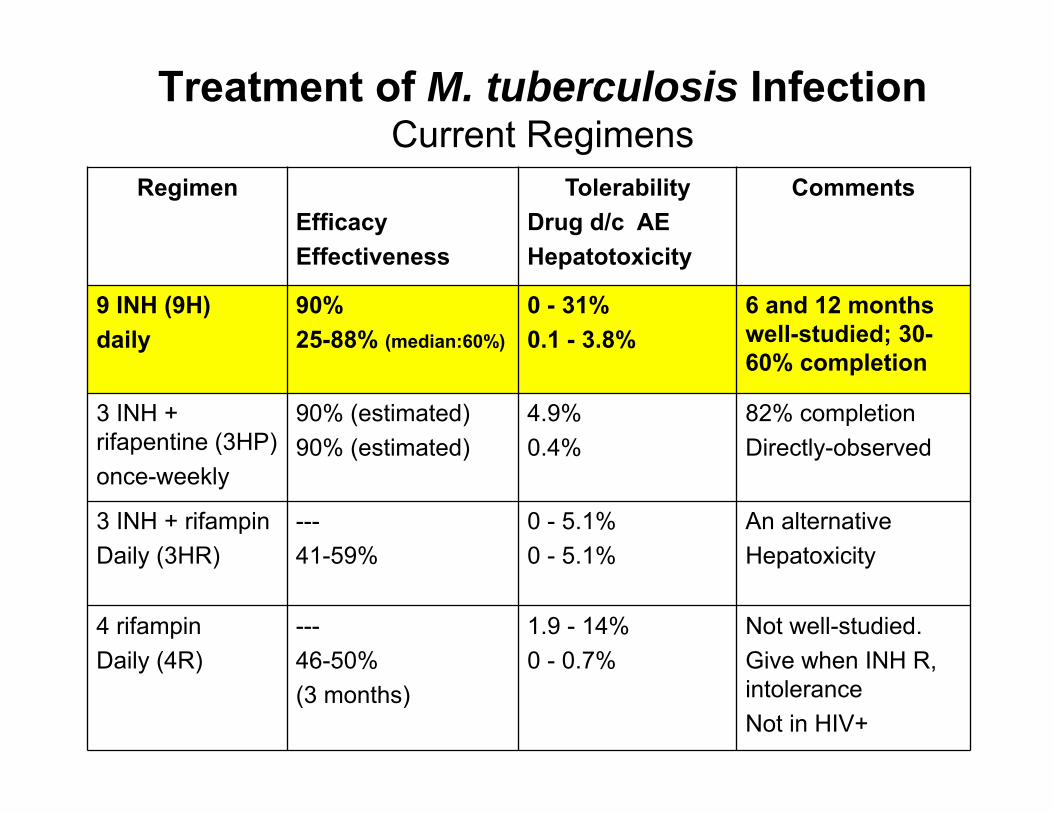
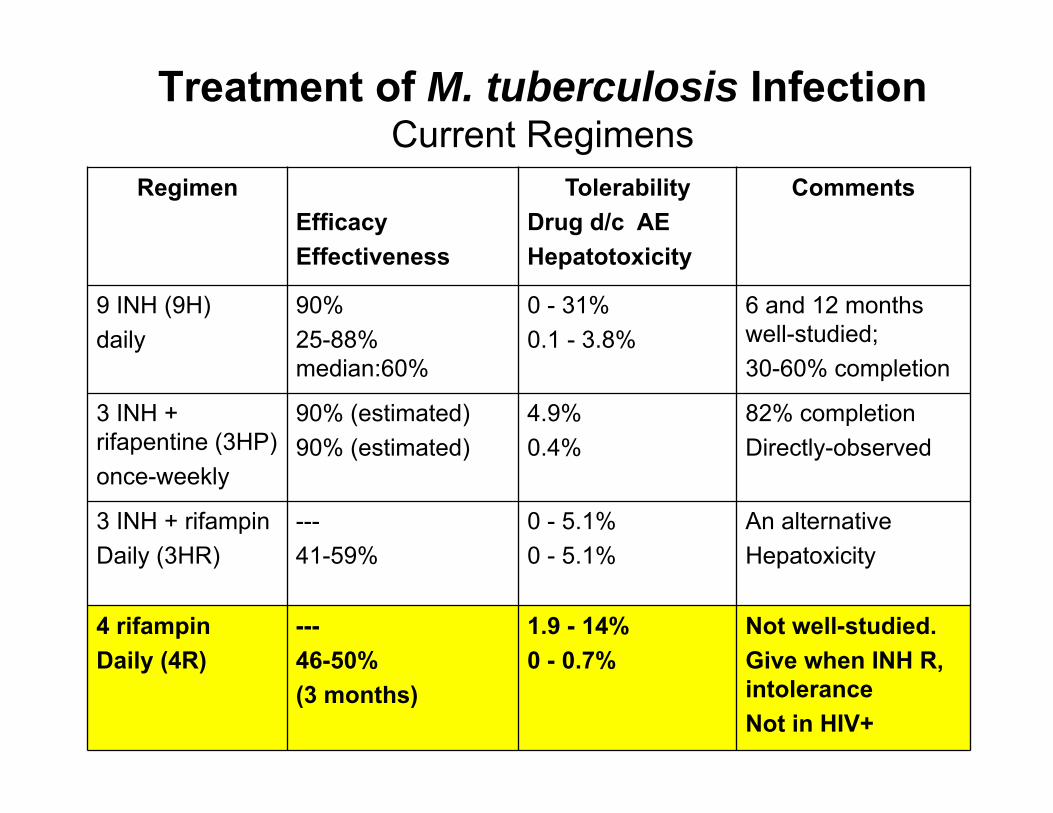
Treatment of M. tuberculosis InfectionCurrent Regimens
RegimenEfficacyEffectiveness
TolerabilityDrug d/c AEHepatotoxicity
Comments
9 INH (9H)daily
90%25-88% (median:60%)
0 - 31%0.1 - 3.8%
6 and 12 months well-studied; 30-60% completion
3 INH + rifapentine (3HP)once-weekly
90% (estimated)90% (estimated)
4.9%0.4%
82% completionDirectly-observed
3 INH + rifampinDaily (3HR)
---41-59%
0 - 5.1%0 - 5.1%
An alternativeHepatoxicity
4 rifampinDaily (4R)
---46-50% (3 months)
1.9 - 14%0 - 0.7%
Not well-studied. Give when INH R, intolerance Not in HIV+
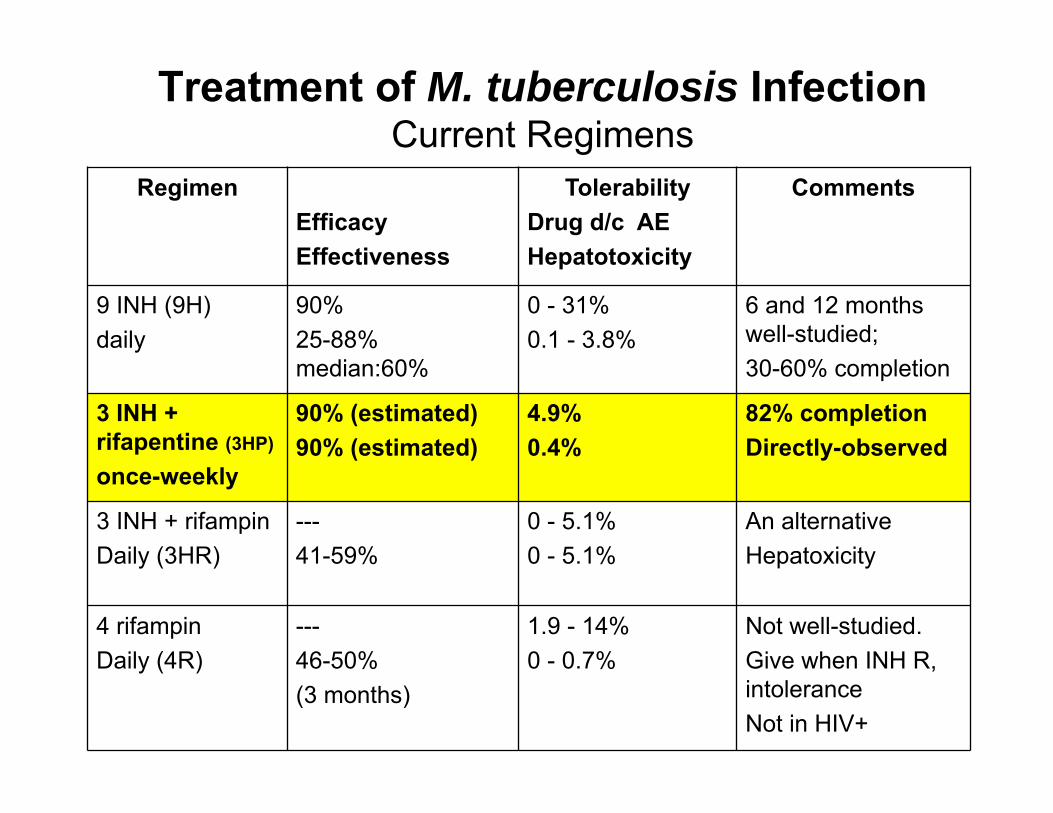
Treatment of M. tuberculosis InfectionCurrent Regimens
RegimenEfficacyEffectiveness
TolerabilityDrug d/c AEHepatotoxicity
Comments
9 INH (9H)daily
90%25-88% median:60%
0 - 31%0.1 - 3.8%
6 and 12 months well-studied; 30-60% completion
3 INH + rifapentine (3HP)
once-weekly
90% (estimated)90% (estimated)
4.9%0.4%
82% completionDirectly-observed
3 INH + rifampinDaily (3HR)
---41-59%
0 - 5.1%0 - 5.1%
An alternativeHepatoxicity
4 rifampinDaily (4R)
---46-50% (3 months)
1.9 - 14%0 - 0.7%
Not well-studied. Give when INH R, intolerance Not in HIV+

Treatment of M. tuberculosis InfectionCurrent Regimens
RegimenEfficacyEffectiveness
TolerabilityDrug d/c AEHepatotoxicity
Comments
9 INH (9H)daily
90%25-88% median:60%
0 - 31%0.1 - 3.8%
6 and 12 months well-studied; 30-60% completion
3 INH + rifapentine (3HP)once-weekly
90% (estimated)90% (estimated)
4.9%0.4%
82% completionDirectly-observed
3 INH + rifampin (3HR)daily
---41-59%
0 - 5.1%0 - 5.1%
An alternativeHepatoxicity
4 rifampin (4R)daily
---46-50% (3 months)
1.9 - 14%0 - 0.7%
Not well-studied. Give when INH R, intolerance Not in HIV+
Treatment of M. tuberculosis InfectionCurrent Regimens
RegimenEfficacyEffectiveness
TolerabilityDrug d/c AEHepatotoxicity
Comments
9 INH (9H)daily
90%25-88% median:60%
0 - 31%0.1 - 3.8%
6 and 12 months well-studied; 30-60% completion
3 INH + rifapentine (3HP)once-weekly
90% (estimated)90% (estimated)
4.9%0.4%
82% completionDirectly-observed
3 INH + rifampinDaily (3HR)
---41-59%
0 - 5.1%0 - 5.1%
An alternativeHepatoxicity
4 rifampinDaily (4R)
---46-50% (3 months)
1.9 - 14%0 - 0.7%
Not well-studied. Give when INH R, intolerance Not in HIV+

3 months of weekly isoniazid + rifapentine3HP
• Several studies have recently been published in special populations or settings: – Children– HIV-infected persons– Possible flu syndrome– Hepatotoxicity and hepatitis C virus infection– Self-administered vs. directly-observed therapy– Health department clinics, jails

Tolerability and Effectiveness in ChildrenTBTC S26 + IMPAACT
• Study 26 amended to enroll 352 additional children; 1,058 total There were 908 for efficacy evaluation
• Follow-up complete September 30, 2013• No hepatotoxicity, grade 4 events, or deaths
Villarino ME et al. JAMA Pediatr 2015;169(3):1-9.
Endpoint 3HPN=472
9HN=436
P-value
Treatmentcompletion
88% 81% 0.003
D/C—adverse drug reaction
2% 0.5% 0.11
Grade 3 toxicity 0.6% 0.2% 0.49TB 0 (0%) 3 (0.78%) Upper bound of
difference: 0.44%

Tolerability and Safety in HIV + PersonsTBTC S26 + ACTG 5259
• Study 26 amended to enroll 191 additional HIV+ persons; 403 total. There were 399 for efficacy evaluation. Median CD4 ~500
• Follow-up complete September 30, 2013Characteristic 3HP
N=2079HN=186
P-value
Treatment completion (MITT)
183/206 (89%) 123/193 (64%) <0.001
Discontinue—adverse drug reaction
7 (3%) 8 (4%) 0.79
Grade 3 toxicity 14 (7%) 18 (10%) 0.36
Grade 4 toxicity 4 (2%) 10 (5%) 0.10
Grade 5 (death) 6 (3%) 5 (3%) 1.00
Hepatotoxicity drug discontinuation
2 (1%) 8 (4%) 0.05
Possible flu syndrome
2 (1%) 0 (0%) 0.50
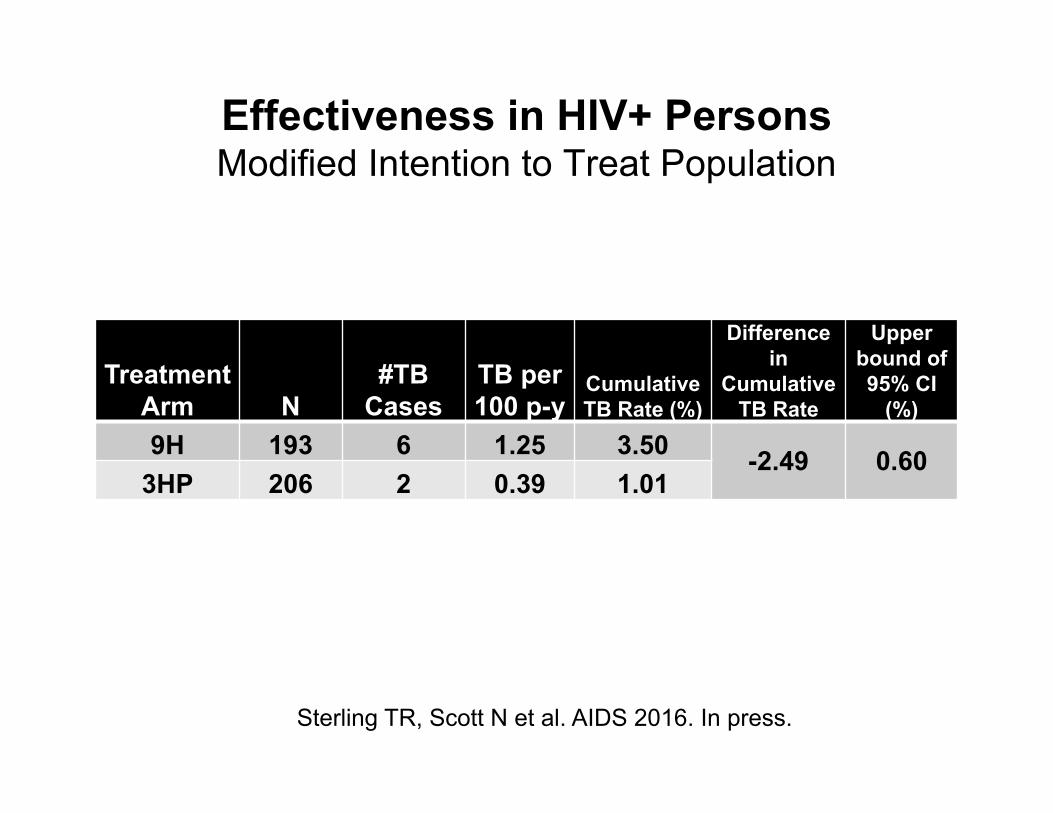
Effectiveness in HIV+ Persons Modified Intention to Treat Population
Treatment Arm N
#TB Cases
TB per 100 p-y
Cumulative TB Rate (%)
Difference in
Cumulative TB Rate
Upper bound of 95% CI
(%)
9H 193 6 1.25 3.50 -2.49 0.603HP 206 2 0.39 1.01
Sterling TR, Scott N et al. AIDS 2016. In press.

3HP in HIV-infected PersonsConclusions
• Among HIV-infected persons with median CD4 ~500 and not on antiretroviral therapy:– 3HP was as effective and safe for treatment of
latent M. tuberculosis infection as 9H, and better tolerated.
• 3HP should be considered for the treatment of latent tuberculosis infection in HIV-infected persons
Sterling TR, Scott N et al. AIDS 2016. In press.

Question 2• A 35 y.o. male with hepatitis C and EtOH
abuse is a close contact of a smear-positive TB case. His interferon gamma release assay is positive. He is asymptomatic; CXR negative. SGOT = 100; SGPT = 115. The best treatment option:
A.9 months of INHB.4 months of rifampinC.3 months of INH + rifampinD.3 months of once-weekly INH + rifapentine
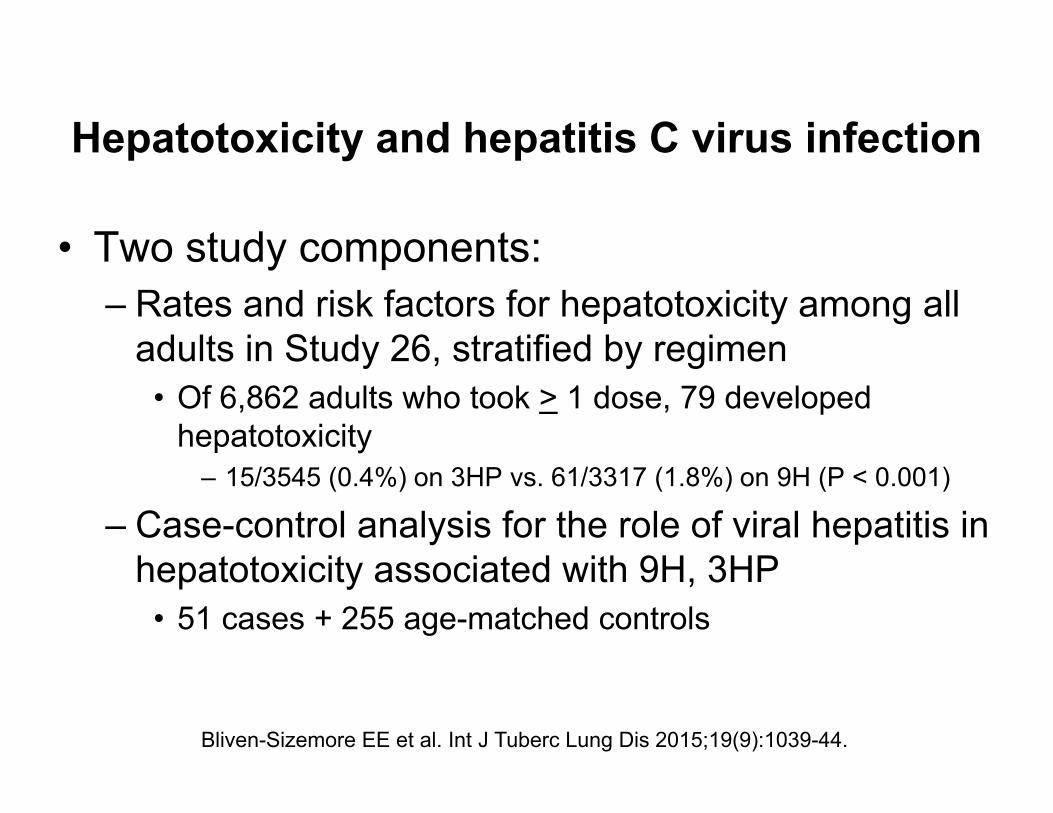
Hepatotoxicity and hepatitis C virus infection
• Two study components:– Rates and risk factors for hepatotoxicity among all
adults in Study 26, stratified by regimen• Of 6,862 adults who took > 1 dose, 79 developed
hepatotoxicity– 15/3545 (0.4%) on 3HP vs. 61/3317 (1.8%) on 9H (P < 0.001)
– Case-control analysis for the role of viral hepatitis in hepatotoxicity associated with 9H, 3HP
• 51 cases + 255 age-matched controls
Bliven-Sizemore EE et al. Int J Tuberc Lung Dis 2015;19(9):1039-44.

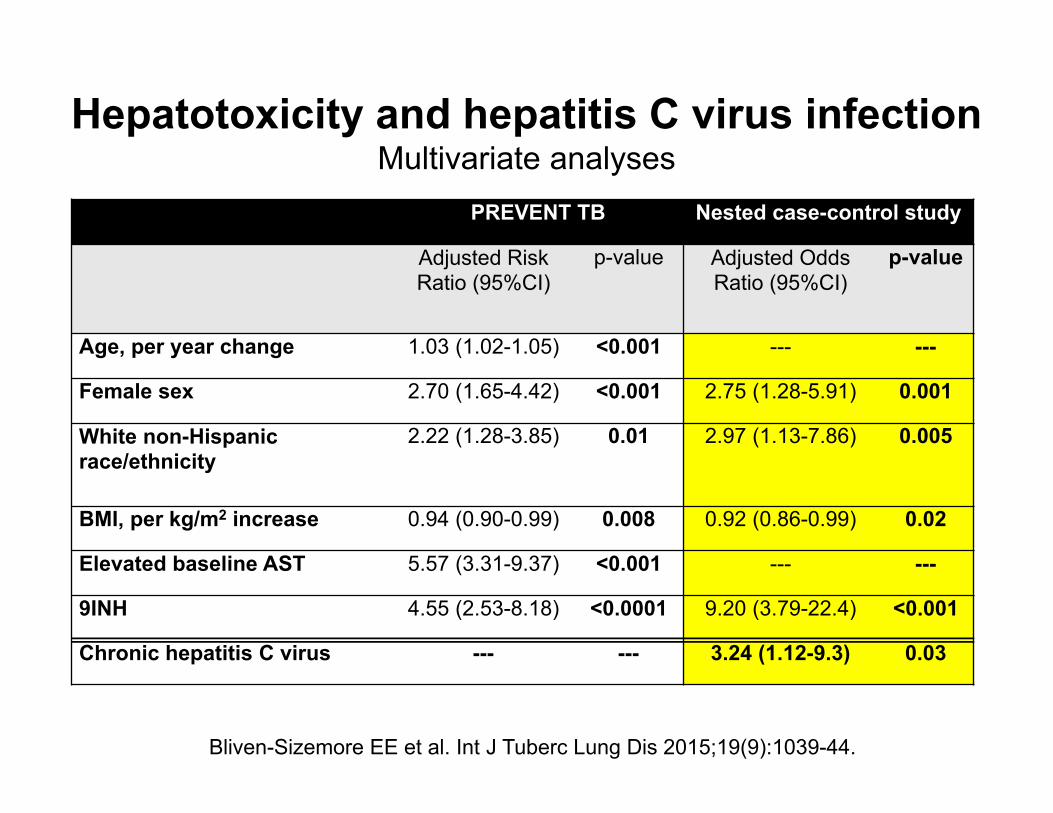
Hepatotoxicity and hepatitis C virus infectionMultivariate analyses
PREVENT TB Nested case-control study
Adjusted Risk Ratio (95%CI)
p-value Adjusted Odds Ratio (95%CI)
p-value
Age, per year change 1.03 (1.02-1.05) <0.001 --- ---
Female sex 2.70 (1.65-4.42) <0.001 2.75 (1.28-5.91) 0.001
White non-Hispanic race/ethnicity
2.22 (1.28-3.85) 0.01 2.97 (1.13-7.86) 0.005
BMI, per kg/m2 increase 0.94 (0.90-0.99) 0.008 0.92 (0.86-0.99) 0.02
Elevated baseline AST 5.57 (3.31-9.37) <0.001 --- ---
9INH 4.55 (2.53-8.18) <0.0001 9.20 (3.79-22.4) <0.001
Chronic hepatitis C virus --- --- 3.24 (1.12-9.3) 0.03
Bliven-Sizemore EE et al. Int J Tuberc Lung Dis 2015;19(9):1039-44.
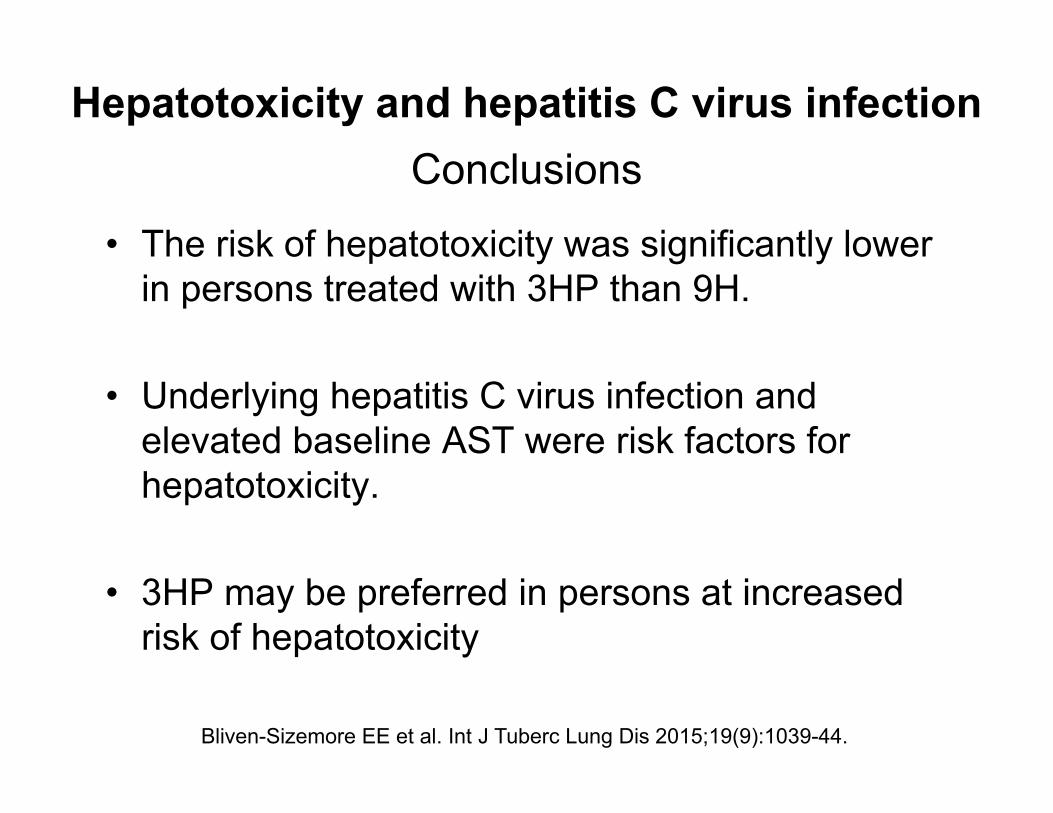
Hepatotoxicity and hepatitis C virus infectionConclusions
• The risk of hepatotoxicity was significantly lower in persons treated with 3HP than 9H.
• Underlying hepatitis C virus infection and elevated baseline AST were risk factors for hepatotoxicity.
• 3HP may be preferred in persons at increased risk of hepatotoxicity
Bliven-Sizemore EE et al. Int J Tuberc Lung Dis 2015;19(9):1039-44.

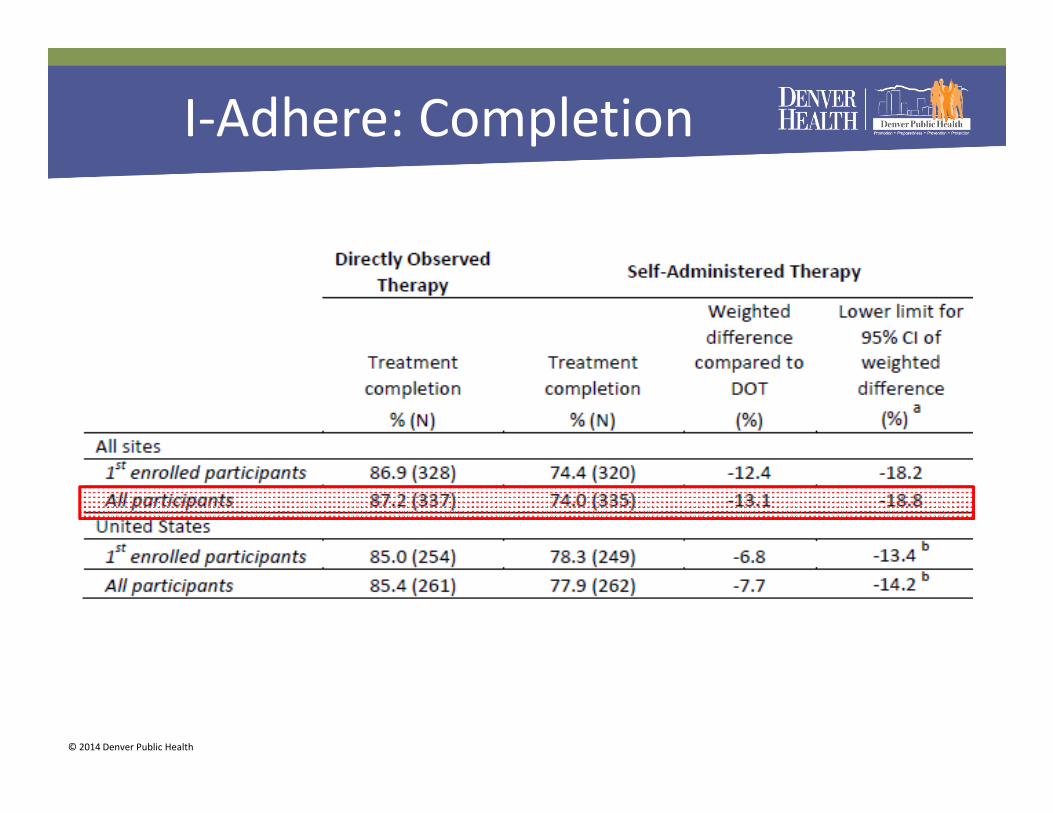
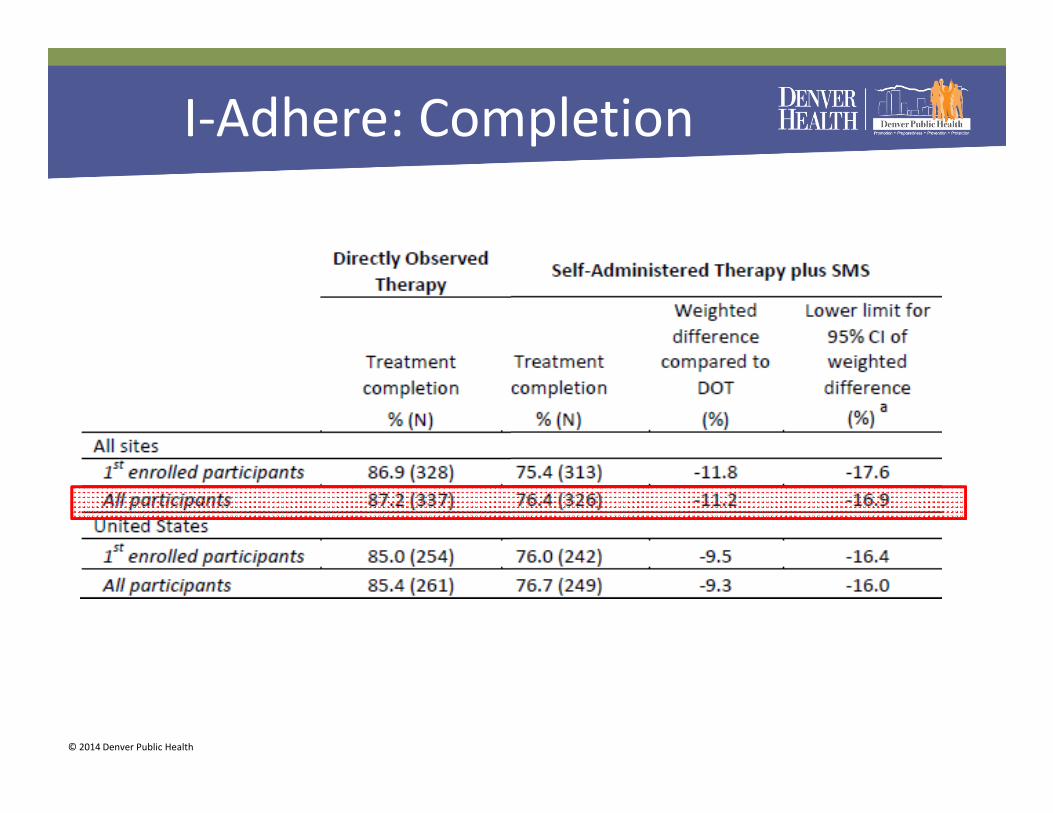
Self-administered once-weekly 3HPTB Trials Consortium Study 33
• International, open-label, randomized controlled trial of 3HP for treatment of M. tuberculosis infection
• Non-inferiority trial; margin 15%• MEMS caps to measure adherence
Belknap R. CROI 2015. Abstract 827LB.
Regimen N Completion rate Discontinuation due to AE
Directly observed 337 87% 3.6%Self-administered 337 74% 5.4%Self-admin with text message reminder
328 76% 4.3%
© 2014 Denver Public Health
I‐Adhere: Completion
© 2014 Denver Public Health
I‐Adhere: Completion
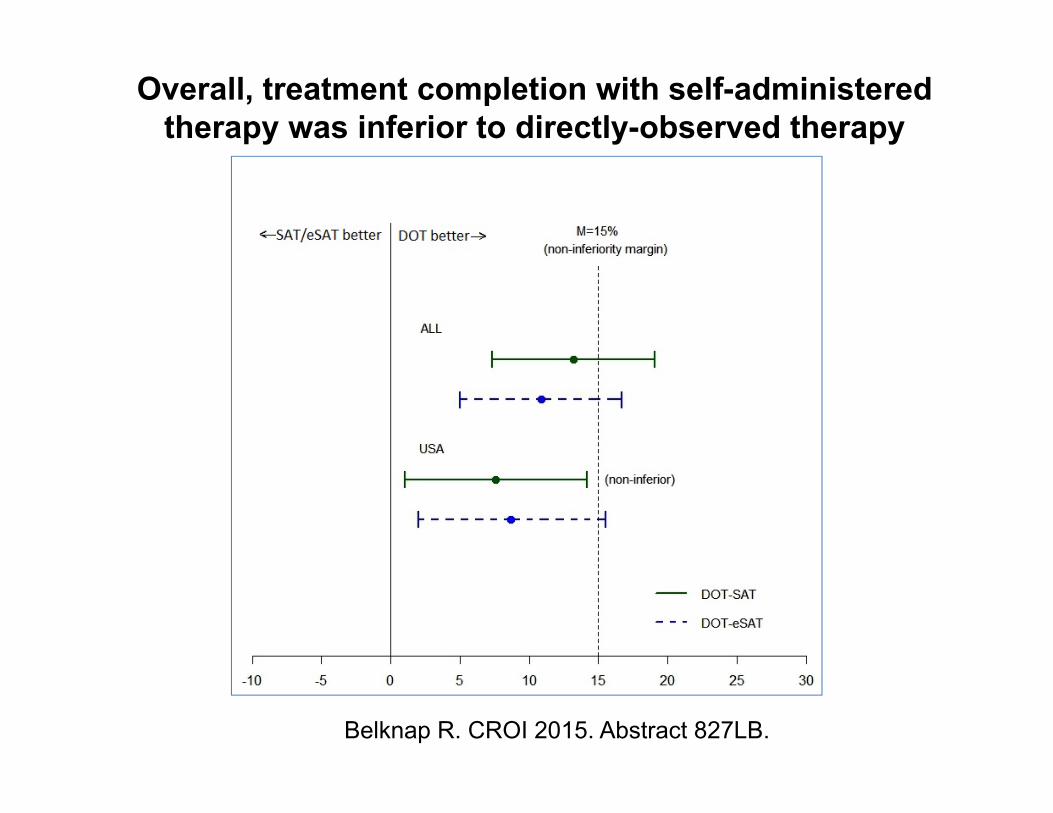
Overall, treatment completion with self-administered therapy was inferior to directly-observed therapy
Belknap R. CROI 2015. Abstract 827LB.

3HP in Operational Settings• New York City Health Department TB Clinics
– Among 631 persons eligible for treatment:• 503 (80%) offered 3HP
– 302 (60%) accepted– 92 (18%) chose other treatment ; 81 because of clinic-based DOT– 109 (22%) refused treatment
• Of the 302 who started 3HP, 196 (65%) completed– 46% treatment completion of other regimens (P < 0.01)– Historical estimates of treatment completion: 34%
» Stennis NL. Clin Infect Dis 2016;62;62(1):53-9.
• California: Urban County Jail– Among 91 persons who started 3HP, 77 (85%) completed
• 11 were transferred out of jail• 2 stopped because of rash• 1 had an unrelated illness and declined further treatment
» Juarez-Reyes M. Open Forum Infect Dis 2016 Jan 6;3(1):ofv220

Question 3
• 25 y.o. male with HIV (CD4 = 450) and a positive interferon gamma release assay. He is asymptomatic and has a negative CXR. The best treatment option to prevent TB:
A.Isoniazid aloneB.Antiretroviral therapy aloneC.Isoniazid + antiretroviral therapyD.No treatment necessary at this time

TB Prevention in HIVART and INH
• Observational study• Rio de Janeiro, Brazil• 11,026 HIV + persons receiving care at 29 public clinics,
Sept 2003-Sept 2005
Intervention TB per 100 p-yNo ART/no INH 4.01ART 1.90INH 1.27ART and INH 0.80
• After adjusting for age, previous TB, and baseline CD4, 76% in TB risk if received ART and INH compared to no ART/no INH
Golub J. AIDS 2007;21:1441-8.

INH + ART to prevent TBRandomized, double-blind placebo-controlled trial
• Khayelitsha, South Africa• Randomly assigned 12 months of INH (n=662) vs.
placebo (n=667) to persons on ART• Primary endpoint: time to incident TB
INH Placebo HR 95% CI• TB per 100 p-y 2.3 3.6 0.63 0.41,0.94• The beneficial effect of INH was not limited to those
who were TST+ or IGRA+• Without a more predictive test, authors suggest that
INH should be recommended to all patients receiving ART in moderate or high TB incidence areas, regardless of TST or IGRA status.
Rangaka MZ. Lancet 2014;384:682-90.

ART with or without INHCote d’Ivoire
• ART started according to WHO guidelines– With or without INH (6 months) started within 1 month
• ART started immediately– With or without INH (6 months) started within 1 month
• Factorial design; no interaction between INH, early ART• Follow-up: 30 months• 2,056 patients; 41% with baseline CD4 > 500• Primary outcome: death, any AIDS event, non-AIDS
invasive bacterial disease, non-AIDS malignancy (combined)
• 35% were QuantiFERON positive• Early ART and INH independently ↓ severe illness
Intervention Adjusted HR 95% CI P-valueEarly ART 0.56 0.41, 0.76 < 0.001INH 0.65 0.48, 0.88 0.005
Danel C—TEMPRANO Trial. N Engl J Med 2015;373:808-822.
Conclusions
• Most TB disease is due to reactivation of latent M. tuberculosis infection
• Preventing reactivation is critical for achieving TB elimination
• Treatment of latent M. tuberculosis infection can have a profound effect on decreasing TB incidence
Conclusions
• Several options for treatment of latent M. tuberculosis infection
• Short-course regimens favored due to higher treatment completion rates
• Antiretroviral therapy and treatment of latent M. tuberculosis infection both decrease TB risk in HIV-infected persons