Almarai Company
2013 Q3 Earnings Presentation

Disclaimer
Information contained in this presentation is subject to change without further notice, its accuracy is not guaranteed and it may not contain all material information concerning the company. Neither we nor our advisors make any representation regarding, and assume no responsibility or liability for, the accuracy or completeness of, or any errors or omissions in, to any information contained herein. In addition, the information contains projections and forward-looking statements that reflect the company’s current views with respect to future events and financial performance. These views are based on current assumptions which are subject to various risks and may change over time. No assurance can be given that future events will occur, that projections will be achieved, or that the company’s assumptions are correct. Actual results may differ materially from those projected. This presentation is strictly not to be distributed without the explicit consent of Almarai Company management under any circumstances.
Almarai Company 2 2013 Q3 Earnings Presentation
Business Highlights
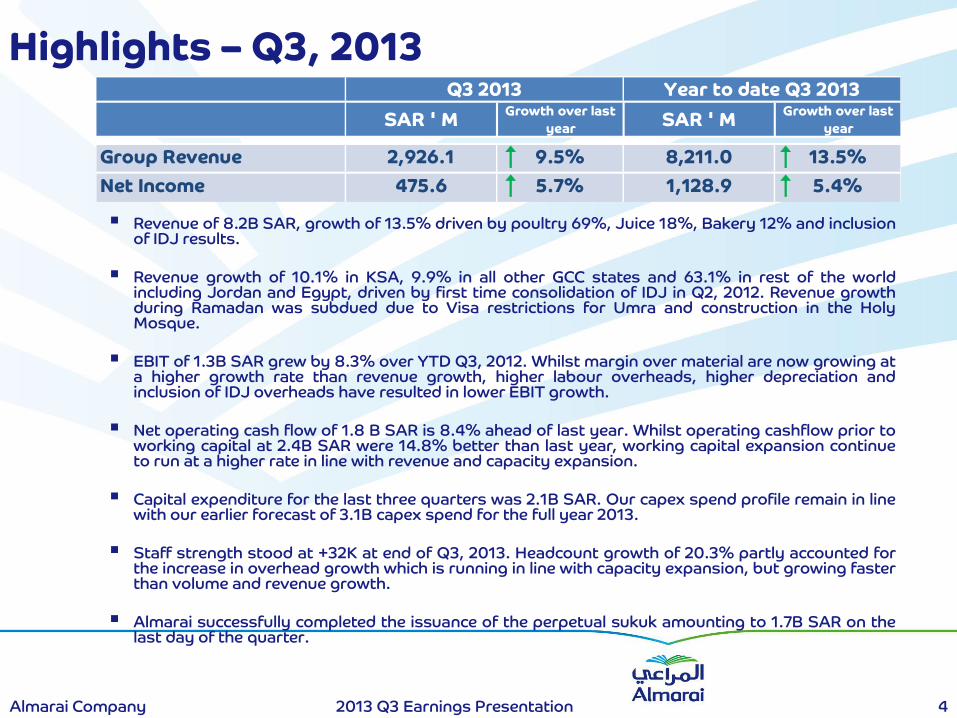
Revenue of 8.2B SAR, growth of 13.5% driven by poultry 69%, Juice 18%, Bakery 12% and inclusion of IDJ results.
Revenue growth of 10.1% in KSA, 9.9% in all other GCC states and 63.1% in rest of the world including Jordan and Egypt, driven by first time consolidation of IDJ in Q2, 2012. Revenue growth during Ramadan was subdued due to Visa restrictions for Umra and construction in the Holy Mosque.
EBIT of 1.3B SAR grew by 8.3% over YTD Q3, 2012. Whilst margin over material are now growing at a higher growth rate than revenue growth, higher labour overheads, higher depreciation and inclusion of IDJ overheads have resulted in lower EBIT growth.
Net operating cash flow of 1.8 B SAR is 8.4% ahead of last year. Whilst operating cashflow prior to working capital at 2.4B SAR were 14.8% better than last year, working capital expansion continue to run at a higher rate in line with revenue and capacity expansion.
Capital expenditure for the last three quarters was 2.1B SAR. Our capex spend profile remain in line with our earlier forecast of 3.1B capex spend for the full year 2013.
Staff strength stood at +32K at end of Q3, 2013. Headcount growth of 20.3% partly accounted for the increase in overhead growth which is running in line with capacity expansion, but growing faster than volume and revenue growth.
Almarai successfully completed the issuance of the perpetual sukuk amounting to 1.7B SAR on the last day of the quarter.
Highlights – Q3, 2013
Almarai Company 4 2013 Q3 Earnings Presentation
SAR ' MGrowth over last
yearSAR ' M
Growth over last
year
Group Revenue 2,926.1 9.5% 8,211.0 13.5%
Net Income 475.6 5.7% 1,128.9 5.4%
Q3 2013 Year to date Q3 2013

Strong pipeline of innovation continues in 2013
5 2013 Q3 Earnings Presentation Almarai Company

Sales Highlights

Sales Growth – Geography mix
Almarai Company 7 2013 Q3 Earnings Presentation
KSA
All
Others
GCC
10.1%
9.9%
63.1%
Almarai
Group 13.5%
% Growth
YTD Q3 2012
Rev in B SAR
YTD Q3 2013
Rev in B SAR
KSA65.5%
GCC25.3%
All Others9.2%
YTD Q3 2013
KSA67.5%
GCC26.1%
All Others6.4%
YTD Q3 2012
0.46
0.75
1.89
2.08
4.88
5.38
7.24
8.21
Sales Analysis by Product & Region
Almarai Company 8 2013 Q3 Earnings Presentation
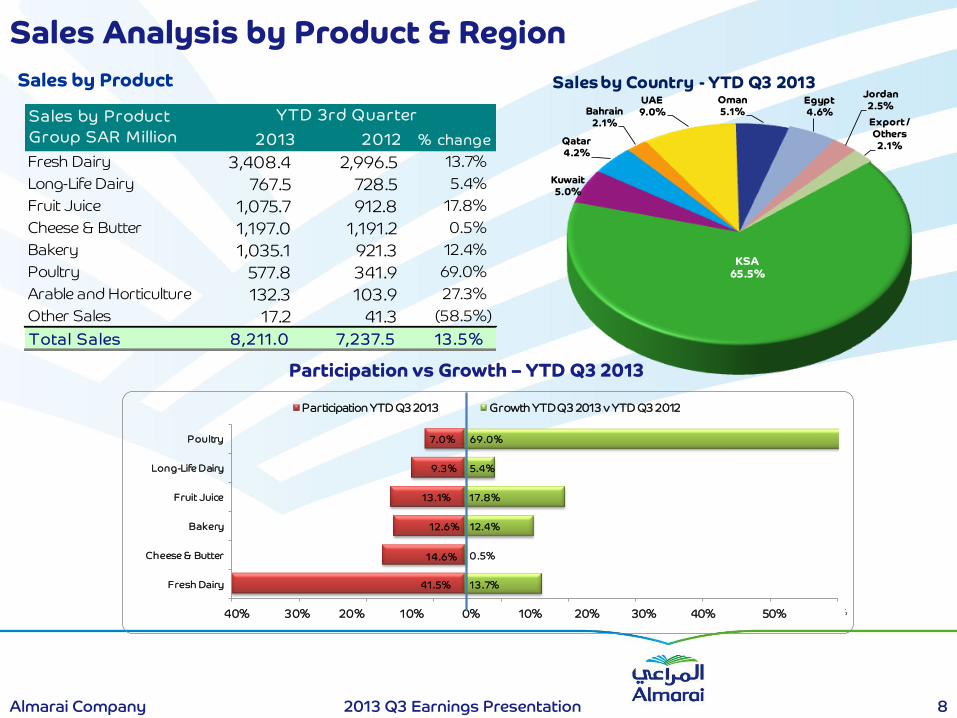
Sales by Product
Participation vs Growth – YTD Q3 2013
2013 2012 % change
Fresh Dairy 3,408.4 2,996.5 13.7%
Long-Life Dairy 767.5 728.5 5.4%
Fruit Juice 1,075.7 912.8 17.8%
Cheese & Butter 1,197.0 1,191.2 0.5%
Bakery 1,035.1 921.3 12.4%
Poultry 577.8 341.9 69.0%
Arable and Horticulture 132.3 103.9 27.3%
Other Sales 17.2 41.3 (58.5%)
Tota l Sa les 8,211.0 7,237.5 13.5%
Sales by Product
Group SAR Million
YTD 3rd Quarter
KSA65.5%
Kuwait5.0%
Qatar4.2%
Bahrain2.1%
UAE9.0%
Oman5.1%
Egypt4.6%
Jordan2.5%
Export / Others
2.1%
Sales by Country - YTD Q3 2013
41.5%
14.6%
12.6%
13.1%
9.3%
7.0%
13.7%
0.5%
12.4%
17.8%
5.4%
69.0%
0% 10% 20% 30% 40% 50% 60% 70% 80% 90%
Fresh Dairy
Cheese & Butter
Bakery
Fruit Juice
Long-Life Dairy
Poultry
Participation YTD Q3 2013 Growth YTD Q3 2013 v YTD Q3 2012
40% 30% 20% 10% 0% 10% 20% 30% 40% 50%

Change in growth rates and IDJ consolidation results in
higher share of poultry, juice and dairy
Almarai Company 9 2013 Q3 Earnings Presentation
39.6% 40.7% 43.4%40.3% 39.6% 39.9%
44.7%
19.4% 15.4%15.3%
15.5% 16.4% 14.4%
13.3%
14.4%
12.9%11.3%
14.0% 14.1%12.9%
11.1%
10.2%13.3% 13.8% 12.5% 11.9%
13.4%13.8%
10.5% 10.4% 9.4% 10.9% 10.7%9.1%
8.5%
4.7% 4.7% 4.8% 6.1% 6.7%7.1%
7.3%
1.3% 2.6% 2.0% 0.7% 0.5% 3.4% 1.4%
0%
10%
20%
30%
40%
50%
60%
70%
80%
90%
100%
Q1 2012 Q2 2012 Q3 2012 Q4 2012 Q1 2013 Q2 2013 Q3 2013
Revenue Contribution
Other Sales
Poultry
Long-Life Dairy
Fruit Juice
Bakery
Cheese & Butter
Fresh Dairy

Statement of Income
Almarai Company 10 2013 Q3 Earnings Presentation
• Margin over material has continued to show higher growth than revenue in the first three quarters. However, higher depreciation, IDJ consolidation effect from Q2 2012 and higher headcount to manage poultry roll out resulted in lower gross profit growth compared to revenue growth.
• Similarly, growth in overheads is driven by head count increase and IDJ consolidation in Q1, resulting in lower net profit growth relative to revenue growth
SAR million 2013 2012 Change 2013 2012 Change
Sales 2,926.1 2,673.0 9.5% 8,211.0 7,237.5 13.5%
Cost of sales (1,821.1) (1,660.8) 9.7% (5,243.8) (4,596.3) 14.1%
Gross Profit 1,105.0 1,012.2 9.2% 2,967.2 2,641.2 12.3%
Selling and Distribution Expenses (470.9) (418.3) 12.6% (1,378.4) (1,166.4) 18.2%
General and Administration Expenses (80.5) (85.3) (5.7%) (250.4) (239.2) 4.7%
EBIT 553.6 508.6 8.9% 1,338.4 1,235.6 8.3%
Share of Results of Associates (3.4) (3.9) (13.1%) (25.2) (21.6) 16.5%
Funding and Currency Costs (62.9) (41.3) 52.5% (159.8) (110.9) 44.1%
Income from Main Operations 487.3 463.4 5.2% 1,153.4 1,103.1 4.6%
Zakat and Income Tax (8.8) (14.6) (39.6%) (28.5) (35.6) (19.9%)
Income before Non Controlling
Interest478.5 448.8 6.6% 1,124.9 1,067.5 5.4%
Non Controlling Interest (2.9) 1.2 n.a 4.0 4.1 (2.2%)
Net Income 475.6 450.0 5.7% 1,128.9 1,071.6 5.4%
Earnings Per Share 0.80 0.75 1.89 1.79
Net Income % 16.3% 16.8% 13.7% 14.8%
3rd Quarter Year to Date 3rd Quarter

Segment Reporting
Almarai Company 11 2013 Q3 Earnings Presentation
SAR Mi l l ionDairy &
JuiceBakery Poultry
Arable and
Hort iculture
Other
Act ivi t ies
Almarai
Consol idated
Q3 YTD 2013
Sales 6,477.5 1,035.1 577.8 320.9 1.2 8,412.5
Third Party Sales 6,464.5 1,035.1 577.8 132.3 1.2 8,211.0
Depreciation (689.1) (100.6) (110.1) (54.2) (12.9) (966.9)
Income / (loss) before Non
Controlling Interest1,264.3 77.3 (212.3) 47.4 (51.7) 1,124.9
Total Assets 13,672.8 2,099.7 4,631.1 1,802.6 1,021.2 23,227.4
Total Liabilities (5,944.9) (671.4) (4,824.3) (246.7) (1,145.9) (12,833.2)
Return on Sales 19.6% 7.5% (36.7%) 35.8% n.a. 13.7%
Growth versus Q3 YTD 2012
- Third Party Sales 10.1% 12.4% 69.0% 27.3% n.a. 13.5%
- Income / (loss) before Non
Controlling Interest20.5% 15.0% 231.6% 8.2% 82.1% 5.4%
Q3 2013
Sales 2,354.1 324.8 212.9 120.2 0.3 3,012.4
Third Party Sales 2,354.1 324.8 212.9 34.0 0.3 2,926.1
Depreciation (225.5) (37.1) (49.2) (18.4) (5.2) (335.4)
Income / (loss) before Non
Controlling Interest556.4 11.7 (75.1) 1.7 (16.2) 478.5
Return on Sales 23.6% 3.6% (35.3%) 5.0% n.a. 16.4%
Growth versus Q3 2012
- Third Party Sales 6.9% 7.2% 67.1% (14.3%) n.a. 9.5%
- Income / (loss) before Non
Controlling Interest29.4% (21.3%) 303.9% (94.5%) 83.1% 6.6%

Trend charts
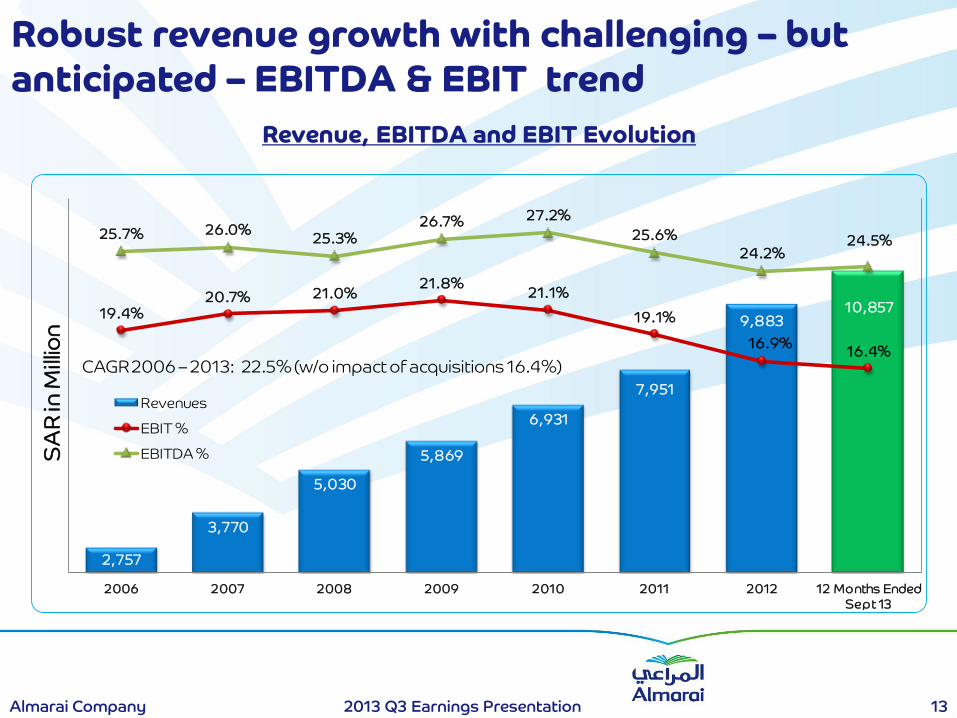
Robust revenue growth with challenging – but
anticipated – EBITDA & EBIT trend
Almarai Company 13 2013 Q3 Earnings Presentation
Revenue, EBITDA and EBIT Evolution
2,757
3,770
5,030
5,869
6,931
7,951
9,88310,85719.4%
20.7% 21.0%21.8%
21.1%
19.1%
16.9%16.4%
25.7% 26.0%25.3%
26.7% 27.2%
25.6%
24.2%24.5%
2006 2007 2008 2009 2010 2011 2012 12 Months Ended
Sept 13
SA
R in
Mill
ion
Revenues
EBIT %
EBITDA %
CAGR 2006 – 2013: 22.5% (w/o impact of acquisitions 16.4%)

Quarterly Performance – Net Income
Almarai Company 14 2013 Q3 Earnings Presentation
90
.6
12
2.8
16
2.2
19
7.4
23
4.1
23
5.2
24
2.1
25
5.1
12
1.8
16
5.3
23
5.2
28
7.1
34
3.1
34
9.3
37
9.5
39
8.2
12
2.6
18
6.1
29
3.7
36
3.4
42
4.5
42
9.7
45
0.0
47
5.6
13
0.2
19
3.1
21
9.2
24
8.8
28
3.5
28
5.5
36
9.0
0
50
100
150
200
250
300
350
400
450
SA
R M
illio
n
Q2 = 4.9%
2013 versus 2012
Q1 = 5.4%
Q3 = 5.7%

Cash Flows
Cash Flow Statement (YTD Q3 2013)
Almarai Company 16 2013 Q3 Earnings Presentation
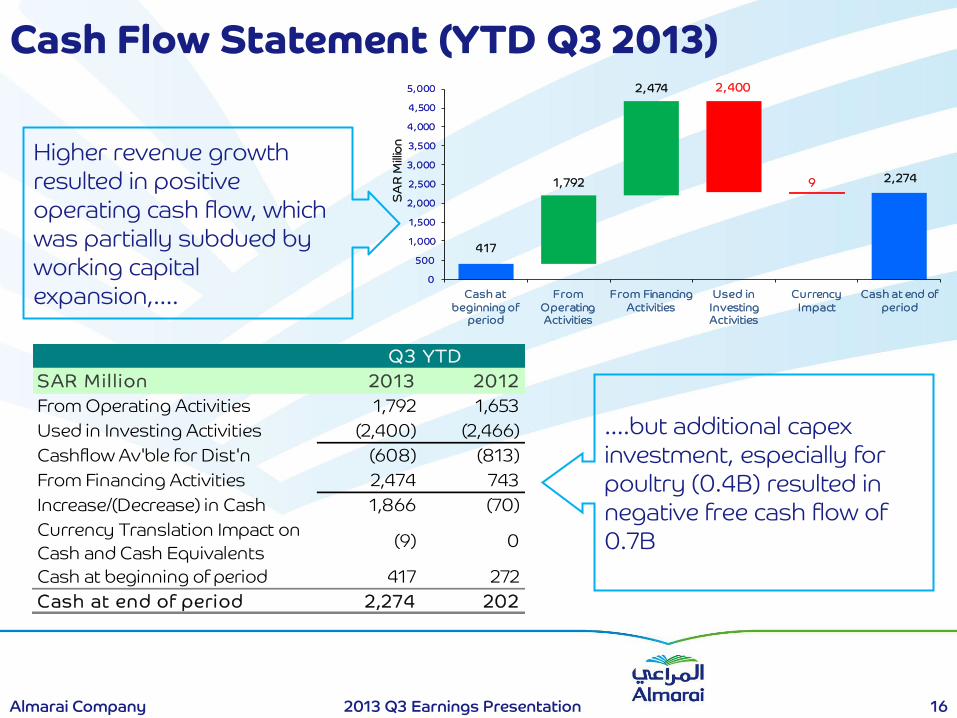
Higher revenue growth
resulted in positive
operating cash flow, which
was partially subdued by
working capital
expansion,….
….but additional capex
investment, especially for
poultry (0.4B) resulted in
negative free cash flow of
0.7B
417
1,792
2,474 2,400
9 2,274
0
500
1,000
1,500
2,000
2,500
3,000
3,500
4,000
4,500
5,000
Cash at
beginning of period
From
Operating Activities
From Financing
Act ivities
Used in
Investing Activities
Currency
Impact
Cash at end of
period
SA
R M
illio
n
SAR Mi l l ion 2013 2012
From Operating Activities 1,792 1,653
Used in Investing Activities (2,400) (2,466)
Cashflow Av'ble for Dist'n (608) (813)
From Financing Activities 2,474 743
Increase/(Decrease) in Cash 1,866 (70)
Currency Translation Impact on
Cash and Cash Equivalents(9) 0
Cash at beginning of period 417 272
Cash at end of period 2,274 202
Q3 YTD

Cash Flow Bridge – rolling 12 months
Almarai Company 17 2013 Q3 Earnings Presentation
202
2,875
1,700
1,300 4 (3,073)
(494)
(240)2,274
Cash at 30 Sept 2012
Operating Cash Flow
Capex
Dividend
Others
Cash at 30 Sept 2013
+ SAR 2,072 m
Loans Issues /
Payments /
Others
Equity Issued -
Perpetual
Sukuk
Bank Loan -Sukuk
Balance Sheet

Balance Sheet
Almarai Company 19 2013 Q3 Earnings Presentation
SAR Mi l l ion 30/09/13 30/09/12
1,456 1,381
966 883
14,614 12,849
17,036 15,113
1,335 1,383
373 300
18,744 16,796
7,920 8,421
324 279
106 129
10,394 7,968
18,744 16,796
76.2% 105.7%
Total Equity
Net Capital Employed
Net Debt to Equity Ratio
Intangible Assets - Goodwill
Investment & Financial Assets, Deferred
Charges and Derivatives
Net Debt
End of Service Benefits
Deferred Tax (Net)
Net Operating Working Capital
Biological Assets
Property, Plant and Equipment
Net Operating Assets
Perpetual Sukuk
Almarai Company 20 2013 Q3 Earnings Presentation
On 24 Dhul Qadah 1434 A.H. (30 September 2013), the Company issued its first Perpetual Sukuk - Series 1 amounting to SAR 1,700.0 million at a par value of SAR 1 million each without discount or premium, bearing a return based on SIBOR plus a pre-determined margin. The Company may redeem the Perpetual Sukuk, in full or in part, at its own discretion and may defer, in full or in part, payment of any profit distribution at its own discretion. The Company is not subject to any limitation on the number of times that it may defer such payment at its own discretion and such deferral is not considered as an event of default. The Perpetual Sukuk rank in priority to all subordinated obligations and the ordinary share capital of the Company. These Sukuk do not carry the right to vote, however each sukukholder participates in the Sukuk Assets. The terms of the Sukuk entitle the Company to commingle its own assets with the Sukuk Assets. Sukuk Assets comprise the sukukholders’ share in the Mudaraba Assets and the sukukholders’ interest in the Murabaha Transaction, together with any amounts standing to the credit of the Sukuk account and the Reserve retained by the Company from the Sukuk account.

Net Debt
Almarai Company 21 2013 Q3 Earnings Presentation
1,320 2,454 3,398 3,869 4,606 6,653 8,237 7,920
70% 80%
94%
72% 74%
98% 101%
76%
1.7x 1.9x
2.3x 2.3x 2.2x
2.8x
3.1x
3.0x
0%
50%
100%
150%
200%
250%
300%
350%
0
1,000
2,000
3,000
4,000
5,000
6,000
7,000
8,000
9,000
2006 2007 2008 2009 2010 2011 2012 Last 12
months
Net Debt Net Debt / Equity Ratio Net Debt / EBITDA
in m
illio
nS
AR

Debt Profile highlights balanced approach for
funding….
Almarai Company 22 2013 Q3 Earnings Presentation
0.0
0.5
1.0
1.5
2.0
2.5
3.0
3.5
<1yr 1-2 yr 2-3yr 3-4 yr 4-5yr >5yr
SA
R B
illio
n
Debt Maturity by Age and Type
Islamic Bonds
Govt / Semi Govt Inst.
Banks
7.1, 69%0.8, 8%
2.3, 23%
Capital Expenditure

Capex spend in line with Guidance…
Almarai Company 24 2013 Q3 Earnings Presentation
Capex spend of 2.1B SAR, which is in line for with our earlier forecast of 3.1B SAR for the full year
2013.
Poultry capex spend for the first three quarter
amounted to more than 0.7B SAR. The key
highlight for the first three quarters is the
commercial start of the first line in Q1 and second
line in Q2 as previously communicated.
Sales depot and logistics expansion accounted for
~0.5B SAR for the first three quarters, resulting in
our our growing foot print across the GCC.
Manufacturing and Farming consumed capex of
~0.3B SAR each for various capacity expansion
projects
Replacement and other capex including IDJ,
accounted for another 0.3B SAR.

0%
50%
100%
150%
200%
250%
300%
Almarai TASI
Key Share Data
Almarai Company 25 2013 Q3 Earnings Presentation
Key Stat ist ics for Almarai (28 Sept 2013)
Current P/E Rat io (ttm) 22.6
Est imated P/E(12/2013) 22.2
Earnings Per Share (SAR) (ttm) 2.5
Market Cap (M SAR) 33,298
Shares Outstanding (M) 600.0
30 Day Average Volume 1,006,677
Dividend Indicated Gross Yield 1.5%
Cash Dividend (SAR) 0.8
Last Dividend 4/3/2013
5 Year Dividend Growth 11.7%

Thank you
Almarai Company
Exit 7, North Circle Road
Al Izdihar District
P.O. Box 8524
Riyadh, 11492
Saudi Arabia
Contact for investor relations matters:
Khalid M. Al Nasser
+966 11 470 00 05 ext 1280