KYMENLAAKSO AMMATTIKORKEAKOULU
University of Applied Sciences
International Business/ International Trade
DANG BAO TRUNG
FACTORS ON EMPLOYEE LOYALTY IN HOANG PHUC COMPANY
Bachelor’s Thesis 2014
2
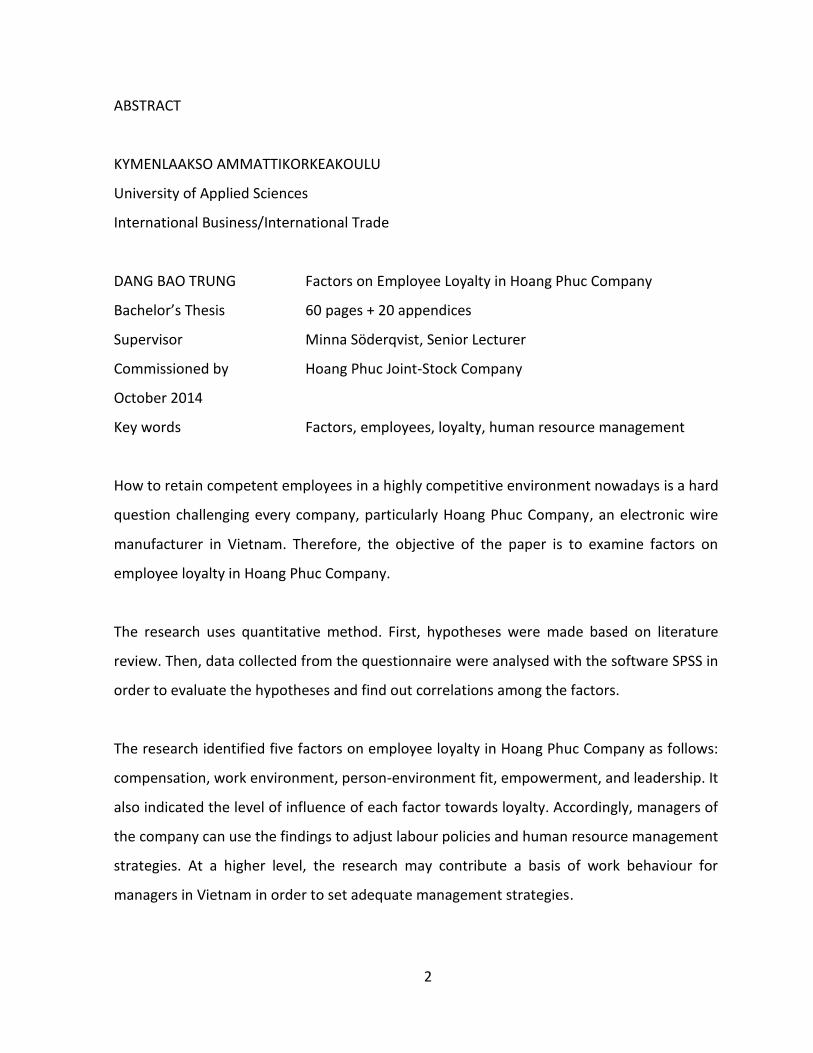
ABSTRACT
KYMENLAAKSO AMMATTIKORKEAKOULU
University of Applied Sciences
International Business/International Trade
DANG BAO TRUNG Factors on Employee Loyalty in Hoang Phuc Company
Bachelor’s Thesis 60 pages + 20 appendices
Supervisor Minna Söderqvist, Senior Lecturer
Commissioned by Hoang Phuc Joint-Stock Company
October 2014
Key words Factors, employees, loyalty, human resource management
How to retain competent employees in a highly competitive environment nowadays is a hard
question challenging every company, particularly Hoang Phuc Company, an electronic wire
manufacturer in Vietnam. Therefore, the objective of the paper is to examine factors on
employee loyalty in Hoang Phuc Company.
The research uses quantitative method. First, hypotheses were made based on literature
review. Then, data collected from the questionnaire were analysed with the software SPSS in
order to evaluate the hypotheses and find out correlations among the factors.
The research identified five factors on employee loyalty in Hoang Phuc Company as follows:
compensation, work environment, person-environment fit, empowerment, and leadership. It
also indicated the level of influence of each factor towards loyalty. Accordingly, managers of
the company can use the findings to adjust labour policies and human resource management
strategies. At a higher level, the research may contribute a basis of work behaviour for
managers in Vietnam in order to set adequate management strategies.
3
Contents
ABSTRACT ............................................................................................................................... 2
1. INTRODUCTION ................................................................................................................. 5
1.1. Rationale ............................................................................................................................................................. 5
1.2. Research Objective .............................................................................................................................................. 5
1.3. Thesis Structure ................................................................................................................................................... 6
2. EMPLOYEE LOYALTY .......................................................................................................... 6
2.1. Definition ............................................................................................................................................................. 6
2.2. Factors on employee loyalty ................................................................................................................................ 8
2.2.1. Compensation ....................................................................................................................................... 8
2.2.2. Work environment ................................................................................................................................ 9
2.2.3. Value congruence ................................................................................................................................ 12
2.2.4. Person-job fit ....................................................................................................................................... 14
2.2.5. Empowerment .................................................................................................................................... 15
2.2.6. Leadership ........................................................................................................................................... 16
2.3. Hypotheses ........................................................................................................................................................ 18
2.4. Measured factors............................................................................................................................................... 19
2.4.1. Independent factors ............................................................................................................................ 19
2.4.2. Dependent factor ................................................................................................................................ 21
3. METHODOLOGY .............................................................................................................. 22
3.1 Quantitative research ........................................................................................................................................ 22
3.2 Data Acquisition ............................................................................................................................................ 23
3.3 Data Analysis ................................................................................................................................................. 24
4. FINDINGS & ANALYSIS ..................................................................................................... 28
4.1. Background Information .................................................................................................................................... 28
4.2. Descriptive Statistics .......................................................................................................................................... 32
4.2.1 Compensation ........................................................................................................................................... 32
4.2.2 Work Environment .................................................................................................................................... 33
4.2.3 Value Congruence ..................................................................................................................................... 34
4.2.4 Person-Job Fit ............................................................................................................................................ 35
4
4.2.5 Empowerment .......................................................................................................................................... 36
4.2.6 Leadership ................................................................................................................................................. 37
4.2.7 Loyalty ....................................................................................................................................................... 38
4.3. Reliability test .................................................................................................................................................... 39
4.4. Exploratory Factor Analysis ............................................................................................................................... 39
4.5. Inferential Analysis ............................................................................................................................................ 44
4.5.1. Pearson Correlation Analysis............................................................................................................... 44
4.6.2 Multiple Regression Analysis ............................................................................................................... 45
4.6.3 Analysis of Variance (ANOVA) ............................................................................................................. 48
5 CONCLUSION & SUGGESTION .......................................................................................... 51
5.1 Results ............................................................................................................................................................... 51
5.2 Implications ....................................................................................................................................................... 51
5.3 Further Study ..................................................................................................................................................... 53
APPENDIX Employee Loyalty Questionnaire - Survey autumn 2014 ............................... 54
REFERENCES ......................................................................................................................... 56
5
1. INTRODUCTION
1.1. Rationale
Competitiveness on human resource is always a key issue in companies. To attract capable
labour, enterprises continuously improve polices on human resource management. A more
difficult challenge facing companies is how to retain employees from inviting temptation of
other competitors. That is a hazard that Hoang Phuc Company want to prevent and limit.
Employee loyalty has a number of benefits for companies. In terms of profit, loyal employees
tend to perform better than expected with their highest motivation and ability. That way,
labour efficiency will definitely be at a high level, generating more profit for the company. In
terms of cost, loyal employees are inclined to remain with the company, and always
recommend their company as a good workplace. As a result, the company’s recruitment cost
will be lessened (Byars, et al 2001). In short, employee loyalty holds the key to the
sustainable development of companies.
In order to retain employees, we must find out what affect employee’s intention to remain
with the company. Accordingly, with the suggestion of the director, I chose “Factors on
employee loyalty in Hoang Phuc Company” as the thesis topic to explore what affects
employees’ loyalty, hence proposing solutions and strategies for the company. The research
objects are all the employees in Hoang Phuc Company, including workers, experts, and
managers.
1.2. Research Objective
The research objective is to determine factors affecting employees’ loyalty in Hoang Phuc
Joint-Stock Company. In other words, the research is to answer the following question:
“What are the factors on employee loyalty in Hoang Phuc Company?” Hence, the company
can apply the findings to adjust human resource management strategies and policies to
6
retain competent employees. At a higher level, the research may provide a kind of reference
for enterprises to maintain and enforce employees’ loyalty.
1.3. Thesis Structure
The thesis consists of 5 chapters. Chapter 1 is the overview of the thesis, including rationale,
research objective and research questions. Chapter 2 is the literature review on theories of
loyalty, and factors on employee loyalty such as compensation, work environment, value
congruence, person-job fit, empowerment, and leadership, hence proposing hypotheses and
measures for quantitative research. Chapter 3 is methodology of the research, methods
employed to carry out the research. Chapter 4 is the core part of the thesis, presenting
findings and analyses of quantitative research, that is, measuring factors on employee loyalty
and confirm the hypotheses. Chapter 5 is the suggestion and implications from the findings
for the company, research limitations, and further studies.
2. EMPLOYEE LOYALTY
2.1. Definition
The attempt to define loyalty can be started from mention the principle of common
interconnectedness, the core of dialectical materialism (Marx & Engels, 1938) as a basis to
examine the concept. That is, there is nothing, no phenomenon, or no process existing
individually, absolutely isolated with the others; on the contrary, they exist in relation,
binding, dependence, inter-conversion. The principle implies that when considering an
object, we must put it in the relations with the others, i.e. the whole context the object
exists in. That way, we can draw conclusions comprehensively and precisely.
There is no doubt that, while the subject of loyalty is always an individual, objects of loyalty
varies according to eras. In the Middle Ages, when all authority was centralized in monarchs
and nobles/officials, the object of loyalty was masters in the master-servant relationship. In
7
the feudal China, loyalty, known as Zhong in Chinese that is interpreted as doing the best you
can do for others (Confucius), was put in priority among a plenty of morals and virtues. At
that time, the biggest mission of citizens was loyal to the king; if the king commanded you to
die, you would have to obey, or you would be considered disloyal to the king. Mentioning
loyalty, the Chinese will immediately think about Ji Xin who sacrificed his life to save
Emperor Gaozu of Han, You Yu who used his back to shield King Zhao of Chu from the rival’s
spears, or Yu Rang who swallowed coal to revenge for the master.
In this era that everyone is equal, loyalty to an individual has been no longer a duty. Hence,
loyalty is mainly mentioned in the relation between employees and their organisations.
There are a great number of definitions of loyalty. Lawrence (1985) emphasized the devotion
of workers to their organisations as reflected in their compliance with instructions from
supervisors. Buchanan (1974) viewed loyalty broadly as an employee’s feelings of
attachment to an organisation. Butler (1984) mentioned supporting an organisation and the
individuals within it. Logan (1984) described loyalty as feeling attachment when an employee
passed on an attractive position with another organisation. Reichheld (1996) asserted that
loyalty was remaining with one organisation for some length of time. Recently, researchers
have paid attention to employees not harming the organization in defining employee loyalty.
Kant (2007) regards employee loyalty as “an implicit promise not to bring harm to other.”
Dooley (2005) argues that loyal employees must not betray their company for their own
sake. Each of the above definitions just describes an aspect of employee loyalty; all of them
are approached either from employee attitude towards organisations like attachment
(Buchanan, 1974) or from employees’ specific acts such as devotion (Lawrence, 1985),
supporting (Butler, 1984), remaining (Reichheld, 1996), not harming (Kant, 2007), and not
betraying (Dooley, 2005). Loyalty is a sentimental state of someone to someone else or
something, a pretty vague concept; therefore, it must be defined based on other clearer
sentimental states or specific behaviours. All in all, a common formula of employee loyalty is
‘having positive feelings towards the organisation or doing positive things for the
organisation.’ Loyalty, however, is a notion relating to human behaviour and sentiment,
8
which are hard to explain thoroughly as affected by numerous factors such as personality,
culture, emotion, value, and so on (Beer, 2009). For instance, love, to someone, can mean
‘always missing and thinking about his lover,’ but to another one, love is doing the best for
his lover. Unlike natural science principles that can be all agreed over the world, concepts
concerning morals or philosophy are specific to each culture, or even individual (Oldenqvist,
2006). Therefore, what I’m attempting to do is not to find out a versatile key to all locks, but
one only to my lock. In other words, the notion that is best appropriate for the research will
be chosen. Because the company’s concern is how to retain employees, the research will
employ the definition of Mowday (1979), that is, “Employee loyalty is the intention or desire
for remaining with the organisation.”
‘Faithful’ is often used as an interchangeable synonym of ‘loyal’, but in fact, they have a
significant difference in usage. The Cambridge dictionary (5th edition) defines: “Faithful is
firm and not changing in your friendship with or support for a person or an organization, or
in your belief in your principles.” Hence, ‘faithful’ and ‘loyal’ both describes closely similar
concepts. Nonetheless, because of the “firm and not changing” characteristic of ‘faithful’, it
must be mentioned in the husband-wife relationship or the customer-business relationship,
whereas ‘loyal’ renders the master-servant relationship. In other words, the subjects and
objects of ‘faithful’ and ‘loyal’ are different.
2.2. Factors on employee loyalty
2.2.1. Compensation
Compensation is the broadest term of payment given to employees in exchange for work
they perform (Sarma, 2009). It can be wages, salaries, commissions, or bonuses. Wage,
salary, and income are often used interchangeably, but they, indeed, are not the same thing.
Wages are payment on the basis of hourly rates, daily rates, or quantity of work; in contrast,
salary is a fixed amount of payment, often received by month, regardless of the number of
working hours. The total amount employees get each month is called income. Besides
9
earning a wage or salary, most employees may gain other benefits as leave travel concession
and holidays, health care, insurance and pensions.
The main challenge to any organisation is how to lay down a fair and equitable
compensation system. Enterprises might hold various views on compensation system, but in
general, they all attempt to achieve the following goals (Beach, 2007): attraction, retention,
motivation, and legal compliance. The higher salary enterprises pay, the more attractive to
qualified applicant they are. A fair and equitable compensation system will help to retain
competent employees somewhat. All components in compensation such as basic
salary/wage, rewards, and allowances need to set effectively in order to encourage
employees. Enterprises must conform to the labour law and related acts on compensation.
Income from a job, without any doubt, is often considered as a measure of its quality or the
level of somebody’s success. High income helps satisfy employees’ physical needs, so they
can devote wholeheartedly to the job, paying more attention to the self-actualisation need.
Adequate income greatly affects employees in the following aspects (Louden and Newton,
2009): highly motivated to perform well, less inclined to look for another job, a higher sense
of responsibility for their job, and a higher sense of discipline in complying with the
organisation’s rules.
Hence, the first hypothesis is:
H1: Compensation affects employee loyalty.
2.2.2. Work environment
The term ‘work environment’, otherwise known as ‘working conditions’ means the
surrounding conditions in which employees work (Cardy, 2003). Workers’ performance and
behaviour are always affected by physical working conditions such as noise, lighting,
temperature, and ventilation (Sarma, 2009), which are each discussed in more detail below.
10
Noise: Noise, annoying sounds, is the biggest obsession in industry. The American Standards
Association (2008) defined noise as ‘undesired sound.’ When noise gets too severe, it not
only diverts employees but often triggers both mental and physical side effects (Bernardin
and Russel, 1993). It may hamper efficiency and cause fatigue apart from various health
disorders. Increasing mechanisation has caused considerable rise in industrial noise
pollution, provisional or enduring damage to hearing and interruption in speech
communication. Noise control is a system-related issue, consisting of noise source, the path
of sound propagation and the receiver (Megginson, 2004). Noise prevention and reduction
measures must be targeted at: controlling sources of noise; impeding the spread, boost and
reverberation of noise; and isolating workers. Noise prevention measures need followed
wherever necessary. While offices can be made of noise-proof, making factories absolutely
noise-free is another story that requiring more effort (Byars, 2001). The level of noise can be
lessened by designing better machines, but it cannot be completely excluded. Accordingly,
workers must learn to cohabit with some noise. It is commonly admissible that noise is a
distractor and that it must be maintained at the minimum degree in order to attain better
outcomes. While complete eradication of noise in factory situation is neither possible nor
preferable, some effort should be taken to maintain it within permissible limits.
Lighting: In spite of the fact that human beings have an outstanding capability to adapt to
the environment, well-being, morale and fatigue are impacted by light and colour (Beach,
2007). Instances of visual disorders at workplace are commonplace, and their causes are
diverse. They must be considered seriously, and workplace had better strive to give optimum
visual states. According to Boxall and Purcell (2002), good lighting should meet: optimal
illumination, uniform lighting, avoidance of glare, appropriate contrast, and correct colour.
The result of adequate illumination at workplace has been proved to significantly affect
human performance (Beach, 2007). Significant of the degree of illumination varies based on
the task in hand. What is good and correct lighting depends on the visual task to be
11
performed. Proper lighting yields a joyful mood and results in partial enhancement in
efficiency and productivity (Louden and Newton, 2009).
Ventilation: Industrial ventilation is regarded as a core part of air-conditioning when it goes
with heating, cooling and humidifying appliances to bring the interior of work space to an
appropriate state for products or for the thermal comfort of workers. When used alone,
ventilation is frequently either to get occupants cool or to lessen the density of a
contaminant in the air inhaled by them (Bhadury, 2000).
Temperature: The temperature of a human being’ vital organs must be kept within small
limits, if he is to survive from subjection to inordinate environments (Dennis, et al., 1990).
When heat exerts on man, his first reaction is a feeling of discomfort. Highest acceptable
limits must be established for the thermal extremity of workplace in order to maintain
thermal balance either throughout a working day or over the duration needed for finishing
work. If the integration of workload and environmental heat is so big that thermal balance
cannot be kept balanced, workers will get vulnerable to heat collapse. While physical work
gets worse in conditions of high temperature and sluggish air, there is no proof to claim that
under similar states, mental work also worsens. Those from hot climate with high humidity
seem to perform as much mental work as those from cool climate although they seemingly
have more breaks. Although there might be economic and technical challenges in declining
the damaging effects of heat and illumination, continuing efforts are crucial to provide an
adequate and appropriate work environment (Christopher, 2008).
Work environment has a strong impact on employees’ efficiency and satisfaction. Clearly, a
faintly-lighted, inadequately-ventilated and crowded workplace obstructs labour
productivity. Blake (2006) concludes that poor working conditions cause greater fatigue,
negligence, absenteeism and indiscipline among the employees. According to a research by
Al-Anzi (2009), over 90% respondents confirm the quality of their working environment
affects their mood and attitude about their work, and about 89% respondents claim the
12
quality of their working environment is very important to them view of job satisfaction.
Obviously, working in a convenient work environment makes workers comfortable,
powerful, and enthusiastic, thus focusing on perform their tasks well.
Therefore, the second hypothesis is:
H2: Work environment affects employee loyalty.
2.2.3. Value congruence
Value congruence is equivalent to the concept of person-organisation fit, or the matching
between a person’s values and believes with the organisation’s values and rules (Netemeyer,
1997; O’Reilly, 1991). Value congruence is a very important basis for numerous researched
factors (Chatman 1991). Argyris (2008) assumes that the incongruence between an
individual's aspirations and needs for growth and organizational forms causes unintended
consequences such as passivity, aggression and related behaviours that interfere with the
achievement of organizational goals. Recent research on organizational behaviour has
centred on empirical studies of value congruence. Kristof-Brown, Zimmerman, and Johnson
(2005) have viewed value congruence as “the compatibility between an individual and a
work environment that occurs when their characteristics are well matched.” Value
congruence plays as a representation of person-culture fit and shows that employees adapt
better to their work environment when the organizational values and their personal value
orientations are congruent (Vandenberghe, 1999).
Google is probably the pioneer of developing and maintaining value congruence. Stacy
Savides Sullivan, Google's Chief Culture Officer, described why Google puts so much
emphasis on its recruitment. Sullivan stated that:
“I think one of the hardest things to do is ensure that we are hiring people who
possess the kind of traits that we're looking for in a Google-y employee. Google-y is
defined as somebody who is fairly flexible, adaptable and not focusing on titles and
13
hierarchy, and just gets stuff done. So, we put a lot of focus in our hiring processes
when we are interviewing to try to determine first and foremost does the person
have the skill set and experience potential to do the job from a background
standpoint in addition to academics and credentials. But also are they going to be
good culture or team fits” (Mills, 2007).
Value congruence is obvious at Google since it attempt to achieve a good fit between the
type of employees and the maintenance of its culture and core values-- the elimination of
hierarchy, and collaborative environment.
Empirical evidence indicates that a high level of value congruence has various benefits. Value
congruence was verified to be correlated with work attitudes such as job satisfaction and
organizational commitment (Boxx et al., 1991; Bretz & Judge, 1994; Chatman, 1991; Downey,
Hellriegel, & Slocum, 1975; O'Reilly, 1991; Posner, Kouzes & Schmidt, 2000; Tziner, 2004;
Vancouver & Schmitt, 1991). Value congruence can be used to anticipate intention of quit
and turnover (Chatman, 1991; O'Reilly et al., 1991; Vancouver et al., 1994), related to
prosocial behaviours such as organizational citizenship behaviours (O'Reilly & Chatman,
1991), self-reported teamwork (Posner, 1992), and contextual performance (Goodman &
Svyantek, 1999). Cable (1996) discovers that organization members who share the values of
the organization are inclined to be more committed to the organization, more satisfied with
their jobs, and less likely to switch. A high level of congruence between individual and
organizational values can result in such positive job attitudes as job involvement, career
success, health and adaptation, and lower stress (Saks & Ashforth, 1997), and to instinctive
behaviour benefiting the organization (Caldwell et al., 2004; Goodman & Svyantek, 1999;
O'Reilly & Chatman, 1991). Recent research has indicated that value congruence is an
indispensable condition for employees’ positive working attitude and behaviour (Netemeyer,
1997). Employees tend to love their job, work more dedicatedly, and remain with the
organisation when their goals and values are congruent with those of the organisation
(Vancouver & Schmidt, 1991).
14
Thus, the third hypothesis is:
H3: Value congruence affects employee loyalty.
2.2.4. Person-job fit
Person-job fit (P-J fit) means the match between the capabilities of a person and the
demands of a job or the desires of a person and the attributes of a job (Edwards, 2003). The
elements of need-supply perspective contain the wants of the individuals and the
characteristics and attributes of the job that may meet those desires. Individuals’ desires
consist of goals, psychological needs, interests, and values. Job supplies are regarded as
general characteristics of occupation, pay, or other job attributes. The demand-ability
perspective comprises the job demands that are mandatory to perform the tasks of the job
and the capabilities that can be utilized to satisfy the job requirements. Job demands
typically include the knowledge, skills, and abilities needed to work at a satisfactory degree
(Caldwell & O'Reilly, 2009). Abilities consist of education, experience, and employee
aptitudes or knowledge, skills, and abilities (French at al., 2006).
There is considerable evidence that a high level of P-J fit has a number of positive outcomes.
Edwards (2003) confirms that job satisfaction, low job stress, motivation, performance,
attendance, and retention are the positive outcomes of P-J fit. When P-J fit is appraised as
the compatibility between what an employee desires and gains from performing job, it is
correlated with improved job satisfaction, adjustment, and organizational commitment, and
lessened intention to switch. Other benefits for task performance have been demonstrated
when the definition of P-J fit is extended to contain the match between abilities and their job
demands (Lawler, 2011). Buckley and Russell (1997) prove that validated and structured
processes for identifying P-J fit result in more effective selection of employees in comparison
to unstructured techniques.
Accordingly, the fourth hypothesis is:
15
H4: Person-job fit affects employee loyalty.
2.2.5. Empowerment
Empowerment is currently a prevalent term in human resource management. Sarma (2009)
claims: “Empowerment is the process of allowing workers to set their own goals, make
decisions, and solve problems within their spheres of responsibility and authority.”
Empowerment would be easy and complicated simultaneously (Peter, 2002). It is easy
because it notifies supervisors to stop bossing people around too much and to allow them to
perform their tasks. It is complicated in that supervisors and employees are, generally, not
trained to do that. A significant amount of time, training and practice may be needed to truly
empower employees. Purcell (2002) abridges the characteristics of an empowered
organisation as follows:
Trust: Existing a belief that employees can be trusted to deal with their work, hence a
minimal need for surveillance, scrutiny, directives and layers of management.
Curiosity: eager to learn from others and about how the company runs.
Forgiveness: Mistakes must be somewhat accepted and tolerated.
Togetherness: flexible to co-operate with any team regardless of hierarchy to aim at the
shared goals and values.
According to Hradesky (1995), there are various benefits from empowerment as follows:
It qualifies the best utilization of employees' understanding and competencies, implants
engagement and a sense of ownership in the employees and fosters employee productivity.
It generates a set of problem solvers in the organisation, establishing an environment helpful
for continual advancement in productivity, product quality, and other measures of individual
and group performance. It strengthens open communication at all levels in the organisation.
Hence, the fifth hypothesis is:
16
H5: Empowerment affects employee loyalty.
2.2.6. Leadership
“The challenge of leadership is to be strong, but not to be rude; be kind, but not weak; be
bold, but not bully; be thoughtful , but not lazy; be humble, but not timid; be proud, but not
arrogant; be humorous, but without folly.” (Rohn, 1992, pp.250)
Needless to say, leadership holds the key to the success of any organisations. There are a
large number of definitions and approaches to leadership, but in general, they are all based
on the following basic assumptions.
The first assumption is that leadership is an organizational or group phenomenon, expressed
through role behaviours performed by an individual in order to influence and regulate the
activities of group or organizational members towards a common goal. The second
assumption is that leadership is both a relational and an attributional phenomenon. That is,
leadership comes into play when followers grasp the leader’s behaviour in a certain manner,
receive the leader’s influence attempts, and then credit leadership status to the individual.
The third assumption is that leadership can be examined in terms of its contents and
processes. In other words, comprehending the leadership phenomenon needs the
characteristics of: the basic leadership elements – the leader, the followers, the situational
context; and the major relational processes – the leader-follower influence process, the
leader-context relational process, and the context-follower relational process (Mendonca,
2006).
The classical research approach to leadership is to identify leader role behaviours in groups.
Researchers pointed out three leader roles – social role, task role, and decision-making role
(Rue, 2002). Nonetheless, that approach seems to zoom in the daily routine maintenance of
the status quo, rather than the true phenomenon of future leadership as observed in society.
17
For this reason, leadership studies need to shift from the current preoccupation with task,
people, and participative orientations to the crucial behaviours seen in leaders who create
deep changes in both the organizations and in their members – behaviours such as visioning,
articulating a vision, and developing strategies to attain the vision. This trend in leadership
research is called the ‘neo-charismatic paradigm’ (Conger and Kanungo, 2003), and the
Conger-Kanungo Model of Charismatic Leadership is the best representative. The model
regards charismatic leaders as moving organizational members from an existing state
towards a desired future state. It comprises three stages. Stage 1 is evaluation of the status
quo. In this stage, leaders analytically assess the status quo to figure out the shortcomings
and the deficiently utilized opportunities as well as the limitations in the environment.
Eventually, charismatic leaders are greatly subtle to both the social and physical
environments. They will implement all the methods for pragmatic evaluation, including
inside and outside sources. Stage 2 is formulation and articulation of the future vision. After
evaluating the environment, charismatic leaders constitute and proclaim an idealized vision,
the desired goals for attaining the organization’s objectives. Charismatic leaders are
generally distinguished by a sense of strategic vision. Stage 3 is accomplishing the vision. In
the final stage, charismatic leaders participate in behaviours that form followers a belief in
the leader’s vision, more particularly, in the leader’s capability to attain the organization’s
goals necessary to accomplish the vision.
Charismatic leadership brings about a ton of benefits. Charismatic leadership behaviours will
lead to high internal cohesion, low internal conflict, high value congruence, and high
consensus. Thanks to the leading of a charismatic leader, followers are concurrent to achieve
the common goals. At the individual level, followers’ results can be determined in two
manners: the followers’ behaviours and attitudes toward the leader and toward the task.
Regarding followers’ behaviours with the charismatic leader, followers show a high degree of
respect for the leader, a high degree of faith in the leader, and a high level of satisfaction
with the leader. Concerning the followers’ attitudes to the task, followers manifest a high
18
degree of cohesion within the team group, a high level of task performance, and a high level
of feeling empowered within the organization to complete tasks (Conger, 2000).
Accordingly, the sixth hypothesis is:
H6: Leadership affects employee loyalty.
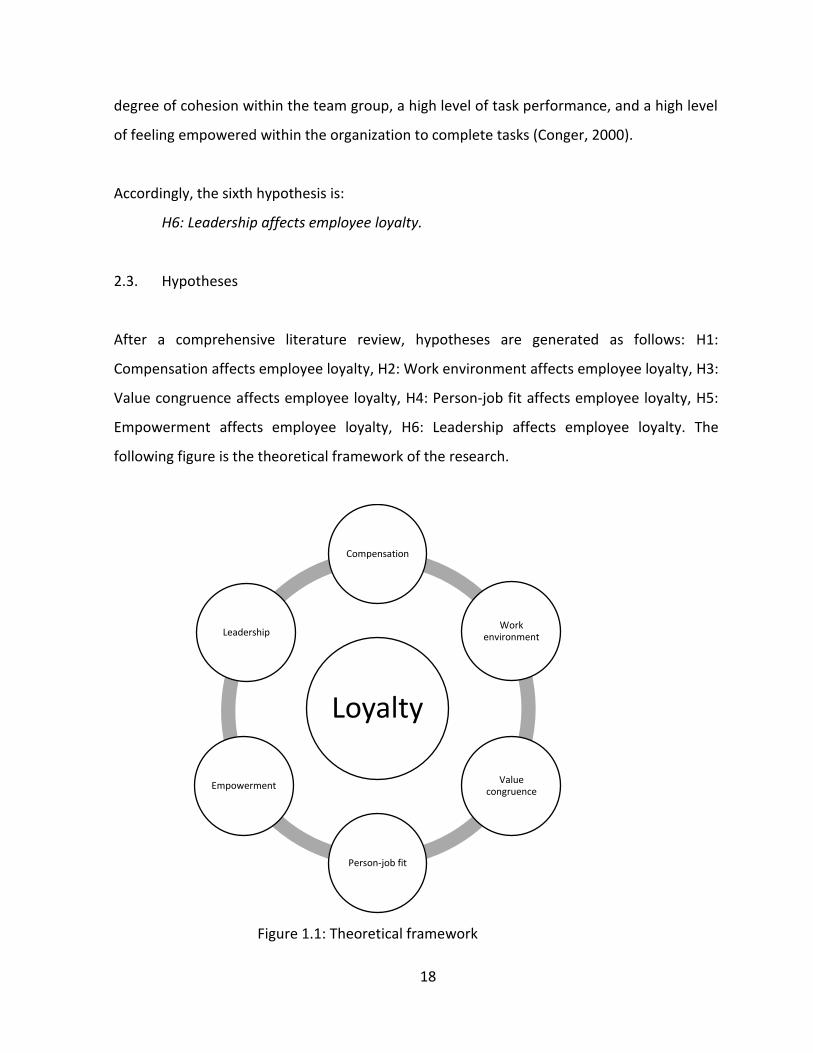
2.3. Hypotheses
After a comprehensive literature review, hypotheses are generated as follows: H1:
Compensation affects employee loyalty, H2: Work environment affects employee loyalty, H3:
Value congruence affects employee loyalty, H4: Person-job fit affects employee loyalty, H5:
Empowerment affects employee loyalty, H6: Leadership affects employee loyalty. The
following figure is the theoretical framework of the research.
Figure 1.1: Theoretical framework
Loyalty
Compensation
Work environment
Value congruence
Person-job fit
Empowerment
Leadership
19
2.4. Measured factors
Employee loyalty is affected by numerous factors. However, with the scope of this research,
the factors that are regularly appeared in research on employee loyalty will be chosen.
Therefore, the scale in the paradigm includes six independent factors and one dependent
factor. Variables are constituted based on the literature review.
2.4.1. Independent factors
2.4.1.1. Compensation
Compensation includes wage/salary, allowances, rewards, and fringe benefits. Employee
satisfaction with compensation is rendered in the correspondence with employees’ capacity
or responsibility, and in living standard. Therefore, factor ‘compensation’ is measured by the
three following variables:
My wage/salary corresponds to my capacity and responsibility.
I live totally well with my current wage/salary.
Allowances, rewards, and fringe benefits are adequate.
2.4.1.2. Work environment
Work environment includes equipment in the workplace, workplace’s temperature, light,
and noise. Employees are satisfied with work environment when they feel comfortable, and
safe in the workplace. Therefore, factor ‘work environment’ is measured by the four
following variables:
Equipment in the workplace is very good.
The work environment is comfortable.
The workplace’s temperature, light, and noise are appropriate.
I feel safe in the workplace.
20
2.4.1.3. Value congruence
Value congruence is the compatibility between employees’ values and the company’s values.
It occurs when employees realize and commit to the company’s values and strategies.
Therefore, factor ‘Value Congruence’ is measured by the three following variables:
The values and believes I respect and those the company pursues are matching.
I respect the company’s culture.
I commit to follow the company’s strategies.
2.4.1.4. Person-job fit
Person-job fit is the matching between employees’ capacity and the job’s requirements. It
exists when employees feel satisfied with their jobs. Hence, factor ‘Person-job fit’ is
measured by the three following variables:
My competence is suitable for job requirements.
I feel motivated and happy with working.
I love my job.
2.4.1.5. Empowerment
Empowerment is the process of allowing workers to set their own goals, make decisions, and
solve problems within their spheres of responsibility and authority. Hence, factor
‘empowerment’ is measured by the five following variables:
My supervisor lets me perform my tasks by myself.
My supervisor lets me make decisions.
My supervisor lets me set my own goals for work.
My supervisor generally forgives my minor mistakes by my wrong decision making.
My supervisor believes in my work evaluation.
21
2.4.1.6. Leadership
Modern leadership is regarded as moving organizational members from an existing state
towards a desired future state. Therefore, factor ‘leadership’ is measured by the four
following variables:
My supervisor gave me a clear path for my personal development.
My supervisor always listens to my opinions and care about my interests.
My capabilities are improved thanks to my supervisors’ training.
I admire and respect my supervisor.
2.4.2. Dependent factor
According to Mowday (1979), employees are loyal to a company when they are willing to
recommend the company as a good workplace, feel proud when talking about the
company’s products, and are inclined to remain with the company. Hence, factor ‘loyalty’ is
measured by the three following variables:
I am willing to recommend my company as a good workplace.
I feel proud when talking about my company’s products.
I will work here for a long time even though other companies might offer me a better
wage.
22
3. METHODOLOGY
3.1 Quantitative research
According to Jha (2008), qualitative research, a prevalent scientific method widely applied in
various academic disciplines, is “detailed descriptions of situations, events, people, and
interactions, observed behaviours, direct quotations from people about their experiences,
attitudes, beliefs, and thoughts and excerpts or entire passages from documents,
correspondence, records, and case histories." Its basic objective is to gather in-depth
understanding on research objects using words. Qualitative data can be acquired from a
number of means participant observation, non-participant observation, field notes, reflexive
journals, structured interview, semi-structured interview, unstructured interview, and
analysis of documents and materials (Marshall, 1998). This paper uses analysis of documents
and materials to propose hypotheses and measures for the quantitative research.
In contrast with qualitative research that uses words to describe objects, quantitative
research is a systematic empirical examination by collecting numerical data that are analysed
using mathematically based methods (Muijs, 2004; Jha, 2008). It is mostly viewed as
hypothesis testing exploration. Quantitative research aims to explore relationships among
phenomena, and their classification. The research objective is to figure out factors on
employee loyalty in Hoang Phuc Company; therefore, quantitative research is the best choice
here.
Basically, the research consists of two stages. In stage 1, hypotheses and measures are made
based on existing literature. In stage 2, data collected from the questionnaire are analysed
with the software SPSS in order to evaluate the hypotheses and find out correlations among
the factors. The specific steps are shown in the following diagram.
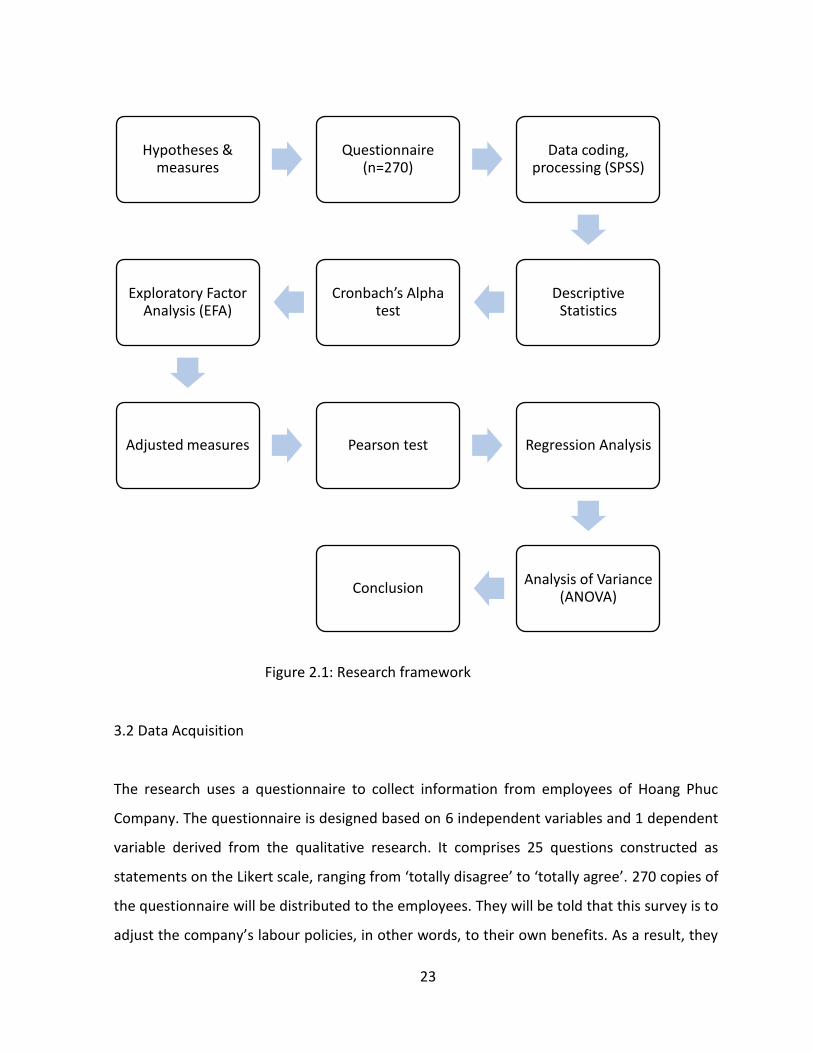
23
Figure 2.1: Research framework
3.2 Data Acquisition
The research uses a questionnaire to collect information from employees of Hoang Phuc
Company. The questionnaire is designed based on 6 independent variables and 1 dependent
variable derived from the qualitative research. It comprises 25 questions constructed as
statements on the Likert scale, ranging from ‘totally disagree’ to ‘totally agree’. 270 copies of
the questionnaire will be distributed to the employees. They will be told that this survey is to
adjust the company’s labour policies, in other words, to their own benefits. As a result, they
Hypotheses & measures
Questionnaire (n=270)
Data coding, processing (SPSS)
Descriptive Statistics
Cronbach’s Alpha test
Exploratory Factor Analysis (EFA)
Adjusted measures Pearson test Regression Analysis
Analysis of Variance (ANOVA)
Conclusion
24
had better take it sincerely and as precisely as possible. For that reason, the survey’s
reliability is at a high level.
3.3 Data Analysis
3.3.1 Data processing
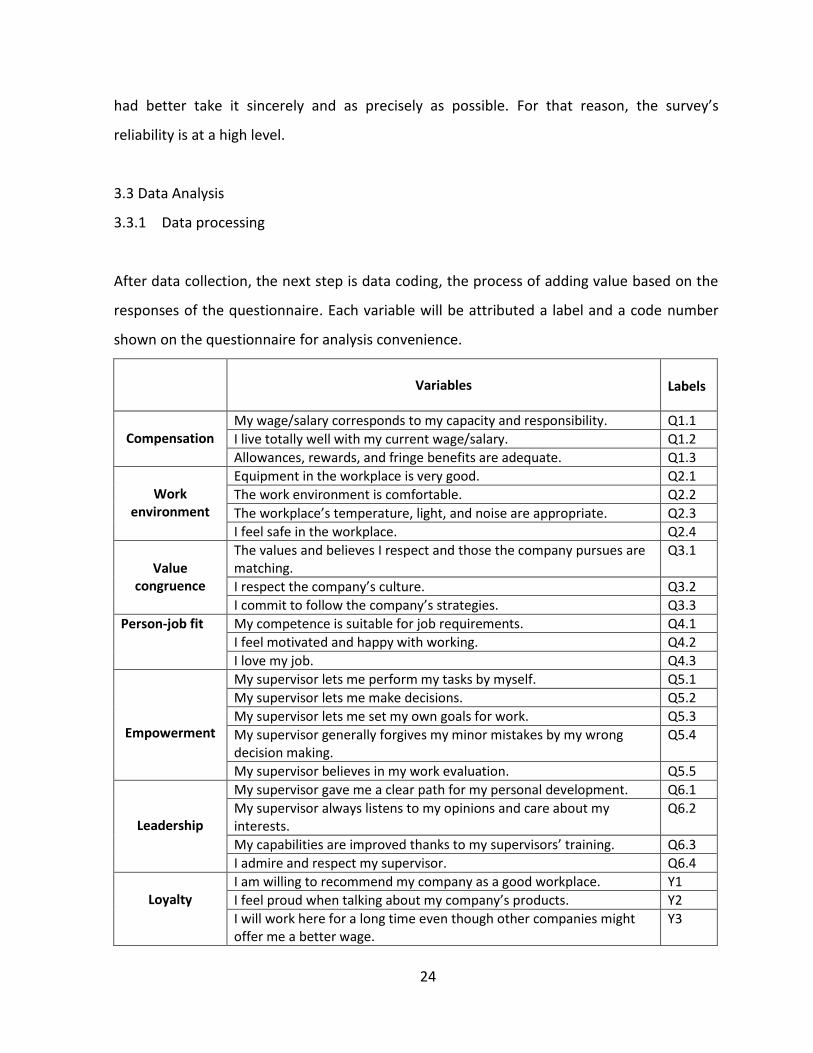
After data collection, the next step is data coding, the process of adding value based on the
responses of the questionnaire. Each variable will be attributed a label and a code number
shown on the questionnaire for analysis convenience.
Factors Variables Labels
Compensation
My wage/salary corresponds to my capacity and responsibility. Q1.1
I live totally well with my current wage/salary. Q1.2
Allowances, rewards, and fringe benefits are adequate. Q1.3
Work
environment
Equipment in the workplace is very good. Q2.1
The work environment is comfortable. Q2.2
The workplace’s temperature, light, and noise are appropriate. Q2.3
I feel safe in the workplace. Q2.4
Value
congruence
The values and believes I respect and those the company pursues are matching.
Q3.1
I respect the company’s culture. Q3.2
I commit to follow the company’s strategies. Q3.3
Person-job fit My competence is suitable for job requirements. Q4.1
I feel motivated and happy with working. Q4.2
I love my job. Q4.3
Empowerment
My supervisor lets me perform my tasks by myself. Q5.1
My supervisor lets me make decisions. Q5.2
My supervisor lets me set my own goals for work. Q5.3
My supervisor generally forgives my minor mistakes by my wrong decision making.
Q5.4
My supervisor believes in my work evaluation. Q5.5
Leadership
My supervisor gave me a clear path for my personal development. Q6.1
My supervisor always listens to my opinions and care about my interests.
Q6.2
My capabilities are improved thanks to my supervisors’ training. Q6.3
I admire and respect my supervisor. Q6.4
Loyalty
I am willing to recommend my company as a good workplace. Y1
I feel proud when talking about my company’s products. Y2
I will work here for a long time even though other companies might offer me a better wage.
Y3
25
After all data are transcribed into computer, SPSS software have data cleaning functions,
detecting mistakes such as value missing. After all, the author get 250 satisfactory samples
(270 copies are distributed), reaching 92,5%.
3.3.2 Descriptive Statistics
The first analysis is descriptive statistics. Descriptive statistic is a set of brief descriptive
coefficient to summarize a given data set, which can either be a representation of the entire
sample or a population. It is applied to describe the basic features of the data in a study,
providing a simple summary about the sample and the measures with simple graphics
analysis (Trochim, 2006). In this research, descriptive statistics is employed to create charts
of employees’ background information.
3.3.3 Scale Assessment
Two tools—Cronbach’s Alpha and Exploratory Factor Analysis (EFA)—are used to assess the
validity and reliability of the scale.
Cronbach’s Alpha, a coefficient of internal consistency, is a concept used in statistics to
evaluate the reliability of a scale, thus eliminating unsatisfactory variables (Cronbach, 1951).
The purpose of this test is to check if variables measure a common concept. In other words,
it can check whether respondents answer seriously or randomly. According to Nunnally
(1994), a variable must meet the two following criteria, otherwise eliminated:
Corrected item-total correlation ≥ 0,3
α ≥ 0,6
Hair (1998) states ‘exploratory factor analysis’ a statistical method used to explore the
underlying structure of a relatively large set of variables, identifying the underlying
26
relationships between measured variables. In EFA, factor loading’s values that are more than
0,5 are considered significant. KMO (Kaiser-Meyer-Olkin) is an indexing indicating the degree
of suitability of EFA method; indexes that is less than 1 and more than 0,5 are considered
suitable. Bartlett’s test is used to test if the EFA test is statistical significant. In short, EFA
must meet the following requirements:
Factor Loading > 0,5
0,5 < KMO < 1
Bartlett’s test Sig. < 0,05
Rotation Sums of Squared Loadings > 50%
Eigenvalue > 1
3.3.4 Inferential Analysis
3.3.4.1 Pearson Correlation Analysis
Pearson's chi-squared test (χ2) is used to measure the independence between a pair of
variables (Gosall, 2012). If the variables are closely correlated, multicollinearity, a statistical
phenomenon in which two or more predictor variables in a multiple regression model are
highly correlated, must be taken into account. The cause of this problem is that statements
made by the researcher are nearly the same. It occurs when Pearson index is more than 0,3.
3.3.4.2 Multiple Regression Analysis
Multiple regression analysis is a statistical method that is applied to analyse the relationship
between the dependent variable and multiple independent variables, in which more than
one independent variable is supposed to influence the dependent variable (Srivastava,
2011). In the multiple regression analysis, multiple independent variables of the study will be
entered into the same types of regression equation. A separate regression of each variable
will be determined to define the relationship with the dependent variable. The relationship
that takes place between each dependent variable and independent variable is linear. All the
27
variables of the questionnaire are measured through the Likert scale. Multiple regressions
will be identified using the following formula to study the relation between the independent
variables and the dependent variable.
Y = β1X1 + β2X2 + β3X3 +.....+ βnXn
Y represents the dependent variable, coefficient β the partial regression coefficient.
3.3.4.3 Analysis of Variance (ANOVA)
Analysis of variance (ANOVA) is a statistical test employed to analyse the differences among
group means (Belle, 2008). If we have only two groups, we could apply the t-test to compare
the means of the groups, but it might come unreliable in case of more than two groups. In
case of only two means, the t-test will give the same outcomes as the ANOVA. There are four
fundamental assumptions in ANOVA as follows:
The errors’ expected values are zero.
The errors’ variances are the same.
The errors are autonomous.
The errors are generally disseminated.
28
4. FINDINGS & ANALYSIS
4.1. Background Information
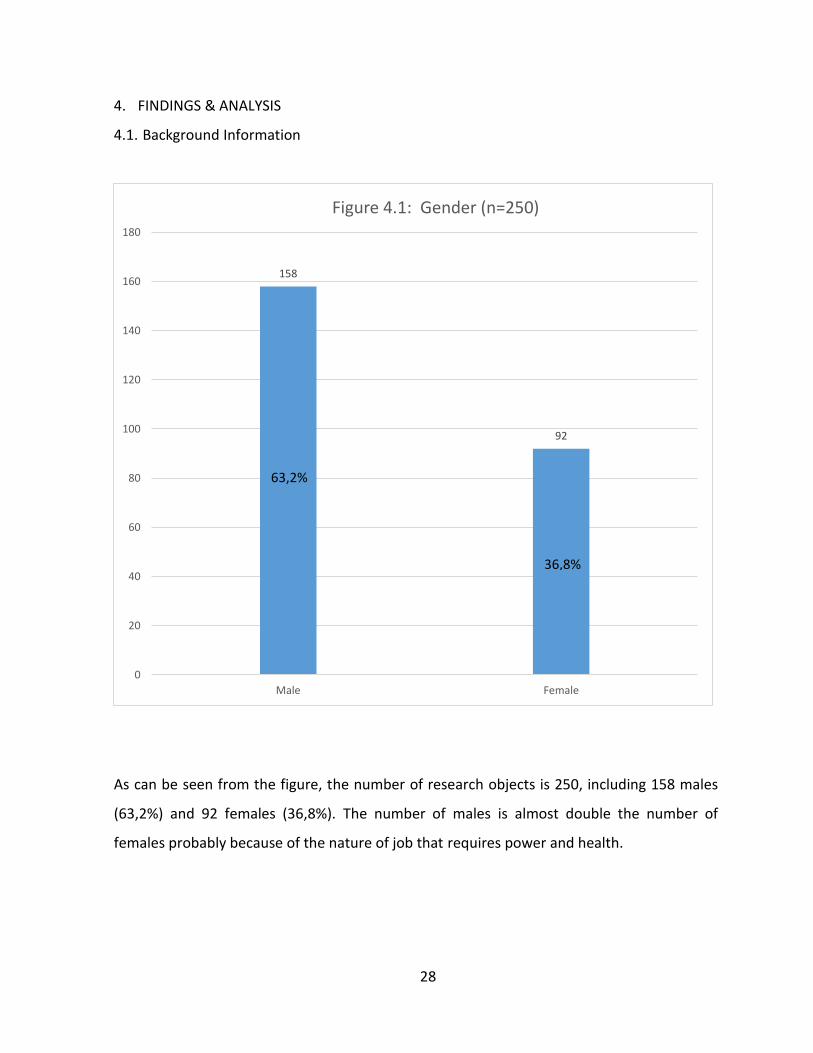
As can be seen from the figure, the number of research objects is 250, including 158 males
(63,2%) and 92 females (36,8%). The number of males is almost double the number of
females probably because of the nature of job that requires power and health.
158
92
0
20
40
60
80
100
120
140
160
180
Male Female
Figure 4.1: Gender (n=250)
63,2%
36,8%
29
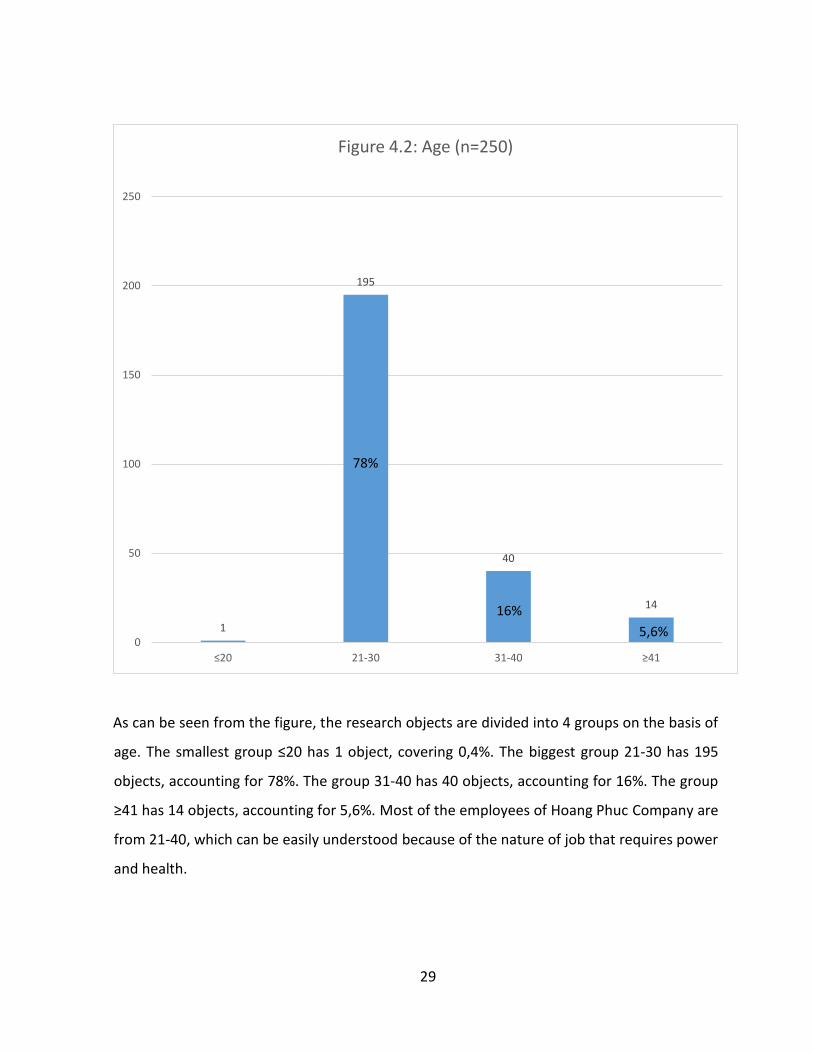
As can be seen from the figure, the research objects are divided into 4 groups on the basis of
age. The smallest group ≤20 has 1 object, covering 0,4%. The biggest group 21-30 has 195
objects, accounting for 78%. The group 31-40 has 40 objects, accounting for 16%. The group
≥41 has 14 objects, accounting for 5,6%. Most of the employees of Hoang Phuc Company are
from 21-40, which can be easily understood because of the nature of job that requires power
and health.
1
195
40
14
0
50
100
150
200
250
≤20 21-30 31-40 ≥41
Figure 4.2: Age (n=250)
78%
16%
5,6%
30
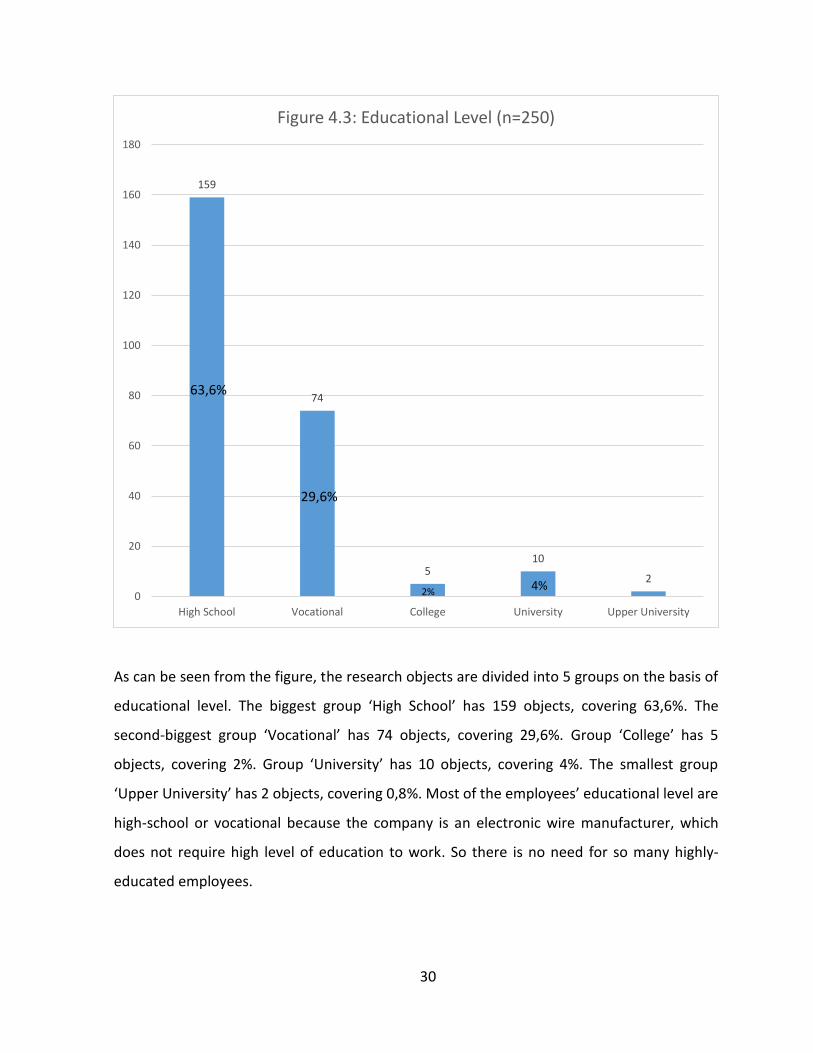
As can be seen from the figure, the research objects are divided into 5 groups on the basis of
educational level. The biggest group ‘High School’ has 159 objects, covering 63,6%. The
second-biggest group ‘Vocational’ has 74 objects, covering 29,6%. Group ‘College’ has 5
objects, covering 2%. Group ‘University’ has 10 objects, covering 4%. The smallest group
‘Upper University’ has 2 objects, covering 0,8%. Most of the employees’ educational level are
high-school or vocational because the company is an electronic wire manufacturer, which
does not require high level of education to work. So there is no need for so many highly-
educated employees.
159
74
5 10
2
0
20
40
60
80
100
120
140
160
180
High School Vocational College University Upper University
Figure 4.3: Educational Level (n=250)
63,6%
29,6%
4% 2%
31
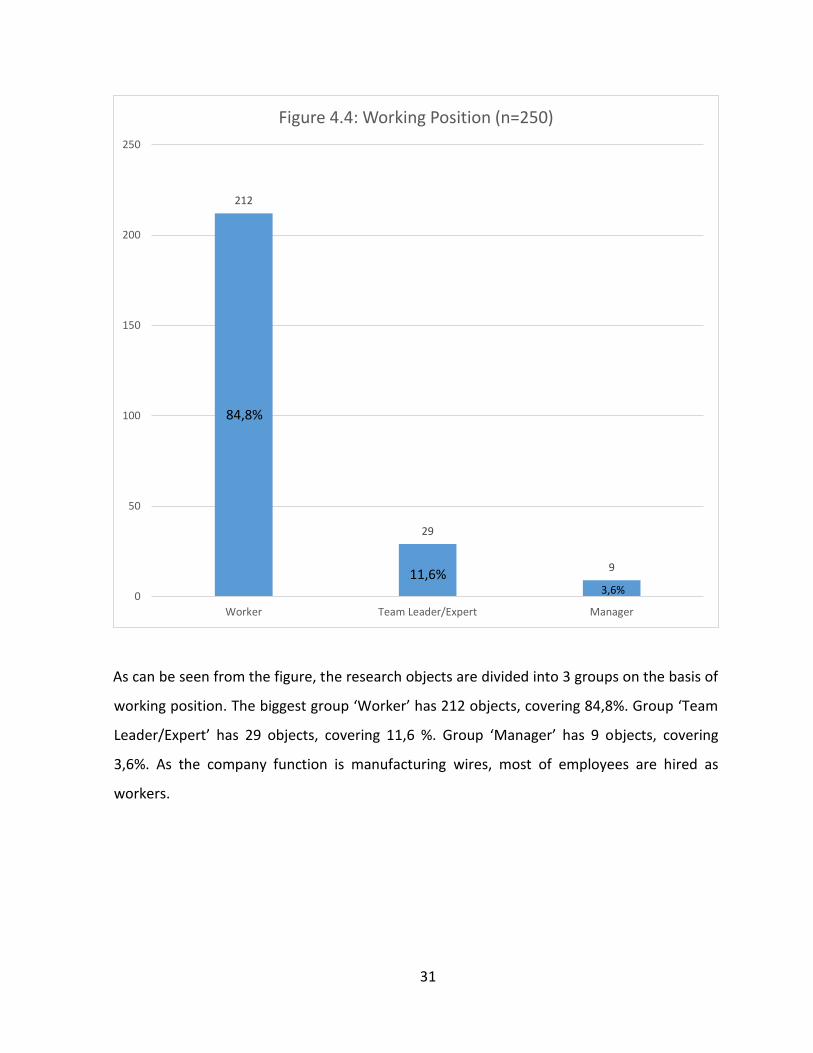
As can be seen from the figure, the research objects are divided into 3 groups on the basis of
working position. The biggest group ‘Worker’ has 212 objects, covering 84,8%. Group ‘Team
Leader/Expert’ has 29 objects, covering 11,6 %. Group ‘Manager’ has 9 objects, covering
3,6%. As the company function is manufacturing wires, most of employees are hired as
workers.
212
29
9
0
50
100
150
200
250
Worker Team Leader/Expert Manager
Figure 4.4: Working Position (n=250)
84,8%
11,6% 3,6%
32
4.2. Descriptive Statistics
4.2.1. Compensation
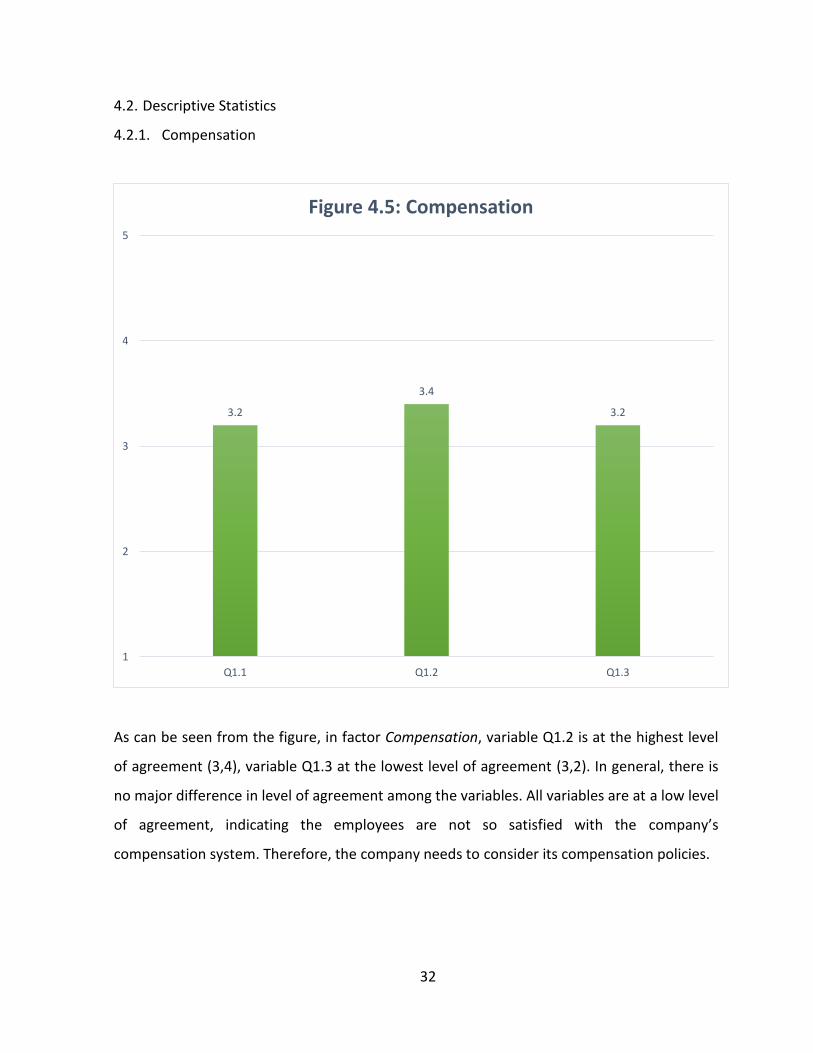
As can be seen from the figure, in factor Compensation, variable Q1.2 is at the highest level
of agreement (3,4), variable Q1.3 at the lowest level of agreement (3,2). In general, there is
no major difference in level of agreement among the variables. All variables are at a low level
of agreement, indicating the employees are not so satisfied with the company’s
compensation system. Therefore, the company needs to consider its compensation policies.
3.2
3.4
3.2
1
2
3
4
5
Q1.1 Q1.2 Q1.3
Figure 4.5: Compensation
33
4.2.2 Work Environment
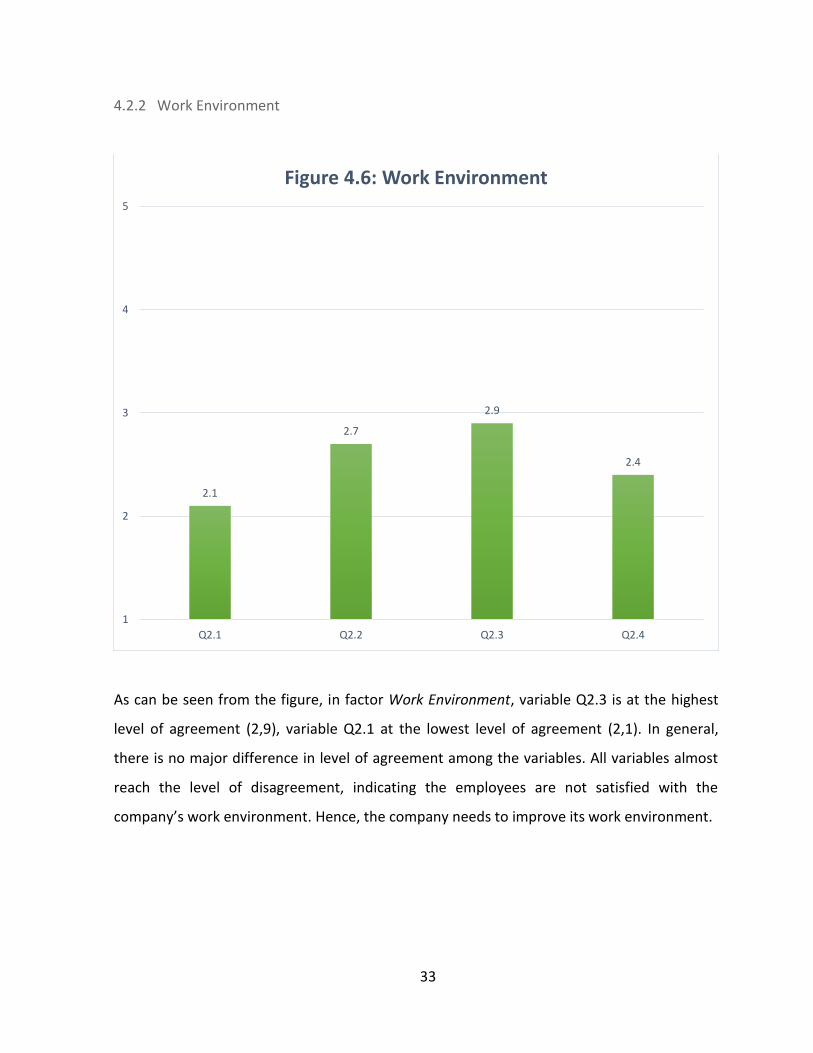
As can be seen from the figure, in factor Work Environment, variable Q2.3 is at the highest
level of agreement (2,9), variable Q2.1 at the lowest level of agreement (2,1). In general,
there is no major difference in level of agreement among the variables. All variables almost
reach the level of disagreement, indicating the employees are not satisfied with the
company’s work environment. Hence, the company needs to improve its work environment.
2.1
2.7
2.9
2.4
1
2
3
4
5
Q2.1 Q2.2 Q2.3 Q2.4
Figure 4.6: Work Environment
34
4.2.3 Value Congruence
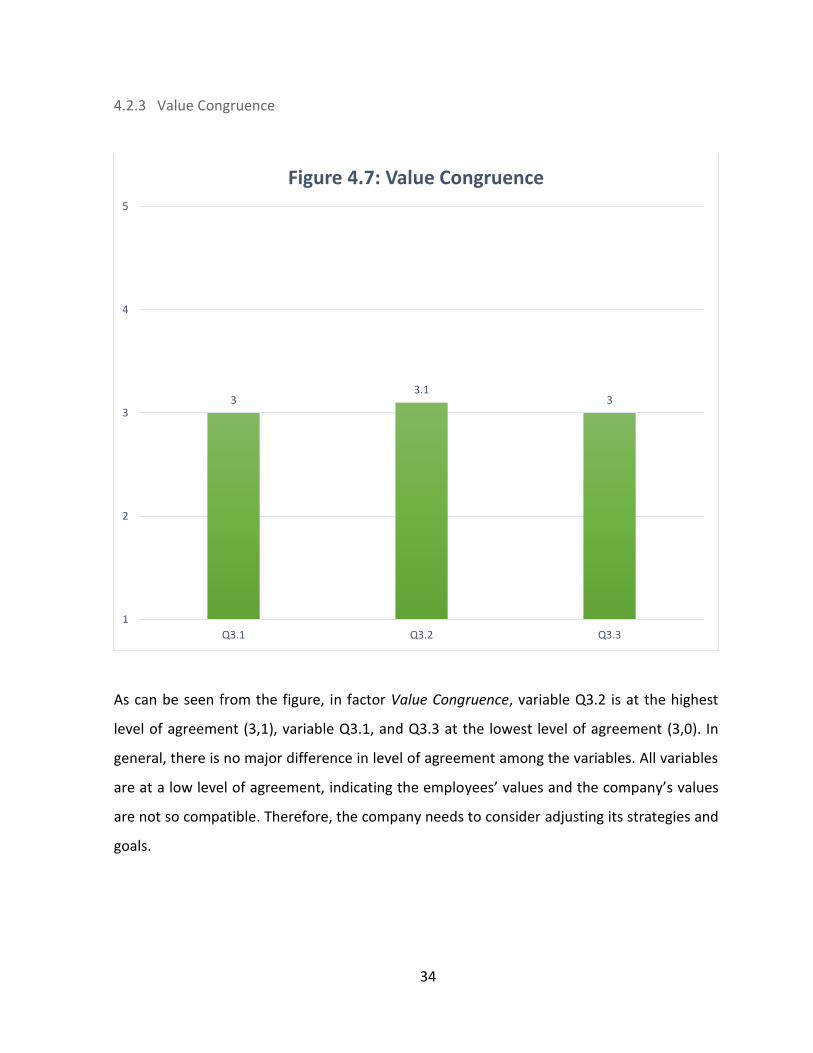
As can be seen from the figure, in factor Value Congruence, variable Q3.2 is at the highest
level of agreement (3,1), variable Q3.1, and Q3.3 at the lowest level of agreement (3,0). In
general, there is no major difference in level of agreement among the variables. All variables
are at a low level of agreement, indicating the employees’ values and the company’s values
are not so compatible. Therefore, the company needs to consider adjusting its strategies and
goals.
3 3.1
3
1
2
3
4
5
Q3.1 Q3.2 Q3.3
Figure 4.7: Value Congruence
35
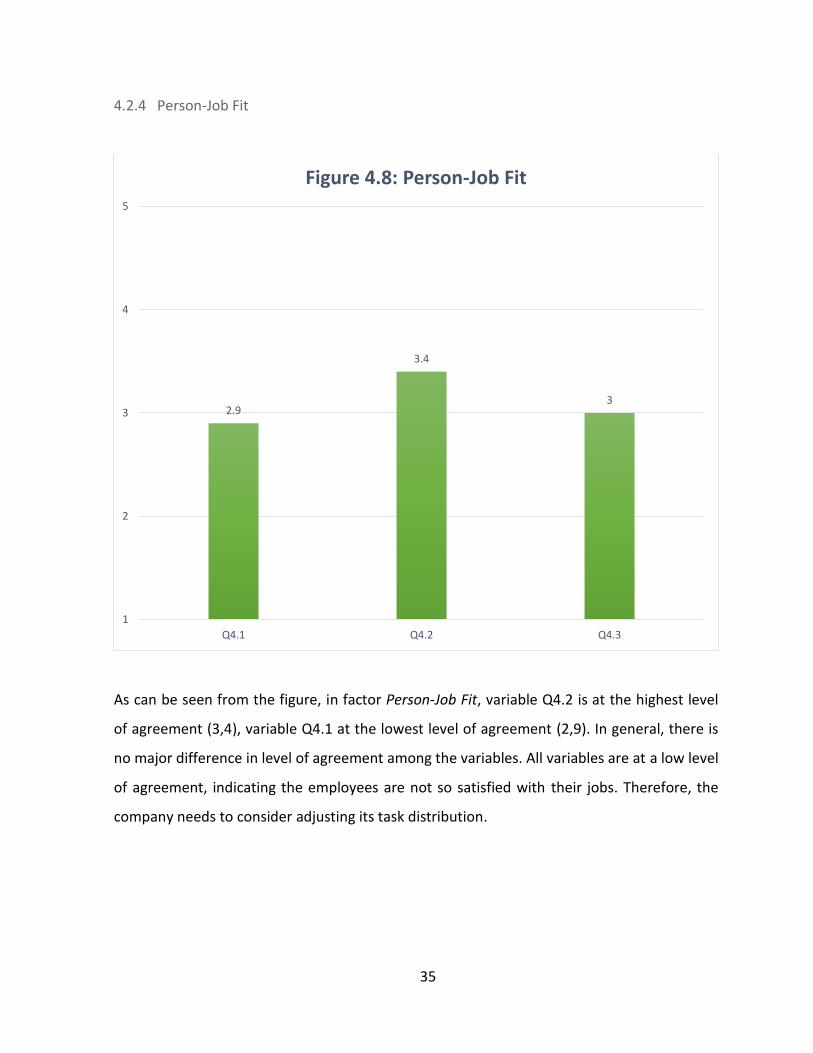
4.2.4 Person-Job Fit
As can be seen from the figure, in factor Person-Job Fit, variable Q4.2 is at the highest level
of agreement (3,4), variable Q4.1 at the lowest level of agreement (2,9). In general, there is
no major difference in level of agreement among the variables. All variables are at a low level
of agreement, indicating the employees are not so satisfied with their jobs. Therefore, the
company needs to consider adjusting its task distribution.
2.9
3.4
3
1
2
3
4
5
Q4.1 Q4.2 Q4.3
Figure 4.8: Person-Job Fit
36
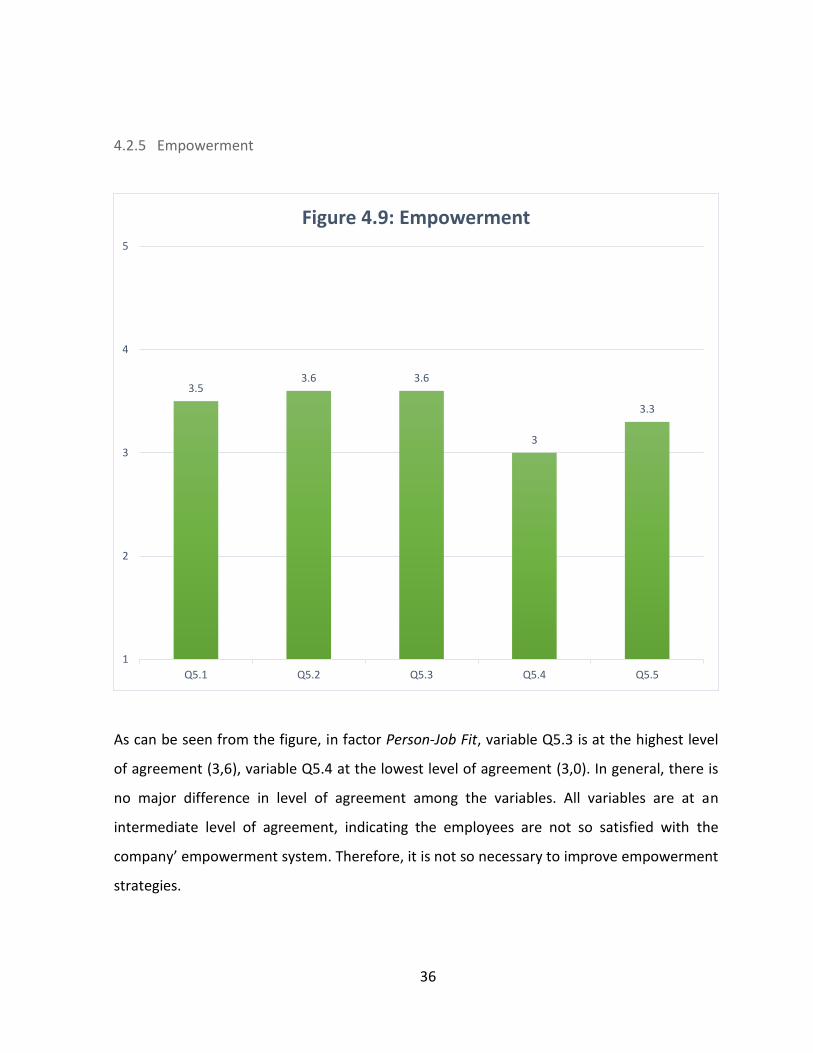
4.2.5 Empowerment
As can be seen from the figure, in factor Person-Job Fit, variable Q5.3 is at the highest level
of agreement (3,6), variable Q5.4 at the lowest level of agreement (3,0). In general, there is
no major difference in level of agreement among the variables. All variables are at an
intermediate level of agreement, indicating the employees are not so satisfied with the
company’ empowerment system. Therefore, it is not so necessary to improve empowerment
strategies.
3.5 3.6 3.6
3
3.3
1
2
3
4
5
Q5.1 Q5.2 Q5.3 Q5.4 Q5.5
Figure 4.9: Empowerment
37
4.2.6 Leadership
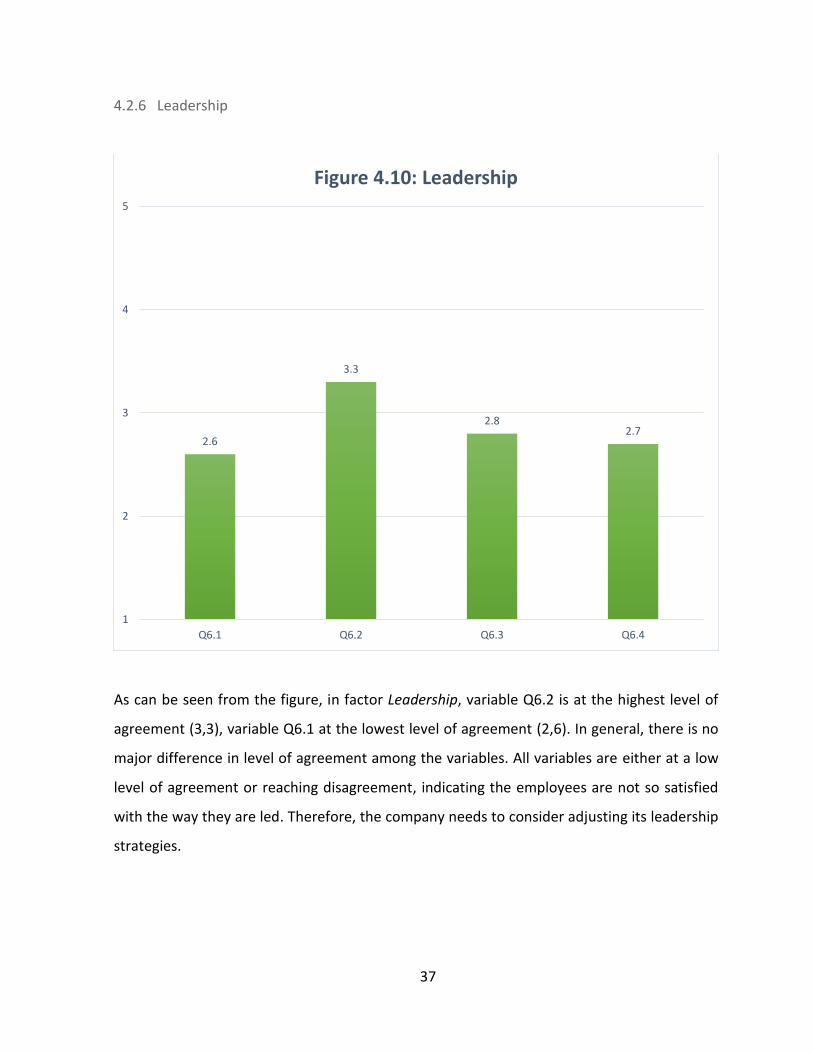
As can be seen from the figure, in factor Leadership, variable Q6.2 is at the highest level of
agreement (3,3), variable Q6.1 at the lowest level of agreement (2,6). In general, there is no
major difference in level of agreement among the variables. All variables are either at a low
level of agreement or reaching disagreement, indicating the employees are not so satisfied
with the way they are led. Therefore, the company needs to consider adjusting its leadership
strategies.
2.6
3.3
2.8 2.7
1
2
3
4
5
Q6.1 Q6.2 Q6.3 Q6.4
Figure 4.10: Leadership
38
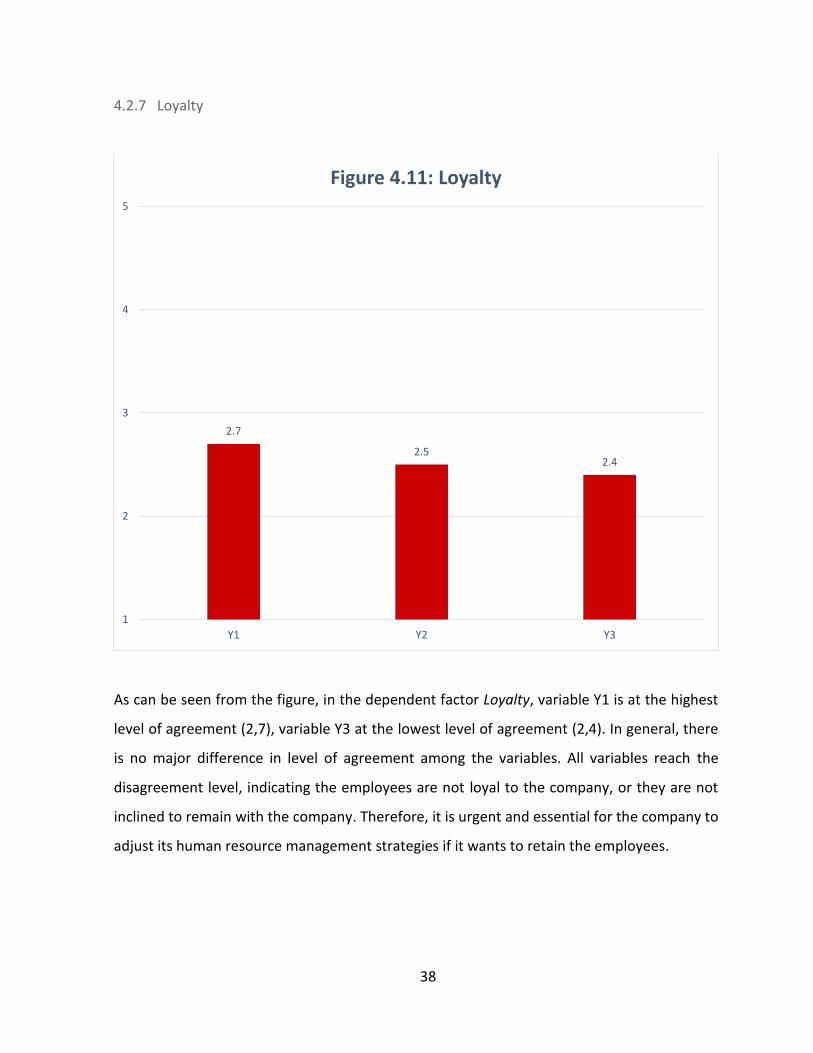
4.2.7 Loyalty
As can be seen from the figure, in the dependent factor Loyalty, variable Y1 is at the highest
level of agreement (2,7), variable Y3 at the lowest level of agreement (2,4). In general, there
is no major difference in level of agreement among the variables. All variables reach the
disagreement level, indicating the employees are not loyal to the company, or they are not
inclined to remain with the company. Therefore, it is urgent and essential for the company to
adjust its human resource management strategies if it wants to retain the employees.
2.7
2.5 2.4
1
2
3
4
5
Y1 Y2 Y3
Figure 4.11: Loyalty
39
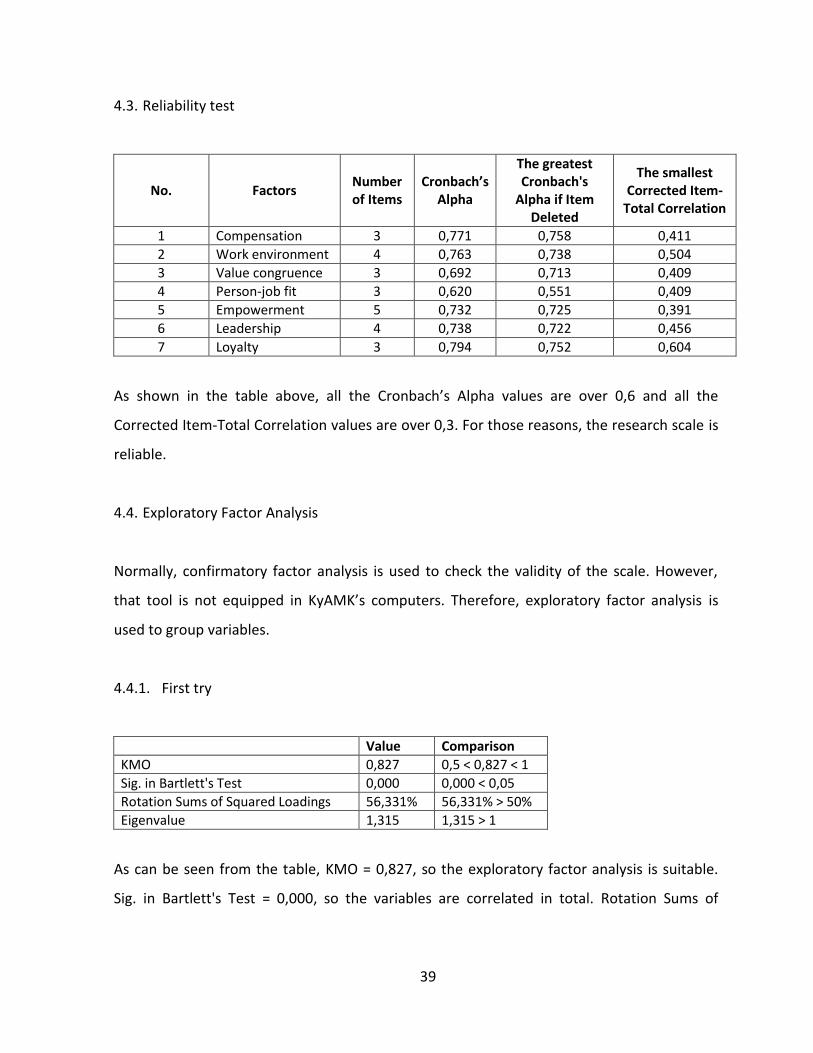
4.3. Reliability test
No. Factors Number of Items
Cronbach’s Alpha
The greatest Cronbach's
Alpha if Item Deleted
The smallest Corrected Item-
Total Correlation
1 Compensation 3 0,771 0,758 0,411
2 Work environment 4 0,763 0,738 0,504
3 Value congruence 3 0,692 0,713 0,409
4 Person-job fit 3 0,620 0,551 0,409
5 Empowerment 5 0,732 0,725 0,391
6 Leadership 4 0,738 0,722 0,456
7 Loyalty 3 0,794 0,752 0,604
As shown in the table above, all the Cronbach’s Alpha values are over 0,6 and all the
Corrected Item-Total Correlation values are over 0,3. For those reasons, the research scale is
reliable.
4.4. Exploratory Factor Analysis
Normally, confirmatory factor analysis is used to check the validity of the scale. However,
that tool is not equipped in KyAMK’s computers. Therefore, exploratory factor analysis is
used to group variables.
4.4.1. First try
Value Comparison
KMO 0,827 0,5 ˂ 0,827 ˂ 1
Sig. in Bartlett's Test 0,000 0,000 ˂ 0,05
Rotation Sums of Squared Loadings 56,331% 56,331% ˃ 50%
Eigenvalue 1,315 1,315 ˃ 1
As can be seen from the table, KMO = 0,827, so the exploratory factor analysis is suitable.
Sig. in Bartlett's Test = 0,000, so the variables are correlated in total. Rotation Sums of
40
Squared Loadings = 56,331%, meaning 56,331% of total variance is explained by 5 new
factors. Eigenvalue = 1,315, so new factors are suitable.
Rotated Component Matrix
Component
1 2 3 4 5
Q3.2 ,717
Q4.2 ,674
Q4.3 ,659
Q4.1 ,620
Q3.3 ,619
Q3.1 ,601
Q2.4 ,766
Q2.2 ,764
Q2.1 ,714
Q2.3 ,648
Q5.1 ,776
Q5.2 ,769
Q5.3 ,760
Q5.4 ,480
Q5.5 ,387 ,434
Q6.1 ,757
Q6.3 ,747
Q6.2 ,732
Q6.4 ,575
Q1.2 ,834
Q1.1 ,769
Q1.3 ,591
41
Almost all the factor loading values are over 0,5, except variables Q5.4 and Q5.5, which are
less than 0,5. Accordingly, they must be eliminated, and the EFA test must be run again.
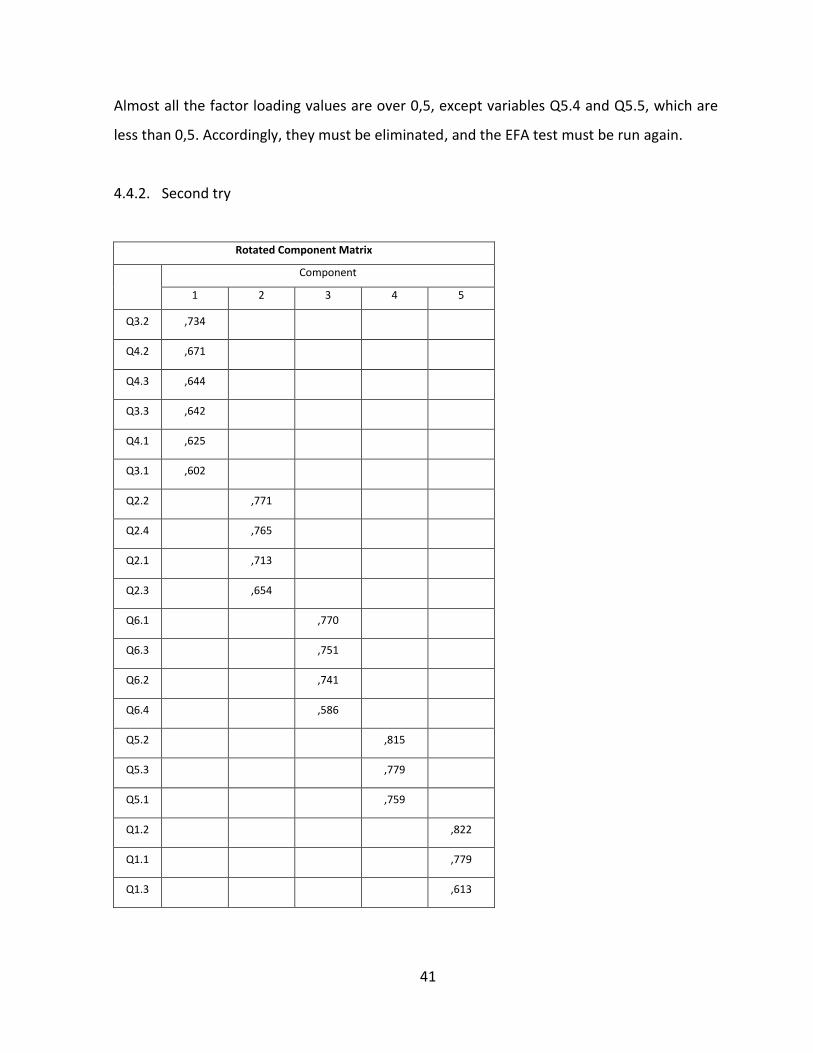
4.4.2. Second try
Rotated Component Matrix
Component
1 2 3 4 5
Q3.2 ,734
Q4.2 ,671
Q4.3 ,644
Q3.3 ,642
Q4.1 ,625
Q3.1 ,602
Q2.2 ,771
Q2.4 ,765
Q2.1 ,713
Q2.3 ,654
Q6.1 ,770
Q6.3 ,751
Q6.2 ,741
Q6.4 ,586
Q5.2 ,815
Q5.3 ,779
Q5.1 ,759
Q1.2 ,822
Q1.1 ,779
Q1.3 ,613
42
As can be seen, variables Q3.1, Q3.2, Q3.3, Q4.1, Q4.2, Q4.3, in factor ‘Value Congruence’
and ‘Person-job fit’ are grouped into a new factor. Therefore, we can name the new factor as
‘Person-environment fit’. The other factors still remain the same as before.
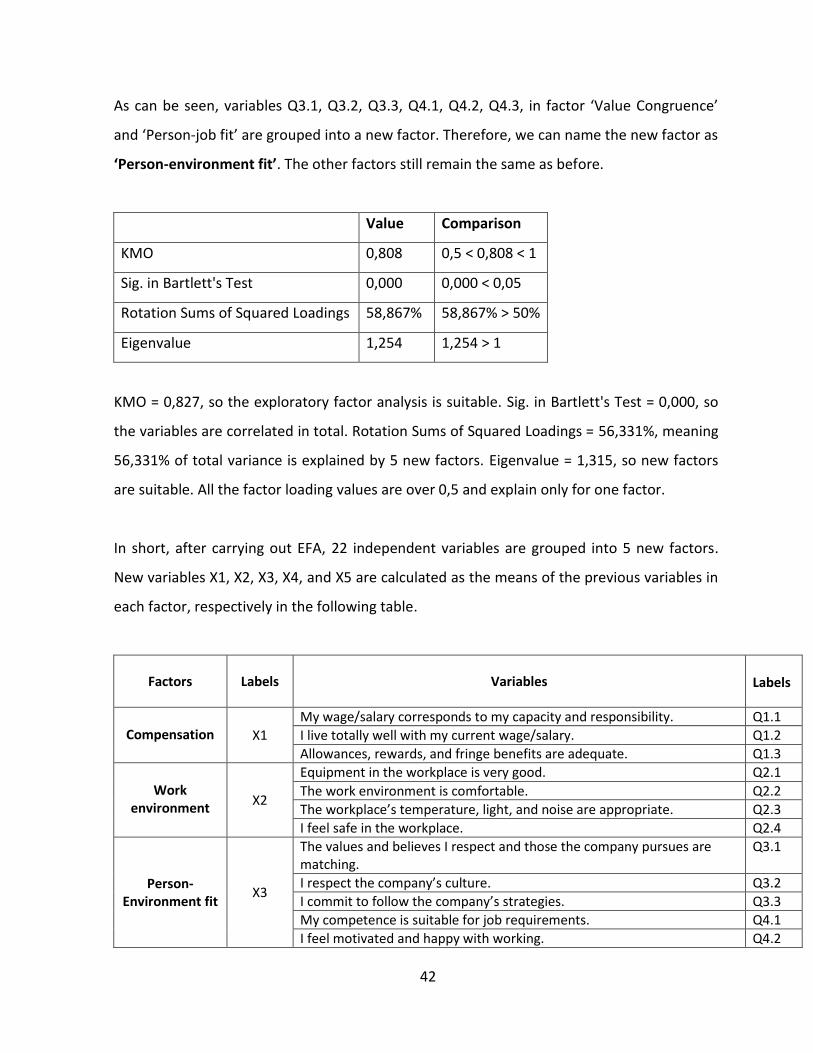
Value Comparison
KMO 0,808 0,5 ˂ 0,808 ˂ 1
Sig. in Bartlett's Test 0,000 0,000 ˂ 0,05
Rotation Sums of Squared Loadings 58,867% 58,867% ˃ 50%
Eigenvalue 1,254 1,254 ˃ 1
KMO = 0,827, so the exploratory factor analysis is suitable. Sig. in Bartlett's Test = 0,000, so
the variables are correlated in total. Rotation Sums of Squared Loadings = 56,331%, meaning
56,331% of total variance is explained by 5 new factors. Eigenvalue = 1,315, so new factors
are suitable. All the factor loading values are over 0,5 and explain only for one factor.
In short, after carrying out EFA, 22 independent variables are grouped into 5 new factors.
New variables X1, X2, X3, X4, and X5 are calculated as the means of the previous variables in
each factor, respectively in the following table.
Factors Labels Variables Labels
Compensation X1
My wage/salary corresponds to my capacity and responsibility. Q1.1
I live totally well with my current wage/salary. Q1.2
Allowances, rewards, and fringe benefits are adequate. Q1.3
Work
environment X2
Equipment in the workplace is very good. Q2.1
The work environment is comfortable. Q2.2
The workplace’s temperature, light, and noise are appropriate. Q2.3
I feel safe in the workplace. Q2.4
Person-Environment fit
X3
The values and believes I respect and those the company pursues are matching.
Q3.1
I respect the company’s culture. Q3.2
I commit to follow the company’s strategies. Q3.3
My competence is suitable for job requirements. Q4.1
I feel motivated and happy with working. Q4.2
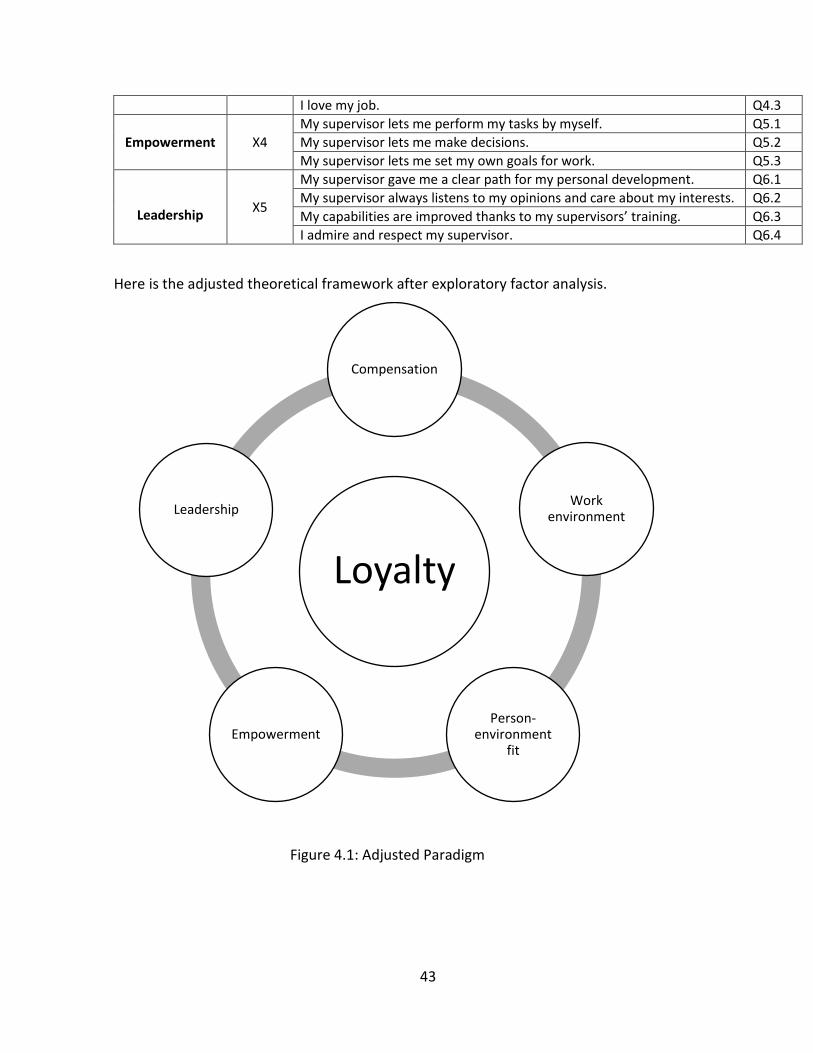
43
I love my job. Q4.3
Empowerment X4
My supervisor lets me perform my tasks by myself. Q5.1
My supervisor lets me make decisions. Q5.2
My supervisor lets me set my own goals for work. Q5.3
Leadership X5
My supervisor gave me a clear path for my personal development. Q6.1
My supervisor always listens to my opinions and care about my interests. Q6.2
My capabilities are improved thanks to my supervisors’ training. Q6.3
I admire and respect my supervisor. Q6.4
Here is the adjusted theoretical framework after exploratory factor analysis.
Figure 4.1: Adjusted Paradigm
Loyalty
Compensation
Work environment
Person-environment
fit Empowerment
Leadership
44
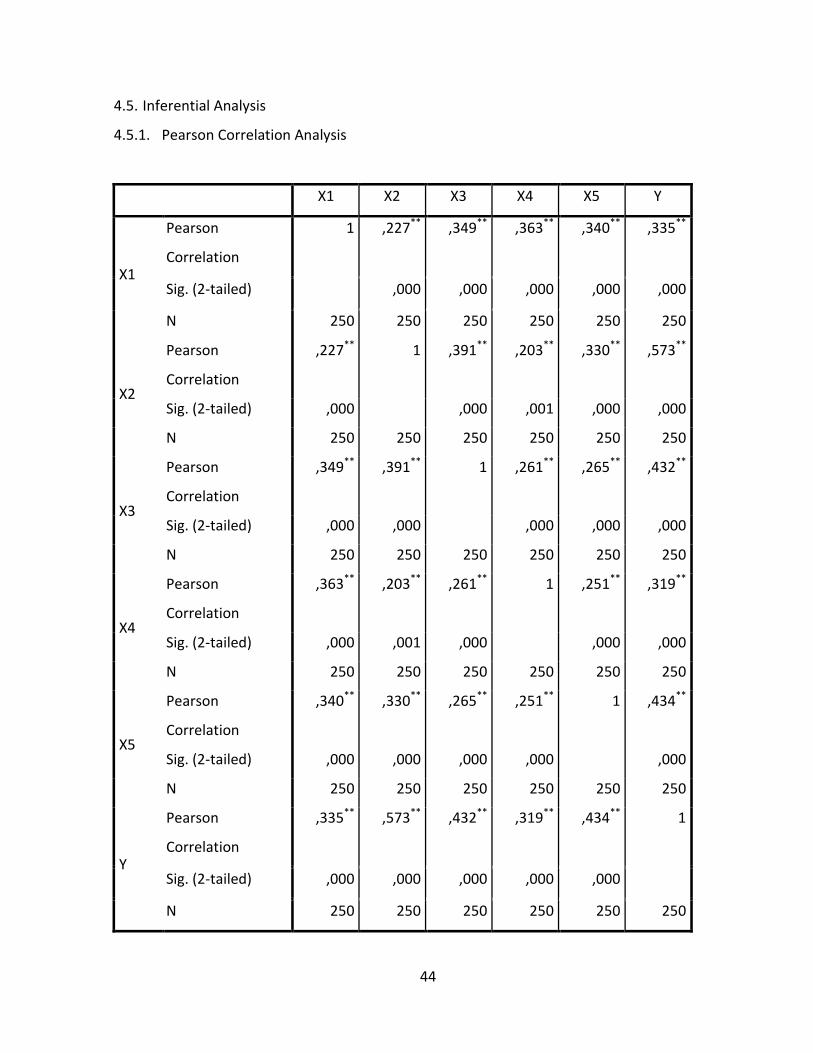
4.5. Inferential Analysis
4.5.1. Pearson Correlation Analysis
X1 X2 X3 X4 X5 Y
X1
Pearson
Correlation
1 ,227** ,349** ,363** ,340** ,335**
Sig. (2-tailed) ,000 ,000 ,000 ,000 ,000
N 250 250 250 250 250 250
X2
Pearson
Correlation
,227** 1 ,391** ,203** ,330** ,573**
Sig. (2-tailed) ,000 ,000 ,001 ,000 ,000
N 250 250 250 250 250 250
X3
Pearson
Correlation
,349** ,391** 1 ,261** ,265** ,432**
Sig. (2-tailed) ,000 ,000 ,000 ,000 ,000
N 250 250 250 250 250 250
X4
Pearson
Correlation
,363** ,203** ,261** 1 ,251** ,319**
Sig. (2-tailed) ,000 ,001 ,000 ,000 ,000
N 250 250 250 250 250 250
X5
Pearson
Correlation
,340** ,330** ,265** ,251** 1 ,434**
Sig. (2-tailed) ,000 ,000 ,000 ,000 ,000
N 250 250 250 250 250 250
Y
Pearson
Correlation
,335** ,573** ,432** ,319** ,434** 1
Sig. (2-tailed) ,000 ,000 ,000 ,000 ,000
N 250 250 250 250 250 250
45
All Sig. values in the table are less than 0,05, so all the pair of variables are correlated and
statistical significant.
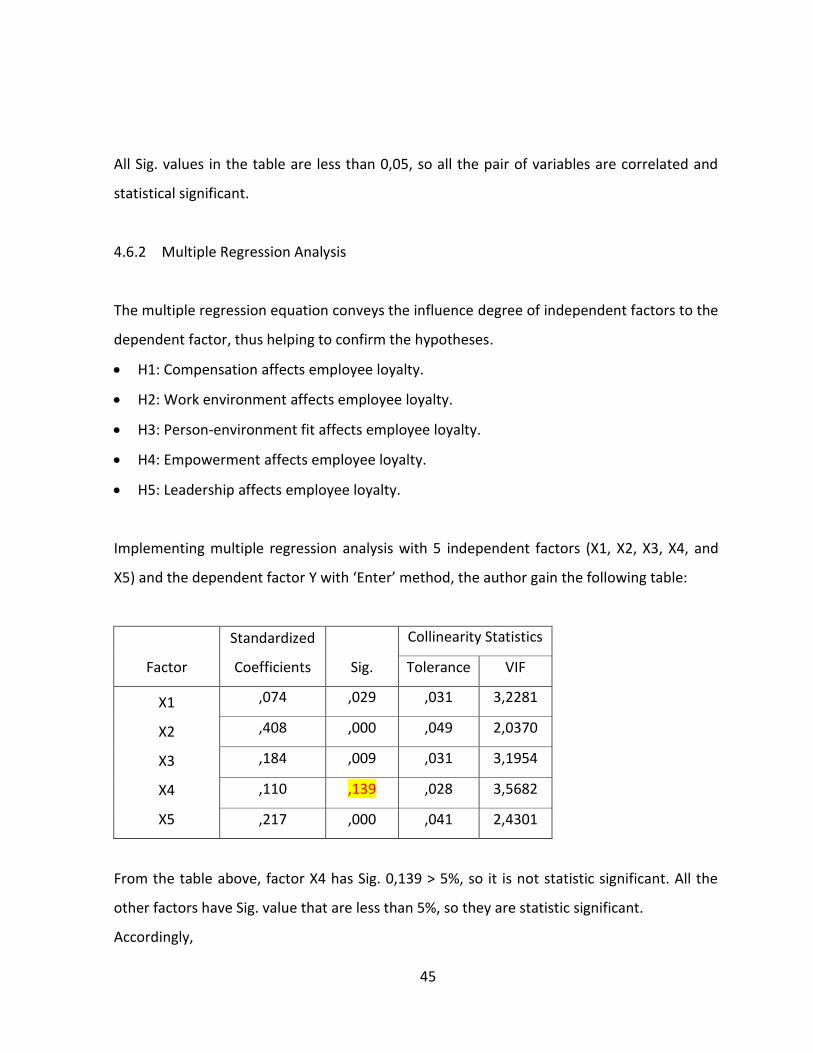
4.6.2 Multiple Regression Analysis
The multiple regression equation conveys the influence degree of independent factors to the
dependent factor, thus helping to confirm the hypotheses.
H1: Compensation affects employee loyalty.
H2: Work environment affects employee loyalty.
H3: Person-environment fit affects employee loyalty.
H4: Empowerment affects employee loyalty.
H5: Leadership affects employee loyalty.
Implementing multiple regression analysis with 5 independent factors (X1, X2, X3, X4, and
X5) and the dependent factor Y with ‘Enter’ method, the author gain the following table:
Factor
Standardized
Coefficients Sig.
Collinearity Statistics
Tolerance VIF
X1
X2
X3
X4
X5
,074 ,029 ,031 3,2281
,408 ,000 ,049 2,0370
,184 ,009 ,031 3,1954
,110 ,139 ,028 3,5682
,217 ,000 ,041 2,4301
From the table above, factor X4 has Sig. 0,139 ˃ 5%, so it is not statistic significant. All the
other factors have Sig. value that are less than 5%, so they are statistic significant.
Accordingly,
46
Hypothesis H4 is denied, meaning empowerment does not affect employee loyalty in
Hoang Phuc Company.
Hypotheses H1, H2, H3, and H5 are accepted, meaning factors compensation, work
environment, person-environment fit, and leadership does affect employee loyalty in
Hoang Phuc Company.
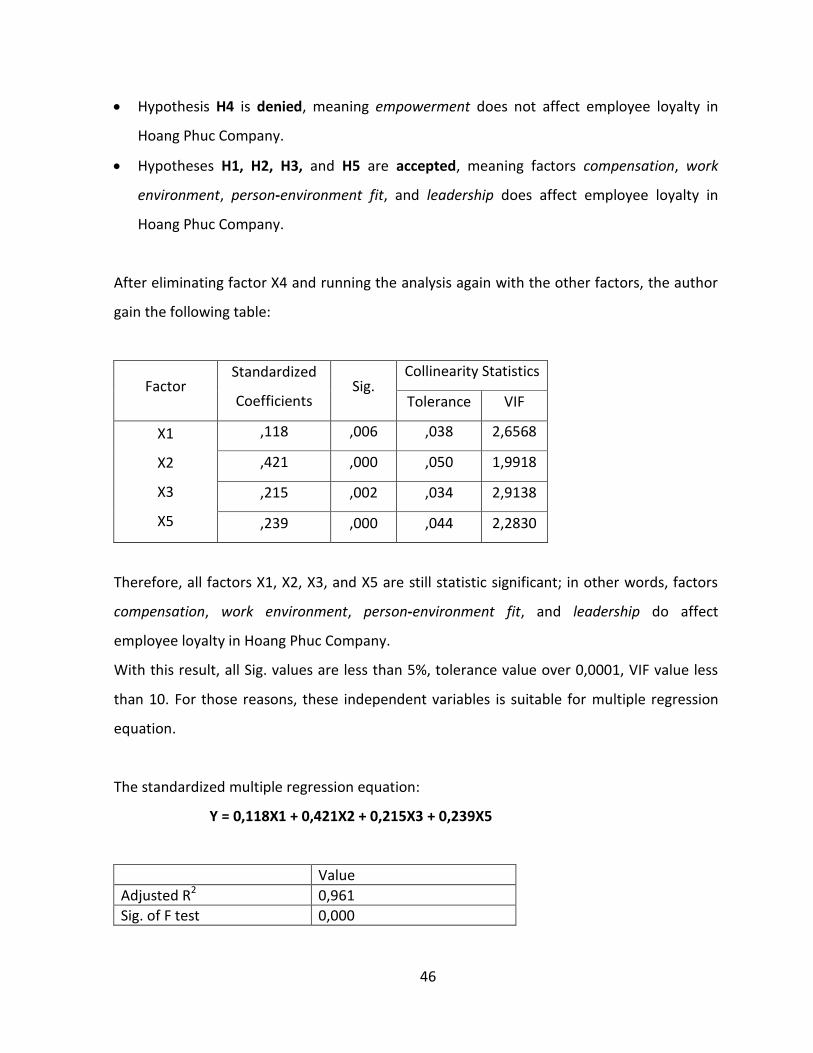
After eliminating factor X4 and running the analysis again with the other factors, the author
gain the following table:
Factor Standardized
Coefficients Sig.
Collinearity Statistics
Tolerance VIF
X1
X2
X3
X5
,118 ,006 ,038 2,6568
,421 ,000 ,050 1,9918
,215 ,002 ,034 2,9138
,239 ,000 ,044 2,2830
Therefore, all factors X1, X2, X3, and X5 are still statistic significant; in other words, factors
compensation, work environment, person-environment fit, and leadership do affect
employee loyalty in Hoang Phuc Company.
With this result, all Sig. values are less than 5%, tolerance value over 0,0001, VIF value less
than 10. For those reasons, these independent variables is suitable for multiple regression
equation.
The standardized multiple regression equation:
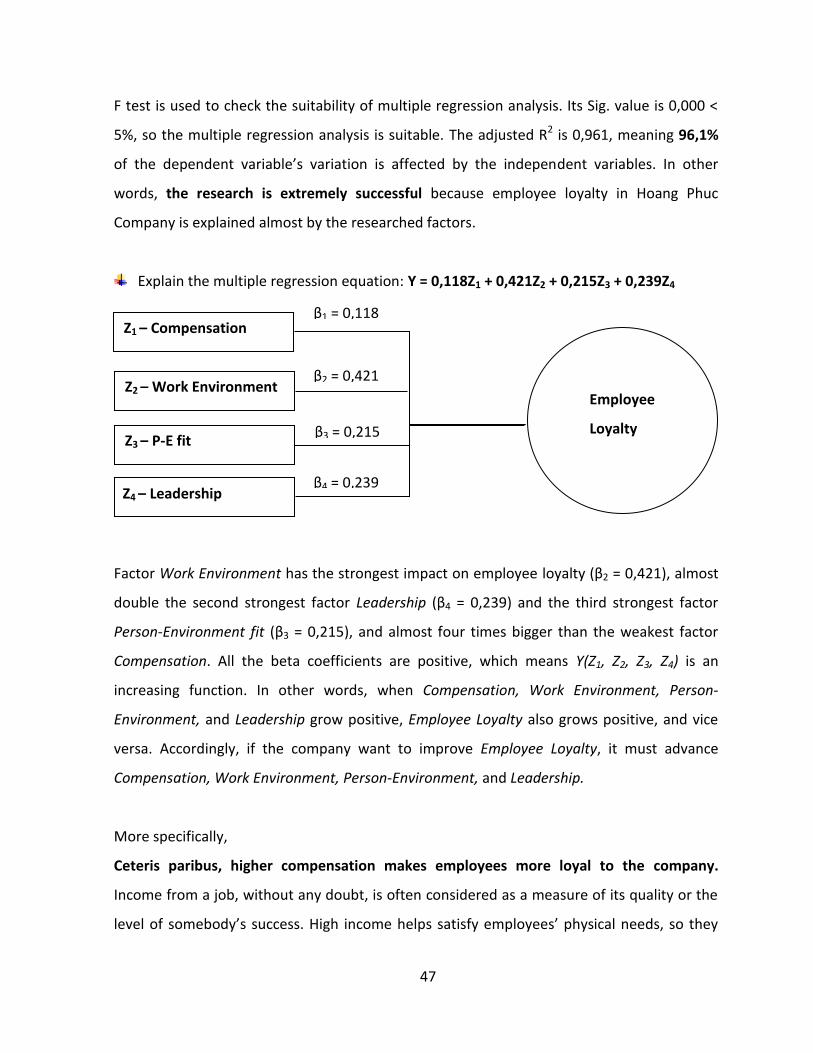
Y = 0,118X1 + 0,421X2 + 0,215X3 + 0,239X5
Value
Adjusted R2 0,961
Sig. of F test 0,000
47
F test is used to check the suitability of multiple regression analysis. Its Sig. value is 0,000 ˂
5%, so the multiple regression analysis is suitable. The adjusted R2 is 0,961, meaning 96,1%
of the dependent variable’s variation is affected by the independent variables. In other
words, the research is extremely successful because employee loyalty in Hoang Phuc
Company is explained almost by the researched factors.
Explain the multiple regression equation: Y = 0,118Z1 + 0,421Z2 + 0,215Z3 + 0,239Z4
Factor Work Environment has the strongest impact on employee loyalty (β2 = 0,421), almost
double the second strongest factor Leadership (β4 = 0,239) and the third strongest factor
Person-Environment fit (β3 = 0,215), and almost four times bigger than the weakest factor
Compensation. All the beta coefficients are positive, which means Y(Z1, Z2, Z3, Z4) is an
increasing function. In other words, when Compensation, Work Environment, Person-
Environment, and Leadership grow positive, Employee Loyalty also grows positive, and vice
versa. Accordingly, if the company want to improve Employee Loyalty, it must advance
Compensation, Work Environment, Person-Environment, and Leadership.
More specifically,
Ceteris paribus, higher compensation makes employees more loyal to the company.
Income from a job, without any doubt, is often considered as a measure of its quality or the
level of somebody’s success. High income helps satisfy employees’ physical needs, so they
Z1 – Compensation
Z2 – Work Environment
Z3 – P-E fit
Z4 – Leadership
Employee
Loyalty
β1 = 0,118
β2 = 0,421
β3 = 0,215
β4 = 0,239
48
can devote wholeheartedly to the job, paying more attention to the self-actualisation need.
They are highly motivated to perform well, and less inclined to look for another job. As a
result, they will have intention to remain with the company.
Ceteris paribus, comfortable work environment makes employees more loyal to the
company. This is the strongest factor on employee loyalty. This can be explained that Hoang
Phuc Company is a manufacturing firm, most employees of which are workers, working in an
industrial manufacturing environment. Therefore, workers need a clean, bright, adequately-
ventilated environment, which makes them comfortable, powerful, and enthusiastic, thus
loving their job and intending to remain with the company.
Ceteris paribus, person-environment fit makes employees more loyal to the company.
When employees can apply their knowledge and skills in their job, they will perform well and
find their job a source of happiness. In other words, they feel motivated, enthusiastic, and
satisfied with their job. As a result, they will desire to remain with that source of happiness
instead of risking with another job.
Ceteris paribus, effective leadership fit makes employees more loyal to the company.
When leaders are good-hearted and competent enough, they can not only develop the
company, but also develop their followers. In other words, leaders will receive charisma of
followers. Hence, regarding followers’ behaviours with the charismatic leader, followers
show a high degree of respect for the leader, a high degree of faith in the leader, and a high
level of satisfaction with the leader. Concerning the followers’ attitudes to the task, followers
manifest a high degree of cohesion within the team group, a high level of task performance,
and a high level of feeling empowered within the organization to complete tasks. When
employees gain benefits, they will intend to remain with the company.
4.6.3 Analysis of Variance (ANOVA)
4.6.3.1 Gender
49
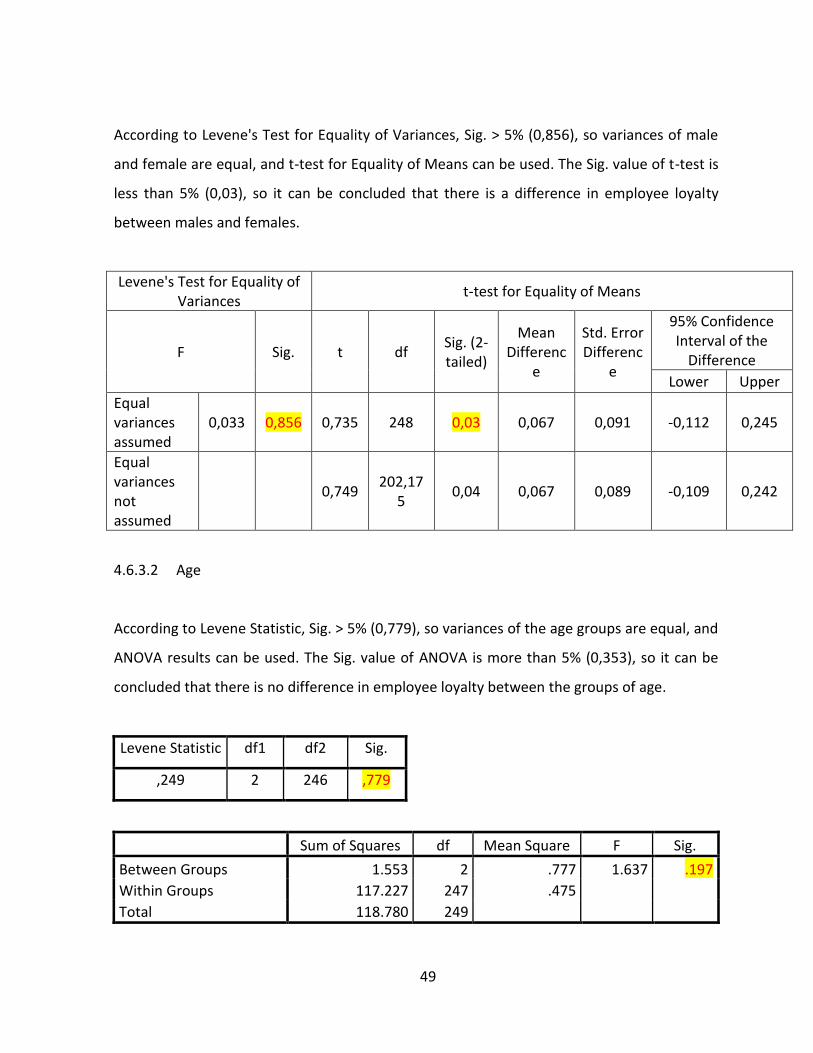
According to Levene's Test for Equality of Variances, Sig. ˃ 5% (0,856), so variances of male
and female are equal, and t-test for Equality of Means can be used. The Sig. value of t-test is
less than 5% (0,03), so it can be concluded that there is a difference in employee loyalty
between males and females.
Levene's Test for Equality of Variances
t-test for Equality of Means
F Sig. t df Sig. (2-tailed)
Mean Differenc
e
Std. Error Differenc
e
95% Confidence Interval of the
Difference
Lower Upper
Equal variances assumed
0,033 0,856 0,735 248 0,03 0,067 0,091 -0,112 0,245
Equal variances not assumed
0,749
202,175
0,04 0,067 0,089 -0,109 0,242
4.6.3.2 Age
According to Levene Statistic, Sig. ˃ 5% (0,779), so variances of the age groups are equal, and
ANOVA results can be used. The Sig. value of ANOVA is more than 5% (0,353), so it can be
concluded that there is no difference in employee loyalty between the groups of age.
Levene Statistic df1 df2 Sig.
,249 2 246 ,779
Sum of Squares df Mean Square F Sig.
Between Groups 1.553 2 .777 1.637 .197
Within Groups 117.227 247 .475
Total 118.780 249
50
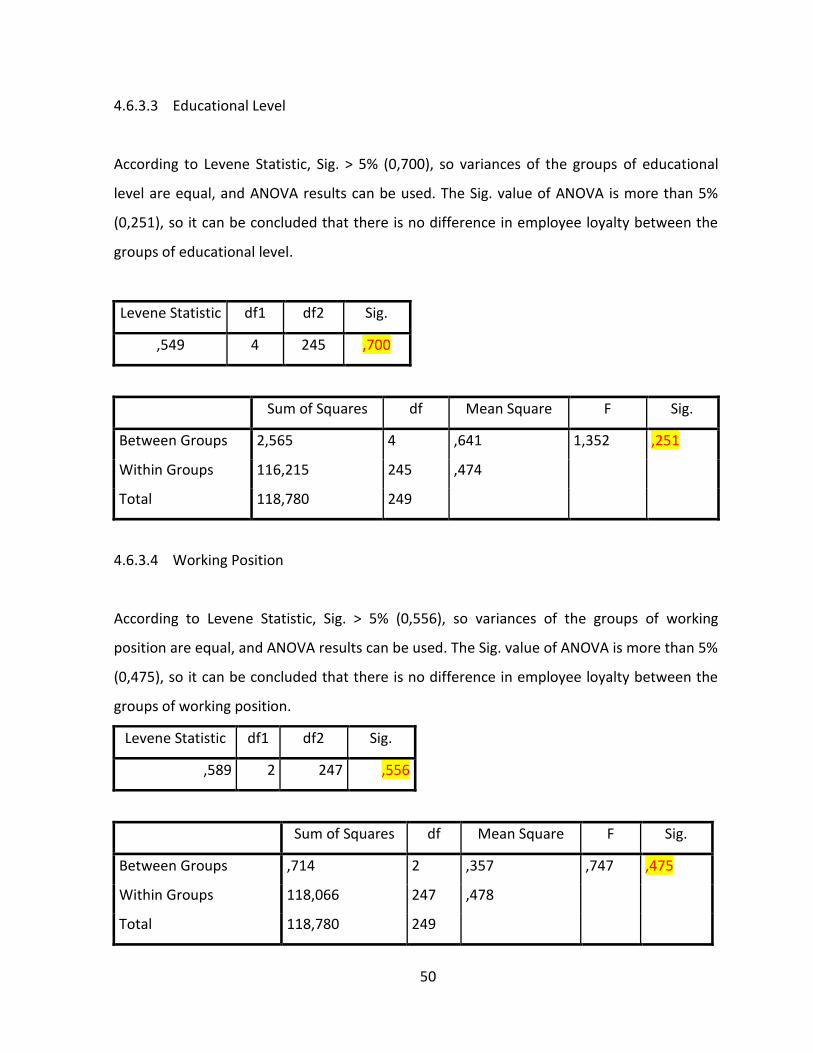
4.6.3.3 Educational Level
According to Levene Statistic, Sig. ˃ 5% (0,700), so variances of the groups of educational
level are equal, and ANOVA results can be used. The Sig. value of ANOVA is more than 5%
(0,251), so it can be concluded that there is no difference in employee loyalty between the
groups of educational level.
Levene Statistic df1 df2 Sig.
,549 4 245 ,700
Sum of Squares df Mean Square F Sig.
Between Groups 2,565 4 ,641 1,352 ,251
Within Groups 116,215 245 ,474
Total 118,780 249
4.6.3.4 Working Position
According to Levene Statistic, Sig. ˃ 5% (0,556), so variances of the groups of working
position are equal, and ANOVA results can be used. The Sig. value of ANOVA is more than 5%
(0,475), so it can be concluded that there is no difference in employee loyalty between the
groups of working position.
Levene Statistic df1 df2 Sig.
,589 2 247 ,556
Sum of Squares df Mean Square F Sig.
Between Groups ,714 2 ,357 ,747 ,475
Within Groups 118,066 247 ,478
Total 118,780 249
51
5 CONCLUSION & SUGGESTION
5.1 Results
The initial paradigm includes 6 factors on employee loyalty as follows: Compensation, Work
Environment, Value Congruence, Person-Job Fit, Empowerment, and Leadership along with
25 variables. The descriptive statistics has shown that the employees are pretty satisfied
with Empowerment and Compensation; moderately satisfied with Value Congruence and
Person-Job Fit; and pretty unsatisfied with Work Environment and Leadership. The research
also indicates that the employees are not loyalty to the company, that is, not inclined to
remain with the company. After Cronbach’s Alpha test and exploratory factor analysis, the
variables are grouped into 5 factors. One new factor Person-Environment Fit is the
combination of factors Value Congruence and Person-Job Fit.
The multiple regression analysis indicates that Employee Loyalty is affected mostly by 4
factors: Compensation, Work Environment, Person-Environment Fit, and Leadership. In other
words, the research is extremely successful in accomplishing its objective. In particular,
factor Work Environment has the strongest influence on employee loyalty, the second
strongest Leadership, the third strongest Person-Environment Fit, the weakest
Compensation. The hypotheses are confirmed that high compensation, comfortable work
environment, high degree of person-environment fit, and effective leadership make
employees loyal to the company. The analysis of variance shows that gender affects
employee loyalty in Hoang Phuc Company. Age, educational level, and working position have
no impact on employee loyalty.
5.2 Implications
First, the company needs to constitute a more competitive compensation system as the
employees are not so satisfied with the current compensation system. The company must
consider the nature of jobs carefully, having a certain plan to determine differential
52
compensation on the basis of various job requirements concerning diverse skill, effort,
responsibility and working conditions. Effort must be made to keep the company’s the level
of wages in line with that obtained in the labour market or industry. Regardless of individual
consideration, the company must ensure equal pay for equal work based on flexibility of
jobs. A plan must be made to adapt fair measure for admitting individual differences in
capability and contribution. The company should make attempt to provide some procedure
for dealing with wage complains.
Second, the company should make the workplace as pleasing, clean and neat as possible.
The adequacy of ventilation, lighting and equipment must be checked regularly. Unusual
heat, noise, dust and fumes must be routinely corrected. Hazardous conditions at the
workplace should be removed. Also, the company had better have a look at other
employers’ working conditions in the local area. Besides working facilities, the company
must pay attention to other facilities for daily needs, ensuring suitable and proper toilets,
clean drinking water, and hygiene eating rooms. Especially, meals for employees should be
healthy and nutritious in order to guarantee employee health. The company are bound to
provide employees with equipment and accessories that are fit for safe and effective work.
Finally, the company should regard the employees as individuals, important human beings at
all times and revere them. The leaders must make attempt to understand and explain the
company’s policies precisely to the followers at all times. Obviously, the leaders must be an
ideal model for the followers. A principle that the leaders should bear in mind is "Praise in
public and reprimand in private." The leaders should let the followers understand that they
are given opportunity to develop and enhance their capability and incomes. Followers also
need to be taken care of individually; the leaders should care about followers likes and
dislikes, listening to their wishes and desires. And most importantly, the leaders must train
the followers properly, improving their skills and knowledge in order to achieve a shared
common goal, that is, for the company.
53
5.3 Further Study
The research has indicated the factors on employee loyalty in Hoang Phuc Company, that is,
Compensation, Work Environment, Person-Environment Fit, and Leadership. Therefore,
further research topic can be:
Improving the compensation system in Hoang Phuc Company: the research examines the
current compensation system to find out shortcomings and then propose solutions to
improve.
Improving the work environment in Hoang Phuc Company: the research figures out the
specific shortcomings in the work environment based on employees’ feedback through
questionnaires, and proposes solutions to improve.
At the macro level, this research has important findings, contributing a paradigm of
employee loyalty with four factors Compensation, Work Environment, Person-Environment
Fit, and Leadership. However, it is just proved to work best with a specific manufacturing
company. Therefore, this paradigm can be implemented again with a wider scope, for
instance, employees of companies in a city, or in a nation. Other factors such as career
promotion opportunities, rewards, and empowerment could be used to measure, too. This
research also contributes an interesting finding—gender affects employee loyalty but in a
small scope. Hence, this research can be implemented again with a wider scope to test
whether there is a relationship between gender and employee loyalty.
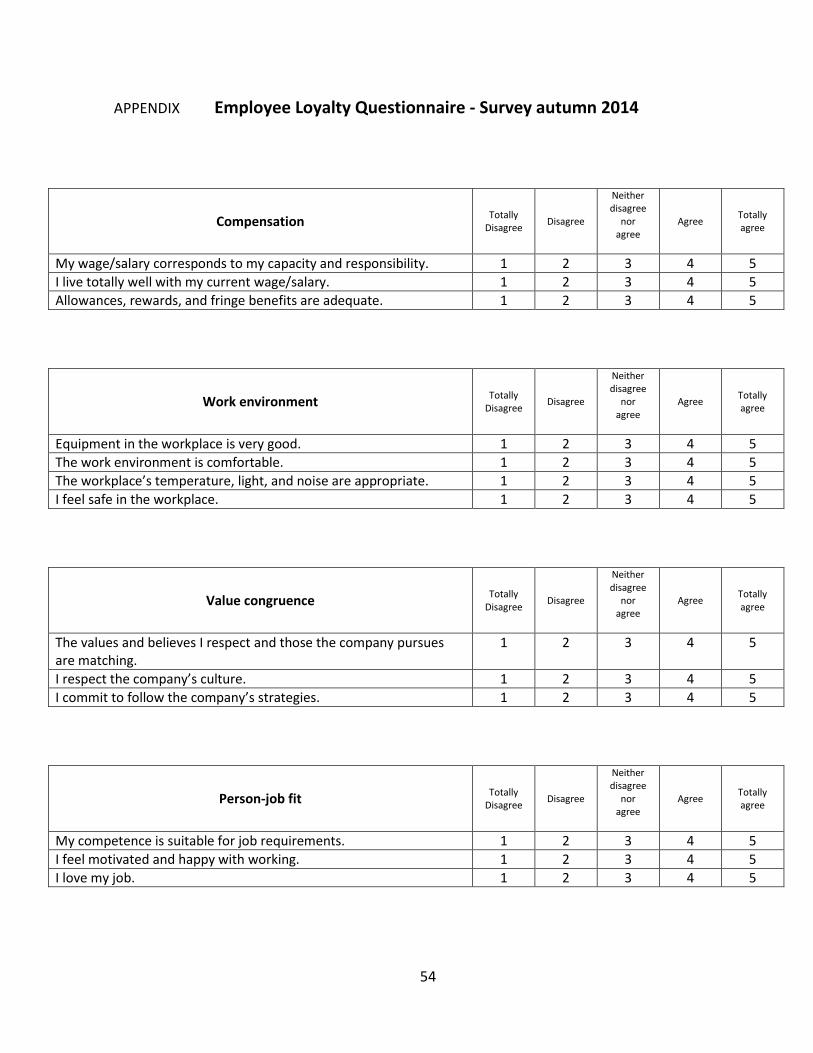
54
APPENDIX Employee Loyalty Questionnaire - Survey autumn 2014
Compensation Totally
Disagree Disagree
Neither disagree
nor agree
Agree Totally agree
My wage/salary corresponds to my capacity and responsibility. 1 2 3 4 5
I live totally well with my current wage/salary. 1 2 3 4 5
Allowances, rewards, and fringe benefits are adequate. 1 2 3 4 5
Work environment Totally
Disagree Disagree
Neither disagree
nor agree
Agree Totally agree
Equipment in the workplace is very good. 1 2 3 4 5
The work environment is comfortable. 1 2 3 4 5
The workplace’s temperature, light, and noise are appropriate. 1 2 3 4 5
I feel safe in the workplace. 1 2 3 4 5
Value congruence Totally
Disagree Disagree
Neither disagree
nor agree
Agree Totally agree
The values and believes I respect and those the company pursues are matching.
1 2 3 4 5
I respect the company’s culture. 1 2 3 4 5
I commit to follow the company’s strategies. 1 2 3 4 5
Person-job fit Totally
Disagree Disagree
Neither disagree
nor agree
Agree Totally agree
My competence is suitable for job requirements. 1 2 3 4 5
I feel motivated and happy with working. 1 2 3 4 5
I love my job. 1 2 3 4 5
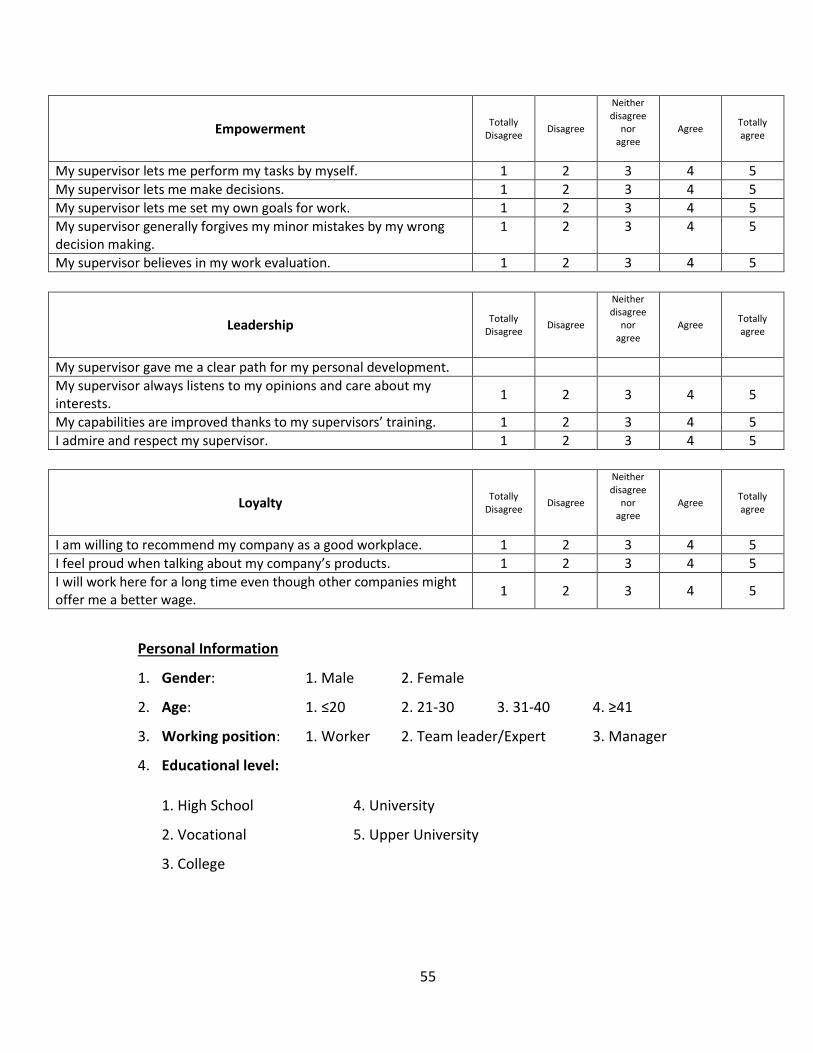
55
Empowerment Totally
Disagree Disagree
Neither disagree
nor agree
Agree Totally agree
My supervisor lets me perform my tasks by myself. 1 2 3 4 5
My supervisor lets me make decisions. 1 2 3 4 5
My supervisor lets me set my own goals for work. 1 2 3 4 5
My supervisor generally forgives my minor mistakes by my wrong decision making.
1 2 3 4 5
My supervisor believes in my work evaluation. 1 2 3 4 5
Leadership Totally
Disagree Disagree
Neither disagree
nor agree
Agree Totally agree
My supervisor gave me a clear path for my personal development.
My supervisor always listens to my opinions and care about my interests.
1 2 3 4 5
My capabilities are improved thanks to my supervisors’ training. 1 2 3 4 5
I admire and respect my supervisor. 1 2 3 4 5
Loyalty Totally
Disagree Disagree
Neither disagree
nor agree
Agree Totally agree
I am willing to recommend my company as a good workplace. 1 2 3 4 5
I feel proud when talking about my company’s products. 1 2 3 4 5
I will work here for a long time even though other companies might offer me a better wage.
1 2 3 4 5
Personal Information
1. Gender: 1. Male 2. Female
2. Age: 1. ≤20 2. 21-30 3. 31-40 4. ≥41
3. Working position: 1. Worker 2. Team leader/Expert 3. Manager
4. Educational level:
1. High School 4. University
2. Vocational 5. Upper University
3. College
56
REFERENCES
Argyris, K., 2008. Personnel Management. New Delhi: McGraw Hill.
Beach, D., 2007. The Management of People at Work. New York: MacMillan
Beer, M., 2009. High Commitment, High Performance. San Francisco, CA: Jossey Bass.
Bernardin, H. and Russel, E., 1993. Human Resource Management. New York: McGraw-Hill.
Bhadury, B., 2000. Managing the Workforce. New Delhi: McGraw-Hill.
Bhonsale, Y., 2009. Personnel Management - The Indian Scene, S. Chand & An Experimental
Approach. New Delhi: McGraw-Hill.
Billimoria, R. and Singh N., 1985. Human Resources Development. New Delhi: Vikas
Publishing House.
Boxall, F., Purcell, J., 2002. Strategy and Human Resource Management. Palgrave: Macmillan.
Bratton, J. and Gold, L., 1994. Human Resource Management - Theory and Practice. London:
The Macmillan Press.
Buchanan, J., 1974. Institutional Behavior. US: University of North Carolina Press.
Butler, J., 1984. Toward Understanding and Measuring Conditions of Trust: Evolution of a
Conditions of Trust Inventory. USA: Journal of Management
57
Byars, L., Richard D. and Rue W., 2001. Human Resource and Personnel Management. New
York: McGraw-Hill.
Cardy, R., 2003. Managing Human Resources. USA: Prentice Hall.
Conger, J. and Kanungo, R., 2003. Charismatic Leadership: The Elusive Factor in
Organizational Effectiveness. San Francisco: Jossey-Bass.
Cronbach, L., 2007. Coefficient alpha and the internal structure of tests. CA: Sage.
Edwards, P., 2003. Human Resource Management. New York: McGraw-Hill.
Gallagher, S., Brown, C., and Brown, L., 2008. Employment Relations Today. DOI:
10.1002/ert.20185.
Gosall, N. and Gurpal S., 2012. Doctor's Guide to Critical Appraisal. Knutsford: PasTest.
Hair, J., 1998. Exploratory Factor Analysis. California: Management Review.
Jha, N.,2008. Research Methodology. Chandigarh: Global Media.
Kristof, B., Zimmerman, D., and Johnson, S., 2005. Preparing Instructional Objectives.
Bangalore: Random House.
Lawrence, R., 1985. The changing of organizational behavior patterns; a case study of
decentralization. Boston: Harvard University.
Logan, G., 1984. Loyalty and a sense of purpose. California: Management Review.
58
Louden, K., and Newton, T., 2009. Job Analysis. London: Sage.
Mendonca, M., 2006. Ethical Leadership. Buckingham: McGraw-Hill Education.
Marshall, C. and Gretchen B., 1998. Designing Qualitative Research. Thousand Oaks, CA:
Sage.
Mathieu, E., Dennis M., 1990. Psychological Bulletin. Mumbai: Himalaya Publishing House.
Megginson, C., 2004. Personnel and Human Resources Administration. UK: Blackwell
Mowday, P., 1979. Measurement of Organizational Commitment. Canada: Journal of
Vocational Behaviour.
Muijs, D., 2004. Doing Quantitative Research in Education with SPSS. USA: Sage.
Netemeyer, M., 1997. Management: Principles and Practices. New York: Macmillan.
Nunnally, H., 1994. How to do quantitative research. London: Rondom House.
O'Reilly, C., Chatman, J., Caldwell, D., 2009. Journal of Occupational Psychology.San Diego:
Academy Press
O'Reilly, C., Chatman, J., Caldwell, D., 2002. Journal of Applied Psychology . San Diego:
Academy Press
Oldenquist, A., 2006. The Journal of Philosophy. Wesley: Addison.
59
Reichheld , F., 1996. Loyalty Effect: The Hidden Force Behind Growth, Profits, and Lasting
Value. Boston: Harvard Business School Publishing Corp.
Sarma, A., 2009. Personnel and Human Resource Management. Mumbai: Himalaya
Publishing House.
Sen, A. and Srivastava, M., 2011. Regression Analysis — Theory, Methods, and Applications.
Berlin: Springer-Verlag.
Trochim, H. 2006. Descriptive Statistics. New York: McGraw Hill.
Vandenberghe, H., 1999. The Professional Manager. London: Institute of Personnel
Management.