UNIVERSITI PUTRA MALAYSIA
DEVELOPMENT OF CONDUCTOR-BACKED COPLANAR WAVEGUIDE (CBCWG) MOISTIJRE SENSORS
TEOH LAY HUA
FSAS 1997 18

DEVELOP1\1ENf OF CONDUCTOR-BACKED COPLANAR WAVEGUIDE (CBCWG) MOISTIJRE SENSORS
by
TEOHLAYHUA
Thesis Submitted in Fulfillment of the Requirements for the Degree of Master of Science in the Faculty of
Science and Environmental Studies Universiti Putra Malaysia
October 1997
Specislly dedicated to:
Mom. Dad. Brother. Sister and
Lee WaiMun

ACKNOWLEDGEMENfS
Firstly, I would like to thank my chairman Associate Professor Dr. Kaida Khalid for his constant support, encouragement, patience and dedication during the whole period of
this research.
I would also like to thank my committee members Associate Professor Dr. Sidek llj.
Abdul Am and Dr. Wan Mohd. Daud bin Wan Yusoff. They are always around to
help out whenever I encounter any difficulty.
Last but not least, all the lectw"ers and staff in Physics Department especially Mr.
RosJim and .Mr. Razak who have helped me in one way or another to complete this
project
TABLE OF CONTENTS
Page AC�OWI...EDG�S............................................................................. iii UST OF T ABI...ES................ ................................ .... .................. ....... .............. V1
liST OF FIGlJRES.................................................................................... ..... xiii LIST OF PLA1'ES........................................................................................... xiii liST OF ABBREVIATIONS ................................. ....... .............. .................. xiv ABS'fRACT.................................................................................................... XVI
ABS'fR.AK...................................................................................................... XU1
CHAPTER 1 wrRODUCTION. ....... ... ........ .... ............ ..... ........ ........... ........ 1
Conductor-backed Coplanar Waveguide.......... .... ....... .............. 2
A Review on Oil Pahn Fruit............ ............... ................... ........ 7
A Review on Cocoa............. ......... .................. ....... ........ ........... 9
Fermentation........................................................................ 10
Drying.................................................................................. 12
Objectives................................................................................. 13
Chapter Organization................................................................. 13
2 MICROWAVE AQUAMETRY............................................... 15
Definition of�waves ............. '" ......... ...... ..... .......... ..... ........ 15
�crowave Aquametry .................................................. '" ..... .... 16 Advantages of Microwaves Moisture Measurements.................. 11
Measmement of Moisture Content............................................ 18
AppJication of Coplanar Line as a Moisture Sensor......... ....... .... 20
Properties of MatcriaJs........................................... ................... 20
Variation in Dielectric Properties with Moisture Content and Mixture Model......... ................... .... ................................... 22
S\IJIUD.al'y' ....... .....•... .•...... ............ ... ..•.... ... ............•...... ......... ..... .•• 25
iv
3 nIEORETICAL ANALYSIS ............. . . ...... . . . . . .... . . . . ....... .. . . . . ... 26
The Analysis of Multi-layer Structure... . . .. . ... . . ...... ... ... . . . . . . . . .... .... 26
TEM Analysis of a 4-layer CBCWG......................................... 27
Characteristic Impedance ofCBCWG....................................... 41
Dielectric Loss................................................... ........................ 42
Calculation of the Total Attenuation of the Sensor.. ............ ..... .... 47
Development of Computer Programmes for Determination of Attenuation of CBCWG at Various Moisture Contents............... 52
SlJllllD8lY' .................... .................................... .. ................ .... ............ .. .. ........ .................................. .. ........ .... " ........ .... 56
4 �1HOOOLOOY............................................ ....................... 57
Sensor Design.. .......... .............. ............... .... ...... ......... .... . . . ........ 57
MeaslD'elnen.t � ..................................... "' .......................... ",. ........... .... 71
s� ........ "'.......................................................................... 77
5 RESULTS AND DISCUSSION................ ..... . ................. ........ 78
ExperiJnental Results....... ............ ........ ........ .... ....... . .......... ......... 78
Comparison Between the Theoretical and
ExperiJnental Results..... .... ........... .............. ......... ... ....... ............. 83
S'IJ:I"IlDIaJY ........ "' .. If .... .. '" .. '" "' .... "' .......... "' ............................ "' .......................... '" "' ............ '" "' .......... '" "' .......... "'............ 1 01
6 CONCLUSION....................................................................... 103
Conclusion........ ................... . . . . . . . . . . . . . . . . . . . .. . . . . . . ... ... . . . . . . . .... ... . .. . . . . 103
Recomm.endations for Future Work............................................ 106
REFERENCES........ ............ . .... ....... ....... ..... .................. . . .............. ......... .......... 108
APPENDICES............... ..... ..... ........ .......... ......... ....... .... .......... .... .......... .......... 111
A Mason's Non-touching Loop Rule.................................. 1 12
B COIllputer Progranunes. ........... ... .. .... . . . ... .... . . . . . . . .... . . . . . . . . 1 15
C Tables of Results........................................................... 130
VlTA................................................................................................................ ISO
v
LIST OF TABLES
Table Page 3.1 Abbreviations used ill the COOlputer Programmes........ ....... ...... .... 55
4.1 Dimensions of the Sensors.. ...... .................................................... 64 4.2 Characteristic Impedance Values With Different Values of
BMAPH for Substrate with sr = 2.2 (Type 2).... ........................ 130
4.3 Characteristic Impedance Values with Different Values of BMAPH for Substrate with Er = 2.2 (Type 3)............................ 131
4.4 Characteristic Impedance Values with Different Values of BMAPH for Substrate with sr = 10.5 (Type 2).......................... 132
4.S Characteristic Impedance Values with Different Values of BMAPH for Substrate with Er = 10.5 (Type 3).......................... 133
4.6 Dielectric Loss Values with Different Values of SPH for 2.2 SGAP (Theoretical)............................................................... 134
4.7 Dielectric Loss Values with Different Values of SPH for 2.2 BGAP (Theoretical).............................................................. 135
4.8 Dielectric Loss Values with Different Va1ues of SPH for 10.5 SOAP (Theoretical)............................................................ 136
4.9 Dielectric Loss Values with Different Values of SPH for 10.5 BGAP (Theoretical)............................................................ 137
4.10 Attenuation Values with Different Values of SPH for 2 .. 2 SGAP (TheoRtica1).�............................................................. 138
4.11 Attenuation Valoes with Different Values of SPH for 2.2 BGAP (Theoretical) ........................................................... '" 139
4.12 Attenuation Values with Different Values of SPH for 10.5 SGAP (Theoretical)............................................................. 140
4.13 Attenuation Values with Different Values ofSPH for 10.5 BGAP (Theoretical)....... .................................... .............. .... 141
vi

5.1 Attenuation Values with Different Values of SPH for 2.2 SGAP (Oil Palm Mesocarp).................................................. 142
5.2 Attenuation Values with Different Values ofSPH for 2.2 BGAP (Oil Palm Mesocarp)................................................... 143
5.3 Attenuation Values with Different Values of SPH for 10.5 SGAP (00 Pahn Mesocarp)................................................. 144
5.4 Attenuation Values with Different Va1ues of SPH for 10.5 BGAP (00 Palm Mesocarp)................................................ 145
5.5 Attenuation Values with Different Values ofSPH for 2.2 SGAP ( Cocoa)..................................................................... 146
5.6 Attenuation Va1ues with Different Values of SPH for 2.2 BOAP ( Cocoa)...................................................................... 147
5.7 Attenuation Va1ues with Different Values of SPH for 10.5 SOAP (Cocoa).................................................................... 148
5.8 Attenuation Values with Different Va1ues of SPH for 10.5 BGAP (Cocoa).................................................................... 149
vii

LIST OF FIGURES
Figure Page
1.1 Coplanar Wa-veguide .............. ...... .......................... . 0 ...•.. , o. 0 0.00..... 3
1.2 Conductor-backed Coplanar Waveguide..................................... 3
1.3 Field COIlcentraUon of �crostrip............. ........ ........... ................. 5
1.4 Field Concentration of Conductor-backed Coplanar Waveguide.................................................................... S
1.5 structure of a 4-Jayer Conductor-backed Coplanar Waveguide.................... ........ .... .......................... .......... 6
1.6 The Oil Palnl Tree and Bunch. .............. ...................... .................. 8
1.7 The Anatotny of Cocoa Beans................. ............... ........ .......... .... 10
3.1 StIucture of1h.e Sensor ......... ..................................................... ... 28
3.2a 4-Jayer Conductor-backed CopJanar Wawguide ............ �............. 36
3.2b Semi-infinite 4-Jayer Conductor-backed Coplanar Waveguide...... 36
3.3a 3-Jayer Conductor-backed CopJauar Waveguide.......................... 37
3.3b Semi-infinite 3-Jayer Conductor-backed Coplanar Waveguide....... 37
3.4a 2-layer Conductor-backed Coplanar Waveguide.......................... 38
3.4h Semi-infinite 2-Jayer Conductor-backed Coplanar Waveguide....... 38
3.5a Equivalent 4-Jayer Conductor-backed Coplanar Waveguide.......... 43
3.Sb Equivalent 3-Jayer Conductor-backed Coplanar Waveguide.......... 43
3.Se Equivalent 2-Jayer Conductor-backed Coplanar Waveguide.......... 44
3.6a Conductor-backed Coplanar Waveguide Sensor with Santple Inserted 0 ... ......... ......... 0 .0................ .. ..... ........ .... .......... ..... 48
3.6b Equivalent 2-port Network.......................... ........ ........ ........... ....... 49
viii
3.1 Simplified Signal Flow Graph using Mason's Non-touching L.oop Rule ....................... ..........•... . . ....•......................................... SO
3.8 Block Diagram of the Computer Programmes used for Detennination of Attenuation of CBCWG Moisture Sensors.......... 53
4.1 Characteristic Impedance vs APB for Different BMAPH for 2-layer CBCWG with sr = 2.2 ............... .............. ... . ................... 59
4.2 Characteristic Impedance vs APB for Different BMAPH for Semi-infinite 3-layer CBCWG with sr = 2.2 ...... ....... ........... ........ 60
4.3 Characteris1ic Impedance vs APB for Different BMAPH for 2-layer CBCWG with s, = 10.5.................................................. 62
4.4 Characteristic Impedance vs APB for Different BMAPH for Semi-infinite 3-layer CBCWG with sr = 10.5. ..... ... .......... ..... ....... 63
4.5 Diagram on the Construc1ion of the Sensor ..................................... 65
4.6 Dielectric Loss vs Moisture Content for Different SPH for 2.2 SGAP ..................................................................................... 61
4.1 Dielectric Loss vs Moisture Content for Different SPH for 2.2 BGAP ..................................................................................... 68
4.8 Dielectric Loss vs Moisture Content for Different SPH for 10.5 SGAP ................................................................................... 69
4.9 Dielectric Loss vs Moisture content for Different SPH for 10.5 SBAP ................................................................................... 70
4.10 Attenuation vs Moisture Content for Different SPH for 2.2 SGAP (Theoretical). ..... ........ ..... ............ .... ........... .......... .... .... 72
4.11 Attenuation vs Moisture Content for Different SPH for 2.2 BGAP (Theoretical) ................................................................ 73
4.12 Attenuation VB Moisture Content for Different SPH for 10.5 SGAP (Theoretical) .............................................................. 74
4.13 Attenuation VB Moisture Content for Different SPH for 10.5 BGAP (Theoretical) .............................................................. 75
ix
4.14 Attenuation as a Function of Frequency for (a) Sensor in air (b) Fruit with 22.8% Moisture Content (c) Fruit with 78.2% Moisture Content ......................................... 76
5.1 Attenuation vs Moistw-e Content for Different SPH for 2.2 SGAP (Oil Palm Mesocarp) .................................................... 79
5.2 Attenuation vs Moisture Content for Different SPH for 2.2 BGAP (Oil Palm Mesocarp)................................................... 80
5.3 Attenuation vs Moisture Content for Different SPH for 10.5 SGAP (Oil Palm Mesocarp)................................................. 81
5.4 Attenuation vs Moisture Content for Different SPH for 10.5 BGAP (Oil Palm Mesocarp)................................................. 82
S.S Attenuation VI Moisture Content for Different SPH for 2.2 SGAP (Cocoa)...................................................................... 84
5.6 Attenuation vs Moisture Content for Different SPH for 2.2 BGAP (Cocoa) ....................................................................... 85
S.7 Attenuation VI Moisture Content for Different SPH for 10.5 SGAP (Cocoa)..................................................................... 86
5.8 Attenuation VI Moisture Content for Different SPH for 10.5 BGAP (Cocoa) ........................ ............................................. 87
5.9 Comparison Between Theoretical and Experimental Results for Oil Palm Mesocarp for SPH=O (2.2 SGAP)....... ....... ..... ...... .... 89
5.10 Comparison Between Theoretical and Expetimental Results for Oil Palm Mesocarp for SPH=O.04 (2.2 SGAP).. ...................... 89
5.11 Comparison Between Theoretical and Experimental Resu11s for Oil Pahn Mesocarp for SPH=O.08 (2.2 SGAP)........................ 90
5.12 Comparison Between Theoretical and Experimental Results for Oil Palm Mesocarp for SPH=O.13 (2.2 SGAP)........................ 90
5.13 Comparison Between Theoretical and Experimental Results for Oil Pahn Mesocarp for SPH=O.18 (2.2 SGAP)........................ 91
5.14 Comparison Between Theoretical and Experimental Results for Oil Palm Mesocarp for SPH=O.22 (2.2 SGAP)........................ 91
x
5.15 Comparison Between Theoretical and Experimental Results for Oil Palm Mesocarp for SPH=O.08 (2.2 BGAP)........................ 92
5.16 Comparison Between Theoretical and Experimental Results for Oil Palm Mesocarp for SPH=O.13 (2.2 BGAP) ....................... 92
5.17 Comparison Between Theoretical and Expet�nental Results for Oil Palm Mesocarp for SPH=O.18 (2.2 BGAP)....................... 93
5.18 Comparison Between Theoretical and Experimental Results for Oil Palm Mesocarp for SPH=O.22 (2.2 BGAP)....................... 93
5.19 Comparison Between Theoretical and Experimental Results for Oil Palm Mesocarp for SPH=O.26 (2.2 BGAP)....................... 94
5.20 Comparison Between Theoretical and Experimental Results for Oil Palm Mesocarp for SPH=O (10.5 SGAP).......................... 95
5.21 Comparison Between Theoretical and Experimental Results for Oil Palm Mesocarp for SPH=O.06 (10.5 SGAP)...................... 95
5.22 Comparison Between Theoretical and Experimental Results for Oil Palm Mesocarp for SPH=O.l1 (10.5 SGAP)..................... 96
S.23 Comparison Between Theoretical and Experimental Results for Oil Palm Mesocarp for SPH=O.17 (10.5 SGAP)...................... 96
5.24 Comparison Between Theoretical and Experimental Results for Oil Pahn Mesocarp for SPH=O.22 (10.5 SGAP)...................... 97
5.25 Comparison Between Theoretical and Experimental Results for Oil Palm Mesocarp for SPH=O.28 (10.5 SGAP)...................... 97
5.26 Comparison Between Theoretical and Experimental Results for Oil Palm Mesocarp for SPH=O (10.5 BGAP).......................... 98
5.27 Comparison Between Theoretical and Experimental Results for Oil Palm Mesocarp for SPH=O.06 (10.5 BGAP)..................... 98
5.28 Comparison Between Theoretical and Experimental Results for Oil Palm Mesocarp for SPH=O.l1 (10.5 BGAP)..................... 99
5.29 Comparison Between Theoretical and Experimental Results for Oil Palm Mesocarp for SPH=O.17 (10.5 BGAP)..................... 99
xi
5.30 Comparison Between Theoretical and Experimental Results for Oil Palm Mesocarp for SPH=0.22 (10.5 BGAP)........... . . . . . . . . .. 100
5.31 Comparison Between Theoretical and Experimental Results for Oil Pahn Mesocarp for SPH=O.28 (10.5 BGAP).......... ........... 100
xii

LIST OF PLATES
Plate Page
4.1 The Four Sensors I>esigned.......... ................... ....... ... ................... 66
4.2 The Setup oftl1e Equipnlcn.t ......................................................... 66

LIST OF ABBREVIATIONS
CBCWG conductor-backed coplanar w�de sr relative permittivity
Sd relative penllittivity of substrate
srI relative permittivity of covered cbcwg Sa relative permittivity of test sample sr4 relative permittivity of protective layer
• complex permittivity £
• complex permeability Il
,
dielec1ric constant S ·
dielectric loss £ •
relative complex permittivity £r •
relative complex permittivity of mixture GIll •
relative complex permittivity of water E", •
relative complex permittivity of oil £1 •
relative complex permittivity of fibre sl V'" wlume fractions of water V, volume fractions of oil VI volume fractions of fiber Mr realtive moisture content MC. moisture content Wr total mass of mixture W", mass of water in mixture W, mass of oil in mixture WI mass of fiber in mixture PT total density of mixture p", density of water in mixture A density of oil in mixture PI density of fiber in mixture h height of substrate (hI) 8 height of covered layer (hI - hi) d height of test sample (� - hI) f height of protective layer (h .. - hl) Kh coshkjh K. cosh kjs Kcl coshkjd Kr coshkl Sh sinh kjh
xiv

S. Sd Sf Tf CII C. Cd Cr Vp
Z. c C. Belf ql ql q3 a p r OJ E(O) E(d) 811,812 821,812 8�1,8� 8�,8� 8;1,8� 8�,8� 11 12 r APB SPH BMAPH
sinh kjs sinhkjd sinhkl tanhk.f I
cothkjh cothkjs cothkjd cothkJ phase velocity
characteristic impedance
capacitance per unit length capacitance per unit length of air effective dielectric constant
tiDing factor of1ayer 1
filling factor oflayer 2
filling factor of layer 3 attenuation constant phase constant propagation constant conductivity
angular frequency complex amplitude of wave at a reference plane complex amplitude of wave at distance d
scattering parameters
length of 2-layer cbcwg
length of sensing area reflection coefficient ratio of inner strip (A) to B (A+PP) ratio of thickness of protective layer (S) over height of substrate (H) ratio of gap (B-A) over height of substrate (H)
xv
Abstract of thesis presented to the Senate of Uniwrsiti Putra Malaysia in fulfillment of the requirements for the degree of Master of Science.
DEVELOPMENT OF TIlE CONDUCTOR-BACKED COPLANAR WAVEGUIDE (�BCWG) MOISTURE SENSOR
By
TEOHLAYHUA
October 1997
Chairman : Associate Professor Kaida KbaJid, Pb.D.
Faculty : Science and Environmental Studies
Conductor-backed coplanar waveguide (CBCWG)l moisture sensor has been developed for a quick and accurate determination of moisture content in :fresh
mesocarp of the oil palm ftuits and cocoa beans. The sensor consists of three paI1s i.e.,
the coupling system representing the 1ranSition between coaxia11ine to the CBCWG,
the 2-Jayer structure of the CBCWG and sensing area.. Previous wade done shows a
close relationship between the oil content and moisture content in the oil palm
IllCSOCaIp during fruit development The quality of cocoa beaus were also affected by
the moisture content in the beans. Thus, by measuring the moisture content in the oil
pahn mesocarp and cocoa beans, the quality of the oil palm :fruit and the cocoa beans
can be obtained indirectly.
1 CBCWG illllO wriUea .. CBCPW
A fimctional relationship has been developed between scattering parameter 821 of the sensor and moisture content of the sample. The reflection and transmission
phenomena in the sensor structure can be represented by a signal flow graph and can
be simplified by using Mason's non-touching loop roles. The calculation of S21 is based
on the quasi-1ransVenIe electtomagnetic mode approxima1ion. Based on the theoretical
analysis, computer programmes written in FORTRAN programming language were
developed to do the calculations of the attenuation. A total of four different sensors
were developed in order to find out the effect of different gap between the conducting
S1rip and upper ground plane and protective layers on the attenuation values.
It is fOlmd that the big gap sensor gives a better sensitivity as compared to the
small gap sensor. This effect is probably due to the field density in the big gap sensor is
much higher than the small gap sensor. The sensitivity of the sensor is also drasticaD:y
affected by the thickness of the protective layer. This is due to the decreasing of the
interaction between the field and the sample as the thickness of the protective layer
increases. A comparison between the theoretical and expetixnentai results for the oil
palm mesocatp was done. A close agreement has been fOlDld. The difference in value
ranges from only 1-4dB.
The fine relationship between the attenuation and moisture content for this kind
of sensor gives the possibility for the development of a compact and portable
microwave instrument for assessing the quality of cocoa and oil palm fruits that are sent
to the factoty.
xvii
Abstrak tesis yang dikemukabn kepada Senat Universiti Putra Malaysia sebagai memenuhi syarat untuk ijazah Master Sains.
PEMBINAAN SENSOR PEMANDU GELOMBANG SESATAH TERSOKONG KONDUKTOR (PGSTK) UNTUK PENENTUAN KELENGASAN (AIR)
Oleh
TEOHLAYHUA
Oktoberlm
Pengerusi : Profesor Madya Kaida KhaIid, Ph.D. Fakulti : Sains dan Pengajian Alam Seldtar
Sensor pcmandu gelombang sesatah tersokong konduktor (PGSTK) teJah dibina untuk penentllan kancbmgan air daIam buah Icelapa sawit dan koko secara cepat dan tepat Sensor tersebut terdiri daripada tiga bahagian, iaitu sistem penyambungan
yang mewakili peraJiban ta1ian sepaksi kepada PGSTK, s1ruktur 2-Japisan PGSTK dan
tapaJc pengukuran. Sam perltubungan rapat te1ah didapaU di antara kMWIlDgaD minyak
dan bndungan air di da1am buah kelapa sawn semasa buah matang KuaJiti buah koko
juga dipengarubi olch kandungIm air di daIam buah. Maka, dengan mengukur
kandungan air di daIam buab, kualiti buah kelapa sawit dan koko boleh didapati secara
tidak Iangsung.

Satu pcrkaitan telah dibina di antara parameter penyerakan sensor, S 11 dan kaDdungan air di dalam sampet Fenomcna pantuJan dan pengbantaran gelombang
mikro di dalam stru.ktur sensor boteh diwakili oleh graf aliran isyarat dan boteh
dipermudahkan dengan mcnggunakan peratw'an lingkaran-tak�bcrsentuh Mason.
Pengiraan 811 adalah berdasarkan mod pengbam.piran kuasi eleldromagnet mcJintang
Berdasarkan anaJisis teori, program komputer daJam bahasa pcngaturcaraan
FORTRAN telah dituJis untuk mengira pengecilan gelombang mikm. Empat sensor
telah direka untuk mengetahui kesan jurang di antara strip konduktor dengan safah
bmni atas dan kesan Japisan pedindungan yang berbeza temadap pengeciJan gelombang
mikro dan sensi1ivi1i sensor.
Didapa1i sensor dengan jurang besar adalah 1ebih sensilif jib dibandingbn
dengan sensor denganjurang keciL Ini kenmngkinan besar disebabkan oleh ketumpatan
medan sensor jurang besat adaJah Icbm tmagi daripada sensor jurang keci1 Kepekaan
sensor juga dipengaruhi dengan ketara oleh ketebalan Iapisan pertindungan. Ini
disebabkan oleh pengurangan interaksi di antara medan dengan sampel apabila Iapisan
perlindungan bertambab tebal. Keputusan teori dan cksperimen untuk buab keJapa
sawn tclah dibandingkan. Satu pcrkaitan yang rapat telah didapati dan perbezaan ni1ai
teori dan eksperimen hanyalab di antara 1-4dB.
Perkaitan yang bait di antara pengecilan gelombang mikro dan kandungan
kelengasan (air) untuk sensor jcnis ini membolehkan pembinaan sebuah aJat
mikrogelombang yang kecil dan mudab a1ih untuk penilaian kuaIiti buah koko dan
kelapa sawit yang dihantar ke kilang.
CHAPTER 1
INTRODUCTION
This project involves the development of conductor-backed coplanar
waveguide (CBCWG) moisture sensors for various agricultural products such as oil
palm fruits and cocoa. Khalid and Abbas (1992) developed a microstrip sensor for
determination of harvesting time for oil palm fruits. A functional relationship has
been developed between insertion loss, / S21 /, of the sensor and moisture content in
mesocarp. It was also shown that a close relationship exists between oil content and
moisture content during fruit development Thus, the oil content and subsequently
the time to harvest the fruit bunch can be determined from moisture content.
The sensors were also used to measure the moisture content in cocoa beans.
Ripe cocoa, which has a moisture content of approximately 70 0/0, was fennented for
a week to develop the chocolate flavours and aroma. After fennentation, the cocoa
has a moisture content of about 56 %. The cocoa was then left to dry out in the sun.
The attenuation measurements were then taken eveI)'day using the CBCWG sensors
to determine the moisture content of the cocoa. The moisture content calculated
from the attenuation was then compared to the moisture content obtained using the
standard oven-dry method.
In this chapter, a brief discussion on the conductor-backed coplanar
waveguide is given. Though the microstrip line has been widely used as a
transmission line, it was later observed that the sensitivity of the coplanar waveguide
was substantially better due to the high field concentration between the conducting
strip and ground plane. Another ground plane may be placed on the other side of the
1

2
substrate for easier heat removal. This modified structure is the conductor-backed
coplanar waveguide (CBCWG). A review on the oil palm fruit and cocoa is also
given. As the quality of the cocoa products is influenced by the fermentation and
drying process, a summary of the fermentation and <.hying process is described. The
objective and also a chapter organisation of the thesis is also given.
Conductor-Backed Coplanar Waveguide
The microstrip line has been widely used as a transmission line (Gupta et al.,
1979) as well as a component in microwave integrated circuits (Gupta and Singh,
1974). A problem encountered when attempting to measure high moisture content
materials using microwave attenuation technique is that, to maintain the attenuation
within reasonable limits, say less than 50 dB, very thin or small quantities of sample
must be used to keep the propagation path length in the sample sman. This is either
inconvenient or impossible. It has been pointed out (Kent, 1972) that microwave
stripline offers distinct advantages in this respect since only a small part of the sample
interacts with the stripline whilst there is no restriction on the size of the sample.
In this case, the line was supported on a substrate material of relatively low
dielectric constant «10) and covered fully or in part by a 'wet' substance of relatively
high pennittivity (> 15). The fringing field interacts with the substance and produces
a change in the attenuation constant of the line. The change in the attenuation constant can be calibrated in terms of moisture content or other parameters which
affect the dielectric properties of the material. Later, it was observed (Rowe et al.,
1983) that the sensitivity of the coplanar waveguide was substantially better than that
of microstrip, on account of the high field concentration between the conducting
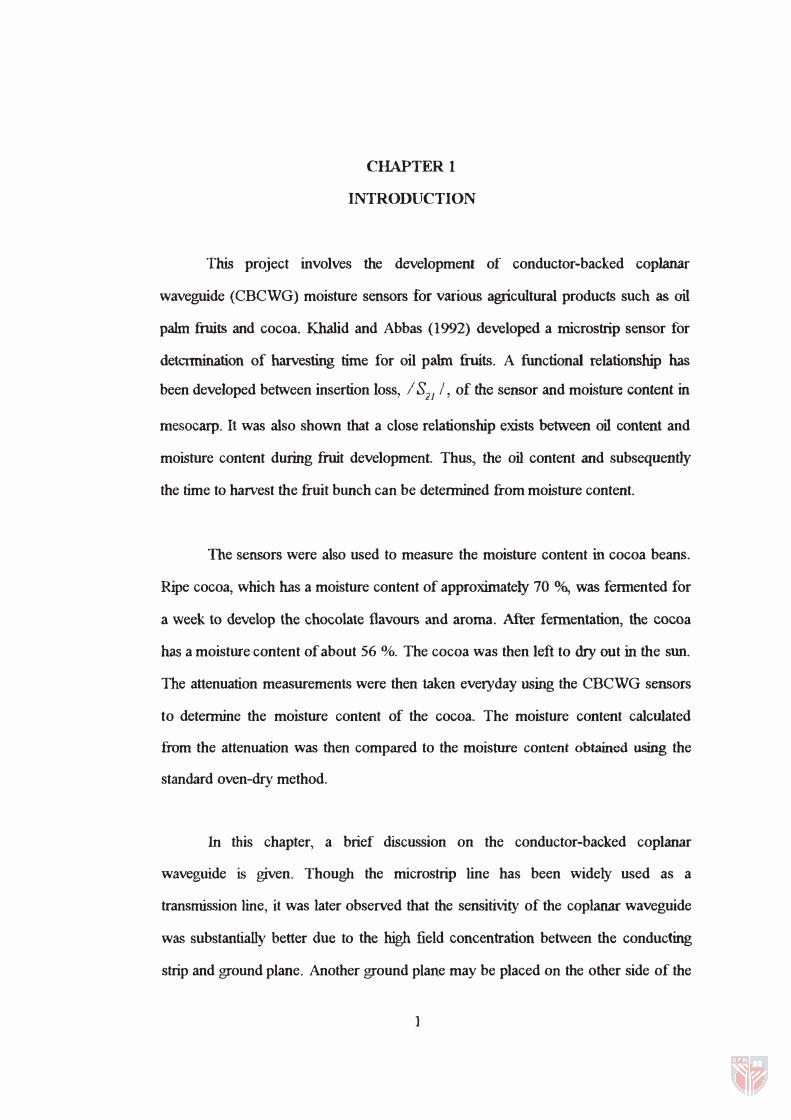
strip and ground. Coplanar waveguide (Fig. 1.1) was invented by Wen (1969) as a
3
Inner conductor J��
Ground
Fig.l.l Coplanar Waveguide.
--- 2b-------t)f-( --- g -__ �) f--2a�
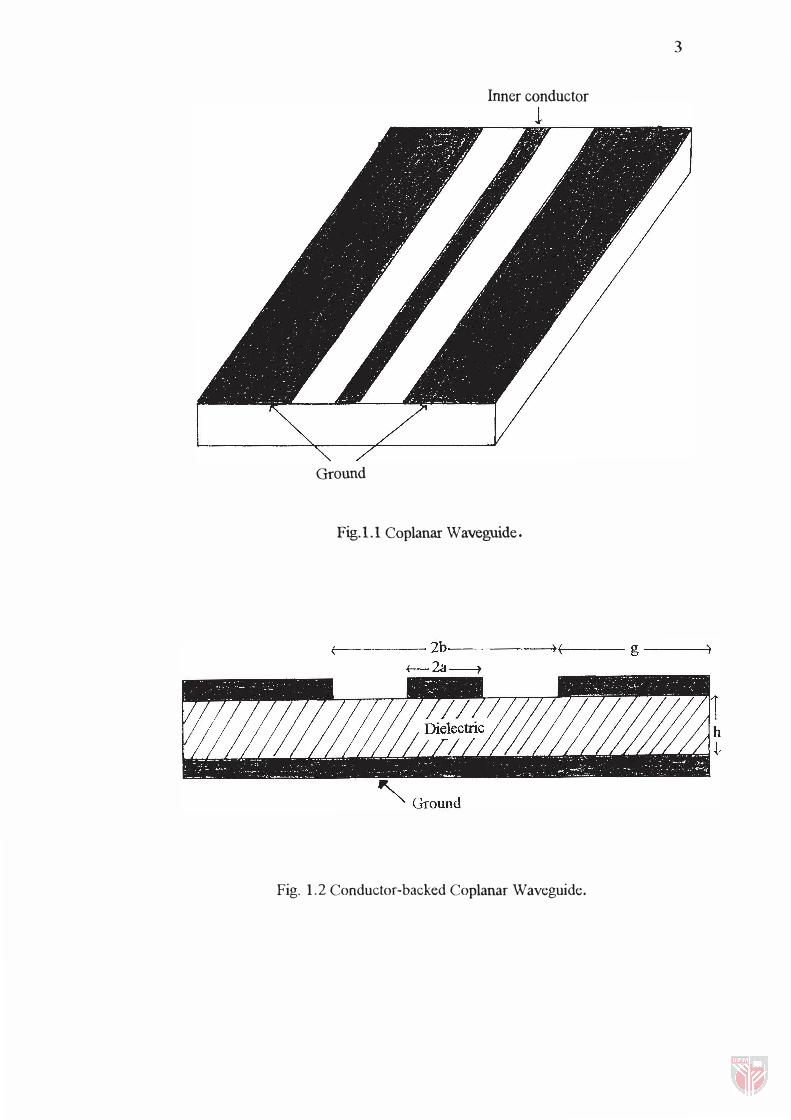
Fig. 1.2 Conductor-backed Coplanar Waveguide.

4
planar transmission line which is made of a center strip on the surface of a substrate
with two ground planes placed adjacent and parallel to the strip. All three conductors
in the coplanar waveguide are on the same side of the substrate. Since the dominant
mode is quasi-transverse electromagnetic ( quasi-TEM), there is also no low
frequency cutoff. Ibis mode is a balanced mode.
However, heat removal from an active device is not easy. An additional
ground plane may be placed on the other side of the substrate as shown in Fig. 1.2.
This modified structure is called the conductor-backed coplanar waveguide. The
presence of the ground plane increases the capacitance of the coplanar waveguide
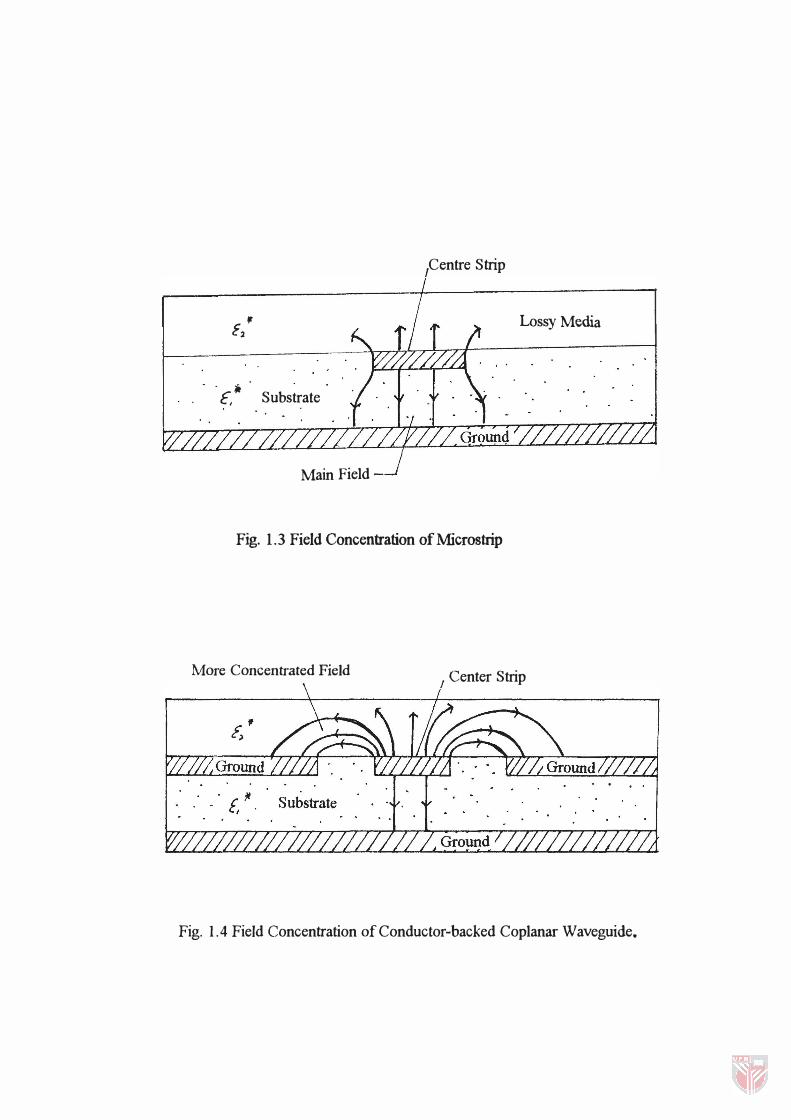
and thereby alters its impedance. Fig. 1.3 shows the field concentration of the
stripline and Fig. 1.4 shows the field concentration of the conductor-backed coplanar
waveguide. Therefore, in this project conductor-backed coplanar waveguide sensor is
used.
The analysis of the sensor starts with a 4-layer conductor-backed coplanar
waveguide. (Refer to Fig. 1.5). From the diagr�, 2a is the width of the conducting
strip and 2b is the width of the conducting strip plus the width of the gap. Thus, the
gap of the sensor is (b-a). The length of the upper ground is given the symbol g.
lirl, lir2, lirJ and lir4 are �spectively the relative permittivity of the substrate, the
protective layer, the test sample and the protective layer. Similiarly, h, s, d and f are
the height of the substrate, protective layer, test sample and protective layer
respectively.
,centre Strip
£2' Lossy Media
. it E, Substrate
Main Field-
Fig. 1.3 Field Concentration ofMlcrostrip
More Concentrated Field I Center Strip
Fig. 1.4 Field Concentration of Conductor-backed Coplanar Waveguide.