United StatesDepartment ofAgriculture
Animal andPlant HealthInspection Service
VeterinaryServices
NationalAnimal HealthMonitoringSystem
November 2011
Poultry 2010Reference of Health and ManagementPractices on Breeder Chicken Farms inthe United States, 2010

The U.S. Department of Agriculture (USDA) prohibits
discrimination in all its programs and activities on the
basis of race, color, national origin, age, disability, and
where applicable, sex, marital status, familial status,
parental status, religion, sexual orientation, genetic
information, political beliefs, reprisal, or because all or
part of an individual’s income is derived from any public
assistance program. (Not all prohibited bases apply to
all programs.) Persons with disabilities who require
alternative means for communication of program
information (Braille, large print, audiotape, etc.) should
contact USDA’s TARGET Center at (202) 720-2600
(voice and TDD).
To file a complaint of discrimination, write to USDA
Director, Office of Civil Rights, 1400 Independence
Avenue, S.W., Washington, D.C. 20250-9410, or call
(800) 795-3272 (voice) or (202) 720-6382 (TDD).
USDA is an equal opportunity provider and employer.
Mention of companies or commercial products does not
imply recommendation or endorsement by the USDA
over others not mentioned. USDA neither guarantees
nor warrants the standard of any product mentioned.
Product names are mentioned solely to report factually
on available data and to provide specific information.
USDA–APHIS–VS, CEAH
NRRC Building B, M.S. 2E7
2150 Centre Avenue
Fort Collins, CO 80526-8117
(970) 494-7000
Email: [email protected]
http://nahms.aphis.usda.gov
#585.1111
Cover photograph courtesy Judy Rodriguez

USDA APHIS VS / i
Items of Note
1. Background: poultry industry structure
Structure of breeder chicken farms in the United States
Breeder farms are comprised of primary breeder farms and multiplier farms. The
illustration below shows how chicken breeder farms in the United States are
structured. Farms with pedigree/elite, great-grandparent, and/or grandparent birds
are considered primary breeder farms, all of which produce eggs for hatching.
The progeny of pedigree flocks form great-grandparent flocks, and the progeny of
great-grandparent flocks form grandparent flocks, and so on. The progeny of
multiplier (i.e., parent) flocks become production birds on broiler (meat production)
or layer (table-egg production) farms.
Primary Breeder
Farms Breeder Farms
The poultry companies that participated in the NAHMS Poultry 2010 study
accounted for 100.0 percent of primary breeder, 81.2 percent of broiler,
71.7 percent of table-egg layer, and 81.5 percent of turkey production in the
United States. Companies that had chicken breeder farms (either company
owned or contract) participated in the breeder-farm phase of the study.
Estimates for primary breeder farms (farms with pedigree, great-grandparent,
and/or grandparent birds) and multiplier farms (farms with parent birds only) are
separated in this report. Additional estimates are separated for broiler breeder
farms (both primary breeder and multiplier farms for production of meat-type
birds) and table-egg breeder farms (both primary breeder and multiplier farms for
production of table-egg-type birds).

ii / Poultry 2010
2. Breeder farm characteristics
• Birds on all primary breeder farms and birds on over 9 of 10 multiplier farms that
produced table-egg layers were owned by breeder companies. Birds on nearly all
multiplier farms that produced broilers were owned by broiler production companies.
• The majority of breeder farms raised pullets at a separate farm site belonging to the
same company; 14.1 percent of primary breeder farms raised pullets on the breeder farm.
No primary breeder farms or multiplier farms added birds to existing flocks when placing
birds in laying houses.
• Primary breeder farms had an average of 14,246 laying hens, while multiplier farms had
an average of 19,680 laying hens. Broiler breeder farms had an average of 19,084 laying
hens compared with table-egg breeder farms which had an average of 23,021 laying
hens.
• The average ratio of hens to roosters on breeder farms was about 11:1. Fertility in
breeding flocks declines as the flock ages. Young males can be added to the breeder
flock, which stimulates breeding activity through competition between new and
established males. This practice is called spiking. Nearly all multiplier farms and 8 of 10
primary breeder farms had introduced spiking males to stimulate breeding activity during
the previous 12 months. Nearly all broiler breeder farms but less than 3 percent of table-
egg breeder farms introduced spiking males to stimulate breeding activity. About one-half
of multiplier farms but less than 1 percent of primary breeder farms that introduced
spiking males did so three or more times during the previous 12 months. The source of
spiking males for nearly all farms was other farms from the same company. Nearly all
breeder farms that received spiking males from other farms performed routine testing of
the source farms for health status (e.g., Mycoplasma or other tests) and also tested males
before placing them on the farm.
• Breeder farms were not in close proximity to other premises. The majority of breeder
farms had no premises with backyard poultry, pigs, or commercial poultry that belonged to
a different company within 1 mile of the farm, and about one-half of breeder farms had no
commercial poultry that belonged to their company located within 1 mile of the farm.
Additionally, breeder farms were, on average, over 2 miles away from a body of water
where wild waterfowl congregated, 20 miles from a live-poultry market, and 25 miles from
a processing or rendering facility.
USDA APHIS VS / iii
• Controlling access to the farm can prevent introduction of disease via people and
vehicles. Nearly all primary breeder farms had fencing surrounding the farm. Signs (e.g.,
no trespassing) were posted on nearly all multiplier farms. Additionally, the majority of
poultry houses (over 75 percent) had locks on doors, warning signs at house doors, and
an anteroom that personnel had to pass through that separated the outside area from the
inside area. The majority of primary breeder farms had gravel or a hard surface
immediately surrounding poultry houses, and the majority of multiplier farms had short
grass surrounding the houses. No breeder farms had tall grass or brush immediately
surrounding the houses.
• Employee management is important for the prevention of disease introduction and
spread. Employees worked at another commercial poultry production or processing facility
on less than 1 percent of multiplier farms and on none of the primary breeder farms. All
primary breeder farms and nearly all multiplier farms had written biosecurity protocols.
Additionally, over 9 of 10 primary breeder farms conducted formal biosecurity training for
employees. No primary breeder farms allowed employees that entered poultry houses to
own poultry or other birds, and nearly all required that the producer or employees shower
before entering poultry houses. In addition, all primary breeder farms required that the
producer and employees change clothing, change shoes or use shoe covers, and to not
have been around poultry at least 24 hours before entering poultry houses. Over 8 of 10
multiplier farms required that the producer and employees use footwear protection, not be
around other poultry, and not own poultry or birds. All primary breeder farms and over 90
percent of multiplier farms washed and disinfected feeders, flushed and disinfected water
lines, washed and disinfected poultry houses, and cleaned the ventilation system after
every flock.
• Business visitors that entered the poultry houses during the previous 12 months
included company service personnel, catch crews, and private or company veterinarians.
Only 0.6 percent of primary breeder farms and 16.6 percent of multiplier farms had any
nonbusiness visitors (e.g., neighbors, friends, school field trips) enter the poultry houses
during the previous 12 months.
• Over 9 of 10 primary breeder farms used vehicles dedicated to their company to
transport shavings onto the farm, bring pullets onto the farm, and transport eggs to the
hatchery.

iv / Poultry 2010
• Only 4.4 percent of primary breeder farms used their hatcheries to hatch eggs for other
companies, compared with 21.3 percent of multiplier farms. For over 9 of 10 breeder
farms, reusable flats and racks for transporting eggs could be used by other farms within
the same company but did not go to farms belonging to a different company. The majority
of table-egg breeder farms used disposable flats.
• No breeder farms had pet birds on the farm. Over 8 of 10 breeder farms never saw wild
birds, cats, dogs, and wild mammals in the poultry houses. Rodents were seen daily in the
poultry houses on less than 5 percent of breeder farms.
• Very few disease problems were reported for breeder farms. The most common was
E. coli peritonitis, with 22.7 percent of farms reporting at least a slight problem with E. coli
peritonitis in the last completed flock. None of the breeder farms had any history of
infectious coryza or avian influenza.
• All breeder farms participated in the National Poultry Improvement Plan (NPIP) avian
influenza (AI) program. All primary breeder farms and more than 85 percent of multiplier
farms participated in NPIP programs for pullorum, Mycoplasma synoviae (MS), and
Mycoplasma gallisepticum (MG). Nearly all breeder farms tested their last completed
flocks for MS, MG, and AI. All primary breeder farms and 4 of 10 multiplier farms tested
their last completed flock for pullorum typhoid. (Note: Flocks may have been tested as
pullets before coming onto the farm.) None of the farms that tested their last completed
flocks for pullorum, MG, or AI had a positive test result, and less than 1 percent of farms
had a positive test result for MS.
• Primary breeder farms did not vaccinate breeding hens while in lay. About one-third of
multiplier farms vaccinated hens in lay against Newcastle disease and infectious
bronchitis. Over 80 percent of primary breeder farms and multiplier farms vaccinated
pullets against infectious laryngotracheitis, Newcastle disease, infectious bronchitis,
Salmonella, infectious bursal disease, avian encephalomyelitis, chicken anemia virus,
reovirus, fowl pox, and coccidiosis. All primary breeder farms vaccinated pullets for E. coli,
and nearly all multiplier farms vaccinated pullets for cholera.

USDA APHIS VS / v
Acknowledgments
The Poultry 2010 study was a cooperative effort among animal health officials, university
researchers, extension personnel, and poultry producers. We want to thank industry
members who helped determine the direction and objectives of this study. Recognition
also goes to the personnel at the Centers for Epidemiology and Animal Health for their
efforts in generating reports from Poultry 2010 data and to our reviewers for providing
valuable expertise and guidance through their comments.
All participants are to be commended, particularly the industry veterinarians whose
voluntary efforts made this component of the Poultry 2010 study possible.
Larry M. Granger
Director
Centers for Epidemiology and Animal Health

vi / Poultry 2010
Suggested bibliographic citation for this report:
USDA. 2011. Poultry 2010. “Reference of Health and Management Practices on Breeder
Chicken Farms in the United States, 2010”
USDA–APHIS–VS–CEAH–NAHMS. Fort Collins, CO
#585.1111
Contacts for further information:
Questions or comments on data analysis: Dr. Lindsey Garber (970) 494-7000
Information on reprints or other reports: Ms. Abby Fienhold (970) 494-7000
Email: [email protected]
Feedback
Feedback, comments, and suggestions regarding Poultry 2010 study reports are
welcomed. Please forward correspondence via email at: [email protected], or you
may submit feedback via online survey at: http://nahms.aphis.usda.gov (Click on
“FEEDBACK on NAHMS reports.”)

USDA APHIS VS / vii
Introduction 1Terms Used in This Report 3
Section I: Population Estimates 5
A. Area Surrounding Farm 51. Region 52. Number of birds (poultry) per square mile 53. Number of poultry farms per square mile 74. Neighboring premises 10
B. Breeder Farm Characteristics 171. Farm description 172. Farm access 183. Farm vehicles 214. Litter 275. Source of drinking water 29
C. House Characteristics 331. Number of poultry houses 332. Age of poultry houses 343. Housing security 364. Ground surface surrounding poultry houses 385. Cleaning procedures for poultry houses 426. Down time between flocks 45
D. People 491. Personnel 492. Visitors 543. Biosecurity measures 58
E. Animals 681. Inventory and age grouping 682. Last completed laying flock 743. Spent- and dead-hen disposal 754. Other animals on farm 805. Rodent and insect control 84
F. Bird Health and Vaccination 861. Disease problems 862. Flock testing 963. Vaccines given before and while laying 100
G. Bird Movement/Transport 1061. Replacement pullets 1062. Farms that supplied pullets 1073. Breeding 1114. Vehicles used to remove birds 115
Table of Contents

viii / Poultry 2010
H. Egg Movement and Transport 1171. Egg handling 1172. Eggs transported to the hatchery 1193. Hatcheries that hatch eggs from other farms 1224. Egg flats 1235. Egg racks 1266. Equipment sharing 128
Section II: Methodology 130A. Needs Assessment 130
B. Sampling and Estimation 1301. Phase I: Company survey 1302. Phase II: Breeder Farm study 1313. Data collection 1314. Data analysis 1315. Population inferences 132
C. Response Rate 132
Appendix I: NPIP Testing Requirements 133
Appendix II: NPIP Flocks and Birds 134
Appendix III: Sample Profile 135
1. Number of participating farms by type 1352. Number of participating farms by region 135
Appendix IV: Study Objectives and Related Outputs 136

USDA APHIS VS / 1
Introduction
Introduction
The National Animal Health Monitoring System (NAHMS) is a nonregulatory program of
the United States Department of Agriculture’s (USDA) Animal and Plant Health Inspection
Service. NAHMS is designed to help meet the Nation’s animal-health information needs.
Layers ’99 was NAHMS’ first national study on poultry, and provided baseline health and
management information for the table-egg industry. Layers ’99 estimated the prevalence
and associated risk factors of Salmonella enterica Enteritidis in U.S. layer flocks.
Poultry 2004 was NAHMS’ second study of the U.S. poultry industry. Poultry 2004
provided information regarding bird health, bird movement, and biosecurity practices of
backyard flocks, game fowl breeder flocks, and live poultry markets.
The Small Enterprise Chicken study was NAHMS’ third study of the poultry industry,
focusing on biosecurity and bird movement on operations with 1,000 to 19,999 chickens.
Poultry 2010 is NAHMS’ fourth study of the U.S. poultry industry. For Poultry 2010,
NAHMS conducted an extensive assessment to determine the information needs of the
poultry industry, researchers, and Federal and State governments. This needs
assessment resulted in three study objectives:
1. Describe the structure of commercial poultry industries, including interactions among
poultry industry segments, movements, and biosecurity practices. Describe farm-level
practices for chicken primary breeder and multiplier flocks. Identify critical factors for
exclusion of disease (e.g., Mycoplasma).
2. Estimate the prevalence and investigate risk factors associated with clostridial
dermatitis (cellulitis/gangrenous dermatitis) on turkey-grower farms.
3. Describe bird health, movement, and biosecurity practices of urban chicken flocks in
four U.S. cities—Miami, Denver, Los Angeles, and New York City.
“Reference of Health and Management Practices on Breeder Chicken Farms in the United
States, 2010,” is the fourth in a series of reports containing information from the Poultry
2010 study. For this report, a questionnaire was administered to broiler (meat type) and
layer (egg type) chicken breeder farms located in the Central and East regions of the
United States (see map, p 4). These regions accounted for 98 percent of egg-type
breeder flocks, 97 percent of egg-type breeder birds, and over 99 percent of meat-type
breeder flocks and birds (see Appendix II, p 134). This report contains information
provided from May 27 through October 16, 2010, by poultry company veterinarians or
representatives from 482 chicken breeder farms.

2 / Poultry 2010
Introduction
The methods used and the number of respondents in the study can be found at the end of
this report.
Further information on NAHMS studies and reports is available online at:
http://nahms.aphis.usda.gov
For questions about this report or additional copies, please contact:
USDA–APHIS–VS–CEAH
NRRC Building B, M.S. 2E7
2150 Centre Avenue
Fort Collins CO 80526-8117
970.494.7000

USDA APHIS VS / 3
Introduction
Terms Used in This Report
Anteroom: A room that separates the outside environment from the area where poultry
are housed. The anteroom is usually inside the outer poultry house door and before the
door that leads into the animal area. Farm personnel use the anteroom to change clothes
and disinfect footwear and hands.
Company type:
Breeder company: A company that owns only breeder flocks.
Production company: A company that produces broilers, turkeys, or table eggs
for human consumption. Production companies may or may not also have
multiplier/parent flocks.
Contract farm: A cooperation between a farmer and a poultry company to produce birds;
the farmer provides housing and daily care for the birds, and the poultry company owns
the birds and provides feed and veterinary care.
Farm type:
Breeder farm: Produces eggs for hatching. Includes primary breeder farms for
meat-type (broiler) chickens, primary breeder farms for table-egg-type chickens,
multiplier farms for meat-type (broiler) chickens, and multiplier farms for table-
egg-type chickens.
Primary breeder: Breeding birds whose offspring are used as breeding birds.
These include pedigree (elite/foundation), great-grandparent, and grandparent
flocks. Includes broiler primary breeder farms and table-egg primary breeder
farms.
Multiplier (parent): Breeding birds whose offspring are used as production birds
(broilers, market turkeys, table egg layers). Includes broiler multiplier farms and
table-egg multiplier farms.
Broiler breeder: Includes primary breeder farms and multiplier farms for meat-
type (broiler) chickens.
Table-egg breeder: Includes primary breeder farms and multiplier farms for
table-egg-type chickens.
Production farm: Produces final product for human consumption.
Broiler farm: Produces chickens for meat.
Table-egg farm: Produces eggs for human consumption.
Turkey farm: Produces turkeys for meat.
Pullet farm: Raises young female birds that will be placed on laying farms, etc. (either
breeder farms or table-egg farms). A pullet farm does not have adult breeding hens.

4 / Poultry 2010
Introduction
Operation average: The average value for all operations. A single value for each
operation is summed over all operations reporting divided by the number of operations
reporting. For example, operation average of characteristics of last completed flock (see
table a., p 74) is calculated by summing reported average characteristics over all
operations divided by the number of operations.
Population estimates: Population estimates in this report are provided with a
measure of precision called the standard error. A 95-percent confidence
interval can be created with bounds equal to the estimate plus or minus two
standard errors. If the only error is sampling error, the confidence intervals
created in this manner will contain the true population mean 95 out of 100
times. In the example to the left, an estimate of 7.5 with a standard error of
1.0 results in limits of 5.5 to 9.5 (two times the standard error above and
below the estimate). The second estimate of 3.4 shows a standard error of
0.3 and results in limits of 2.8 and 4.0. Alternatively, the 90-percent confidence
interval would be created by multiplying the standard error by 1.65 instead of
2. Most estimates in this report are rounded to the nearest tenth. If rounded to
0, the standard error was reported (0.0). If there were no reports of the event,
no standard error was reported (—). References to estimates being higher or
lower than other estimates are based on the 95-percent confidence intervals
not overlapping.
Shavings: The bedding on the floor of the poultry houses. Common bedding materials
include wood shavings and rice hulls.
Standard Errors(1.0)
10
9
8
7
6
5
4
3
2
1
0(0.3)
Examples of a 95% Confidence Interval
95% Confidence Intervals
USDA APHIS VS / 5
Section I: Population Estimates—A . Area Surrounding Farm
Section I: Population Estimates
A. AreaSurroundingFarm
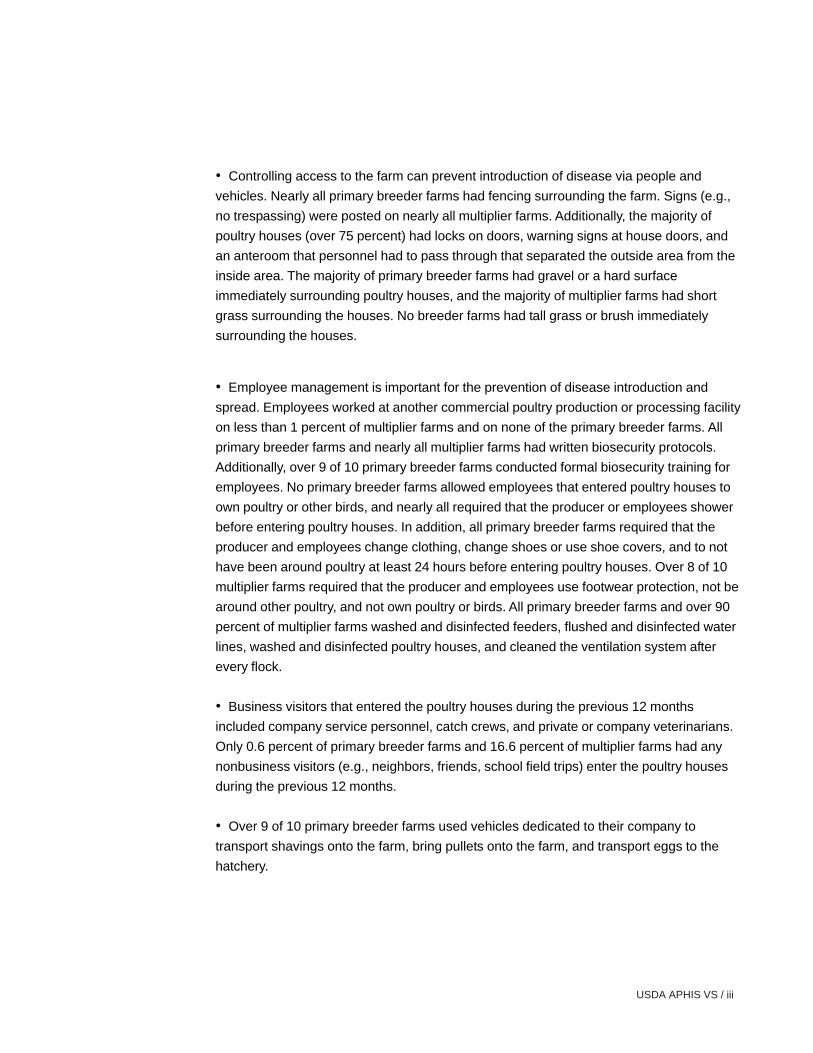
1. Region
Primary breeder and multiplier farms that produced broilers were concentrated in the East
region. More than 8 of 10 primary breeder farms that produced table-egg-type chickens
(84.5 percent) were located in the Central region.
Percentage of farms by region and by farm type:
Percent Farms
Farm Type
Primary breeder—
broiler
Primary breeder— table egg
Multiplier— broiler
Multiplier— table egg
All breeder farms
Region Pct. Std. error Pct.
Std. error Pct.
Std. error Pct.
Std. error Pct.
Std. error
Central 29.6 (5.6) 84.5 (13.2) 21.9 (1.7) 41.6 (6.6) 23.5 (1.6)
East 70.4 (5.6) 15.5 (13.2) 78.1 (1.7) 58.4 (6.6) 76.5 (1.6)
Total 100.0 100.0 100.0 100.0 100.0
2. Number of birds (poultry) per square mile
About 3 of 4 breeder farms (76.7 percent) were located in counties with 2,000 or more
birds per square mile.
a. Percentage of breeder farms by number of birds (poultry) per square mile in farm’s
county, and by region:
Percent Breeder Farms
Region
Central East All farms
Number of birds Pct. Std. error Pct.
Std. error Pct.
Std. error
Less than 100 9.4 (4.4) 8.7 (2.0) 8.8 (1.8)
100 to less than 2,000 24.0 (3.3) 11.6 (2.3) 14.5 (2.0)
2,000 or more 66.6 (5.0) 79.7 (2.7) 76.7 (2.4)
Total 100.0 100.0 100.0

6 / Poultry 2010
Section I: Population Estimates—A . Area Surrounding Farm
Six of 10 primary breeder farms (59.0 percent) and 8 of 10 multiplier farms (78.9 percent)
were located in counties with 2,000 or more birds per square mile.
b. Percentage of farms by number of birds (poultry) per square mile in farm’s county, and
by farm type:
The majority of broiler breeder farms (77.9 percent) were located in counties with 2,000 or
more birds per square mile. The majority of table-egg breeder farms (54.1 percent) were
located in counties with 100 to fewer than 2,000 birds per square mile.
c. Percentage of farms by number of birds (poultry) per square mile in farm’s county, and
by farm type:
Percent Farms
Farm Type
Primary breeder Multiplier
Number of birds Percent Std. error Percent
Std. error
Less than 100 9.1 (2.5) 8.8 (2.1)
100 to less than 2,000 31.9 (2.1) 12.3 (2.2)
2,000 or more 59.0 (2.4) 78.9 (2.7)
Total 100.0 100.0
Percent Farms
Farm Type
Broiler breeder Table-egg breeder
Number of birds Percent Std. error Percent
Std. error
Less than 100 8.9 (1.9) 6.6 (1.8)
100 to less than 2,000 13.2 (2.0) 54.1 (5.1)
2,000 or more 77.9 (2.5) 39.3 (5.0)
Total 100.0 100.0

USDA APHIS VS / 7
Section I: Population Estimates—A . Area Surrounding Farm
3. Number of poultry farms per square mile
About one-half the breeder farms in the East region (50.9 percent) were located in
counties with 0.25 poultry farms or more per square mile. In the Central region, the
majority of breeder farms (60.0 percent) were located in counties with 0.125 to fewer than
0.25 poultry farms per square mile.
a. Percentage of breeder farms by number of poultry farms per square mile in farm’s
county, and by region:
Percent Breeder Farms
Region
Central East All farms
Number of poultry farms Pct. Std. error Pct.
Std. error Pct.
Std. error
Less than 0.05 2.5 (0.6) 14.0 (2.7) 11.3 (2.0)
0.05 to less than 0.125 32.2 (5.0) 20.1 (2.8) 22.9 (2.4)
0.125 to less than 0.25 60.0 (5.0) 15.0 (2.1) 25.5 (1.9)
0.25 or more 5.3 (1.9) 50.9 (2.5) 40.3 (2.0)
Total 100.0 100.0 100.0
8 / Poultry 2010
Section I: Population Estimates—A . Area Surrounding Farm
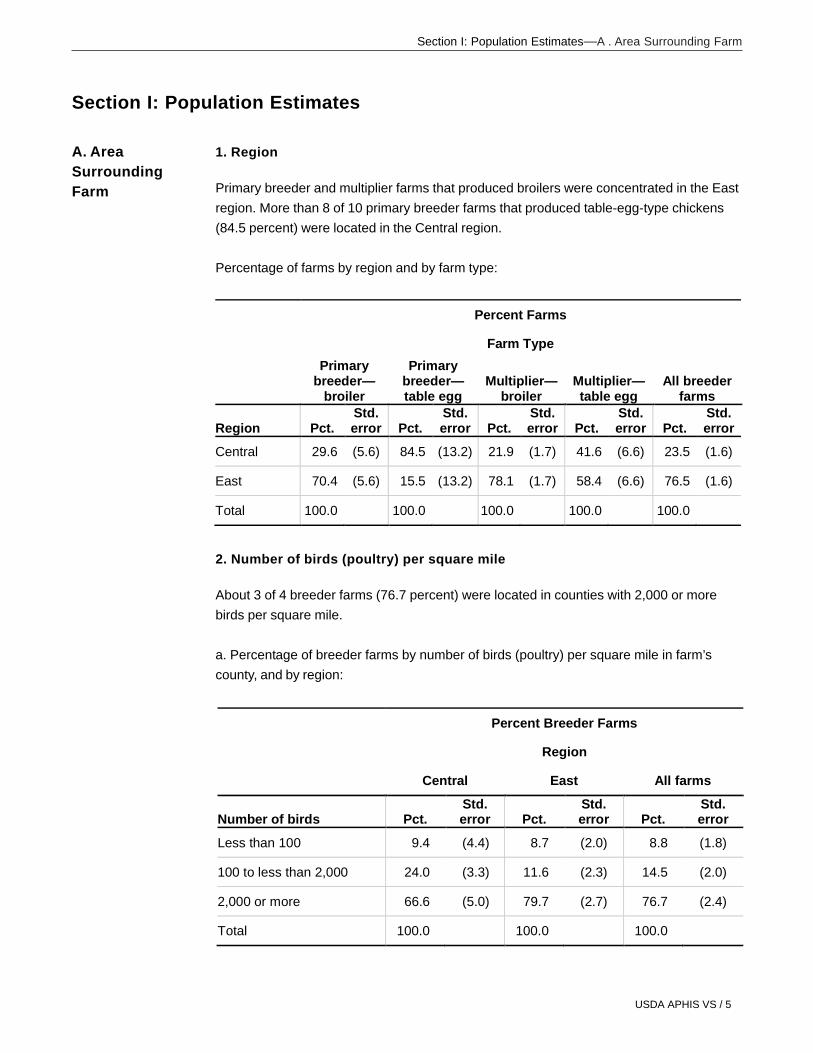
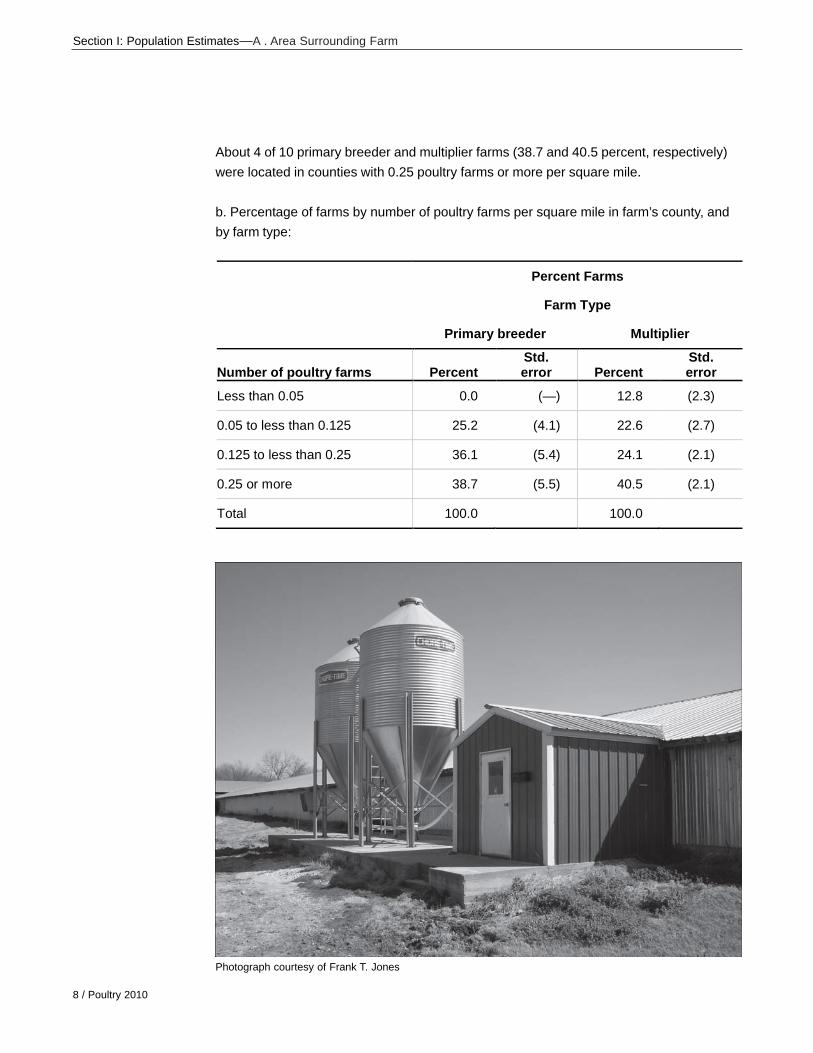
About 4 of 10 primary breeder and multiplier farms (38.7 and 40.5 percent, respectively)
were located in counties with 0.25 poultry farms or more per square mile.
b. Percentage of farms by number of poultry farms per square mile in farm’s county, and
by farm type:
Photograph courtesy of Frank T. Jones
Percent Farms
Farm Type
Primary breeder Multiplier
Number of poultry farms Percent Std. error Percent
Std. error
Less than 0.05 0.0 (—) 12.8 (2.3)
0.05 to less than 0.125 25.2 (4.1) 22.6 (2.7)
0.125 to less than 0.25 36.1 (5.4) 24.1 (2.1)
0.25 or more 38.7 (5.5) 40.5 (2.1)
Total 100.0 100.0

USDA APHIS VS / 9
Section I: Population Estimates—A . Area Surrounding Farm
About 4 of 10 table-egg breeder farms (43.8 percent) were located in counties with 0.05 to
less than 0.125 poultry farms per square mile.
c. Percentage of farms by number of poultry farms per square mile in farm’s county, and
by farm type:
Percent Farms
Farm Type
Broiler breeder Table-egg breeder
Number of poultry farms Percent Std. error Percent
Std. error
Less than 0.05 10.8 (2.1) 29.0 (4.8)
0.05 to less than 0.125 22.2 (2.5) 43.8 (5.1)
0.125 to less than 0.25 26.2 (2.0) 2.9 (2.9)
0.25 or more 40.8 (2.0) 24.3 (5.4)
Total 100.0 100.0

10 / Poultry 2010
Section I: Population Estimates—A . Area Surrounding Farm
4. Neighboring premises
On average, both primary breeder farms and multiplier farms were more than 2 miles
away from a water body where wild water fowl congregate. About one-half of respondents
did not know the distance to the nearest premises with backyard poultry or to a live-poultry
market. For those who did know, the average distance to the nearest premises with
backyard poultry was 2.5 miles, and the average distance to the nearest live-poultry
market was more than 20 miles. Processing or rendering facilities were 25.5 miles away,
on average.
a. Average distance (in miles) from farm to nearest neighboring premises, by farm type:
Average Distance (miles)
Farm Type
Primary breeder Multiplier All farms Did not know
Premises Avg. Std. error Avg.
Std. error Avg.
Std. error Pct.
Std. error
Water body where wild water fowl congregate
2.4 (0.4) 3.2 (0.4) 3.1 (0.4) 20.2 (2.6)
Premises with commercial poultry that contracts with this company
2.0 (0.2) 3.0 (0.3) 2.9 (0.3) 6.0 (1.5)
Premises with commercial poultry, different company
4.3 (1.5) 6.5 (0.8) 6.3 (0.7) 22.8 (2.1)
Premises with backyard, hobby, or fighting poultry
1.3 (0.1) 2.7 (0.3) 2.5 (0.2) 50.1 (3.0)
Live poultry market or poultry flea market
20.8 (1.8) 21.2 (1.5) 21.1 (1.4) 58.1 (2.6)
Processing or rendering facility
19.7 (2.4) 26.1 (1.3) 25.5 (1.2) 36.5 (2.4)

USDA APHIS VS / 11
Section I: Population Estimates—A . Area Surrounding Farm
Table-egg breeder farms were farther away from other commercial poultry premises
(either same company or different company) on average than broiler breeder farms.
Conversely, broiler breeder farms were farther away from a water body where wild water
fowl congregated on average than layer breeder farms, although table-egg breeders were
still an average of 1.1 miles away from a water body.
b. Average distance (in miles) from farm to nearest neighboring premises, by farm type:
Average Distance (miles)
Farm Type
Broiler breeder Table-egg breeder
Premises Average Std. error Average Std. error
Water body where wild water fowl congregate
3.1 (0.4) 1.1 (0.2)
Premises with commercial poultry that contracts with this company
2.8 (0.3) 9.1 (0.7)
Premises with commercial poultry, different company
5.9 (0.7) 17.7 (1.1)
Premises with backyard, hobby, or fighting poultry
2.5 (0.2) 4.5 (2.4)
Live poultry market or poultry flea market
21.1 (1.4) *
Processing or rendering facility 25.5 (1.2) 18.3 (3.1)
*Too few responses to estimate.

12 / Poultry 2010
Section I: Population Estimates—A . Area Surrounding Farm
The majority of breeder farms were located more than 1 mile from a commercial poultry
farm belonging to a different company, backyard poultry, or premises with pigs. About one-
half of breeder farms (49.3 percent) had no commercial poultry farms that contracted with
their company located within a 1-mile radius of the farm.
c. Percentage of breeder farms by type and number of premises within a 1-mile radius:
Percent Breeder Farms
Number of Premises
0 1 2 3 or more
Premises type Pct. Std. error Pct.
Std. error Pct.
Std. error Pct.
Std. error Total
Commercial poultry farm that contracts with this company
49.3 (3.2) 27.8 (3.0) 12.0 (2.4) 10.9 (1.8) 100.0
Commercial poultry farm, different company
65.7 (3.0) 19.2 (2.7) 9.6 (2.0) 5.5 (1.4) 100.0
Backyard/hobby/ fighting poultry
76.0 (2.9) 18.8 (2.8) 3.3 (1.3) 1.9 (1.2) 100.0
Premises with pigs
90.1 (2.2) 8.9 (2.2) 0.8 (0.8) 0.2 (0.2) 100.0

USDA APHIS VS / 13
Section I: Population Estimates—A . Area Surrounding Farm

14 / Poultry 2010
Section I: Population Estimates—A . Area Surrounding Farm
About 4 of 10 primary breeder farms (39.9 percent) and 2 of 10 multiplier farms
(21.9 percent) were located within a 1-mile radius of a backyard poultry flock.
d. Percentage of farms by type of premises within a 1-mile radius and by farm type:
Percent Farms
Farm Type
Primary breeder Multiplier All farms
Premises type Pct. Std. error Pct.
Std. error Pct.
Std. error
Commercial poultry farm that contracts with this company
49.1 (5.5) 50.9 (3.5) 50.7 (3.2)
Commercial poultry farm, different company
38.1 (4.8) 33.9 (3.3) 34.3 (3.0)
Backyard/hobby/ fighting poultry
39.9 (5.6) 21.9 (3.2) 24.0 (2.9)
Premises with pigs 9.8 (3.6) 9.9 (2.5) 9.9 (2.2)
A small percentage of farms (1.4 percent) had free-ranging backyard poultry within
100 feet of the farm perimeter during the previous 12 months.
e. Percentage of farms that had seen free-ranging backyard poultry within 100 feet of the
farm during the previous 12 months, by region:
Percent Farms
Region
Central East All farms
Percent Std. error Percent Std. error Percent Std. error
4.2 (3.5) 0.5 (0.3) 1.4 (0.9)

USDA APHIS VS / 15
Section I: Population Estimates—A . Area Surrounding Farm
f. Percentage of primary breeder and multiplier farms that had seen free-ranging backyard
poultry within 100 feet of the farm during the previous 12 months:
Percent Farms
Farm Type
Primary breeder Multiplier
Percent Std. error Percent Std. error
3.8 (2.7) 1.1 (0.9)
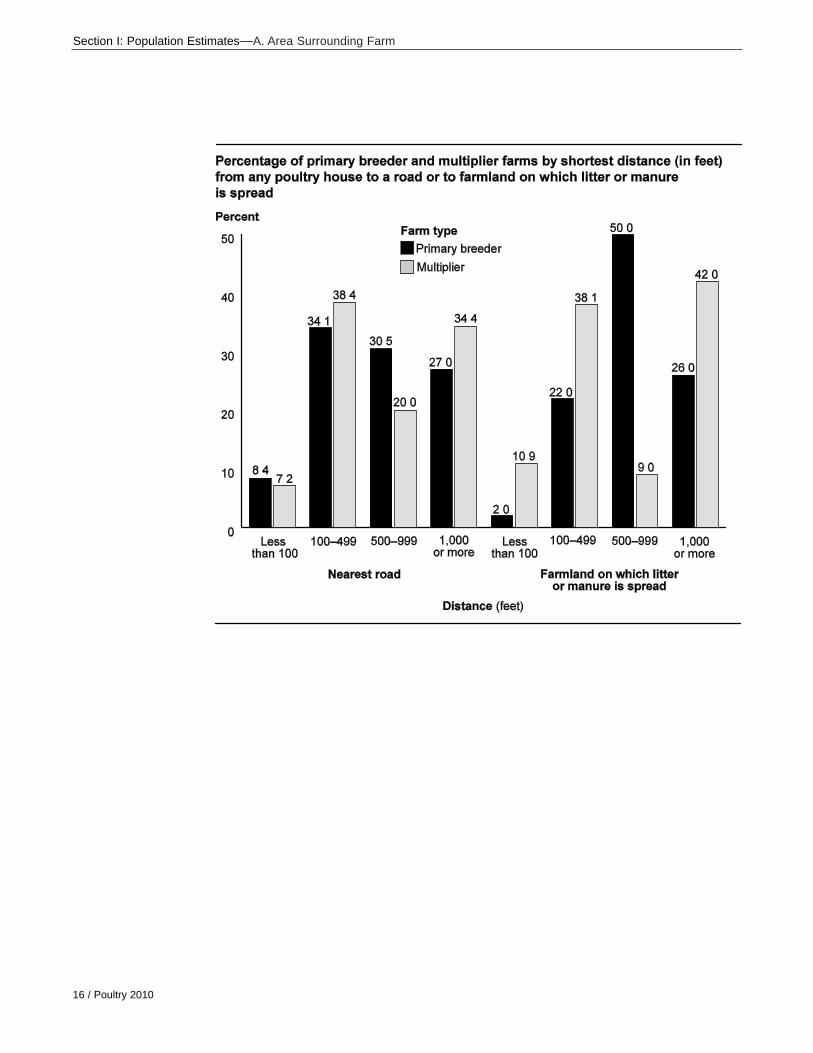
On over one-half of primary breeder and multiplier farms (57.5 and 54.4 percent,
respectively), the nearest road was 500 or more feet from any of the farms’ poultry
houses. On less than 10 percent of primary breeder and multiplier farms (8.4 and
7.2 percent, respectively), the nearest road was less than 100 feet from any of the farms’
poultry houses. On over three-fourths of primary breeder farms (76.0 percent) and over
one-half of multiplier farms (51.0 percent), the nearest farmland on which litter or manure
was spread was 500 or more feet away from any of the farms’ poultry houses. (See
Section B.4 on p 27 for more information about litter application to land.)
g. Percentage of primary breeder and multiplier farms by shortest distance (in feet) from
any poultry house to a road or to farmland on which litter or manure is spread:
Percent Farms
Distance (feet)
Less than 100 100–499 500–999 1,000 or more
Pct. Std. error Pct.
Std. error Pct.
Std. error Pct.
Std. error Total
Nearest road
Primary breeder
8.4 (1.6) 34.1 (5.4) 30.5 (5.5) 27.0 (5.2) 100.0
Multiplier 7.2 (2.1) 38.4 (3.5) 20.0 (2.7) 34.4 (3.2) 100.0
Nearest farmland on which litter or manure is spread
Primary breeder
2.0 (2.0) 22.0 (5.0) 50.0 (3.8) 26.0 (5.3) 100.0
Multiplier 10.9 (2.3) 38.1 (3.6) 9.0 (2.0) 42.0 (3.5) 100.0
16 / Poultry 2010
Section I: Population Estimates—A. Area Surrounding Farm

USDA APHIS VS / 17
Section I: Population Estimates—B. Breeder Farm Characteristics
B. Breeder FarmCharacteristics
1. Farm description
The Poultry 2010 breeder farm study included broiler and table-egg breeder farms
belonging to breeder companies and production companies. Overall, 10.0 percent of
broiler and table-egg breeder farms were primary breeder farms. The majority of breeder
farms (87.5 percent) were broiler multiplier farms.
a. Percentage of breeder farms by farm type:
Farm type Percent farms Std. error
Primary breeder—broiler 9.5 (0.0)
Primary breeder—table egg 0.5 (0.1)
Multiplier/parent—broiler 87.5 (0.0)
Multiplier/parent—table egg 2.5 (0.1)
Total 100.0
18 / Poultry 2010
Section I: Population Estimates—B. Breeder Farm Characteristics
Birds on all primary breeder farms (100.0 percent) and birds on about 9 of 10 table-egg
multiplier farms (90.9 percent) were owned by breeder companies. Birds on nearly all
broiler multiplier farms (98.7 percent) were owned by production companies.
b. Percentage of farms by bird ownership and by farm type:
Percent Farms
Farm Type
Primary breeder—
broiler
Primary breeder— table egg
Multiplier— broiler
Multiplier— table egg
All breeder farms
Bird ownership Pct.
Std. error Pct.
Std. error Pct.
Std. error Pct.
Std. error Pct.
Std. error
Breeder company
100.0 (—) 100.0 (—) 1.3 (0.5) 90.9 (0.4) 13.5 (0.4)
Production company
0.0 (—) 0.0 (—) 98.7 (0.5) 9.1 (0.4) 86.5 (0.4)
Total 100.0 100.0 100.0 100.0 100.0
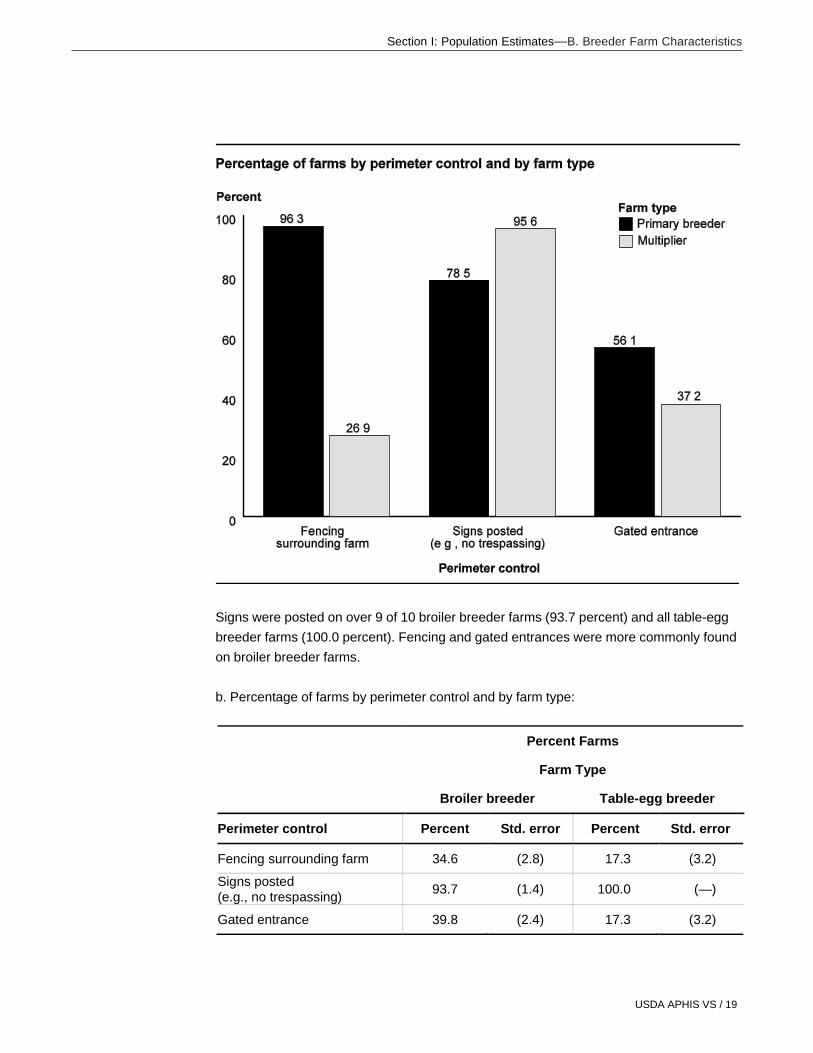
2. Farm access
Nearly all primary breeder farms (96.3 percent) had fencing surrounding the farm. Signs
were posted on nearly all multiplier farms (95.6 percent).
a. Percentage of farms by perimeter control and by farm type:
Percent Farms
Farm Type
Primary breeder Multiplier All farms
Perimeter control Pct. Std. error Pct.
Std. error Pct.
Std. error
Fencing surrounding farm 96.3 (0.6) 26.9 (3.0) 34.1 (2.7)
Signs posted (e.g., no trespassing)
78.5 (2.2) 95.6 (1.5) 93.8 (1.3)
Gated entrance 56.1 (0.6) 37.2 (2.6) 39.1 (2.3)
USDA APHIS VS / 19
Section I: Population Estimates—B. Breeder Farm Characteristics
Signs were posted on over 9 of 10 broiler breeder farms (93.7 percent) and all table-egg
breeder farms (100.0 percent). Fencing and gated entrances were more commonly found
on broiler breeder farms.
b. Percentage of farms by perimeter control and by farm type:
Percent Farms
Farm Type
Broiler breeder Table-egg breeder
Perimeter control Percent Std. error Percent Std. error
Fencing surrounding farm 34.6 (2.8) 17.3 (3.2)
Signs posted (e.g., no trespassing)
93.7 (1.4) 100.0 (—)
Gated entrance 39.8 (2.4) 17.3 (3.2)
20 / Poultry 2010
Section I: Population Estimates—B. Breeder Farm Characteristics
On 81.2 percent of farms, vehicles came onto the farm via gravel road.
c. Percentage of farms by road surface used by vehicles coming onto the farm and by
farm type:
Percent Farms
Farm Type
Primary breeder Multiplier All farms
Road surface Pct. Std. error Pct.
Std. error Pct.
Std. error
Hardtop/asphalt 2.2 (1.0) 2.8 (0.7) 2.7 (0.7)
Gravel 88.6 (3.1) 80.4 (2.9) 81.2 (2.6)
Dirt 9.2 (3.0) 16.8 (2.8) 16.1 (2.5)
Total 100.0 100.0 100.0
d. Percentage of farms by road surface used by vehicles coming onto the farm and by
farm type:
Percent Farms
Farm Type
Broiler breeder Table-egg breeder
Road surface Percent Std. error Percent Std. error
Hardtop/asphalt 2.8 (0.7) 1.3 (1.3)
Gravel 80.8 (2.7) 94.7 (3.3)
Dirt 16.4 (2.6) 4.0 (3.0)
Total 100.0 100.0

USDA APHIS VS / 21
Section I: Population Estimates—B. Breeder Farm Characteristics
3. Farm vehicles
The majority of primary breeder farms required that visits by the specified vehicle types be
recorded in a vehicle log. About 4 of 10 primary breeder farms required that the tires on
feed trucks, vehicles moving birds onto the operation, and vehicles removing eggs be
sprayed before entering the farm. Vehicle tires are often sprayed with a disinfectant to
prevent introduction of disease.
a. Percentage of primary breeder farms by biosecurity procedures required for the
following vehicle types visiting the farm:
Percent Primary Breeder Farms
Biosecurity Procedure
Recorded in vehicle log
Tires sprayed before
entering farm
Tires sprayed before leaving
farm
Must park at least 100 ft from
bird houses
Vehicle type Pct. Std. error Pct.
Std. error Pct.
Std. error Pct.
Std. error
Feed delivery vehicle 94.6 (3.2) 41.8 (4.2) 5.5 (3.2) 6.4 (3.3)
Vehicle for moving birds onto operation
95.9 (2.5) 46.2 (3.2) 6.8 (3.7) 0.0 (—)
Vehicle for moving birds off operation
62.9 (4.9) 13.2 (4.6) 3.2 (2.4) 0.0 (—)
Vehicle for removing eggs
86.9 (3.8) 39.4 (4.6) 4.5 (3.1) 2.3 (2.3)
Vehicle of service technician or veterinarian
84.5 (4.9) 7.2 (3.7) 0.0 (—) 28.1 (5.4)
Vehicle(s) of catch crews or vaccination crews*
84.7 (5.1) 24.9 (5.5) 0.0 (—) 24.4 (5.5)
*For farms that have catch or vaccination crews.

22 / Poultry 2010
Section I: Population Estimates—B. Breeder Farm Characteristics

USDA APHIS VS / 23
Section I: Population Estimates—B. Breeder Farm Characteristics
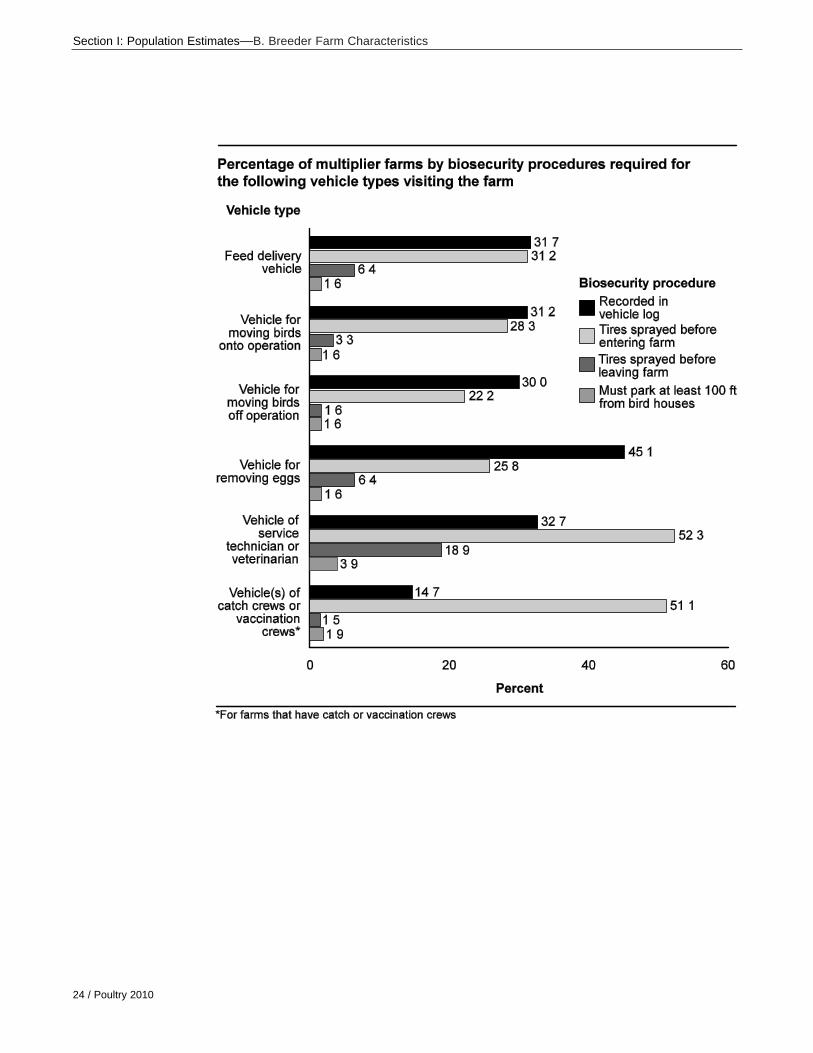
At least 3 of 10 multiplier farms kept a vehicle log to record visits by feed trucks, vehicles
moving birds onto and off the operation, vehicles removing eggs, and vehicles of a service
technician or veterinarian. Over one-half of multiplier farms sprayed the tires of service
technician/veterinarian and catch/vaccination crew vehicles before allowing the vehicles
entrance to the farm.
b. Percentage of multiplier farms by biosecurity procedures required for the following
vehicle types visiting the farm:
Percent Multiplier Farms
Biosecurity Procedure
Recorded in vehicle log
Tires sprayed before
entering farm
Tires sprayed before leaving
farm
Must park at least 100 ft from
bird houses
Vehicle type Pct. Std. error Pct.
Std. error Pct.
Std. error Pct.
Std. error
Feed delivery vehicle 31.7 (2.3) 31.2 (2.2) 6.4 (2.0) 1.6 (0.5)
Vehicle for moving birds onto operation
31.2 (2.2) 28.3 (2.2) 3.3 (1.5) 1.6 (0.5)
Vehicle for moving birds off operation
30.0 (2.2) 22.2 (1.9) 1.6 (1.0) 1.6 (0.5)
Vehicle for removing eggs
45.1 (2.2) 25.8 (2.0) 6.4 (2.0) 1.6 (0.5)
Vehicle of service technician or veterinarian
32.7 (2.4) 52.3 (2.0) 18.9 (1.8) 3.9 (1.3)
Vehicle(s) of catch crews or vaccination crews*
14.7 (2.4) 51.1 (2.4) 1.5 (1.0) 1.9 (0.6)
*For farms that have catch or vaccination crews.
24 / Poultry 2010
Section I: Population Estimates—B. Breeder Farm Characteristics

USDA APHIS VS / 25
Section I: Population Estimates—B. Breeder Farm Characteristics
Overall, 99.4 percent of breeder farms used shavings as bedding in poultry houses.
c. Percentage of farms that used shavings, by farm type:
Percent Farms
Farm Type
Primary breeder Multiplier All farms
Percent Std. error Percent Std. error Percent Std. error
95.1 (0.7) 99.8 (0.1) 99.4 (0.0)
All broiler breeder farms and 80.0 percent of table-egg breeder farms used shavings.
d. Percentage of farms that used shavings, by farm type:
Percent Farms
Farm Type
Broiler breeder Table-egg breeder
Percent Std. error Percent Std. error
100.0 (—) 80.0 (1.3)
26 / Poultry 2010
Section I: Population Estimates—B. Breeder Farm Characteristics
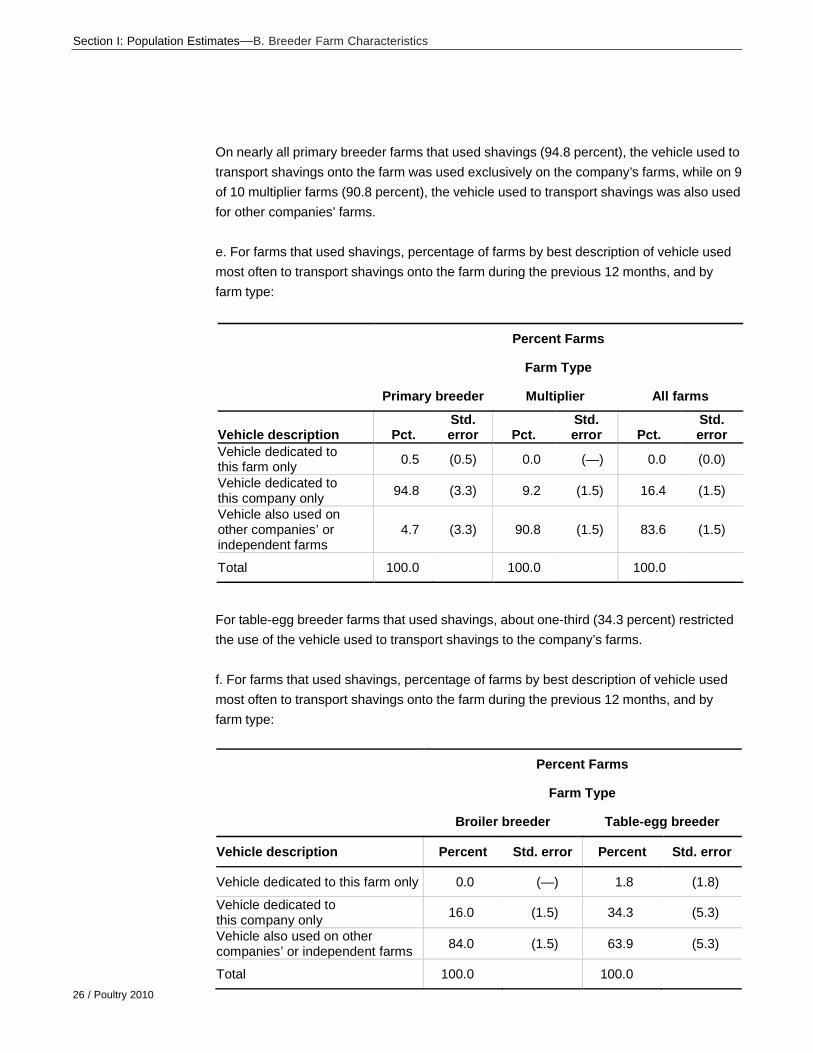
On nearly all primary breeder farms that used shavings (94.8 percent), the vehicle used to
transport shavings onto the farm was used exclusively on the company’s farms, while on 9
of 10 multiplier farms (90.8 percent), the vehicle used to transport shavings was also used
for other companies’ farms.
e. For farms that used shavings, percentage of farms by best description of vehicle used
most often to transport shavings onto the farm during the previous 12 months, and by
farm type:
Percent Farms
Farm Type
Primary breeder Multiplier All farms
Vehicle description Pct. Std. error Pct.
Std. error Pct.
Std. error
Vehicle dedicated to this farm only
0.5 (0.5) 0.0 (—) 0.0 (0.0)
Vehicle dedicated to this company only
94.8 (3.3) 9.2 (1.5) 16.4 (1.5)
Vehicle also used on other companies’ or independent farms
4.7 (3.3) 90.8 (1.5) 83.6 (1.5)
Total 100.0 100.0 100.0
For table-egg breeder farms that used shavings, about one-third (34.3 percent) restricted
the use of the vehicle used to transport shavings to the company’s farms.
f. For farms that used shavings, percentage of farms by best description of vehicle used
most often to transport shavings onto the farm during the previous 12 months, and by
farm type:
Percent Farms
Farm Type
Broiler breeder Table-egg breeder
Vehicle description Percent Std. error Percent Std. error
Vehicle dedicated to this farm only 0.0 (—) 1.8 (1.8)
Vehicle dedicated to this company only
16.0 (1.5) 34.3 (5.3)
Vehicle also used on other companies’ or independent farms
84.0 (1.5) 63.9 (5.3)
Total 100.0 100.0

USDA APHIS VS / 27
Section I: Population Estimates—B. Breeder Farm Characteristics
4. Litter
For breeder farms that used shavings, about 9 of 10 farms (88.2 percent) moved used
litter off the farm. Litter was not reused for a second flock on any breeder farms.
Producers may use more than one litter disposal practice.
a. For farms that used shavings, percentage of farms by disposition of used litter after the
completion of a flock’s laying cycle, and by farm type:
Percent Farms
Farm Type
Primary breeder Multiplier All farms
Litter disposition Pct. Std. error Pct.
Std. error Pct.
Std. error
Stored on farm 2.4 (2.4) 17.5 (2.8) 16.3 (2.6)
Applied to land on this farm 43.9 (5.9) 61.4 (3.1) 59.9 (2.9)
Moved off the farm 85.2 (2.9) 88.5 (2.2) 88.2 (2.0)
Reused for another flock 0.0 (—) 0.0 (—) 0.0 (—)
No table-egg breeder farms stored used litter on the farm, while 16.7 percent of broiler
breeder farms did.
b. For farms that used shavings, percentage of farms by disposition of used litter after the
completion of a flock’s laying cycle, and by farm type:
Percent Farms
Farm Type
Broiler breeder Table-egg breeder
Litter disposition Percent Std. error Percent Std. error
Stored on farm 16.7 (2.7) 0.0 (—)
Applied to land on this farm 59.2 (3.0) 89.6 (3.8)
Moved off the farm 88.1 (2.1) 92.6 (4.3)
Reused for another flock 0.0 (—) 0.0 (—)

28 / Poultry 2010
Section I: Population Estimates—B. Breeder Farm Characteristics
The majority of breeder farms that stored used litter (80.7 percent) stored the litter 100 to
499 feet from the nearest poultry house.
c. For breeder farms that stored used litter on the farm, percentage of farms by distance
(in feet) from litter storage to nearest poultry house:
Distance (feet) Percent breeder farms Std. error
Less than 100 15.0 (7.5)
100–499 80.7 (7.7)
500 or more 4.3 (2.5)
Total 100.0
A very small percentage of primary breeder and multiplier farms applied litter and/or
manure from another farm to their land. Typically, when litter from another farm was
applied it was from the same company.
d. Percentage of farms that applied litter and/or manure from another farm to their land, by
litter/manure source and by farm type:
Percent Farms
Farm Type
Primary breeder Multiplier All farms
Litter/manure source Pct.
Std. error Pct.
Std. error Pct.
Std. error
Same company 2.3 (2.3) 2.0 (0.9) 2.1 (0.8)
Different company 0.0 (—) 0.2 (0.2) 0.2 (0.2)
Either 2.3 (2.3) 2.0 (0.9) 2.1 (0.8)

USDA APHIS VS / 29
Section I: Population Estimates—B. Breeder Farm Characteristics
A very small percentage of broiler breeder farms and no layer breeder farms applied litter
and/or manure from another farm to their land.
e. Percentage of farms that applied litter and/or manure from another farm to their land, by
litter/manure source and by farm type:
Percent Farms
Farm Type
Broiler breeder Table-egg breeder
Litter/manure source Percent Std. error Percent Std. error
Same company 2.1 (0.9) 0.0 (—)
Different company 0.2 (0.2) 0.0 (—)
Either 2.1 (0.9) 0.0 (—)
5. Source of drinking water
About 8 of 10 multiplier farms (82.6 percent) used well water for their birds’ drinking water,
and nearly one-half of primary breeder farms (45.1 percent) used municipal water.
a. Percentage of farms by source of birds’ drinking water and by farm type:
Percent Farms
Farm Type
Primary breeder Multiplier All farms
Source of drinking water Pct.
Std. error Pct.
Std. Error Pct.
Std. error
Surface water 0.0 (—) 0.7 (0.7) 0.7 (0.7)
Well water 54.9 (5.0) 82.6 (2.8) 79.8 (2.6)
Municipal water system 45.1 (5.0) 16.4 (2.8) 19.2 (2.6)
Other water system 0.0 (—) 0.3 (0.2) 0.3 (0.2)
Total 100.0 100.0 100.0

30 / Poultry 2010
Section I: Population Estimates—B. Breeder Farm Characteristics
For primary breeder farms that did not use municipal water for their birds’ drinking water,
about two-thirds (68.7 percent) sanitized the water. Some farms may monitor water for
bacteria and sanitize the water only when necessary.
b. For farms that did not use municipal water for birds’ drinking water, percentage of farms
that sanitized the water (e.g., chlorination, peroxide, etc.), by farm type:
Percent Farms
Farm Type
Primary breeder Multiplier All farms
Percent Std. error Percent Std. error Percent Std. error
68.7 (8.2) 27.7 (2.6) 30.7 (2.5)
A higher percentage of table-egg breeder farms than broiler breeder farms used municipal
water for their birds’ drinking water (40.0 and 18.6 percent, respectively).
c. Percentage of farms by source of birds’ drinking water and by farm type:
Percent Farms
Farm Type
Broiler breeder Table-egg breeder
Source of drinking water Percent Std. error Percent Std. error
Surface water 0.7 (0.7) 0.0 (—)
Well water 80.4 (2.7) 60.0 (4.2)
Municipal water system 18.6 (2.7) 40.0 (4.2)
Other water system 0.3 (0.2) 0.0 (—)
Total 100.0 100.0

USDA APHIS VS / 31
Section I: Population Estimates—B. Breeder Farm Characteristics
Photograph courtesy of Frank T. Jones
Nearly all table-egg breeder farms that did not use municipal water for their birds’ drinking
water sanitized the water (95.8 percent).
d. For farms that did not use municipal water for birds’ drinking water, percentage of farms
that sanitized the water (e.g., chlorination, peroxide, etc.), by farm type:
Percent Farms
Farm Type
Broiler breeder Table-egg breeder
Percent Std. error Percent Std. error
29.1 (2.5) 95.8 (2.0)

32 / Poultry 2010
Section I: Population Estimates—B. Breeder Farm Characteristics
The percentages of farms by sources of birds’ drinking water were similar by region.
e. Percentage of farms by source of birds’ drinking water and by region:
Percent Farms
Region
Central East
Source of drinking water Percent Std. error Percent Std. error
Surface water 0.0 (—) 0.8 (0.9)
Well water 72.8 (6.7) 82.0 (2.7)
Municipal water system 27.2 (6.7) 16.8 (2.7)
Other water system 0.0 (—) 0.4 (0.3)
Total 100.0 100.0

USDA APHIS VS / 33
Section I: Population Estimates—C. House Characteristics
C. HouseCharacteristics
1. Number of poultry houses
A total of 5.3 percent of primary breeder farms and 26.9 percent of multiplier farms had
three or more poultry houses on the farm.
a. Percentage of farms by number of poultry houses on the farm, and by farm type:
Percent Farms
Farm Type
Primary breeder Multiplier All farms
Number of houses Pct. Std.
Error Pct. Std.
Error Pct. Std. Error
1 23.2 (3.4) 19.1 (2.5) 19.5 (2.3)
2 71.5 (4.2) 54.0 (3.5) 55.8 (3.2)
3–4 4.6 (2.7) 26.6 (3.0) 24.4 (2.7)
5 or more 0.7 (0.5) 0.3 (0.2) 0.3 (0.2)
Total 100.0 100.0 100.0
Broiler breeder farms tended to have more poultry houses on the farm than table-egg
breeder farms.
b. Percentage of farms by number of poultry houses on the farm, and by farm type:
Percent Farms
Farm Type
Broiler breeder Table-egg breeder
Number of houses Percent Std. error Percent Std. error
1 17.9 (2.4) 71.7 (5.0)
2 57.2 (3.3) 7.7 (3.5)
3–4 24.7 (2.8) 14.3 (4.7)
5 or more 0.2 (0.2) 6.3 (2.5)
Total 100.0 100.0

34 / Poultry 2010
Section I: Population Estimates—C. House Characteristics
The percentages of farms by number of poultry houses were similar across regions.
c. Percentage of breeder farms by number of poultry houses on the farm, and by region:
Percent Breeder Farms
Region
Central East
Number of houses Percent Std. error Percent Std. error
1 16.3 (5.6) 20.5 (2.5)
2 50.8 (7.6) 57.3 (3.5)
3–4 32.6 (7.0) 21.9 (2.8)
5 or more 0.3 (0.2) 0.3 (0.2)
Total 100.0 100.0
2. Age of poultry houses
The majority of poultry houses on primary breeder and multiplier farms were 10 to 19
years old. The percentages of houses across age categories were similar on primary
breeder and multiplier farms.
a. Percentage of poultry houses on the farm, by age of house and by farm type:
Percent Houses
Farm Type
Primary breeder Multiplier All farms
Age of house (years) Pct. Std. error Pct. Std. error Pct.
Std. Error
Less than 5 14.7 (4.5) 13.7 (2.1) 13.8 (1.9)
5–9 19.9 (4.2) 21.9 (2.7) 21.7 (2.5)
10–19 58.3 (5.9) 55.7 (3.2) 55.9 (3.0)
20 or more 7.1 (3.0) 8.7 (1.2) 8.6 (1.2)
Total 100.0 100.0 100.0

USDA APHIS VS / 35
Section I: Population Estimates—C. House Characteristics
The percentages of poultry houses by age category did not differ substantially for broiler
breeder and table-egg breeder farms.
b. Percentage of poultry houses on the farm, by age of house and by farm type:
Percent Houses
Farm Type
Broiler breeder Table-egg breeder
Age of house (years) Percent Std. error Percent Std. error
Less than 5 13.8 (2.0) 16.6 (6.7)
5–9 21.8 (2.6) 18.0 (5.6)
10–19 56.1 (3.1) 47.4 (7.2)
20 or more 8.3 (1.2) 18.0 (5.9)
Total 100.0 100.0
The percentage of poultry houses by age category did not differ substantially by region.
c. Percentage of poultry houses on the farm, by age of house and by region:
Percent Houses
Region
Central East
Age of house (years) Percent Std. error Percent Std. error
Less than 5 21.0 (4.2) 11.5 (2.1)
5–9 13.4 (4.8) 24.4 (2.9)
10–19 62.2 (6.4) 53.8 (3.3)
20 or more 3.4 (1.1) 10.3 (1.5)
Total 100.0 100.0

36 / Poultry 2010
Section I: Population Estimates—C. House Characteristics
Photo courtesy Judy Rodriguez
3. Housing security
The majority of poultry houses had locks on the doors, anterooms that personnel traveled
through, and warning signs at the house door.
a. Percentage of poultry houses on the farm, by type of house security and by farm type:
Percent Houses
Farm Type
Primary breeder Multiplier All farms
Type of security Pct. Std. error Pct.
Std. error Pct.
Std. error
Locks on doors 96.7 (3.2) 87.6 (1.8) 88.3 (1.7)
Anteroom that separates outside area from inside area that personnel must travel through
98.0 (2.0) 73.0 (2.7) 75.1 (2.5)
Warning sign at house door
63.1 (5.9) 67.1 (2.6) 66.7 (2.4)

USDA APHIS VS / 37
Section I: Population Estimates—C. House Characteristics
A higher percentage of houses on table-egg breeder farms had anterooms and warning
signs at the house door compared with houses on broiler breeder farms.
b. Percentage of poultry houses on the farm, by type of house security and by farm type:
Percent Houses
Farm Type
Broiler breeder Table-egg breeder
Type of security Percent Std. error Percent Std. error
Locks on doors 88.5 (1.7) 82.2 (10.0)
Anteroom that separates outside area from inside area that personnel must travel through
74.7 (2.6) 93.3 (3.4)
Warning sign at house door 66.1 (2.5) 91.8 (3.9)

38 / Poultry 2010
Section I: Population Estimates—C. House Characteristics
4. Ground surface surrounding poultry houses
The majority of primary breeder farms (63.4 percent) had gravel or a hard surface
surrounding their poultry houses, and the majority of multiplier farms (78.9 percent) had
short grass immediately surrounding their houses. No breeder farms had tall grass or
brush immediately surrounding their houses.
a. Percentage of farms by ground surface immediately surrounding the poultry houses,
and by farm type:
Percent Farms
Farm Type
Primary breeder Multiplier All farms
Ground surface Pct. Std. error Pct.
Std. error Pct.
Std. error
Gravel or hard surface 63.4 (5.6) 14.6 (1.9) 19.3 (1.8)
Dirt 3.0 (2.1) 6.5 (1.7) 6.2 (1.5)
Short grass 33.6 (5.5) 78.9 (2.3) 74.5 (2.2)
Tall grass or brush 0.0 (—) 0.0 (—) 0.0 (—)
Total 100.0 100.0 100.0

USDA APHIS VS / 39
Section I: Population Estimates—C. House Characteristics

40 / Poultry 2010
Section I: Population Estimates—C. House Characteristics
The majority of table-egg breeder farms (84.3 percent) had gravel or a hard surface
surrounding their poultry houses, and the majority of broiler breeder farms (76.4 percent)
had short grass immediately surrounding their houses.
b. Percentage of farms by ground surface immediately surrounding the poultry houses,
and by farm type:
Percent Farms
Farm Type
Broiler breeder Table-egg breeder
Ground surface Percent Std. error Percent Std. error
Gravel or hard surface 17.3 (1.9) 84.3 (3.4)
Dirt 6.3 (1.6) 0.0 (—)
Short grass 76.4 (2.2) 15.7 (3.4)
Tall grass or brush 0.0 (—) 0.0 (—)
Total 100.0 100.0

USDA APHIS VS / 41
Section I: Population Estimates—C. House Characteristics
A higher percentage of farms had short grass immediately surrounding their poultry
houses in the Central region than in the East region (86.1 and 71.0 percent, respectively).
c. Percentage of farms by ground surface immediately surrounding the poultry houses,
and by region:
Percent Farms
Region
Central East
Ground surface Percent Std. error Percent Std. error
Gravel or hard surface 13.1 (2.1) 21.2 (2.4)
Dirt 0.8 (0.8) 7.8 (2.0)
Short grass 86.1 (2.1) 71.0 (2.8)
Tall grass or brush 0.0 (—) 0.0 (—)
Total 100.0 100.0
42 / Poultry 2010
Section I: Population Estimates—C. House Characteristics
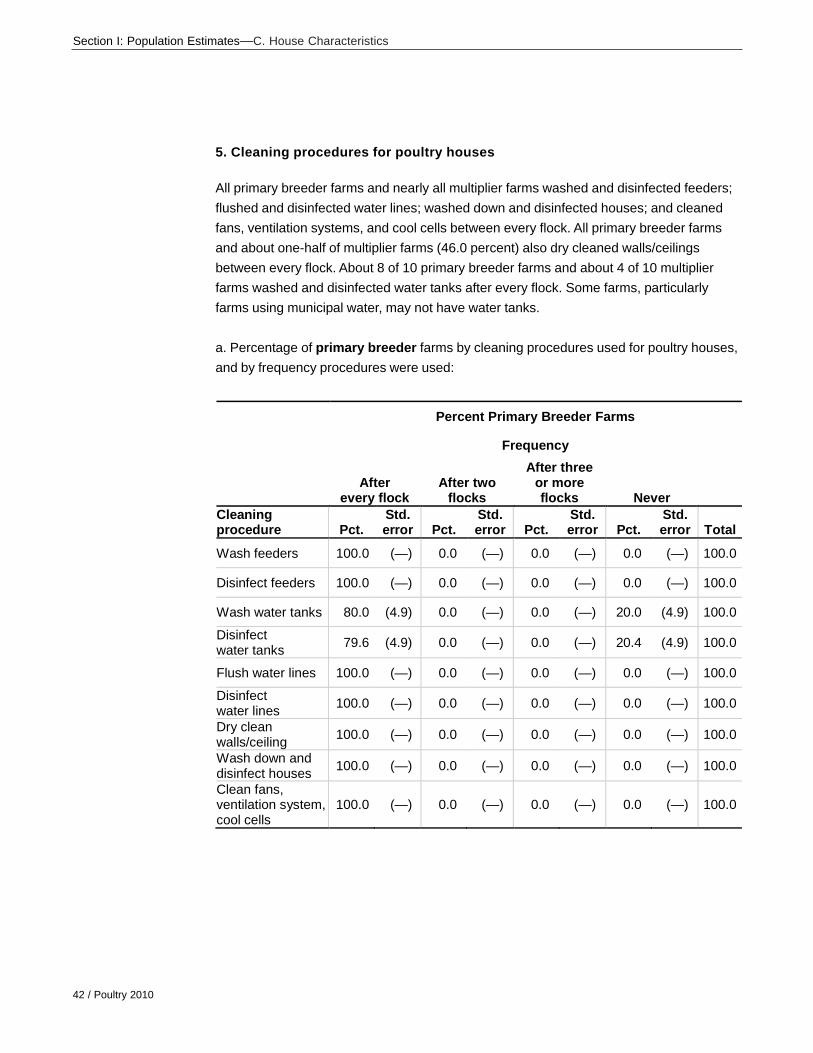
5. Cleaning procedures for poultry houses
All primary breeder farms and nearly all multiplier farms washed and disinfected feeders;
flushed and disinfected water lines; washed down and disinfected houses; and cleaned
fans, ventilation systems, and cool cells between every flock. All primary breeder farms
and about one-half of multiplier farms (46.0 percent) also dry cleaned walls/ceilings
between every flock. About 8 of 10 primary breeder farms and about 4 of 10 multiplier
farms washed and disinfected water tanks after every flock. Some farms, particularly
farms using municipal water, may not have water tanks.
a. Percentage of primary breeder farms by cleaning procedures used for poultry houses,
and by frequency procedures were used:
Percent Primary Breeder Farms
Frequency
After
every flock After two
flocks
After three or more flocks Never
Cleaning procedure Pct.
Std. error Pct.
Std. error Pct.
Std. error Pct.
Std. error Total
Wash feeders 100.0 (—) 0.0 (—) 0.0 (—) 0.0 (—) 100.0
Disinfect feeders 100.0 (—) 0.0 (—) 0.0 (—) 0.0 (—) 100.0
Wash water tanks 80.0 (4.9) 0.0 (—) 0.0 (—) 20.0 (4.9) 100.0
Disinfect water tanks
79.6 (4.9) 0.0 (—) 0.0 (—) 20.4 (4.9) 100.0
Flush water lines 100.0 (—) 0.0 (—) 0.0 (—) 0.0 (—) 100.0
Disinfect water lines
100.0 (—) 0.0 (—) 0.0 (—) 0.0 (—) 100.0
Dry clean walls/ceiling
100.0 (—) 0.0 (—) 0.0 (—) 0.0 (—) 100.0
Wash down and disinfect houses
100.0 (—) 0.0 (—) 0.0 (—) 0.0 (—) 100.0
Clean fans, ventilation system, cool cells
100.0 (—) 0.0 (—) 0.0 (—) 0.0 (—) 100.0

USDA APHIS VS / 43
Section I: Population Estimates—C. House Characteristics
b. Percentage of multiplier farms by cleaning procedures used for poultry houses, and by
frequency procedures were used:
Percent Multiplier Farms
Frequency
After every flock
After two flocks
After three or more flocks Never
Cleaning procedure Pct.
Std. error Pct.
Std. error Pct.
Std. error Pct.
Std. error Total
Wash feeders 94.4 (1.7) 0.2 (0.1) 0.0 (—) 5.4 (1.7) 100.0
Disinfect feeders 99.3 (0.3) 0.2 (0.1) 0.0 (—) 0.5 (0.3) 100.0
Wash water tanks 41.4 (3.5) 0.3 (0.1) 0.0 (—) 58.3 (3.5) 100.0
Disinfect water tanks
42.6 (3.5) 0.3 (0.1) 0.0 (—) 57.1 (3.5) 100.0
Flush water lines 99.8 (0.1) 0.2 (0.1) 0.0 (—) 0.0 (—) 100.0
Disinfect water lines
98.8 (0.4) 0.2 (0.1) 0.0 (—) 1.0 (0.4) 100.0
Dry clean walls/ceiling
46.0 (3.4) 0.2 (0.1) 0.0 (—) 53.8 (3.4) 100.0
Wash down and disinfect houses
99.8 (0.1) 0.2 (0.1) 0.0 (—) 0.0 (—) 100.0
Clean fans, ventilation system, cool cells
99.8 (0.1) 0.2 (0.1) 0.0 (—) 0.0 (—) 100.0

44 / Poultry 2010
Section I: Population Estimates—C. House Characteristics

USDA APHIS VS / 45
Section I: Population Estimates—C. House Characteristics
6. Down time between flocks
Usual down time for houses between flocks was at least 28 days for nearly all primary
breeder and multiplier farms (99.6 and 91.0 percent, respectively).
a. Percentage of farms by usual number of days houses were down between flocks, and
by farm type:
Percent Farms
Farm Type
Primary breeder Multiplier All farms
Usual down time (days) Pct.
Std. Error Pct.
Std. error Pct.
Std. Error
Less than 21 0.4 (0.4) 0.0 (—) 0.1 (0.0)
21–28 0.0 (—) 9.0 (1.8) 8.0 (1.6)
28–41 31.0 (2.1) 35.2 (3.4) 34.7 (3.1)
42–59 62.2 (3.8) 32.5 (3.0) 35.7 (2.7)
60 or more 6.4 (3.2) 23.3 (1.0) 21.5 (1.0)
Total 100.0 100.0 100.0

46 / Poultry 2010
Section I: Population Estimates—C. House Characteristics
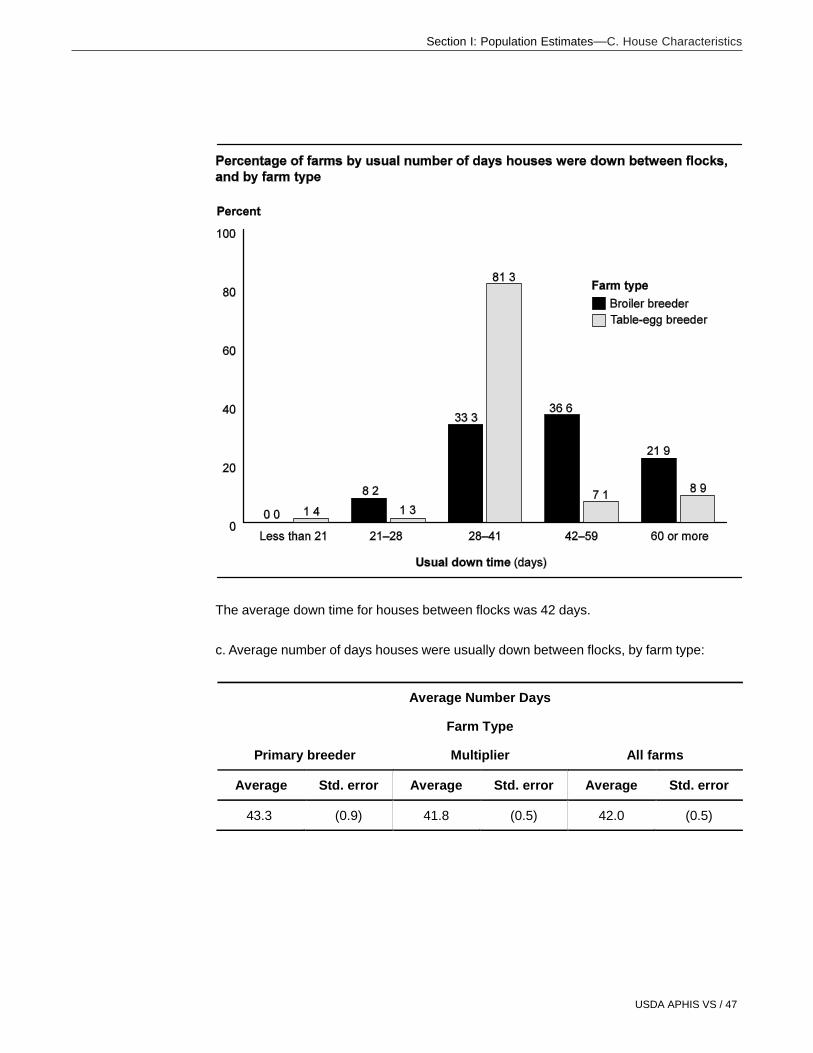
About 8 of 10 table-egg breeder farms (81.3 percent) had a usual down time of 28 to 41
days for houses between flocks. Over one-half of broiler breeder farms (58.5 percent) had
a usual down time of 42 days or longer.
b. Percentage of farms by usual number of days houses were down between flocks, and
by farm type:
Percent Farms
Farm Type
Broiler breeder Table-egg breeder
Usual down time (days) Percent Std. error Percent Std. error
Less than 21 0.0 (—) 1.4 (1.4)
21–28 8.2 (1.7) 1.3 (1.3)
28–41 33.3 (3.2) 81.3 (3.0)
42–59 36.6 (2.8) 7.1 (2.9)
60 or more 21.9 (1.0) 8.9 (3.5)
Total 100.0 100.0
USDA APHIS VS / 47
Section I: Population Estimates—C. House Characteristics
The average down time for houses between flocks was 42 days.
c. Average number of days houses were usually down between flocks, by farm type:
Average Number Days
Farm Type
Primary breeder Multiplier All farms
Average Std. error Average Std. error Average Std. error
43.3 (0.9) 41.8 (0.5) 42.0 (0.5)

48 / Poultry 2010
Section I: Population Estimates—C. House Characteristics
Broiler breeder farms had a higher average down time for houses between flocks than
table-egg breeder farms (42.3 and 32.5 days, respectively).
d. Average number of days houses were usually down between flocks, by farm type:
Average Number Days
Farm Type
Broiler breeder Table-egg breeder
Average Std. error Average Std. error
42.3 (0.5) 32.5 (1.0)
Photograph courtesy of Frank T. Jones

USDA APHIS VS / 49
Section I: Population Estimates—D. People
D. People 1. Personnel
On about 8 of 10 farms (82.3 percent) the producer or other employees lived on-site. The
producer or other employees worked at another commercial poultry facility on no primary
breeder farms and on less than 1 percent of multiplier farms.
a. Percentage of farms on which the producer/employees lived on-site or worked at
another commercial poultry facility, by farm type:
Percent Farms
Farm Type
Primary breeder Multiplier All farms
Pct. Std. Error Pct.
Std. error Pct.
Std. error
Producer or other employee lives on-site
73.7 (4.2) 83.2 (2.5) 82.3 (2.3)
Producer or other employee works at another commercial poultry production or processing facility
0.0 (—) 0.6 (0.3) 0.5 (0.3)
The percentage of farms in which the producer or other employees lived on-site or worked
at another commercial poultry facility was similar for broiler breeder and table-egg breeder
farms.
b. Percentage of farms on which the producer/employees lived on-site or worked at
another commercial poultry facility, by farm type:
Percent Farms
Farm Type
Broiler breeder Table-egg breeder
Percent Std. error Percent Std. error
Producer or other employee lives on-site
82.1 (2.4) 87.9 (3.9)
Producer or other employee works at another commercial poultry production or processing facility
0.5 (0.3) 0.0 (—)

50 / Poultry 2010
Section I: Population Estimates—D. People
English was the primary language spoken by the producer for nearly all farms (96.1
percent). Spanish was the primary language for employees on 17.9 percent of farms.
“Other” languages were mainly Asian.
c. Percentage of farms by primary language spoken by the producer and employees, and
by farm type:
Percent Farms
Farm Type
Primary breeder Multiplier All farms
Language Pct. Std.
Error Pct. Std.
Error Pct. Std. Error
Producer
English 93.8 (2.8) 96.4 (1.2) 96.1 (1.1)
Spanish 0.0 (—) 0.7 (0.7) 0.7 (0.7)
Other 6.2 (2.8) 2.9 (1.0) 3.2 (0.9)
Total 100.0 100.0 100.0
Employees
English 79.9 (4.9) 79.6 (2.6) 79.7 (2.4)
Spanish 13.2 (4.4) 18.6 (2.5) 17.9 (2.2)
Other 6.9 (2.9) 1.8 (1.0) 2.4 (0.9)
Total 100.0 100.0 100.0

USDA APHIS VS / 51
Section I: Population Estimates—D. People
A higher percentage of table-egg breeder farms had Spanish-speaking employees
compared with broiler breeder farms (59.7 and 16.6 percent of farms, respectively).
d. Percentage of farms by primary language spoken by the producer and employees, and
by farm type:
Percent Farms
Farm Type
Broiler breeder Table-egg breeder
Language Percent Std. error Percent Std. error
Producer
English 96.0 (1.2) 100.0 (—)
Spanish 0.7 (0.7) 0.0 (—)
Other 3.3 (1.0) 0.0 (—)
Total 100.0 100.0
Employees
English 80.9 (2.5) 40.3 (1.5)
Spanish 16.6 (2.3) 59.7 (1.5)
Other 2.5 (1.0) 0.0 (—)
Total 100.0 100.0

52 / Poultry 2010
Section I: Population Estimates—D. People
“Other” languages (mainly Asian) were more commonly spoken by producers and
employees on farms in the Central region than in the East region.
e. Percentage of breeder farms by primary language spoken by the producer and
employees, and by region:
Percent Breeder Farms
Region
Central East
Language Percent Std. error Percent Std. error
Producer
English 89.1 (3.5) 98.3 (1.0)
Spanish 0.0 (—) 0.9 (0.9)
Other 10.9 (3.5) 0.8 (0.4)
Total 100.0 100.0
Employees
English 77.4 (4.8) 80.3 (2.7)
Spanish 13.7 (3.4) 19.1 (2.7)
Other 8.9 (3.9) 0.6 (0.3)
Total 100.0 100.0
All primary breeder farms (100 percent) had written biosecurity protocols, and over 9 of 10
primary breeder farms (90.8 percent) conducted formal biosecurity training for employees.
f. Percentage of farms by type of biosecurity training used and by farm type:
Percent Farms
Farm Type
Primary breeder Multiplier All farms
Type of training Pct. Std. error Pct.
Std. error Pct.
Std. error
Written biosecurity protocols
100.0 (—) 93.0 (1.9) 93.7 (1.7)
Formal employee biosecurity training
90.8 (1.6) 39.8 (2.6) 45.0 (2.4)

USDA APHIS VS / 53
Section I: Population Estimates—D. People
A higher percentage of table-egg breeder farms than broiler breeder farms conducted
formal biosecurity training for employees (84.6 and 43.8 percent, respectively).
g. Percentage farms by type of biosecurity training used and by farm type:
Percent Farms
Farm Type
Broiler breeder Table-egg breeder
Type of training Percent Std. error Percent Std. error
Written biosecurity protocols 93.5 (1.8) 100.0 (—)
Formal employee biosecurity training
43.8 (2.4) 84.6 (1.8)

54 / Poultry 2010
Section I: Population Estimates—D. People
2. Visitors
Visitors who entered the poultry houses during the previous 12 months included company
service person (99.4 percent of farms), catch crew (91.1 percent), private or company
veterinarian (63.7 percent), and other business visitors (62.9 percent). No primary breeder
farms had extension agents, wholesaler/buyer/dealers, or renderers enter the poultry
houses, and less than 1 percent of primary breeder farms had a nutritionist, customers, or
nonbusiness visitors enter the poultry houses.
a. Percentage of farms by type of visitors that entered the poultry houses during the
previous 12 months, and by farm type:
Percent Farms
Farm Type
Primary breeder Multiplier All farms
Type of visitor Pct. Std. error Pct.
Std. Error Pct.
Std. error
Federal/State veterinarian or animal health worker
1.4 (1.1) 12.1 (2.1) 11.2 (1.9)
Extension agent or university veterinarian
0.0 (—) 9.0 (1.8) 8.2 (1.6)
Private or company veterinarian
92.3 (3.2) 61.1 (3.4) 63.7 (3.1)
Company service person
100.0 (—) 99.4 (0.4) 99.4 (0.3)
Nutritionist or feed company consultant
0.9 (0.6) 19.4 (2.6) 17.9 (2.4)
Catch crew 99.0 (1.0) 90.4 (1.9) 91.1 (1.7)
Vaccination crew 23.5 (3.5) 9.2 (1.8) 10.4 (1.7)
Customer (private individual)
0.4 (0.4) 6.6 (1.8) 6.1 (1.7)
Wholesaler, buyer, or dealer
0.0 (—) 0.0 (—) 0.0 (—)
Renderer 0.0 (—) 2.8 (1.2) 2.6 (1.1)
Feed delivery personnel 1.4 (1.1) 19.8 (2.8) 18.3 (2.5)
Other business visitors including other producers and service personnel
71.2 (3.8) 62.1 (3.1) 62.9 (2.8)
Other nonbusiness visitors including neighbors, friends, and school field trips
0.6 (0.6) 16.6 (2.2) 15.2 (2.0)

USDA APHIS VS / 55
Section I: Population Estimates—D. People
A higher percentage of table-egg breeder farms than broiler breeder farms had a
nutritionist or feed consultant enter the poultry houses during the previous 12 months
(65.8 and 16.4 percent, respectively). A higher percentage of broiler breeder farms than
table-egg breeder farms had other business visitors enter the poultry houses (64.6 and
8.7 percent, respectively).
b. Percentage of farms by type of visitors that entered the poultry houses during the
previous 12 months, and by farm type:
Percent Farms
Farm Type
Broiler breeder Table-egg breeder
Type of visitor Percent Std. error Percent Std. error
Federal/State veterinarian or animal health worker
11.0 (2.0) 16.2 (3.1)
Extension agent or university veterinarian
8.2 (1.7) 7.6 (0.1)
Private or company veterinarian 63.0 (3.2) 86.1 (2.4)
Company service person 99.4 (0.3) 100.0 (—)
Nutritionist or feed company consultant
16.4 (2.5) 65.8 (2.2)
Catch crew 91.3 (1.8) 86.3 (0.0)
Vaccination crew 10.0 (1.7) 22.5 (1.3)
Customer (private individual) 6.1 (1.7) 3.7 (1.8)
Wholesaler, buyer, or dealer
0.0 (—) 0.0 (—)
Renderer 2.7 (1.2) 0.0 (—)
Feed delivery personnel 18.4 (2.6) 14.5 (4.1)
Other business visitors including other producers and service personnel
64.6 (2.9) 8.7 (2.2)
Other nonbusiness visitors including neighbors, friends, and school field trips
15.6 (2.0) 0.0 (—)

56 / Poultry 2010
Section I: Population Estimates—D. People
Nearly all primary breeder farms (99.4 percent) and about 4 of 10 multiplier farms
(38.2 percent) always recorded visits to the poultry houses in a visitor log.
c. Percentage of farms by frequency that visits to the poultry houses were recorded in a
visitor log, and by farm type:
Percent Farms
Farm Type
Primary breeder Multiplier All farms
Frequency Pct. Std.
Error Pct. Std. error Pct.
Std. Error
Always 99.4 (0.6) 38.2 (2.3) 43.4 (2.1)
Sometimes 0.0 (—) 7.3 (1.6) 6.7 (1.5)
Never 0.6 (0.6) 54.5 (2.3) 49.9 (2.1)
Total 100.0 100.0 100.0

USDA APHIS VS / 57
Section I: Population Estimates—D. People
Nearly all table-egg breeder farms (97.5 percent) and about 4 of 10 broiler breeder farms
(41.7 percent) always recorded visits to the poultry houses in a visitor log.
d. Percentage of farms by frequency that visits to the poultry houses were recorded in a
visitor log, and by farm type:
Percent Farms
Farm Type
Broiler breeder Table-egg breeder
Frequency Percent Std. error Percent Std. error
Always 41.7 (2.1) 97.5 (1.3)
Sometimes 6.9 (1.5) 0.0 (—)
Never 51.4 (2.2) 2.5 (1.3)
Total 100.0 100.0

58 / Poultry 2010
Section I: Population Estimates—D. People
3. Biosecurity measures
Over 6 of 10 breeder farms always required that the producer and employees use
footwear protection before entering poultry houses, not be around other poultry for at least
24 hours, and not own poultry or birds (66.5, 60.5, and 95.0 percent of farms,
respectively).
a. Percentage of breeder farms by biosecurity measures required for the producer and
employees who entered the poultry houses, and by frequency measures were used:
Percent Breeder Farms
Frequency
Always Sometimes Never
Biosecurity measure Pct. Std. error Pct.
Std. error Pct.
Std. error Total
Shower 10.9 (0.7) 10.0 (1.8) 79.1 (1.8) 100.0
Different personnel for different houses
4.2 (1.2) 12.9 (2.0) 82.9 (2.2) 100.0
Wear disposable coveralls
19.9 (1.6) 9.3 (1.6) 70.8 (2.2) 100.0
Change of clothing (washable)
29.7 (1.8) 38.6 (2.5) 31.7 (2.7) 100.0
Any clothing requirement
44.6 (2.0) 29.6 (2.1) 25.8 (2.4) 100.0
Change shoes or use shoe covers
48.2 (2.1) 29.1 (1.9) 22.7 (2.1) 100.0
Foot bath (liquid) 40.7 (1.9) 11.7 (1.9) 47.6 (2.2) 100.0
Foot bath (dry) 21.1 (1.3) 20.7 (1.0) 58.2 (1.0) 100.0
Scrub footwear (bucket and brush)
19.6 (0.5) 5.1 (1.4) 75.3 (1.4) 100.0
Any footwear requirement
66.5 (2.3) 23.8 (1.8) 9.7 (1.8) 100.0
Not be around other poultry (at least 24 hours)
60.5 (2.9) 23.3 (2.7) 16.2 (2.3) 100.0
Cannot own poultry or birds
95.0 (1.4) 0.0 (—) 5.0 (1.4) 100.0
USDA APHIS VS / 59
Section I: Population Estimates—D. People
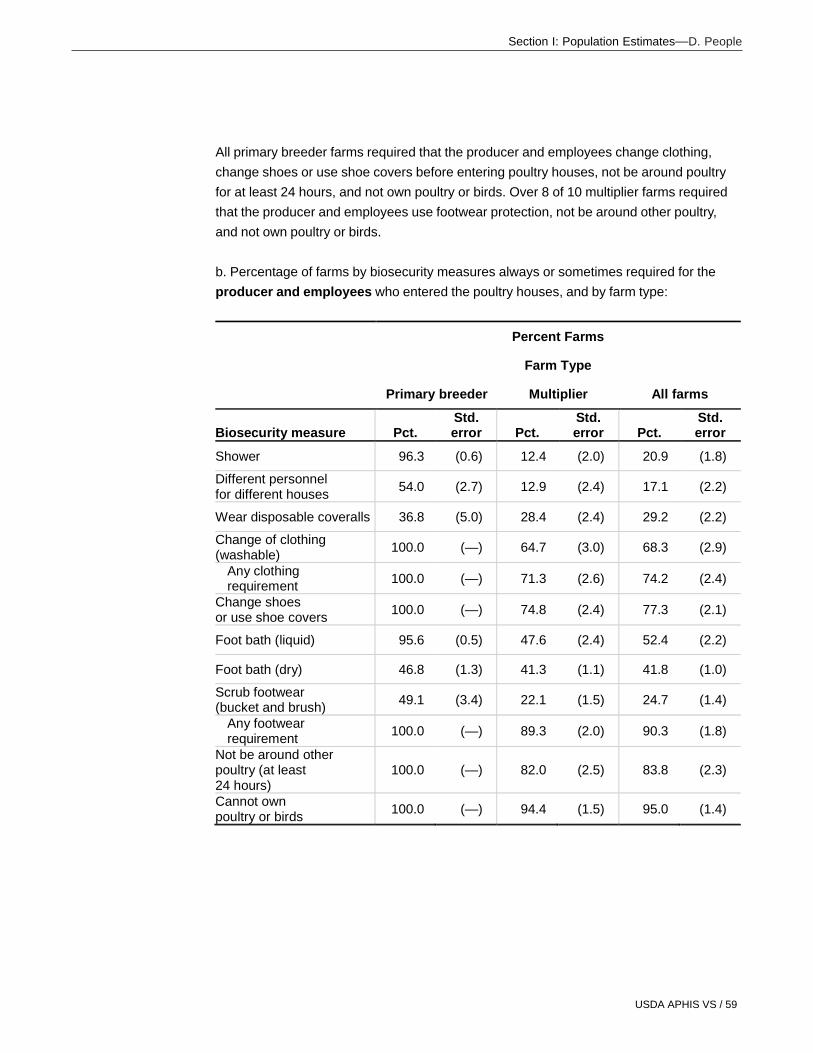
All primary breeder farms required that the producer and employees change clothing,
change shoes or use shoe covers before entering poultry houses, not be around poultry
for at least 24 hours, and not own poultry or birds. Over 8 of 10 multiplier farms required
that the producer and employees use footwear protection, not be around other poultry,
and not own poultry or birds.
b. Percentage of farms by biosecurity measures always or sometimes required for the
producer and employees who entered the poultry houses, and by farm type:
Percent Farms
Farm Type
Primary breeder Multiplier All farms
Biosecurity measure Pct. Std. error Pct.
Std. error Pct.
Std. error
Shower 96.3 (0.6) 12.4 (2.0) 20.9 (1.8)
Different personnel for different houses
54.0 (2.7) 12.9 (2.4) 17.1 (2.2)
Wear disposable coveralls 36.8 (5.0) 28.4 (2.4) 29.2 (2.2)
Change of clothing (washable)
100.0 (—) 64.7 (3.0) 68.3 (2.9)
Any clothing requirement
100.0 (—) 71.3 (2.6) 74.2 (2.4)
Change shoes or use shoe covers
100.0 (—) 74.8 (2.4) 77.3 (2.1)
Foot bath (liquid) 95.6 (0.5) 47.6 (2.4) 52.4 (2.2)
Foot bath (dry) 46.8 (1.3) 41.3 (1.1) 41.8 (1.0)
Scrub footwear (bucket and brush)
49.1 (3.4) 22.1 (1.5) 24.7 (1.4)
Any footwear requirement
100.0 (—) 89.3 (2.0) 90.3 (1.8)
Not be around other poultry (at least 24 hours)
100.0 (—) 82.0 (2.5) 83.8 (2.3)
Cannot own poultry or birds
100.0 (—) 94.4 (1.5) 95.0 (1.4)

60 / Poultry 2010
Section I: Population Estimates—D. People

USDA APHIS VS / 61
Section I: Population Estimates—D. People
Nearly all farms (93.3 percent) prohibited catch and vaccination crews from owning poultry
or birds. Biosecurity practices may differ for catch crews and vaccination crews since
catch crews visit at the end of the life of the flock and vaccination crews visit during the
flock production period. If practices differed, they would fall in the sometimes category.
c. Percentage of breeder farms by biosecurity measures required for catch and
vaccination crews* that entered the poultry houses, and by frequency measures were
used:
Percent Breeder Farms
Frequency
Always Sometimes Never
Biosecurity measure Pct. Std. error Pct.
Std. error Pct.
Std. error Total
Shower 8.4 (1.3) 1.9 (0.5) 89.7 (1.3) 100.0
Different personnel for different houses
0.6 (0.4) 4.7 (1.2) 94.7 (1.3) 100.0
Wear disposable coveralls
32.8 (3.2) 18.5 (1.8) 48.7 (3.1) 100.0
Change of clothing (washable)
59.4 (2.8) 13.0 (2.4) 27.6 (3.2) 100.0
Any clothing requirement
80.1 (3.1) 3.3 (1.4) 16.6 (3.0) 100.0
Change shoes or use shoe covers
58.3 (2.9) 4.6 (1.6) 37.1 (2.8) 100.0
Foot bath (liquid) 35.5 (3.3) 7.3 (2.0) 57.2 (3.0) 100.0
Foot bath (dry) 15.9 (1.2) 1.3 (0.5) 82.8 (1.2) 100.0
Scrub footwear (bucket and brush)
17.0 (2.2) 4.8 (1.4) 78.2 (2.2) 100.0
Any footwear requirement
66.1 (2.6) 3.0 (1.6) 30.9 (2.3) 100.0
Not be around other poultry (at least 24 hours)
29.4 (3.2) 57.3 (3.1) 13.3 (2.6) 100.0
Cannot own poultry or birds
93.3 (1.6) 2.4 (0.9) 4.3 (1.3) 100.0
*For those operations that had catch or vaccination crews.

62 / Poultry 2010
Section I: Population Estimates—D. People
All primary breeder farms required that catch and vaccination crews that were to enter
poultry houses must shower, change clothing, change shoes or use shoe covers, not be
around poultry for at least 24 hours, and not own poultry or birds. Over 8 of 10 multiplier
farms had clothing requirements for catch and vaccination crews and prohibited crews
from owning poultry or birds.
d. Percentage of farms by biosecurity measures always or sometimes required for catch
and vaccination crews* that entered the poultry houses, and by farm type:
Percent Farms
Farm Type
Primary breeder Multiplier All farms
Biosecurity measure Pct. Std. error Pct.
Std. error Pct.
Std. error
Shower 100.0 (—) 4.0 (1.3) 10.3 (1.3)
Different personnel for different houses
12.4 (6.0) 4.8 (1.3) 5.3 (1.3)
Wear disposable coveralls 48.8 (7.9) 51.4 (3.3) 51.3 (3.1)
Change of clothing (washable)
100.0 (—) 70.4 (3.4) 72.4 (3.1)
Any clothing requirement
100.0 (—) 82.2 (3.2) 83.4 (3.0)
Change shoes or use shoe covers
100.0 (—) 60.3 (3.0) 62.9 (2.8)
Foot bath (liquid) 92.0 (1.1) 39.2 (3.2) 42.8 (3.0)
Foot bath (dry) 33.1 (4.0) 16.0 (1.3) 17.2 (1.2)
Scrub footwear (bucket and brush)
66.0 (4.9) 18.6 (2.3) 21.8 (2.2)
Any footwear requirement
100.0 (—) 66.8 (2.5) 69.1 (2.3)
Not be around other poultry (at least 24 hours)
100.0 (—) 85.7 (2.8) 86.7 (2.6)
Cannot own poultry or birds
100.0 (—) 95.4 (1.4) 95.7 (1.3)
*For those operations that had catch or vaccination crews.

USDA APHIS VS / 63
Section I: Population Estimates—D. People

64 / Poultry 2010
Section I: Population Estimates—D. People
Nearly all breeder farms required clothing and footwear protection for visitors entering
poultry houses (95.7 and 99.6 percent of farms, respectively).
e. Percentage of breeder farms by biosecurity measures required for visitors who
entered the poultry houses, and by frequency measures were used:
Percent Breeder Farms
Frequency
Always Sometimes Never
Biosecurity measure Pct. Std. error Pct.
Std. error Pct.
Std. error Total
Shower 12.4 (0.8) 5.4 (1.6) 82.2 (1.8) 100.0
Wear disposable coveralls
83.0 (1.6) 7.4 (1.4) 9.6 (1.0) 100.0
Change of clothing (washable)
32.7 (2.6) 37.0 (2.6) 30.3 (2.6) 100.0
Any clothing requirement
95.7 (1.1) 1.8 (1.0) 2.5 (0.6) 100.0
Change shoes or use shoe covers
96.1 (1.0) 1.3 (0.9) 2.6 (0.6) 100.0
Foot bath (liquid) 42.6 (2.5) 13.0 (2.1) 44.4 (2.2) 100.0
Foot bath (dry) 39.9 (1.2) 1.1 (0.4) 59.0 (1.2) 100.0
Scrub footwear (bucket and brush)
17.9 (1.4) 3.8 (1.2) 78.3 (1.7) 100.0
Any footwear requirement
99.6 (0.3) 0.1 (0.1) 0.3 (0.2) 100.0
Not be around other poultry (at least 24 hours)
51.6 (2.5) 43.2 (2.4) 5.2 (1.3) 100.0
Cannot own poultry or birds
88.9 (1.5) 7.8 (1.0) 3.3 (1.1) 100.0

USDA APHIS VS / 65
Section I: Population Estimates—D. People
All primary breeder farms and nearly all multiplier farms always or sometimes required
visitors entering poultry houses to use a clothing precaution, change shoes or use shoe
covers, not be around poultry for at least 24 hours, and not own poultry or birds. All
primary breeder farms always or sometimes required visitors to shower before entering
poultry houses.
f. Percentage of farms by biosecurity measures always or sometimes required for visitors
who entered the poultry houses, and by farm type:
Percent Farms
Farm Type
Primary breeder Multiplier All farms
Biosecurity measure Pct. Std. error Pct.
Std. error Pct.
Std. error
Shower 100.0 (—) 8.0 (2.0) 17.8 (1.8)
Wear disposable coveralls 40.3 (5.0) 96.3 (1.0) 90.4 (1.0)
Change of clothing (washable)
100.0 (—) 66.0 (2.9) 69.7 (2.6)
Any clothing requirement
100.0 (—) 97.2 (0.6) 97.5 (0.6)
Change shoes or use shoe covers
100.0 (—) 97.1 (0.7) 97.4 (0.6)
Foot bath (liquid) 95.6 (0.5) 50.9 (2.5) 55.6 (2.2)
Foot bath (dry) 45.0 (0.3) 40.5 (1.3) 41.0 (1.2)
Scrub footwear (bucket and brush)
50.1 (3.2) 18.3 (1.9) 21.7 (1.7)
Any footwear requirement
100.0 (—) 99.7 (0.2) 99.7 (0.2)
Not be around other poultry (at least 24 hours)
100.0 (—) 94.2 (1.5) 94.8 (1.3)
Cannot own poultry or birds
100.0 (—) 96.3 (1.2) 96.7 (1.1)

66 / Poultry 2010
Section I: Population Estimates—D. People

USDA APHIS VS / 67
Section I: Population Estimates—D. People
About 4 of 10 primary breeder farms (38.3 percent) and 9 of 10 multiplier farms
(94.4 percent) used catch crews that also caught birds for other companies. None of the
primary breeder farms used vaccination crews that also caught birds for other companies.
g. Percentage of farms that used catch crews or vaccination crews that also caught birds
for other companies, by farm type:
Percent Farms
Farm Type
Primary breeder Multiplier All farms
Crew type Pct. Std.
Error Pct. Std. error Pct.
Std. Error
Catch 38.3 (4.8) 94.4 (1.8) 89.1 (1.7)
Vaccination 0.0 (—) 8.7 (2.0) 7.8 (1.8)
About 9 of 10 broiler breeder farms (89.9 percent) and 6 of 10 table-egg breeder farms
(61.3 percent) used catch crews that also caught birds for other companies.
h. Percentage of farms that used catch crews or vaccination crews that also caught birds
for other companies, by farm type:
Percent Farms
Farm Type
Broiler breeder Table-egg breeder
Crew type Percent Std. error Percent Std. error
Catch 89.9 (1.7) 61.3 (0.0)
Vaccination 8.1 (1.8) 0.0 (—)

68 / Poultry 2010
Section I: Population Estimates—E. Animals
E. Animals 1. Inventory and age grouping
About 25 percent of primary breeder farms and 6 percent of multiplier farms had no laying
hens on the day the study questionnaire was completed; however, these farms were
probably between flocks (in down time). Pullets and young roosters were rarely kept on
the breeding farms.
a. Percentage of farms by type of birds present* and by farm type:
Percent Farms
Farm Type
Primary breeder Multiplier All farms
Type of bird Pct. Std. error Pct. Std. error Pct. Std. error
Pullets 4.7 (1.4) 0.0 (—) 0.5 (0.1)
Laying hens 76.7 (4.5) 94.2 (1.6) 92.3 (1.5)
Young roosters 4.7 (1.4) 1.7 (0.6) 2.0 (0.6)
Breeding roosters 76.7 (4.5) 94.1 (1.7) 92.3 (1.6)
*Birds present on the day the questionnaire was completed.
The percentage of farms with no laying hens on the day the questionnaire was completed
was similar for broiler breeder farms and table-egg breeder farms.
b. Percentage of farms by type of birds present* and by farm type:
Percent Farms
Farm Type
Broiler breeder Table-egg breeder
Type of bird Percent Std. error Percent Std. error
Pullets 0.5 ().1) 0.0 (—)
Laying hens 92.2 (1.6) 97.4 (1.8)
Young roosters 2.1 (0.6) 0.0 (—)
Breeding roosters 92.1 (1.6) 97.4 (1.8)
*Birds present on the day the questionnaire was completed.

USDA APHIS VS / 69
Section I: Population Estimates—E. Animals
Multiplier farms tended to be larger than primary breeder farms; 36.9 percent of multiplier
farms had 20,000 or more laying hens compared with 5.5 percent of primary breeder
farms.
c. For farms with laying hens present,* percentage of farms by number of laying hens and
by farm type:
Percent Farms
Farm Type
Primary breeder Multiplier All farms
Number laying hens Pct.
Std. Error Pct.
Std. Error Pct.
Std. Error
1–9,999 27.6 (5.5) 14.6 (2.5) 15.7 (2.3)
10,000–19,999 66.9 (6.1) 48.5 (3.6) 50.1 (3.3)
20,000–29,999 3.0 (2.5) 18.8 (2.9) 17.4 (2.6)
30,000 or more 2.5 (2.5) 18.1 (2.6) 16.8 (2.4)
Total 100.0 100.0 100.0
*Birds present on the day the questionnaire was completed.
Table-egg breeder farms tended to be larger than broiler breeder farms. The majority of
table-egg breeder farms had 20,000 to 29,999 laying hens, whereas the majority of broiler
breeder farms had 10,000 to 19,999 laying hens.
d. For farms with laying hens present,* percentage of farms by number of laying hens and
by farm type:
Percent Farms
Farm Type
Broiler breeder Table-egg breeder
Number laying hens Percent Std. error Percent Std. error
1–9,999 15.7 (2.4) 14.7 (2.0)
10,000–19,999 51.5 (3.4) 7.2 (3.8)
20,000–29,999 15.8 (2.7) 69.5 (3.1)
30,000 or more 17.0 (2.5) 8.6 (3.7)
Total 100.0 100.0
*Birds present on the day the questionnaire was completed.

70 / Poultry 2010
Section I: Population Estimates—E. Animals
Primary breeder farms had an average of 14,246 laying hens while multiplier farms had an
average of 19,680 laying hens.
e. For farms with laying hens present*, average number of laying hens per farm, by farm
type:
Average Number Laying Hens
Farm Type
Primary breeder Multiplier All farms
Average Std. error Average Std. error Average Std. error
14,246 (948) 19,680 (620) 19,208 (573)
*Birds present on the day the questionnaire was completed.
Broiler breeder farms had an average of 19,084 laying hens while table-egg breeder farms
had an average of 23,021 laying hens.
f. For farms with laying hens present,* average number of laying hens per farm, by farm
type:
Average Number Laying Hens
Farm Type
Broiler breeder Table-egg breeder
Average Std. error Average Std. error
19,084 (591) 23,021 (865)
*Birds present on the day the questionnaire was completed.
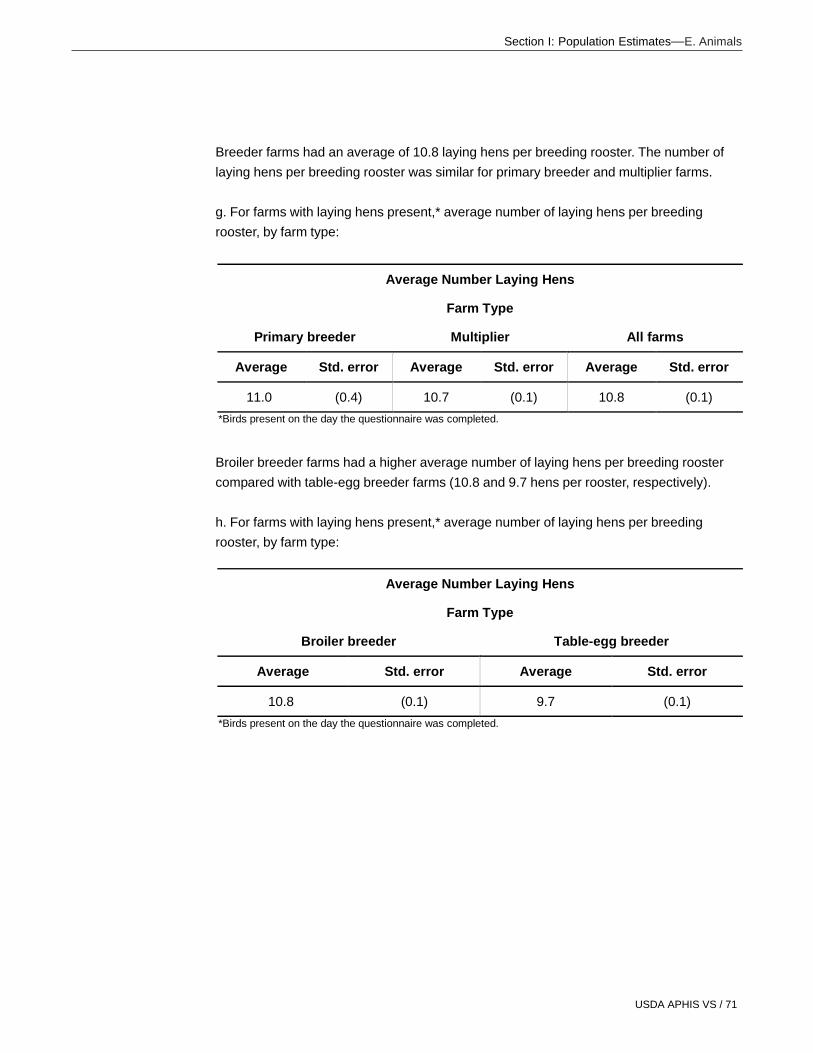
USDA APHIS VS / 71
Section I: Population Estimates—E. Animals
Breeder farms had an average of 10.8 laying hens per breeding rooster. The number of
laying hens per breeding rooster was similar for primary breeder and multiplier farms.
g. For farms with laying hens present,* average number of laying hens per breeding
rooster, by farm type:
Average Number Laying Hens
Farm Type
Primary breeder Multiplier All farms
Average Std. error Average Std. error Average Std. error
11.0 (0.4) 10.7 (0.1) 10.8 (0.1)
*Birds present on the day the questionnaire was completed.
Broiler breeder farms had a higher average number of laying hens per breeding rooster
compared with table-egg breeder farms (10.8 and 9.7 hens per rooster, respectively).
h. For farms with laying hens present,* average number of laying hens per breeding
rooster, by farm type:
Average Number Laying Hens
Farm Type
Broiler breeder Table-egg breeder
Average Std. error Average Std. error
10.8 (0.1) 9.7 (0.1)
*Birds present on the day the questionnaire was completed.

72 / Poultry 2010
Section I: Population Estimates—E. Animals
The whole farm had just one age of birds on almost all breeder farms (95.0 percent).
When different ages were present it tended to be in different houses.
i. Percentage of farms by best description of bird age grouping on the farm, and by farm
type:
Percent Farms
Farm Type
Primary breeder Multiplier All farms
Age grouping Pct. Std. error Pct.
Std. Error Pct.
Std. error
Multi-age, same house 1.6 (0.7) 0.7 (0.7) 0.8 (0.6)
Different ages, different houses
10.0 (3.8) 3.6 (1.4) 4.2 (1.3)
Whole farm one age 88.4 (3.8) 95.7 (1.6) 95.0 (1.5)
Total 100.0 100.0 100.0
For nearly all broiler breeder farms (95.5 percent) and three-fourths of table-egg breeder
farms (76.9 percent), the whole farm had one age of birds.
j. Percentage of farms by best description of bird age grouping on the farm, and by farm
type:
Percent Farms
Farm Type
Broiler breeder Table-egg breeder
Age grouping Percent Std. error Percent Std. error
Multi-age, same house 0.6 (0.6) 6.0 (2.6)
Different ages, different houses 3.9 (1.3) 17.1 (5.1)
Whole farm one age 95.5 (1.5) 76.9 (5.0)
Total 100.0 100.0

USDA APHIS VS / 73
Section I: Population Estimates—E. Animals
Over one-half of table-egg primary breeder farms (53.8 percent) contained a combination
of great-grandparent and grandparent stock, compared with only 3.1 percent of broiler
primary breeder farms.
k. Percentage of primary breeder farms, by type of bird and by farm type*:
Percent Primary Breeder Farms
Farm Type
Broiler primary breeder
Table-egg primary breeder
All primary breeder farms
Type of bird Pct. Std. error Pct.
Std. Error Pct.
Std. error
Pedigree (Elite/ Foundation) only
5.4 (1.4) 0.0 (—) 5.2 (1.3)
Elite and other breeders 0.0 (—) 7.7 (7.7) 0.4 (0.4)
Great-grandparent only 14.4 (2.1) 0.0 (—) 13.6 (2.0)
Great-grandparent and grandparent
3.1 (1.1) 53.8 (14.3) 5.5 (1.3)
Grandparent only 77.1 (2.5) 38.5 (14.0) 75.3 (2.5)
Other 0.0 (—) 0.0 0.0 (—)
Total 100.0 100.0 100.0
*Results in this table are from Phase I (see Section II: Methodology, p 130).

74 / Poultry 2010
Section I: Population Estimates—E. Animals
2. Last completed laying flock
Hens were placed and removed at a younger age on primary breeder farms than on
multiplier farms. Primary breeder farms experienced a higher mortality than multiplier
farms. Note: Although culls were not specifically addressed in the study questionnaire,
farms may have included culls in the mortality estimates.
a. Operation average characteristics of last completed laying flock, by farm type:
Operation Average
Farm Type
Primary breeder Multiplier All farms
Characteristics of last completed flock Avg.
Std. error Avg.
Std. error Avg.
Std. error
Age of hens when placed (weeks)
18.4 (0.4) 21.2 (0.0) 20.9 (0.1)
Percent hens that died 15.4 (0.7) 11.8 (0.6) 12.2 (0.5)
Percent hens that died at or before 60 weeks of age
15.1 (0.6) 10.3 (0.5) 10.8 (0.5)
Age hens removed (weeks) 59.8 (0.2) 64.6 (0.1) 64.1 (0.1)
Hens were placed at a younger age and removed at an older age on table-egg breeder
farms than on broiler breeder farms. Broiler breeder farms experienced a higher mortality
than table-egg breeder farms.
b. Operation average characteristics of last completed laying flock, by farm type:
Operation Average
Farm Type
Broiler breeder Table-egg breeder
Characteristics of last completed flock Average Std. error Average Std. error
Age of hens when placed (weeks) 21.0 (0.1) 16.8 (0.0)
Percent hens that died 12.4 (0.5) 7.3 (0.2)
Percent hens that died at or before 60 weeks of age
11.0 (0.5) 6.3 (0.2)
Age hens removed (weeks) 64.0 (0.1) 66.5 (0.6)

USDA APHIS VS / 75
Section I: Population Estimates—E. Animals
Molting of hens was rarely done on either primary breeder or multiplier farms.
c. Percentage of farms that molted the last completed laying flock, by farm type:
Percent Farms
Farm Type
Primary breeder Multiplier All farms
Percent Std. error Percent Std. error Percent Std. error
0.5 (0.5) 0.2 (0.1) 0.2 (0.1)
d. Percentage of farms that molted the last completed laying flock, by farm type:
Percent Farms
Farm Type
Broiler breeder Table-egg breeder
Percent Std. error Percent Std. error
0.1 (0.1) 5.3 (3.0)
3. Spent- and dead-hen disposal
Over 9 of 10 breeder farms (95.4 percent) disposed of spent hens via processing.
a. Percentage of farms by usual disposal method of spent hens and by farm type:
Percent Farms
Farm Type
Primary breeder Multiplier All farms
Disposal method Pct. Std. error Pct.
Std. Error Pct.
Std. error
Processing 94.6 (0.9) 95.5 (0.6) 95.4 (0.5)
Rendering 4.6 (0.5) 4.1 (0.5) 4.2 (0.4)
Live-bird market 0.0 (—) 0.2 (0.2) 0.2 (0.2)
Other method 0.8 (0.8) 0.2 (0.2) 0.2 (0.2)
Total 100.0 100.0 100.0

76 / Poultry 2010
Section I: Population Estimates—E. Animals
Nearly all broiler breeder farms (98.2 percent) disposed of spent hens via processing,
whereas rendering was the method of spent-hen disposal used for the highest percentage
of table-egg breeder farms (94.8 percent).
b. Percentage of farms by usual disposal method of spent hens, and by farm type:
Percent Farms
Farm Type
Broiler breeder Table-egg breeder
Disposal method Percent Std. error Percent Std. error
Processing 98.2 (0.5) 2.5 (1.3)
Rendering 1.4 (0.4) 94.8 (3.0)
Live-bird market 0.2 (0.2) 0.0 (—)
Other method 0.2 (0.2) 2.7 (2.8)
Total 100.0 100.0

USDA APHIS VS / 77
Section I: Population Estimates—E. Animals
Over 9 of 10 farms in the Central and East regions disposed of spent hens via processing.
c. Percentage of breeder farms by usual disposal method of spent hens, and by region:
Percent Breeder Farms
Region
Central East
Disposal method Percent Std. error Percent Std. error
Processing 93.7 (0.8) 95.9 (0.7)
Rendering 6.3 (0.8) 3.5 (0.6)
Live-bird market 0.0 (—) 0.3 (0.3)
Other method 0.0 (—) 0.3 (0.2)
Total 100.0 100.0
Nearly all primary breeder farms (97.0 percent) and about one-half of multiplier farms
(46.6 percent) disposed of their daily mortality via on-site incineration. About one-third of
multiplier farms (32.2 percent) disposed of their daily mortality by burial on-site.
d. Percentage of farms by usual carcass (daily mortality) disposal method, and by farm
type:
Percent Farms
Farm Type
Primary breeder Multiplier All farms
Disposal method Pct. Std.
Error Pct. Std.
Error Pct. Std. Error
Rendering 0.8 (0.5) 2.4 (1.2) 2.2 (1.1)
Composting on-site 0.0 (—) 18.1 (2.7) 16.3 (2.4)
Burial on-site 0.8 (0.8) 32.2 (1.7) 29.1 (1.6)
Incineration on-site 97.0 (1.3) 46.6 (3.1) 51.6 (2.8)
Other method 1.4 (0.8) 0.7 (0.3) 0.8 (0.2)
Total 100.0 100.0 100.0

78 / Poultry 2010
Section I: Population Estimates—E. Animals

USDA APHIS VS / 79
Section I: Population Estimates—E. Animals
Percent Farms
Farm Type
Broiler breeder Table-egg breeder
Disposal method Percent Std. error Percent Std. error
Rendering 2.1 (1.1) 8.0 (3.8)
Composting on-site 16.2 (2.5) 20.0 (4.4)
Burial on-site 29.7 (1.6) 8.3 (3.4)
Incineration on-site 51.5 (2.9) 52.5 (4.9)
Other method 0.5 (0.2) 11.2 (3.3)
Total 100.0 100.0
A higher percentage of broiler breeder farms than table-egg breeder farms buried
carcasses on-site (29.7 and 8.3 percent of farms, respectively).
e. Percentage of farms by usual carcass (daily mortality) disposal method, and by farm
type:

80 / Poultry 2010
Section I: Population Estimates—E. Animals
Carcass disposal methods did not differ substantially by region. Note the large standard
errors in the Central region.
f. Percentage of breeder farms by usual carcass (daily mortality) disposal method, and by
region:
Percent Breeder Farms
Region
Central East
Disposal method Percent Std. error Percent Std. error
Rendering 0.7 (0.4) 2.7 (1.4)
Composting on-site 30.8 (7.5) 12.2 (2.2)
Burial on-site 0.4 (0.4) 37.3 (2.1)
Incineration on-site 66.9 (7.5) 47.2 (3.0)
Other method 1.2 (0.4) 0.6 (0.3)
Total 100.0 100.0
4. Other animals on farm
Cattle were present on about 45.4 percent of breeder farms. No breeder farms had pet
birds.
a. Percentage of farms by type of animals on the farm and by farm type:
Percent Farms
Farm Type
Primary breeder Multiplier All farms
Type of Animal Pct. Std.
Error Pct. Std. Error Pct.
Std. Error
Cattle 40.7 (5.6) 45.9 (3.3) 45.4 (3.0)
Pigs 12.0 (4.2) 2.1 (0.6) 3.1 (0.7)
Other livestock 16.7 (4.0) 23.9 (3.1) 23.2 (2.8)
Pet birds 0.0 (—) 0.0 (—) 0.0 (—)
Other pets (dogs, cats, etc.) 39.6 (5.0) 70.0 (2.9) 66.9 (2.7)

USDA APHIS VS / 81
Section I: Population Estimates—E. Animals
A higher percentage of broiler breeder farms than table-egg breeder farms had cattle and
other livestock, whereas a higher percentage of table-egg breeder farms had pigs.
b. Percentage of farms by type of animals on the farm and by farm type:
Percent Farms
Farm Type
Broiler breeder Table-egg breeder
Type of Animal Percent Std. error Percent Std. error
Cattle 46.3 (3.1) 15.0 (4.0)
Pigs 2.8 (0.7) 13.7 (3.8)
Other livestock 23.8 (2.9) 1.3 (1.3)
Pet birds 0.0 (—) 0.0 (—)
Other pets (dogs, cats, etc.) 67.2 (2.7) 59.7 (5.3)
Cattle were found on a higher percentage of breeder farms in the Central region than in
the East region.
c. Percentage of breeder farms by type of animals on the farm and by region:
Percent Breeder Farms
Region
Central East
Type of Animal Percent Std. error Percent Std. error
Cattle 63.3 (6.4) 39.9 (3.4)
Pigs 6.8 (2.1) 2.0 (0.7)
Other livestock 26.0 (6.7) 22.3 (3.0)
Pet birds 0.0 (—) 0.0 (—)
Other pets (dogs, cats, etc.) 77.5 (4.6) 63.7 (3.2)
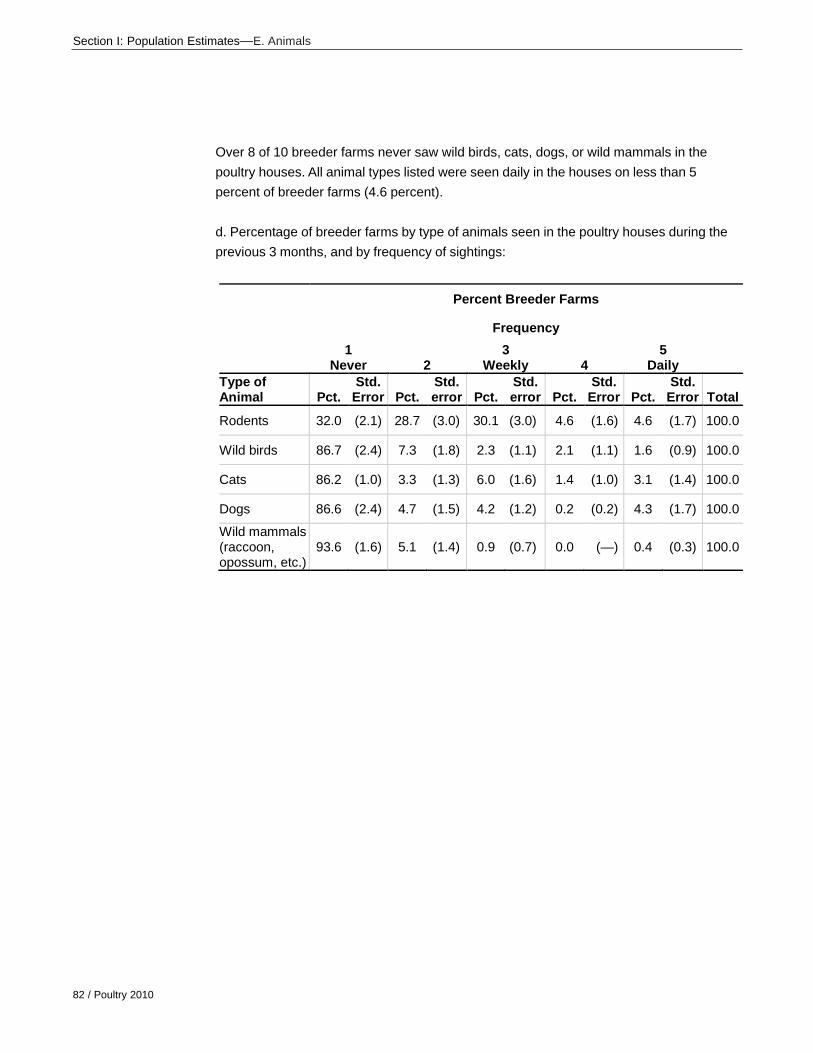
82 / Poultry 2010
Section I: Population Estimates—E. Animals
Over 8 of 10 breeder farms never saw wild birds, cats, dogs, or wild mammals in the
poultry houses. All animal types listed were seen daily in the houses on less than 5
percent of breeder farms (4.6 percent).
d. Percentage of breeder farms by type of animals seen in the poultry houses during the
previous 3 months, and by frequency of sightings:
Percent Breeder Farms
Frequency
1 Never 2
3 Weekly 4
5 Daily
Type of Animal Pct.
Std. Error Pct.
Std. error Pct.
Std. error Pct.
Std. Error Pct.
Std. Error Total
Rodents 32.0 (2.1) 28.7 (3.0) 30.1 (3.0) 4.6 (1.6) 4.6 (1.7) 100.0
Wild birds 86.7 (2.4) 7.3 (1.8) 2.3 (1.1) 2.1 (1.1) 1.6 (0.9) 100.0
Cats 86.2 (1.0) 3.3 (1.3) 6.0 (1.6) 1.4 (1.0) 3.1 (1.4) 100.0
Dogs 86.6 (2.4) 4.7 (1.5) 4.2 (1.2) 0.2 (0.2) 4.3 (1.7) 100.0
Wild mammals (raccoon, opossum, etc.)
93.6 (1.6) 5.1 (1.4) 0.9 (0.7) 0.0 (—) 0.4 (0.3) 100.0

USDA APHIS VS / 83
Section I: Population Estimates—E. Animals
Wild birds, cats, dogs, and wild mammals were seen at least weekly on less than 1
percent of primary breeder farms, and rodents were seen at least weekly on only 6.2
percent of primary breeder farms.
e. Percentage of farms by type of animals seen in the poultry houses at least weekly
(score 3, 4, or 5, see table previous page) during the previous 3 months, and by farm type:
Percent Farms
Farm Type
Primary breeder Multiplier All farms
Type of Animal Pct. Std. Error Pct.
Std. error Pct.
Std. error
Rodents 6.2 (2.3) 43.0 (3.4) 39.3 (3.0)
Wild birds 0.7 (0.5) 6.6 (2.0) 6.0 (1.8)
Cats 0.4 (0.4) 11.6 (1.7) 10.5 (1.6)
Dogs 0.4 (0.4) 9.7 (2.2) 8.7 (2.0)
Wild mammals (raccoons, opossum, etc.)
0.0 (—) 1.4 (0.8) 1.3 (0.7)
Rodents were seen at least weekly on 7 of 10 table-egg breeder farms (69.6 percent) and
4 of 10 broiler breeder farms (38.4 percent).
f. Percentage of farms by type of animals seen in the poultry houses at least at least
weekly (score 3, 4, or 5, see table previous page) during the previous 3 months, and by
farm type:
Percent Farms
Farm Type
Broiler breeder Table-egg breeder
Type of Animal Percent Std. Error Percent Std. Error
Rodents 38.4 (3.1) 69.6 (2.1)
Wild birds 6.1 (1.8) 3.7 (2.1)
Cats 10.8 (1.6) 1.3 (1.2)
Dogs 9.0 (2.1) 1.3 (1.2)
Wild mammals (raccoons, opossum, etc.)
1.3 (0.8) 1.3 (1.3)

84 / Poultry 2010
Section I: Population Estimates—E. Animals
5. Rodent and insect control
Nearly all breeder farms (99.2 percent) used chemical or bait rodent control. Traps or
sticky tape were used on about one-third of breeder farms (36.1 percent).
a. Percentage of farms by method of rodent control used during the previous 12 months,
and by farm type:
Percent Farms
Farm Type
Primary breeder Multiplier All farms
Rodent control Pct. Std. error Pct.
Std. error Pct.
Std. error
Chemicals or bait 100.0 (—) 99.1 (0.9) 99.2 (0.8)
Traps or sticky tape 45.4 (0.5) 35.1 (2.5) 36.1 (2.2)
Cats or dogs 0.0 (—) 14.7 (1.2) 13.2 (1.1)
Exterminator 0.0 (—) 0.6 (0.3) 0.6 (0.2)
About one of three broiler breeder farms (34.2 percent) and all table-egg breeder farms
used traps or sticky tape for rodent control.
b. Percentage of farms by method of rodent control used during the previous 12 months,
and by farm type:
Percent Farms
Farm Type
Broiler breeder Table-egg breeder
Rodent control Percent Std. error Percent Std. error
Chemicals or bait 99.2 (0.8) 100.0 (—)
Traps or sticky tape 34.2 (2.3) 100.0 (—)
Cats or dogs 13.6 (1.1) 0.0 (—)
Exterminator 0.3 (0.2) 9.0 (3.2)

USDA APHIS VS / 85
Section I: Population Estimates—E. Animals
Insecticide sprays were used by 9 of 10 breeder farms (90.5 percent).
c. Percentage of farms by method of insect control used during the previous 12 months,
and by farm type:
Percent Farms
Farm Type
Primary breeder Multiplier All farms
Insect control Pct. Std. error Pct.
Std. Error Pct.
Std. error
Insecticide sprays 95.4 (1.4) 89.9 (2.3) 90.5 (2.1)
Sticky tape 12.9 (2.1) 14.2 (2.4) 14.1 (2.1)
Parasites (e.g., insect parasitic nematodes)
0.7 (0.5) 17.0 (1.1) 15.3 (1.0)
Fly baits 90.6 (3.4) 75.3 (2.8) 76.8 (2.5)
Other control method 1.2 (0.7) 4.9 (1.7) 4.5 (1.5)
Sticky tape was used for insect control on 9 of 10 table-egg breeder farms (89.7 percent)
but was used infrequently on broiler breeder farms (11.8 percent).
d. Percentage of farms by method of insect control used during the previous 12 months,
and by farm type:
Percent Farms
Farm Type
Broiler breeder Table-egg breeder
Insect control Percent Std. error Percent Std. error
Insecticide sprays 90.2 (2.1) 98.7 (1.3)
Sticky tape 11.8 (2.2) 89.7 (3.0)
Parasites (e.g., insect parasitic nematodes)
15.6 (1.0) 6.8 (3.5)
Fly baits 76.2 (2.6) 97.2 (2.8)
Other control method 4.6 (1.5) 2.6 (1.7)

86 / Poultry 2010
Section I: Population Estimates—F. Bird Health and Vaccination
F. Bird Healthand Vaccination
1. Disease problems
Breeder farms reported very few disease problems for the last completed flock. The most
common disease problem on breeder farms was E. coli peritonitis; 22.7 percent of farms
reported at least a slight problem with E. coli peritonitis in the last completed flock. “Other”
problems were mostly mites and Staphylococcus infection.
a. Percentage of breeder farms by severity of disease problems in the last completed
flock:
Percent Breeder Farms
Severity
Severe Moderate Slight None
Disease Pct. Std. error Pct.
Std. error Pct.
Std. error Pct.
Std. error Total
Mycoplasma synoviae (MS) 0.7 (0.6) 0.5 (0.3) 0.8 (0.4) 98.0 (0.8) 100.0
Mycoplasma gallisepticum (MG)
0.0 (—) 0.0 (—) 0.0 (—) 100.0 (—) 100.0
Infectious laryngotracheitis (ILT)
0.0 (—) 0.0 (—) 1.8 (1.0) 98.2 (1.0) 100.0
Newcastle disease 0.0 (—) 0.0 (—) 0.0 (—) 100.0 (—) 100.0
Infectious bronchitis
0.0 (—) 0.0 (—) 0.9 (0.7) 99.1 (0.7) 100.0
Infectious coryza 0.0 (—) 0.0 (—) 0.0 (—) 100.0 (—) 100.0
Marek’s disease 0.0 (—) 0.0 (—) 0.1 (0.1) 99.9 (0.1) 100.0
Coccidiosis 0.0 (—) 0.0 (—) 0.1 (0.1) 99.9 (0.1) 100.0
Avian influenza (AI)
0.0 (—) 0.0 (—) 0.0 (—) 100.0 (—) 100.0
Cholera 0.6 (0.6) 1.8 (0.8) 2.9 (1.2) 94.7 (1.5) 100.0
E. coli peritonitis 0.7 (0.6) 8.3 (1.6) 13.7 (2.1) 77.3 (2.4) 100.0
Other disease problem
0.5 (0.3) 4.9 (0.8) 11.2 (1.2) 83.4 (1.2) 100.0

USDA APHIS VS / 87
Section I: Population Estimates—F. Bird Health and Vaccination
About two-thirds of primary breeder farms (67.7 percent) had at least a slight problem with
E. coli peritonitis in their last completed flock.
b. Percentage of farms that had slight, moderate, or severe problems with the following
diseases in the last completed flock, by farm type:
Percent Farms
Farm Type
Primary breeder Multiplier All farms
Disease Pct. Std. error Pct.
Std. error Pct.
Std. error
Mycoplasma synoviae (MS) 3.8 (2.6) 1.8 (0.8) 2.0 (0.8)
Mycoplasma gallisepticum (MG)
0.0 (—) 0.0 (—) 0.0 (—)
Infectious laryngotracheitis (ILT)
0.0 (—) 2.1 (1.1) 1.8 (1.0)
Newcastle disease 0.0 (—) 0.0 (—) 0.0 (—)
Infectious bronchitis 2.6 (1.9) 0.7 (0.7) 0.9 (0.7)
Infectious coryza 0.0 (—) 0.0 (—) 0.0 (—)
Marek’s disease 0.0 (—) 0.1 (0.1) 0.1 (0.1)
Coccidiosis 0.0 (—) 0.1 (0.1) 0.1 (0.1)
Avian influenza (AI) 0.0 (—) 0.0 (—) 0.0 (—)
Cholera 0.0 (—) 5.8 (1.7) 5.3 (1.5)
E. coli peritonitis 67.7 (4.5) 17.6 (2.6) 22.7 (2.4)
Other disease problem 0.5 (0.5) 18.4 (1.3) 16.6 (1.2)

88 / Poultry 2010
Section I: Population Estimates—F. Bird Health and Vaccination

USDA APHIS VS / 89
Section I: Population Estimates—F. Bird Health and Vaccination
Except for “other” disease problems, broiler breeder and table-egg breeder farms
experienced similar levels of disease problems in their last completed flocks.
c. Percentage of farms that had slight, moderate, or severe problems with the following
diseases in the last completed flock, by farm type:
Percent Farms
Farm Type
Broiler breeder Table-egg breeder
Disease Percent Std. error Percent Std. error
Mycoplasma synoviae (MS) 2.0 (0.8) 0.0 (—)
Mycoplasma gallisepticum (MG) 0.0 (—) 0.0 (—)
Infectious laryngotracheitis (ILT) 1.9 (1.0) 0.0 (—)
Newcastle disease 0.0 (—) 0.0 (—)
Infectious bronchitis 0.9 (0.7) 2.5 (1.7)
Infectious coryza 0.0 (—) 0.0 (—)
Marek’s disease 0.0 (—) 2.8 (2.8)
Coccidiosis 0.0 (—) 2.8 (2.8)
Avian influenza (AI) 0.0 (—) 0.0 (—)
Cholera 5.4 (1.6) 1.3 (1.3)
E. coli peritonitis 22.5 (2.5) 26.8 (3.4)
Other disease problem 17.1 (1.2) 0.0 (—)

90 / Poultry 2010
Section I: Population Estimates—F. Bird Health and Vaccination
Except for “other” disease problems, disease problems did not differ substantially by
region.
d. Percentage of breeder farms that had slight, moderate, or severe problems with the
following diseases in the last completed flock, by region:
Percent Breeder Farms
Region
Central East
Disease Percent Std. error Percent Std. error
Mycoplasma synoviae (MS) 1.6 (1.1) 2.1 (1.0)
Mycoplasma gallisepticum (MG) 0.0 (—) 0.0 (—)
Infectious laryngotracheitis (ILT) 0.0 (—) 2.4 (1.3)
Newcastle disease 0.0 (—) 0.0 (—)
Infectious bronchitis 1.1 (0.8) 0.8 (0.8)
Infectious coryza 0.0 (—) 0.0 (—)
Marek’s disease 0.3 (0.3) 0.0 (—)
Coccidiosis 0.3 (0.3) 0.0 (—)
Avian influenza (AI) 0.0 (—) 0.0 (—)
Cholera 2.8 (2.7) 6.0 (1.8)
E. coli peritonitis 14.1 (3.2) 25.3 (3.0)
Other disease problem 0.2 (0.2) 21.6 (1.5)

USDA APHIS VS / 91
Section I: Population Estimates—F. Bird Health and Vaccination
No breeder farms had any history of infectious coryza or avian influenza. A higher
percentage of farms (22.7 percent) reported a problem with E. coli perotinitis in the last
completed flock (see table b., p 87) than reported a problem in the last year
(13.2 percent) [table below]. The problem in the last completed flock may have happened
more than 1 year ago.
e. Percentage of breeder farms by time elapsed since most recent case of the following
diseases:
Percent Breeder Farms
Time (years)
Less than 1 1 to 3 More than 3 Never
Disease Pct. Std. error Pct.
Std. error Pct.
Std. error Pct.
Std. error Total
Mycoplasma synoviae (MS) 0.6 (0.6) 2.5 (0.6) 5.8 (1.3) 91.1 (1.5) 100.0
Mycoplasma gallisepticum (MG)
0.0 (—) 0.7 (0.6) 0.8 (0.7) 98.5 (0.9) 100.0
Infectious laryngotracheitis (ILT)
2.5 (1.2) 1.9 (1.0) 0.7 (0.6) 94.9 (1.4) 100.0
Newcastle disease 0.0 (—) 0.0 (—) 0.7 (0.7) 99.3 (0.7) 100.0
Infectious bronchitis
0.4 (0.3) 0.7 (0.7) 0.8 (0.7) 98.1 (1.0) 100.0
Infectious coryza 0.0 (—) 0.0 (—) 0.0 (—) 100.0 (—) 100.0
Marek’s disease 0.1 (0.1) 0.0 (—) 0.1 (0.1) 99.8 (0.2) 100.0
Coccidiosis 0.0 (—) 0.1 (0.1) 2.8 (0.2) 97.1 (0.2) 100.0
Avian influenza (AI)
0.0 (—) 0.0 (—) 0.0 (—) 100.0 (—) 100.0
Cholera 5.1 (1.7) 3.0 (1.1) 3.4 (1.4) 88.5 (2.2) 100.0
E. coli peritonitis 13.2 (2.1) 18.6 (2.5) 3.3 (1.1) 64.9 (2.9) 100.0
Other disease problem
13.0 (1.1) 5.8 (1.0) 0.2 (0.2) 81.0 (1.2) 100.0
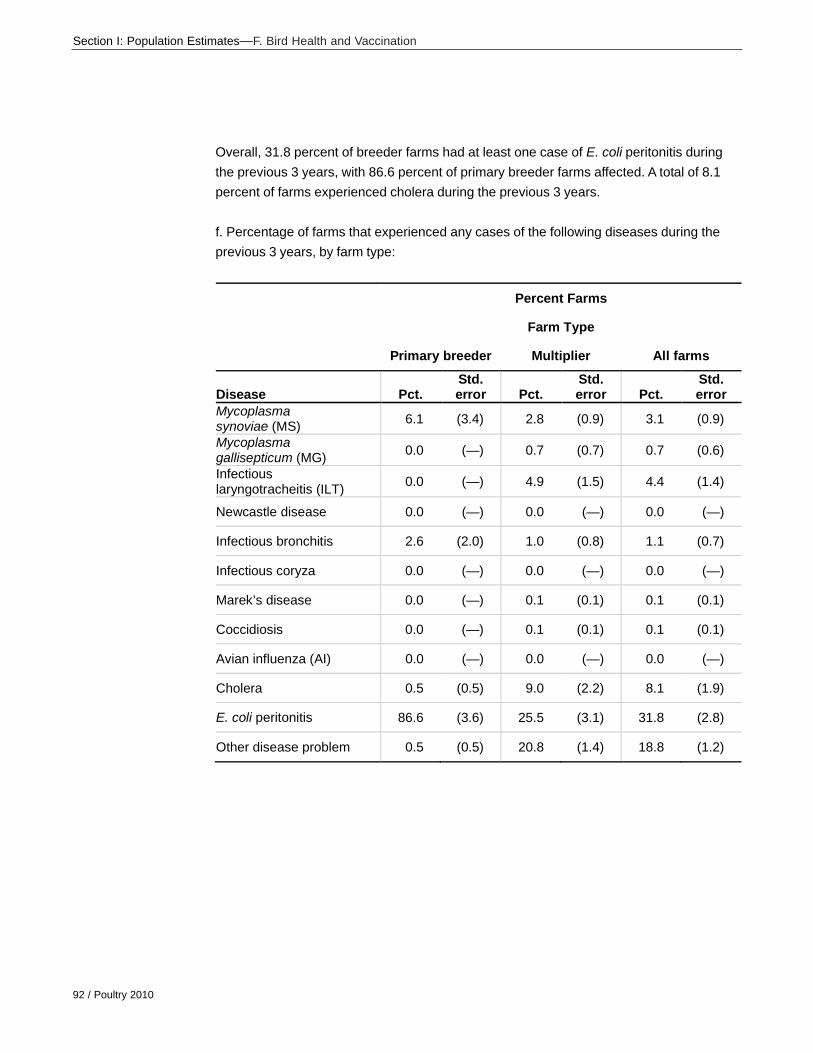
92 / Poultry 2010
Section I: Population Estimates—F. Bird Health and Vaccination
Overall, 31.8 percent of breeder farms had at least one case of E. coli peritonitis during
the previous 3 years, with 86.6 percent of primary breeder farms affected. A total of 8.1
percent of farms experienced cholera during the previous 3 years.
f. Percentage of farms that experienced any cases of the following diseases during the
previous 3 years, by farm type:
Percent Farms
Farm Type
Primary breeder Multiplier All farms
Disease Pct. Std. error Pct.
Std. error Pct.
Std. error
Mycoplasma synoviae (MS) 6.1 (3.4) 2.8 (0.9) 3.1 (0.9)
Mycoplasma gallisepticum (MG)
0.0 (—) 0.7 (0.7) 0.7 (0.6)
Infectious laryngotracheitis (ILT)
0.0 (—) 4.9 (1.5) 4.4 (1.4)
Newcastle disease 0.0 (—) 0.0 (—) 0.0 (—)
Infectious bronchitis 2.6 (2.0) 1.0 (0.8) 1.1 (0.7)
Infectious coryza 0.0 (—) 0.0 (—) 0.0 (—)
Marek’s disease 0.0 (—) 0.1 (0.1) 0.1 (0.1)
Coccidiosis 0.0 (—) 0.1 (0.1) 0.1 (0.1)
Avian influenza (AI) 0.0 (—) 0.0 (—) 0.0 (—)
Cholera 0.5 (0.5) 9.0 (2.2) 8.1 (1.9)
E. coli peritonitis 86.6 (3.6) 25.5 (3.1) 31.8 (2.8)
Other disease problem 0.5 (0.5) 20.8 (1.4) 18.8 (1.2)

USDA APHIS VS / 93
Section I: Population Estimates—F. Bird Health and Vaccination
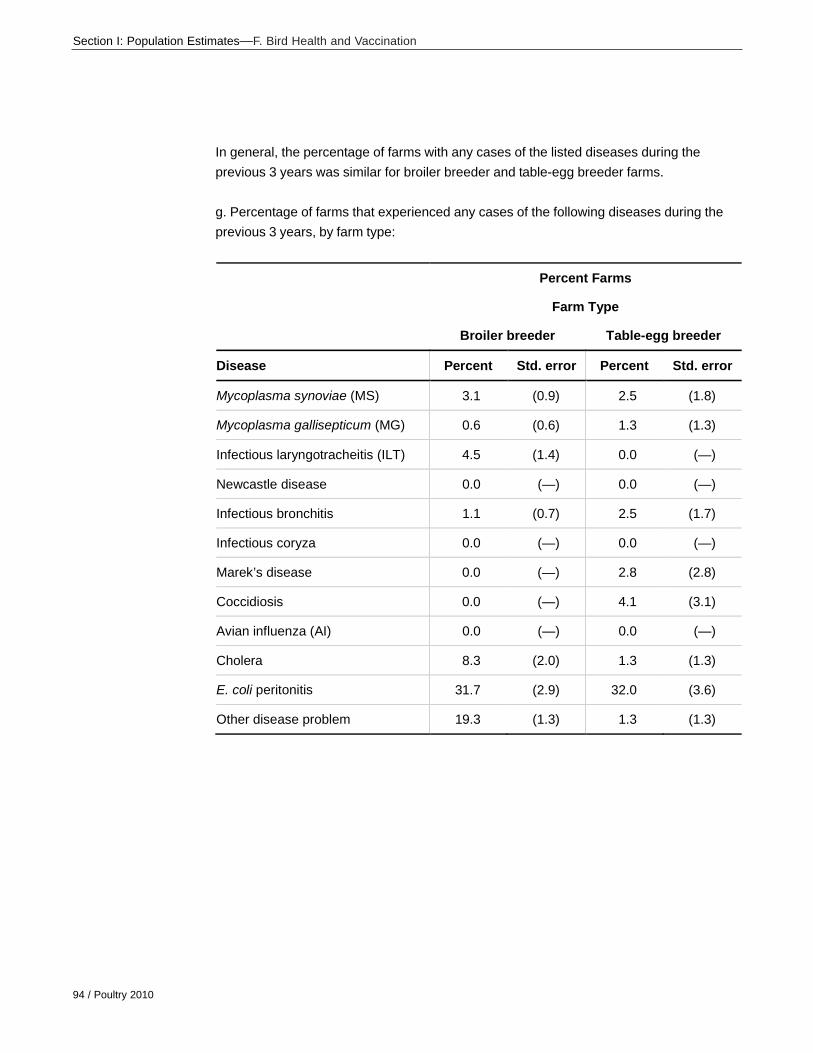
94 / Poultry 2010
Section I: Population Estimates—F. Bird Health and Vaccination
In general, the percentage of farms with any cases of the listed diseases during the
previous 3 years was similar for broiler breeder and table-egg breeder farms.
g. Percentage of farms that experienced any cases of the following diseases during the
previous 3 years, by farm type:
Percent Farms
Farm Type
Broiler breeder Table-egg breeder
Disease Percent Std. error Percent Std. error
Mycoplasma synoviae (MS) 3.1 (0.9) 2.5 (1.8)
Mycoplasma gallisepticum (MG) 0.6 (0.6) 1.3 (1.3)
Infectious laryngotracheitis (ILT) 4.5 (1.4) 0.0 (—)
Newcastle disease 0.0 (—) 0.0 (—)
Infectious bronchitis 1.1 (0.7) 2.5 (1.7)
Infectious coryza 0.0 (—) 0.0 (—)
Marek’s disease 0.0 (—) 2.8 (2.8)
Coccidiosis 0.0 (—) 4.1 (3.1)
Avian influenza (AI) 0.0 (—) 0.0 (—)
Cholera 8.3 (2.0) 1.3 (1.3)
E. coli peritonitis 31.7 (2.9) 32.0 (3.6)
Other disease problem 19.3 (1.3) 1.3 (1.3)

USDA APHIS VS / 95
Section I: Population Estimates—F. Bird Health and Vaccination
Presence of disease during the previous 3 years was generally similar for breeder farms
in the Central and East regions.
h. Percentage of breeder farms that experienced any cases of the following diseases
during the previous 3 years, by region:
Percent Breeder Farms
Region
Central East
Disease Percent Std. error Percent Std. error
Mycoplasma synoviae (MS) 2.7 (1.4) 3.2 (1.0)
Mycoplasma gallisepticum (MG) 0.0 (—) 0.9 (0.8)
Infectious laryngotracheitis (ILT) 0.0 (—) 5.7 (1.8)
Newcastle disease 0.0 (—) 0.0 (—)
Infectious bronchitis 2.1 (1.3) 0.9 (0.9)
Infectious coryza 0.0 (—) 0.0 (—)
Marek’s disease 0.4 (0.4) 0.0 (—)
Coccidiosis 0.4 (0.4) 0.0 (0.0)
Avian influenza (AI) 0.0 (—) 0.0 (—)
Cholera 12.7 (5.6) 6.7 (1.8)
E. coli peritonitis 27.9 (6.1) 32.9 (3.3)
Other disease problem 1.1 (0.9) 24.0 (1.6)

96 / Poultry 2010
Section I: Population Estimates—F. Bird Health and Vaccination
2. Flock testing
Nearly all primary breeder farms (94.4 percent) tested their last completed flock 11 or
more times for MS, MG, and AI. The majority of multiplier farms tested one to five times
for these diseases (59.3, 59.3, and 70.1 percent, respectively). Tests for pullorum were
performed less frequently. It is important to note that some respondents may have
included testing of pullets in the total number of tests, and others may have only counted
testing of laying hens. (See Appendix I, p 133, for NPIP testing requirements.)
a. Percentage of farms that tested the last completed flock for the following diseases, by
number of times flock was tested (number of testing occasions) and by farm type:
Percent Farms
Farm Type
Primary breeder Multiplier All farms
Number testing occasions Pct. Std. error Pct. Std. error Pct. Std. error
Pullorum-typhoid
0 0.0 (—) 59.9 (2.0) 53.9 (1.8)
1 to 5 45.4 (0.5) 39.8 (2.0) 40.3 (1.8)
6 to 10 5.7 (3.1) 0.3 (0.2) 0.9 (0.4)
11 or more 48.9 (3.2) 0.0 (—) 4.9 (0.3)
Mycoplasma synoviae (MS)
0 0.0 (—) 0.3 (0.2) 0.3 (0.2)
1 to 5 0.0 (—) 59.3 (1.8) 53.4 (1.7)
6 to 10 5.6 (3.1) 37.8 (1.8) 34.5 (1.7)
11 or more 94.4 (3.1) 2.6 (0.1) 11.8 (0.3)
Mycoplasma gallisepticum (MG)
0 0.0 (—) 0.3 (0.2) 0.3 (0.2)
1 to 5 0.0 (—) 59.3 (1.8) 53.4 (1.7)
6 to 10 5.6 (3.1) 37.8 (1.8) 34.5 (1.7)
11 or more 94.4 (3.1) 2.6 (0.1) 11.8 (0.3)
Avian influenza (AI)
0 0.0 (—) 0.2 (0.2) 0.2 (0.2)
1 to 5 0.0 (—) 70.1 (2.2) 63.0 (2.0)
6 to 10 5.6 (3.1) 27.1 (2.2) 25.0 (2.0)
11 or more 94.4 (3.1) 2.6 (0.1) 11.8 (0.3)

USDA APHIS VS / 97
Section I: Population Estimates—F. Bird Health and Vaccination
Nearly all table-egg breeder farms tested for MS, MG, and AI 11 or more times, while the
majority of broiler breeder farms tested for these diseases 1 to 5 times. Nearly all table-
egg breeder farms tested for pullorum 1 to 5 times. Broiler multipliers do not routinely test
for pullorum and rely on the broiler primary breeders to supply pullorum-free chicks. All
primary breeder farms test for pullorum (see previous table).
b. Percentage of farms that tested the last completed flock for the following diseases, by
number of times flock was tested (number of testing occasions) and by farm type:
Percent Farms
Farm Type
Broiler breeder Table-egg breeder
Number testing occasions Percent Std. error Percent Std. error
Pullorum-typhoid
0 55.4 (1.9) 2.5 (1.3)
1 to 5 38.6 (1.9) 97.5 (1.3)
6 to 10 0.9 (0.4) 0.0 (—)
11 or more 5.1 (0.3) 0.0 (—)
Total 100.0 100.0
Mycoplasma synoviae (MS)
0 0.2 (0.2) 2.5 (1.3)
1 to 5 55.0 (1.7) 1.2 (1.2)
6 to 10 35.6 (1.7) 0.0 (—)
11 or more 9.2 (0.3) 96.3 (0.0)
Total 100.0 100.0
Mycoplasma gallisepticum (MG)
0 0.2 (0.2) 2.5 (1.3)
1 to 5 55.0 (1.7) 1.2 (1.2)
6 to 10 35.6 (1.7) 0.0 (—)
11 or more 9.2 (0.3) 96.3 (0.0)
Total 100.0 100.0
Avian influenza (AI)
0 0.2 (0.2) 0.0 (—)
1 to 5 64.9 (2.0) 2.5 (1.3)
6 to 10 25.7 (2.0) 1.2 (1.2)
11 or more 9.2 (0.3) 96.3 (0.0)
Total 100.0 100.0

98 / Poultry 2010
Section I: Population Estimates—F. Bird Health and Vaccination
None of the farms that tested their last completed flocks for pullorum or AI had a positive
test result, and less than 1 percent of farms had a positive test result for MS or MG.
c. For farms that tested the last completed flock for disease, percentage of farms that had
at least one positive test for the following diseases:
Disease Percent Farms Std. error
Pullorum-typhoid 0.0 (—)
Mycoplasma synoviae (MS) 0.9 (0.7)
Mycoplasma gallisepticum (MG) 0.0* (0.0)
Avian influenza (AI) 0.0 (—)
*Rounds to 0.0 (<0.1).
Of all MS testing occasions that occurred on breeder farms, only 0.1 percent revealed at
least one bird positive for MS.
d. Percentage of testing occasions in which at least one bird tested positive, by disease
tested for:
Disease Percent testing
occasions Std. error
Pullorum-typhoid 0.0 (—)
Mycoplasma synoviae (MS) 0.1 (0.1)
Mycoplasma gallisepticum (MG) 0.0* (0.0)
Avian influenza (AI) 0.0 (—)
*Rounds to 0.0 (<0.1).

USDA APHIS VS / 99
Section I: Population Estimates—F. Bird Health and Vaccination
All breeder farms participated in the NPIP AI program. All primary breeder farms and more
than 85 percent of multiplier farms participated in the NPIP programs for pullorum, MS,
and MG.
e. Percentage of farms that participated in an NPIP program for the following diseases, by
farm type:
Percent Farms
Farm Type
Primary breeder Multiplier All farms
Disease Pct. Std. error Pct.
Std. error Pct.
Std. error
Pullorum-typhoid 100.0 (—) 95.6 (1.6) 96.1 (1.4)
Mycoplasma synoviae (MS)
100.0 (—) 85.7 (0.0) 87.1 (0.0)
Mycoplasma gallisepticum (MG) 100.0 (—) 85.6 (0.0) 87.1 (0.0)
Avian influenza (AI) 100.0 (—) 100.0 (—) 100.0 (—)
All table-egg breeder farms participated in the NPIP programs for pullorum, MS, and AI,
and 97.5 percent participated in the NPIP-MG program.
f. Percentage of farms that participated in an NPIP program for the following diseases, by
farm type:
Percent Farms
Farm Type
Broiler breeder Table-egg breeder
Disease Percent Std. error Percent Std. error
Pullorum-typhoid 95.9 (1.4) 100.0 (—)
Mycoplasma synoviae (MS) 86.7 (0.0) 100.0 (—)
Mycoplasma gallisepticum (MG) 86.7 (0.0) 97.5 (1.3)
Avian influenza (AI) 100.0 (—) 100.0 (—)

100 / Poultry 2010
Section I: Population Estimates—F. Bird Health and Vaccination
3. Vaccines given before and while laying
Primary breeder farms did not vaccinate breeding hens in lay. About one-third of multiplier
farms vaccinated hens against Newcastle disease or infectious bronchitis while in lay.
Over 80 percent of primary breeder farms and multiplier farms vaccinated pullets against
ILT, Newcastle disease, infectious bronchitis, Salmonella, IBD, avian encephalomyelitis,
chicken anemia virus, reovirus, fowl pox, and coccidiosis. All primary breeder farms
vaccinated pullets for E. coli, and nearly all multiplier farms (98.0 percent) vaccinated
pullets for cholera.
a. Percentage of farms that vaccinated breeding hens before they entered the laying
house (as pullets) and while in lay, by disease vaccinated for and by farm type:
Percent Farms
Pullets Hens In lay
Farm type Farm type
Primary breeder Multiplier
Primary breeder Multiplier
Disease Pct. Std. error Pct.
Std. error Pct.
Std. error Pct.
Std. error
Infectious laryngotracheitis (ILT)
95.6 (0.5) 99.5 (0.3) 0.0 (—) 0.0 (—)
Mycoplasma synoviae (MS)
0.0 (—) 1.8 (0.5) 0.0 (—) 0.0 (—)
Mycoplasma gallisepticum (MG)
0.0 (—) 1.8 (0.5) 0.0 (—) 0.0 (—)
Cholera 40.2 (0.4) 98.0 (0.2) 0.0 (—) 0.0 (—)
Newcastle disease 100.0 (—) 95.5 (1.3) 0.0 (—) 31.5 (2.2)
Infectious bronchitis 100.0 (—) 96.3 (1.2) 0.0 (—) 31.5 (2.2)
Salmonella 86.7 (2.0) 85.1 (0.6) 0.0 (—) 0.0 (—)
Infectious bursal disease (IBD)
100.0 (—) 97.7 (0.6) 0.0 (—) 0.0 (—)
Avian encephalomyelitis
94.4 (3.1) 97.5 (0.6) 0.0 (—) 0.0 (—)
E. coli 100.0 (—) 15.5 (0.6) 0.0 (—) 0.0* (0.0)
Chicken anemia virus 100.0 (—) 95.4 (0.6) 0.0 (—) 0.0 (—)
Reovirus 99.2 (0.8) 95.1 (0.6) 0.0 (—) 0.0 (—)
Fowl pox 100.0 (—) 97.7 (0.6) 0.0 (—) 0.0 (—)
Coccidiosis 94.8 (0.9) 92.9 (1.5) 0.0 (—) 0.0 (—)
Other vaccines 40.2 (0.4) 39.1 (1.7) 0.0 (—) 0.0 (—)
*Rounds to 0.0 (<0.1).

USDA APHIS VS / 101
Section I: Population Estimates—F. Bird Health and Vaccination
Table-egg breeder farms did not vaccinate birds in lay, except for 1.3 percent of farms that
vaccinated for E. coli. About 3 of 10 broiler breeder farms vaccinated birds in lay against
Newcastle disease or infectious bronchitis. More than 9 of 10 broiler breeder farms
vaccinated pullets for cholera, chicken anemia virus, and reovirus compared with less
than one-third of table-egg breeder farms.
b. Percentage of farms that vaccinated breeding hens before they entered the laying
house (as pullets) and while in lay, by disease vaccinated for and by farm type:
Percent Farms
Pullets Hens in lay
Farm type Farm type
Broiler breeder
Table-egg breeder
Broiler breeder
Table-egg breeder
Disease Pct. Std. error Pct.
Std. error Pct.
Std. error Pct.
Std. error
Infectious laryngotracheitis (ILT)
99.5 (0.3) 84.6 (1.8) 0.0 (—) 0.0 (—)
Mycoplasma synoviae (MS)
1.7 (0.5) 0.0 (—) 0.0 (—) 0.0 (—)
Mycoplasma gallisepticum (MG)
1.7 (0.5) 1.3 (1.3) 0.0 (—) 0.0 (—)
Cholera 94.3 (0.0) 19.2 (4.2) 0.0 (—) 0.0 (—)
Newcastle disease 95.9 (1.2) 100.0 (—) 29.5 (2.1) 0.0 (—)
Infectious bronchitis 96.5 (1.1) 100.0 (—) 29.5 (2.1) 0.0 (—)
Salmonella 84.9 (0.6) 96.2 (0.0) 0.0 (—) 0.0 (—)
Infectious bursal disease (IBD)
97.9 (0.5) 100.0 (—) 0.0 (—) 0.0 (—)
Avian encephalomyelitis
97.1 (0.6) 100.0 (—) 0.0 (—) 0.0 (—)
E. coli 23.8 (0.6) 30.8 (2.0) 0.0 (—) 1.3 (1.3)
Chicken anemia virus 97.7 (0.5) 32.1 (0.4) 0.0 (—) 0.0 (—)
Reovirus 97.7 (0.5) 21.8 (0.3) 0.0 (—) 0.0 (—)
Fowl pox 97.9 (0.5) 100.0 (—) 0.0 (—) 0.0 (—)
Coccidiosis 93.8 (1.4) 67.9 (0.4) 0.0 (—) 0.0 (—)
Other vaccines 40.4 (1.5) 0.0 (—) 0.0 (—) 0.0 (—)

102 / Poultry 2010
Section I: Population Estimates—F. Bird Health and Vaccination

USDA APHIS VS / 103
Section I: Population Estimates—F. Bird Health and Vaccination
The most common type of vaccine used for infectious laryngotracheitis was tissue culture
(90.4 percent of farms).
c. For farms that vaccinated pullets for infectious laryngotracheitis (ILT), percentage of
farms by type of ILT vaccination:
Vaccination type Percent farms Std. error
Chick embryo 8.4 (2.5)
Tissue culture 90.4 (2.6)
Vector 16.4 (1.6)
Killed and live infectious bursal disease vaccines were used more commonly than
recombinant vaccines. The most common delivery system was individual injection (98.5
percent of farms) followed by water (85.0 percent of farms).
d. For farms that vaccinated pullets for infectious bursal disease (IBD), percentage of
farms by IBD vaccine type and by delivery system:
Percent farms Std. error
Vaccine type
Killed (inactivated) 94.5 (1.3)
Live/modified live 94.5 (1.2)
Recombinant 9.9 (1.8)
Delivery system
Spray 52.0 (1.7)
Water 85.0 (1.5)
Individual injection 98.5 (0.5)
In ovo 25.2 (2.1)
Other delivery system 1.4 (0.9)

104 / Poultry 2010
Section I: Population Estimates—F. Bird Health and Vaccination
Nearly all breeder farms kept daily records for mortality, feed consumption, and egg
production (99.9, 98.5, and 99.9 percent of farms, respectively). Over 9 of 10 primary
breeder farms (94.1 percent) kept morbidity records.
a. Percentage of farms by records kept and by farm type:
Percent Farms
Farm Type
Primary breeder Multiplier All farms
Records kept Pct. Std. Error Pct.
Std. Error Pct.
Std. Error
Morbidity (iIlness)
Yes 94.1 (2.1) 28.6 (3.2) 35.4 (2.9)
No 5.9 (2.1) 71.4 (3.2) 64.6 (2.9)
Total 100.0 100.0 100.0
Mortality
Yes, daily 100.0 (—) 99.9 (0.1) 99.9 (0.1)
Yes, not daily 0.0 (—) 0.1 (0.1) 0.1 (0.1)
No 0.0 (—) 0.0 (—) 0.0 (—)
Total 100.0 100.0 100.0
Feed consumption
Yes, daily 95.0 (2.8) 98.8 (0.9) 98.5 (0.8)
Yes, not daily 5.0 (2.8) 1.1 (0.9) 1.4 (0.8)
No 0.0 (—) 0.1 (0.1) 0.1 (0.1)
Total 100.0 100.0 100.0
Egg production
Yes, daily 100.0 (—) 99.9 (0.1) 99.9 (0.1)
Yes, not daily 0.0 (—) 0.1 (0.1) 0.1 (0.1)
No 0.0 (—) 0.0 (—) 0.0 (—)
Total 100.0 100.0 100.0

USDA APHIS VS / 105
Section I: Population Estimates—F. Bird Health and Vaccination
Morbidity records were kept by about one-third of broiler breeder farms (35.8 percent) and
one-fourth of table-egg breeder farms (23.1 percent).
b. Percentage of farms by records kept and by farm type:
Percent Farms
Farm Type
Broiler breeder Table-egg breeder
Records kept Percent Std. error Percent Std. error
Morbidity (illness)
Yes 35.8 (3.0) 23.1 (2.0)
No 64.2 (3.0) 76.9 (2.0)
Total 100.0 100.0
Mortality
Yes, daily 100.0 (—) 97.2 (2.8)
Yes, not daily 0.0 (—) 2.8 (2.8)
No 0.0 (—) 0.0 (—)
Total 100.0 100.0
Feed consumption
Yes, daily 98.8 (0.9) 87.6 (3.1)
Yes, not daily 1.2 (0.9) 9.6 (3.6)
No 0.0 (—) 2.8 (2.8)
Total 100.0 100.0
Egg production
Yes, daily 100.0 (—) 97.2 (2.8)
Yes, not daily 0.0 (—) 2.8 (2.8)
No 0.0 (—) 0.0 (—)
Total 100.0 100.0

106 / Poultry 2010
Section I: Population Estimates—G. Bird Movement/Transport
1. Replacement pullets
The majority of breeder farms raised replacement pullets at a different farm site belonging
to the same company; 14.1 percent of primary breeder farms raised replacement pullets
on the same farm.
a. Percentage of farms by location that replacement pullets were raised for the farm, and
by farm type:
Percent Farms
Farm Type
Primary breeder Multiplier All farms
Location raised Pct. Std. error Pct.
Std. error Pct.
Std. error
On this farm 14.1 (2.1) 1.1 (0.9) 2.4 (0.9)
On a different farm site, same company (including contract)
86.7 (2.0) 99.8 (0.2) 98.5 (0.3)
On a farm from another company
0.0 (—) 0.2 (0.2) 0.2 (0.2)
The majority of broiler breeder and table-egg breeder farms raised replacement pullets on
a different farm site, same company (98.5 and 100.0 percent of farms, respectively).
b. Percentage of farms by location that replacement pullets were raised for the farm, and
by farm type:
Percent Farms
Farm Type
Broiler breeder Table-egg breeder
Location raised Percent Std. error Percent Std. error
On this farm 2.4 (0.9) 2.8 (2.8)
On a different farm site, same company (including contract)
98.5 (0.3) 100.0 (—)
On a farm from another company 0.2 (0.2) 0.0 (—)
G. BirdMovement/Transport

USDA APHIS VS / 107
Section I: Population Estimates—G. Bird Movement/Transport
2. Farms that supplied pullets
The majority of breeder farms (85.9 percent) had one source farm that supplied pullets or
chicks to the farm. Primary breeder farms tended to have more source farms than
multiplier farms.
a. Percentage of farms by number of different farms that supplied pullets or chicks to the
farm, and by farm type:
Percent Farms
Farm Type
Primary breeder Multiplier All farms
Number of farms Pct. Std.
Error Pct. Std. error Pct.
Std. Error
1 65.4 (5.2) 88.3 (2.0) 85.9 (1.8)
2 to 9 17.7 (4.5) 11.5 (2.0) 12.2 (1.8)
10 or more 16.9 (4.8) 0.2 (0.2) 1.9 (0.5)
Total 100.0 100.0 100.0
The majority of broiler breeder farms and table-egg breeder farms received their pullets or
chicks from one source farm (86.1 and 79.2 percent of farms, respectively).
b. Percentage of farms by number of different farms that supplied pullets or chicks to the
farm, and by farm type:
Percent Farms
Farm Type
Broiler breeder Table-egg breeder
Number of farms Percent Std. error Percent Std. error
1 86.1 (1.9) 79.2 (3.8)
2 to 9 11.9 (1.9) 20.8 (3.8)
10 or more 2.0 (0.5) 0.0 (—)
Total 100.0 100.0

108 / Poultry 2010
Section I: Population Estimates—G. Bird Movement/Transport
All primary breeder farms were within an average of 99 miles or less from source farms
that supplied pullets or chicks to the farm: 44.6 percent were less than 20 miles and 55.4
percent were 20 to 99 miles from source farms. Multiplier farms tended to be farther from
their source farms.
c. Percentage of farms by average distance (in miles) pullets (or chicks if pullets are
raised on farm) were transported to the farm, and by farm type:
Percent Farms
Farm Type
Primary breeder Multiplier All farms
Average distance (miles) Pct.
Std. Error Pct.
Std. Error Pct.
Std. Error
Less than 20 44.6 (5.2) 18.5 (2.3) 21.3 (2.1)
20 to 99 55.4 (5.2) 79.1 (2.3) 76.6 (2.1)
100 or more 0.0 (—) 2.4 (0.5) 2.1 (0.5)
Total 100.0 100.0 100.0
Over 4 of 10 layer breeder farms (41.5 percent) were located an average of 100 miles or
more from their pullet source farms, whereas less than 1 percent of broiler breeder farms
(0.9 percent) were 100 miles or more from their pullet source farms.
Note: Since table-egg breeder farms account for only 3 percent of all breeder farms (see
table a., p 17), they do not contribute greatly to the “all farms” estimate in the previous
table.
d. Percentage of farms by average distance (in miles) pullets (or chicks if pullets are
raised on farm) were transported to the farm, and by farm type:
Percent Farms
Farm Type
Broiler breeder Table-egg breeder
Average distance (miles) Percent Std. error Percent Std. error
Less than 20 21.2 (2.2) 23.6 (3.5)
20 to 99 77.9 (2.2) 34.9 (5.3)
100 or more 0.9 (0.5) 41.5 (5.6)
Total 100.0 100.0

USDA APHIS VS / 109
Section I: Population Estimates—G. Bird Movement/Transport
All primary breeder farms and 8 of 10 multiplier farms used vehicles dedicated to their
company only to bring pullets/chicks onto the farm.
e. Percentage of farms by best description of vehicle used most often to bring pullets/
chicks onto the farm during the previous 12 months, and by farm type:
Percent Farms
Farm Type
Primary breeder Multiplier All farms
Vehicle description Pct. Std. error Pct.
Std. error Pct.
Std. error
Vehicle dedicated to this farm only
0.0 (—) 0.7 (0.4) 0.6 (0.4)
Vehicle dedicated to this company only
100.0 (—) 79.5 (1.3) 81.6 (1.1)
Vehicle also used on other companies’ farms or independent farms
0.0 (—) 19.8 (1.2) 17.8 (1.1)
Total 100.0 100.0 100.0
Nearly all table-egg breeder farms (97.2 percent) and 8 of 10 broiler breeder farms
(81.1 percent) used vehicles dedicated to their company only to bring pullets/chicks onto
the farm.
f. Percentage of farms by best description of vehicle used most often to bring pullets/
chicks onto the farm during the previous 12 months, and by farm type:
Percent Farms
Farm Type
Broiler breeder Table-egg breeder
Vehicle description Percent Std. error Percent Std. error
Vehicle dedicated to this farm only 0.7 (0.4) 0.0 (—)
Vehicle dedicated to this company only
81.1 (1.2) 97.2 (2.8)
Vehicle also used on other companies’ farms or independent farms
18.2 (1.1) 2.8 (2.8)
Total 100.0 100.0

110 / Poultry 2010
Section I: Population Estimates—G. Bird Movement/Transport
No primary breeder farms or multiplier farms added pullets to existing flocks when placing
pullets in the laying houses.
g. Percentage of farms by procedures for placing pullets in laying houses, and by farm
type:
Percent Farms
Farm Type
Primary breeder Multiplier All farms
Procedure for placing pullets Pct.
Std. error Pct.
Std. error Pct.
Std. error
Whole farm all-in/all-out* 54.7 (4.9) 96.8 (1.4) 92.5 (1.4)
All-in/all-out by house* 45.3 (4.9) 3.2 (1.4) 7.5 (1.4)
Pullets added to existing flocks
0.0 (—) 0.0 (—) 0.0 (—)
Total 100.0 100.0 100.0
*May take a couple of weeks to complete additions, but birds not added to existing flocks.
About 9 of 10 broiler breeder farms (93.2 percent) and 7 of 10 table-egg breeder farms
(68.9 percent) placed pullets all-in/all-out for the whole farm.
h. Percentage of farms by procedures for placing pullets in laying houses, and by farm
type:
Percent Farms
Farm Type
Broiler breeder Table-egg breeder
Procedure for placing pullets
Percent Std. error Percent Std. error
Whole farm all-in/all-out* 93.2 (1.4) 68.9 (3.7)
All-in/all-out by house* 6.8 (1.4) 31.1 (3.7)
Pullets added to existing flocks
0.0 (—) 0.0 (—)
Total 100.0 100.0
*May take a couple of weeks to complete additions, but birds not added to existing flocks.
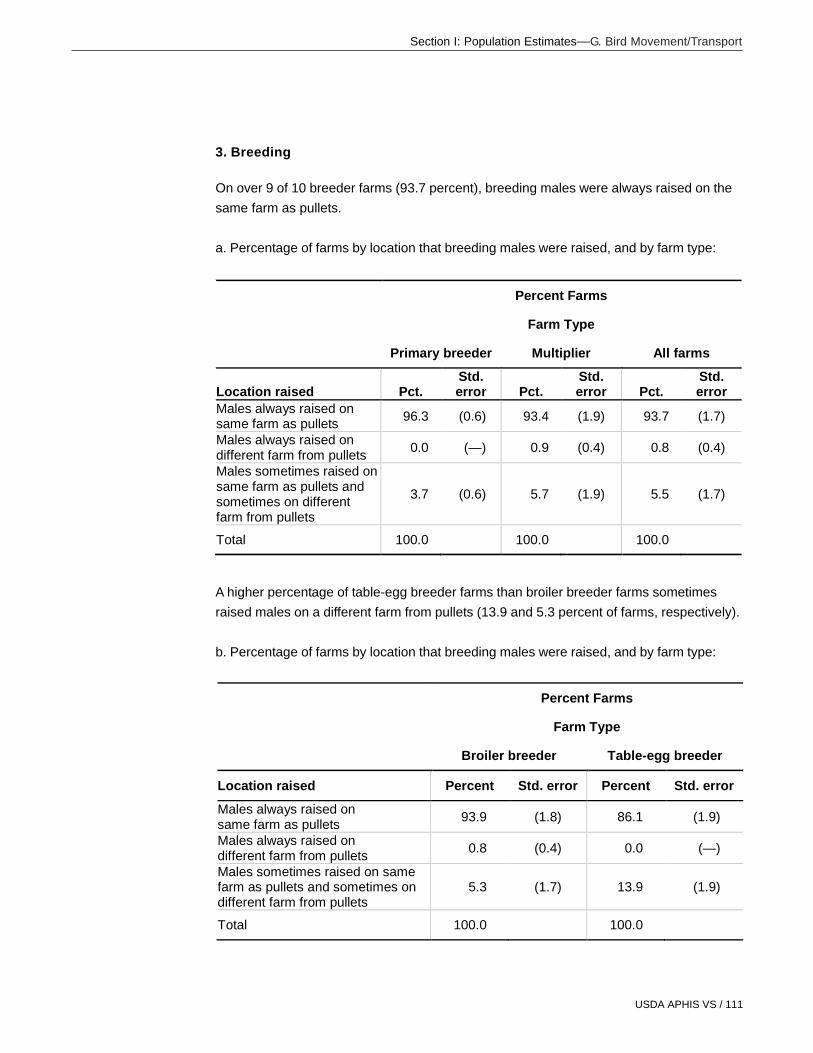
USDA APHIS VS / 111
Section I: Population Estimates—G. Bird Movement/Transport
3. Breeding
On over 9 of 10 breeder farms (93.7 percent), breeding males were always raised on the
same farm as pullets.
a. Percentage of farms by location that breeding males were raised, and by farm type:
Percent Farms
Farm Type
Primary breeder Multiplier All farms
Location raised Pct. Std. error Pct.
Std. error Pct.
Std. error
Males always raised on same farm as pullets
96.3 (0.6) 93.4 (1.9) 93.7 (1.7)
Males always raised on different farm from pullets
0.0 (—) 0.9 (0.4) 0.8 (0.4)
Males sometimes raised on same farm as pullets and sometimes on different farm from pullets
3.7 (0.6) 5.7 (1.9) 5.5 (1.7)
Total 100.0 100.0 100.0
A higher percentage of table-egg breeder farms than broiler breeder farms sometimes
raised males on a different farm from pullets (13.9 and 5.3 percent of farms, respectively).
b. Percentage of farms by location that breeding males were raised, and by farm type:
Percent Farms
Farm Type
Broiler breeder Table-egg breeder
Location raised Percent Std. error Percent Std. error
Males always raised on same farm as pullets
93.9 (1.8) 86.1 (1.9)
Males always raised on different farm from pullets
0.8 (0.4) 0.0 (—)
Males sometimes raised on same farm as pullets and sometimes on different farm from pullets
5.3 (1.7) 13.9 (1.9)
Total 100.0 100.0

112 / Poultry 2010
Section I: Population Estimates—G. Bird Movement/Transport
Nearly all multiplier farms (96.7 percent) and 8 of 10 primary breeder farms (80.2 percent)
introduced spiking males during the previous 12 months to stimulate breeding activity.
c. Percentage of farms that introduced spiking males during the previous 12 months to
stimulate breeding activity, by farm type:
Percent Farms
Farm Type
Primary breeder Multiplier All farms
Percent Std. error Percent Std. error Percent Std. error
80.2 (2.2) 96.7 (0.4) 95.0 (0.4)
Nearly all broiler breeder farms (99.8 percent) but less than 3 percent of table-egg breeder
farms (2.6 percent) introduced spiking males during the previous 12 months to stimulate
breeding activity.
d. Percentage of farms that introduced spiking males during the previous 12 months to
stimulate breeding activity, by farm type:
Percent Farms
Farm Type
Broiler breeder Table-egg breeder
Percent Std. error Percent Std. error
99.8 (0.4) 2.6 (1.8)

USDA APHIS VS / 113
Section I: Population Estimates—G. Bird Movement/Transport
About one-half of multiplier farms (49.5 percent) but less than 1 percent of primary
breeder farms (0.6 percent) that introduced spiking males during the previous 12 months,
introduced the males three or more times.
e. For farms that introduced spiking males to stimulate breeding activity during the
previous 12 months, percentage of farms by number of times males were introduced, and
by farm type:
Percent Farms
Farm Type
Primary breeder Multiplier All farms
Number times Pct. Std.
Error Pct. Std.
Error Pct. Std. Error
1 54.2 (6.3) 14.0 (2.2) 17.6 (2.1)
2 45.2 (6.2) 36.5 (3.5) 37.3 (3.2)
3 times or more 0.6 (0.6) 49.5 (3.1) 45.1 (2.8)
Total 100.0 100.0 100.0
The source of spiking males for nearly all farms was other farms from the same company.
No farms used spiking males from a different company.
f. For farms that introduced spiking males to stimulate breeding activity during the
previous 12 months, percentage of farms by source of spiking males:
Source of spiking males Percent farms Std. error
Excess males from young flocks on same farm
2.9 (1.1)
Other farms, same company 99.9 (0.1)
Other farms, different company 0.0 (—)

114 / Poultry 2010
Section I: Population Estimates—G. Bird Movement/Transport
Nearly all breeder farms that received spiking males from other farms performed routine
testing of the source farms for health status (e.g., Mycoplasma or other tests) and also
tested males before placing them on the farm.
g. For farms that introduced spiking males that came from other farms, percentage of
farms by health practices performed on source farm and males:
Health practice Percent farms Std. error
Routine testing of source farm for health status (e.g., Mycoplasma or other tests)
99.8 (0.2)
Testing of males before placing on farm (e.g., Mycoplasma or other tests)
99.4 (0.3)
Quarantine of males before introducing to laying flock
7.1 (1.7)
Spiking males were transported an average of 20 to 49 miles for about one-half of
receiving farms.
h. For farms that introduced spiking males that came from other farms, percentage of
farms by average number of miles spiking males were transported to the farm:
Average distance traveled (miles)
Percent farms Std. error
Less than 20 24.5 (2.7)
20 to 49 50.1 (3.5)
50 to 99 25.4 (3.0)
100 or more 0.0 (—)
Total 100.0

USDA APHIS VS / 115
Section I: Population Estimates—G. Bird Movement/Transport
4. Vehicles used to remove birds
The majority of primary breeder farms (59.7 percent) used vehicles dedicated to their
company only to remove birds from the farm, whereas the majority of multiplier farms
(78.8 percent) used vehicles that were also used for other companies’ farms.
a. Percentage of farms by best description of vehicle used most often to remove birds
from the farm during the previous 12 months (e.g., transport birds to slaughter or market),
and by farm type:
Percent Farms
Farm Type
Primary breeder Multiplier All farms
Vehicle description Pct. Std. error Pct.
Std. error Pct.
Std. error
Vehicle dedicated to this farm only
0.0 (—) 0.2 (0.2) 0.2 (0.2)
Vehicle dedicated to this company only
59.7 (4.6) 21.0 (2.3) 24.9 (2.1)
Vehicle also used on other companies’ farms or independent farms
39.5 (4.6) 78.8 (2.3) 74.8 (2.1)
Other vehicles used 0.8 (0.8) 0.0 (—) 0.1 (0.1)
Total 100.0 100.0 100.0

116 / Poultry 2010
Section I: Population Estimates—G. Bird Movement/Transport
Table-egg breeder farms most commonly used vehicles dedicated to their company to
remove birds, and broiler breeder farms most commonly used vehicles that were also
used for other companies.
b. Percentage of farms by best description of vehicle used most often to remove birds
from the farm during the previous 12 months (e.g., transport birds to slaughter or market),
and by farm type:
Percent Farms
Farm Type
Broiler breeder Table-egg breeder
Vehicle description Percent Std. error Percent Std. error
Vehicle dedicated to this farm only
0.2 (0.2) 0.0 (—)
Vehicle dedicated to this company only
23.1 (2.2) 82.5 (0.0)
Vehicle also used on other companies’ farms or independent farms
76.7 (2.2) 14.8 (2.8)
Other vehicles used 0.0 (—) 2.7 (2.7)
Total 100.0 100.0
Photograph courtesy of Frank T. Jones

USDA APHIS VS / 117
Section I: Population Estimates—H. Egg Movement/Transport
H. Egg Movementand Transport
1. Egg handling
Nearly all breeder farms gathered eggs by belt only or by both hand and belt. Only 1.6
percent of farms used hand gathering only.
a. Percentage of farms by egg-gathering method and by farm type:
Percent Farms
Farm Type
Primary breeder Multiplier All farms
Egg-gathering method Pct. Std. error Pct.
Std. error Pct.
Std. error
Hand only 0.7 (0.5) 1.7 (1.0) 1.6 (0.9)
Belt only 30.9 (5.2) 56.5 (2.7) 54.0 (2.5)
Both hand and belt 68.4 (5.2) 41.8 (2.5) 44.4 (2.3)
Total 100.0 100.0 100.0
About three-fourths of table-egg breeder farms (78.4 percent) used belt only to gather
eggs.
b. Percentage of farms by egg-gathering method and by farm type:
Percent Farms
Farm Type
Broiler breeder Table-egg breeder
Egg-gathering method Percent Std. error Percent Std. error
Hand only 1.6 (0.9) 2.6 (1.7)
Belt only 53.2 (2.5) 78.4 (3.8)
Both hand and belt 45.2 (2.4) 19.0 (3.8)
Total 100.0 100.0

118 / Poultry 2010
Section I: Population Estimates—H. Egg Movement/Transport
The majority of primary breeder and multiplier farms sent clean floor eggs to the hatchery
and discarded broken floor eggs.
c. Percentage of primary breeder farms by handling procedures for the following egg
types:
Percent Primary Breeder Farms
Handling Procedure
Sent to hatchery Sent to breaker Discarded
Egg type Pct. Std. error Pct.
Std. error Pct.
Std. error Total
Clean floor eggs 92.8 (2.1) 5.3 (0.9) 1.9 (1.9) 100.0
Dirty floor eggs 30.1 (5.1) 47.7 (3.6) 22.2 (4.8) 100.0
Broken eggs 0.0 (—) 15.1 (4.6) 84.9 (4.6) 100.0
d. Percentage of multiplier farms by handling procedures for the following egg types:
Percent Multiplier Farms
Handling Procedure
Sent to hatchery Sent to breaker Discarded
Egg type Pct. Std. error Pct.
Std. error Pct.
Std. error Total
Clean floor eggs 97.8 (0.1) 2.1 (0.1) 0.1 (0.1) 100.0
Dirty floor eggs 2.4 (1.2) 65.8 (0.7) 31.8 (1.4) 100.0
Broken eggs 0.0 (—) 24.2 (0.8) 75.8 (0.8) 100.0

USDA APHIS VS / 119
Section I: Population Estimates—H. Egg Movement/Transport
2. Eggs transported to the hatchery
Breeder farms most commonly transported eggs to the hatchery two times per week (95.2
percent of farms).
a. Percentage of farms by number of times per week eggs were transported to the
hatchery, and by farm type:
Percent Farms
Farm Type
Primary breeder Multiplier All farms
Number of times per week Pct.
Std. Error Pct.
Std. error Pct.
Std. error
1 0.8 (0.8) 0.0 (—) 0.1 (0.1)
2 99.2 (0.8) 94.7 (1.4) 95.2 (1.3)
3 or more 0.0 (—) 5.3 (1.4) 4.7 (1.3)
Total 100.0 100.0 100.0
Four of 10 table-egg breeder farms (40.3 percent) transported eggs to the hatchery 3 or
more times per week.
b. Percentage of farms by number of times per week eggs were transported to the
hatchery, and by farm type:
Percent Farms
Farm Type
Broiler breeder Table-egg breeder
Number of times per week
Percent Std. error Percent Std. error
1 0.0 (—) 2.7 (2.7)
2 96.3 (1.3) 57.0 (5.6)
3 or more 3.7 (1.3) 40.3 (5.2)
Total 100.0 100.0

120 / Poultry 2010
Section I: Population Estimates—H. Egg Movement/Transport
Multiplier farms transported eggs a longer distance to the hatchery than primary breeder
farms; 33.0 percent of multiplier farms, but only 8.2 percent of primary breeder farms,
transported eggs 50 miles or more to the hatchery.
c. Percentage of farms by distance (in miles) eggs were transported to the hatchery, and
by farm type:
Percent Farms
Farm Type
Primary breeder Multiplier All farms
Distance (miles) Pct. Std. error Pct.
Std. error Pct.
Std. error
Less than 20 44.0 (5.5) 20.0 (3.1) 22.6 (2.8)
20–49 47.8 (5.6) 47.0 (3.6) 47.1 (3.2)
50–99 7.4 (1.7) 20.9 (3.0) 19.4 (2.7)
100 or more 0.8 (0.8) 12.1 (0.8) 10.9 (0.7)
Total 100.0 100.0 100.0
Broiler breeder farms transported eggs a longer distance to the hatchery than table-egg
breeder farms; 79.2 percent of broiler breeder farms, but only 22.3 percent of table-egg
breeder farms; transported eggs 20 miles or more to the hatchery.
d. Percentage of farms by distance (in miles) eggs were transported to the hatchery, and
by farm type:
Percent Farms
Farm Type
Broiler breeder Table-egg breeder
Distance (miles) Percent Std. error Percent Std. error
Less than 20 20.8 (2.9) 77.7 (3.4)
20–49 48.2 (3.3) 11.5 (3.6)
50–99 20.0 (2.8) 2.5 (1.3)
100 or more 11.0 (0.8) 8.3 (3.4)
Total 100.0 100.0

USDA APHIS VS / 121
Section I: Population Estimates—H. Egg Movement/Transport
Nearly all breeder farms (95.4 percent) used a vehicle dedicated to their company only to
transport eggs to the hatchery.
e. Percentage of farms by best description of vehicle used most often to transport eggs
from the farm to the hatchery during the previous 12 months, and by farm type:
Percent Farms
Farm Type
Primary breeder Multiplier All farms
Vehicle description Pct. Std. error Pct.
Std. error Pct.
Std. error
Vehicle dedicated to this farm only
0.0 (—) 0.2 (0.2) 0.2 (0.2)
Vehicle dedicated to this company only
100.0 (—) 94.9 (1.7) 95.4 (1.5)
Vehicle also used on other companies’ farms or independent farms
0.0 (—) 4.9 (1.7) 4.4 (1.5)
Total 100.0 100.0 100.0
A small percentage of broiler breeder farms (4.5 percent) used vehicles that were also
used on other companies’ farms to transport eggs to the hatchery.
f. Percentage of farms by best description of vehicle used most often to transport eggs
from the farm to the hatchery during the previous 12 months, and by farm type:
Percent Farms
Farm Type
Broiler breeder Table-egg breeder
Vehicle description Percent Std. error Percent Std. error
Vehicle dedicated to this farm only 0.2 (0.2) 1.3 (1.3)
Vehicle dedicated to this company only
95.3 (1.5) 98.7 (1.3)
Vehicle also used on other companies’ farms or independent farms
4.5 (1.5) 0.0 (—)
Total 100.0 100.0
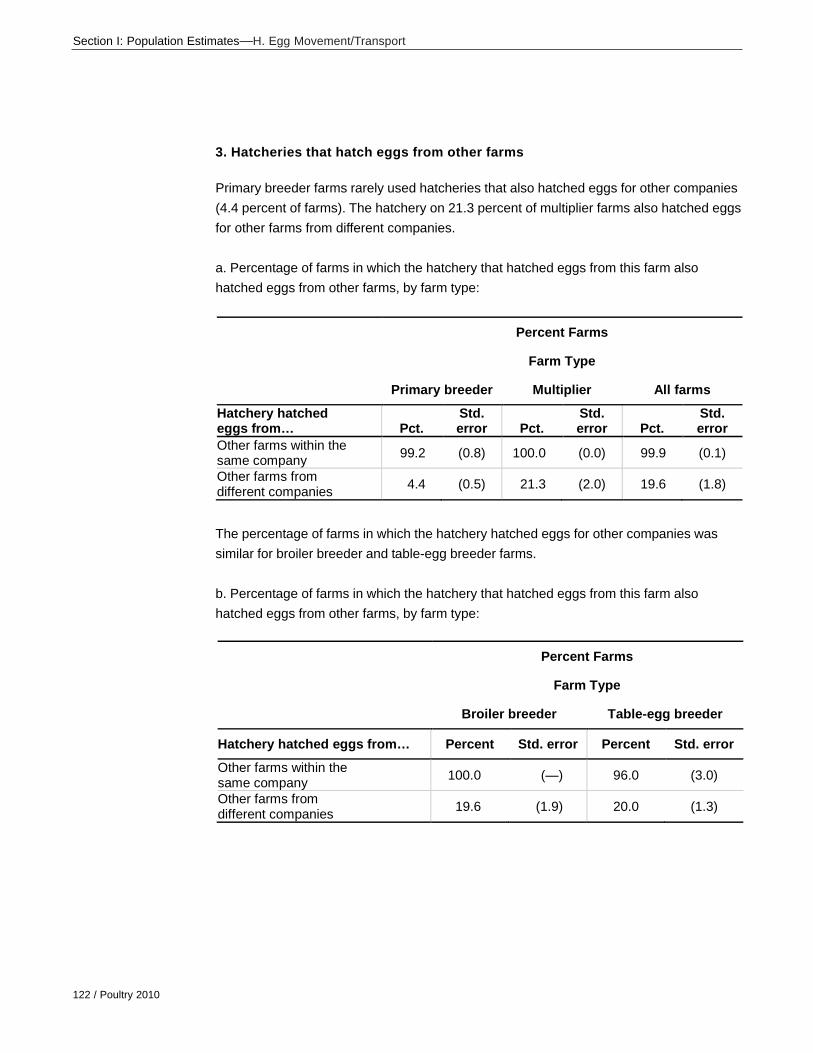
122 / Poultry 2010
Section I: Population Estimates—H. Egg Movement/Transport
3. Hatcheries that hatch eggs from other farms
Primary breeder farms rarely used hatcheries that also hatched eggs for other companies
(4.4 percent of farms). The hatchery on 21.3 percent of multiplier farms also hatched eggs
for other farms from different companies.
a. Percentage of farms in which the hatchery that hatched eggs from this farm also
hatched eggs from other farms, by farm type:
Percent Farms
Farm Type
Primary breeder Multiplier All farms
Hatchery hatched eggs from… Pct.
Std. error Pct.
Std. error Pct.
Std. error
Other farms within the same company
99.2 (0.8) 100.0 (0.0) 99.9 (0.1)
Other farms from different companies
4.4 (0.5) 21.3 (2.0) 19.6 (1.8)
The percentage of farms in which the hatchery hatched eggs for other companies was
similar for broiler breeder and table-egg breeder farms.
b. Percentage of farms in which the hatchery that hatched eggs from this farm also
hatched eggs from other farms, by farm type:
Percent Farms
Farm Type
Broiler breeder Table-egg breeder
Hatchery hatched eggs from… Percent Std. error Percent Std. error
Other farms within the same company
100.0 (—) 96.0 (3.0)
Other farms from different companies
19.6 (1.9) 20.0 (1.3)

USDA APHIS VS / 123
Section I: Population Estimates—H. Egg Movement/Transport
4. Egg flats
Nearly all primary breeder and multiplier farms used flats that may go to other farms within
the same company only; none used flats that went to farms belonging to different
companies.
a. Percentage of farms by best description of how flats were usually handled, and by farm
type:
Percent Farms
Farm Type
Primary breeder Multiplier All farms
Handling description Pct. Std. error Pct.
Std. error Pct.
Std. error
Disposable 4.4 (0.5) 2.1 (0.1) 2.3 (0.0)
Returned to same farm 0.8 (0.8) 1.5 (0.8) 1.5 (0.7)
May go to other farms, same company only
94.8 (0.9) 96.4 (0.8) 96.2 (0.7)
May go to other farms, other companies
0.0 (—) 0.0 (—) 0.0 (—)
No flats used 0.0 (—) 0.0 (—) 0.0 (—)
Total 100.0 100.0 100.0

124 / Poultry 2010
Section I: Population Estimates—H. Egg Movement/Transport
Percent Farms
Farm Type
Broiler breeder Table-egg breeder
Handling description Percent Std. error Percent Std. error
Disposable 0.0 (—) 78.7 (0.0)
Returned to same farm 1.0 (0.7) 15.0 (1.3)
May go to other farms, same company only
99.0 (0.7) 6.3 (1.3)
May go to other farms, other companies
0.0 (—) 0.0 (—)
No flats used 0.0 (—) 0.0 (—)
Total 100.0 100.0
The majority of table-egg breeder farms (78.7 percent) used disposable flats.
b. Percentage of farms by best description of how flats were usually handled, and by farm
type:
All farms that used nondisposable flats cleaned and disinfected the flats before returning
them to a farm.
c. For farms that used nondisposable flats, percentage of farms in which the flats were
usually cleaned and disinfected before leaving the hatchery and returning to a farm:
Percent farms Std. error
100.0 (—)

USDA APHIS VS / 125
Section I: Population Estimates—H. Egg Movement/Transport
d. Percentage of farms in which buggies to roll flats onto trucks were used at different
premises, by farm type
Percent Farms
Farm Type
Primary breeder Multiplier All farms
Percent Std. error Percent Std. error Percent Std. error
54.5 (2.7) 85.5 (0.8) 82.4 (0.8)
Buggies used to roll flats onto the trucks were used at different premises for a higher
percentage of broiler breeder farms (84.1 percent) than table-egg breeder farms (26.7
percent).
e. Percentage of farms in which buggies to roll flats onto trucks were used at different
premises, by farm type:
Percent Farms
Farm Type
Broiler breeder Table-egg breeder
Percent Std. error Percent Std. error
84.1 (0.8) 26.7 (4.0)
Nearly all farms that used buggies for different premises cleaned and disinfected the
buggies between farms.
f. For farms in which buggies were used at different premises, percentage of farms that
cleaned and disinfected buggies between farms:
Percent farms Std. error
97.6 (1.3)

126 / Poultry 2010
Section I: Population Estimates—H. Egg Movement/Transport
5. Egg racks
Nearly all multiplier farms (97.0 percent) and 6 of 10 primary breeder farms (58.2 percent)
used racks that may go to other farms within the same company only; 4 of 10 primary
breeder farms (40.6 percent) did not use racks.
a. Percentage of farms by best description of how racks were usually handled, and by
farm type:
Percent Farms
Farm Type
Primary breeder Multiplier All farms
Handling description Pct. Std. error Pct.
Std. error Pct.
Std. error
Returned to same farm
1.2 (0.9) 0.5 (0.2) 0.6 (0.2)
May go to other farms, same company only
58.2 (0.7) 97.0 (1.2) 93.1 (1.1)
May go to other farms, other companies
0.0 (—) 0.3 (0.2) 0.3 (0.2)
No racks used 40.6 (0.5) 2.2 (1.2) 6.0 (1.1)
Total 100.0 100.0 100.0
Photograph courtesy of Frank T. Jones

USDA APHIS VS / 127
Section I: Population Estimates—H. Egg Movement/Transport
A total of 14.0 percent of table-egg breeder farms returned racks to the same farm.
b. Percentage of farms by best description of how racks were usually handled, and by
farm type:
Percent Farms
Farm Type
Broiler breeder Table-egg breeder
Handling description Percent Std. error Percent Std. error
Returned to same farm 0.1 (0.1) 14.0 (3.3)
May go to other farms, same company only
93.4 (1.1) 84.7 (3.5)
May go to other farms, other companies
0.3 (0.2) 0.0 (—)
No racks used 6.2 (1.1) 1.3 (1.3)
Total 100.0 100.0
All farms that used racks cleaned and disinfected the racks before they left the hatchery
and returned to a farm.
c. For farms that used racks, percentage of farms in which the racks were usually cleaned
and disinfected before leaving the hatchery and returning to a farm:
Percent farms Std. error
100.0 (—)

128 / Poultry 2010
Section I: Population Estimates—H. Egg Movement/Transport
6. Equipment sharing
About three-fourths of primary breeder farms (78.5 percent) and one-half of multiplier
farms (52.2 percent) never shared outside tools, equipment, or machinery—other than
racks or flats—with another farm within the same company, and all primary breeder farms
(100.0 percent) and 7 of 10 multiplier farms (70.5 percent) never shared these items with
farms from a different company.
a. Percentage of farms that shared any outside tools, equipment, or machinery—other
than racks and flats—(e.g., tractors, feeding equipment, litter spreaders, trailers) with
other farms during the previous 12 months, by frequency shared and by farm type:
Percent Farms
Farm Type
Primary breeder Multiplier All farms
Frequency shared Pct. Std. error Pct.
Std. Error Pct. Std. error
Another farm, same company
At least monthly 0.4 (0.4) 3.6 (1.4) 3.2 (1.3)
Less than monthly 21.1 (5.0) 44.2 (3.1) 41.9 (2.8)
Never 78.5 (5.0) 52.2 (3.2) 54.9 (2.9)
Total 100.0 100.0 100.0
Another farm, different company
At least monthly 0.0 (—) 0.3 (0.2) 0.3 (0.2)
Less than monthly 0.0 (—) 29.2 (2.2) 26.2 (2.0)
Never 100.0 (—) 70.5 (2.2) 73.5 (2.0)
Total 100.0 100.0 100.0
About 9 of 10 table-egg breeder farms (89.2 percent) and one-half of broiler breeder
farms (53.9 percent) never shared outside tools, equipment, or machinery—other than
racks or flats—with another farm within the same company, and all table-egg breeder
farms (100.0 percent) and 7 of 10 broiler breeder farms (72.8 percent) never shared these
items with farms from a different company.

USDA APHIS VS / 129
Section I: Population Estimates—H. Egg Movement/Transport
Percent Farms
Farm Type
Broiler breeder Table-egg breeder
Frequency shared Percent Std. error Percent Std. error
Another farm, same company
At least monthly 3.2 (1.3) 2.6 (1.8)
Less than monthly 42.9 (2.9) 8.2 (3.2)
Never 53.9 (3.0) 89.2 (3.6)
Total 100.0 100.0
Another farm, different company
At least monthly 0.3 (0.2) 0.0 (—)
Less than monthly 26.9 (2.0) 0.0 (—)
Never 72.8 (2.0) 100.0 (—)
Total 100.0 100.0
Nearly all farms that shared equipment washed and disinfected the equipment before
bringing it onto the farm.
c. For farms that shared tools, equipment, and/or machinery—other than racks or flats—
percentage of farms that washed and disinfected equipment/machinery before bringing it
onto the farm:
b. Percentage of farms that shared any outside tools, equipment, or machinery—other
than racks and flats—(e.g., tractors, feeding equipment, litter spreaders, trailers) with
other farms during the previous 12 months, by frequency shared and by farm type:
Percent farms Std. error
94.6 (2.4)

130 / Poultry 2010
Section II: Methodology
Section II: Methodology
A. NeedsAssessment
NAHMS develops study objectives by exploring existing literature and contacting industry
members and other stakeholders about their informational needs and priorities during a
needs assessment phase. For Poultry 2010, the following activities were conducted:
• A focus group consisting of industry, State, Federal, and university representatives met
at the World Poultry Exposition in Atlanta, GA, in January 2008.
• A needs assessment questionnaire was distributed to poultry veterinarians via the
presidents of the egg layer, broiler, turkey, and primary breeder veterinary groups. This
questionnaire was also distributed to State and Federal veterinarians, and laboratory and
research personnel.
• Discussions were held with each of the poultry veterinary groups at the American
Association of Avian Pathologists meeting in New Orleans, LA, in July 2008, and in
Seattle, WA, in July 2009.
• Additional discussions occurred at the United States Animal Health Association
Transmissible Diseases of Poultry Committee.
B. Samplingand Estimation
1. Phase I: Company survey
Phase I of the Poultry 2010 study focused on the industry structure and company
practices. The selection unit for Phase I was the poultry company. A total of 6 breeder
companies, 14 broiler companies, 23 table egg layer companies, and 15 turkey
companies were selected to participate in Phase I of the Poultry 2010 study. Turkey
breeder companies were not included. Companies that had broilers and turkeys were
considered to be two separate companies for the purposes of this study. Additionally,
subparts of some large turkey companies were considered to be separate companies.
Large turkey co-ops were considered to be companies. The selected companies
represent all primary breeders, 81.2 percent of broilers produced during 20091, 71.7
percent of table egg layers in production on December 31, 20091, and 76.8 percent of
turkeys slaughtered in 20092 in the United States.

USDA APHIS VS / 131
Section II: Methodology
2. Phase II: Breeder Farm study
Companies that participated in Phase I and that had any layer (egg type) or broiler (meat
type) breeder farms were eligible to participate in Phase II (Breeder Farm study). Turkey
breeder farms were not included in Phase II. The Poultry 2010 Breeder Farm study
included farms located in the Central and East regions of the United States
(see map, p 4). States in these regions accounted for 98 percent of egg-type breeder
flocks, 97 percent of egg-type breeder birds, and over 99 percent of meat-type breeder
flocks and birds in flocks participating in the National Poultry Improvement Plan
(see Appendix II).
3. Data collection
Data collection was conducted from May 27 through October 16, 2010. Company
veterinarians or representatives completed one company questionnaire per company.
Companies that had breeder farms selected a sample of farms for Phase II (Breeder
Farm study), and completed one questionnaire per farm. Some veterinarians elected to
complete farm-level questionnaires for all of their breeder farms, while others selected a
sample of farms. Breeder companies, broiler companies, and table-egg companies had a
choice of completing the company and farm-level questionnaires either online or by hard
copy. Turkey company questionnaires were only available via hard copy. The online data
collection Web site was developed and managed by a private Web site development
company. Hard-copy questionnaires were mailed to the NAHMS office and entered into a
SAS data file.
4. Data analysis
Online data (both company and farm level) were forwarded to NAHMS as comma-
delimited files. These files were converted to SAS data sets and merged with the SAS
data sets that had been entered by NAHMS staff, resulting in one company-level SAS
data set and one farm-level SAS data set. Validation checks were performed on these
data sets after they were combined. Point estimates were generated using SUDAAN
software, which accounts for complex study design.

132 / Poultry 2010
Section II: Methodology
5. Population inferences
a. Phase I: Company survey
Inferences cover the population of the selected poultry companies. The selected
companies represent all primary breeders, 81.2 percent of broilers produced during 2009,1
71.7 percent of table egg layers in production on December 31, 2009,1 and 76.8 percent
of turkeys slaughtered in 20092 in the United States. All respondent data were statistically
weighted to reflect the population from which they were selected. Because companies
were selected with certainty, the initial selection weight was equal to one for all selected
companies. This selection weight was adjusted for nonresponse within industry segment
and size strata.
b. Phase II: Breeder farm study
Companies with any broiler or table-egg breeder farms were eligible to continue on to
Phase II. The company weight was adjusted for nonresponse within industry segment.
This weight was then adjusted by an expansion factor equal to the number of breeder
farms that the company had divided by the number of farms that completed the
questionnaire. The reporting unit for Phase II was the individual farm.
.
1 www.WattAgNet.com, February 2010. WATT PoultryUSA survey.
2 WATT PoultryUSA Turkey Profiles, February 2010.
C. ResponseRate
Overall, 72 percent of selected companies participated in Phase I (company survey). Of
those companies eligible to continue to Phase II (Breeder Farm study), 81 percent
participated.
Companies Breeder
companies Broiler
companies Table-egg companies
Turkey companies Total
Selected for Phase I (company-level survey)
6 14 23 15* 58
Participated in Phase I 6 (100%) 8 (57%) 16 (70%) 12 (80%) 42 (72%)
Eligible for Phase II (Breeder Farm study)
6 8 2** 0 16
Participated in Phase II
5 (83%) 6 (75%) 2 (100%) 0 13 (81%) *For the purpose of this study, subparts of some large turkey companies were considered to be separate
(unique) companies. Also, large turkey co-ops were considered to be companies. **
Most table-egg companies receive birds from a breeder company and do not have their own breeder farms.

USDA APHIS VS / 133
Appendix I: NPIP Testing Requirements
Appendix I: National Poultry Improvement Plan Testing Requirements
Disease Primary breeder flocks Multiplier flocks
Pullorum Test at 4 months of age No NPIP requirements
Mycoplasma gallisepticum (MG)
Test at 4 months of age and every 90 days
Test at 4 months of age and every 90 days
Mycoplasma synoviae (MS)
Test at 4 months of age and every 90 days
Test at 4 months of age and every 90 days
Avian influenza (AI) Test at greater than 4 months of age and every 90 days
Test at greater than 4 months of age and every 90 days
Source: NPIP Web site.
NPIP testing requirements for egg- and meat-type breeder chicken flocks, by disease

134 / Poultry 2010
Appendix II: NPIP Flocks and Birds
Number of Layer (Egg-type) and Broiler (Meat-type) Chicken Breeder Flocks and Number
of Birds in National Poultry Improvement Plan, by Region
Appendix II: NPIP Flocks and Birds
Region Layer breeder
flocks Layer breeder
birds Broiler breeder
flocks Broiler breeder
birds
West 4
(2.0%) 111,130 (3.1%)
9 (0.2%)
582,105 (0.7%)
Central 115
(56.6%) 1,584,868 (44.5%)
1,408 (25.2%)
24,117,882 (29.0%)
East 84
(41.4%) 1,866,750 (52.4%)
4,158 (74.6%)
58,578,821 (70.3%)
Total 203
(100.0%) 3,562,748 (100.0%)
5,575 (100.0%)
83,278,808 (100.0%)
Source: Dr. Steve Roney, NPIP.

USDA APHIS VS / 135
Appendix III: Sample Profile
Appendix III: Sample Profile
1. Number of participating farms by type
Type Number of farms
Primary breeder—broiler (meat-type) 117
Primary breeder—layer (egg-type) 13
Multiplier/parent—broiler (meat-type) 291
Multiplier/parent—layer (egg-type) 61
Total 482
2. Number of participating farms by region
Region Number of farms
Central 107
East 375
Total 482

136 / Poultry 2010
Appendix IV: Study Objectives and Related Outputs
1. Describe the structure of commercial poultry industries, including interactions among
poultry industry segments, movements, and biosecurity practices. Describe farm-level
practices for chicken primary breeder and multiplier flocks. Identify critical factors for
exclusion of disease (such as Mycoplasma).
• Poultry 2010: Structure of the U.S. Commercial Poultry Industry, expected fall 2011
• Poultry 2010: Reference of Health and Management Practices on Breeder Chicken
Farms in the United States, 2010, expected fall 2011
• Info sheets, expected fall 2011
2. Estimate the prevalence and investigate risk factors associated with clostridial
dermatitis (cellulitis/gangrenous dermatitis) on turkey grower farms.
• Poultry 2010: Clostridial dermatitis on United States Turkey Farms, Interpretive Report,
expected spring 2012
• Info sheets, expected spring 2012
3. Estimate the size of the urban chicken ownership population in Los Angeles. Describe
bird health, movement, and biosecurity practices of urban chicken flocks in four U.S.
cities: Miami, Denver, Los Angeles and New York City.
• Poultry 2010: Reference of the Health and Management of Chicken Flocks in Urban
Settings in Four U.S. Cities, April 2011
• Characteristics of Urban Chicken Flocks in Four U.S. Cities: the Human/Chicken
Interface, info sheet, April 2011
• Biosecurity of Urban Chicken Flocks in Four U.S. Cities, info sheet, April 2011
• Poultry 2010: Urban-chicken Ownership in Los Angeles County, California, 2010,
descriptive report, July 2011
• Urban Chicken Flocks in Los Angeles County, California, 2010
Appendix IV: Study Objectives and Related Outputs