Unit-2
Rumbaugh Methodology Booch Methodology Jacobson Methodology Patterns Frameworks Unified Approach Unified Modeling Language Use case class diagram Interactive Diagram Collaboration Diagram State Diagram Activity Diagram.

Chapter Objectives
You should be able to define and understand
Object Oriented methodologies.
- The Rumbaugh OMT
- The Booch methodology
- Jacobson’s methodologiesPatternsFrameworks

Rumbaugh’s Object Modeling Technique (OMT)
-A method for analysis,design and implementation by an object oriented technique.
-fast and intuitive approach for identifying and modeling all objects making up a system.
-Class attributes, methods, inheritance and association can be expressed easily.
-Dynamic behavior of objects can be described using the OMT dynamic model.
-Detailed specification of state transitions and their -descriptions within a system

Four phases of OMT(can be performed iteratively)
Analysis: objects,dynamic and functional models
System Design: Basic architecture of the system.
Object Design: static, dynamic and functional models of objects.
Implementation: reusable, extendible and robust code.

Three different parts of OMT modeling
An object model - object model & data dictionary
A dynamic model - state diagrams & event flow diagrams
A functional model - data flow & constraints

Object Model
structure of objects in a system. Identity, relationships to other
objects, attributes and operations. Object diagram

Object Diagram
Classes interconnected by association lines
Classes- a set of individual objects Association lines- relationship
among classes (i.e., objects of one class to objects of another class)

OMT Dynamic Model States, transitions, events and
actions OMT state transition diagram-
network of states and events

OMT Functional Model DFD- (Data Flow Diagram) Shows flow of data between different
processes in a business. Simple and intuitive method for
describing business processes without focusing on the details of computer systems.

Data Flow Diagram Four primary symbols
Process- any function being performedData Flow- Direction of data element movement
Data Store – Location where data is stored
External Entity-Source or Destination of a data element

The Booch Methodology Widely used OO method Uses the object paradigm Covers the design and analysis
phase of an OO system Criticized for his large set of
symbols

Diagrams of Booch method Class diagrams-
describe roles and responsibilities of objects Object diagrams
describe the desired behavior of the system in terms of scenarios
State transition diagrams
state of a class based on a stimulus Module diagrams
to map out where each class & object should be declared Process diagrams
to determine to which processor to allocate a process Interaction diagrams
describes behavior of the system in terms of scenarios

Booch method prescribes:
Macro Development Process
Micro Development Process

Macro Development Process Controlling framework for the
micro process. Primary concern-technical
management of the system.

Steps for macro development process
1. Conceptualization2. Analysis & Development of the model3. Design or create the system
architecture4. Evolution or implementation5. Maintenance
Micro Development Process
Each macro process has its own micro development process
Steps:- Identify classes & objects- Identify class & objects semantics- Identify class & object relationship- Identify class & objects interface
and implementation
JACOBSON METHODOLOGIES
Use Cases. Object Oriented Software
Engineering. Object Oriented Business
Engineering.
Use Cases Understanding system requirements Interaction between Users and Systems The use case description must contain
How and when the use case begins and ends. The Interaction between the use case and its actors,
including when the interaction occurs and what is exchanged.
How and when the use case will need data stored in the system.
Exception to the flow of events How and when concepts of the problem domain are
handled.

OOSE Object Oriented Software
Engineering. Objectory is built models
Use case model Domain object model Analysis object model Implementation model Test model

OOBE Object Oriented Business
Engineering OOBE is object modeling at the
enterprise level. Analysis phase Design and Implementation phase Testing phase
E.g. Unit testing, integration and system testing.
PATTERNS It is an instructive information that
captures the essential structure and insight of a successful family of proven solutions to a recurring problem that arises within a certain context and system of forces.
Good Pattern will do the following It solves a problem. It is a proven concept. The Solution is not obvious. It describes a relationship. The pattern has a significant
human component.

Patterns
Patterns
Generative Patterns(describe recurring phenomena
with saying how to reproduce them)
Non Generative Patterns(describe recurring phenomena
without saying how to reproduce them)

Patterns Template Essential Components should be clearly
recognizable on reading a pattern: Name Problem Context Forces Solution Examples Resulting context Rationale Related Patterns Known uses
Frameworks Way of delivering application
development patterns to support best practice sharing during application development.
Can be viewed as the implementation of a system of design patterns.
Benefits of Frameworks Reusability Modularity Extensibility Inversion of Control

Difference between Patterns and Frameworks
Design patterns are more abstract than frameworks.
Design patterns are smaller architectural elements than frameworks.
Design patterns are less specialized than frameworks.

Model An abstract representation of a
system. Types of model
1. Use case model2. Domain model3. Analysis object model4. Implementation model5. Test model
Model Types of model
1. Use case model defines the outside (actors) & inside (use case) of the system’s behavior.
2. Domain model maps real world object into the domain object model.
3. Analysis object model how source code should be carried out & written.
4. Implementation model represents the implementation of the system.
5. Test model test plans, specifications & reports.

Model Model is an iterative process. It can represent static or dynamic
situations. Model
Static Dynamic
Represents a system’s behaviors that, taken together, reflect its behavior over time.
(e.g.) interaction & activity diagrams
Provides a system’s parameters at rest or at a specific point in time.
(e.g.) class diagram

Why modeling Blue print Clarity Familiarity Maintenance Simplification
Advantages of modeling Easy to express complex ideas Reduce complexity Enhance & reinforce learning and
training Low cost Easy to change the model

What is Unified Modeling Language (UML)?
The UML is a graphical / standard language for visualizing, specifying, constructing & documenting the artifacts of a software system.

History of UML 1980 – 1990 Many different
methodologies
1. Booch method by Grady Booch2. Object Modeling Technique (OMT) by Jim
Rumbaugh3. Object Oriented Software Engineering (OOSE) by
Ivar Jacobson
Each method had its strengths & weaknesses.
1. Booch was great in design2. OMT & OOSE were great in analysis

History of UMLUML 1.0 (January 1997)
UML 1.1 (November 1997)
UML 1.3 (Current Minor revision 1999)
UML 1.4 (Planned Minor revision 2000)
UML 2.0 (Planned Major revision 2004)

UML Concepts
UML can be used to support your entire life cycle.
1. The interaction of your application with the outside world (use case diagram)
2. Visualize object interaction (sequence & collaboration diagrams)
3. The structure of your system (class diagram)4. View the system architecture by looking at
the defined package.5. The components in your system (component
diagram)

What are Diagrams ? Graphical presentation of model
elements. A diagram is a graphical means to
view a system’s parts
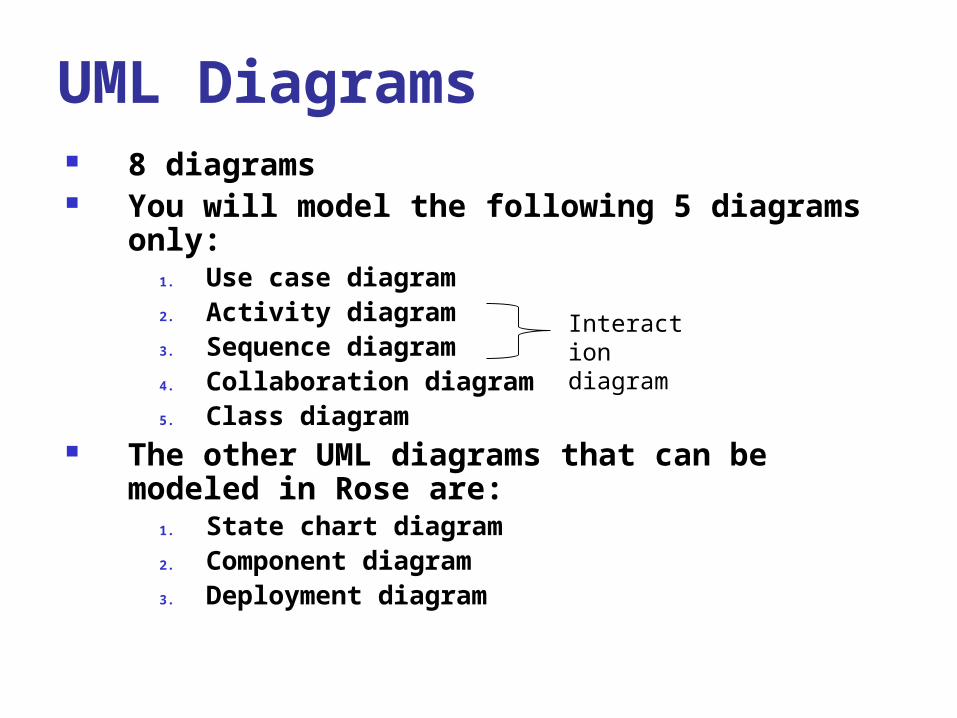
UML Diagrams 8 diagrams You will model the following 5 diagrams
only:1. Use case diagram2. Activity diagram3. Sequence diagram4. Collaboration diagram5. Class diagram
The other UML diagrams that can be modeled in Rose are:
1. State chart diagram2. Component diagram3. Deployment diagram
Interaction diagram

Behavior Diagram Sequence diagram Collaboration diagram State chart diagram Activity diagram
Interaction diagram
behavior diagram

UML Diagrams
1. Class diagram2. Use case diagram3. Activity diagram4. Sequence diagram5. Collaboration diagram6. State chart diagram7. Component diagram8. Deployment diagram

1. Class diagram Class a set of objects that share the
same attributes, operations & relationships.
It represented by a compartmentalized rectangle.
It shows the structure of your software. 3 compartments
1. Top2. Middle3. Bottom

1. Class diagram1. Top shows class name2. Middle shows class attributes3. Bottom shows class operation
LoginForm
UserNamePIN
Enter Login Details()Submit()
LoginController
Validate()
CustomerInfo
User NamePIN
Address
getLoginDetails()

1. Class diagram1. Attributes defines the characteristics or structure of a class.
displayed in the middle of the compartmentalized rectangle.
LoginForm
UserNamePIN
Enter Login Details()Submit()
LoginController
Validate()
CustomerInfo
User NamePIN
Address
getLoginDetails()
Attributes

1. Class diagram2. Operation the service provided by the class.
displayed in the bottom of the compartmentalized rectangle.
LoginForm
UserNamePIN
Enter Login Details()Submit()
LoginController
Validate()
CustomerInfo
User NamePIN
Address
getLoginDetails()
Operations
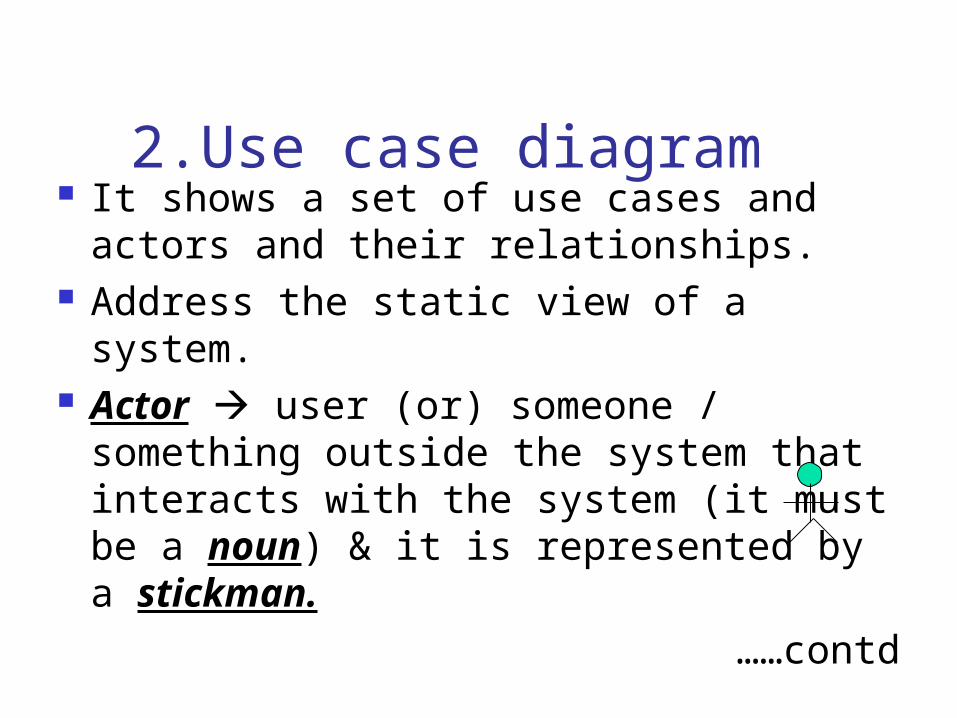
2.Use case diagram It shows a set of use cases and
actors and their relationships. Address the static view of a system. Actor user (or) someone /
something outside the system that interacts with the system (it must be a noun) & it is represented by a stickman.
……contd

2.Use case diagram Use case a sequences of actions (it
must be a verb) & it is represented by an oval.
Relationship illustrates a connection among model elements.
Unidirectional Bi-directional It is created to visualize the interaction of
your system with the outside world. (e.g.) ATM
……contd

2. Use case diagram (ATM)
CASH DISPENSER
PRINTERCHANGE PIN
WITHDRAW
CHECK BALANCE
LOGIN
CUSTOMER

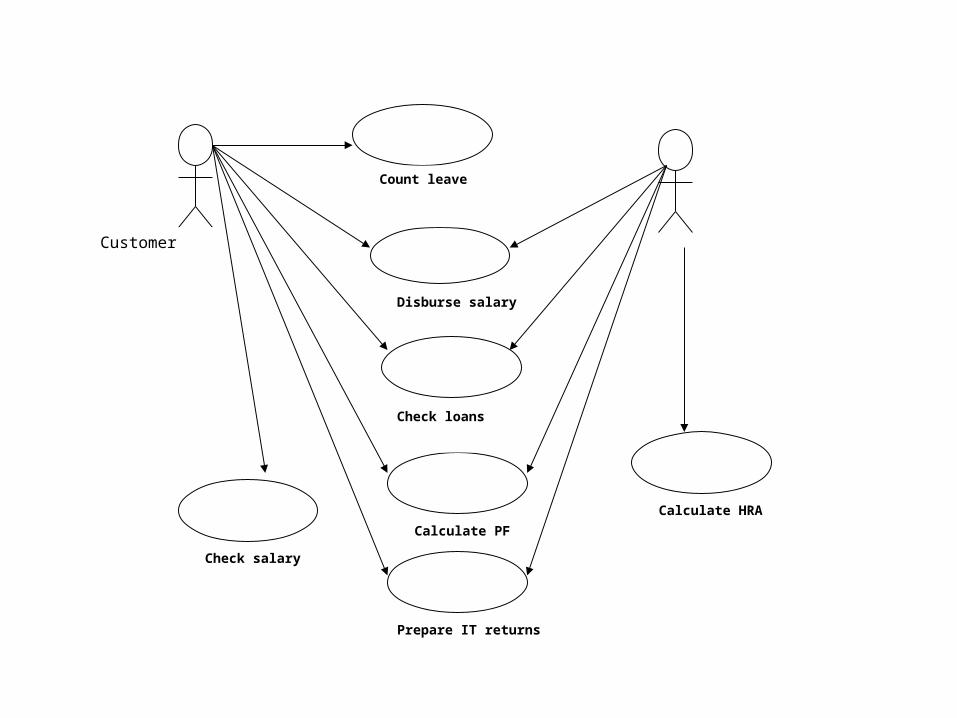
2. Use case diagram (Pay roll) Actors employee & account
Use case count leave, disburse salary, check loans, calculate PF, prepare IT returns, calculate HRA & check salary
Customer
Calculate PF
Check loans
Disburse salary
Count leave
Prepare IT returns
Check salary
Calculate HRA

3.Activity Diagram It shows the flow of events with
our system & what is going on inside a use case.
We draw the activity diagram for each & every use case.
Login (use case) – (e.g.) ATM It is showing flow of control from
activity to activity.
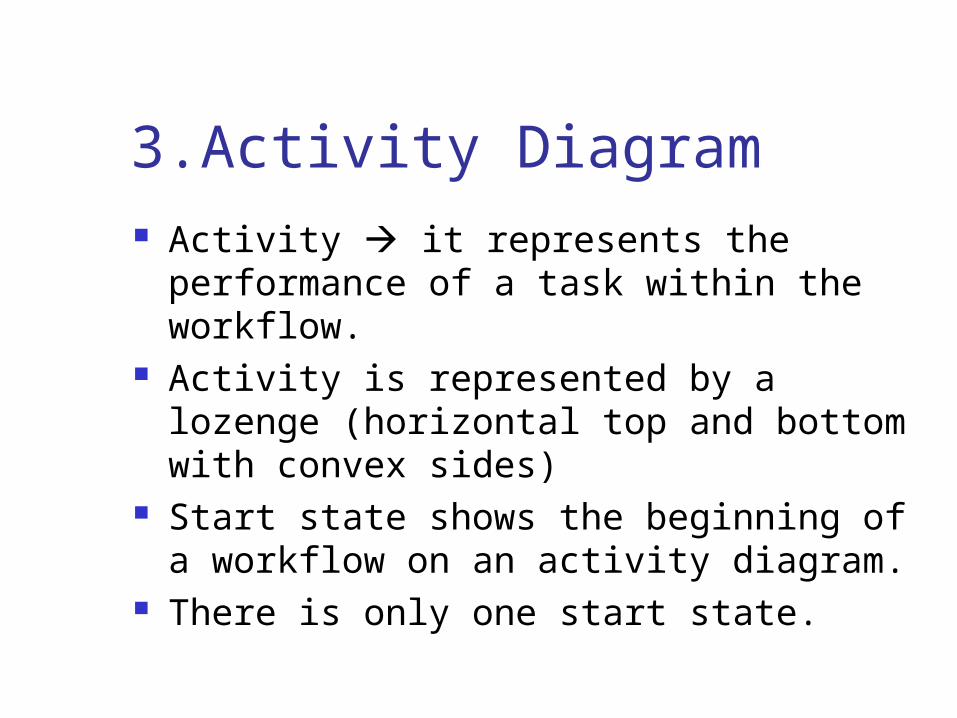
3.Activity Diagram Activity it represents the
performance of a task within the workflow.
Activity is represented by a lozenge (horizontal top and bottom with convex sides)
Start state shows the beginning of a workflow on an activity diagram.
There is only one start state.

3.Activity Diagram A start state is represented by a
solid circle.
An end state represents a final or terminal state on an activity diagram.
A end state is represented by a bull’s eye.

3.Activity Diagram A state transition shows what
activity follows after another. It is represented by a solid line
with an arrow.
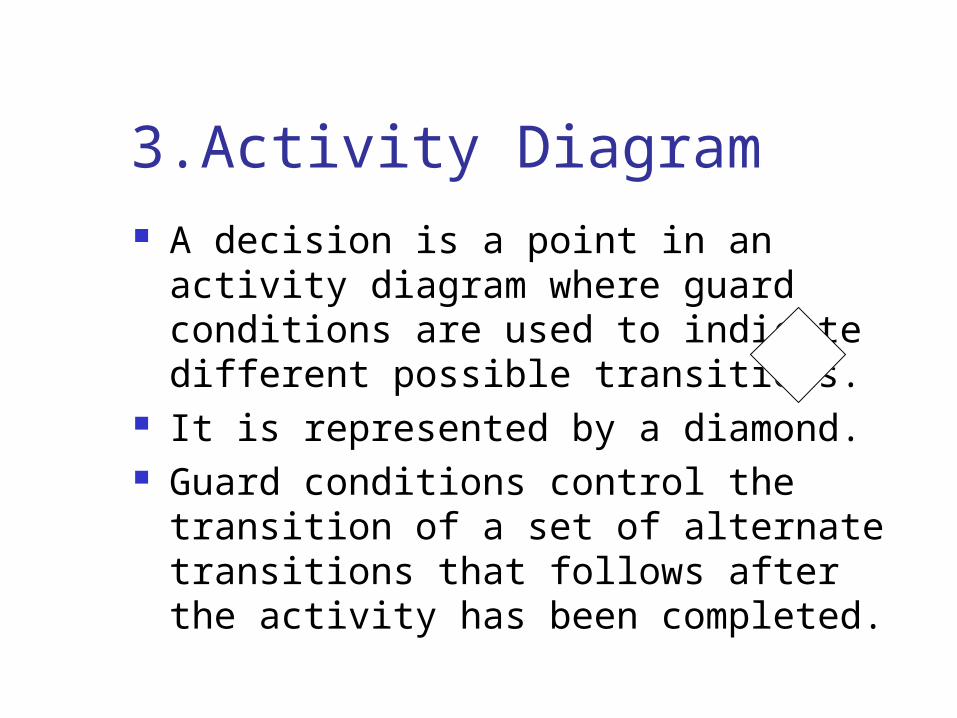
3.Activity Diagram A decision is a point in an activity
diagram where guard conditions are used to indicate different possible transitions.
It is represented by a diamond. Guard conditions control the transition
of a set of alternate transitions that follows after the activity has been completed.
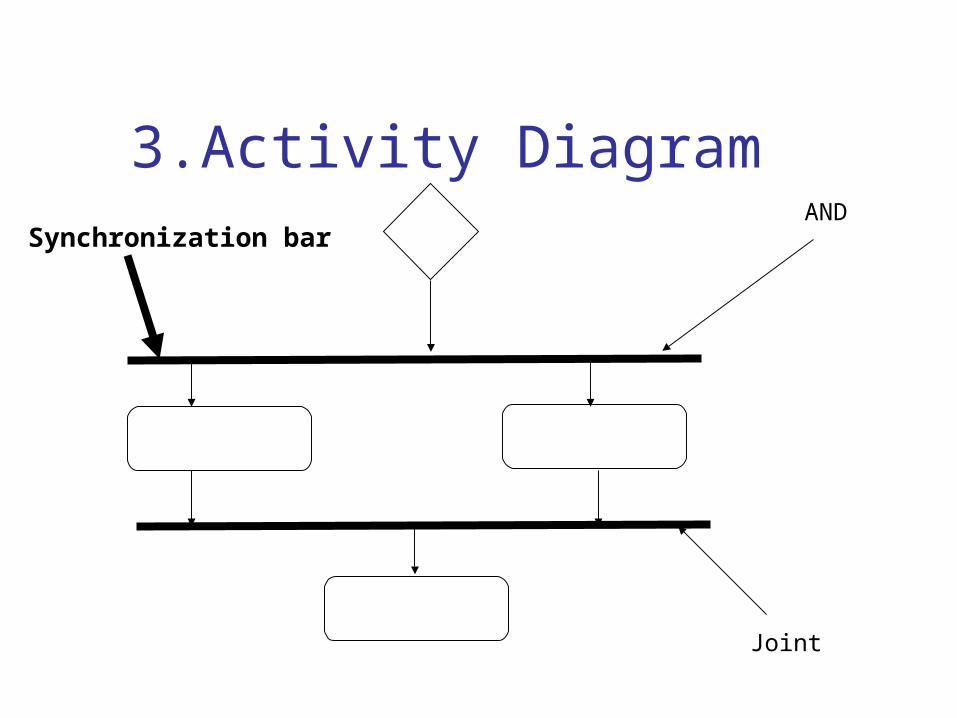
3.Activity DiagramAND
Joint
Synchronization bar

3.Activity Diagram A synchronization bar allows you to
show concurrent threads in a work flow of a use case.
It represented by a thick horizontal or vertical line.
3.Activity Diagram A swimlane is used to partition an
activity diagram to help us better understand who or what is initiating an activity.

3.Activity Diagram – Login Use case
Customer Enters the login details
System retrives the details
System validates the customer
System welcomes the customer
System prompts to reenter
[ True ]
[ False ]

4.Sequence Diagram It shows step by step what must
happen to accomplish a piece of functionality provided by the system.
It has 2Ds.1. Vertical dimensions represents time2. Horizontal dimensions represents
different objects. Vertical line is called the object’s life
line.

4.Sequence Diagram
Life line the existence object at a particular time.
Objects are shown at the top.
The object role is shown as a vertical dashed line, the life line.
4.Sequence Diagram
A message is the communication between 2 objects that triggers an event.
It is represented by a labeled arrow.
Each message is represented by an arrow between the life lines of 2 objects.

4.Sequence Diagram
A focus of control shows the period of time during which an object is performing an action, either directly or through a subordinate procedure.
It represented by a tall, thin rectangle.

4.Sequence Diagram – login success
: Customer : Customer : LoginForm : LoginForm : LoginController : LoginController : CustomerInfo : CustomerInfo
Enter Login Detail...
Submit( )
Validate( )
getLoginDetails( )
5.Collaboration Diagram It displays objects and their links to
one other.
It is also known as an interaction diagram.
5.Collaboration Diagram It is made up of the following basic
elements :1. Actors2. Objects3. Links4. Messages

5.Collaboration Diagram1. Actors user 2. Objects data + logic / the representation of some real world entity.3. Links a pathway for communication between objects.
represented by a solid line between 2 objects4. Messages the communication between objects that triggers an event. represented by a labeled arrow
above the link.
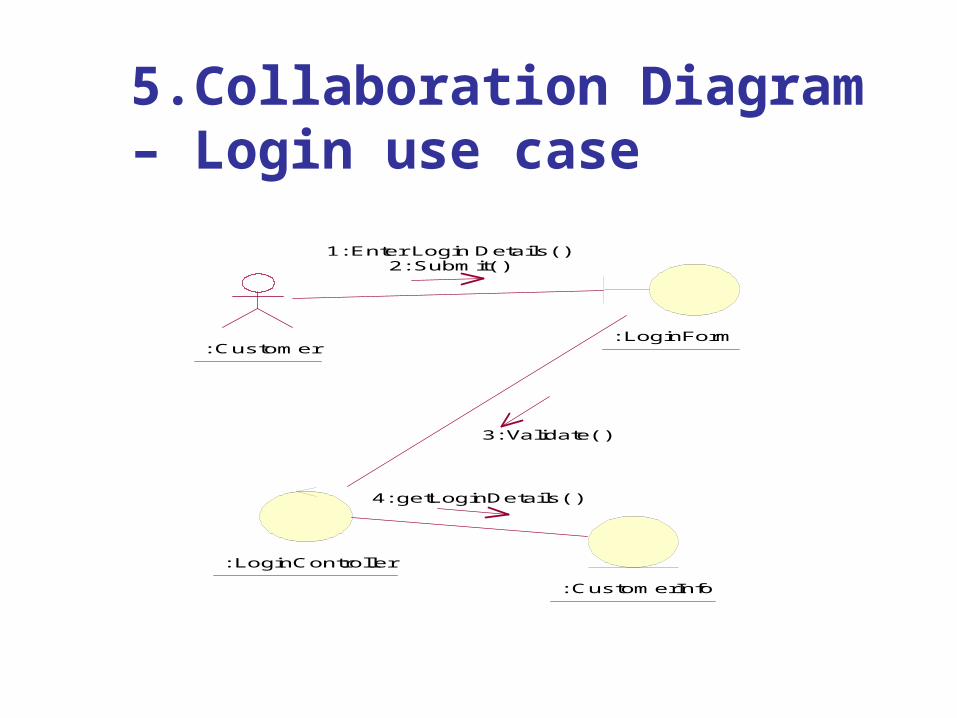
5.Collaboration Diagram – Login use case
: Customer : LoginForm
: LoginController
: CustomerInfo
1: Enter Login Details( )2: Submit( )
3: Validate( )
4: getLoginDetails( )

6. State Chart Diagram
It shows the sequence of states. A state is represented as a rounded
box, which may contain one or more compartments.
Name compartment holds the name of the state.
Internal transition compartment list of actions / activities
Start & end states
7.Component Diagram It shows relationship between the
components in the system.
A component may be a software component [for (e.g.) a.h file in C++ (or) a .java file in Java], a run time component [for (e.g.) a.DLL file]
8. Deployment Diagram It shows the configuration of run
time processing elements & the software components, processes & objects that live in them.
It shows the nodes in the system & the connections between them.
Review Name the 2 benefits of visual modeling. What is UML? Name three UML diagrams. What are the elements of a use-case
diagram? Define a use case. Define an actor. What is meant by a relationship?

Module Summary Visual modeling
1. The interaction of your application with the outside world (use case diagram)
2. Visualize object interaction (sequence & collaboration diagrams)
3. The structure of your system (class diagram)4. View the system architecture by looking at
the defined package.5. The components in your system (component
diagram)

Module Summary UML
The UML is a graphical / standard language for visualizing, specifying, constructing & documenting the artifacts of a software system.

Module Summary You can model the following 8 UML
diagrams in Rational Rose. 1. Use case diagram2. Activity diagram3. Sequence diagram4. Collaboration diagram5. Class diagram6. State chart diagram7. Component diagram8. Deployment diagram

Views and Diagrams in Rational Rose
What is model?A model is a simplification of reality or the blueprint of the system.
What is view?A view is a perspective of the model (ie)
meaningful to specific stakeholders.
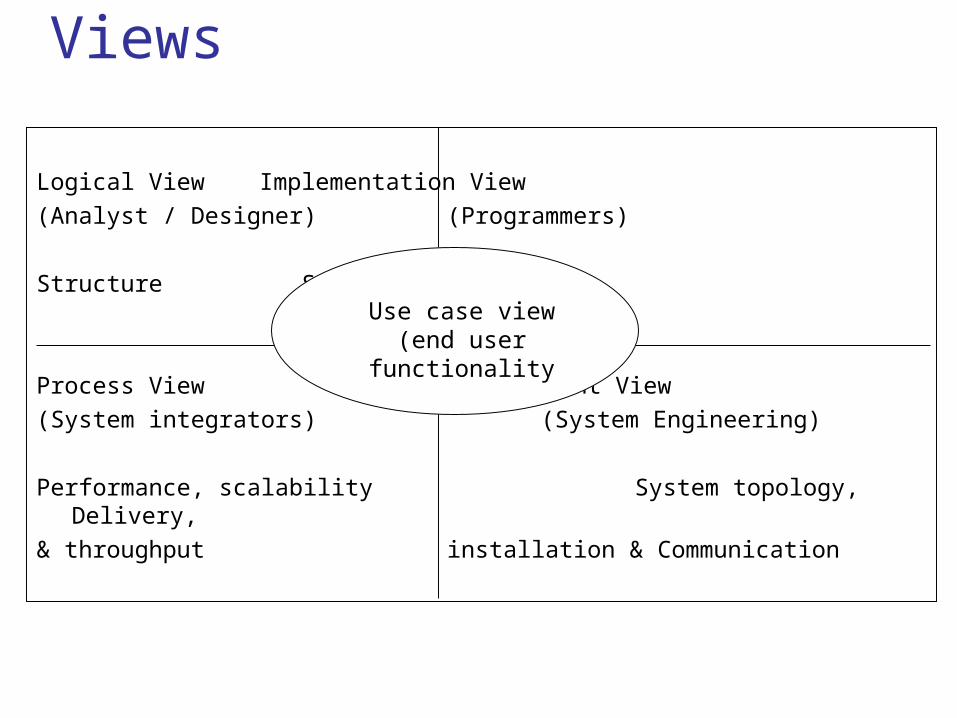
Views
Logical View Implementation View(Analyst / Designer) (Programmers)
Structure Software Management
Process View Deployment View(System integrators) (System Engineering)
Performance, scalability System topology, Delivery,
& throughput installation & Communication
Use case view (end user functionality

Views
In Rose, you can create the following views
1. Use-case view2. Logical view 3. Process view4. Component view (Implementation view)5. Deployment view
These views together create what we call the 4+1 Architectural View
Use Case View
It specifies WHAT the system should do?
Servers as a contract between customer and developer.
Essential to analysis, design and test activities.

Logical View It supports the functional
requirements of the system.
It includes use-case realizations, class and interaction diagrams.
It can also include state chart and activity diagrams.
Process View Addresses the performance,
scalability and throughput of the system.
Is not necessary for a single Processing environment.

Component / Implementation View Addresses issues of ease of
development, management of software assets, reuse & etc.

Deployment View Addresses issues like deployment,
installation and performance.
.Used for distributed system only.

Rational Rose Interface It includes the following :
Browser Diagram window Diagram toolbar Documentation window Log window Options window
The options window is not technically part of the rose interface. However, it is important in your initial setup.

The Browser The browser allow you to
textually view and navigate the views and diagrams in rational rose.
Display the elements that you have modeled. if an element doesn’t appear in the browser, it not a part of your modeled system.

Diagram window The diagram window allows you to
create and update graphical views of the current model.

Diagram Toolbar The diagram toolbar
includes the elements to build a diagram.
Each diagrams toolbar unique to that diagram.
It is active only when the diagram is displayed.
Documentation window Used to create, view or modify text
that explains a selected item within a diagram.
Log window Reports progress, result and errors. For (e.g.) code generation commands
post progress and error messages to this window.
To display log window, go to View menu, click LOG to show or hide the window.
To clear the contents of log window, click CLEAR LOG.

Options window Used to set all of your default for
modeling.
Note that if you change default, existing model elements are not changed.

Basic tool techniques There are two basic tool
techniques we will discuss before you begin the labs. They are
1. Deleting diagram elements 2. Adding diagram elements

Deleting diagram elements
What happens when you delete an element from the browser? Rose does the following.
Removes the selected elements from the model
Removes all icons representing the elements from all diagrams on which they appear.
Delete the specification for the element .
There are three ways to delete an element.
1. Click the element in the diagram and then press ctrl-D
2. Right click the element in browser, and then click delete
3. Click the element in the browser or diagram. From the edit menu, click delete from model.
Deleting Diagram Elements

Adding diagram elements
How do you add diagram elements? You add elements to a diagram from
either the diagram tool bar or browser.
Review What are views? Name a view in rose and discuss
its purpose. Name two feature of the rose
interface Discuss deleting from the browser
versus the diagram.
Module Summary Rational Rose uses views & diagrams
to depict varying perspectives and a system’s parts.
There are 5 views in Rational Rose :1. Use case view2. Logical view3. Process view 4. Component / implementation view5. Deployment view

Module Summary Diagrams are a graphical means to view
a system’s parts. The browser shows all of your model
elements Diagram window is to create a view Diagram toolbar includes the elements
to build a diagram. Documentation window is used to
create, view or modify text that explains a selected item within a diagram.

Log window reports progress, results & errors.
Option window allows you to set your defaults.
Deleting diagram elements ctrl D, DEL key (or) go to edit menu, click DELETE FROM MODEL.
Adding diagram elements click the element & then click in the diagram window.
Module Summary

Thank You!