Understanding the Impact of Accountability Reform on Public
Employee Attitudes: The Case of No Child Left Behind
Jason A. Grissom
Harry S Truman School of Public Affairs
University of Missouri
Sean Nicholson‐Crotty
Department of Political Science and
Harry S Truman School of Public Affairs
University of Missouri
James R. Harrington
Harry S Truman School of Public Affairs
University of Missouri

1
Over the past three decades, reforms targeted at improving government performance,
accountability, transparency, and customer orientation—sometimes grouped under the moniker
of New Public Management (NPM)—have been implemented in public organizations delivering
all type of services across all levels of government. There is at times disagreement about the
exact reforms that make up NPM or about its continued relevance. Some suggest that
―performance management‖ may have survived as the dominant element in this basket of
reforms and taken its place as the central tenet of modern governance (Kettl and Kelman 2007).
Whatever the name, however, it is widely accepted that performance or results-oriented
management practices that stress employee accountability and borrow tools from the private
sector to incentivize production have come to dominate administrative reform (see Moynihan
2008).
The performance payoffs of these reforms have received considerable scholarly attention
and the findings have been, not unexpectedly, mixed (see for example, Thompson and Rainey
2003; Moynihan and Pandey 2005; Dubnick 2005; Fredrickson 2006). As these reforms have
taken hold in more organizations, and affected more employees, scholars have begun to expand
this exploration to the impact on the attitudes of public workers. While early proponents of NPM
style reforms suggested that they would increase satisfaction, empowerment, and commitment
among public employees (Barzelay 1992; Osborne and Gaebler 1992), the empirical evidence
has been a decidedly mixed bag. Some reforms have been shown to negatively impact public
employee attitudes (e.g., Korunga et al. 2003), while others have been found to be positively
related to satisfaction (e.g., Lee et al. 2006). In some cases, authors have found positive and
negative effects in the same study (Yang and Kassekert 2006). Given that the debate over the
utility and appropriateness of many of these reforms is ongoing, understanding their impact on

2
employee satisfaction and commitment is of significant import to scholars, managers, and
policymakers.
We hope to contribute to this enterprise in this project. We endeavor to show that a
prominent model of job stress from the private sector can be used, following some adaptations to
the unique values of public workers, to predict the impact that performance based reforms will
have on satisfaction among those employees. Specifically, we adapt the Demand, Control,
Support (DCS) model (Krasek and Theorell 1990), which has recently been applied to attitudes
in the public sector (Noblett and Rodwell 2009), to include job security, which has been shown
to be an important predictor of public employee attitudes (Lim 1996). We propose that the
impact of reform on more generalized attitudes like satisfaction should be a function of the sum
of its impacts on an important set of antecedents; an impact that we expect will be moderated by
the effectiveness of the public employee’s manager. We test the utility of that framework in an
examination of the impact of No Child Left Behind—arguably one of the most ambitious
performance based accountability reform ever implemented in this country—on teacher attitudes.
The results suggest that the adapted DCS model may offers a powerful tool for explaining, and
disentangling the components of, the often disparate impact of performance reforms on public
employee attitudes.
Literature on the Impact of Performance Reforms on Employee Attitudes
With the widespread adoption of private sector management practices in public
organizations, often grouped loosely under the names ―New Public Management‖ or
―Performance Based Accountability,‖ scholars have become increasingly interested in the impact
that these reforms have on public employees. This growing literature has investigated the impact
of managing for results, accountability standards, pay-banding, at-will employment and other
3
common NPM reforms on the stress and satisfaction of those working in the public sector.
Interestingly, however, this research has arrived at divergent conclusions regarding that impact.
One body of scholarship has suggested a negative relationship. Authors have found a link
between these reforms and levels of public employee stress (Korunka et al. 2003; Exworthy and
Halford 1999). Work has also suggested that emphases on efficiency and accountability decrease
employee satisfaction (Mikkelsen, Osgard, and Lovrich 2000) and that reforms which emphasize
extrinsic rather than intrinsic rewards may result in reduced levels of organizational commitment
(Young, Worchel, and Woehr 1998; Foster and Wilding 2000). Finally, New Public Management
reforms have been shown to erode professional values among public servants (Pollitt and
Bouckaert 2000; Powell, Brock, and Hinings 1999) and workplace trust (Battaglio and Condrey
2009).
Alternatively, another body of work suggests a positive, or at least more complicated,
relationship between NPM style reforms and employee attitudes in the public service. Yang and
Kaessekert (2006) find that contracting out and the erosion of civil service protections reduce
satisfaction, but that performance-based accountability, pay-for-performance, and
―innovativeness culture‖ can actually produce improvements in public employee satisfaction
(Yang and Kassekert 2006). Lee et al. (2006) find that pay-for-performance schemes are
regularly associated with increased satisfaction in the federal civil service in more than three
decades worth of surveys. Finally, Bertelli (2007) finds that performance-based incentives can
reduce stated turnover intention among some federal employees. Specifically, he finds that
supervisory-level employees who are subject to pay-banding respond positively (i.e., have lower
stated turnover intention) to timely performance incentives, though perceived accountability does
not influence turnover intention. Alternatively, among nonsupervisory personnel, being held
4
accountable for results significantly increases the likelihood that they will state an intention to
leave.
Understanding and Managing the Impact of Performance Reforms
The literature reviewed thus far suggests that performance or accountability focused
reforms, though often bundled together by both scholars and policymakers, can have differential
effects on public employees’ psychological health, job satisfaction, and turnover intention. This
section draws on and expands a theoretical model from the private sector management literature
that has recently been applied to public organizations in order to construct a framework that will
generate predictions about the direction of a reform’s impact on public employees.
In recent years, scholars have applied a number of models from the private management
and occupational health literatures in order to better understand the mechanisms by which
organizational reforms impact the attitudes of public employees (see for example Noblett and
Rowdell 2009). Among the most commonly applied of these has been the Demand-Control-
Support, or Job-Strain, model (Krasek 1979; Krasek and Theorell 1990). The model
hypothesizes an interactive relationship between the demands placed on an individual by her job,
the level of decision making authority that she feels she has, and the support that she receives
from supervisors and coworkers (see van der Doef & Maes 1999 for a review). It predicts high
strain, and the negative psychological consequences that accompany it (e.g. stress, low
satisfaction), when the demands of a job exceed the control and support necessary to meet those
demands. The model has received widespread support in research on private organizations and is
among the most commonly used theoretical approaches in occupational stress research (Fox et al.
1993).
5
The justification for applying this model in the public sector is typically the
organizational change wrought by New Public Management. Scholars suggest that the imposition
of external accountability standards and the new performance-oriented culture, along with the
dwindling or static resources that often accompany NPM reforms, have placed much greater
demands on, and intensified the work of, public employees (Korunga et al. 2003; Schafer and
Toy 1999). They also assume that, despite the rhetoric of decentralization, NPM reforms often
do little to increase the actual decision making authority of line employees and may actually
decrease control by giving more power to external stakeholders (Dixon, Kouzmin, and Korac-
Kakabadse 1998; Hood 1991). While these are reasonable assertions and provide an intuitive
justification for the application of the DCS to public organizations, there has been little empirical
evidence generated regarding the actual impact of NPM style reforms on demand, control, or
support.
Nonetheless, scholars have found some evidence for elements the DCS model in public
organizations that have undergone NPM-style reforms. Noblett et al. (2005) find that job control
and supervisor support have a significant impact on psychological health, satisfaction, and
organizational commitment in what they describe as a ―commercially-oriented‖ public
organization. Similarly, Noblett and Rowdell (2009) find that for police officers in a
metropolitan department that had undergone NPM-style reforms, demands, perceived control,
and support from supervisors influence intrinsic satisfaction, extrinsic satisfaction, and a more
generalized sense of well-being. They did not, however, find an interactive relationship between
these variables. In a more ―customer‖ oriented bureau that included numerous occupational
categories, they found that higher demands reduced extrinsic satisfaction and well-being, higher
control increased intrinsic and extrinsic satisfaction, and supervisor support improved all three.
6
Again, however, they did not find evidence that supervisor support moderates either demand or
control.
Before moving on the ways in which we believe the DCS model can be used to generate
predictions about the impact of performance and accountability reforms on public employee
well-being, we believe that a component needs to be added to that model. While it is reasonable
to expect—as have scholars applying the model—that task demands, sufficient decision
authority, and support from supervisors and coworkers will be key factors in determining public
sector employees’ psychological well-being, there are some additional dimensions that may
contribute to stress among these workers.
The most studied difference between public and private employees is public service
motivation. Research suggests that individuals who choose to go into the public workforce value
the production of public goods or the protection of the public interest to a greater degree than
those who select into private sector employment (Rainey 1982; Perry and Wise 1990; Brewer
2008). It is reasonable to expect then that task demands that are contrary to the public good will
create stress in a public employee who is unable to resolve the conflict. Indeed, the literature on
whistleblowers suggests that this tension is, in part, what motivates individuals to go outside of
traditional lines of authority to change the direction of their organizations (Brewer and Selden
1998). Systematic violations of employees’ public service ethic by the demands made on them
should be, we believe, relatively rare (though see O’Leary 2005) as government agencies are
most often dedicated to furthering the public good. Therefore, we do not treat violations of the
public service ethic as a potential source of public employee stress in our framework.
The other value that we know public sector workers elevate more than their private
counterparts is job security. A long line of research in economics suggests that, all else being

7
equal, those who choose to work for government are more risk adverse than those who select
private firms (see for example Bellante and Link 1981). While work in public affairs has
demonstrated that these differences do not always translate into risk tolerance at the
organizational level (Bozeman and Kingsley 1998) it has confirmed that, at the individual level,
public employees value job security considerably more than their private sector counterparts
(Houston 2000). Unlike the public service ethic, job security is something that can be
systematically threatened by changes to the organizations or systems in which public employees
work. Indeed, reforms enacted in states such as Georgia and Florida and under consideration in
others (e.g., Wisconsin, Kansas, and Ohio) have done so across the board by ending civil service
protections for new hires. Other reforms threaten security for individuals by downsizing
agencies, tying wages or advancement to performance, or allowing for the reorganization of
entire public organizations if they fail to meet performance targets.
Research on public organizations confirms that reduced jobs security is, in part,
responsible for the increase in job stress among public sector employees following the
widespread adoption of NPM-style reforms (VanWart and Berman 1999; Golembewski 1996).
Recent work also suggests that lack of security arising from downsizing within an individual’s
organization produces stress that can, under certain circumstances, impede reform efforts
(Kelman 2006). Thus, we suggest that, in addition to the task demands, the decision authority
necessary to meet those demands, and the level of social and supervisory support, the level of
perceived job security should be considered as a potentially important element in the production
of job stress for public employees.1
1 The actual use of demand, control, support, and security to predict employee stress would be challenging
because the theory suggests that these are interactive and a 4-way interaction is essentially impossible to interpret; though scholars do sometimes report primarily additive results from the model (Noblett and Rowdel 2009).

8
With this addition to the DCS model, we now turn to our framework for understanding
the diverse impacts of performance and accountability related reforms on public employee
satisfaction. If demand, control, social and supervisory support, and security are the component
elements of employee stress and satisfaction in the public service (see Noblett and Rowdel
2005), then the impact of any reform on these larger outcomes should be a function of the impact
of the reform on those component parts. We are particularly interested in the impact on demand,
control, social support, and security, because these are the variables that we believe are most
likely to be directly influenced by reform. We make this argument because what you are asked to
do as an employee will likely change as a result of the adoption of performance-oriented reforms
(see Korunga et al. 2003); the discretion you are afforded to accomplish those tasks may go up
(Osborne and Gaebler 1992) or become even more constrained (Brodkin 2011) depending on the
level to which decision-making is decentralized; scarce resources allocated according to
performance may erode relationships among coworkers who now view peers as competitors or
may bond them more tightly together as ―survivors‖ (Kellman 2006; Brockner et al. 2004); and,
finally, security is likely to be impacted by reforms that erode tenure or tie it to performance.
Alternatively, we view supervisor support as unlikely to be influenced by performance or
accountability reforms. The factors that influence whether an individual is an effective or
supportive leader are more likely to be individual characteristics such as empathy, skill, and
experience.
We do expect supervisor or manager behavior to moderate the impact of
performance/accountability reforms on demand, control, social support, and security. We make
this argument because of the considerable evidence that this moderating role is a key component
of what managers do. Working within the structure of the organization, they influence the ways

9
in which inputs influence employees and, ultimately, are converted by those employees into
outputs (Lynn et al. 1999). Even more germane to our investigation, they make decisions that
buffer the organization and its employees from environmental shocks and moderate the impact of
environmental changes on the attitudes of individuals within the organization (Fredrickson 1999;
Kam and Franzese 2007).
There is considerable anecdotal and descriptive evidence that some managers are better at
these tasks than others (Doig and Hargrove 1987; Holzer and Callahan 1998; Thompson and
Jones 1994). There is also mounting empirical evidence that higher quality managers have a
direct positive impact on employee behavior and organizational performance (Grissom 2011;
Meier and O’Toole 2002; Meier et al. 2007). Research is also beginning to demonstrate that
managerial effectiveness moderates the impact of other managerial activities on performance
(Hicklin et al. 2008; Grissom 2011).
Based on this research, we expect that more effective public managers will positively
moderate the impact of performance and accountability reforms on the task demands, decision
authority, social support, and job security of employees. Taking job control as an example, if a
reform, on average, decreases control it will do so less for employs who work for a highly
effective manager. Alternatively, if the reform increases decision authority then that increase will
grow even larger as managerial effectiveness increases. To put this another way, we expect that
outcomes for an employee affected by a reform will improve (i.e., lower demands, more control,
more social support, more security) as their manager becomes more effective.
Thus, we focus on task demands, decision authority, social support, and job security as
the key antecedents of job stress that will be influenced by performance and accountability
reforms and the interaction of those reforms with managerial effectiveness. We expect that the
10
sum of the impact of a reform across these factors explains its impact on more general employee
attitudes such as job satisfaction and organizational commitment. So, if a new performance
measurement system increases the reporting burden for the employees of an organization but is
not accompanied by discretion in time allocation to meet those new demands, does not produce
any solidary benefits among employees, and has no bearing on job security, then we would
expect a negative impact on satisfaction. If it increased reporting requirements, left discretion
and security unchanged, but fostered a cut-throat work environment among employees who
undercut one another to bolster their own performance reports, we would expect a larger
negative impact on satisfaction.
Alternatively, we might envision scenarios where performance rewarding schemes were
associated with improvements in satisfaction. These improvements might come about if security,
social support, and task demands stayed largely the same but managers now afforded employees
more discretion in accomplishing duties, so long as they met performance goals. If the new
performance culture also encouraged more team production, which increased solidarity among
previously isolated coworkers, then we would expect an even greater association between a
reform and the satisfaction of employees affected by it.
Finally, we believe that in the most likely outcome, reforms might improve one of the
dimensions discussed above while negatively affecting others. So, to take a reform that has been
widely adopted throughout the public sector, Managing for Results (MFR) might increase the
time employees must spend recording and reporting activities to superiors, but, it has been
suggested, will also reduce the red-tape and bureaucratic constraints that reduce employee
autonomy (Barzelay 1992). In this case, the impact of the reform on overall levels of satisfaction
or commitment will be a function of the relative impact that it has on these two subcomponents.

11
If the employee perceives MFR to increases demands only slightly but thinks that it has
significantly improved control, then the effect on satisfaction should be positive. If the size of
those impacts is reversed, then we would expect employee satisfaction to go down as a result of
the reform.
Examining the Impact of No Child Left Behind on Teacher Attitudes
We test the utility of the framework developed above in an analysis of No Child Left
Behind (NCLB) and its impact teacher attitudes. NCLB is arguably one of the largest
performance-based accountability reforms ever implemented in this country, affecting more than
16,000 public organizations. The legislation, which took effect in the 2002-2003 school year,
compelled states to set standards, conduct annual evaluations of student performance linked to
those standards, and to sanction schools that fail to make ―adequate yearly progress‖ toward
meeting them. The sanctions mandated by the law are tied to the continued receipt of Title I
funds and are relatively draconian. If a school fails to make AYP two years in a row, districts
must offer students in that school the opportunity to attend another school and pay the
transportation costs. If the school misses the mark 4 years in a row, it must make ―fundamental‖
staffing and structural changes to address the problem. After a sufficient number of failing years,
the management of the school can be handed over to a private company or the state or the
organization can be reorganized as a charter school.
Limited evidence is beginning to accumulate regarding the impact of these reforms on the
operation and performance of schools and the attitudes of teachers. Dee and Jacob (2010) find
that the policy increased per-student expenditures and the educational qualifications of teachers.
They also find that it caused a reallocation of teaching time toward tested subjects like reading
and away from unmeasured outcomes such as social studies and science. Dee and Jacob (2011)
12
demonstrate that the implementation of the policy has increased average 4th
grade math scores
and 8th
grade scores among traditionally low achieving students on the National Assessment of
Educational Progress. In interviews with teachers in three states, Hamilton et al. (2007) find that
teacher’s felt an increased sense of autonomy. Reback et al. (2011) find lower reported levels of
job security in schools that were close their state’s performance threshold and, thus, in the
greatest danger of failing to make AYP.
Because it sets clear performance standards, mandates meaningful standards for
organizations that fail to meet them, and has affected hundreds of thousands of line bureaucrats
across the country, NCLB implementation is an ideal arena in which to examine the utility of the
framework outlined above. We first use a cross-sectional time-series design to model task
demands, job control, social support, and job security before and after the implementation of
NCLB, allowing principal effectiveness to moderate the impact of the policy. We then take a
more sophisticated approach, modeling the differential impact of NCLB on demand, control,
support, and security in states that had no preexisting state-level accountability systems (treated)
and those that had such systems (untreated) and examine the moderating impact of principal
effectiveness on the policy’s impact in treated states. Finally, we use the results from these
models to predict the impact of NCLB on a more general measure of teacher satisfaction and use
a mediating variables analysis to show the degree to which that impact is actually a function of
its impact on demand, control, support, and security.
Data and Methods
For this study, we built a cross-sectional time series of data on teachers, principals, and
schools spanning four waves of the Schools and Staffing Survey (SASS). SASS is a nationally
representative survey of public school personnel collected approximately every four years. The
13
four waves we utilize were collected during the 1993-94, 1999-2000, 2003-04, and 2007-08
academic years, which means that we have data on two time points prior to the date that No
Child Left Behind took effect and two time points afterward. Throughout the remainder of the
paper we will refer to the survey years by year corresponding to the second year in the survey
wave (i.e., 1993-94 will be ―1994‖).
In selected SASS schools, survey data are collected from the principal and from multiple
randomly selected teachers on such topics as school organization, professional development, and
perceptions of the school climate. Demographic, experience, and educational background data
also are collected. Unique respondent identifiers make teacher responses linkable to their
principals and information on the schools in which they work. Pooling the data across years, we
utilize data on approximately 150,000 teachers. Survey weights are used in all analysis to
account for the complex sampling strategy SASS employs.
Dependent Variables. The primary constructs for which we aim to examine the impact of
No Child Left Behind are demand, control, job support, job security, and job satisfaction. We
measure each at the teacher level using items from the SASS teacher questionnaires. Our
measure of demand is total weekly hours worked, measured as a teacher’s estimate of how many
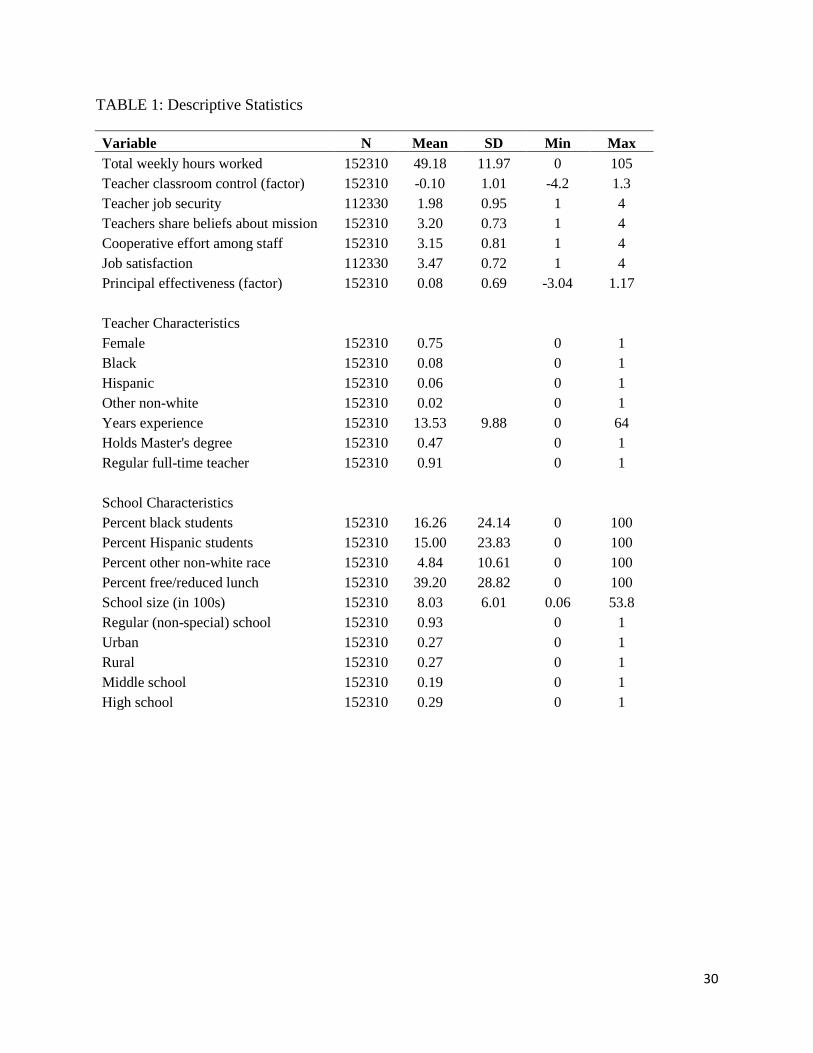
hours he or she works on all teaching-related duties during a typical week.2 As shown in Table 1,
the mean across years is approximately 49 hours per week.
To capture control, we make use of six items asked in each SASS wave that ask teachers
how much control they feel they exercise in their own classrooms over: selecting textbooks and
2 The questions concerning this variable vary somewhat across SASS waves. In 1994 and 2000, we created this total
from a composite of three questions which asked respondents how many hours they were required to work each week during school hours, how many hours they spend on student interactions outside of school, and how much other time they spent. In 2004 and 2008, they were simply asked to estimate their total hours worked in a typical week. We cannot rule out the possibility that differences in answers between the two sets of years are not due in part to differences in question wording.

14
materials; selecting content, topics and skills to be taught; selecting teaching techniques;
evaluating students; disciplining students; and determining the amount of homework to be
assigned. The scale for each item ranges from ―No control‖ to ―Complete control,‖3 though the
number of points in the scale varies across years. To equate the scales, we converted each one to
a three-point scale for no control, some control, and complete control. Polychoric factor analysis
on the converted items revealed one underlying control factor (Eigenvalue = 3.7), which
Cronbach’s α suggested to have a relatively high degree of reliability (α = 0.78). Factor scores
were used to assign a single control measure to each teacher and then standardized across
observations to facilitate interpretation.
Job support is captured using two items: ―Most of my colleagues share my beliefs and
values about what the central mission of the school should be,‖ and ―There is a great deal of
cooperative effort among staff members.‖ Teachers were asked to respond to each of these
statements using a 4-point Likert scale (strongly disagree, somewhat disagree, somewhat agree,
strongly disagree) each year. Factor testing revealed that these two measures could not be
reasonably combined into one scale,4 so we chose to model each variable separately.
Our measure of job security comes from teachers’ Likert scale responses to the item: ―I
worry about the security of my job because of the performance of my students on state or local
tests.‖ This item was not included on the 1994 survey. A higher value of this variable indicates
greater feelings of job insecurity.
Finally, we measure job satisfaction with the Likert response to: ―I am generally satisfied
with being a teacher at this school.‖ Teachers are quite satisfied in generally, averaging 3.47 of 4
points across years.
3 In 2004 and 2008, the range was “No control” to “A great deal of control.”
4 Kaiser-Meyer-Olkin Measure of Sampling Adequacy = 0.5. Eigenvalue = 0.79.

15
Independent Variables. Our primary interest is the impact of No Child Left Behind. We
operationalize an indicator variable for NCLB that is set equal to 0 prior to the law’s
implementation and 1 afterward. Given that the first academic year that the law went into effect
was 2002-03, we count the 2004 and 2008 SASS years as being subject to NCLB and the prior
years as not. As an additional step toward identifying the causal impact of NCLB, we also utilize
information on which states had implemented consequentialist accountability systems prior to
NCLB. We code this binary variable using information contained in Hanushek and Raymond
(2005) and Dee and Jacob (2011).5
Additionally, we are interested in the potential moderating impact of management
effectiveness on the effects of NCLB on teacher outcomes. Since principals are teachers direct
supervisors, we measure their effectiveness using a combination of items from the teacher
survey. In particular we make use of four items: (1) My principal enforces school rules for
student conduct and backs me up when I need it, (2) My principal knows what kind of school
he/she wants and has communicated it to the staff, (3) In this school, staff members are
recognized for a job well done, and (4) The school administration’s behavior toward the staff is
supportive and encouraging. Polychoric factor analysis revealed one underlying factor for these
four items (Eigenvalue = 3.0, Cronbach’s α = 0.83), which we label principal effectiveness.
These measures were then standardized across teachers. A similar approach to measuring this
same construct using SASS has been taken in previous work (e.g., Grissom, 2011; Grissom, in
press). We then use the factor scoring method to assign a value to each teacher. To combat
common source bias in our estimates of the impact of principal effectiveness, we take the
5 In some cases, Dee and Jacob’s (2011) rendering of the year in which a state had implemented consequentialist
accountability differed from Hanushek and Raymond’s (2005). In these cases, we followed Dee and Jacob’s coding.
16
additional step of replacing each teacher’s value with the average of value of all of the other
teachers in the school.6
Control Variables. To increase the precision of our estimates in the regression models
that follow, we included a number of control variables obtained from the SASS data. At the
teacher level, these included indicators for being female, black, Hispanic, and other nonwhite
race, plus total teaching experience. We also included an indicator for holding a Master’s degree
and for being a regular full-time teacher. At the school level, we included the percentage of
students who were black, Hispanic, and other nonwhite race. We also included the percentage of
students receiving free or reduced price lunch, a measure of student poverty. We also included
school enrollment and enrollment squared, plus indicators for being a regular (non-specialized)
school, urban and rural location (suburban omitted), and school level (middle or high, with
elementary omitted).
Regression Models. We run a series of four models for each dependent variable. The
most basic model takes the following form:
In this model, β1 captures any difference in the level of the outcome variable Y associated with
the two time periods following the passage of NCLB. The vectors T, P, and S include control
variables at the teacher, principal, and school level, respectively. Principal effectiveness is
included among these variables in all models. represents a state fixed effect. is a linear time
trend, defined from the year 1990 (before any state had implemented state accountability)
forward.
6 This averaging reduced the standard deviation in the measures, which is why the standard deviation shown in
Table 1 is lower than 1.

17
In this basic model, will capture the mean shift in the outcome variable, controlling for
other factors, between the pre-NCLB and post-NCLB years. However, we may be concerned that
this coefficient will capture not only the effect of NCLB but also the effects of other unobserved
changes that occurred in education across these same time periods. Fortunately, Dee and Jacob
(2010) outline a comparative interrupted time series method that provides additional evidence on
the causal impact of NCLB. This method relies on the assumption that the effects of NCLB will
be stronger in states who did not have pre-existing consequentialist school accountability
systems when NCLB was implemented. For example, NCLB conceivably had a greater impact
on teachers’ feelings of job security in Idaho, which did not link consequences to student
performance prior to NCLB, than in Texas or North Carolina, both of which put strong
accountability systems in place during the mid-1990s.
Thus, we run a second set of models that add the interaction between NCLB and No prior
accountability to each model, where no prior accountability is set equal to 1 for any state who
had not implemented a consequentialist accountability system prior to 2002. A significant
coefficient on this interaction term in the same direction as the sign on the NCLB variable can be
viewed as additional evidence of a causal impact of NCLB on the outcome variable of interest.7
To examine the potential moderating impact of principal effectiveness on NCLB, our third model
drops the interaction between NCLB and prior accountability and adds an interaction between
the principal effectiveness factor and NCLB. In the fourth model, we include both interactions,
plus the three-way interaction between NCLB, prior accountability and principal effectiveness.
This three-way interaction term tests for a differential impact of principal effectiveness after
7 Note that the “main effect” of No prior accountability falls out of the models because it is subsumed by the state
fixed effect.
18
NCLB in the states that had no prior accountability relative to the ones that already had those
systems.
Findings and Discussion
Demand, Control, Support, and Security. The first 4 columns of Table 1 present the
results from the model of the impact of No Child Left Behind on hours worked, which is our
measure of task demands. The first 3 columns show a model with simply No Child Left Behind,
then No Child Left Behind interacted with No Prior Accountability, and then No Child Left
Behind interacted with Principal Effectiveness. These are models are primarily illustrative and
included to show the stability of the results as variables are added to the model. The model in
Column 4 contains all the measures mentioned above as well as the three-way interaction
between NCLB, No Prior Accountability (NPA), and Principal Effectiveness. This is the fully
specified model and the one that will be the focus of the discussion. As noted above, all models
contain an extensive set of control variables, but in the interest of brevity we will limit the
discussion to a small set of these and the key independent variables.
The time trend in the full model of demand is positive and significant, suggesting that
over time teachers have generally been working more. Even controlling for that trend, however,
we observe a positive impact of NCLB on hours worked. On average, teachers worked almost 2
hours more each week after the implementation of the reform in 2002-2003. The policy is
associated with a 0.16 standard deviation shift in the dependent variable. Those were the only
variables of interest that had significant impact in the model of hours worked. The nonsignificant
interaction of NCLB and the measure of No Prior Accountability (NPA) suggests that there was
not a differential impact of the policy in states that did and did not have their own consequential
performance based accountability regime prior to No Child Left Behind. Similarly, we did not
19
observe a significant impact of principal effectiveness or the interaction of effectiveness with
NCLB. This suggests that management behavior did not have a direct effect on hours worked or
moderate the impact of No Child Left Behind on that variable. Finally, the three-way interaction
between Principal Effectiveness, NCLB, and NPA was also insignificant suggesting no
differential impact between management’s effect on the impact of the reform in states that did
and did not have accountability systems prior to the implementation of the federal law.
The final 4 columns of Table 2 contain the models of teachers’ perceived control over
their jobs. Again, the final model (column 8) is fully specified and the one which we will
interpret. In this case the time trend is negative and significant, suggesting that teachers have
generally felt a loss of control over the last 15 years. Alternatively, the implementation of No
Child Left Behind correlates positively with perceived control. The coefficient suggests a half
standard deviation increase in control in the average state following the reform, which represents
a substantively meaningful impact. The interaction between NCLB and NPA is significant and
positive, indicating that the federal law increased perceived control to a greater degree in states
that did not have performance based accountability systems prior to 2002. The increase in the
effect in these states is approximately 10%.
The management variables also emerge as significant in this model. The main effect for
the principal effectiveness measure is positive and significant, suggesting that teachers feel they
have greater control in schools with more effective managers. Similarly, the interaction between
effectiveness and No Child Left Behind is also positive and significant. This indicates that the
positive effect of this reform on perceived control is dependent in part on the effectiveness of a
teacher’s principal. At the lowest level of effectiveness, NCLB increased control by only .32
standard deviations, while in schools with the most effective manager, teachers reported a .57
20
standard deviation increase The three-way interaction between Effectiveness, NCLB, and NPA is
not statistically significant, indicating that having no state-level accountability system in place
prior to NCLB did not change the degree to which effective managers moderated the impact of
that policy.
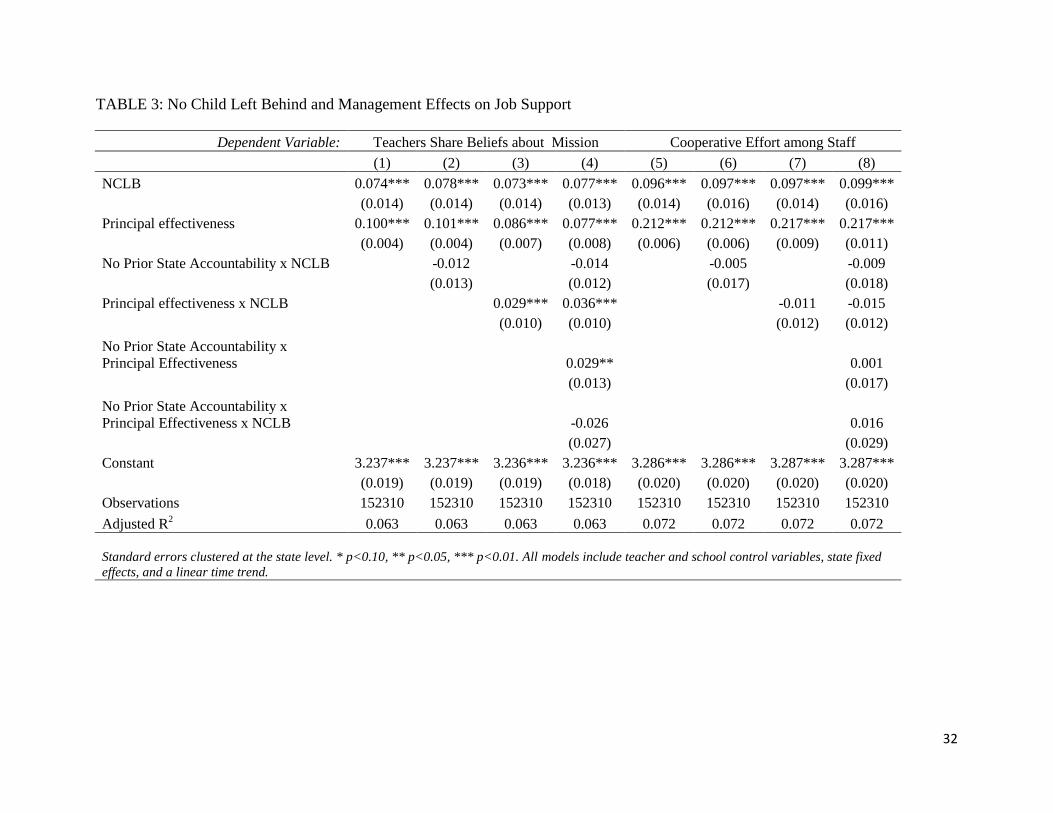
Table 3 presents results from our models of social support. As noted above, there were
only two good measures of support in our data, so we treat them separately because it is
inappropriate to factor analyze these two variables. Again, we will focus the discussion on the
fully specified models in Columns 4 and 8. No Child Left Behind has a positive and significant
impact on sense of shared mission and on the perception of cooperation among school staff. The
implementation of that policy is associated with approximately a 0.1-s.d. shift in each measure.
The interaction between NCLB and NPA is not significant in either equation, suggesting that the
lack of a state-level accountability system prior to NCLB did not increase the impact of that
reform on our measures of social support.
Management appears to have a direct, but not a moderating impact on social support. The
measure of principal effectiveness is positive and significant, suggesting a .4-s.d. shift in the
sense of shared mission and a 1-sd shift in perceived cooperation across the range of the
principal effectiveness measure. Neither the interaction between NCLB and Principal
Effectiveness nor the 3-way interaction were significant in either model suggesting that
management does not moderate the effect of NCLB on social support, either on average or in
states that did have prior accountability systems.
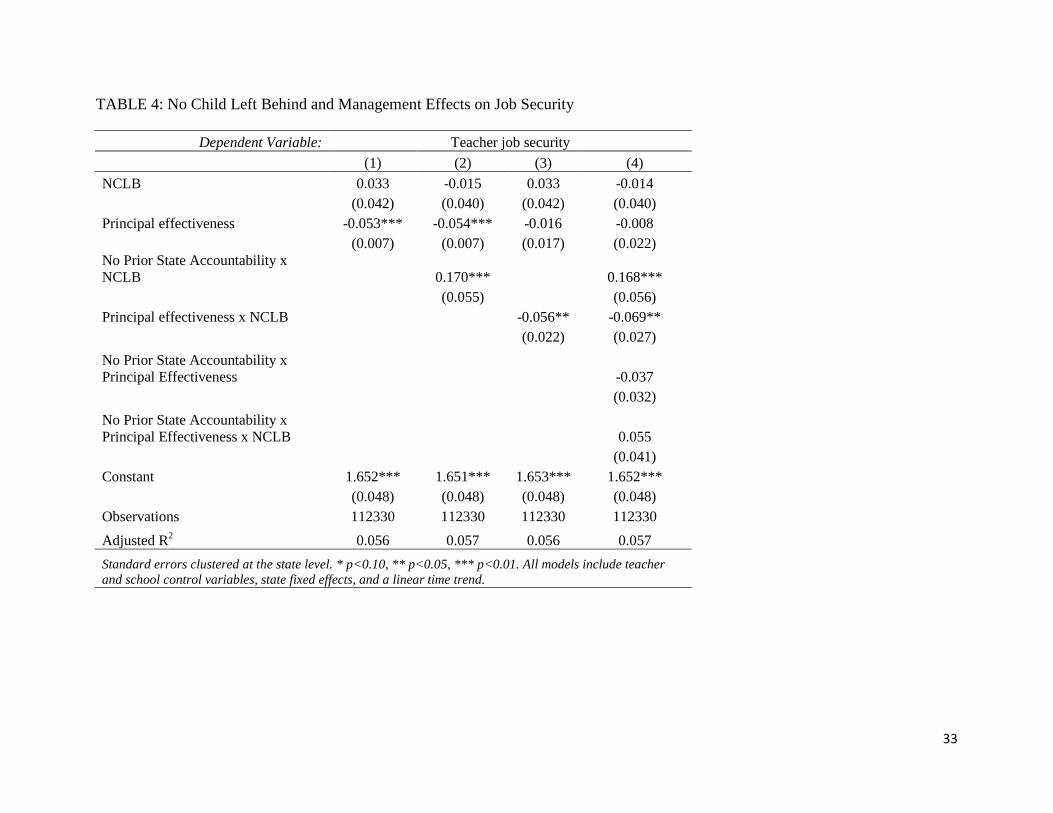
Finally, Table 4 contains the models predicting job security. It is important to remember
that this is actually a measure of insecurity with higher values reflecting increased concern about
tenure. In this case NCLB did not have a significant effect on the dependent variable in the
21
average state. However, the significant interaction between NCLB and NPA suggests that the
implementation of the federal policy did significantly increase insecurity in those states that did
not have a state-level accountability system prior to 2002. The coefficient on the interaction term
suggests that the implementation of the federal policy caused a .17-s.d. increase in insecurity in
those states. The management variables suggest that principal effectiveness does not have a
direct impact on perceived job security, but that it does moderate the impact of NCLB on that
variable. Indeed, at the lowest level of effectiveness, NCLB actually increased insecurity by .21-
s.d. Alternatively, in schools with the most effective principal, the reform decreased insecurity
by .07-s.d. The three-way interaction between NCLB, NPA, and Effectiveness in not significant,
indicating that managers do not have a differential moderating effect on the relationship between
NCLB and security depending on the existence of a prior accountability system.
Looking across the findings regarding the impact of NCLB on the predictors of job stress
and satisfaction, some patterns emerge. The policy is associated, in the average state, with
increased task demands, increased control, and improved perceptions of coworker support. We
have greater faith that the observed relationships are causal in the case of control and job
security, where our falsification test suggests that the policy had a greater impact in states that
did not have a consequential performance based accountability system in place before the
implementation of the federal law. All else equal, better management is associated with reports
of more class-room control among teachers and higher levels of perceived support. Principal
effectiveness also moderates the impact of No Child Left Behind on perceived control and job
security, with better managers increasing the impact on control and decreasing the effect on
insecurity. Principal effectiveness did not have a larger effect in states with no prior
accountability systems, but that is not unexpected. In fact, it is in those states where managers

22
had experience with these types of systems that we might expect them to be better at moderating
the impacts for employees.
Satisfaction. We have argued herein that these factors – demand, control, support, and
security – should help us to understand the impact of performance based accountability reforms
on general employee attitudes, such as job satisfaction. Specifically, we suggested that the
impact on satisfaction should be a function of the sum of impacts on these antecedents. So, if we
look across the average case in all models, we see that NCLB increased demands by .16-s.d., but
also increased perceived control by .5-s.d., and perceptions of shared mission and cooperation
among coworkers by .1-s.d. each. With other variables (particularly principal effectiveness) held
at their means, the federal policy did not have a significant impact on job security. Therefore,
based on the framework laid out above, we would expect No Child Left Behind to be associated
with a positive effect on satisfaction for the average teacher. Alternatively, if we focus on those
antecedents that had a larger impact in states with no prior accountability systems, we see that
the federal law increased control roughly the same amount that it decreased security. Thus, we
would expect to see no significant increase in satisfaction in states that did not have
performance-based accountability relative to other states.
The first column in Table 5 presents the model of teacher satisfaction. The results suggest
that the impact of reform on demand, control, support, and security do a good job of predicting
the impact on more general attitudes. For the average teacher, No Child Left Behind increased
satisfaction. Substantively, the coefficient suggests that the implementation of the policy
increased satisfaction by .1-s.d. Alternatively, and as the framework predicts, the NCLB did not
have a larger effect in states without prior accountability systems.

23
As an additional test of the validity of demand, control, support, and security as
antecedents of satisfaction, the second column of Table 5 presents the results from a mediating
variables analysis. If No Child Left Behind is affecting satisfaction through its impact on these
variables, then their inclusion in the same model should reduce the observed impact of NCLB.
The findings from the second model suggest that this is indeed the case. All of the mediating
variables have a significant impact on satisfaction. After their inclusion in the model, the
coefficient on NCLB not only shrinks, but actually becomes negative.
Conclusion
We began this essay with the observation that the literature was conflicted regarding the
impact of performance based accountability reforms on public employee well-being. We also
suggested that the application and adaption of a widely used job-stress model, along with the
recognition that effective managers can moderate the effects of external factors on employees,
could help to understand the varied impacts observed by scholars. We test the utility of the
model in an analysis of No Child Left Behind and its impact on teacher attitudes. The findings
invite three conclusions.
First, though it was not our primary purpose in this study, the results suggest some
conclusions regarding the impact of No Child Left Behind on teacher attitudes. We observe a
consistent association between the federal law and the perceptions of teachers regarding their
work environments. It correlates with slightly more hours worked, but also more perceived
control in the classroom and greater cooperation and shared vision among the teachers in a
school. We also see a correlation between the implementation of NCLB and increased job
satisfaction in the average teacher. We do not find strong evidence, however, that these observed
relationships are causal. This is not to say they are not. It simply means that we did not

24
consistently observe a larger impact for the policy in states that did not have similar
accountability regimes in place before 2002. Others have argued, and we generally believe, that
it is in these states where the NCLB had the greatest room to make an impact and, therefore, that
larger impacts in those states gives greater confidence that observed relationships between the
policy and outcomes are causal. The falsification test is met in the cases of classroom control and
perceived job security, but beyond those we can only conclude that No Child Left Behind is
associated with generally positive changes in teacher attitudes.
Our second conclusion is that the DCS model, when adapted to account for the value that
public employees place on job security, does a nice job of explaining the impact of reforms such
as NCLB on attitudes. Such reforms influence the task demands faced by employees, the
decision authority they have to meet those demands, the support they receive from coworkers,
and the security they feel they have in their jobs. These are important antecedents of more
general measures of mental well-being, such as stress and satisfaction. The impact of reforms on
these measures is, therefore, a function of their impact on these antecedents. So, the erosion of
civil service protections or contracting out, which decrease security, or decrease security and
increase demands (for employees that must manage contracts), without having an obvious
positive impact on control or support, will negatively affect employee satisfaction. Alternatively,
a Managing for Results regime, which increases demands, but increases decision authority to a
greater degree, will increase satisfaction. These expectations are identical to what Yang and
Kassekert (2006) find in their study of these three reforms. Those results lead them to conclude
that NPM reforms, and their impacts on public employees, each deserve ―independent evaluation
and theorizing.‖ Alternatively, we believe our results suggest a single theoretical framework that
can be used to predict the various effects that different reforms have on employees.

25
The second conclusion we draw is that the impact of accountability and other reforms
should not be considered independently of the role that managers play in the implementation of
these changes. The results from our analyses suggest, as expected, that better managers produce
better outcomes for employees on almost every dimension we examine. They also indicate,
however, that management effectiveness helps to determine the impact that reforms have on
employee well being. In some cases, the positive impact of NCLB on a teacher’s work
environment simply grows larger or smaller based on the effectiveness of the principal. In other
cases, the quality of the manager determines whether the federal policy had a positive or a
negative impact on a teacher. Obviously, the employee-management relationship in schools may
differ in important ways from relationships in other public organizations and, as a result, the
moderating effect that managers have on the effect of reforms may also differ. Nonetheless, we
believe that our results suggest the need to consider that impact when assessing the effect of
NPM-style reforms on public organizations and employees.
26
References
Barzelay, M. (1992). Breaking through bureaucracy: New vision for managing in government.
Berkeley: University of California Press.
Battaglio, R.P. and Condrey, S.E. (2009). Reforming Public Management: Analyzing the Impact
of Public Service Reform on Organizational and Managerial Trust. Journal of Public
Administration Research and Theory, 19(4), 689-707.
Bellante, D, and Link, A.N. (1981). Are Public Sector Workers More Risk Averse Than Private
Sector Workers? Industrial and Labor Relations Review, 34(3), 408-412.
Bertelli, A.M. (2007). Determinants of Bureaucratic Turnover Intention: Evidence from the
Department of the Treasury. Journal of Public Administration Research and Theory, 17,
235-258.
Bozeman, B. and Kingsley, G. (1998). Risk Culture in Public and Private Organizations. Public
Administration Review, 58(2), 109-118.
Brewer, G.A. (2008). Employee and Organizational Performance. In J.L. Perry and A.
Hondeghem (Eds.) Motivation in Public Management: The Call of Public Service. New
York: Oxford Press.
Brewer, G.A., and Selden, S.C. (1998). Whistle-blowers in the Federal Civil Service: New
Evidence of the Public Service Ethic. Journal of Public Administration Research and
Theory 8: 413-39.
Brockner, J., Spreitzer, G., Mishra, A., Hochwarter, W., Pepper, L. and Weinburg, J. (2004).
Perceived Control as an Antidote to the Negative Effects of Layoffs on Survivors’
Organizational Commitment and Job Performance. Administrative Science Quarterly,
49(1), 76-100.
Brodkin, E.Z. (2011). Policy work: Street-level organizations under new managerialism. Journal
of Public Administration Research and Theory, 21, 1253-1277.
Dee, T. and Jacobs, B. (2011). The Impact of No Child Left Behind on Student Achievement.
NBER Working Paper No. 15531.
Dixon, J., Kouzmin, A. and Korac-Kakabadse, N. (1998). Managerialism - something old,
something borrowed, little new: Economic prescription versus effective organizational
change in public agencies. International Journal of Public Sector Management,11(2/3),
164-187
Doig, J. and Hargrove, E. (1987). Leadership and Innovation: A Biographical Perspective on
Entrepreneurs in Government. Baltimore, MD: Johns Hopkins University Press
Exworthy, M. and Halford, S. (1999). Professionals and Managers in a Changing Public Sector:
Conflict, Compromise and Collaboration?, in M. Exworthy and S. Halford (eds ),
Professionals and the New Managerialism in the Public Sector. Buckingham: Open
University Press.
27
Foster, P. and Wilding, P. (2000) Whither Welfare Professionalism. Social Policy and
Administration, 34(2), 143-59.
Fox , M.L., Dwyer, D.J., & Ganster, D.C. (1993). Effects of Stressful Job Demands and Control
on Physiological and Attitudinal Outcomes in a Hospital Setting. The Academy of
Management, 36(2), 289-318.
Grissom, J.A. (2011). Revisiting the Impact of Participative Decision-Making on Public
Employee Retention: The Moderating Influence of Effective Managers. American Review
of Public Administration.
Hicklin, A.K., O’Toole, L.J. and Meier, K.J. (2008). Serpents in the Sand: Managerial
Networking and Nonlinear Influences on Organizational Performance. Journal of Public
Administration Research and Theory, 18(2) (April), 253–74.
Holzer, M. and Callahan, K. (1998). Government at Work: Best Practices and Model Programs.
Thousand Oaks, CA: Sage Publications.
Hood, C. (1991). A Public Management All Seasons? Public Administration, 69, 3-19.
Houston, D.J. (2000). Public-Service Motivation: A Multivariate Test. Journal of Public
Administration Research and Theory, 10(4), 713-728.
Kam, C.D., and Franzese, R.J. (2007). Modeling and Interpreting Interactive Hypotheses in
Regression Analysis. Ann Arbor: University of Michigan Press.
Kellman, S. (2006). Downsizing, Competition, and Organizational Change in Government: Is
Necessity the Mother of Invention? Journal of Policy Analysis and Management, 25(4),
875-895.
Korunka, C., Scharitzer, D., Carayon, P., & Sainfort, F. (2003). Employee strain and job
satisfaction related to an implementation of quality in a public service organization: a
longitudinal study. Work & Stress, 17(1), 52-72.
Karasek, R. A. (1979). Job Demands, Job Decision Latitude, and Mental Strain: Implications for
Job Redesign. Administrative Science Quarterly, 24, 285-308
Karasek, R., & Theorell, T. (1990). Healthy Work: Stress, Productivity, and the Reconstruction
of Working Life. New York: Basic Books.
Lee, S. and Whitford, A.B. (2008). ―Exit, Voice, Loyalty, and Pay: Evidence from the Federal
Workforce. Journal of Public Administration Research and Theory. 18(4), 647-671
Lynn, L.E., Heinrich, C.J., and Hill, C.J. (2000). Studying Governance and Public Management:
Challenges and Prospects. Journal of Public Administration Research and Theory, 10(2),
233-262.
Meier, K.J. and O’Toole, L.J. (2002). Public Management and Organizational Performance: The
Effect of Managerial Quality. Journal of Policy Analysis and Management, 21(4), 629-
643.

28
Meier, K.J., O’Toole, L.J., Boyne, G.A., & Walker, R.M. (2007). Strategic Management and the
Performance of Public Organizations: Testing Venerable Ideas against Recent Theories.
Journal of Public Administration Research and Theory, 17(3), 357-377.
Mikkelsen, A, Osgard, T. and Lovrich. N. (2000). Modeling the Effects of Organizational Setting
and Individual Coping Style on Employees Subjective Health, Job Satisfaction and
Commitment. Public Administration Quarterly, 371–97.
Noblet, A.J., Rodwell, J.J. and McWilliams, J. 2006. Organizational Change in the Public Sector:
Augmenting the Demand Control Model to Predict Employee Outcomes under New
Public Management. Work and Stress 20, 335–52.
Noblett, A.J. and Rodell, J.J. (2009). Integrating Job Stress and Social Exchange Theories to
Predict Employee Strain in Reformed Public Sector Contexts. Journal of Public
Administration Research and Theory, 19(3), 555-578.
O'Leary, R. (2005). The Ethics of Dissent: Managing Guerrilla Government. Washington, D. C.:
CQ Press.
Osborne, D. E., & Gaebler, T. (1992). Reinventing Government: How the Entrepreneurial Spirit
is Transforming the Public Sector. Reading, MA: Addison-Wesley.
O’Toole, Laurence J., Jr., and Kenneth J. Meier. 1999. ―Modeling the Impact of Public
Management: Implications of Structural Context.‖ Journal of Public Administration
Research and Theory 9, 4: 505-526.
Perry, J. and Wise, L. (1990). The Motivational Bases of Public Service. Public Administration
Review 50, 367-373
Pollitt, C., and Bouckaert. G. (2000). Public Management Reform: A Comparative Analysis.
Oxford: Oxford University Press
Powell, M., Brock, D. and Hinings, C.R. (1999). The Changing Professional Organization, in D.
Brock, M. Powell and C.R. Hinings (eds), Restructuring the Professional Organization:
Accounting, Care and Law. London: Routledge, 1–19.
Rainey, H. G. (1983). Public agencies and private firms: Incentives, goals and individual roles.
Administration & Society, 15, 207-242.
Reback, R., Rockoff, J. & Schwartz, H.L. (2011). Under Press: Job Security, Resource
Allocation, and Productivity in Schools Under NCLB. NBER Working Paper No. 16745.
Schafer, W. and Toy, D. (1999) Managers Are Dealing with Stress and Thriving. Public
Management, 81(6), 29-34.
Thompson, J.R. and Jones, V.D. (1994). Reinventing the Federal Government: The Role of
Theory in Reform Implementation. The American of Public Administration, 25(2), 183-
199.

29
van der Doef, M., & Maes, S. (1999). The Job Demand-control(-support) Model and
Psychological Well-being: A Review of 20 Years of Empirical Research. Work and
Stress, 13, 87-114.
Van Wart, M., & Berman, E. (1999). Contemporary Public Sector Productivity Values: Narrower
Scope, Tougher Standards, and New Rules of the Game. Public Productivity &
Management Review, 22(3), 326-347.
Yang, K. and Kassekert, A.(2009). Linking Management Reform with Employee Job
Satisfaction: Evidence from Federal Agencies. Journal of Public Administration
Research and Theory, 20(2), 413-436.
Young, B., Worchel, S., & Woehr, D. (1998). Organizational Commitment among Public
Service Employees. Public Personnel Management,
30
TABLE 1: Descriptive Statistics
Variable N Mean SD Min Max
Total weekly hours worked 152310 49.18 11.97 0 105
Teacher classroom control (factor) 152310 -0.10 1.01 -4.2 1.3
Teacher job security 112330 1.98 0.95 1 4
Teachers share beliefs about mission 152310 3.20 0.73 1 4
Cooperative effort among staff 152310 3.15 0.81 1 4
Job satisfaction 112330 3.47 0.72 1 4
Principal effectiveness (factor) 152310 0.08 0.69 -3.04 1.17
Teacher Characteristics
Female 152310 0.75
0 1
Black 152310 0.08
0 1
Hispanic 152310 0.06
0 1
Other non-white 152310 0.02
0 1
Years experience 152310 13.53 9.88 0 64
Holds Master's degree 152310 0.47
0 1
Regular full-time teacher 152310 0.91
0 1
School Characteristics
Percent black students 152310 16.26 24.14 0 100
Percent Hispanic students 152310 15.00 23.83 0 100
Percent other non-white race 152310 4.84 10.61 0 100
Percent free/reduced lunch 152310 39.20 28.82 0 100
School size (in 100s) 152310 8.03 6.01 0.06 53.8
Regular (non-special) school 152310 0.93
0 1
Urban 152310 0.27
0 1
Rural 152310 0.27
0 1
Middle school 152310 0.19
0 1
High school 152310 0.29
0 1

31
TABLE 2: No Child Left Behind and Management Effects on Job Demands and Control
Dependent Variable: Total Weekly Hours Worked Teacher Classroom Control
(1) (2) (3) (4) (5) (6) (7) (8)
NCLB 1.842*** 1.963*** 1.855*** 1.989*** 0.528*** 0.513*** 0.526*** 0.509***
(0.196) (0.179) (0.193) (0.177) (0.022) (0.025) (0.022) (0.025)
Principal effectiveness -0.121 -0.119 -0.003 -0.077 0.058*** 0.058*** 0.044*** 0.044***
(0.087) (0.087) (0.130) (0.149) (0.008) (0.008) (0.009) (0.010)
No Prior State Accountability x NCLB
-0.431
-0.480
0.053*
0.062**
(0.385)
(0.387)
(0.028)
(0.030)
Principal effectiveness x NCLB
-0.230 -0.163
0.028* 0.037*
(0.149) (0.161)
(0.015) (0.020)
No Prior State Accountability x Principal
Effectiveness
0.284
-0.004
(0.263)
(0.020)
No Prior State Accountability x Principal
Effectiveness x NCLB
-0.271
-0.030
(0.327)
(0.027)
Constant 29.210*** 29.212*** 29.221*** 29.229*** 0.080** 0.079** 0.078** 0.078**
(0.423) (0.431) (0.422) (0.432) (0.033) (0.033) (0.033) (0.033)
Observations 152310 152310 152310 152310 152310 152310 152310 152310
Adjusted R2 0.220 0.220 0.220 0.220 0.084 0.084 0.084 0.084
Standard errors clustered at the state level. * p<0.10, ** p<0.05, *** p<0.01. All models include teacher and school control variables, state fixed effects, and a
linear time trend.
32
TABLE 3: No Child Left Behind and Management Effects on Job Support
Dependent Variable: Teachers Share Beliefs about Mission Cooperative Effort among Staff
(1) (2) (3) (4) (5) (6) (7) (8)
NCLB 0.074*** 0.078*** 0.073*** 0.077*** 0.096*** 0.097*** 0.097*** 0.099***
(0.014) (0.014) (0.014) (0.013) (0.014) (0.016) (0.014) (0.016)
Principal effectiveness 0.100*** 0.101*** 0.086*** 0.077*** 0.212*** 0.212*** 0.217*** 0.217***
(0.004) (0.004) (0.007) (0.008) (0.006) (0.006) (0.009) (0.011)
No Prior State Accountability x NCLB
-0.012
-0.014
-0.005
-0.009
(0.013)
(0.012)
(0.017)
(0.018)
Principal effectiveness x NCLB
0.029*** 0.036***
-0.011 -0.015
(0.010) (0.010)
(0.012) (0.012)
No Prior State Accountability x
Principal Effectiveness
0.029**
0.001
(0.013)
(0.017)
No Prior State Accountability x
Principal Effectiveness x NCLB
-0.026
0.016
(0.027)
(0.029)
Constant 3.237*** 3.237*** 3.236*** 3.236*** 3.286*** 3.286*** 3.287*** 3.287***
(0.019) (0.019) (0.019) (0.018) (0.020) (0.020) (0.020) (0.020)
Observations 152310 152310 152310 152310 152310 152310 152310 152310
Adjusted R2 0.063 0.063 0.063 0.063 0.072 0.072 0.072 0.072
Standard errors clustered at the state level. * p<0.10, ** p<0.05, *** p<0.01. All models include teacher and school control variables, state fixed
effects, and a linear time trend.
33
TABLE 4: No Child Left Behind and Management Effects on Job Security
Dependent Variable: Teacher job security
(1) (2) (3) (4)
NCLB 0.033 -0.015 0.033 -0.014
(0.042) (0.040) (0.042) (0.040)
Principal effectiveness -0.053*** -0.054*** -0.016 -0.008
(0.007) (0.007) (0.017) (0.022)
No Prior State Accountability x
NCLB
0.170***
0.168***
(0.055)
(0.056)
Principal effectiveness x NCLB
-0.056** -0.069**
(0.022) (0.027)
No Prior State Accountability x
Principal Effectiveness
-0.037
(0.032)
No Prior State Accountability x
Principal Effectiveness x NCLB
0.055
(0.041)
Constant 1.652*** 1.651*** 1.653*** 1.652***
(0.048) (0.048) (0.048) (0.048)
Observations 112330 112330 112330 112330
Adjusted R2 0.056 0.057 0.056 0.057
Standard errors clustered at the state level. * p<0.10, ** p<0.05, *** p<0.01. All models include teacher
and school control variables, state fixed effects, and a linear time trend.

34
TABLE 5: Examining the Impacts of No Child Left Behind on Job Satisfaction
Dependent Variable: Job Satisfaction
(1) (2)
NCLB 0.052*** -0.083***
(0.017) (0.014)
No Prior State Accountability x NCLB -0.013 0.001
(0.011) (0.009)
Mediating Variables Added? No Yes
Constant 3.533*** 2.377***
(0.022) (0.034)
Observations 112330 112330
Adjusted R2 0.056 0.222
Standard errors clustered at the state level. * p<0.10, ** p<0.05, *** p<0.01. All
models include teacher and school control variables, state fixed effects, and a linear
time trend.