DOCUMENT RESUME
ED 419 853 UD 032 326
AUTHOR Schoener, John; Paroff, Jodi; Jarvis, Carolyn; Ford, PatriceTITLE Who We Are. Students and Schools in the NYNSR (New York
Networks for School Renewal) Project, 1995-96.INSTITUTION New York Univ., NY. Inst. for Education and Social Policy.SPONS AGENCY Annenberg Foundation, St. Davids, PA.PUB DATE 1997-07-00NOTE 34p.
PUB TYPE Reports Evaluative (142)EDRS PRICE MF01/PCO2 Plus Postage.DESCRIPTORS Black Students; *Demography; *Educational Change; Elementary
Secondary Education; Hispanic Americans; *Partnerships inEducation; Public Schools; *Student Characteristics; *UrbanSchools
IDENTIFIERS *New York City Board of Education; Reform Efforts
ABSTRACTThis report provides demographic information about students
attending the 82 New York Networks for School Renewal (NYNSR) foundingschools in the 1995-96 school year and compares them to students in non-NYNSRNew York City public schools. It also describes the location, number, size,and grade levels of NYNSR schools. The NYNSR project is a joint effort offour school reform organizations who came together to leverage school reformin the New York City system. These organizations are the New York Associationof Community Organizations for Reform Now, the Center for CollaborativeEducation, the Center for Educational Innovation, and New Visions ror PublicSchools. The project began in January 1995 with a $25 million Challenge Grantfrom the Annenberg Foundation. This report, which is one of a series ofoutcome reports to be prepared by the Institute for Education and SocialPolicy, relies largely on demographic and data outcomes collected by the NewYork City Board of Education. Their data indicate that overall the NYNSRfounding schools serve a population of students quite similar to those of thenon-NYNSR schools, although NYNSR schools serve higher percentages of Blackand Hispanic students and students eligible for free lunch, and fewer Asianstudents than the school system as a whole. NYNSR schools served about 29,000students in 1995-96. NYNSR schools serve an elementary school population thatis somewhat lower in performance than the non-NYNSR school population. NYNSRstudents appear not to perform as well as their counterparts in the middlegrades, although they are similar in reading achievement, and in high schoolthe NYNSR schools serve more students at higher performance levels. NYNSRschools are not evenly distributed throughout the city, but are concentratedin Manhattan. Because the information on which the report is based comes fromschool-level data, it is not possible to examine the characteristics ofdifferent subgroups, although this will be an eventual aim of the projectevaluation. Two appendixes provide information about data sources and a listof the NYNSR schools. (Contains 3 tables and 14 graphs.) (SLD)
********************************************************************************
Reproductions supplied by EDRS are the best that can be madefrom the original document.
********************************************************************************
NEW YORKNETWORKS
FOR SCHOOLRENEWAL
An Annenberg FoundationChallenge for New York City
0
WHO WE ARESTUDENTS AND SCHOOLS IN THE NYNSR PROJECT, 1995-96
U.S. DEPARTMENT OF EDUCATIONOffice of Educational Research and Improvement
EDUCATIONAL RESOURCES INFORMATIONCENTER (ERIC)
This document has been reproduced asreceived from the person or organizationoriginating it.
Minor changes have been made toimprove reproduction quality.
Points of view or opinions stated in thisdocument do not necessarily representofficial OERI position or policy.
1
PERMISSION TO REPRODUCE ANDDISSEMINATE THIS MATERIAL HAS
BEEN GRANTED BY
Nom') F'-v_02_7eir--17/15i _kiP_ Slcr,
TO THE EDUCATIONAL RESOURCESINFORMATION CENTER (ERIC)
A Report of theNew York Networks for School Renewal (NYNSR) Research Collaborative
JULY 1997
NEW YORKNETWORKS
FOR SCHOOLRENEWAL
Initiated by a five:year, $25 million Annenberg Foundation challenge grant being matched by other contributors,
New York Networks for School Renewal is developing and nurturing a rapidly increasing number of small
public schools in New York City that are now offering quality education to nearly 50,000 students of highly
diverse backgrounds. Linking these schools in networks, the project seeks to empower school practictioners,
parents and students in wry: that lead to greater student achievement and school accountability.
Project Sponsors
ACORN(N.Y. Association of Community Organizations for Reform Now)
Center for Collaborative Education
Center for Educational Innovation
New Visions for Public Schools
Iris Morales, Director
NYNSR Research Collaborative
Institute for Education & Social Policy, New York University
Center for Puerto Rican Studies at Hunter College
National Center for Restructuring Education, Schools, and Teaching atTeachers College, Columbia University
Lang College, The New School for Social Research
Graduate Center, City University of New York
The NYNSR Research Collaborative will issue a series of reports
from 1997 through 2001 about various aspects of the NYNSR Project.
WHO WE ARE was prepared by
4111INSTITUTE FOREducation and SOcial Policy
New York University285 Mercer Street, NYC 10003
(212)998-5880 FAX: (212)995-4564email: [email protected]
Research TeamJohn Schoener
Jodi ParoffCarolyn JarvisPatrice Ford
NEW YORKNETWORKS
FOR SCHOOLRENEWAL
An Annenberg FoundationChallenge for New York City
WHO WE ARESTUDENTS AND SCHOOLS IN THE NYNSR PROJECT, 1995-96
A Report of theNew York Networks for School Renewal (NYNSR) Research Collaborative
JULY 1997
prepared by:
farlikP INSTITUTE FORIIII
Education and Social PolicyNew York University
285 Mercer Street, NYC 10003(212) 998-5880 FAX (212) 995-4564
email: [email protected]
4
WHO WE ARESTUDENTS AND SCHOOLS IN THE NYNSR PROJECT, 1995-96
TABLE OF CONTENTS
EXECUTIVE SUMMARY
I. THE PROJECT AND ITS SPONSORS I
II. THE EVALUATION 3
The Research Collaborative
The Outcomes Study
III. WHO ARE THE NYNSR STUDENTS? 6Demographic Characteristics
Special Student Populations
Reading and Math Performance
IV. CHARACTERISTICS OF NYNSR SCHOOLS 14
Grade Organization
School Size
Distribution of NYNSR Elementary and Middle Schools Across Boroughs
Distribution of NYNSR High Schools Across Superintendencies
V. DISCUSSION 19
5
GRAPHS
Percent of NYC Public School Students in NYNSR and non-NYNSR schools by:Race/Ethnicity (Figures la, 14 1c)Gender (Figures 2a, 2b, 2c)Eligibility for Free Lunch (Figure 3)Designation as Special Education (Figure 4)Designation as Limited English Proficient (Figure 5)Reading and Math Performance (Figures 6a, 6b, 6c)
Average Registers of NYNSR and non-NYNSR Schools (Figure 7)
Number of NYNSR Elementary and Middle Schools in Community School Districts (Figure 8)
TABLES
Number of Founding NYNSR Schools by grades served during 1995-96 (Table 1)
Average and Total Registers Founding NYNSR Schools and Non-NYNSR Schools (Table 2)
Number of Schools and Enrollment, by Superintendencies, for NYNSR and Non-NYNSR High Schools(Table 3)
APPENDICES
Appendix I: Notes about data sources 21
Appendix II: NYNSR schools and grades served 23
EXECUTIVE SUMMARY
This WHO WE ARE report provides demographic information about students
attending New York Networks for School Renewal (NYNSR) founding schools in
the 1995-96 school year and compares them to students in non-NYNSR New
York City public schools. It also describes the location, number, size and grade
levels of NYNSR schools. The schools included in this report are the 82 NYNSR
founding schoolsthose schools that were part of the project when it began in
1995-96. Subsequent reports will include the approximately 40 additional schools
that have been added to the project since its inception.
The NYNSR project is a joint effort of four school reform organizations who came
together to leverage systemic reform throughout the New York City school system.
These organizationsthe NYNSR sponsors are the New York Association of
Community Organizations for Reform Now (ACORN), the Center for Collaborative
Education (CCE), the Center for Educational Innovation (CEI) at the Manhattan
Institute, and New Visions for Public Schools. The project began in January 1995
with a $25 million Challenge Grant from the Annenberg Foundation.
In July 1996, the NYNSR project contracted with New York University's Institute
for Education and Social Policy (IESP) to conduct an evaluation of the NYNSR
project in cooperation with a group of other researchers and research organizations.
These organizations, called the Research Collaborative, include: Teachers College's
National Center for Restructuring Education, Schools andTeaching, and researchers
at the CUNY Graduate Center, the Center for Puerto Rican Studies at Hunter
College, and the New School for Social Research.
This report, prepared by the Institute for Education and Social Policy (IESP), is
one of a series of outcomes reports IESP will produce as part of the NYNSR
evaluation. IESP's outcomes study relies largely on extant demographic and
outcomes data collected and maintained by the New York City Board of Education.
This report is based on Board of Education school-level data.
WHO WE ARE: Students and Schools in the NYNSR Project, 1995-96
Overall Findings
Analysis of the 1995-96 data indicates that NYNSR founding schools are serving
a population of students that is quite similar to the population of students in the
non-NYNSR New York City public schools; but NYNSR schools are serving higher
percentages of black and Hispanic students and students eligible for free lunch.
NYNSR schools served about 29,000 students in 1995-96, a population larger
than an average Community School District in New York City. NYNSR schools
serve students at all grade levels and in four of the five boroughs in New York City.
Racial/Ethnic Composition
NYNSR elementary schools are serving about the same percentage of black students,
a considerably larger percentage of Hispanic students, and considerably fewer white,
Asian and other students than the school system as a whole.
NYNSR schools serving middle grades have proportionately more black and
Hispanic students and fewer white, Asian and other students than the school
system as a whole.
Among those schools serving high-school grades, NYNSR and non-NYNSR
schools are more similar in racial/ethnic composition than are students in NYNSR
and non-NYNSR schools at the elementary and middle school levels. But NYNSR
high schools serve somewhat more black and Hispanic high school students
and fewer white, Asian and other students than non-NYNSR New York City
public high schools.
Gender Composition
The gender compositions of NYNSR and other public schools are comparable at
the elementary and middle school levels, where approximately half of the students
are male and half are female. At the high school level, however, NYNSR schools
have a slightly higher percentage of female students, whereas non-NYNSR schools
have an even split of male and female students.
0
ii WHO WE ARE: Students and Schools in the NYNSR Project, 1995-96
Student Performance
The NYNSR elementary student population includes somewhat more low
performing students (based on standardized test scores) than the non-NYNSR
elementary school population.
At the middle school level, the NYNSR students appear to be lower performing
in mathematics than students in non-NYNSR schools, but very similar in reading
achievement.
At the high school level, the NYNSR student population includes more higher
performing students than the population in non-NYNSR high schools.
Students Designated as Requiring Special Education or LimitedEnglish Proficient
The percentage of students who are designated as requiring special education or
Limited English Proficient (LEP) is lower at NYNSR schools than at non-NYNSR
schools. It is unclear, however, whether NYNSR schools are actually serving fewer
LEP or special education students or whether NYNSR schools are using different
policies and practices for designating students as LEP or requiring special education.
This issue is being further explored through a survey of NYNSR school directors.
Location of NYNSR Schools
The NYNSR schools are not evenly dispersed throughout the city. More NYNSR
schools are in Manhattan than in any other borough, with the highest concentration
of elementary and middle schools in Community School Districts 3 and 4. This
may be due to local Community School District policies about creating new schools,
or it may also reflect different policies about student recruitment and enrollment.
IESP is conducting additional analyses which compare NYNSR schools to different
subgroups of non-NYNSR schools to explore this issue.
The information in this report is based on school-level data. Therefore data
could not be disaggregated to examine the characteristics of different subgroups
aWHO WE ARE: Students and Schools in the NYNSR Project, 1995-96 iii
of students, such as entering students, as against those students who have been in
schools for different periods of time. As part of the evaluation, IESP is constructing
a student-level data base of all students in NYNSR schools, to examine the
characteristics of performance of specific groups of students. These data will allow
IESP to report longitudinally on attrition, mobility and stability of NYNSR
students, as well as to examine graduation rates, drop-out rates and performance
on standard achievement measures.
In addition, IESP is identifyingin cooperation with the New York City Board of
Education a comparison group of schools with student populations similar to
NYNSR students. IESP will conduct analyses comparing the progress and
performance of students in NYNSR and non-NYNSR schools over time.
iv WHO WE ARE: Students and Schools in the NYNSR Project, 1995-96
WHO WE ARE provides demographic information about students attending New York
Networks for School Renewal ( NYNSR) schools in the 1995-96 school year and compares
them to students in non-NYNSR NewYork City public schools. It also describes the location,
number, size and grade levels of NYNSR schools in 1995-96, the first year of a five -year
project. Data included in this report are for the 82 NYNSR founding schools those
schools that were part of the project when it began in 1995-96. Subsequent reports will
include the approximately 40 additional schools that have been added to the project.
I. THE PROJECT AND ITS SPONSORS
The five-year New York Networks for School Renewal (NYNSR) project began in
January 1995 with a $25 million Challenge Grant from the Annenberg Foundation.
The project is an outgrowth of school reform work by four organizations, the New
York Association of Community Organizations for Reform Now (ACORN), the
Center for Collaborative Education (CCE), the Center for Educational Innovation
(CEI) at the Manhattan Institute, and New Visions for Public Schools. These
organizations the NYNSR sponsors had been working separately on a
common set of initiatives: small schools, choice, school-based budgeting, greater
school autonomy, school-based forms of accountability, and collaborative decision-
making. As sponsors of the NYNSR project, they brought together their individual
efforts to achieve a broader goal leveraging systemic reform throughout the
New York City school system.
The sponsors work together in collaboration with the New York City Board of
Education, the New York City Schools Chancellor, the United Federation of
Teachers, and the Mayor's Office. There is also regular consultation with
communities, parents and policy-makers.
The sponsors bring together both established and newly created schools into
voluntary networks. The NYNSR project hypothesizes that these networks will
function as mechanisms of support and will help hold members of schools
accountable for school achievement, fiscal integrity and equity. In addition,
NYNSR works with the Chancellor and the Board of Education to develop a
WHO WE ARE: Students and Schools in the-taiNSR Project, 1995-96
Project SponsorsO New York Association of Community
Organizations for Reform Now (ACORN)
O Center for Collaborative Education
O Center for Educational Innovation at
the Manhattan Institute
New Visions for Public Schools
1
Learning Zone to provide schools with the flexibility necessary to advance
educational innovation.
The NYNSR project's intentions are: 1) to bring to scale the effort in New York
City to create a critical mass of small effective schools that equitably serve the full
range of New York City children so that they model a public school norm rather
than an anomaly; 2) to influence the public school system to become more
systematically supportive of such schools; and 3) to test the proposition that small
schools that work together voluntarily will produce higher levels of achievement
and equity. The NYNSR project seeks to produce schools and networks within
the New York City public school system that receive and exercise substantial
decision-making authority over personnel, budget and instruction, to better meet
the specific needs of students.
12
2 WHO WE ARE: Students and Schools in the NYNSR Project, 1995-96
II. THE EVALUATION
The Research Collaborative
In July 1996, the NYNSR project contracted with New York University's Institute
for Education and Social Policy (IESP) to conduct an evaluation of the NYNSR
project in cooperation with a group of other researchers and research organizations.
The group, called the Research Collaborative (RC), includes: Teachers College's
National Center for Restructuring Education, Schools, andTeaching (NCREST);
and researchers at the CUNY Graduate Center, the Center for Puerto Rican Studies
at Hunter College, and the New School for Social Research. The Institute for
Education and Social Policy coordinates the Research Collaborative's work.
The Research Collaborative, working with the project sponsors and participating
school practitioners, agreed on the following questions as the focus of the evaluation:
Who are the students in the NYNSR schools? What is the nature of their
academic achievement? Are they achieving as well as or better or worse
than comparable students in other New York City public schools? What
are the costs of the NYNSR effort? What are the equity considerations?
What policies and practices contribute to the development of NYNSR schools
and networks (including school-level practices, network practices, and district/
city/state policies)? How have they contributed to the development and
functioning of schools and networks? What policies and practices supportor
impede the development and functioning of NYNSR schools and networks?
How have they promoted or hampered school and network development?
Has NYNSR been implemented as planned? Has NYNSR realized its
educational goals?
To what extent, and how, have the institutions that collaborated to endorse the
NYNSR project (including Community School Districts, the New York City
Board of Education, High School Districts, the New York State Education
Department, and other partners) carried out their commitments to the project?
13WHO WE ARE: Students and Schools in the NYNSR Project, 1995-96 3
To address these questions, the Research Collaborative has designed an inquiry
consisting of three components: implementation, outcomes and participatory research.
The Outcomes Study
WHO WE ARE is one of a series of evaluation reports IESP is producing as part of the
overall outcomes study. Because the NYNSR project includes a sizable number of
students, staff and schools, we want to make information available to the city's
education community about the students served by these schools as well as how
these students are achieving in comparison to students in other schools. The outcomes
study will report data that includes all schools participating in this initiative and
compare this data with those of the other New York City public schools.
The four purposes of the overall outcomes study are:
to provide demographic data about students and schools participating in the
NYNSR project;
* to assess how representative the students and schools in the NYNSR effort
are of the larger New York City public school system;
to report on the progress of schools and students participating in the
NYNSR project; and
to compare the outcomes for students and schools participating in the
NYNSR project with those of non-NYNSR students and schools.
WHO WE ARE, the first report of the outcomes study, relies largely on extant
demographic and outcomes data collected and maintained by the New York City
Board of Education. All data presented in this report are for the 1995-96 school
year, the first year for which individual Building-District-School (BDS) codes were
established for a substantial number of the new, small, or restructured schools in
the NYNSR roster of schools.
As part of the outcomes study, IESP has constructed two databases. The first, a
school-level database, contains aggregate data for each school in the project. It is
14
4 WHO WE ARE: Students and Schools in the NYNSR Project, 1995-96
used to describe student demographics and some outcomes of NYNSR schools
and to compare them to non-NYNSR schools.The second, a student-level database,
contains longitudinal, unit-record data for each student in the entering class of
students. It is used to study issues such as student mobility and comparative
achievement. A fuller discussion of data sources, the structure of New York City
Board of Education data files, and the limitations of the existing data are included
in Appendix I.
15
WHO WE ARE: Students and Schools in the NYNSR Project, 1995-96 5
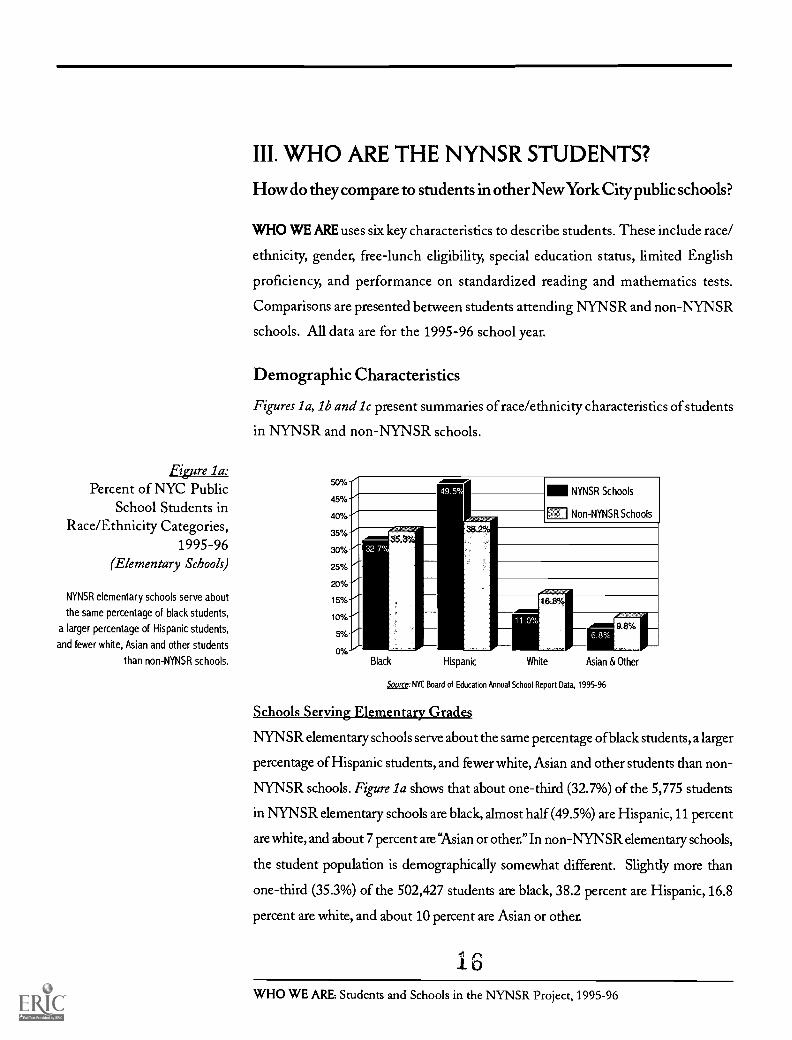
Figure la:Percent of NYC Public
School Students inRace/Ethnicity Categories,
1995-96(Elementary Schools)
NYNSR elementary schools serve about
the same percentage of black students,
a larger percentage of Hispanic students,
and fewer white, Asian and other students
than non-NYNSR schools.
III. WHO ARE THE NYNSR STUDENTS?
How do they compare to students in other New York City public schools?
WHO WE ARE uses six key characteristics to describe students. These include race/
ethnicity, gender, free-lunch eligibility, special education status, limited English
proficiency, and performance on standardized reading and mathematics tests.
Comparisons are presented between students attending NYNSR and non -NYNSR
schools. All data are for the 1995-96 school year.
Demographic Characteristics
Figures la, lb and 1 c present summaries of race/ethnicity characteristics of students
in NYNSR and non-NYNSR schools.
50%
45%
40%
35%
30%
25%
20%
15%
10%
5%
0%Black
38,2%
Hispanic
NYNSR Schools
Non-NYNSR Schools
White Asian & Other
5ource NYC Board of Education Annual School Report Data, 1995-96
Schools Serving Elementary Grades
NYNSR elementary schools serve about the same percentage of black students, a larger
percentage of Hispanic students, and fewer white, Asian and other students than non-
NYNSR schools. Figure la shows that about one-third (32.7%) of the 5,775 students
in NYNSR elementary schools are black, almost half (49.5%) are Hispanic, 11 percent
are white, and about 7 percent are "Asian or other." In non-NYNSR elementary schools,
the student population is demographically somewhat different. Slightly more than
one-third (35.3%) of the 502,427 students are black, 38.2 percent are Hispanic, 16.8
percent are white, and about 10 percent are Asian or other.
i 66 WHO WE ARE: Students and Schools in the NYNSR Project, 1995-96
50%
45%
40%
35%
30%
25%
20%
15%
10%
5%
0%
NYNSR Schools
Non-NYNSR Schools
35 0"/
Black Hispanic White Asian & Other
sources NYC Board of Education Annual School Report Data, 1995-96
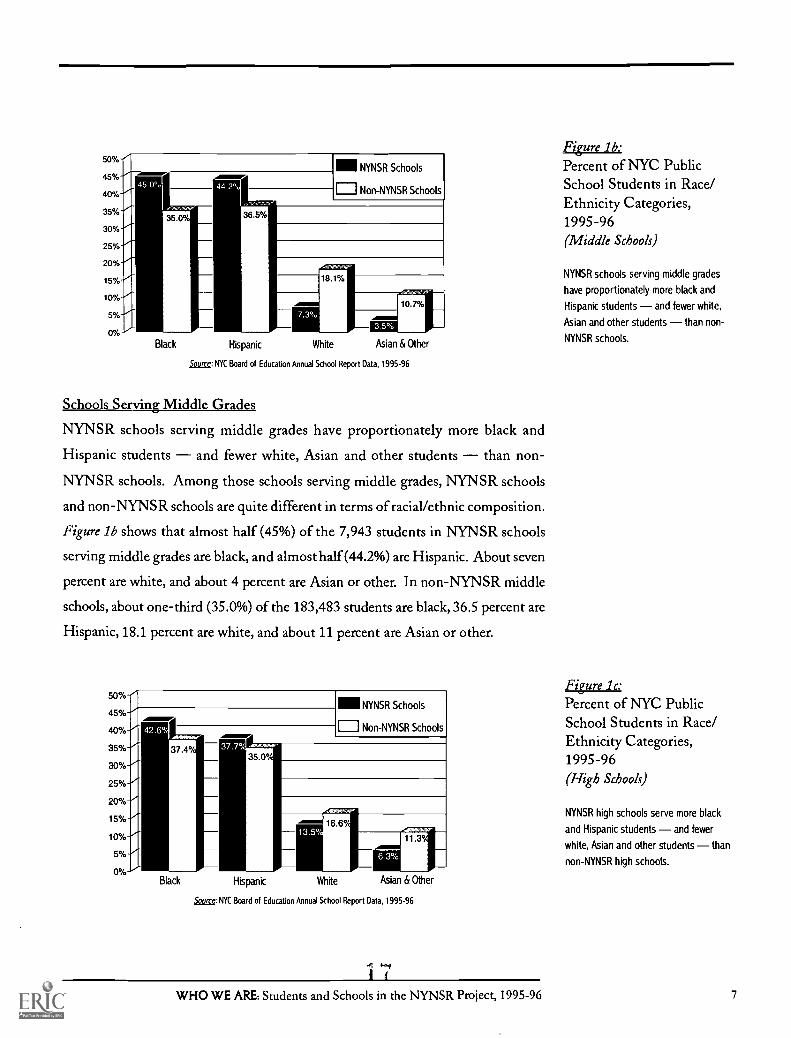
Schools Serving Middle Grades
NYNSR schools serving middle grades have proportionately more black and
Hispanic students and fewer white, Asian and other students than non-
NYNSR schools. Among those schools serving middle grades, NYNSR schools
and non-NYNSR schools are quite different in terms of racial/ethnic composition.
Figure lb shows that almost half (45%) of the 7,943 students in NYNSR schools
serving middle grades are black, and almost half (44.2%) are Hispanic. About seven
percent are white, and about 4 percent are Asian or other. In non-NYNSR middle
schools, about one-third (35.0%) of the 183,483 students are black, 36.5 percent are
Hispanic, 18.1 percent are white, and about 11 percent are Asian or other.
50%
45%
40%
35%
30%
25%
20%
15%
10%
5%
0%
NYNSR Schools
Non-NYNSR Schools
Black Hispanic White Asian & Other
,Source: NYC Board of Education Annual School Report Data, 1995-96
Figure lb:Percent of NYC PublicSchool Students in Race/Ethnicity Categories,1995-96(Middle Schools)
NYNSR schools serving middle grades
have proportionately more black and
Hispanic students and fewer white,
Asian and other students than non-
NYNSR schools.
Figure lc:Percent of NYC PublicSchool Students in Race/Ethnicity Categories,1995-96(High Schools)
NYNSR high schools serve more black
and Hispanic students and fewer
white, Asian and other students than
non-NYNSR high schools.
WHO WE ARE: Students and Schools in the NYNSR Project, 1995-96 7
Figures 2a, 26:Percent of Male and
Female Students in NYCPublic Schools, 1995-96
(Elementary & Middle Schools)
Figure 2cPercent of Male and
Female Students in NYCPublic Schools, 1995-96
(High Schools)
The gender compositions of NYNSR and
non-NYNSR public schools are
comparable at the elementary and middle
school levels, where approximately half
of the students are male and half are
female. At the high school level, however,
NYNSR schools have a slightly higher
percentage of female students
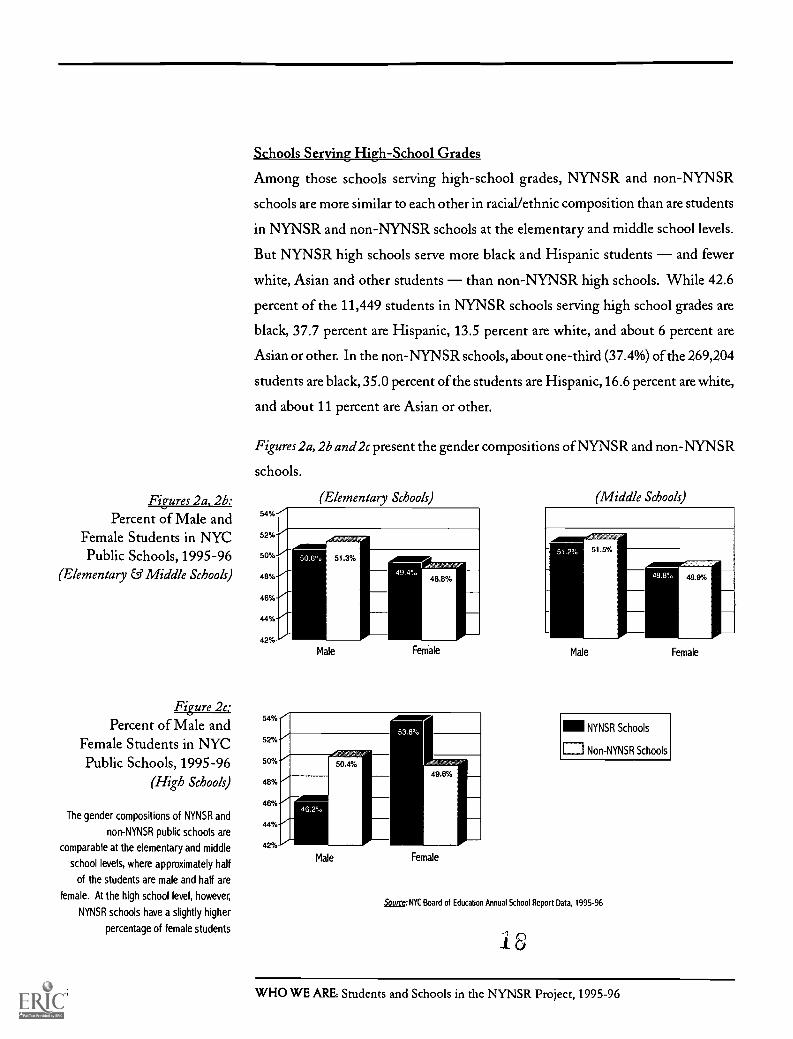
Schools Serving High-School Grades
Among those schools serving high-school grades, NYNSR and non-NYNSR
schools are more similar to each other in racial/ethnic composition than are students
in NYNSR and non-NYNSR schools at the elementary and middle school levels.
But NYNSR high schools serve more black and Hispanic students and fewer
white, Asian and other students than non-NYNSR high schools. While 42.6
percent of the 11,449 students in NYNSR schools serving high school grades are
black, 37.7 percent are Hispanic, 13.5 percent are white, and about 6 percent are
Asian or other. In the non-NYNSR schools, about one-third (37.4%) of the 269,204
students are black, 35.0 percent of the students are Hispanic, 16.6 percent are white,
and about 11 percent are Asian or other.
Figures 2a, 2b and 2c present the gender compositions of NYNSR and non-NYNSR
schools.
54%
52%
50%
48%
46%
44%
42%
(Elementary Schools) (Middle Schools
54%
52%
50%
48%
46%
44%
42%
Male Female
46.2%
Male
Male
NYNSR Schools
Non-NYNSR Schools
Female
Source: NYC Board of Education Annual School Report Data, 1995-96
16
Female
8 WHO WE ARE: Students and Schools in the NYNSR Project, 1995-96
The gender compositions of NYNSR and non-NYNSR public schools are
comparable at the elementary and middle school levels, where approximately half
of the students are male and half are female. At the high school level, however,
NYNSR schools have a slightly higher percentage of female students, whereas the
rest of the public high schools in New York City have an even split of male and
female students. The NYNSR high schools are comprised of 53.8 percent female
and 46.2 percent male students; the percentage of male and female students in the
non-NYNSR public schools in New York City is fairly evenly split (50.4% and
49.6% respectively).
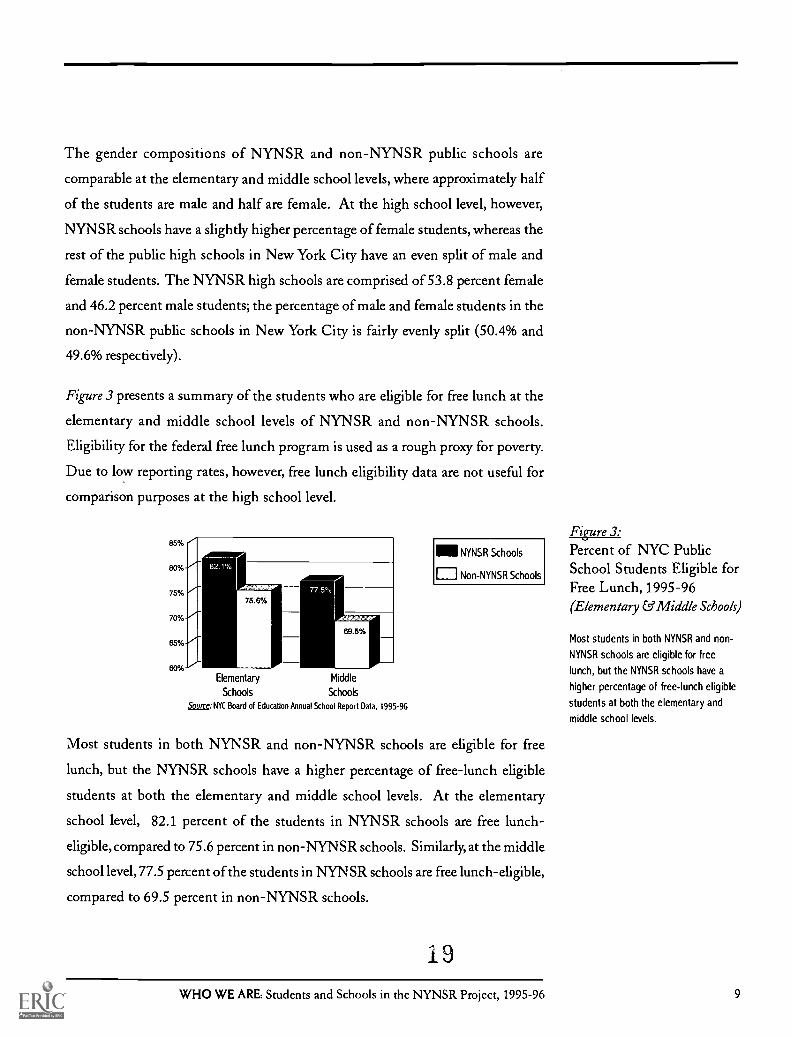
Figure 3 presents a summary of the students who are eligible for free lunch at the
elementary and middle school levels of NYNSR and non-NYNSR schools.
Eligibility for the federal free lunch program is used as a rough proxy for poverty.
Due to low reporting rates, however, free lunch eligibility data are not useful for
comparison purposes at the high school level.
85%
80%
75%
70%
65%
60%
756%
15%Elementary Middle
Schools Schools
some: NYC Board of Education Annual School Report Data, 1995-96
IIII NYNSR Schools
E.:I Non-NYNSR Schools
Most students in both NYNSR and non-NYNSR schools are eligible for free
lunch, but the NYNSR schools have a higher percentage of free-lunch eligible
students at both the elementary and middle school levels. At the elementary
school level, 82.1 percent of the students in NYNSR schools are free lunch-
eligible, compared to 75.6 percent in non-NYNSR schools. Similarly, at the middle
school level, 77.5 percent of the students in NYNSR schools are free lunch-eligible,
compared to 69.5 percent in non-NYNSR schools.
19
Figure 3:Percent of NYC PublicSchool Students Eligible forFree Lunch, 1995-96(Elementary & Middle Schools)
Most students in both NYNSR and non-
NYNSR schools are eligible for free
lunch, but the NYNSR schools have a
higher percentage of free-lunch eligible
students at both the elementary and
middle school levels.
WHO WE ARE: Students and Schools in the NYNSR Project, 1995-96 9
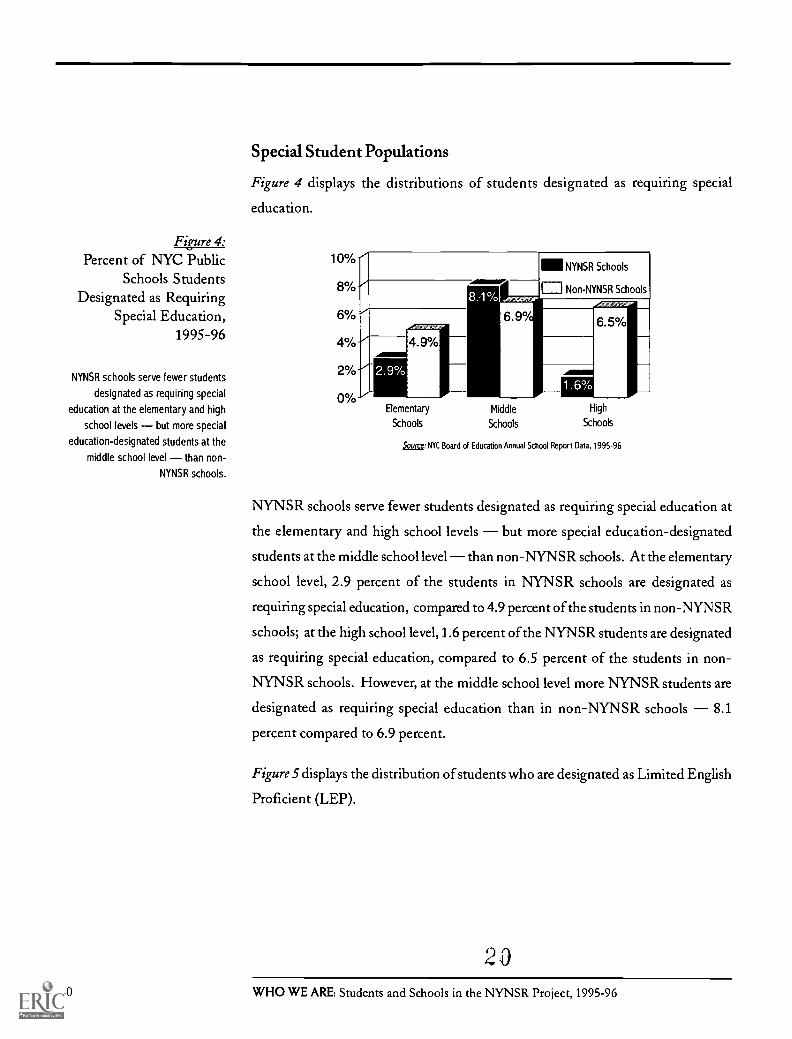
Figure 4:Percent of NYC Public
Schools StudentsDesignated as Requiring
Special Education,1995-96
NYNSR schools serve fewer students
designated as requiring special
education at the elementary and high
school levels but more special
education-designated students at the
middle school level than non-
NYNSR schools.
Special Student Populations
Figure 4 displays the distributions of students designated as requiring special
education.
NYNSR Schools
1-1 Non-NYNSR Schools
4.9%
Elementary
Schools
Middle
Schools
High
Schools
Source: NYC Board of Education Annual School Report Data, 1995-96
NYNSR schools serve fewer students designated as requiring special education at
the elementary and high school levels but more special education-designated
students at the middle school level than non-NYNSR schools. At the elementary
school level, 2.9 percent of the students in NYNSR schools are designated as
requiring special education, compared to 4.9 percent of the students in non-NYNSR
schools; at the high school level, 1.6 percent of the NYNSR students are designated
as requiring special education, compared to 6.5 percent of the students in non-
NYNSR schools. However, at the middle school level more NYNSR students are
designated as requiring special education than in non-NYNSR schools 8.1
percent compared to 6.9 percent.
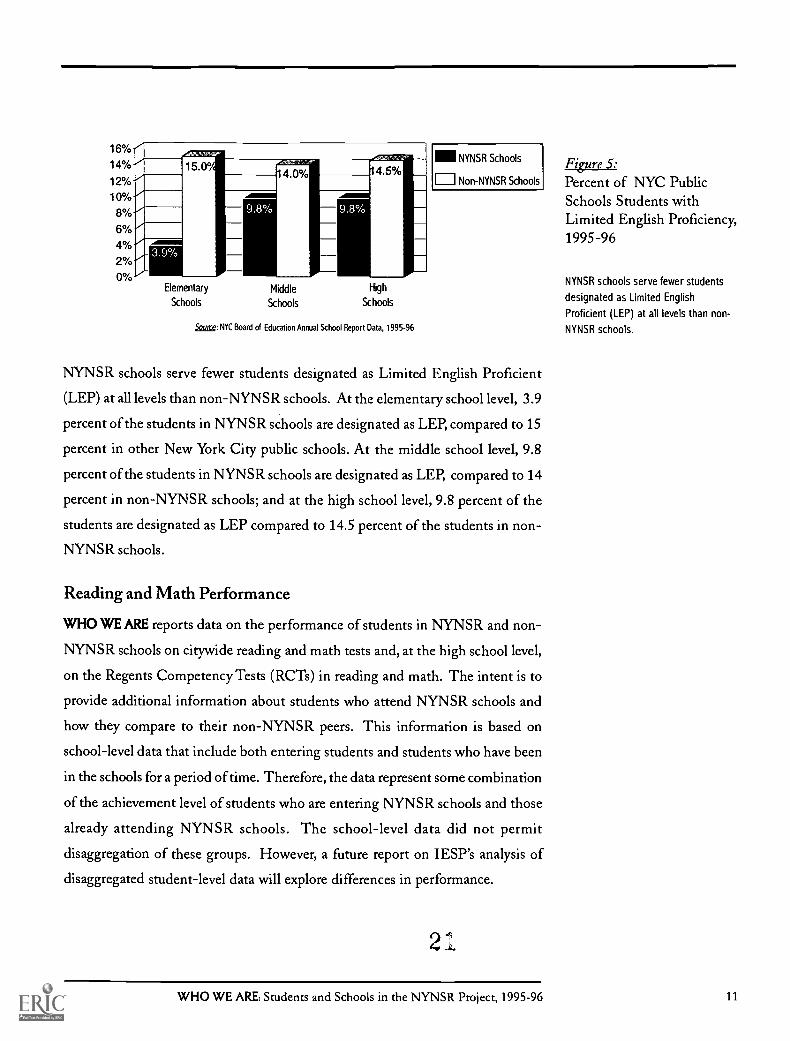
Figure 5 displays the distribution of students who are designated as Limited English
Proficient (LEP).
2010 WHO WE ARE: Students and Schools in the NYNSR Project, 1995-96
16%
14%
12%
10%8%
6%4%
2%
0%Elementary
Schools
Middle
Schools
High
Schools
Sam: NYC Board of Education Annual School Report Data, 1995-96
NYNSR Schools
Non-NYNSR Schools
NYNSR schools serve fewer students designated as Limited English Proficient
(LEP) at all levels than non-NYNSR schools. At the elementary school level, 3.9
percent of the students in NYNSR schools are designated as LEP, compared to 15
percent in other New York City public schools. At the middle school level, 9.8
percent of the students in NYNSR schools are designated as LEP, compared to 14
percent in non-NYNSR schools; and at the high school level, 9.8 percent of the
students are designated as LEP compared to 14.5 percent of the students in non-
NYNSR schools.
Reading and Math Performance
WHO WE ARE reports data on the performance of students in NYNSR and non-
NYNSR schools on citywide reading and math tests and, at the high school level,
on the Regents Competency Tests (RCTs) in reading and math. The intent is to
provide additional information about students who attend NYNSR schools and
how they compare to their non-NYNSR peers. This information is based on
school-level data that include both entering students and students who have been
in the schools for a period of time. Therefore, the data represent some combination
of the achievement level of students who are entering NYNSR schools and those
already attending NYNSR schools. The school-level data did not permit
disaggregation of these groups. However, a future report on 'ESP's analysis of
disaggregated student-level data will explore differences in performance.
2
Figure 5:Percent of NYC PublicSchools Students withLimited English Proficiency,1995-96
NYNSR schools serve fewer students
designated as Limited English
Proficient (LEP) at all levels than non-
NYNSR schools.
WHO WE ARE: Students and Schools in the NYNSR Project, 1995-96 11
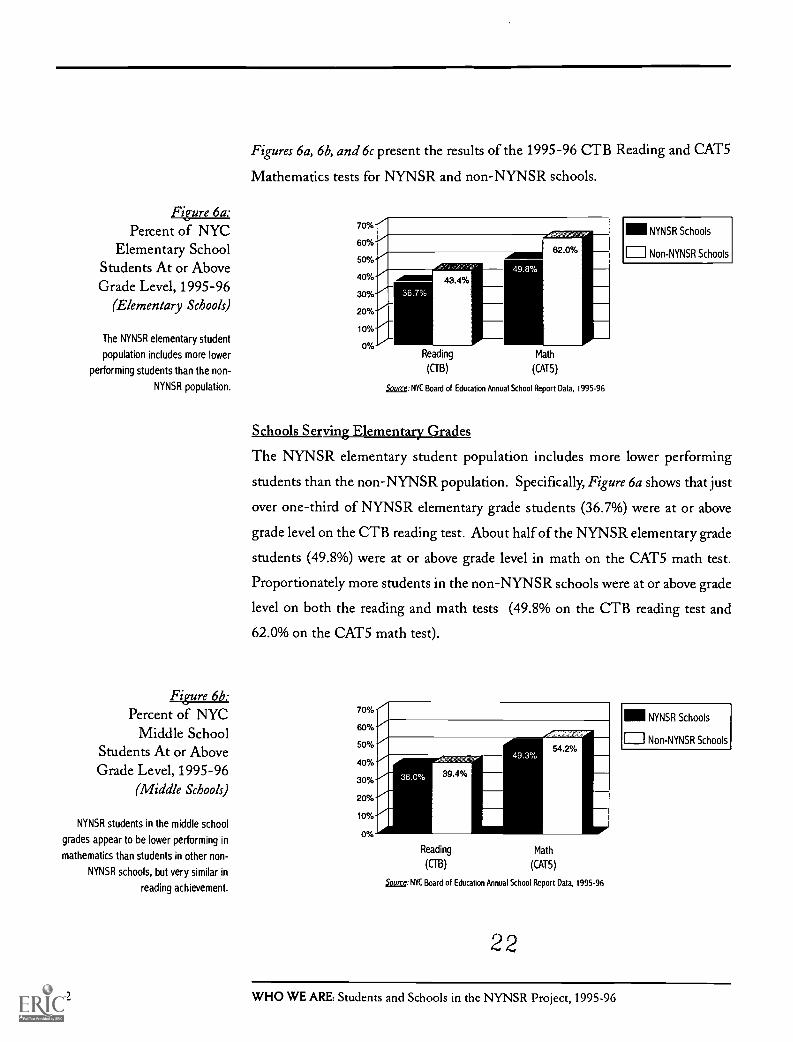
Figure 6a:Percent of NYC
Elementary SchoolStudents At or AboveGrade Level, 1995-96
(Elementary Schools)
The NYNSR elementary student
population includes more lower
performing students than the non-
NYNSR population.
Figure 6bPercent of NYC
Middle SchoolStudents At or AboveGrade Level, 1995-96
(Middle Schools)
NYNSR students in the middle school
grades appear to be lower performing in
mathematics than students in other non-
NYNSR schools, but very similar in
reading achievement.
Figures 6a, 6b, and 6c present the results of the 1995-96 CTB Reading and CATS
Mathematics tests for NYNSR and non-NYNSR schools.
70%
60%
50%
40%
30%
20%
10%
0%Reading
(GB)
Math
(CATS)
Source: NYC Board of Education Annual School Report Data, 1995-96
NYNSR Schools
Non-NYNSR Schools
Schools Serving Elementary Grades
The NYNSR elementary student population includes more lower performing
students than the non-NYNSR population. Specifically, Figure 6a shows that just
over one-third of NYNSR elementary grade students (36.7%) were at or above
grade level on the CTB reading test. About half of the NYNSR elementary grade
students (49.8%) were at or above grade level in math on the CATS math test.
Proportionately more students in the non-NYNSR schools were at or above grade
level on both the reading and math tests (49.8% on the CTB reading test and
62.0% on the CATS math test).
70%
60%
50%
40%
30%
20%
10%
0%
Reading Math
(CTB) (CATS)
souro: NYC Board of Education Annual School Report Data, 1995-96
22
. 111NYNSR Schools
Non-NYNSR Schools
12 WHO WE ARE: Students and Schools in the NYNSR Project, 1995-96
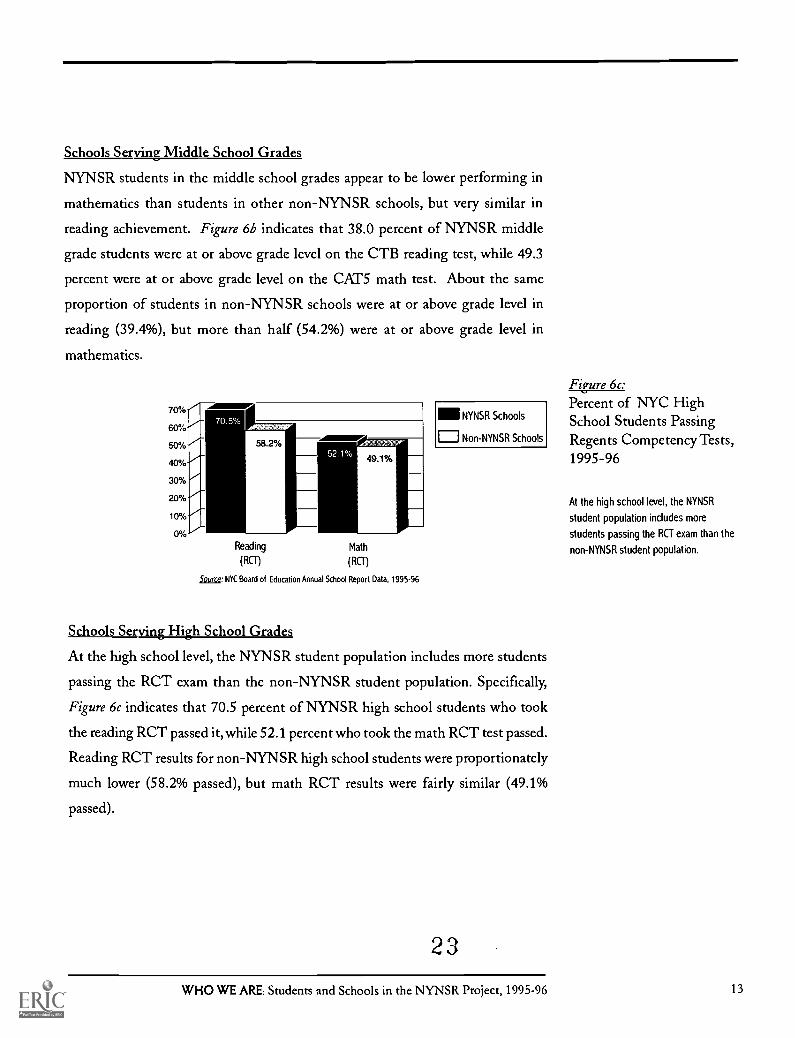
Schools Serving Middle School Grades
NYNSR students in the middle school grades appear to be lower performing in
mathematics than students in other non-NYNSR schools, but very similar in
reading achievement. Figure 6b indicates that 38.0 percent of NYNSR middle
grade students were at or above grade level on the CTB reading test, while 49.3
percent were at or above grade level on the CAT5 math test. About the same
proportion of students in non-NYNSR schools were at or above grade level in
reading (39.4%), but more than half (54.2%) were at or above grade level in
mathematics.
70%
60%
50%
40%
30%
20%
10%
0%
Reading
(RCT)
Math
(RCT)
Source: NYC Board of Education Annual School Report Data, 1995-96
NYNSR Schools
Non-NYNSR Schools
Schools Serving High School Grades
At the high school level, the NYNSR student population includes more students
passing the RCT exam than the non-NYNSR student population. Specifically,
Figure 6c indicates that 70.5 percent of NYNSR high school students who took
the reading RCT passed it, while 52.1 percent who took the math RCT test passed.
Reading RCT results for non-NYNSR high school students were proportionately
much lower (58.2% passed), but math RCT results were fairly similar (49.1%
passed).
23
Figure 6c:Percent of NYC HighSchool Students PassingRegents Competency Tests,1995-96
At the high school level, the NYNSR
student population includes more
students passing the RCT exam than the
non-NYNSR student population.
WHO WE ARE: Students and Schools in the NYNSR Project, 1995-96 13
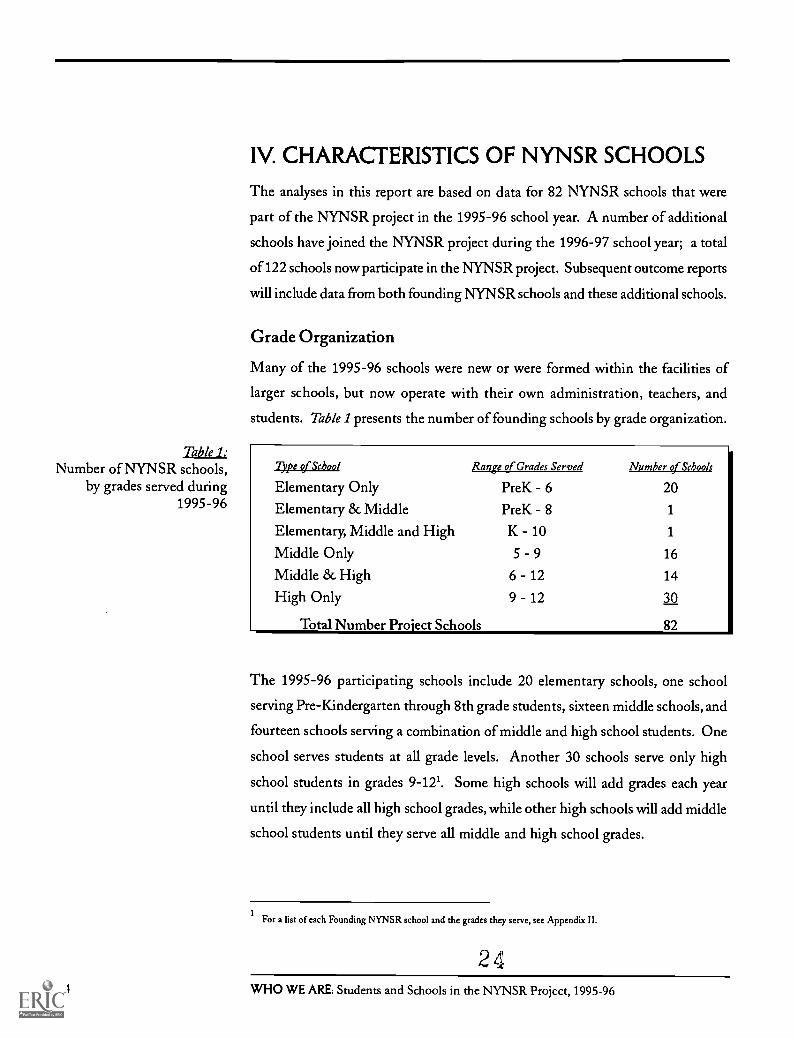
Table 1:Number of NYNSR schools,
by grades served during1995-96
14
IV. CHARACTERISTICS OF NYNSR SCHOOLS
The analyses in this report are based on data for 82 NYNSR schools that were
part of the NYNSR project in the 1995-96 school year. A number of additional
schools have joined the NYNSR project during the 1996-97 school year; a total
of 122 schools now participate in the NYNSR project. Subsequent outcome reports
will include data from both founding NYNSR schools and these additional schools.
Grade Organization
Many of the 1995-96 schools were new or were formed within the facilities of
larger schools, but now operate with their own administration, teachers, and
students. Table 1 presents the number of founding schools by grade organization.
Type of School
Elementary Only
Elementary & Middle
Elementary, Middle and High
Middle Only
Middle & High
High Only
Range of Grades Served
PreK 6PreK 8
K 105 9
6 -129 -12
Total Number Project Schools
Number of Schools
20
1
1
16
14
30
82
The 1995-96 participating schools include 20 elementary schools, one school
serving Pre-Kindergarten through 8th grade students, sixteen middle schools, and
fourteen schools serving a combination of middle and high school students. One
school serves students at all grade levels. Another 30 schools serve only high
school students in grades 9-121. Some high schools will add grades each year
until they include all high school grades, while other high schools will add middle
school students until they serve all middle and high school grades.
1For a list of each Founding NYNSR school and the grades they serve, see Appendix H.
24WHO WE ARE: Students and Schools in the NYNSR Project, 1995-96
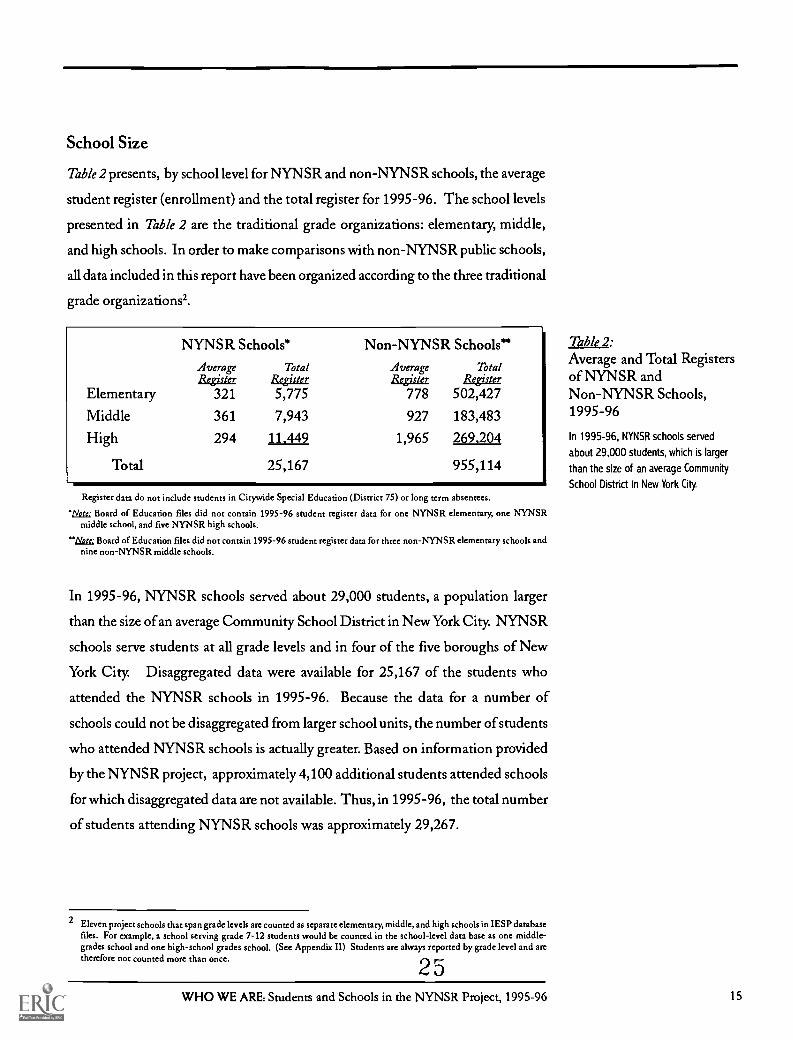
School Size
Table 2 presents, by school level for NYNSR and non-NYNSR schools, the average
student register (enrollment) and the total register for 1995-96. The school levels
presented in Table 2 are the traditional grade organizations: elementary, middle,
and high schools. In order to make comparisons with non-NYNSR public schools,
all data included in this report have been organized according to the three traditional
grade organizations'.
NYNSR Schools*
AverageRegister
TotalRegister
Non-NYNSRAverageRegister
Schools**
TotalRegister
Elementary 321 5,775 778 502,427
Middle 361 7,943 927 183,483
High 294 11,449 1,965 269,204
Total 25,167 955,114
Register data do not include students in Citywide Special Education (District 75) or long term absentees.
'Note,: Board of Education files did not contain 1995-96 student register data for one NYNSR elementary, one NYNSRmiddle school, and five NYNSR high schools.
"Note; Board of Education files did not contain 1995-96 student register data for three non-NYNSR elementary schools andnine non-NYNSR middle schools.
In 1995-96, NYNSR schools served about 29,000 students, a population larger
than the size of an average Community School District in New York City. NYNSR
schools serve students at all grade levels and in four of the five boroughs of New
York City. Disaggregated data were available for 25,167 of the students who
attended the NYNSR schools in 1995-96. Because the data for a number of
schools could not be disaggregated from larger school units, the number of students
who attended NYNSR schools is actually greater. Based on information provided
by the NYNSR project, approximately 4,100 additional students attended schools
for which disaggregated data are not available. Thus, in 1995-96, the total number
of students attending NYNSR schools was approximately 29,267.
2 Eleven project schools that span grade levels are counted as separate elementary, middle, and high schools in IESP databasefiles. For example, a school serving grade 7-12 students would be counted in the school-level data base as one middle-grades school and one high-school grades school. (See Appendix H) Students are always reported by grade level and aretherefore not counted more than once.
25WHO WE ARE: Students and Schools in the NYNSR Project, 1995-96
Table 2:Average and Total Registersof NYNSR andNon-NYNSR Schools,1995-96
In 1995-96, NYNSR schools served
about 29,000 students, which is larger
than the size of an average Community
School District in New York City.
15
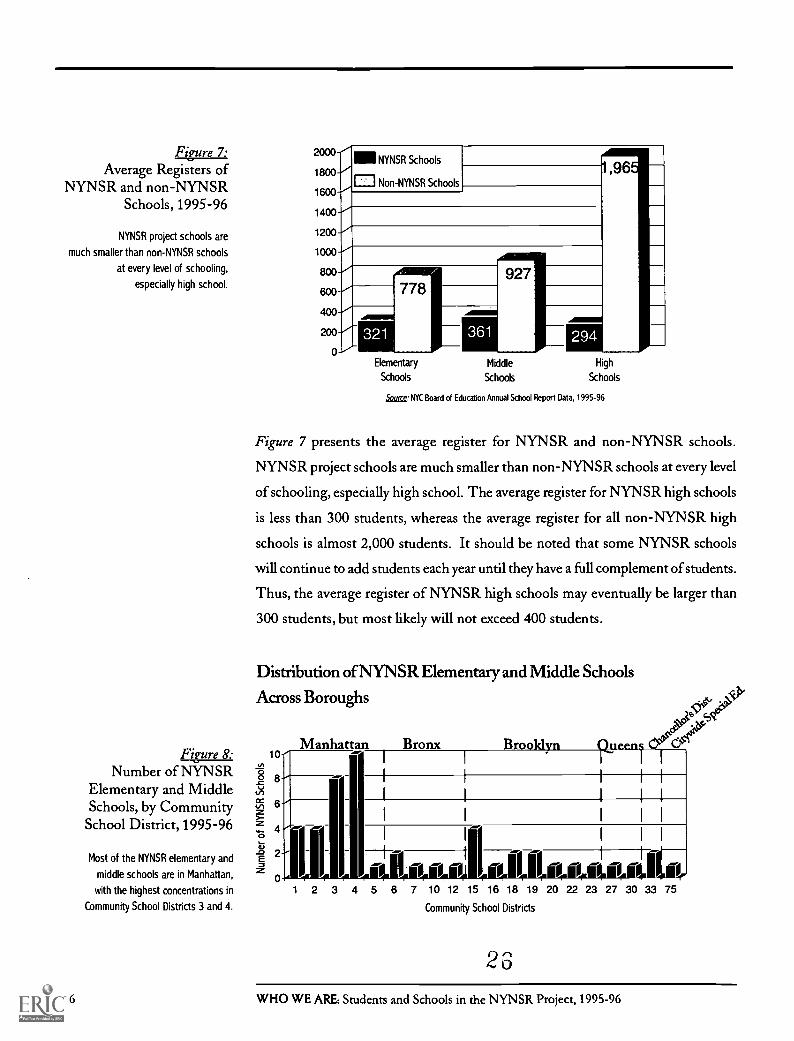
Figure 7:Average Registers of
NYNSR and non-NYNSRSchools, 1995-96
NYNSR project schools are
much smaller than non-NYNSR schools
at every level of schooling,
especially high school.
Figure 8:Number of NYNSR
Elementary and MiddleSchools, by Community
School District, 1995-96
Most of the NYNSR elementary and
middle schools are in Manhattan,
with the highest concentrations in
Community School Districts 3 and 4.
16
2000
1800
1600
1400
1200
1000
800
600
400
200
0
NYNSR Schools
Non-NYNSR Schools
1,96'EN
927778
361 294
Elementary Middle High
Schools Schools Schools
,Source: NYC Board of Education Annual School Report Data, 1995-96
Figure 7 presents the average register for NYNSR and non-NYNSR schools.
NYNSR project schools are much smaller than non-NYNSR schools at every level
of schooling, especially high school. The average register for NYNSR high schools
is less than 300 students, whereas the average register for all non-NYNSR high
schools is almost 2,000 students. It should be noted that some NYNSR schools
will continue to add students each year until they have a full complement of students.
Thus, the average register of NYNSR high schools may eventually be larger than
300 students, but most likely will not exceed 400 students.
Distribution of NYN SR Elementary and Middle Schools
Across Boroughsoff.
ce?P.
Bronx Brooklyn queens O'C
1 2 3 4 5 6 7 10 12 15 16 18 19 20 22 23 27 30 33 75Community School Districts
2
WHO WE ARE: Students and Schools in the NYNSR Project, 1995-96
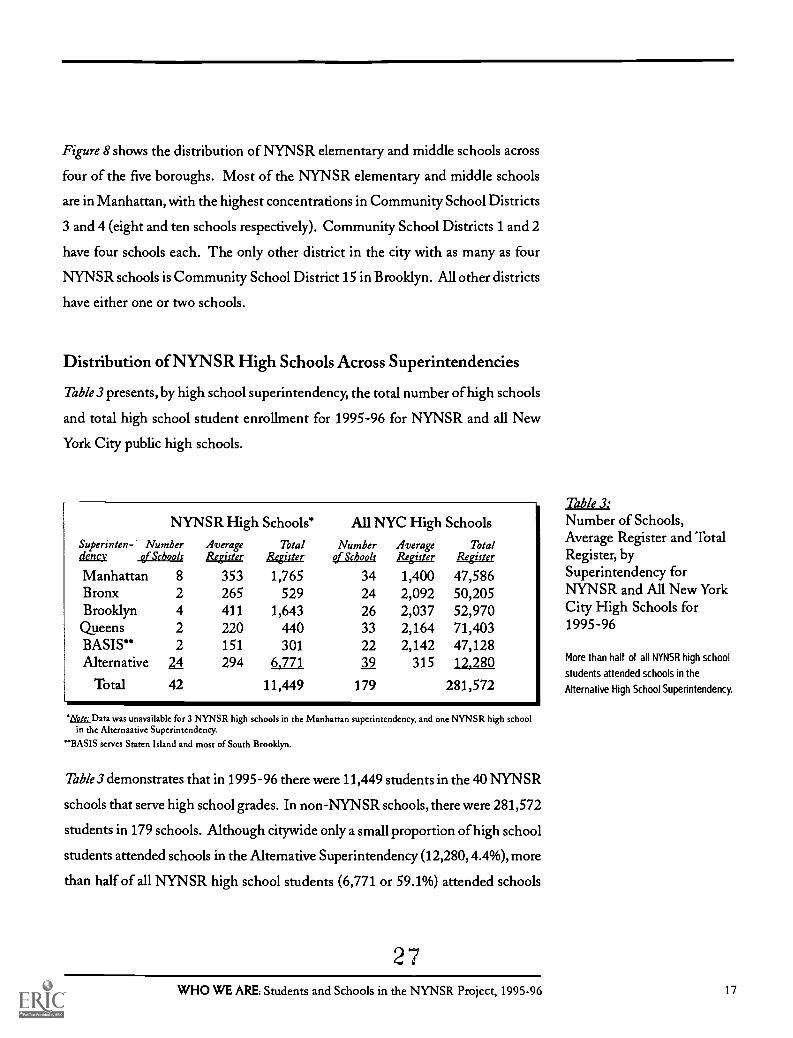
Figure 8 shows the distribution of NYNSR elementary and middle schools across
four of the five boroughs. Most of the NYNSR elementary and middle schools
are in Manhattan, with the highest concentrations in Community School Districts
3 and 4 (eight and ten schools respectively). Community School Districts 1 and 2
have four schools each. The only other district in the city with as many as four
NYNSR schools is Community School District 15 in Brooklyn. All other districts
have either one or two schools.
Distribution of NYNSR High Schools Across Superintendencies
Table 3 presents, by high school superintendency, the total number of high schools
and total high school student enrollment for 1995-96 for NYNSR and all New
York City public high schools.
NYNSRSuperinten- Numberdency of Schools
High Schools*
Average TotalRegister Register
All NYC
Numberof Schools
High Schools
Average TotalRegister Register
Manhattan 8 353 1,765 34 1,400 47,586Bronx 2 265 529 24 2,092 50,205Brooklyn 4 411 1,643 26 2,037 52,970
Queens 2 220 440 33 2,164 71,403BASIS** 2 151 301 22 2,142 47,128Alternative 294 6.771 39 315 12,280
Total 42 11,449 179 281,572
'Note: Data was unavailable for 3 NYNSR high schools in the Manhattan superintendency, and one NYNSR high schoolin the Alternaative Superintendency.
"BASIS serves Staten Island and most of South Brooklyn.
Table 3 demonstrates that in 1995-96 there were 11,449 students in the 40 NYNSR
schools that serve high school grades. In non-NYNSR schools, there were 281,572
students in 179 schools. Although citywide only a small proportion of high school
students attended schools in the Alternative Superintendency (12,280, 4.4%), more
than half of all NYNSR high school students (6,771 or 59.1%) attended schools
27WHO WE ARE: Students and Schools in the NYNSR Project, 1995-96
Table 3:Number of Schools,Average Register and TotalRegister, bySuperintendency forNYNSR and All New YorkCity High Schools for1995-96
More than half of all NYNSR high school
students attended schools in the
Alternative High School Superintendency.
17
in this Superintendency. The next largest group of NYNSR high school students
attended schools in the Manhattan Superintendency. Within the Alternative
Superintendency, schools are located within four of the five boroughs: twelve in
Manhattan, five in the Bronx, four in Brooklyn, and three in Queens. About half
of the students attending schools in the Alternative Superintendency are attending
schools in Manhattan.
Table 3 also shows the average register of NYNSR high schools. The average
registers of these schools, ranging from 151 to 411 students, are in sharp contrast
to other borough-based NYC public high schools which have average registers
ranging from 1,400 to 2,164 students. Average total registers for the Alternative
high schools, like NYNSR high schools, are much smaller.
Comparisons of students attending NYNSR schools with students attending
different kinds of New York City public high schools (e.g., zoned or educational
option) will be presented in a subsequent report.
28
18 WHO WE ARE: Students and Schools in the NYNSR Project, 1995-96
V. DISCUSSION
As stated previously, the percentage of students who are designated as Limited
English Proficient (LEP) or requiring special education is lower at NYNSR schools
than at non-NYNSR schools. It is unclear, however, whether the NYNSR schools
are actually serving fewer LEP students or students requiring special education, or
whether NYNSR schools are using different policies and practices for designating
students as requiring special education or LEP and serving them in different types
of educational programs.
To address these issues, the Institute has designed a survey for administration to a
random sample of NYNSR school directors. Whenever patterns in the data present
questions or inconsistencies, IESP will investigate the underlying issues..
The NYNSR schools are not evenly dispersed throughout the city; more NYNSR
schools are in Manhattan than in any other borough. This concentration may be
due to varying Community School District policies about initiating schools and
encourging school choice, or it may reflect different polices about student recruitment
and enrollment. IESP is conducting additional analyses which compare NYNSR
schools to different subgroups of non-NYNSR schools to explore this issue.
Since all the information presented in this report is based on school-level data, the
data could not be disaggregated to examine the characteristics of different groups
of students. For example, the performance on reading and math tests of entering
students, as against students who have been in NYNSR schools for different periods
of time, could not be disaggregated.
As part of the evaluation design, IESP is constructing a student-level database of
all students in NYNSR schools, to examine the characteristics and performance
of discrete groups of students. These data will allow IESP to report longitudinally
on the attrition, mobility and stability rates of NYNSR students, as well as to
examine graduation and drop-out rates and performance on standard achievement
29
WHO WE ARE: Students and Schools in the NYNSR Project, 1995-96
It is unclear whether the NYNSR schools
are actually serving fewer LEP students
or students requiring special education,
or whether NYNSR schools are using
different policies and practices for
designating students as requiring special
education or LEP and serving them in
different types of educational programs.
IESP is constructing a student-level
database of all students in NYNSR
schools, to examine the characteristics
and performance of specific groups of
students. These data will allow IESP to
report longitudinally on the attrition,
mobility and stability rates of NYNSR
students, as well as to examine graduation
and drop-out rates and performance on
standard achievement measures.
19
measures. In addition, IESP is identifying in cooperation with the New York
City Board of Education a comparison group of schools with similar student
populations. Using the NYNSR student database and the comparison group, IESP
will conduct analyses comparing the progress and performance of students in
NYNSR and non-NYNSR schools over time.
3'0
20 WHO WE ARE: Students and Schools in the NYNSR Project, 1995-96
APPENDIX I:
Notes About Data Sources for the School-Level Database
The New York City Board of Education manages the reporting of school data
centrally and assigns a unique Building-District-School (BDS) identification code
to each school. Thus the Board of Education is able to track and assign data to
particular schools and identify multiple units (schools) within a single facility.
All New York City public schools, except those in Citywide Special Education,
fall under the jurisdiction of one of three organizational entities: a Community
School District, the Division of High Schools, or the Chancellor's District. Several
separate divisions at the central Board of Education maintain school data; one
unit maintains elementary and middle school data, while another unit maintains
high school data. Data for schools serving grades 9 through 12 is managed by the
Division of High Schools (now the Division of Student Support Services), while
Community School District data is managed by the Office of Student Information
Services and the Division of Assessment and Accountability. In the past, very few
Community School Districts opened high schools. Starting in the early 1990s,
however, some new small schools initiated by Community School Districts also
served high school grades. Data management for these schools is still in flux.
For a variety of reasons, several NYNSR schools are still formally treated as
programs, and therefore have no unique BDS code in the Board of Education's
data systems. This creates at least three reporting limitations within the NYNSR
evaluation's school-level database. First, for some schools data are entirely missing
or are not disaggregated from a larger facility. As of the writing of WHO WE ARE,
five NYNSR founding schools have not been assigned a unique BDS identification
code and are therefore not included in the NYNSR evaluation school-level
database'. For example, the data for NYNSR's Business Leadership Institute at
3The 1995-96 data sources recognize approximately 85% of the NYNSR founding schools. Data are missing from ourschool-level database for the following schools because their student data were not disaggregated from their larger schoolbuildings: Community Service Academy, Muscota New School, New Program at PS 261, Rockaway New School, BusinessLeadership Institute at South Shore High School and Urban Academy. The data from Schomberg and Forsythe campusesof Satellite Academy are also not available disaggregated, but since these students are included in the Satellite Academy-Chambers report, they are counted in all summary calculations.
31WHO WE ARE: Students and Schools in the NYNSR Project, 1995-96 21
South Shore High School (B LI SS), which serves approximately 15% of the school's
student body, is not disaggregated and is not included in the NYNSR school
database.
Second, data for certain grades within NYNSR schools cannot be disaggregated.
For example, middle school students who attend Eastside Community High School
are aggregated within another non-project school entity. Thus, we have data for
grades 9-12 for Eastside, but not grades 7-8.
Third, there are a number of schools that have multiple BDS codes and are therefore
counted as separate schools. For example, The Children's School, a school which
draws general education and special education students from Community School
District 15 and also draws special education students from Citywide Special
Education, has its data stored under two BDS codes. However, when this report
presents aggregate data summarized across grade levels, Children's School students
are counted as one student body.
32
22 WHO WE ARE: Students and Schools in the NYNSR Project, 1995-96
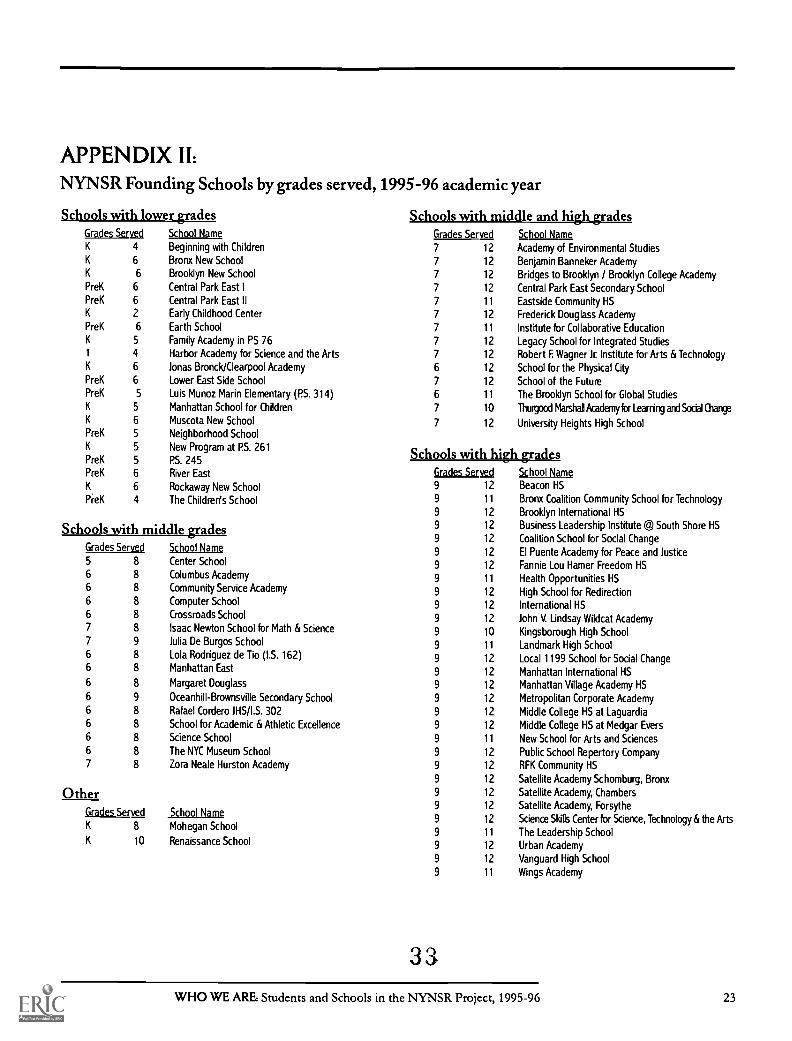
APPENDIX II:NYNSR Founding Schools by grades served, 1995-96 academic year
Schools with lower gradesGrades Served School Name
K 4 Beginning with ChildrenK 6 Bronx New SchoolK 6 Brooklyn New SchoolPreK 6 Central Park East IPreK 6 Central Park East IIK 2 Early Childhood Center
PreK 6 Earth SchoolK 5 Family Academy in PS 761 4 Harbor Academy for Science and the ArtsK 6 Jonas Bronck/Clearpool AcademyPreK 6 Lower East Side SchoolPreK 5 Luis Munoz Marin Elementary (PS. 314)K 5 Manhattan School for ChildrenK 6 Muscota New SchoolPreK 5 Neighborhood SchoolK 5 New Program at P.S. 261
PreK 5 PS. 245PreK 6 River East
6 Rockaway New SchoolPi-eK 4 The Children's School
Schools with middle gradesGrades Served
5 86 86 86 86 87 87 9
6 86 8
6 8
6 9
6 86 8
6 8
6 8
7 8
OtherGrades Served
K 8
K 10
School Name
Center School
Columbus Academy
Community Service Academy
Computer School
Crossroads School
Isaac Newton School for Math & ScienceJulia De Burgos School
Lola Rodriguez de Tio (I.S. 162)Manhattan East
Margaret Douglass
Oceanhill-Brownsville Secondary School
Rafael Cordero JHS/I.S. 302
School for Academic & Athletic Excellence
Science School
The NYC Museum School
Zora Neale Hurston Academy
School Name
Mohegan School
Renaissance School
Schools with middle and high gradesrades Served
7 12
7 12
7 12
7 12
7 11
7 12
7 11
7 12
7 12
6 12
7 12
6 11
7 10
7 12
School Name
Academy of Environmental Studies
Benjamin Banneker Academy
Bridges to Brooklyn / Brooklyn College Academy
Central Park East Secondary School
Eastside Community HS
Frederick Douglass Academy
Institute for Collaborative Education
Legacy School for Integrated StudiesRobert E Wagner Jr Institute for Arts & Technology
School for the Physical City
School of the FutureThe Brooklyn School for Global Studies
Thurgood Marshall Academy for Learning and Sodal Change
University Heights High School
Schools with high gradesGrades Served
9 12
9 11
9 12
9 12
9 12
9 12
9 12
9 11
9 12
9 12
9 12
9 10
9 11
9 12
9 12
9 12
9 12
9 12
9 12
9 11
9 12
9 12
9 12
9 12
9 12
9 12
9 11
9 12
9 12
9 11
33
ahool NameBeacon HS
Bronx Coalition Community School for Technology
Brooklyn International HSBusiness Leadership Institute @ South Shore HS
Coalition School for Social Change
El Puente Academy for Peace and Justice
Fannie Lou Hamer Freedom HS
Health Opportunities HS
High School for RedirectionInternational HS
John V. Lindsay Wildcat Academy
Kingsborough High SchoolLandmark High School
Local 1199 School for Social Change
Manhattan International HSManhattan Village Academy HS
Metropolitan Corporate Academy
Middle College HS at Laguardia
Middle College HS at Medgar Evers
New School for Arts and Sciences
Public School Repertory CompanyRFK Community HS
Satellite Academy Schomburg, Bronx
Satellite Academy, Chambers
Satellite Academy, Forsythe
Science Skills Center for Science, Technology & the Arts
The Leadership SchoolUrban Academy
Vanguard High School
Wings Academy
WHO WE ARE: Students and Schools in the NYNSR Project, 1995-96 23
SIn
IID
1573 Madison Avenue, Room 318New York, NY 10029-3899
(212) 369-1288 (212) 369-0765 (Fax)
http://www.nynetworks.inter.net
34 BEST COPY AVAILABLE
U.S. Department of EducationOffice of Educational Research and Improvement (OERI)
National Library of Education (NLE)Educational Resources Information Center (ERIC)
REPRODUCTION RELEASE(Specific Document)
I. DOCUMENT IDENTIFICATION:
ERICUX.1.12.3076
Title:Who We Are: Students and Schools in the NYNSR Project, 1995-96
Author(s): Tnst i thhtP fnr Ed,u and Social P.
Corporate Source: Publication Date:
July 1997
II. REPRODUCTION RELEASE:In order to disseminate as widely as possible timely and significant materials of interest to the educationalcommunity, documents announced in the
monthly abstract journal of the ERIC system, Resources in Education (RIE), are usually made available to users in microfiche, reproduced paper copy,
and electronic media, and sold through the ERIC Document Reproduction Service (EDRS). Credit is given to the source of each document, and, ifreproduction release is granted, one of the following notices is affixed to the document.
If permission is granted to reproduce and disseminate the identified document, please CHECK ONE of the following three options and sign at the bottom
of the page.
The sample slicker shown below will beaffixed to an Level 1 documents
PERMISSION TO REPRODUCE ANDDISSEMINATE THIS MATERIAL HAS
BEEN GRANTED BY
ND
TO THE EDUCATIONAL RESOURCESINFORMATION CENTER (ERIC)
Levet 1
Cheat here for Level I release. permitting reproductionand dissemination In mIcroliche or other ERIC ardtival
media (e.g., electronic) and paper copy.
Signhere, -please
The sample sticker shown below will beallbsd to an Level 2A doamtents
PERMISSION TO REPRODUCE ANDDISSEMINATE THIS MATERIAL IN
MICROFICHE, AND IN ELECTRONIC MEDIAFOR ERIC COLLECTION SUBSCRIBERS ONLY,
HAS BEEN GRANTED BY
2A
\e
Sa
TO THE EDUCATIONAL RESOURCESINFORMATION CENTER (ERIC)
Level 2A
Check hers for Level 2A release. pemittbng reproductionand dissoninagon In microfiche and In electronic media
for ERIC wchlval collection subscribers only
The sample sticker shown below will beaffixed to ell Level 28 documents
PERMISSION TO REPRODUCE ANDDISSEMINATE THIS MATERIAL IN
MICROFICHE ONLY HAS BEEN GRANTED BY
2B
TO THE EDUCATIONAL RESOURCESINFORMATION CENTER (ERIC)
Level 2B
I
Check here for Level 28 release, permittingreproduction and dissemination in microfiche only
Documents MI be processed as Indicated provided reproduction quality permits.If permission to reproduce Is granted. but no box Is cheated. documents will be processed el Level 1.
I hereby grant to the Educational Resoun;es information Center (ERIC) nonexclusive permission to reproduce anddisseminate this document
as indicated above. Reproduditin from the ERIC microfiche or electronic media by persons other than ERIC employees and its systemcontractors requires permission from the copyright holder. Exception is made for non-profit reproduction by libraries and other service agendas
to satisfy igfamation educators in response to discrete inquiries.
(a eAddress:
Institute for Education and Social PolioNYU, 285 Mercer Street
Printed NameiPostionffltis:
Norm FruchterTelephoto
(217)0([email protected]
FAX
(?1 )(1q5-4564_pen/21/98
III. DOCUMENT AVAILABILITY INFORMATION (FROM NON-ERIC SOURCE):
If permission to reproduce is not granted to ERIC, or, if you wish ERIC to cite the availability of the document from another source, pleaseprovide the following information regarding the availability of the document. (ERIC will not announce a document unless it is publiclyavailable, and a dependable source can be specified. Contributors should also be aware that ERIC selection criteria are significantly morestringent for documents that cannot be made available through EDRS.)
Publisher/Distributor.
Address:
Price:
IV. REFERRAL OF ERIC TO COPYRIGHT/REPRODUCTION RIGHTS HOLDER:If the right to grant this reproduction release is held by someone other than the addressee, please provide the appropriate name andaddress:
Name:
Address:
V. WHERE TO SEND THIS FORM:
Send this form to the following ERIC Clearinghouse:
ERIC Clearinghouse on Urban EducationBox 40, Teachers College
Columbia UniversityNew York, NY 10027
However, if solicited by the ERIC Facility, or if making an unsolicited contribution to ERIC, return this form (and the document beingcontributed) to:
ERIC Processing and Reference Facility1 100 West Street, rd Floor
Laurel, Maryland 20707-3598
Telephone: 301-497-4080Toll Free: 800-799-3742
FAX: 301-953-0263e-mall: [email protected]
WWW: http:llericfac.plccard.csc.com
EFF-ORR Maw 9/07%