
Twentieth century trends in dew Twentieth century trends in dew point temperature throughout the point temperature throughout the
Upper MidwestUpper Midwest
Jesse WartmanJesse Wartman
Mentors: Daryl Herzmann and Dr. Eugene TakleMentors: Daryl Herzmann and Dr. Eugene Takle
Why are dew-point Why are dew-point temperatures important?temperatures important?
Important in forecastingUsed for specific and relative humiditiesRegulate transpiration and evaporation processesKey factors in the surface energy and hydrological budgetsWater vapor is the strongest contribution to the greenhouse effect

Past StudiesPast StudiesGaffen and Ross (1999)
Increase through spring and fall
Robinson (1998)Dew points were lower in the Upper Midwest during the winter
Robinson (2000)Increase of 0.9°F per 100 years over U.S.Increase over spring and fall

Possible ErrorsPossible ErrorsNon-uniform stations
Technology and instrument changes
1950s - sling psychrometers1960s – dial hygrothermometersMost recent – HO-83 dial hygrothermometer (NWS)
HypothesesHypotheses
Dew-point temperatures have experienced significant, positive trends over the past 44 years in the Upper Midwest.
Those dew-point temperature tendencies are no different from trends that have been found across the rest of the United States in past studies.

Data and MethodsData and MethodsHourly obs through IEM from the NCDC1961-2005MonthlySeasonal
Winter - December, January, & FebruarySpring - March, April & MaySummer - June, July & AugustFall - September, October, & November
YearlyDecadal
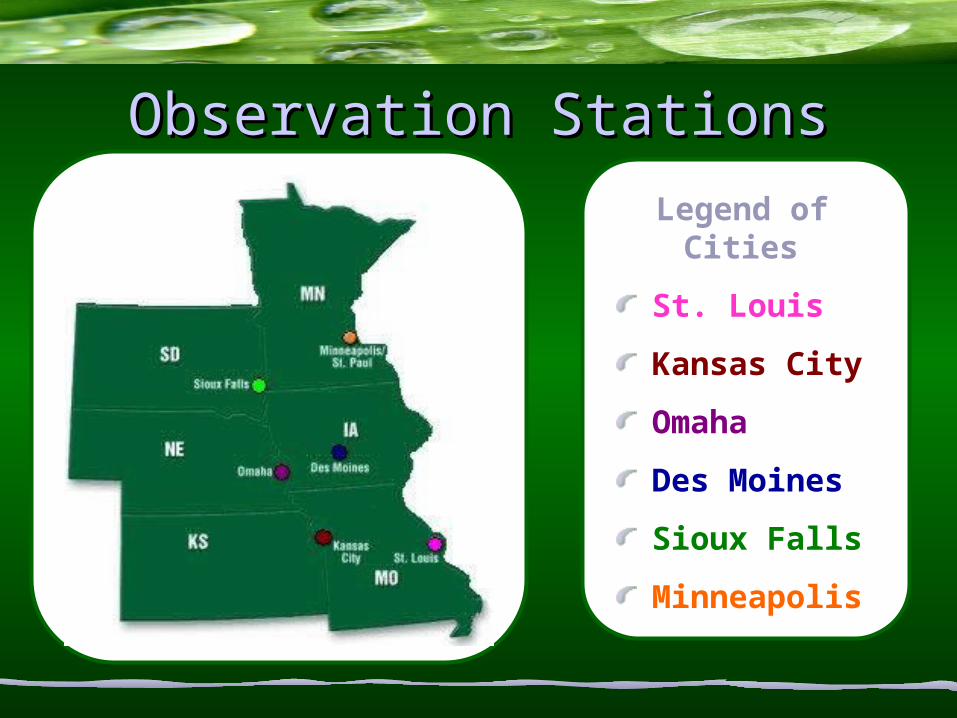
Observation StationsObservation StationsLegend of Cities
St. Louis
Kansas City
Omaha
Des Moines
Sioux Falls
Minneapolis

Missing DataMissing DataSioux Falls – 0%Minneapolis – 18% - data gap – decadal averages were substituted in, no significant change so left outOmaha – 30.11% - no data before 1974Des Moines – 1.33% - data gapKansas City – 27.27% - no data before 1973St. Louis – 27.27% - no data before 1973

SignificanceSignificance
Significant if P-value < 0.05Semi-significant if P-value < 0.1
P-Value – calculated in JMP, observed significance probability from t-ratios
T-ratio – tests hypothesis that each parameter is zero, ratio of the parameter estimate to its standard error
RESULTSRESULTS
Monthly Climatic TrendsSeasonal climatic trends
Yearly average climatic trendsDecadal climatic trendsTwenty-two year climatic
trendsExtreme days
Precipitable water

Monthly Climatic TrendsMonthly Climatic TrendsP-Value < 0.05P-Value < 0.05 – – P-value < 0.1P-value < 0.1
MPLS January Februrary March April May June July August September October Novemeber DecemberSlope 0.083 0.1489 0.0353 0.0439 0.00875 0.02995 0.0415 0.0595 0.051 -0.0156 0.011 0.201P-Value 0.0068 0.0932 0.5524 0.275 0.8698 0.401 0.173 0.0793 0.2325 0.764 0.853 0.0196
STL January Februrary March April May June July August September October Novemeber DecemberSlope 0.185 0.0865 -0.112 0.059 0.041 0.0227 0.0135 0.033 -0.035 0.037 -0.031 0.0084P-Value 0.0358 0.3335 0.1101 0.3046 0.601 0.6276 0.7246 0.462 0.4968 0.5824 0.6948 0.9309
DSM January Februrary March April May June July August September October Novemeber DecemberSlope 0.2199 0.139 0.07 0.053 0.048 0.035 0.07 0.09 0.0139 0.024 0.021 0.094
P-Value 0.0025 0.0354 0.127 0.1169 0.342 0.28 0.0043 0.0021 0.691 0.586 0.673 0.1682
FSD January Februrary March April May June July August September October Novemeber DecemberSlope 0.27 0.155 0.0527 0.055 0.061 0.0369 0.086 0.127 0.075 0.0037 0.0265 0.141P-Value 0.0008 0.0272 0.23 0.0891 0.1862 0.306 0.0032 0.0001 0.024 0.9355 0.5542 0.0323
OMA January Februrary March April May June July August September October Novemeber DecemberSlope 0.2597 0.1477 0.0386 0.00191 0.03987 0.0729 0.0858 0.0867 0.0246 0.09 0.0714 0.1234P-Value 0.0155 0.1933 0.609 0.9798 0.603 0.152 0.0503 0.0534 0.666 0.1723 0.404 0.2682
MCI January Februrary March April May June July August September October Novemeber DecemberSlope 0.313 0.178 -0.0215 0.0887 0.0924 0.0828 0.12 0.109 0.0417 0.092 0.092 0.13917P-Value 0.0012 0.076 0.758 0.189 0.2 0.0726 0.0192 0.0087 0.4623 0.189 0.272 0.179
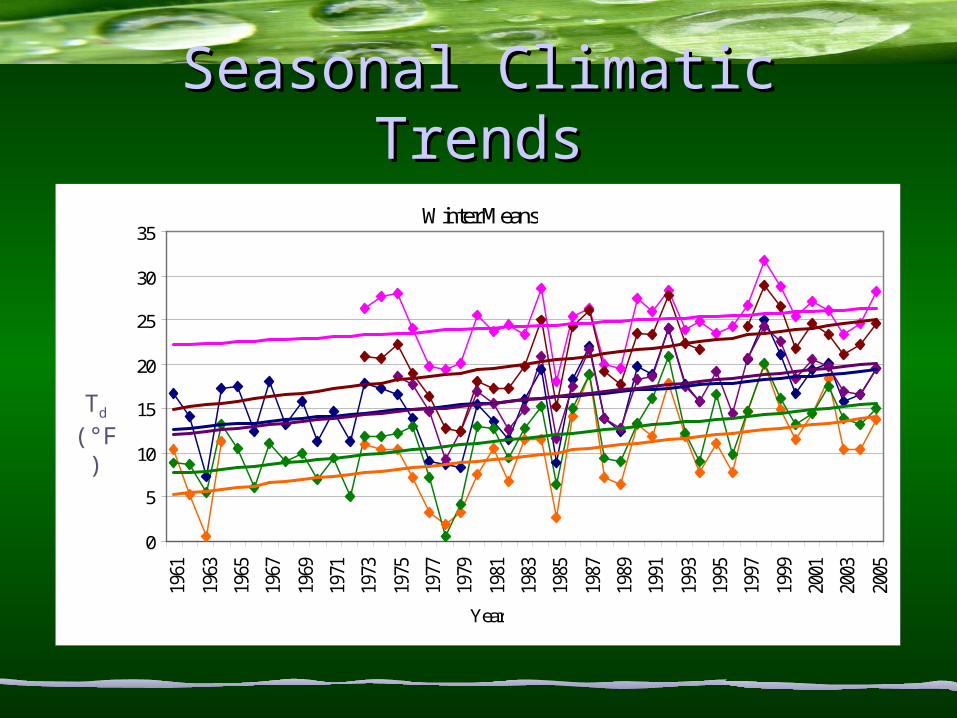
Seasonal Climatic TrendsSeasonal Climatic TrendsWinter Means
0
5
10
15
20
25
30
35
1961
1963
1965
1967
1969
1971
1973
1975
1977
1979
1981
1983
1985
1987
1989
1991
1993
1995
1997
1999
2001
2003
2005
Year
Td
(°F)

Seasonal Climatic TrendsSeasonal Climatic TrendsSpring Means
25
30
35
40
45
50
1961
1963
1965
1967
1969
1971
1973
1975
1977
1979
1981
1983
1985
1987
1989
1991
1993
1995
1997
1999
2001
2003
2005
Year
Td
(°F)
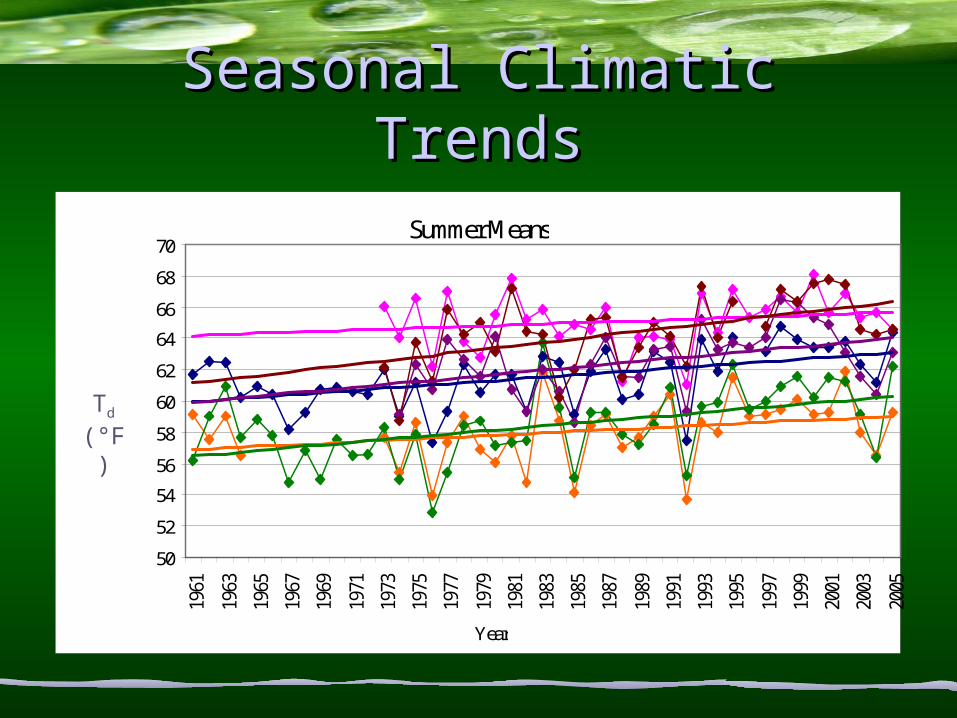
Seasonal Climatic TrendsSeasonal Climatic TrendsSummer Means
50
52
54
56
58
60
62
64
66
68
70
1961
1963
1965
1967
1969
1971
1973
1975
1977
1979
1981
1983
1985
1987
1989
1991
1993
1995
1997
1999
2001
2003
2005
Year
Td
(°F)
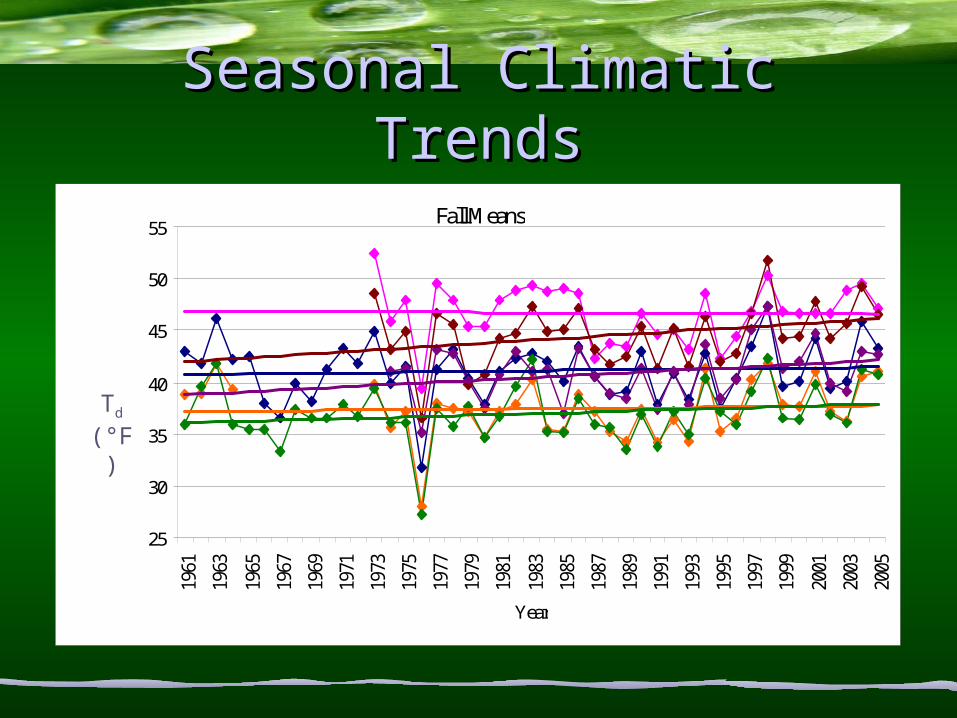
Seasonal Climatic TrendsSeasonal Climatic TrendsFall Means
25
30
35
40
45
50
55
1961
1963
1965
1967
1969
1971
1973
1975
1977
1979
1981
1983
1985
1987
1989
1991
1993
1995
1997
1999
2001
2003
2005
Year
Td
(°F)
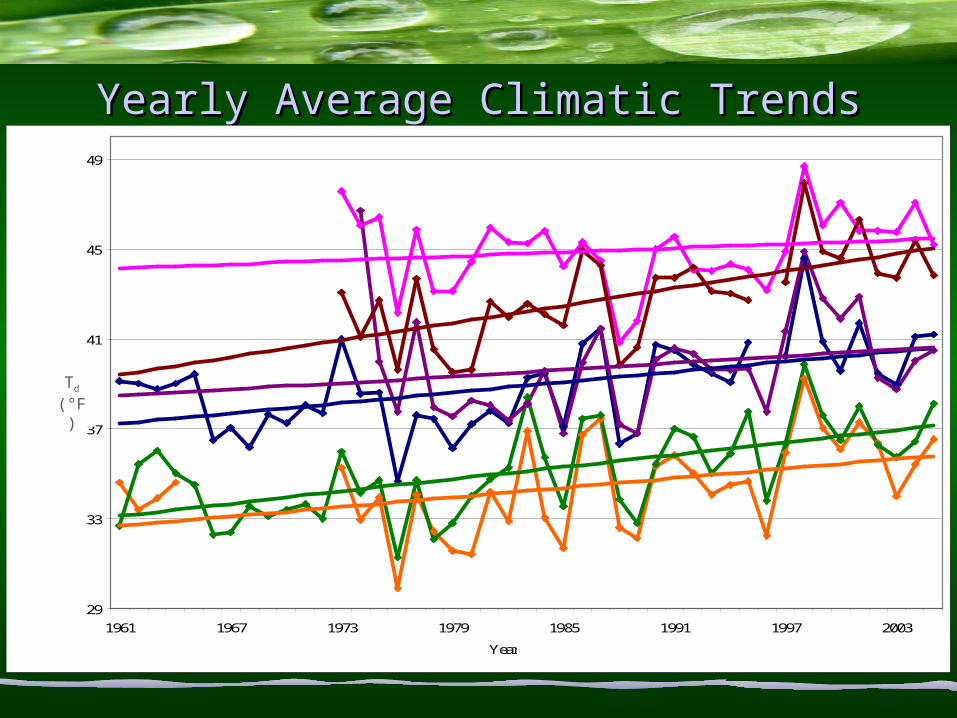
Yearly Average Climatic TrendsYearly Average Climatic Trends
29
33
37
41
45
49
1961 1967 1973 1979 1985 1991 1997 2003
Year
Td
(°F)
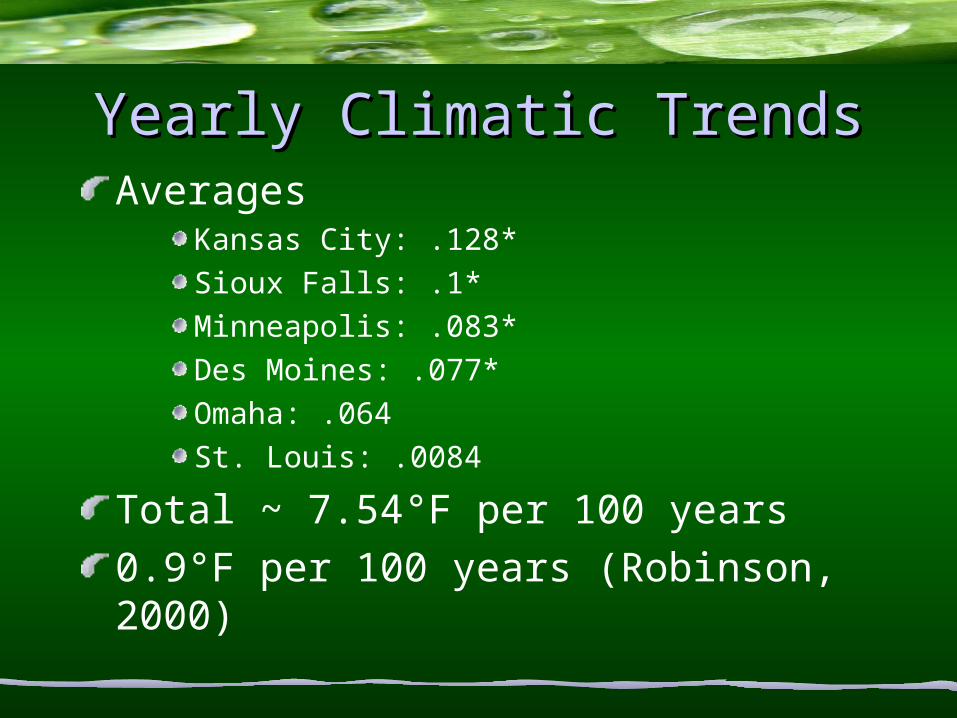
Yearly Climatic TrendsYearly Climatic TrendsAverages
Kansas City: .128*Sioux Falls: .1*Minneapolis: .083*Des Moines: .077*Omaha: .064St. Louis: .0084
Total ~ 7.54°F per 100 years0.9°F per 100 years (Robinson, 2000)

Decadal Climatic TrendsDecadal Climatic TrendsYearly Trend 1961-1970
30
32
34
36
38
40
1961 1962 1963 1964 1965 1966 1967 1968 1969 1970
Year
Yearly Trend 1971-1980
28
30
32
34
36
38
40
42
44
46
48
50
1971 1972 1973 1974 1975 1976 1977 1978 1979 1980
Year
Td
(°F)
Td
(°F)
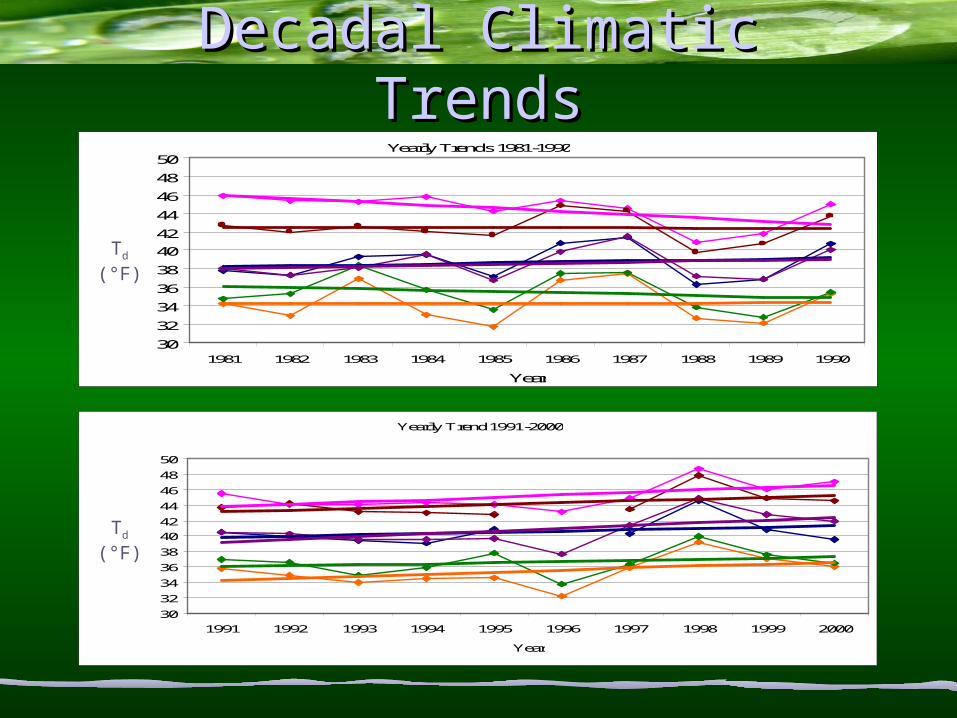
Decadal Climatic TrendsDecadal Climatic TrendsYearly Trends 1981-1990
30
32
34
36
38
40
42
44
46
48
50
1981 1982 1983 1984 1985 1986 1987 1988 1989 1990
Year
Yearly Trend 1991-2000
30
32
34
36
38
40
42
44
46
48
50
1991 1992 1993 1994 1995 1996 1997 1998 1999 2000
Year
Td
(°F)
Td
(°F)
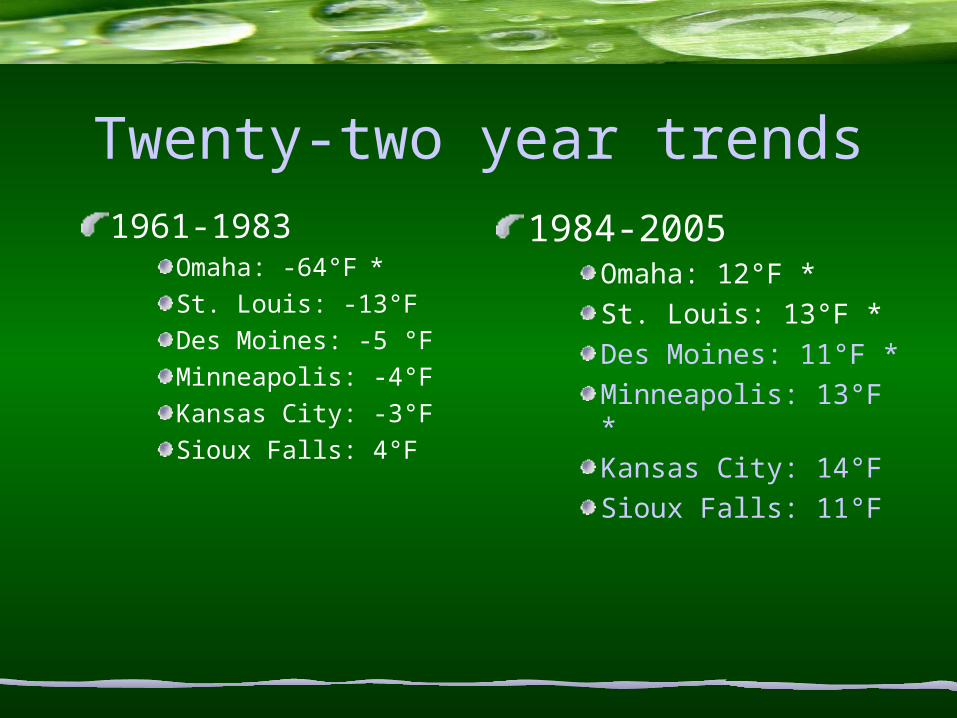
Twenty-two year trends1961-1983
Omaha: -64°F *
St. Louis: -13°F
Des Moines: -5 °FMinneapolis: -4°F
Kansas City: -3°F
Sioux Falls: 4°F
1984-2005Omaha: 12°F *St. Louis: 13°F *Des Moines: 11°F *Minneapolis: 13°F *Kansas City: 14°F Sioux Falls: 11°F

Twenty-two year trends
-70
-60
-50
-40
-30
-20
-10
0
10
20
OMA STL DSM MSP MCI FSD
1961-19831984-2005
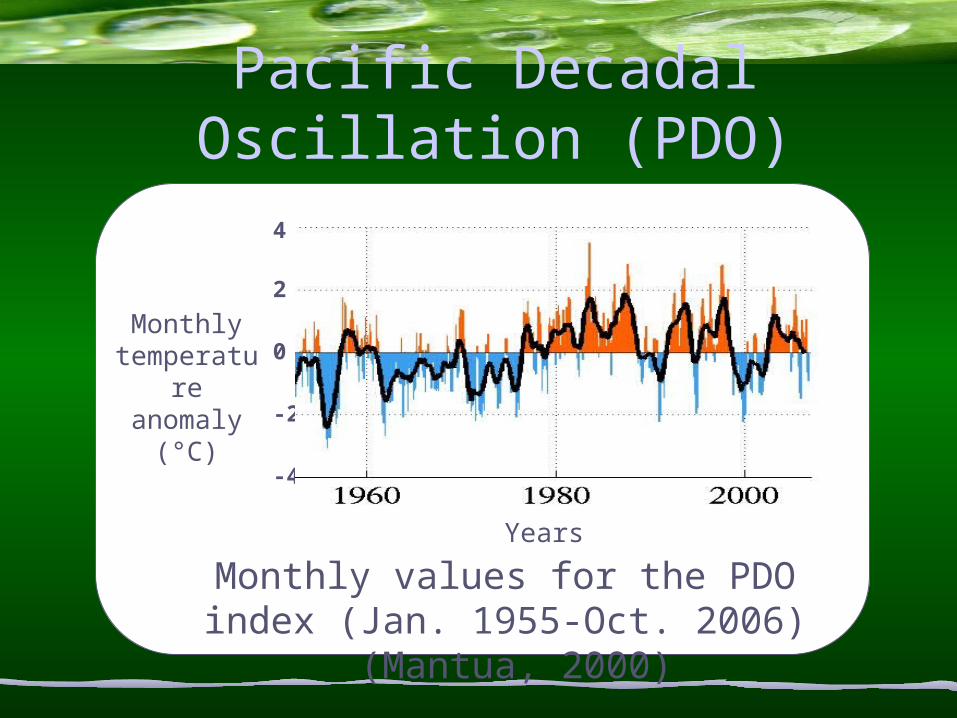
Pacific Decadal Oscillation (PDO)
Monthlytemperature
anomaly (°C)
4
2
0
-2
-4
Years
Monthly values for the PDO index (Jan. 1955-Oct. 2006) (Mantua, 2000)
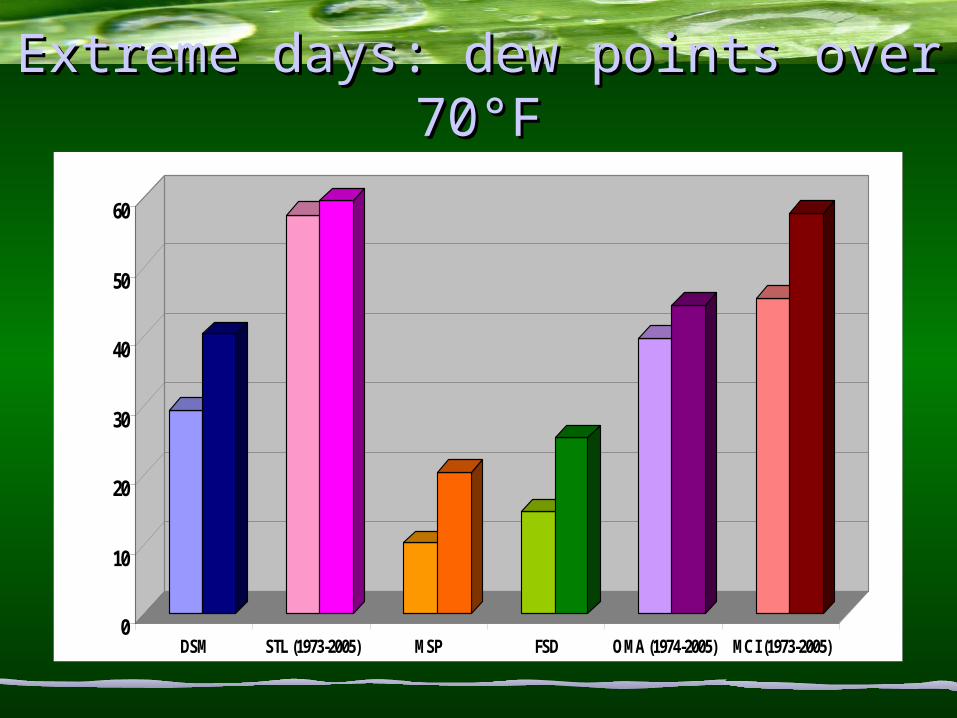
Extreme days: dew points over Extreme days: dew points over 70°F70°F
0
10
20
30
40
50
60
DSM STL (1973-2005) MSP FSD OMA (1974-2005) MCI (1973-2005)

Extreme days: dew points over Extreme days: dew points over 75°F75°F
0
5
10
15
20
25
DSM STL (1973-2005) MSP FSD OMA (1974-2005) MCI (1973-2005)
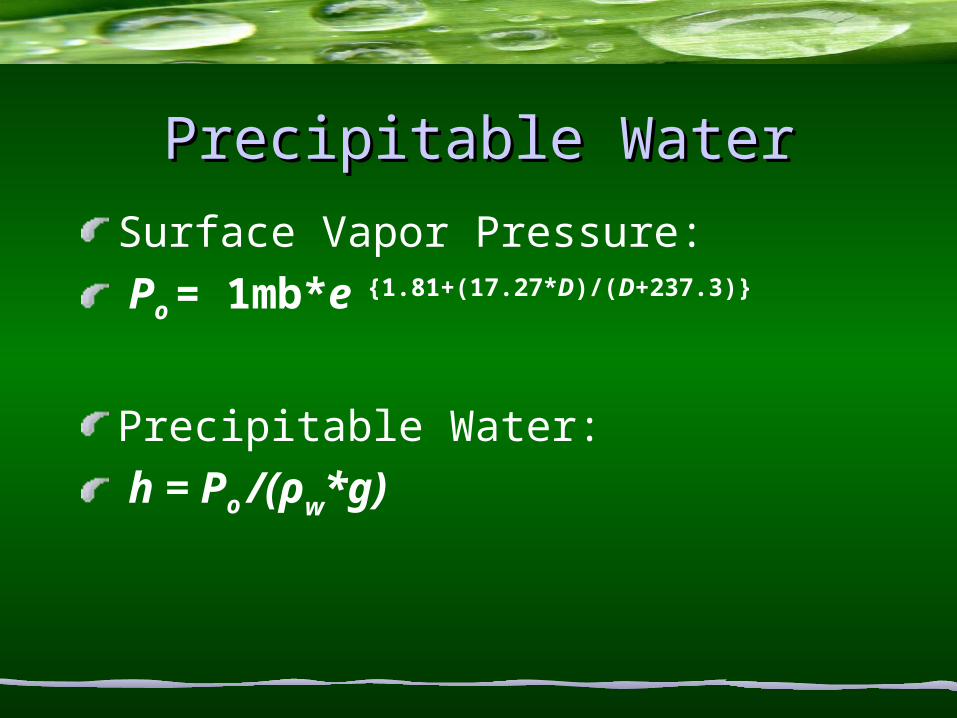
Precipitable WaterPrecipitable Water
Surface Vapor Pressure: Po = 1mb*e {1.81+(17.27*D)/(D+237.3)}
Precipitable Water: h = Po /(ρw*g)
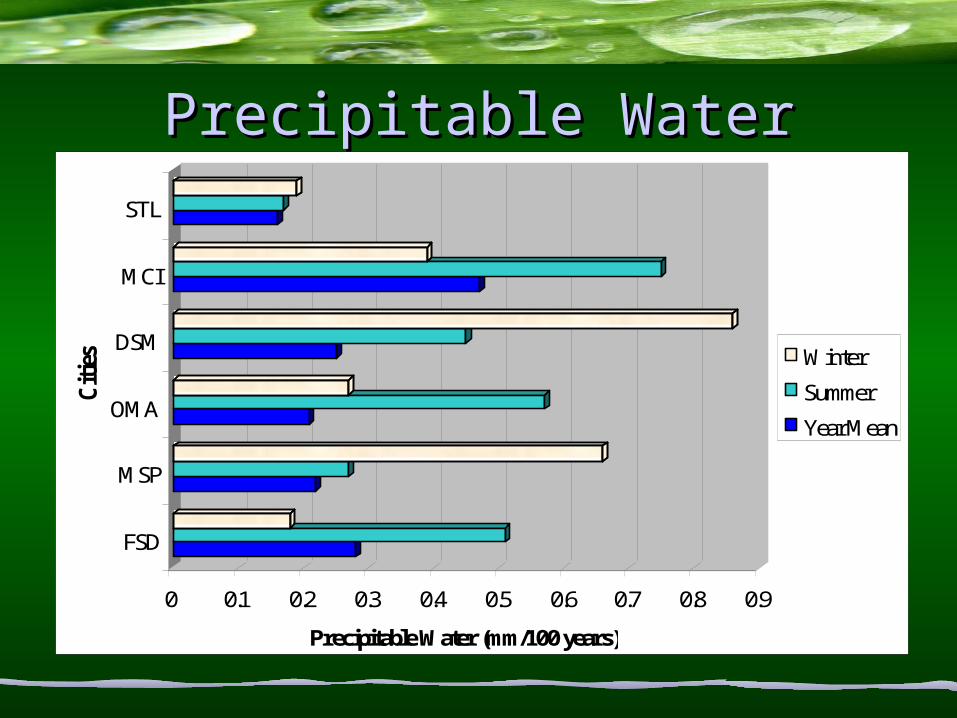
Precipitable WaterPrecipitable Water
0 0.1 0.2 0.3 0.4 0.5 0.6 0.7 0.8 0.9
Precipitable Water (mm/100 years)
FSD
MSP
OMA
DSM
MCI
STL
Cit
ies
.
Winter
Summer
Year Mean

ImplicationsImplications

ImplicationsImplicationsPrecipitationHeat stressCrop productionSoil errosionWater suppliesHuman healthHeat waves
Concluding RemarksConcluding RemarksShift from negative trend to positive trendPositive overall trendHypotheses
Dew-point temperatures have experienced significant, positive trends over the past 44 years in the Upper Midwest. -> TRUEThose dew-point temperature tendencies are no different from trends that have been found across the rest of the United States in past studies. -> FALSE
7.54°F over 100 years in Upper Midwest0.9°F over 100 years in United States
Future WorkFuture Work
Modelling studiesFuture increases?Increase in greenhouse gasesPDO
El Niño
Atlantic OscillationOther factors

AcknowledgementsAcknowledgements
Daryl E. HerzmannEugene S. TakleJon Hobbs