EACCTB 2019
Disclosure
EACCTB 2019
EACCTB 2019
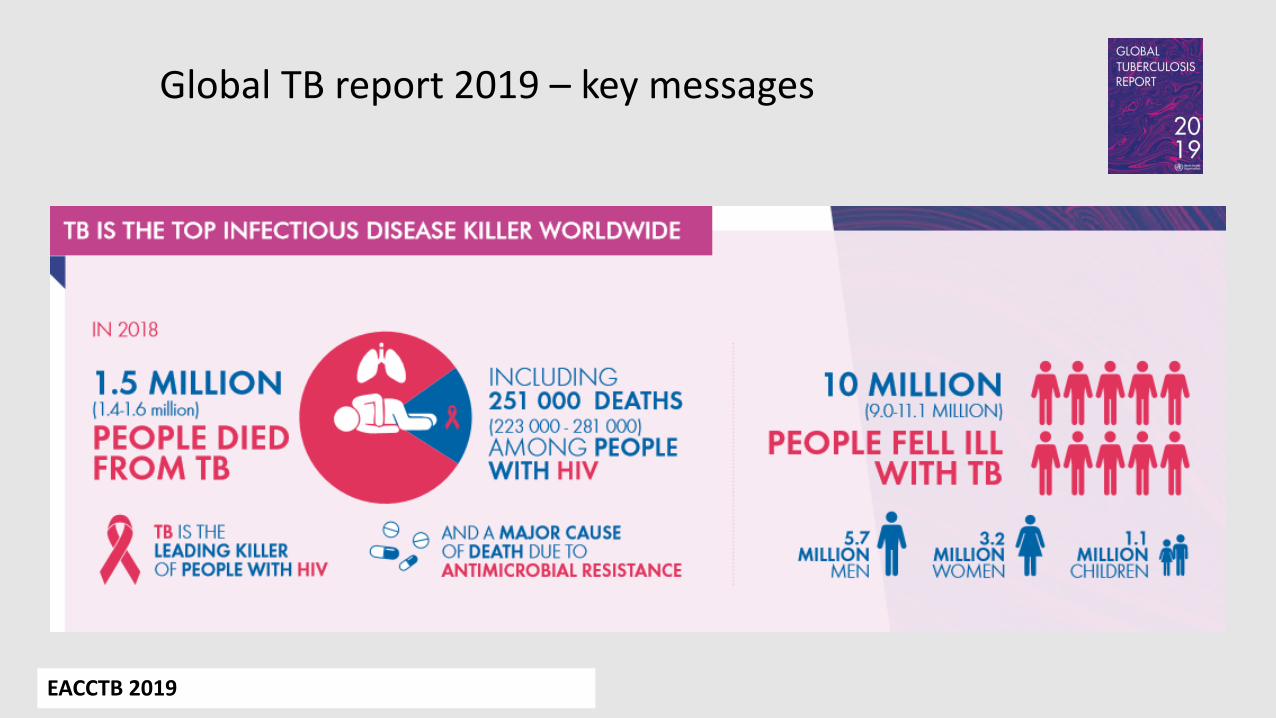
Global TB report 2019 – key messages
EACCTB 2019
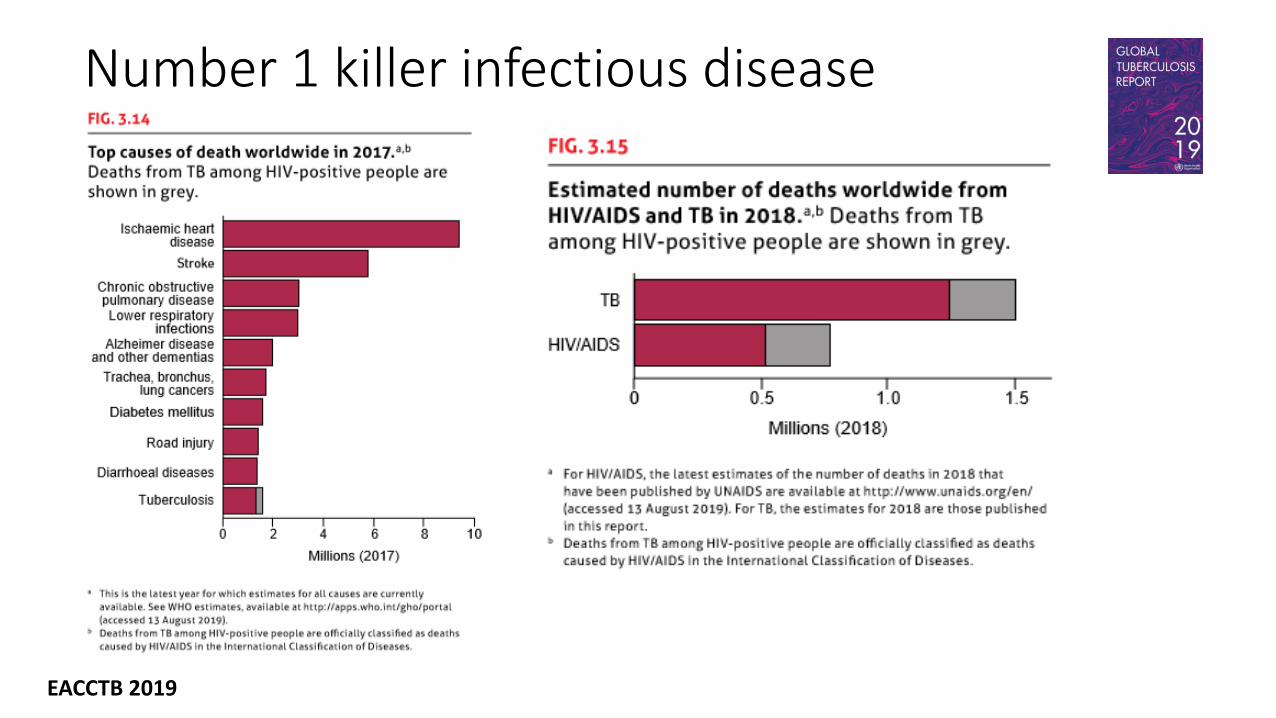
Number 1 killer infectious disease
EACCTB 2019

EACCTB 2019

EACCTB 2019
EACCTB 2019
EACCTB 2019
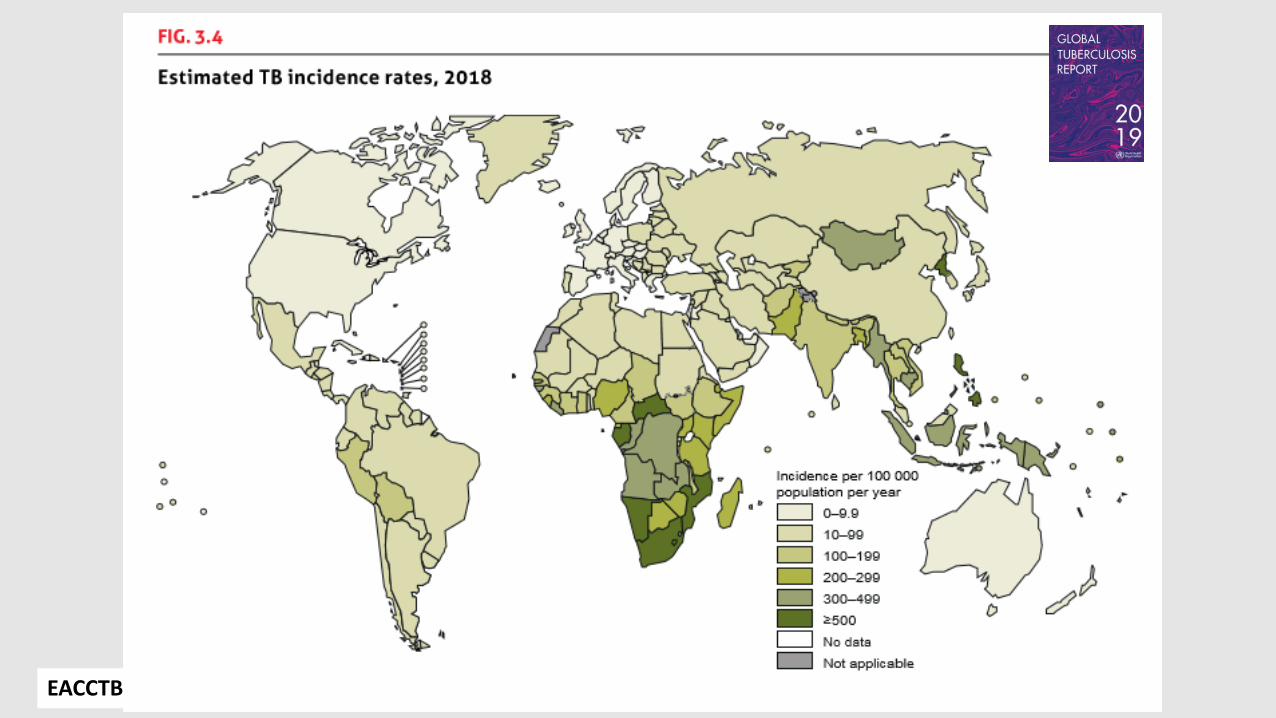
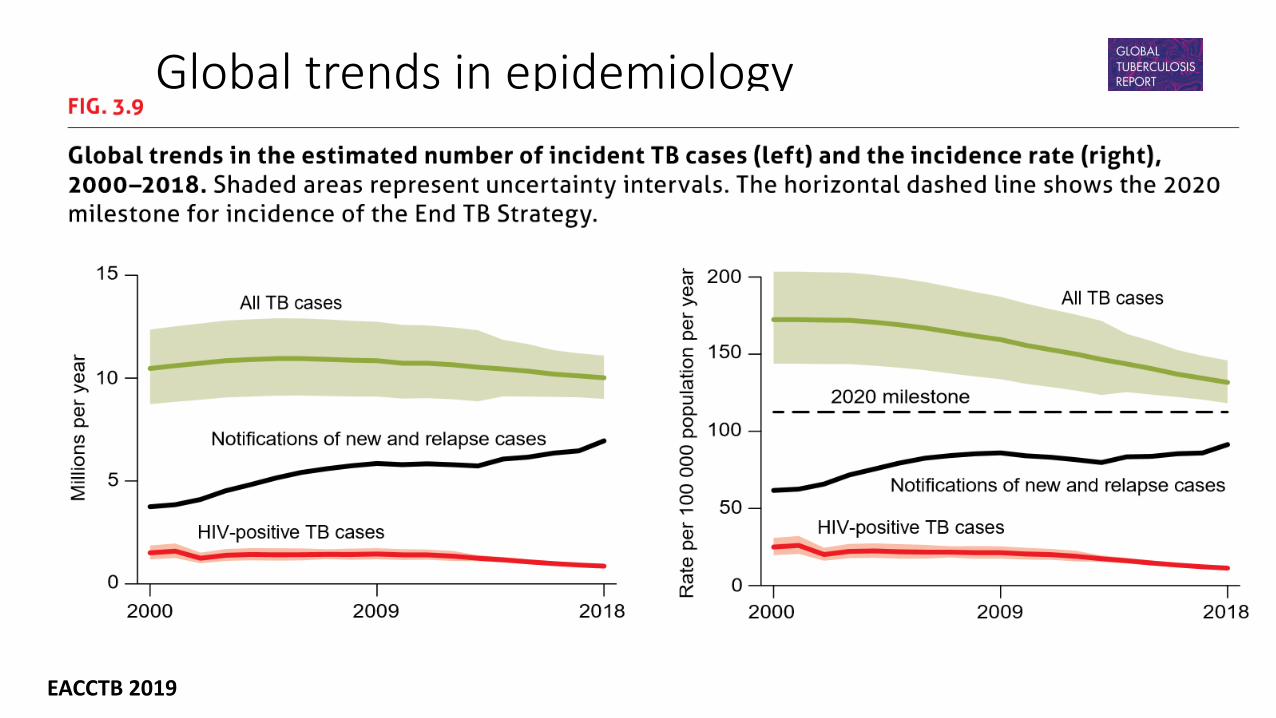
Global trends in epidemiology

EACCTB 2019
EACCTB 2019
EACCTB 2019
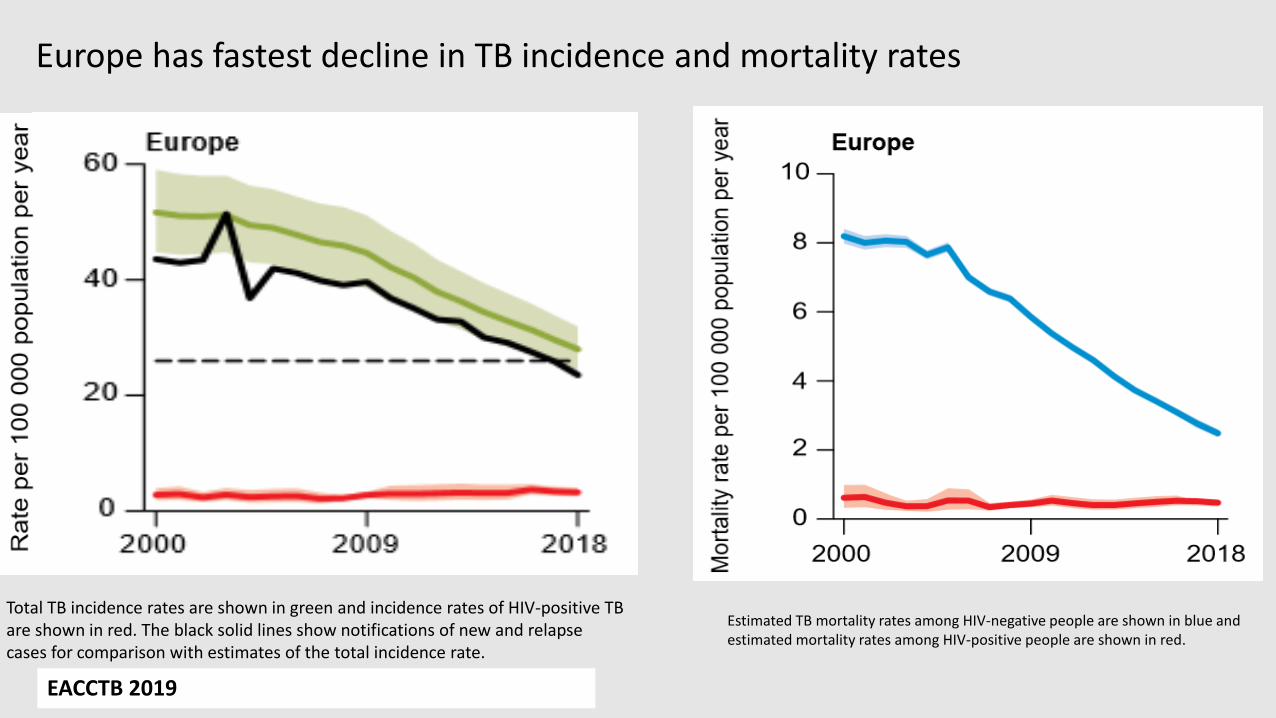
Europe has fastest decline in TB incidence and mortality rates
Estimated TB mortality rates among HIV-negative people are shown in blue and estimated mortality rates among HIV-positive people are shown in red.
Total TB incidence rates are shown in green and incidence rates of HIV-positive TB are shown in red. The black solid lines show notifications of new and relapse cases for comparison with estimates of the total incidence rate.

EACCTB 2019
EACCTB 2019
EACCTB 2019
0
2
4
6
8
10
12
14
16
18
20
10 000
20 000
30 000
40 000
50 000
60 000
70 000
80 000
90 000
2008 2009 2010 2011 2012 2013 2014 2015 2016 2017
TB
ca
se
s/1
00
00
0
TB
ca
se
s
Year of reporting
TB cases TB notification rate
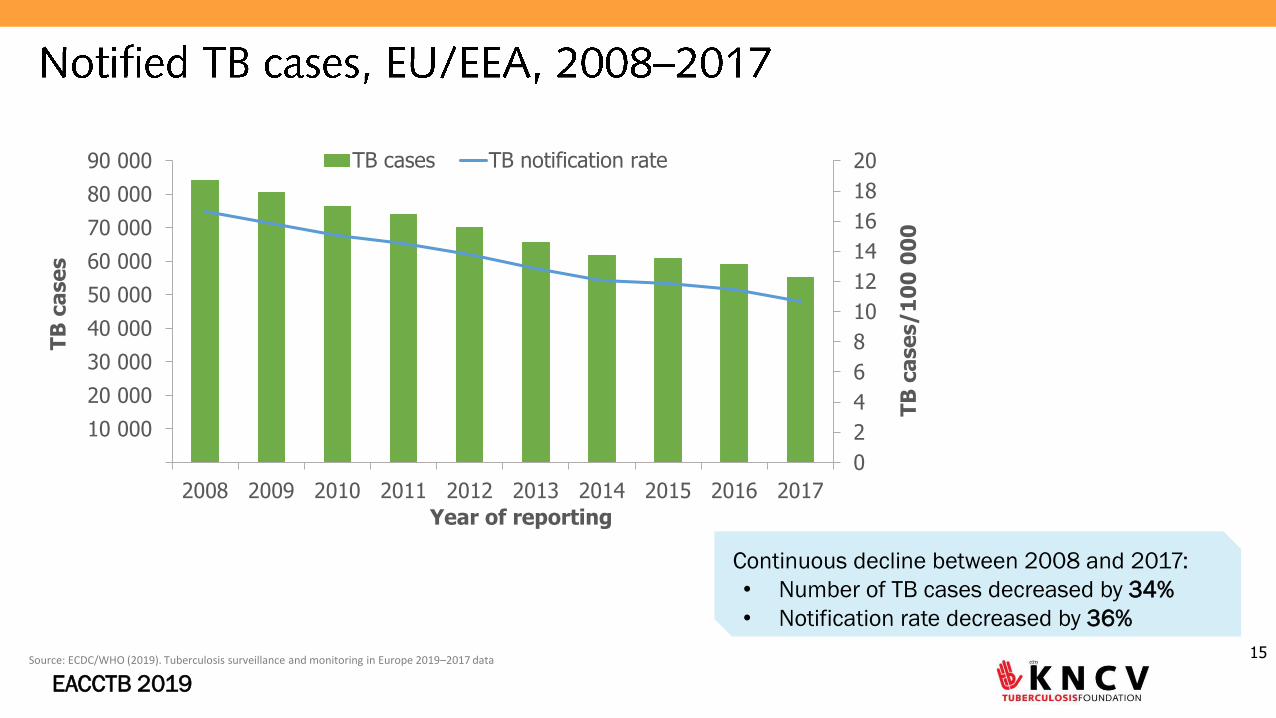
15Source: ECDC/WHO (2019). Tuberculosis surveillance and monitoring in Europe 2019–2017 data
Continuous decline between 2008 and 2017:
• Number of TB cases decreased by 34%
• Notification rate decreased by 36%
EACCTB 2019 16
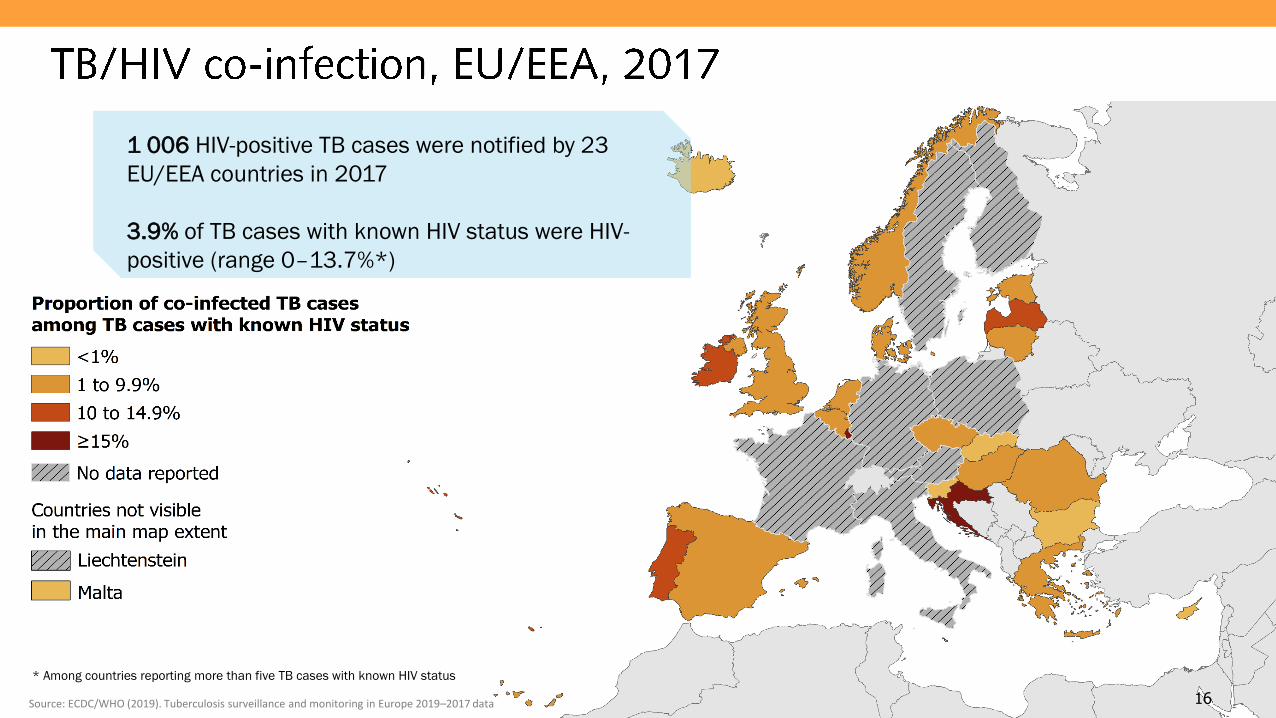
1 006 HIV-positive TB cases were notified by 23
EU/EEA countries in 2017
3.9% of TB cases with known HIV status were HIV-
positive (range 0–13.7%*)
Source: ECDC/WHO (2019). Tuberculosis surveillance and monitoring in Europe 2019–2017 data
* Among countries reporting more than five TB cases with known HIV status

EACCTB 2019 17
1 107 MDR TB cases notified by 30 EU/EEA countries
3.7% of all TB cases with available DST* results had
MDR TB (range 0–25.4%)
Source: ECDC/WHO (2019). Tuberculosis surveillance and monitoring in Europe 2019–2017 data
* DST – drug susceptibility test
EACCTB 2019 18
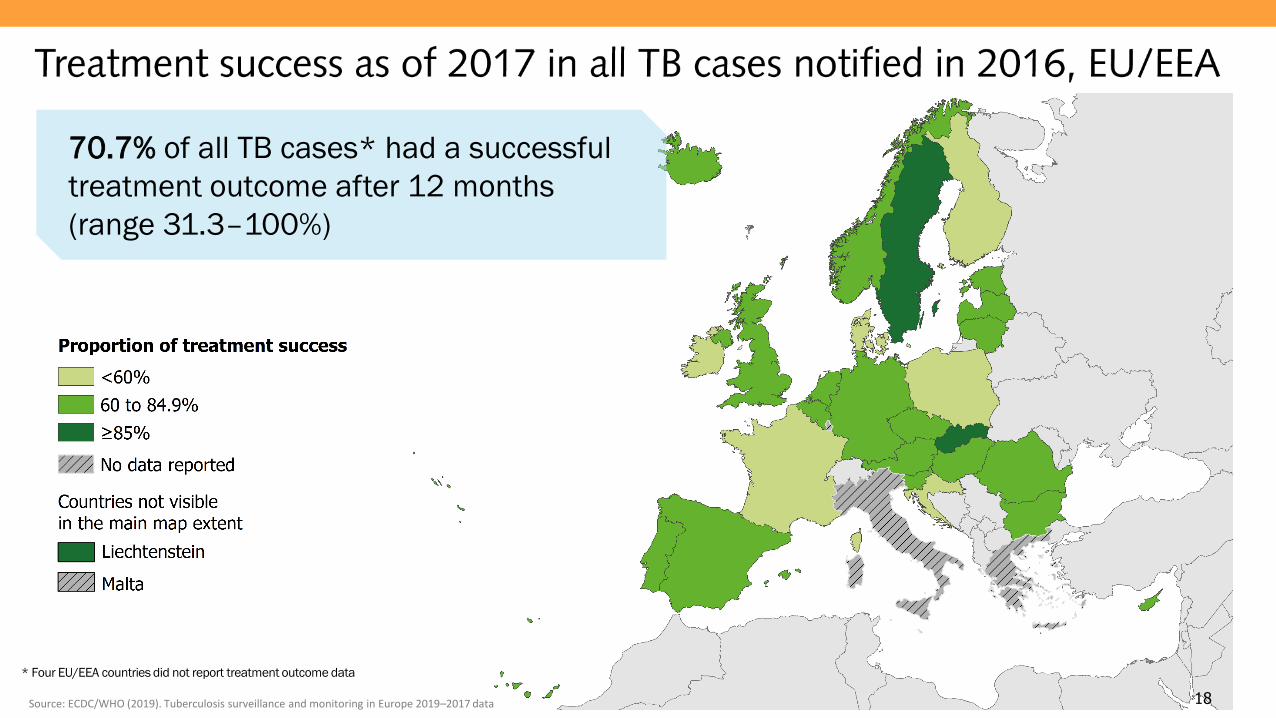
70.7% of all TB cases* had a successful
treatment outcome after 12 months
(range 31.3–100%)
Source: ECDC/WHO (2019). Tuberculosis surveillance and monitoring in Europe 2019–2017 data
* Four EU/EEA countries did not report treatment outcome data

EACCTB 2019
EACCTB 2019 20
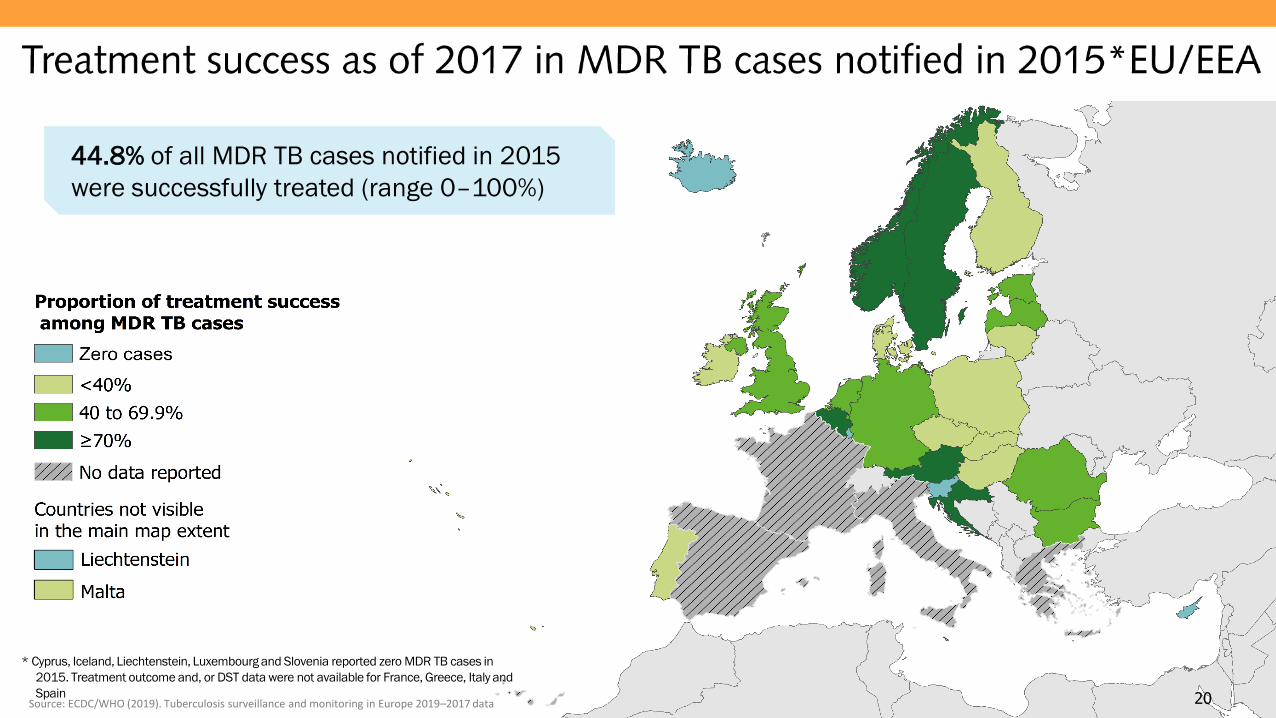
44.8% of all MDR TB cases notified in 2015
were successfully treated (range 0–100%)
Source: ECDC/WHO (2019). Tuberculosis surveillance and monitoring in Europe 2019–2017 data
* Cyprus, Iceland, Liechtenstein, Luxembourg and Slovenia reported zero MDR TB cases in
2015. Treatment outcome and, or DST data were not available for France, Greece, Italy and
Spain
EACCTB 2019
21
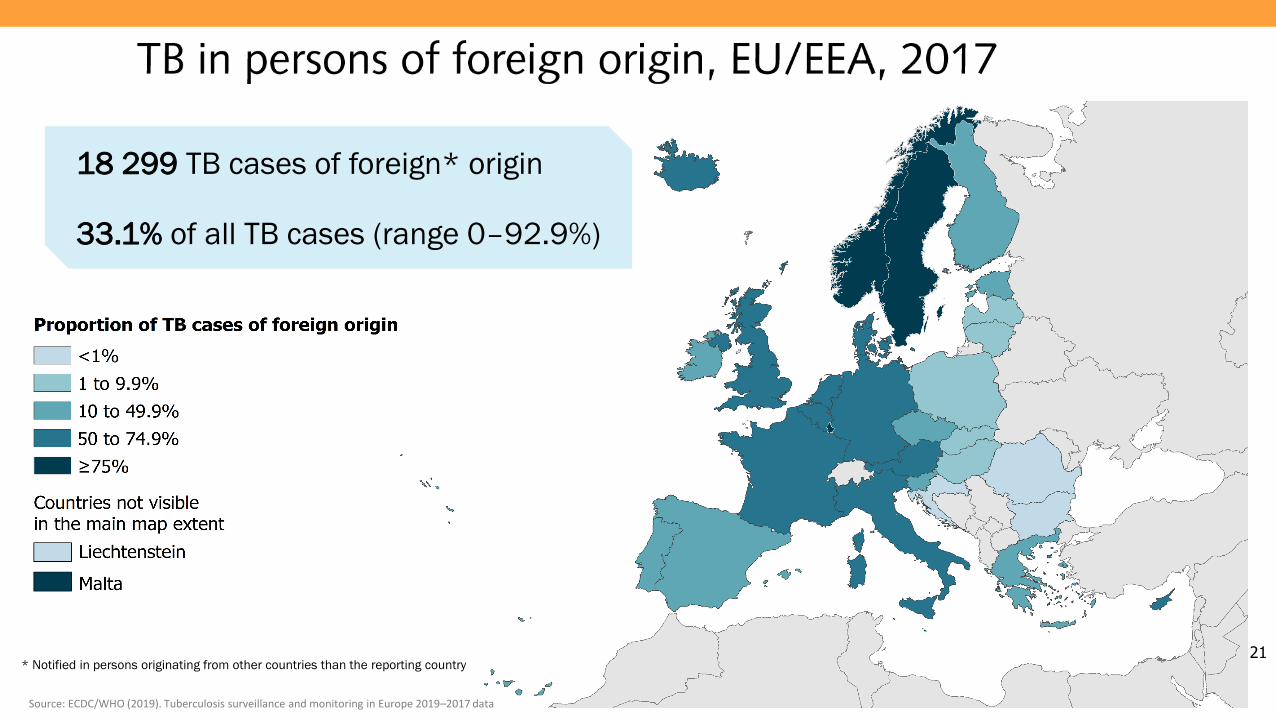
18 299 TB cases of foreign* origin
33.1% of all TB cases (range 0–92.9%)
Source: ECDC/WHO (2019). Tuberculosis surveillance and monitoring in Europe 2019–2017 data
* Notified in persons originating from other countries than the reporting country

EACCTB 2019
TB cases in persons of foreign origin, EU/EEA, 2008–2017
22
0.0
1.0
2.0
3.0
4.0
5.0
0
20
40
60
80
100
2008 2009 2010 2011 2012 2013 2014 2015 2016 2017
Ca
se
s /
10
0 0
00
Pe
rce
nta
ge
Year of reporting
Proportion of foreign cases Rate per 100 000 of the total population
Source: ECDC/WHO (2019). Tuberculosis surveillance and monitoring in Europe 2019–2017 data
The proportion of cases in persons of foreign origin increased from 22.6% in 2008 to 33.1% in 2017
The rate of TB cases of foreign origin per 100 000 of the total population varied between 3.4 and 3.9
EACCTB 2019
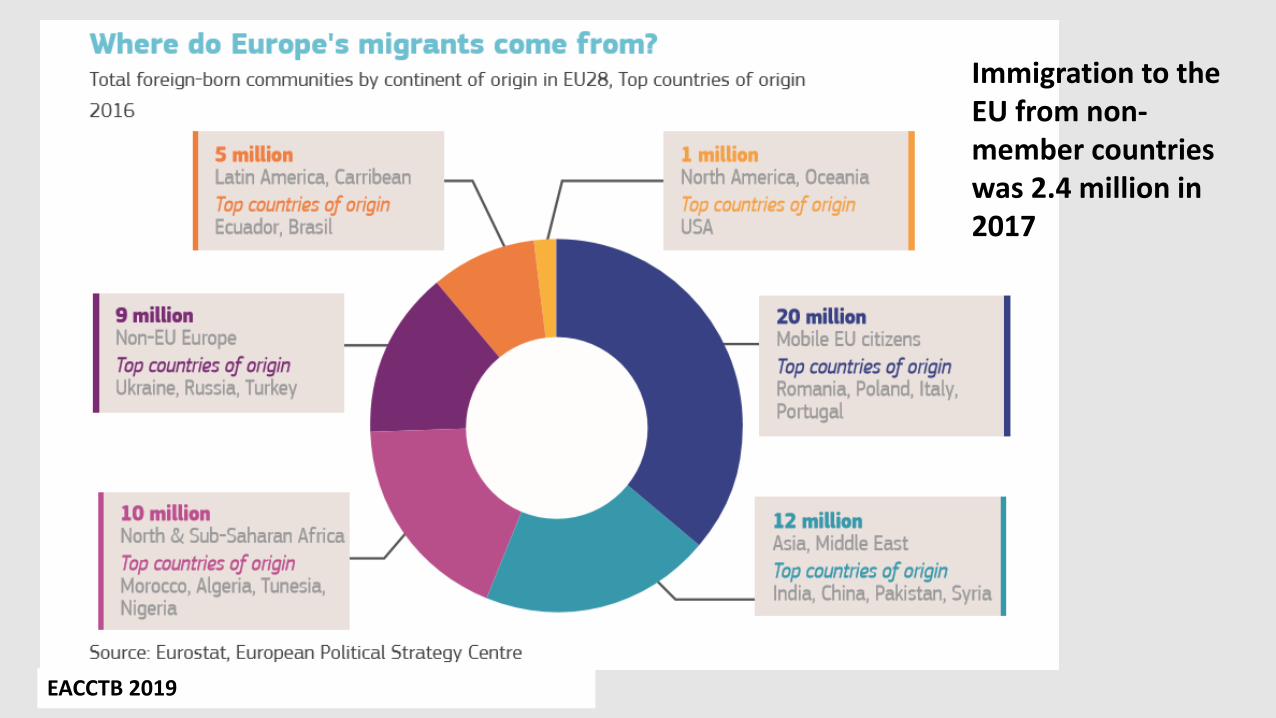
Immigration to the EU from non-member countries was 2.4 million in 2017

EACCTB 2019
Immigrants to Europe – where do they come from?
0
5000
10000
15000
20000
25000
30000
35000
40000
45000
0
5000
10000
15000
20000
25000
30000
35000
40000
45000
2012 2013 2014 2015 2016 2017
Immigration to the Netherlands from high burden TB countries - top 12
Kenia
Nigeria
Pakistan
Somalië
Filippijnen
Ethiopië
Eritrea
Zuid-Afrika, land
Indonesië
India
Grand Total

EACCTB 2019
Conclusions
• Global TB incidence is declining, but absolute numbers are not
• The TB incidence in Europe is declining faster
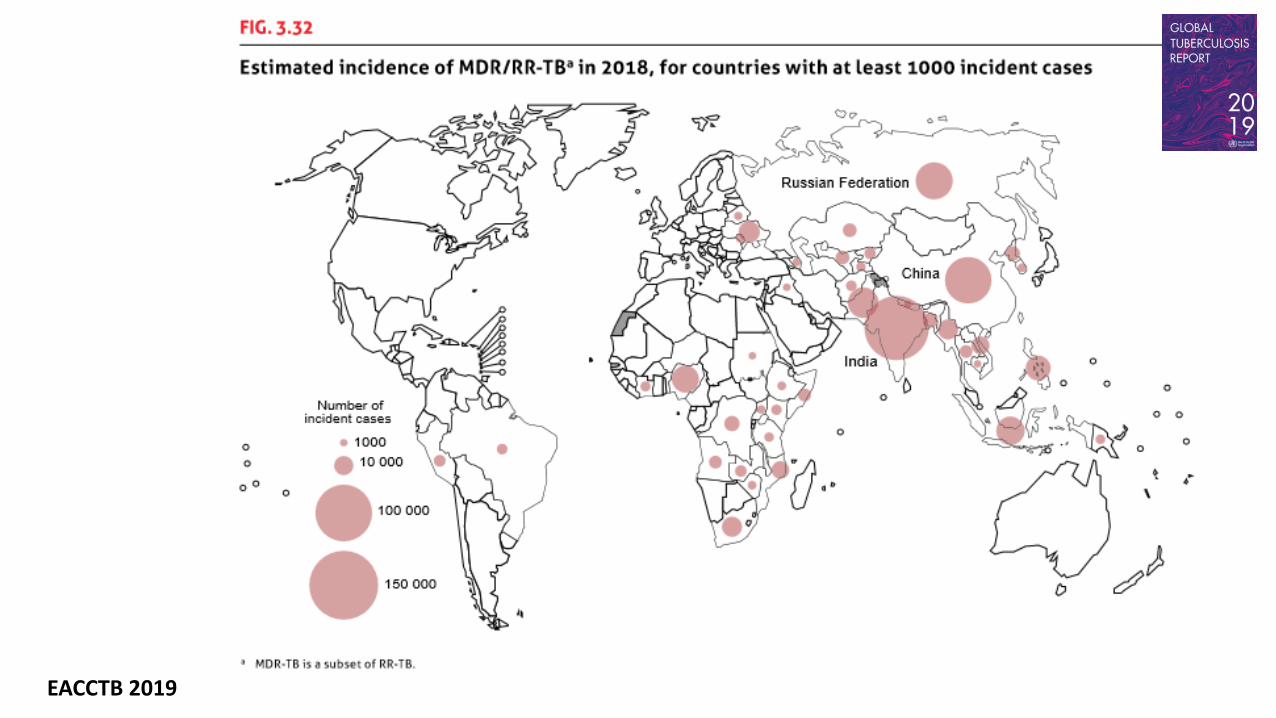
• High MDR and TB-HIV burden in former Sovjet-Union countries
• There is still a considerable gap of patients not detected and put on treatment globally and in FSU-countries
• Immigration from high burden counties determines TB epidemiology in western European countries
EACCTB 2019
Acknowledgement
WHO & ECDC for use of data, maps and infographics
EACCTB 2019


![TB Activist Toolkit - TB/HIV Epidemiology and Impact [PowerPoint Slides]](https://static.cupdf.com/doc/110x72/568c39d21a28ab0235a3d21b/tb-activist-toolkit-tbhiv-epidemiology-and-impact-powerpoint-slides.jpg)
![TB Activist Toolkit - TB/HIV Epidemiology and Impact [Facilitators Notes]](https://static.cupdf.com/doc/110x72/568bdbd51a28ab2034affa5c/tb-activist-toolkit-tbhiv-epidemiology-and-impact-facilitators-notes.jpg)