Travel & Trade Linkages April 2014
2
Contents
Executive Summary ................................................................................... 3
1 Tourism as an export sector ............................................................ 5 1.1 Contribution to exports ............................................................................... 5 1.2 Export contributions in Asia ....................................................................... 7 1.3 Key sector comparison ............................................................................ 11 1.4 Contribution to external balance .............................................................. 13
2 Aviation and trade ........................................................................... 16 2.1 Aviation: tourism and trade capacity ........................................................ 16
3 Business travel & trade .................................................................. 18 3.1 Business travel and trade ........................................................................ 18 3.2 The value of trade .................................................................................... 21 3.3 Quantifying the value of business travel to trade ..................................... 23 3.4 The importance of business travel within Asia ......................................... 24
Annex: Business Travel Impact Calculations ........................................ 26

Travel & Trade Linkages April 2014
3
Executive Summary Travel & Tourism makes a large contribution to global exports
Travel & Tourism is an important, but sometimes overlooked, export sector. Spending by foreign visitors (otherwise known as visitor exports) accounted for over 5% of total global exports in 2013 and 28% of service sector exports.
This export contribution is disproportionately large compared with output as the sector directly contributes to around 3% of global GDP and employment. Almost a third of all Travel & Tourism economic activity is generated by international travel. Cross-border spending has also tended to be more dynamic than domestic spending and further rapid growth is expected.
Travel & Tourism is the seventh largest export sector in the G20, but is more geographically diverse than some other notable export sectors. Production of the four largest export sectors is highly concentrated within just five countries, which account for almost two-thirds of global output. The same five countries account for around half of total global GDP but two-fifths of Travel & Tourism output. Other countries therefore receive substantial economic benefits from international Travel & Tourism spending and the contribution of visitor exports to total exports is relatively stable across developed countries.
The benefit of Travel & Tourism to external trade balances is large for some major countries helping them to run current account surpluses, or smaller deficits than may otherwise be the case. For example, a number of countries including Italy, Malaysia, Spain and Thailand are currently expected to run a current account surplus in 2014, which would become a deficit in the absence of tourism credits.
Scope for further growth within Asia-Pacific
Visitor exports also make a notable contribution to total exports in Asia-Pacific countries, albeit a slightly smaller proportion than the global average with many economies dependent on trading raw materials and manufactured goods.
The importance of visitor exports within Asia-Pacific has fallen slightly over the last ten years, comprising a smaller share of total exports. This is despite some rapid growth in tourism activity and is related to strong performance in other sectors.
0% 10% 20% 30% 40% 50% 60% 70%
Northeast Asia
South Asia
Southe
ast A
sia
Oceania
Sub-‐regional Asia visitor receipts as a share of service exports 2014
2004 2014 2024
0% 10% 20% 30%
Other manufacturing
Food products
Textiles
Travel & Tourism
Other business services
Mining -‐ energy materials
Basic metals
Transport equipment
Chemicals
Machinery & equipment
% exports
Top 10 export sectors across the G20 as a share of total exports
7 1118
49
17
0 312
6
27
88
0102030405060708090
100
2003 2013 2023
Middle class household share(Millions of households with income greater than $35,000)
Brazil Russia India China
Travel & Trade Linkages April 2014
4
-30%
-20%
-10%
0%
10%
20%
30%
40%
2004 2005 2006 2007 2008 2009 2010 2011 2012 2013
RPK = revenue passenger kmsFTK = freight ton kms
Source: IATA
International air passenger & cargo growth% year 3mma
Global RPK
Global FTK
0
5
10
15
20
25
Asia Pacific N.E. Asia S.E. Asia S. Asia Oceania World
Range
Average
ROI of business travel
Source : Oxford Economics
Value of output generated by one unit of business travel spending
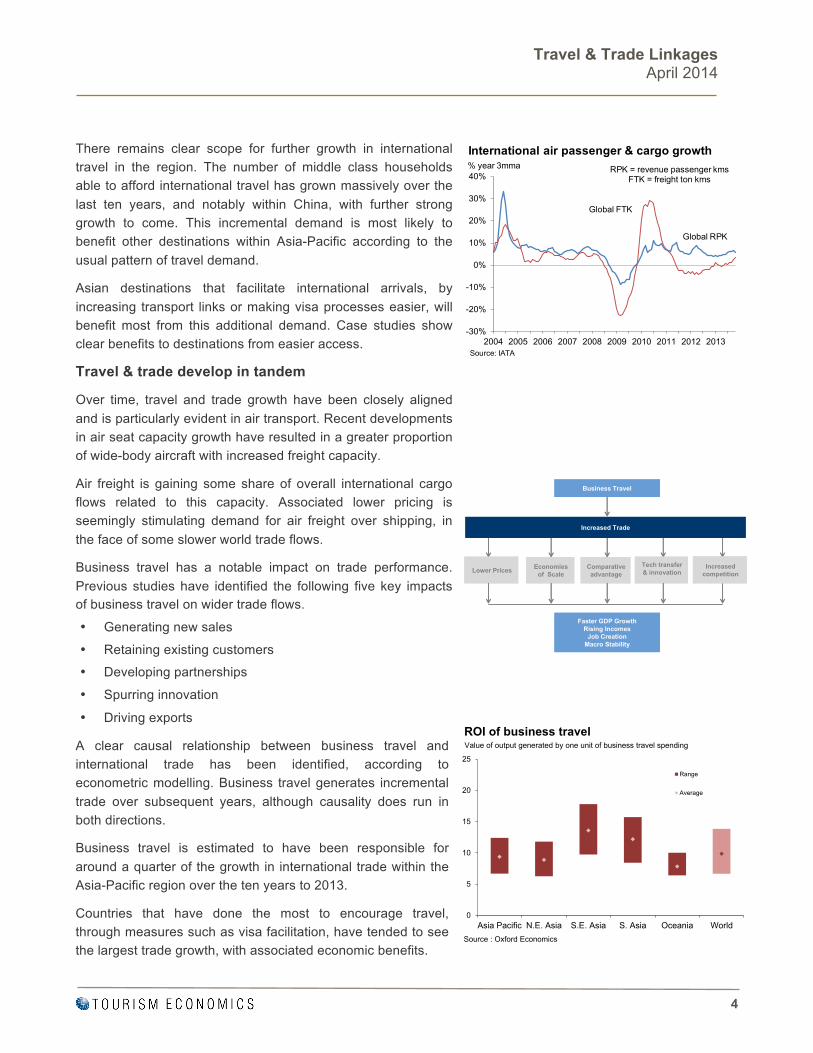
There remains clear scope for further growth in international travel in the region. The number of middle class households able to afford international travel has grown massively over the last ten years, and notably within China, with further strong growth to come. This incremental demand is most likely to benefit other destinations within Asia-Pacific according to the usual pattern of travel demand.
Asian destinations that facilitate international arrivals, by increasing transport links or making visa processes easier, will benefit most from this additional demand. Case studies show clear benefits to destinations from easier access.
Travel & trade develop in tandem
Over time, travel and trade growth have been closely aligned and is particularly evident in air transport. Recent developments in air seat capacity growth have resulted in a greater proportion of wide-body aircraft with increased freight capacity.
Air freight is gaining some share of overall international cargo flows related to this capacity. Associated lower pricing is seemingly stimulating demand for air freight over shipping, in the face of some slower world trade flows.
Business travel has a notable impact on trade performance. Previous studies have identified the following five key impacts of business travel on wider trade flows.
• Generating new sales
• Retaining existing customers
• Developing partnerships
• Spurring innovation
• Driving exports
A clear causal relationship between business travel and international trade has been identified, according to econometric modelling. Business travel generates incremental trade over subsequent years, although causality does run in both directions.
Business travel is estimated to have been responsible for around a quarter of the growth in international trade within the Asia-Pacific region over the ten years to 2013.
Countries that have done the most to encourage travel, through measures such as visa facilitation, have tended to see the largest trade growth, with associated economic benefits.
Increased Trade
Lower Prices
Faster GDP GrowthRising Incomes
Job CreationMacro Stability
Tech transfer & innovation
Economies of Scale
Comparative advantage
Increased competition
Business Travel
Increased Trade
Lower PricesLower Prices
Faster GDP GrowthRising Incomes
Job CreationMacro Stability
Tech transfer & innovationTech transfer & innovation
Economies of Scale
Economies of Scale
Comparative advantage
Comparative advantage
Increased competitionIncreased
competition
Business Travel

Travel & Trade Linkages April 2014
5
1 Tourism as an export sector
1.1 Contribution to exports
International tourism spending yields an impressive economic benefit, totalling US$1,296 bn in 2013, equivalent to 29% of total global Travel & Tourism demand. This is estimated to rise further to $1,359 bn in 2014, according to the annual economic research carried out by the World Travel & Tourism Council (WTTC) and Oxford Economics.
Cross border spending on Travel & Tourism has shown itself to be somewhat more dynamic than domestic spending, growing over the past 10 years by an average annual rate of 3.2% pa (in real terms). This is an impressive rate of growth given that the period included a major global recession and outpaced the 2.5% global GDP growth over the same period. This is also in contrast to more subdued domestic tourism spending, which grew by a more moderate 2.0% pa over the same period. As a share of overall tourism demand, international tourism spending has risen from 27% to 29% over the course of the past 10 years.
International tourism spending is an important export sector and makes a significant contribution to overall export revenues around the world. Such spending is technically described as a visitor export and is an essential component of trade, comprising 5.4% of global export volumes in 2013.
Visitor exports are a crucial component of service sector exports and represented, on average, 28% of service sector exports worldwide in 2013; which in turn represented around 20% of all exports. This is a disproportionately high ratio given the relative size of the Travel & Tourism sector which directly accounts for

Travel & Trade Linkages April 2014
6
approximately 3% of global GDP and employment; and around 6% of global service sector output. Such flows generate much needed foreign exchange and financial stability for many countries, particularly for emerging economies. For example, among the G201 countries, over a quarter of service sector exports are generated by Travel & Tourism. Specifically, more than half of all service exports are generated by Travel & Tourism in France, Turkey, Mexico, South Africa, and Saudi Arabia; between 25% and 50% in the US, Russia, China, Australia, Italy, Argentina, Spain, and Indonesia.
Over the course of the next ten years the large contribution of Travel & Tourism to service sector exports should remain broadly static at a global level, but with some notable changes by country. Saudi Arabia and Mexico should see the contribution of Travel & Tourism receipts to service exports continue to grow over the longer term as they continue to develop as tourism destinations. Some lesser, but significant, growth is also expected for South Africa, Russia, Brazil and Argentina. Continued economic development in all these countries will attract business travellers, while developments in tourism infrastructure, in part to service a growing domestic market, will also attract foreign visitors and spending.
1 The Group of Twenty Finance Ministers and Central Bank Governors from 19 major wealthy countries plus the EU. Tourism ministers from these countries have met at the same time as G20 meetings under the heading of the T20. Spain is a permanent guest of the G20 and T20 and is included as one of the countries in charts and analysis here.
-‐2%
-‐1%
0%
1%
2%
3%
Saud
i Arabia
Mexico
South Africa
Russia
Brazil
Argentina
Japan
Spain UK
China
Italy
Germany
South Ko
rea
Canada
USA
India
Australia
France
Turkey
Indo
nesia
T20 per annum change in visitor receipts as a share of service exports 2014-‐24 (% pt change)

Travel & Trade Linkages April 2014
7
Countries such as Turkey and Indonesia are expected to see sizable falls in the contribution of visitor receipts to service exports. This is despite a forecast of continued growth in arrivals and inbound spending for these established destinations, albeit slower growth than expected for some other service sectors. Faster development in other service sectors, and notably finance, will reduce the relative importance of Travel & Tourism. Visitor exports are expected to continue to provide over a third of service sector export revenue in Indonesia and over a half in Turkey. The chart above shows the expected absolute changes in Travel & Tourism’s share of service sector exports by 2024. There remains clear potential for even faster growth in Travel & Tourism if more accommodative policies are adopted.
1.2 Export contributions in Asia
Within Asia, foreign visitor exports represent a substantial share of exports, albeit a slightly smaller proportion than the global average. Travel & Tourism accounts for 4.8% of total exports from Asian countries, with several major economies highly dependent on exports of raw materials and manufactured goods. Visitor exports remain a highly important source of foreign exchange for Asian economies, accounting for 31% of the region’s service sector exports, a higher proportion than the global average.
The dependence on Travel & Tourism clearly varies across the Asia-Pacific region, with a higher dependence evident for Oceania where visitor exports account for almost half (47%) of its service exports despite a fall in this share over the past ten years. In fact, visitor exports for the region increased by 43%, in nominal terms, over the same period, but the relative importance of other sectors has increased during this time, including some service sectors in support of the booming raw materials sector.
0%
10%
20%
30%
40%
50%
60%
70%
Northeast
Asia
South Asia
Southe
ast
Asia
Oceania
Sub-‐regional Asia visitor receipts as a share of service exports 2014
2004 2014 2024

Travel & Trade Linkages April 2014
8
In South Asia tourism receipts account for just 14% of all service exports, suffering by comparison with the large computer and IT sector in India. This high-tech sector has also continued to outpace rapidly growing tourism demand. Some of this growth in export performance may be attributable to business travel flows (as detailed in subsequent sections). But it is also clear that despite the large contribution to exports from the Travel & Tourism sector there remains significant room for further development in the region if more facilitative tourism policies are pursued.
Previous studies have shown that clear positive benefits, in terms of additional visitors and spending, can be gained by countries, including within Asia, by adopting more accommodative visa policies. Case studies show that easier visa processes can have a large beneficial impact on travel to destinations2. Although, the Asia-Pacific region is relatively open for travellers, earlier research shows that, for example, 49% of the population of APEC economies still requires a visa to travel within the bloc. This population will become increasingly important for destinations, containing some important developing source markets which will take a larger share of travel demand.
Some of the more open Asian countries in terms of visas receive a particularly large proportion of exports from Travel & Tourism. In 2014 more than half of all service exports are likely to be generated by Travel & Tourism in nine such countries (Cambodia, Fiji, Laos, Macau, Malaysia, Maldives, New Zealand, Thailand, Tonga,
2 World Tourism Organization and the World Travel & Tourism Council (2013), The Impact of Visa Facilitation in APEC economies

Travel & Trade Linkages April 2014
9
Vanuatu, and Vietnam), as evident in the chart above. Indeed, three of these countries owe more than 90% of their service exports to visitor receipts. Visitor receipts account for well over half of all exports for the same three countries. Maldives and Macau receive over 80% of their total export revenues from Travel & Tourism spending.
In the longer term some large increases in the importance of tourism receipts to service exports are expected, generally linked to developments in tourism demand in origin markets. Appetite for international travel remains undiminished as tourists the world over seek new experiences. This is being enhanced by the rapidly rising income levels within emerging markets which are leading to the formation of millions of new middle class households with a complementary appetite for international travel.
Growth in the size of the middle class is particularly evident in China, as the number of households earning over US$35,000 is estimated to triple from around 30mn to almost 90mn over the next ten years. This income threshold is an indicator of the level of household income at which point international travel typically becomes affordable. International tourism spending is not expected to demonstrate any notable slowdown over the next ten years with growth of 6.2% per annum expected, even with the current levels of visa access. This compares favourably to the average growth of 6.4% growth over the past ten years and 6.9% growth over the past 20 years. This earlier period included some significant travel liberalisation which the large number of new middle class households will be able to exploit.
As a result, China is expected to overtake both the US and Germany to become the world’s largest source of outbound Travel & Tourism spending within the next five years. However, just ten years ago, Chinese outbound spending was less than 15% of the value of spending coming from either US or Germany. In making this assessment Travel & Tourism spending has been defined to be consistent with
7 1118
49
17
0 312
6
27
88
0102030405060708090
100
2003 2013 2023
Middle class household share(Millions of households with income greater than $35,000)
Brazil Russia India China

Travel & Trade Linkages April 2014
10
WTTC’s annual research (carried out in collaboration with Oxford Economics), which is in turn consistent with the Tourism Satellite Account: Recommended Methodological Framework (TSA: RMF 2008). This measure of spending includes both transportation fares and travel spending (a complementary metric to visitor exports), but also excludes outbound spending on full-time education.
Looking at the travel component of the balance of payments data as a simpler measure shows that China became the largest source market for outbound spending in 2012, although this metric excludes transportation and includes some sizable education-related spending. Regardless of the current position in global rankings, China has clearly gained in importance as a tourism source market and is only going to gain prominence, with clear implications for travel to destinations in the Asia-Pacific region.
Particularly notable improvements in arrivals and tourist receipts are expected in Myanmar. This expected increase is associated with continued developments which have opened up the country to the rest of Asia and the world, via the installation of democracy, reopening of universities, increased transport links and improved visa facilitation; all of which will help to attract foreign direct investment flows into the country. Associated business travel flows are likely in the short-term, and leisure tourists are also expected in increasing numbers once tourism infrastructure is developed and improved.
0%
1%
2%
3%
4%
Myanm
ar
Philipp
ines
New
Zealand
Tonga
Nepal
Vanuatu
Thailand
Japan
Kirib
ati
Vietnam
China
Sri Lanka
Bangladesh
South Korea
Asia per annum change in visitor receipts as a share of service exports 2014-‐24 (% pt change)
Travel & Trade Linkages April 2014
11
1.3 Key sector comparison
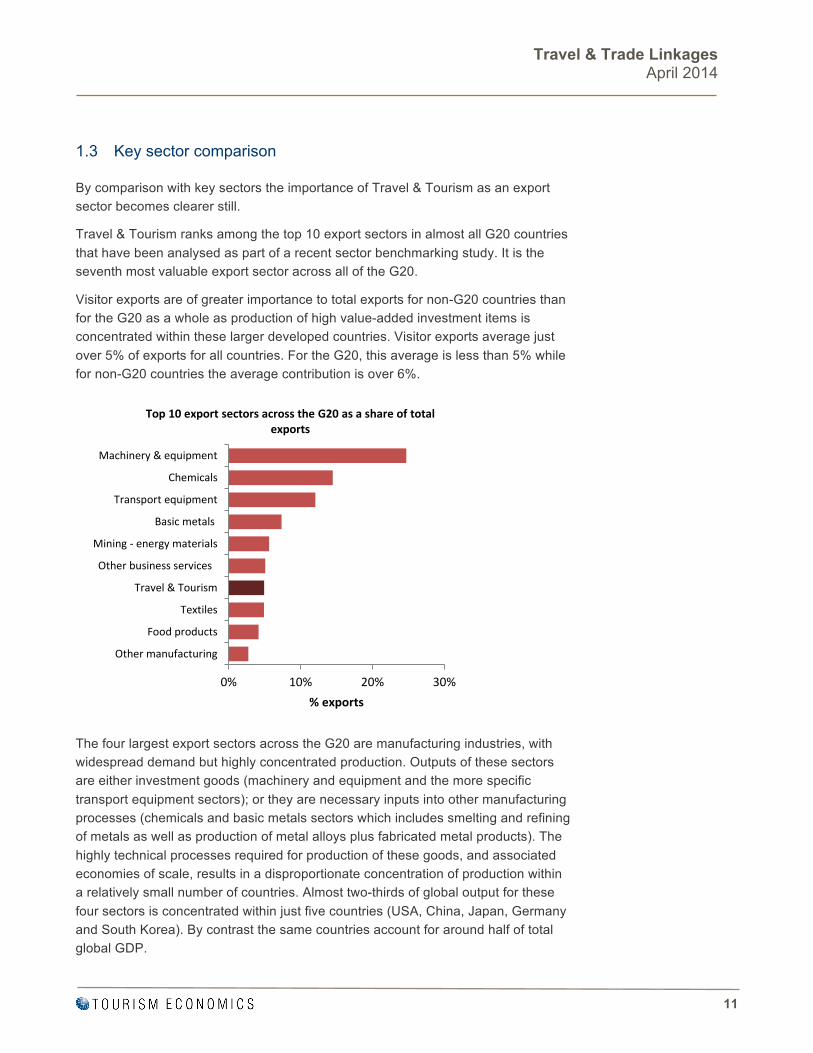
By comparison with key sectors the importance of Travel & Tourism as an export sector becomes clearer still.
Travel & Tourism ranks among the top 10 export sectors in almost all G20 countries that have been analysed as part of a recent sector benchmarking study. It is the seventh most valuable export sector across all of the G20.
Visitor exports are of greater importance to total exports for non-G20 countries than for the G20 as a whole as production of high value-added investment items is concentrated within these larger developed countries. Visitor exports average just over 5% of exports for all countries. For the G20, this average is less than 5% while for non-G20 countries the average contribution is over 6%.
The four largest export sectors across the G20 are manufacturing industries, with widespread demand but highly concentrated production. Outputs of these sectors are either investment goods (machinery and equipment and the more specific transport equipment sectors); or they are necessary inputs into other manufacturing processes (chemicals and basic metals sectors which includes smelting and refining of metals as well as production of metal alloys plus fabricated metal products). The highly technical processes required for production of these goods, and associated economies of scale, results in a disproportionate concentration of production within a relatively small number of countries. Almost two-thirds of global output for these four sectors is concentrated within just five countries (USA, China, Japan, Germany and South Korea). By contrast the same countries account for around half of total global GDP.
0% 10% 20% 30%
Other manufacturing
Food products
Textiles
Travel & Tourism
Other business services
Mining -‐ energy materials
Basic metals
Transport equipment
Chemicals
Machinery & equipment
% exports
Top 10 export sectors across the G20 as a share of total exports

Travel & Trade Linkages April 2014
12
Travel & Tourism is a more geographically diverse sector with export benefits more widely spread across countries. The same five countries listed above account for 40% of Travel & Tourism output: a lower proportion than their share of global GDP. Other countries therefore receive substantial economic benefits from Travel & Tourism, and notably from international spending. The contribution of visitor exports to total exports is relatively stable across developed countries compared to the contribution of many other sectors.
The extraction of raw materials is a further important source of exports for the G20 as a whole, but is also highly geographically concentrated, according to the presence of raw materials. Energy producing raw materials (including oil and gas) represents the fifth largest export sector for the G20 as a whole, but the importance by country varies significantly. This sits outside of the top ten export industries for nine out of the twenty countries considered in the study. As a further example of geographic dispersion, extraction of other raw materials is the 13th largest export sector for the G20, accounting for only 2% of total exports. Yet this is the 2nd largest export sector for Australia, Brazil and South Africa due to their geographic endowment.
It is also noteworthy that visitor exports are more than double the value from raw agricultural produce, as the 11th largest export sector. It should be noted that the export value of processed food products are significantly larger than the value of raw agricultural produce, albeit still smaller than visitor export values by itself.
0% 2% 4% 6%
Cultural services
Other community services
Government services
Insurance services
Communication services
Construction services
Computer & info services
Financial services
Royalties & license fees
Travel & Tourism
Other business services
% exports
Service sector exports across the G20 as a share of total exports

Travel & Trade Linkages April 2014
13
Compared to other service sectors the importance of Travel & Tourism is clear. Across the G20 as a whole, visitor exports are of comparable size to a broad range of business services in aggregate. However, it is notable that Travel & Tourism exports are over 2.5 times larger than the combined exports of financial and insurance services.
1.4 Contribution to external balance
By making a large contribution to exports, facilitating Travel & Tourism activity can also improve a country’s external balance. With an outlook of continued growth in international tourism demand, countries which improve access for these additional tourists will be able to gain market share. Spending by these additional tourists will generate incremental tourism receipts with a boost to the balance of payments. By running a surplus, or a smaller deficit, on this external balance, some pressure would be removed from public sector accounts. Higher foreign income would directly benefit private sector sales within the Travel & Tourism sector, as well as the wider economy through effects such as the supply chain, but would also generate tax revenue. This would include sales taxes and any other tariffs faced by tourists as well as income tax paid by workers and any business taxes faced both directly by the Travel & Tourism sector as well as in the wider economy. Higher tax revenue would improve the government balance, and could be used to support greater public spending or to reduce any debt.
In the absence of tourism credits, some notable deterioration in the external balance would be seen. This is illustrated in the accompanying chart as a simple first round estimate of the importance of Travel & Tourism revenue to G20 countries. These estimates are useful illustrations of the importance of fully realising the clear demand for international travel, notably growth from emerging markets.
-‐15%
-‐10%
-‐5%
0%
5%
10%
15%
20%
Saud
i Arabia
Germ
any
South Ko
rea
China
Japan
Russia
Italy
Argentina
Mexico
South Afric
aUSA
Spain
Brazil
UK
France
Indo
nesia
Australia
India
Cana
daTu
rkey
Net balance (% GDP
)
T20 tourism receipts contribution to national current account 2014
Current account balance excluding tourism credits
Current account balance

Travel & Trade Linkages April 2014
14
Spain and Italy stand out as G20 countries which would likely experience a current account deficit in 2014 rather than the currently expected surplus. This is particularly evident for Spain with a move from a surplus equivalent of 1.4% GDP to a deficit of 3.6%: a 5% point swing. The potential swing for Italy would be large at over 2% points, the same magnitude as for France. Given the continued weakness in domestic demand within these economies and the ongoing commitment to tighter policy and debt reduction this loss of foreign income would be a large blow to private sector sales and public sector accounts alike. In addition to the direct impact on economic growth and the debt situation, this could undermine some of the confidence in the tentative economic recovery.
Excluding tourism credits would also have a large impact on the external balance for other advanced and emerging markets. Larger deficits would be expected in UK, US and Australia, with a potential deterioration of the external balance of over 1% GDP. Turkey also has a large external demand with potential deterioration of the external balance to -11% excluding tourism credits.
It should be noted that the real importance of tourism to the external balance can only truly be measured when outbound spending is also taken into consideration. Of course the net effect across all countries would be zero on this simple basis, without any other potential benefits from travel and globalisation. By country this net effect would also depend on outbound spending and Travel & Tourism spending involves some redistribution of income from countries with otherwise large surpluses. For example, within Europe the net effect of Travel & Tourism is to improve the external balance for Spain, Italy and France at least partly involving a redistribution of income from Germany which runs a particularly large surplus on other sectors.
Within Asia, some high profile countries and territories would also see their currently expected small external surpluses transform into deficits in the absence of tourism credits. These countries and territories include Macau and Hong Kong, both of which receive large Travel & Tourism revenues from Chinese tourists. Other small, open destinations such as Singapore and Fiji would also see large deterioration in
-‐40%
-‐30%
-‐20%
-‐10%
0%
10%
20%
Taiwan
Singap
ore
South Ko
rea
China
Banglade
shPh
ilipp
ines
Japan
Vietnam
Papu
a Ne
w Guine
aMyanm
arPakistan
Malaysia
Nepal
Indo
nesia
Australia
India
Tonga
Solomon
Island
sSri Lan
kaLaos
New
Zealand
Thailand
Vanu
atu
Hong
Kon
gMaldives
Cambo
dia
Kirib
ati
Fiji
Macau
Net balance (US
$)
Asia-‐Pacific tourism receipts contribution to national current account 2014
Current account balance excluding tourism credits
Current account balance
50% >

Travel & Trade Linkages April 2014
15
the external balance as a share of GDP in the absence of tourism credits. On a net basis, there would also be some redistribution from China to these other countries and territories.
Thailand and Malaysia would also experience a deficit instead of the current expected surplus in the absence of international tourism demand. These countries would experience a swing in the external balance of 11% and 7% respectively in the absence of tourism credits, also equivalent to large monetary values of US$43bn and US$25bn. On a net basis these countries also receive large benefits from tourism with redistribution of income from other countries.
Travel & Trade Linkages April 2014
16
2 Aviation and trade
2.1 Aviation: tourism and trade capacity
Aviation is an important part of Travel & Tourism contributing to over 10% of the direct economic benefit of the sector. Around 18% of cross border Travel & Tourism spending is derived from passenger fares and 70% of this total is derived from air fares. Hence, aviation provides a crucial benefit to overall international trade flows.
Of course these proportions vary significantly by country, dependent on the size of the carriers based in that country relative to other travel receipts. As an example, Qatar is home to a large airline relative to the size of its tourism sector and air fares contribute to around 60% of revenue earned from Travel & Tourism. By comparison the United Arab Emirates hosts two large airlines, with air fare revenues almost double that in Qatar, but these transportation revenues are more balanced by other tourism receipts. The wider tourism offer within UAE and the associated revenue means that 40% of UAE Travel & Tourism earnings are from international transportation fares, a lower proportion than in Qatar, albeit a larger proportion than the global average.
However, aviation also provides a further benefit to the global economy and notably as a direct carrier of air freight.
Data from IATA show that air freight has historically grown in conjunction with passenger demand. Growth in passenger traffic has followed a similar growth pattern to air freight over time following similar peaks and troughs, although with some differences in volatility. However, in recent periods there has been some divergence with faster air passenger demand than cargo demand. Despite the recovery in economic growth, and even faster recovery in tourism demand, air cargo
-30%
-20%
-10%
0%
10%
20%
30%
40%
2004 2005 2006 2007 2008 2009 2010 2011 2012 2013
RPK = revenue passenger kmsFTK = freight ton kms
Source: IATA
International air passenger & cargo growth% year 3mma
Global RPK
Global FTK
Travel & Trade Linkages April 2014
17
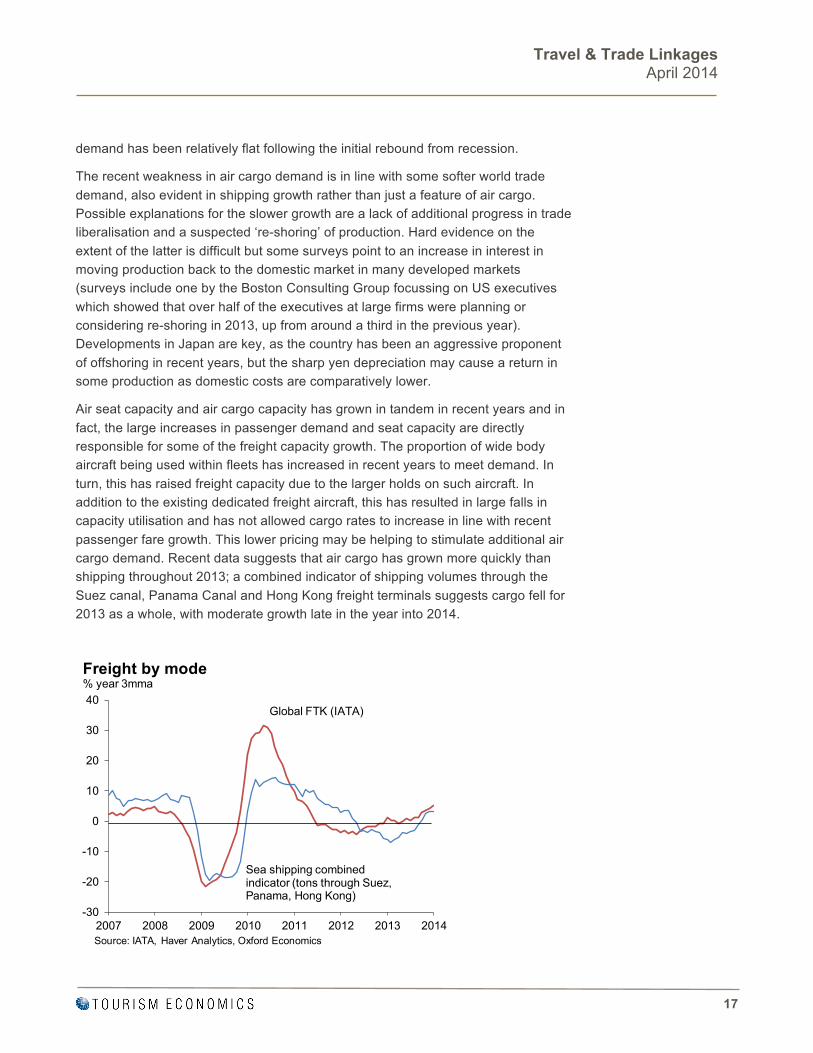
demand has been relatively flat following the initial rebound from recession.
The recent weakness in air cargo demand is in line with some softer world trade demand, also evident in shipping growth rather than just a feature of air cargo. Possible explanations for the slower growth are a lack of additional progress in trade liberalisation and a suspected ‘re-shoring’ of production. Hard evidence on the extent of the latter is difficult but some surveys point to an increase in interest in moving production back to the domestic market in many developed markets (surveys include one by the Boston Consulting Group focussing on US executives which showed that over half of the executives at large firms were planning or considering re-shoring in 2013, up from around a third in the previous year). Developments in Japan are key, as the country has been an aggressive proponent of offshoring in recent years, but the sharp yen depreciation may cause a return in some production as domestic costs are comparatively lower.
Air seat capacity and air cargo capacity has grown in tandem in recent years and in fact, the large increases in passenger demand and seat capacity are directly responsible for some of the freight capacity growth. The proportion of wide body aircraft being used within fleets has increased in recent years to meet demand. In turn, this has raised freight capacity due to the larger holds on such aircraft. In addition to the existing dedicated freight aircraft, this has resulted in large falls in capacity utilisation and has not allowed cargo rates to increase in line with recent passenger fare growth. This lower pricing may be helping to stimulate additional air cargo demand. Recent data suggests that air cargo has grown more quickly than shipping throughout 2013; a combined indicator of shipping volumes through the Suez canal, Panama Canal and Hong Kong freight terminals suggests cargo fell for 2013 as a whole, with moderate growth late in the year into 2014.
-30
-20
-10
0
10
20
30
40
2007 2008 2009 2010 2011 2012 2013 2014
Freight by mode % year 3mma
Source: IATA, Haver Analytics, Oxford Economics
Global FTK (IATA)
Sea shipping combined indicator (tons through Suez, Panama, Hong Kong)

Travel & Trade Linkages April 2014
18
3 Business travel & trade
3.1 Business travel and trade
Spending on business travel tends to follow the economic cycle, with faster growth in years of strong profits. However, companies also tend to reign in travel spending as profits fall. In this way business travel follows the cycle of business investment.
However, while the return on investment is widely acknowledged, the return on business travel is often overlooked. Cuts in travel budgets can have a detrimental impact on economic performance.
Oxford Economics and WTTC have carried out significant prior research to consider the benefits of business travel. Research has employed surveys of global business travellers and executives in countries around the world as well as cross-country econometric analysis to identify the causal relationship between business travel and trade3.
Several benefits to business travel were identified in research, each having a notable impact on business performance and productivity. Five key benefits of business travel to productivity were identified, with large benefits for trade.
• Generating new sales
• Retaining existing customers
• Developing partnerships
• Spurring innovation
• Driving exports
3.1.1 Generating new sales
Travel and sales are inextricably linked. Surveys show that the probability of converting sales is significantly higher with an in-person meeting than without. And the value of face-to-face meetings is more notable in emerging markets. On average, executives report that 29% of their company’s new sales depend on business travel, while in China the proportion is higher at 38%.
3 Business Travel: A Catalyst for Economic Performance, 2011 http://wttc.org/research/policy-research/business-travel-research/
Travel & Trade Linkages April 2014
19
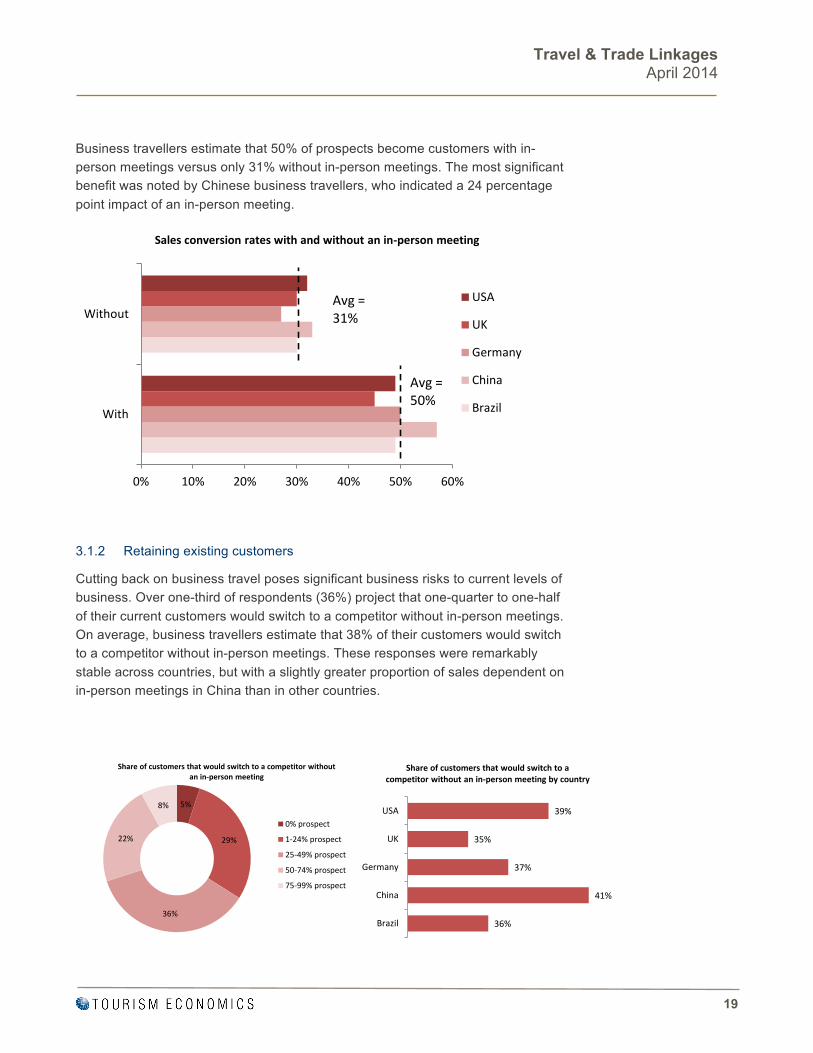
Business travellers estimate that 50% of prospects become customers with in-person meetings versus only 31% without in-person meetings. The most significant benefit was noted by Chinese business travellers, who indicated a 24 percentage point impact of an in-person meeting.
3.1.2 Retaining existing customers
Cutting back on business travel poses significant business risks to current levels of business. Over one-third of respondents (36%) project that one-quarter to one-half of their current customers would switch to a competitor without in-person meetings. On average, business travellers estimate that 38% of their customers would switch to a competitor without in-person meetings. These responses were remarkably stable across countries, but with a slightly greater proportion of sales dependent on in-person meetings in China than in other countries.
5%
29%
36%
22%
8%
Share of customers that would switch to a competitor without an in-‐person meeting
0% prospect
1-‐24% prospect
25-‐49% prospect
50-‐74% prospect
75-‐99% prospect
36%
41%
37%
35%
39%
Brazil
China
Germany
UK
USA
Share of customers that would switch to a competitor without an in-‐person meeting by country
0% 10% 20% 30% 40% 50% 60%
With
Without
Sales conversion rates with and without an in-‐person meeting
USA
UK
Germany
China
Brazil
Avg = 31%
Avg = 50%

Travel & Trade Linkages April 2014
20
3.1.3 Developing partnerships
Cooperative relationships are integral to company performance. Global business travellers understand that travel is essential to building these relationships. For example, nearly three quarters (72%) of global business travellers find external conferences and conventions have a “significant” or “high” impact on developing partnerships. And well over half of respondents indicate that meeting with partners is “very” or “extremely” important to expanding into new markets, investing in new markets, and managing their company’s supply chain.
Trade shows and exhibitions have been identified as key events for developing partnerships. 64% of trade show and exhibition participants identified a significant impact on building partnerships.
3.1.4 Spurring innovation
Global business travellers also affirmed a strong relationship between travel and innovation and productivity. Over two-thirds of executive travellers (70%) believe that business travel is “extremely” or “very” important to innovation and to “added productivity/efficiency.”
10%
4%
7%
4%
16%
9%
8%
10%
31%
23%
25%
20%
28%
35%
33%
39%
15%
29%
26%
27%
Employ additional staff
Manage supply chain moreefficiently
Invest in New markets
Expand into new customermarkets
Importance of meeting with suppliers and other partners
Not at all important Slightly important Moderately important Very important Extremely important
66%
59%
64%
43%

Travel & Trade Linkages April 2014
21
3.1.5 Driving exports
Trade is directly influenced by business travel flows including a combination of the above factors. Enhanced sales and partnerships arising from international business travel help the flow of international trade and exports.
The role of international business travel in generating trade benefits was clear among the executives and business travellers surveyed. A significant majority of international travellers feel it is extremely important to travel to expand business in international markets (70%) and to invest internationally (65%). Travel is also integral to smooth operations between international offices within an organisation, which can often involve additional trade between countries.
3.2 The value of trade
In addition to the identified value of business travel to exports from surveys, the value of business travel to trade has also been identified according to econometric
74%
74%
70%
70%
70%
63%
61%
55%
47%
Increased profits
Increased sales
Developing partnerships with suppliers
General innovation
Added productivity/efficiency
Investing in local markets
Increased international sales
Investing in foreign
Ability to hire additional employees
Business travel is "very important" or "extremely important" to...
8%
5%
4%
10%
3%
7%
27%
28%
19%
29%
35%
33%
26%
30%
37%
Employ additional staff ininternational markets
Invest in internationalmarkets
Expand business ininternational markets
Importance of travel to international subsidiaries
Not at all important Slightly important Moderately important Very important Extremely important
70%
65%
55%

Travel & Trade Linkages April 2014
22
relationships as part of the previous 2011 study. Trade advances economic development by allowing countries to focus on areas of comparative advantage. This allows the creation of economies of scale with lower prices and also spurs innovation and competition.
There is a strong relationship between trade growth and wider economic development measured in terms of per capita GDP growth. Countries which have enjoyed stronger economic growth have also experienced stronger trade growth. This is clear for some Asian countries, and especially for China, Korea, Singapore, India and Thailand. Of course, correlation does not necessarily imply causality but further theory and econometric tests show that the improvements in country wealth is in part a consequence of trade.
The implications of this are significant. Trade not only generates income for companies but also advances economic development by lowering prices, creating economies of scale, allowing countries to focus on areas of comparative advantage, spurring innovation, and by creating competition. Conversely, one of the causes of the Great Depression in the 1930s was the rise of protectionism and trade barriers.
Since the recent recession, some reversal of the previous trend of globalisation has occurred with some repatriation of previous outsourced production, with potential consequences for wider economic development. Global Trade Alert has identified a rise in the number of protectionist measures imposed since 2012.
Business travel therefore has wider economic benefits than GDP and jobs generated in sectors directly serving business travellers. By facilitating global trade, business travel plays a significant role in driving economic development, improving standards of living, and creating jobs around the world.
0%
1%
2%
3%
4%
5%
6%
7%
8%
9%
10%
3% 5% 7% 9% 11% 13% 15%
Per cap
ita GDP
growth
Trade growth
Trade and per capita GDP (CAGR 1980-‐2010)
China
Korea
IndiaSingapore
Thailand
Turkey
Chile
UK
Mexico

Travel & Trade Linkages April 2014
23
3.3 Quantifying the value of business travel to trade
The overall impact of business travel on economic performance has been econometrically estimated to confirm and quantify the benefits suggested by survey analysis. Oxford Economics conducted a comprehensive econometric analysis to identify any causal relationships which exist between business travel and trade, productivity, and overall economic development. Estimation was carried out for a broader range of countries to determine the global impact as well as that for Asia-Pacific. Further details of this calculation are included in the Annex, while full methodology is included in the 2011 report.
A combination of time series and panel econometrics reveals a clear link between international business travel and world trade. Specifically, higher business travel intensity (business travel spending relative to GDP) drives higher trade intensity (imports and exports relative to GDP).
Based on this analysis (and removing the compounding, reverse effects of trade on travel) the estimated equations suggest that business travel was responsible for up to 35% of the growth in world exports in the ten years to 2010. This is consistent with previous analysis by Oxford Economics and the wealth of literature also reviewed for prior analysis. The estimated trade benefits were shared by both developed and developing economies, with a clear conclusion: trade depends on travel.
Increased Trade
Lower Prices
Faster GDP GrowthRising Incomes
Job CreationMacro Stability
Tech transfer & innovation
Economies of Scale
Comparative advantage
Increased competition
Business Travel
Increased Trade
Lower PricesLower Prices
Faster GDP GrowthRising Incomes
Job CreationMacro Stability
Tech transfer & innovationTech transfer & innovation
Economies of Scale
Economies of Scale
Comparative advantage
Comparative advantage
Increased competitionIncreased
competition
Business Travel
Travel & Trade Linkages April 2014
24
3.4 The importance of business travel within Asia
The link between both business travel spending and trade is notable within Asia and a high correlation between the two indicators is clear for many Asian countries.
Almost one-quarter of the growth in Asia-Pacific trade over the ten years to 2013 can be attributed to business travel developments, according to the modelling described above. Previous analysis suggested that roughly one third of the growth in international trade worldwide over the past decade can be attributed to business travel.
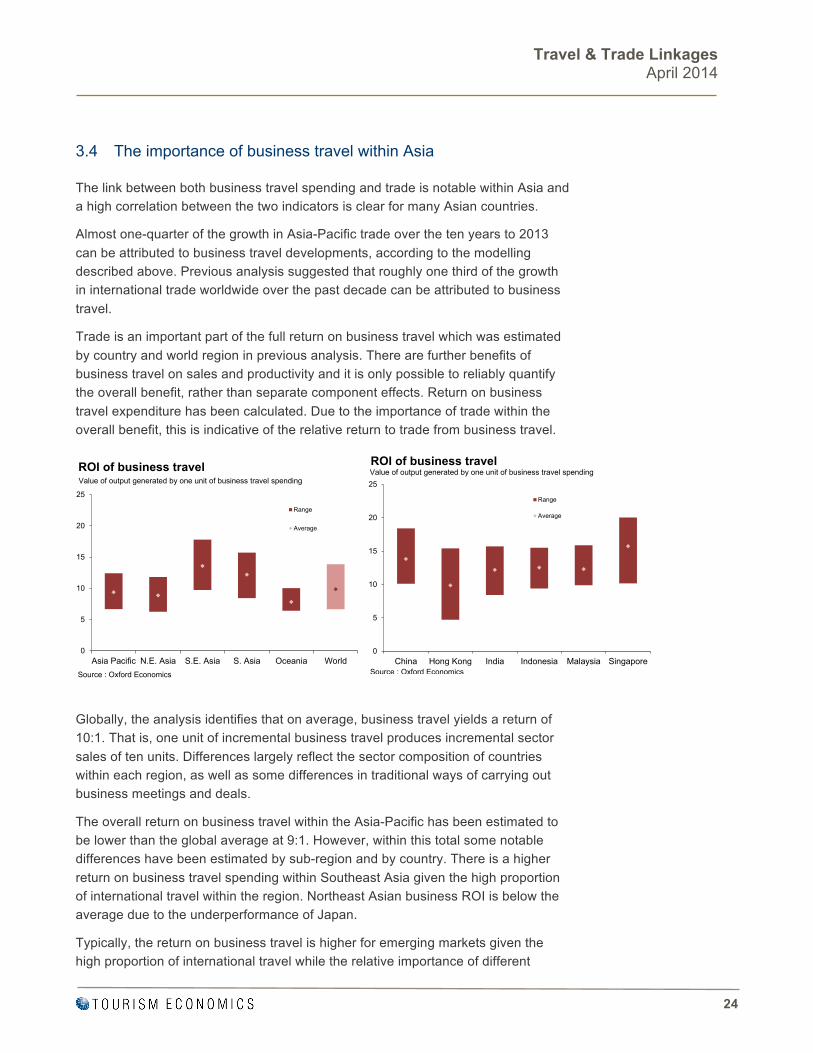
Trade is an important part of the full return on business travel which was estimated by country and world region in previous analysis. There are further benefits of business travel on sales and productivity and it is only possible to reliably quantify the overall benefit, rather than separate component effects. Return on business travel expenditure has been calculated. Due to the importance of trade within the overall benefit, this is indicative of the relative return to trade from business travel.
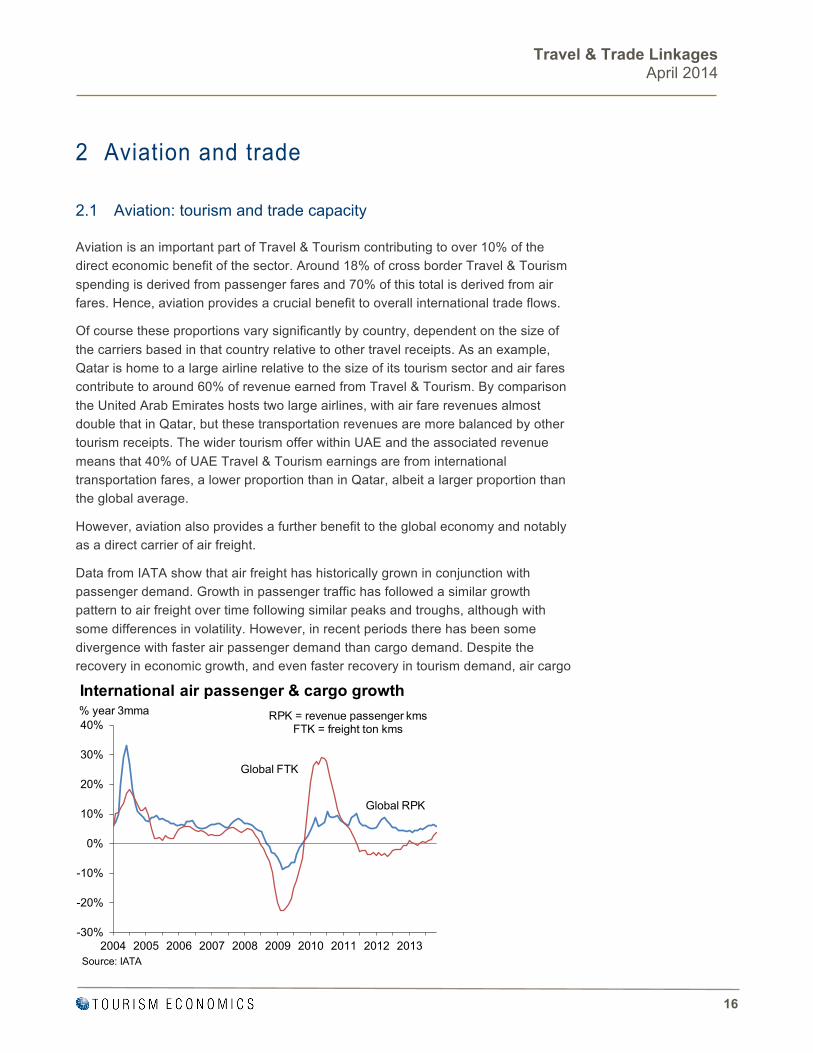
Globally, the analysis identifies that on average, business travel yields a return of 10:1. That is, one unit of incremental business travel produces incremental sector sales of ten units. Differences largely reflect the sector composition of countries within each region, as well as some differences in traditional ways of carrying out business meetings and deals.
The overall return on business travel within the Asia-Pacific has been estimated to be lower than the global average at 9:1. However, within this total some notable differences have been estimated by sub-region and by country. There is a higher return on business travel spending within Southeast Asia given the high proportion of international travel within the region. Northeast Asian business ROI is below the average due to the underperformance of Japan.
Typically, the return on business travel is higher for emerging markets given the high proportion of international travel while the relative importance of different
0
5
10
15
20
25
Asia Pacific N.E. Asia S.E. Asia S. Asia Oceania World
Range
Average
ROI of business travel
Source : Oxford Economics
Value of output generated by one unit of business travel spending
0
5
10
15
20
25
China Hong Kong India Indonesia Malaysia Singapore
Range
Average
ROI of business travel
Source : Oxford Economics
Value of output generated by one unit of business travel spending

Travel & Trade Linkages April 2014
25
sectors also plays a major role in determining the link between travel and trade. Singapore and China exhibit a relatively high ROI of business travel, involving a strong return to trade from increased business travel.
Business Travel Spending (US$
bn)
Business Travel Intensity (%
GDP)
International outbound share of travel spend
Average Estimated ROI
Range of possible ROI
valuesAsia Pacific 225.8 1.7% 17% 9.4 +/-2.9
N.E. Asia 174.9 1.8% 14% 8.9 +/-2.8S.E. Asia 14.5 1.1% 75% 13.6 +/-4S. Asia 18.6 1.4% 6% 12.2 +/-3.6Oceania 17.7 1.6% 17% 7.8 +/-1.8
Select MarketsChina 82.0 1.6% 14% 13.8 +/- 4.1Hong Kong 2.9 1.4% 86% 9.9 +/- 5.4India 17.4 1.4% 17% 12.2 +/- 3.6Indonesia 5.3 1.0% 31% 12.5 +/- 3.1Malaysia 3.0 1.6% 79% 12.3 +/- 3Singapore 3.2 1.8% 92% 15.7 +/- 4.9
ROI of Business Travel in Asia (by business origin)Return on investment to business of additional spending in business travel

Travel & Trade Linkages April 2014
26
Annex: Business Travel Impact Calculations While the strong correlation between business travel and trade suggests a relationship it does not necessarily imply a true causal relationship. The table below shows both correlation and causation statistics across a sample of countries. These econometric tests provide very strong evidence that business travel causes international trade, and is notable for some key Asian countries.
Results confirm the theoretical assumption that outbound travel is most powerful in its effect on exports, while inbound travel primarily influences imports. It should be noted that the relationships are not exclusively in one direction as trade also drives some immediate business travel during the same year. Business travel typically generates additional trade over subsequent years.
Specifically, higher business travel intensity (business travel spending relative to GDP) drives higher trade intensity (imports and exports relative to GDP). With a similar relationship observed through the business cycle rather than just as a trend over time. Granger causality tests, as well as tests for unit roots to confirm the common growth pattern, were carried out in previous analysis to confirm the hypothesis.
Some further complication in understanding causality lies in the fact that both travel and trade often develops on a bilateral basis. Freer trade measures typically benefit both exports and imports for a country. Additionally, greater ease of travel between countries often benefits both inbound and outbound travel as reciprocal visa policies are often pursued.
0.20%
0.25%
0.30%
1995 1997 1999 2001 2003 2005 2007 200915%
20%
25%
30%Business travel intensity (lhs)Trade intensity (rhs)
Business Travel and World Trade Intensity
Source : Oxford Economics
Intensity is calculated as relative to GDP

Travel & Trade Linkages April 2014
27
But overall the causality tests summarised in the table below suggest that travel does indeed generate trade in subsequent years.
The overall benefits of business travel on economic performance go beyond the facilitation of trade. Business travel also impacts overall productivity and therefore business performance and profitability. As with the trade relationship, causality runs in both directions: while productivity does influence travel in the short-run there is a longer-run impact of business travel on productivity.
The specific effects of business travel on changes in productivity have been estimated by sector. By extension the benefit to sales and profits has been identified using a combination of time series and cross-sectional panel econometrics. The advantage of this approach is that it captures both direct and indirect benefits of business travel and is rooted in sector data covering extensive history and provides a more accurate measure of the benefit of business travel by county.
Analysis was extended to cover each world region on a country-by-country basis by applying sector-specific results for representative countries to the broader region. The sector composition and the business travel intensity (domestic and international) for each country determine ROI estimates for this broader set. We can place a range of values around this based on any additional cross-country differences for countries within the region.
CorrelationTravel causes
TradeTrade causes
Travel CorrelationTravel causes
TradeTrade causes
TravelUS 0.87 95% 26% 0.65 82% 86%Canada 0.92 100% 99% 0.85 98% 87%UK 0.54 65% 85% 0.61 95% 80%France 0.49 57% 85% 0.63 61% 92%Germany 0.97 90% 81% 0.69 60% 98%Italy 0.52 99% 100% 0.17 58% 99%Spain 0.20 75% 99% 0.74 91% 80%Japan 0.91 97% 53% 0.40 74% 92%China 0.32 92% 95% 0.67 90% 99%Russia 0.83 50% 90% 0.52 100% 95%Brazil 0.57 100% 100% 0.98 88% 87%India 0.72 84% 66% 0.46 99% 58%UAE 0.42 83% 49% 0.82 95% 64%Singapore 0.70 96% 94% 0.74 83% 53%Hong Kong 0.67 95% 100% 0.43 86% 78%Note: causality is shown as the probability that the identified casual relationship is true
Trade & Business Travel by countryInbound business travel vs imports Outbound business travel vs exports
Causality (% confidence) Causality (% confidence)

Travel & Trade Linkages April 2014
28
Globally, the analysis identifies that on average, business travel yields a return of 10:1. That is, one unit of incremental business travel produces incremental sector sales of ten units. Differences across regions are partly determined by historic relationships between business travel and sector-by-sector productivity. In addition, differences reflect the sector composition of countries within each region.
Total Business Travel Spending
(US$ bn)
Business Travel Intensity (%
GDP)
International outbound share of travel spend
Average Estimated ROI
*
Range of possible ROI
values
Americas 302 1.6% 10% 11.9 +/-4.1North America 275 1.7% 8% 11.5 +/-4Other America 27 0.9% 26% 13.3 +/-4.2
Europe 290 1.5% 31% 7.9 +/-3.6EU 243 1.5% 31% 6.9 +/-3.3Other Europe 47 1.4% 27% 12.8 +/-5.7
Asia Pacific 226 1.7% 17% 9.4 +/-2.9Middle East 18 1.2% 58% 10.1 +/-3.7Africa 21 1.5% 27% 9.7 +/-3.3
World 856 1.5% 20% 9.9 +/-3.6* Return on investment to business of additional spending in business travel
Business Travel Spend and ROI by Region


PHILADELPHIA 303 Lancaster Avenue, Suite 1b Wayne PA 19087, USA Tel: +1 610 995 9600 OXFORD Abbey House, 121 St Aldates Oxford, OX1 1HB, UK Tel: +44 1865 268900 LONDON Broadwall House, 21 Broadwall London, SE1 9PL, UK Tel: +44 207 803 1400 BELFAST Lagan House, Sackville Street Lisburn, BT27 4AB, UK Tel: +44 28 9266 0669 NEW YORK 817 Broadway, 10th Floor New York, NY 10003, USA Tel: +1 646 786 1863 SINGAPORE No.1 North Bridge Road High Street Centre #22-07 Singapore 179094 Tel: +65 6338 1235 PARIS 9 rue Huysmans 75006 Paris, France Tel: + 33 6 79 900 846 email: [email protected]
www.tourismeconomics.com