Trade Wargaming
A.T. Kearney Ltd.
October 18, 2017
Retail Council of Canada
Preparing For Trade Policy Disruption

2
Agenda
1) Discuss potential scenarios resulting from NAFTA termination
2) Translate possible tariff increases into direct impact on cost of goods sold for Canadian retailers
3) Identify the indirect impact on overall economy, consumer spending and category share of wallet
4) Establish guidelines for retailer self-assessment and action
Together with RCC, A.T. Kearney assessed the impact of different scenarios on your business and your customers’ spending behavior

3
Canada-US bilateral trade under NAFTA is the second-largest trading relationship in the world
2016 Canada-US bilateral goods
trade was $700 billion+1
1. US goods exports to Canada = $365 bn and Canadian goods exports to USA = $381 bn2. Estimate based on tariff-free 6 digit HS code product lines3. Adjusted for inflation4. 2016 US trade deficit with China US$347 bn; with Mexico US$64 bnSource: Office of the United States Trade Representative
38% real increase in trade
value since 19943
2016 US trade deficit of $16 billion
with Canada was driven by cars,
natural gas and softwood lumber
exports4
Tariff-free access to 94% of
goods2

4
Retail is a critical driver of the Canadian economy
Source: Statistics Canada, Euromonitor, A.T. Kearney; excludes health and pharma retail , IBIS World
$452 bn
$142 bn
Automotive
$119 bn
$32 bn
Household Goods
$15 bn
Food & Beverage
Apparel & Footwear
Total Sales
$143 bn
Electronics & Appliances
2016 Canadian retailer sales(CAD$ bn)
Retail sector employs 2.7
million+ Canadians
or 12% of Canada’s workforce
Retail comprises 5% of
Canada’s GDP and is one of the
chief drivers of the economy
Fragmented - 20 largest
retailers in Canada make up
<50% of retail sales
5
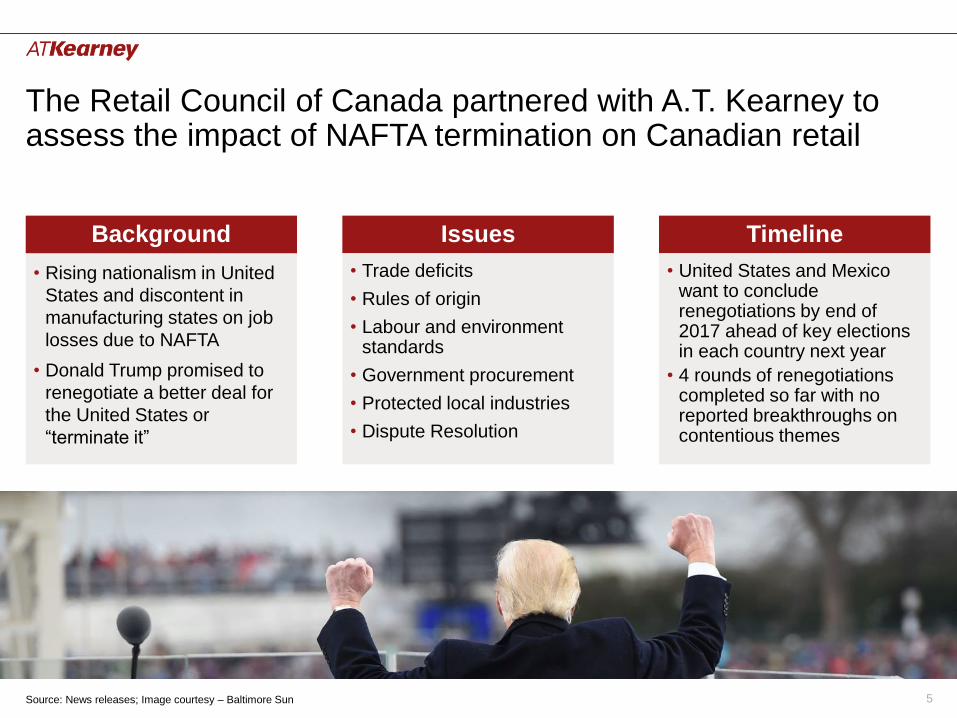
The Retail Council of Canada partnered with A.T. Kearney to assess the impact of NAFTA termination on Canadian retail
• Rising nationalism in United
States and discontent in
manufacturing states on job
losses due to NAFTA
• Donald Trump promised to
renegotiate a better deal for
the United States or
“terminate it”
Background Issues Timeline
• Trade deficits
• Rules of origin
• Labour and environment standards
• Government procurement
• Protected local industries
• Dispute Resolution
• United States and Mexico want to conclude renegotiations by end of 2017 ahead of key elections in each country next year
• 4 rounds of renegotiations completed so far with no reported breakthroughs on contentious themes
Source: News releases; Image courtesy – Baltimore Sun
6
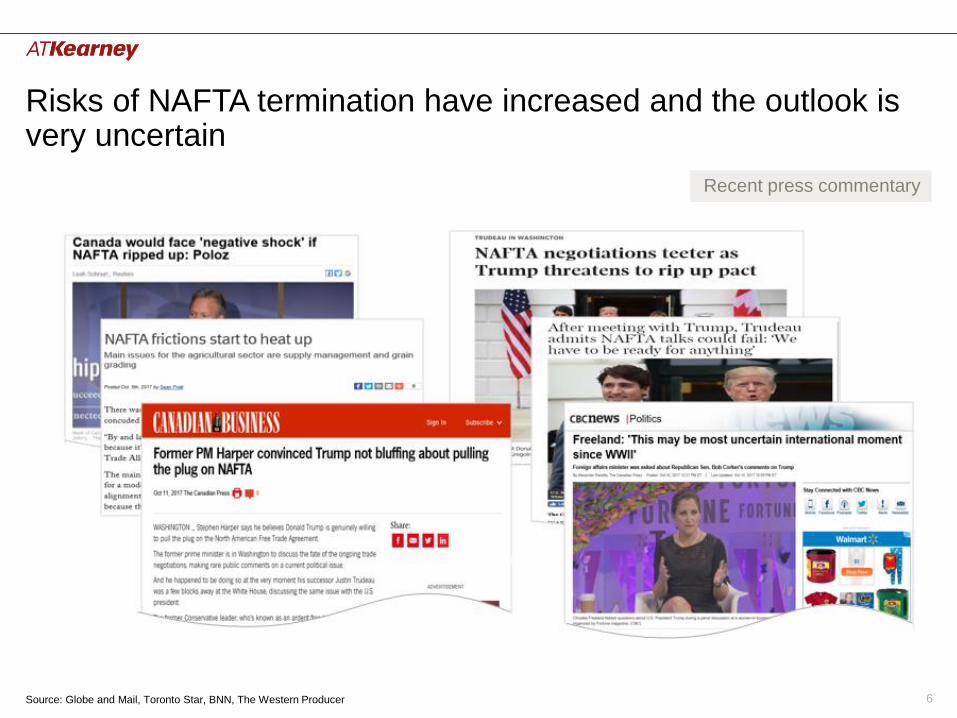
Risks of NAFTA termination have increased and the outlook is very uncertain
Recent press commentary
Source: Globe and Mail, Toronto Star, BNN, The Western Producer

7
Retail goods imports from USA are worth ~$108 bn and are concentrated in eight main sub-categories
Retail goods imports from USA(CAD $ bn, 2015)
1. Production imports (~$257 bn) e.g. machinery & equipment, commodities, chemicals, etc2. Household items with high purchase frequency e.g., soap, paper towels, toilet paper, toothpaste, garbage bags etc.3. Household items with low purchase frequency e.g., furniture, mattresses, drapes, linen etc.4. Other foods is comprised of baked goods, fish & shellfish, food oils, cereal, alcohol, etc.5. Canadian goods exports to the United States was $381 bn leading to a trade deficit of $16 bn; bilateral trade is worth $746 bn (= $365 bn + $381 bn)Source: US Exports Data 2015, A.T. Kearney analysis
Detailed breakdown in Appendix
31
17
9
Automotive
34
257
Retail Goods Imports
108
Production Goods Imports1
All Goods Imports5
Apparel & Footwear
1
Food & Beverage
20
10
73
Electronics & Appliances
365
22
15
3
Household Goods
34Passenger Vehicles, Parts & Accessories
Consumables2
Durables3
Appliances
ElectronicsMeat & Dairy
Fresh
Other Foods4
Baseline of US-originating imports

8
Baseline Imports & Tariffs
Scenario Development
Direct and Indirect ImpactOn Retailers
Actions for RCC members
This assessment has quantified the impact on gross margins for retail in Canada through the lens of direct and indirect costs
• Examined current NAFTA and WTO tariffs and US –originating imports across 5,000+ line items
• Developed scenarios and tariff structures for a no-NAFTA trade relationship between USA and Canada
• Estimated direct impact on US-originating COGS due to tariffs
• Quantified indirect impact by:
– Estimating slowdown in GDP growth
– Quantifying lower household retail spend
– Using income elasticity to measure shift in category share of wallet
• Identified operational areas of focus for retailers in Canada
• Developed next steps and action items for retailers
Details of assessment
Source: A.T. Kearney

9
If NAFTA were terminated, there are three possible scenarios for Canada’s trade relationship with the United States
Scenarios overview
Scenario 1: Revert to Canada-US Free Trade Agreement (FTA)1
• Canada and USA agree to their own bilateral free trade agreement similar to the
current NAFTA agreement
Scenario 2: End of North American Free Trade
• Tariffs on US imports change to rates applied on other nations’ exports to Canada
under World Trade Organization (WTO) rules
Scenario 3: Protectionism Returns
• Rising nationalism and protectionism might see United States breaking with the WTO
treaty and raise tariffs as they see fit, prompting Canadian retaliation in kind
1. Canada-US Free Trade Agreement (CUFTA), preceded NAFTA and was effective 1989 – 1994; Scenario proposes a bilateral free-trade agreement at current tariff levels is agreed uponSource: A.T. Kearney
Mo
st
Lik
ely
Ex
tre
me
Scenario development

10
The direct impact of different scenarios depends on the tariff increase in each sub-category
9.8%2
7.9%
5.7%
1.1%
3.3%
0.0%
0.0%
248.9%
Example Potential Tariffs (% of import value)
Scenario 1: Revert to Canada-US FTA
Scenario 2: End of N. American Free Trade
Scenario 3: Protectionism Returns
Example Potential Tariffs (% of import value)
20.0%
20.0%
248.9%
20.0%
20.0%
20.0%
20.0%
20.0%
Overview of tariff scenarios
Example Potential Tariffs (% of import value)
NAFTA Current State
Avg. NAFTA Tariffs (% of import value)
248.9%
Fresh
Apparel & Footwear
0.0%
Meat & Dairy
Other Foods
Electronics
0.0%
0.0%
0.0%Appliances
0.0%
0.0%
Automotive 0.0%
Household Goods 0.0%
0.0%
0.0%
0.0%
0.0%
0.0%
248.9%
0.0%
1. Other foods is comprised of baked goods, fish & shellfish, food oils, cereal, alcohol, etc.2. This has been calculated as a weighted average of the avg. MFN applied duties for the following retail categories: Alcohol(3.8%), Baked Goods (0%), Cereals (20.5%), Fish & Shellfish
(0.9%), Food Oils (3.8%), Other Foods (3.5% to 10.4%)3. Other NAFTA categories (non-retail) with MFN applied tariffs include petroleum (0.9%), chemicals (0.8%), transport equipment (5.7%), manufactures (2.5%) and wood, paper, etc. (0.9%) Source: A.T. Kearney
Direct impact on retailers in Canada
Sample Tariff Increase
Automotive Household Goods Electronics & Appliances Food & Beverage Apparel & Footwear

11
As a reference, every one percentage point increase in tariff rates increases 2019 COGS for retailers in Canada by ~$1 bn
Incremental retail COGS due to 1 ppt increase in tariffs(CAD$ mn, nationwide)
Source: US Exports Data 2015, CBSA Tariff Schedule September 2017, A.T. Kearney analysis
Total
83
109
Household Goods Food & Beverage
196
110
Automotive
27
1,063
28
307
444
6
Apparel & Footwear
59
Electronics & Appliances
Appliances
Electronics
Meat & Dairy
Fresh
Other Foods
Direct impact on retailers in Canada

12
• Cumulative impact of ~$21 bn
• With automotive and household goods importers most impacted, 5 of the 8 categories suffer $1 bn+ in incremental COGS
The direct impact of rising tariffs will be a ~$4-20 bn increase in costs for retailers in Canada
Increase in US originating COGS(CAD$ mn)
• Minimal long-term impact
• Uncertainty during transition
period in case NAFTA
renegotiation fails and new
Canada-US FTA has to be
agreed upon
• Little to no impact on current
retailer supply chains and
supplier relationships
• Cumulative impact of ~$4 bn
• Automotive is most impacted, however, high tariffs threaten low margin categories such as Fresh and Other Foods
Fresh $194 mn
$1,062 mnOther Foods
$2,531 mnAutomotive
Household Goods $0 mn
$0 mn
Electronics
Appliances
$91 mn
$0 mn
$48 mnApparel & Footwear
Meat & Dairy
Other Foods $2,174 mn
Meat & Dairy $0 mn
Household Goods
Fresh
Apparel & Footwear $122 mn
$6,144 mn
$1,176 mn
Automotive
Appliances
Electronics
$536 mn
$1,654 mn
$8,880 mn
Direct impact on retailers in Canada
Scenario 1: Revert to Canada-US FTA
Scenario 2: End of N. American Free Trade
Scenario 3:
Protectionism Returns
Source: A.T. Kearney
13
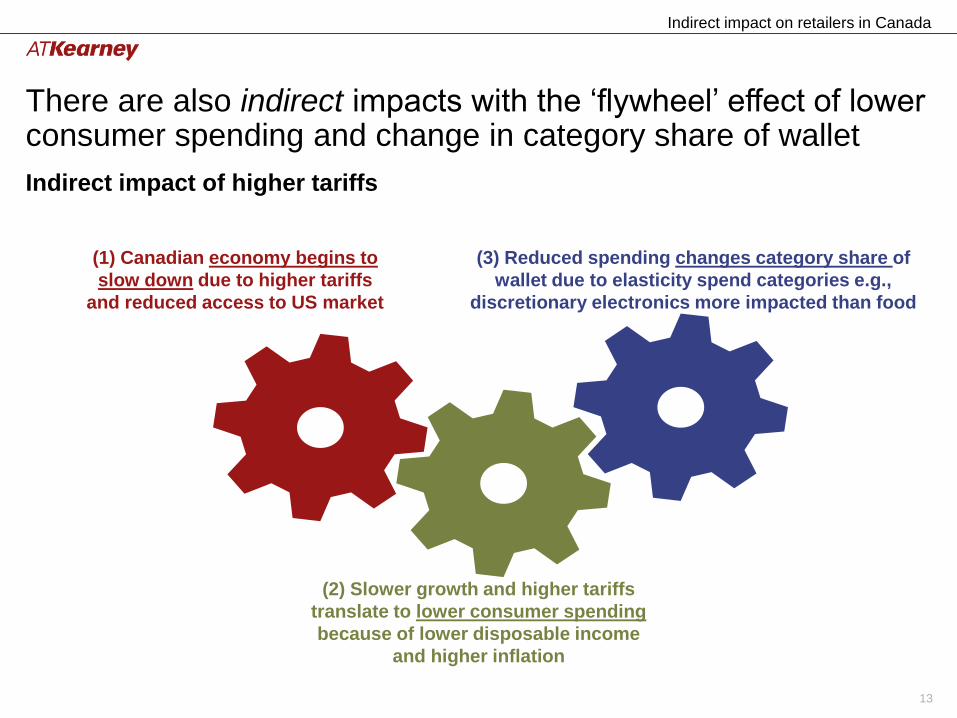
There are also indirect impacts with the ‘flywheel’ effect of lower consumer spending and change in category share of wallet
(1) Canadian economy begins to
slow down due to higher tariffs
and reduced access to US market
(2) Slower growth and higher tariffs
translate to lower consumer spending
because of lower disposable income
and higher inflation
Indirect impact of higher tariffs
(3) Reduced spending changes category share of
wallet due to elasticity spend categories e.g.,
discretionary electronics more impacted than food
Indirect impact on retailers in Canada
14
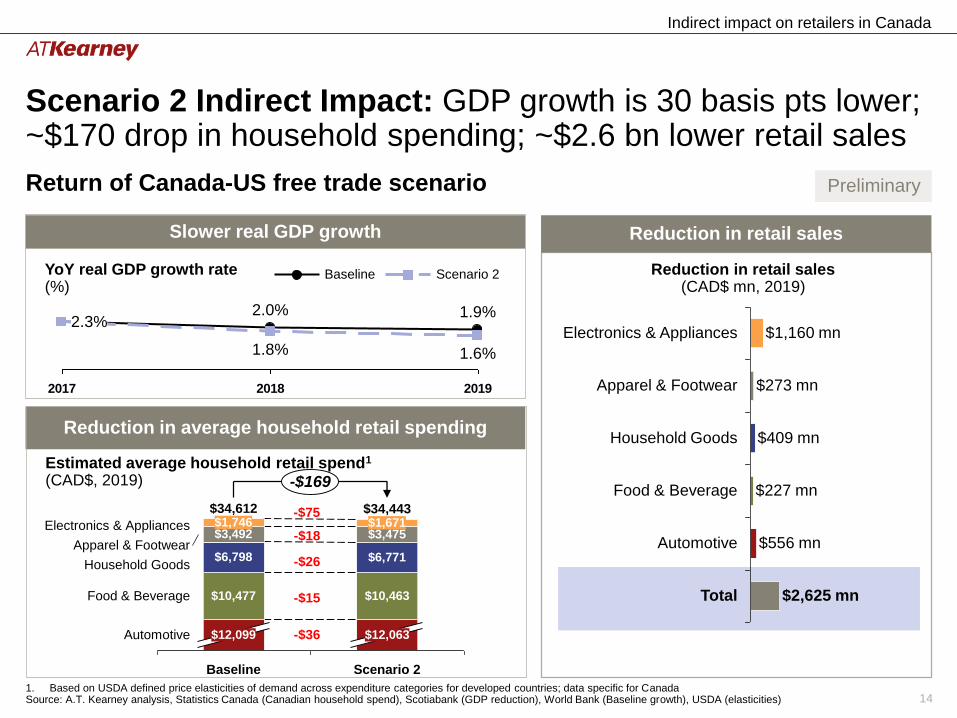
2017 2018 2019
1.8% 1.6%
2.3%1.9%2.0%
Baseline Scenario 2
$10,477
$12,099
$6,798
$3,492$1,746
$34,612
Apparel & Footwear
$1,671
$12,063
$6,771
Electronics & Appliances
Automotive
$34,443
Household Goods
Scenario 2
$10,463
$3,475
Food & Beverage
Baseline
-$169
Slower real GDP growth
Reduction in average household retail spending
1. Based on USDA defined price elasticities of demand across expenditure categories for developed countries; data specific for CanadaSource: A.T. Kearney analysis, Statistics Canada (Canadian household spend), Scotiabank (GDP reduction), World Bank (Baseline growth), USDA (elasticities)
Return of Canada-US free trade scenario
-$18
-$26
-$15
-$36
Scenario 2 Indirect Impact: GDP growth is 30 basis pts lower; ~$170 drop in household spending; ~$2.6 bn lower retail sales
Estimated average household retail spend1
(CAD$, 2019)
Indirect impact on retailers in Canada
YoY real GDP growth rate(%)
-$75
Reduction in retail sales (CAD$ mn, 2019)
Total
Automotive
$2,625 mn
$556 mn
Food & Beverage
$409 mn
$273 mn
Electronics & Appliances
Household Goods
$1,160 mn
Apparel & Footwear
$227 mn
Reduction in retail sales
Preliminary

15
2017 2018 2019
0.1%
1.9%
0.6%
2.3%2.0%
Baseline Scenario 2
$3,380
-$1,078
$6,798
Automotive $11,870
$1,746
Baseline
Food & Beverage
Household Goods
$34,612
Electronics & Appliances
$10,384
$6,630
Scenario 3
Apparel & Footwear
$33,534$1,270
$10,477
$12,099
$3,492
Slower real GDP growth
Reduction in average household retail spending
1. Based on USDA defined price elasticities of demand across expenditure categories for developed countries; data specific for CanadaSource: A.T. Kearney analysis, Statistics Canada (Canadian household spend), Scotiabank (GDP reduction), World Bank (Baseline growth), USDA (elasticities)
Estimated average household retail spend1
(CAD$, 2019)
Indirect impact on retailers in Canada
YoY real GDP growth rate(%)
Total
$2,602 mn
Automotive
Apparel & Footwear
$3,535 mn
$16,690 mn
$1,446 mn
$1,735 mn
Food & Beverage
Electronics & Appliances $7,372 mn
Household Goods
Reduction in retail sales
Scenario 3 Indirect Impact: GDP growth is 180 basis pts lower; ~$1,100 drop in household spending; ~$17 bn lower retail sales
Protectionism returns scenario
-$112
-$168
-$93
-$228
-$476
Reduction in retail sales (CAD$ mn, 2019)
Preliminary

16
Key Takeaway: The cumulative impact of Scenarios 2 and 3 is to potentially reduce gross margins in retail by ~$5-25 bn
• Discretionary goods (e.g.,
electronics & appliances,
automotive and household
goods) will be impacted by
the shift in share of wallet
Decreased Sales
• Automotive and household
goods are at greatest risk of
increased COGS due to
volume of imports and
magnitude of tariff increase
Increased COGS
$0.1 bn
$0.5 bn
$4.7 bnTotal
Household Goods
$1.3 bnFood & Beverage
Apparel & Footwear $0.2 bn
Electronics & Appliances
Automotive $2.6 bn
$24.5 bn
$3.6 bn
$3.7 bn
$1.0 bn
$9.3 bn
$6.9 bn
2
Reduction in baseline category gross margins(CAD$ bn, 2019)
Scenario 2(Most Likely)
Scenario 3(Assuming 20% Tariffs)
Source: A.T. Kearney
(Fresh, Meat & Dairy and Other Foods)
(Consumables and Durables)
Gross margin impact on retailers in Canada
Preliminary

17
Gross margin impact for retailers will depend on their exposure to US-originating COGS and the scenario under consideration
Hypothetical impact calculator for “Diane’s General Store”(2019, Scenario 2)
Customized impact available on request
Apparel & Footwear
Household Goods
1. Gross Margin Impact =[ Current GM * % Nationwide Sales Decrease] + [Current COGS * % US-sourced*(1-% Nationwide Sales Decrease)*Tariff Rate Increase]2. Example: In Scenario 2, % decrease in nationwide apparel sales is 0.7% and tariff increase is 7.9%; Therefore GM impact = [$217 mn* 0.007]+[$533 mn*0.15*0.993*0.079] = $7.8 mn3. National sales decrease is measured as reduction in retail sales under scenario as a proportion of national retail sales in that categorySource: A.T. Kearney
Gross margin impact on retailers in Canada
Sales
($ mn)
COGS
($ mn)
Current Gross
Margin ($ mn)
% COGS
US-Originating
Gross Margin Impact
($ mn)1
$3,750 mn $2,475 mn $1,275 mn 25%-$3.2 mn
(-0.2%)
$750 mn $533 mn $217 mn 15%-$7.8 mn2
(-3.6%)
$500 mn $350 mn $150 mn 80%-$27.7 mn
(-19%)
$5,000 mn $3,358 mn $1,642 mn 29%- $38.7 mn
(-2.4%)
Food & Beverage
(Packaged)

18
These scenarios have the potential to impact retailers in Canada in three major areas
• Higher tariffs and reduced sales will impact bottom-line of retailers unless costs are passed onto customers or cost reduction is achieved
• Smaller retailers with greater exposure to US-originating imports are disproportionately impacted
Profitability Supply Chain Organization
• Tighter rules of origin on embedded content may prompt companies to buy outside of NAFTA suppliers
• This may necessitate re-working of complex supply chains and re-design of distribution networks
• Organizational capabilities on trade compliance, sourcing and supply chain will need to be enhanced
• Retailers may need enhanced capabilities to analyze bill of materials and product classifications to assess origins and tariff impacts
19
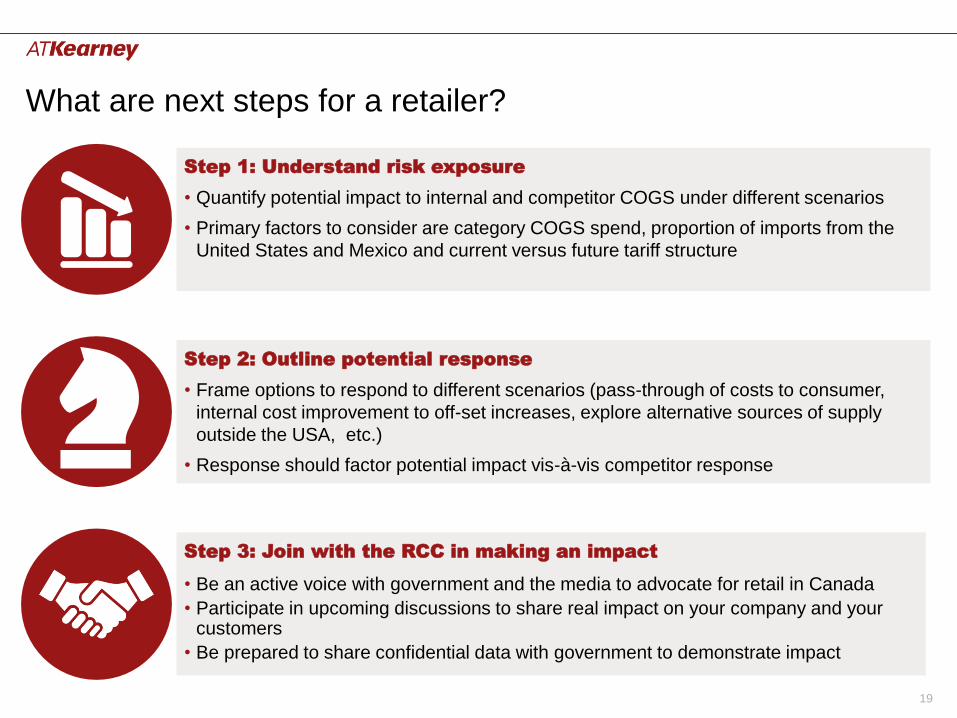
What are next steps for a retailer?
Step 1: Understand risk exposure
• Quantify potential impact to internal and competitor COGS under different scenarios
• Primary factors to consider are category COGS spend, proportion of imports from the
United States and Mexico and current versus future tariff structure
Step 2: Outline potential response
• Frame options to respond to different scenarios (pass-through of costs to consumer,
internal cost improvement to off-set increases, explore alternative sources of supply
outside the USA, etc.)
• Response should factor potential impact vis-à-vis competitor response
Step 3: Join with the RCC in making an impact
• Be an active voice with government and the media to advocate for retail in Canada
• Participate in upcoming discussions to share real impact on your company and your customers
• Be prepared to share confidential data with government to demonstrate impact

20
Appendix

21
Your A.T. Kearney team
Raj Mukherjee
Manager, [email protected]
Dean Hillier
Partner, [email protected]
Johan Gott
Principal, Washington D.C.

22
Key Assumptions – Calculation Inputs
Spend as a % of GDP
2015 Canada Real GDP (CAD) $2,018,649,947,620
2015 Population of Canada 35,848,610
2015 Real GDP per capita $56,310.41
2016 Average people per
household2.4
2015 Average GDP per
Canadian household $135,144.99
2015 Average Household
Spend$60,516
2015 Avg Household Spend
as a % of Avg Household
GDP
45%
Current State
2016 Canada Real GDP (CAD) $2,027,729,657,3831990 - 2016 Canadian GDP (World Bank)
2016 Exchange Rate (Canadian Forex)
2016 Average people per household 2.4 2016 Census - Avg. Houseold Size (Statistics Canada)
Calculating Avg Household Retail Spend as a % of Total
Avg. Household Retail Spend
Revised Categories% of Total
Average SpendSource
Household Goods 10.9%2015 Distribution of
Avg Household
Spend (Statistics
Canada)
Apparel & Footwear 5.6%
Electronics & Other 2.8%
Food & Beverage 16.8%
Automotive 19.4%
Total 55.50%
% of Retail Household Spend
Household Goods 20%
Apparel & Footwear 10%
Food & Beverage 30%
Automotive 35%
Electronics & Other 5%
Total Retail Portion of Avg.
Household Spend100.0%
• Derived Avg. Household spend as a % of GDP as a way of deriving spend for 2017 through 2019 given GDP growth projections
• 2016 GDP used as base for GDP projections
• Avg household size used to determine avg. GDP per household
• Used to determine what % of avg. household spend is attributed to retail categories
• Used to determine the distribution of baseline retail avg. household spend across retail categories
Sources / Methodology
1990 - 2016 Canadian GDP (World Bank)
1990 - 2016 Canadian Population Estimates (World Bank)
Calculated using current year GDP / current year population
estimates
2016 Census - Avg. Houseold Size (Statistics Canada)
Calculated using 2015 GDP per capita * 2016 avg people per
household
2015 Distribution of Avg Household Spend (Statistics Canada)
Calculated by taking 2015 Avg Household Spend / 2015 Avg
GDP per Canadian household

23
Retail spend represent 56% of average household spend
$3,994
$11,740
$10,167
$3,389
$6,596
Shelter
Health & Personal Care
Recreation
Education
Automotive
Food & Beverage
Electronics & Other
Apparel & Footwear
Household Goods
2019
$62,364
$18,023(29%)
$3,742(6%)
$4,116(7%)
$1,871(3%)
$12,099(19%)
$10,477(17%)
$1,746(3%)
$3,492(6%)
$6,798(11%)
2015
$60,516
$17,489
$3,631
$1,815
$1,694
Comparison of Average Household Spend($CAD)
Annual retail spend
($34,612, 56% of household spend)
Source Statistics Canada

24
Price Elasticities: Determining Distribution of 1 unit reduction in spend
• Took distribution of one unit of spend based on price elasticities across all categories
• Focusing on retail, identified distribution of 1 unit of retail-specific spend across retail relevant categories
• For transportation, divided percentage to only include retail relevant subcategories like vehicle and auto part purchases
Baseline (distribution
of $1)
Food & Beverage 0.05
Apparel & Footwear 0.06
Gross rent, fuel & power 0.20
Household Goods 0.09
Medical Care 0.12
Education 0.08
Transport & Communication 0.15
Other - Discretionary 0.26
Total Reduction per Year 1.00
Sources 2010 Price Elasticities
Report (USDA)
Retail Related Portion of Incremental Unit
0.58
% of Transport vs Com. Source
84%Transportation Sub-Categories
(Statistics Canada)
Baseline (distribution of $1)
Food & Beverage 0.09
Apparel & Footwear 0.10
Household Goods 0.16
Automotive 0.21
Electronics & Appliances 0.44
Total 1.00
Distribution of 1 unit of spend across all categories
Distribution of 1 unit of spend across retail categories
Methodology

25
Sample line items with high tariff rates under NAFTA
SelectionSelection of High Tariff Items
Baked Goods
Other Foods
Food Oils
Meat & Dairy
HS Code MFN Tariff Description of Goods
40610
245.5% but not
less than
$4.52/kg
(0406.10.20) Cheese and curd. - Fresh (unripen
or uncured) cheese, including whey cheese,
and curd
40640
245.5% but not
less than
$5.33/kg
(0406.40.20) Cheese and curd. - Blue-veined
cheese and other cheese containing veins
produced by Penicillium roqueforti
40721
163.5% but not
less than
79.9¢/dozen
(0407.21.20) Birds' eggs, in shell, fresh,
preserved or cooked. - Other fresh eggs: - Of
fowls of the species Gallus domesticus
160100 154.50%
(1601.00.32) Sausages and similar products, of
meat, meat offal or blood; food preparations
based on these products. - Of turkeys, other
than in cans or glass jars
HS Code MFN Tariff Description of Goods
210690
212% but not
less than
$2.11/kg
(2106.90.32) Food preparations not elsewhere
specified - Milk, cream or butter substitutes,
containing 50% or more by weight of dairy
content
210690
212% but not
less than
$2.11/kg
(2106.90.34) Food preparations not elsewhere
specified or included - Preparations, containing
more than 15% by weight of milk fat but less
than 50% by weight of dairy content, suitable for
use as butter substitutes
210690 $1.45/kg(2106.90.52) Food preparations not elsewhere
specified or included - Egg preparations
210690
274.5% but not
less than
$2.88/kg
(2106.90.94) Food preparations not elsewhere
specified or included - Containing 50% or more
by weight of dairy content
HS Code MFN Tariff Description of Goods
180690
265% but not
less than
$1.15/kg
(1806.90.12) Chocolate and other food
preparations containing cocoa - Chocolate ice
cream mix or ice milk mix
HS Code MFN Tariff Description of Goods
151790
218% but not
less than
$2.47/kg
(1517.90.22) Margarine; edible mixtures or
preparations of animal or vegetable fats or oils -
Substitutes for butter
Source: Canada Border Service Agency

26
Sample line items with high tariff rates under NAFTA
SelectionSelection of High Tariff Items
Baked Goods
Other Foods
Food Oils
Meat & Dairy
HS Code MFN Tariff Description of Goods
40610
245.5% but not
less than
$4.52/kg
(0406.10.20) Cheese and curd. - Fresh (unripen
or uncured) cheese, including whey cheese,
and curd
40640
245.5% but not
less than
$5.33/kg
(0406.40.20) Cheese and curd. - Blue-veined
cheese and other cheese containing veins
produced by Penicillium roqueforti
40721
163.5% but not
less than
79.9¢/dozen
(0407.21.20) Birds' eggs, in shell, fresh,
preserved or cooked. - Other fresh eggs: - Of
fowls of the species Gallus domesticus
160100 154.50%
(1601.00.32) Sausages and similar products, of
meat, meat offal or blood; food preparations
based on these products. - Of turkeys, other
than in cans or glass jars
HS Code MFN Tariff Description of Goods
210690
212% but not
less than
$2.11/kg
(2106.90.32) Food preparations not elsewhere
specified - Milk, cream or butter substitutes,
containing 50% or more by weight of dairy
content
210690
212% but not
less than
$2.11/kg
(2106.90.34) Food preparations not elsewhere
specified or included - Preparations, containing
more than 15% by weight of milk fat but less
than 50% by weight of dairy content, suitable for
use as butter substitutes
210690 $1.45/kg(2106.90.52) Food preparations not elsewhere
specified or included - Egg preparations
210690
274.5% but not
less than
$2.88/kg
(2106.90.94) Food preparations not elsewhere
specified or included - Containing 50% or more
by weight of dairy content
HS Code MFN Tariff Description of Goods
180690
265% but not
less than
$1.15/kg
(1806.90.12) Chocolate and other food
preparations containing cocoa - Chocolate ice
cream mix or ice milk mix
HS Code MFN Tariff Description of Goods
151790
218% but not
less than
$2.47/kg
(1517.90.22) Margarine; edible mixtures or
preparations of animal or vegetable fats or oils -
Substitutes for butter
Source: Canada Border Service Agency

27
Details of other categories that make up retail relevant and non-retail relevant imports
Retail
End-Use Code
U.S. Exports to
Canada Value 2015
($CAD, K)
(30000) Passenger cars, new and used $18,601,504
(41050) Cell phones and other household
goods, n.e.c. $6,038,436
(21300) Computers $5,310,705
(40120) Toiletries and cosmetics $4,568,646
(41120) Toys, games, and sporting goods $4,547,209
(21301) Computer accessories $3,902,473
(40140) Other consumer nondurables $3,737,109
(41030) Household appliances $3,432,572
(40000) Apparel, household goods -
textile $3,059,063
(41000) Furniture, household goods, etc. $2,959,272
(40110) Books, printed matter $2,727,231
(12270) Precious metals, other $1,714,401
(40030) Apparel, household goods-
nontextile $1,600,430
(12260) Nonmonetary gold $1,487,681
(41310) Jewelry, etc. $1,183,407
(41200) Televisions and video equipment $1,054,635
(41220) Recorded media $968,358
(00370) Wine, beer, and related products $817,237
(41110) Pleasure boats and motors $815,325
Retail
End-Use Code
U.S. Exports to
Canada Value 2015
($CAD, K)
(41210) Stereo equipment, etc.$802,786
(41040) Rugs$793,399
(41020) Cookware, cutlery, tools$641,510
(40130) Tobacco, manufactured$632,353
(41140) Musical instruments$521,167
(12640) Finished textile supplies$492,181
(01010) Alcoholic beverages, excluding
wine $332,131
(41010) Glassware, chinaware$303,784
(41320) Artwork, antiques, stamps, etc.$296,695
(42100) Gem diamonds$288,887
(40050) Sports apparel and gear$258,487
(12650) Leather and furs$44,184
(41300) Numismatic coins$35,265

28
Details of other categories that make up retail relevant and non-retail relevant imports (cont.)
Not Retail
End-Use Code
U.S. Exports to
Canada Value 2015
($CAD, K)
(30100) Trucks, buses and special
purpose vehicles $17,657,946
(21180) Industrial machines, other $13,088,340
(11120) Petroleum products, other $10,997,073
(22090) Civilian aircraft, engines,
equipment, and parts $10,814,007
(11100) Crude oil $9,590,289
(20005) Electric apparatus $8,734,149
(60000) Minimum value shipments $8,480,761
(12500) Plastic materials $7,855,692
(12770) Other industrial supplies $7,648,761
(21100) Industrial engines $7,272,554
(30200) Engines and engine parts
(carburetors, pistons, rings, and valves) $6,893,868
(12300) Finished metal shapes $6,597,928
(21400) Telecommunications equipment $6,113,936
(12550) Chemicals-other $6,071,103
(40100) Pharmaceutical preparations $5,914,099
(12100) Iron and steel mill products $5,343,748
(21170) Materials handling equipment $5,207,212
(21030) Excavating machinery $5,177,935
(12430) Newsprint $4,614,515
Not Retail
End-Use Code
U.S. Exports to
Canada Value 2015
($CAD, K)
(21160) Measuring, testing, control
instruments $4,330,465
(12540) Chemicals-organic $3,945,715
(21610) Medicinal equipment $3,769,571
(21190) Photo, service industry
machinery $3,599,226
(20000) Generators, accessories $3,273,754
(21200) Agricultural machinery,
equipment $3,270,150
(13210) Shingles, molding, wallboard $3,168,086
(12510) Chemicals-fertilizers $2,965,234
(11200) Gas-natural $2,899,192
(21320) Semiconductors $2,864,722
(12110) Iron and steel products, other $2,819,135
(12200) Aluminum and alumina $2,650,814
(11110) Fuel oil $2,379,096
(12530) Chemicals-inorganic $1,907,476
(21120) Metalworking machine tools $1,848,500
(12750) Industrial rubber products $1,752,391
(21500) Business machines and
equipment $1,743,182
(11130) Natural gas liquids $1,649,250
(00220) Animal feeds, n.e.c. $1,640,087

29
Details of other categories that make up retail relevant and non-retail relevant imports (cont.)
Not Retail
End-Use Code
U.S. Exports to
Canada Value 2015
($CAD, K)
(22100) Railway transportation equipment $1,598,709
(13100) Logs and lumber $1,530,396
(11020) Coal and fuels, other $1,488,752
(12000) Steelmaking materials $1,227,710
(12620) Manmade cloth $1,195,449
(12290) Nonferrous metals, other $1,165,423
(12760) Mineral supplies-manufactured $1,085,133
(12210) Copper $1,072,739
(21600) Laboratory testing instruments $1,067,508
(21140) Wood, glass, plastic $1,061,633
(21110) Food, tobacco machinery $1,026,579
(13110) Wood supplies, manufactured $982,006
(21000) Drilling & oilfield equipment $888,555
(60010) Miscellaneous domestic exports
and special transactions $867,711
(13200) Glass-plate, sheet, etc. $774,812
(12700) Synthetic rubber-primary $774,259
(10150) Agriculture-manufactured, other $741,696
(10140) Agric. farming-unmanufactured$666,437
(10130) Agric. industry-unmanufactured $634,980
Not Retail
End-Use Code
U.S. Exports to
Canada Value 2015
($CAD, K)
(11010) Metallurgical grade coal $627,281
(21150) Pulp and paper machinery $587,116
(12420) Pulpwood and woodpulp $478,361
(21040) Nonfarm tractors and parts $392,687
(22220) Marine engines, parts $360,097
(13220) Nontextile floor tiles $333,289
(11400) Electric energy $313,466
(42000) Nursery stock, etc. $279,724
(21130) Textile, sewing machines $255,381
(50050) Tanks, artillery, missiles, rockets,
guns and ammunition $237,488
(12720) Nonmetallic minerals $232,588
(21010) Specialized mining $232,051
(10120) Hides and skins $214,539
(50070) Parts for military-type goods $158,465
(12630) Hair, waste materials $133,305
(12600) Cotton fiber cloth $132,964
(11300) Nuclear fuel materials $110,756
(50030) Military trucks, armored vehicles,
etc.$58,091
(22210) Commercial vessels, other $56,610

30
Mixed
End-Use Code
U.S. Exports to
Canada Value 2015
($CAD, K)
(30230) Other parts and accessories of
vehicles $29,150,131
(00360) Other foods $6,450,943
(00320) Fruits, frozen juices $5,084,707
(00330) Vegetables $4,265,504
(00350) Bakery products $3,947,822
(00300) Meat, poultry, etc. $3,286,498
(30220) Automotive tires and tubes $2,094,444
(01000) Fish and shellfish $1,526,871
(00340) Nuts $1,199,424
(00110) Oilseeds, food oils $769,506
(00310) Dairy products and eggs $541,081
(00200) Corn $451,693
(00010) Rice $277,211
(01020) Nonagricultural foods, etc. $154,005
(00100) Soybeans $121,944
(00000) Wheat $93,406
(00210) Sorghum, barley, oats $45,083
Details of other categories that make up retail relevant and non-retail relevant imports (cont.)
Not Retail
End-Use Code
U.S. Exports to
Canada Value 2015
($CAD, K)
(22200) Vessels, excluding scrap $34,748
(10100) Tobacco, unmanufactured $24,346
(12765) Tapes, audio and visual $18,130
(50010) Aircraft launching gear, parachutes,
etc. $6,575
(30210) Bodies and chassis for passenger
cars $3,428
(10000) Cotton, raw $941
(22300) Spacecraft, excluding military$36
(50060) Military apparel and footwear$20
(50020) Engines and turbines for military
aircraft $8
(50000) Military aircraft, complete $0
(60040) Undocumented exports to Canada$0

31
Americas Atlanta
Bogotá
Boston
Calgary
Chicago
Dallas
Detroit
Houston
Mexico City
New York
Palo Alto
San Francisco
São Paulo
Toronto
Washington, D.C.
Asia Pacific Bangkok
Beijing
Brisbane
Hong Kong
Jakarta
Kuala Lumpur
Melbourne
Mumbai
New Delhi
Perth
Seoul
Shanghai
Singapore
Sydney
Taipei
Tokyo
Europe Amsterdam
Berlin
Brussels
Bucharest
Budapest
Copenhagen
Düsseldorf
Frankfurt
Helsinki
Istanbul
Kiev
Lisbon
Ljubljana
London
Madrid
Milan
Moscow
Munich
Oslo
Paris
Prague
Rome
Stockholm
Stuttgart
Vienna
Warsaw
Zurich
Middle East
and Africa
Abu Dhabi
Doha
Dubai
JohannesburgRiyadh
A.T. Kearney is a leading global management consulting firm with offices in more than 40 countries. Since
1926, we have been trusted advisors to the world's foremost organizations. A.T. Kearney is a partner-owned
firm, committed to helping clients achieve immediate impact and growing advantage on their most mission-
critical issues. For more information, visit www.atkearney.com.