Topic 3. COST VOLUME PROFIT APPROACH
Vera Butkouskaya

CONTENT
▰▰
▰▰▰
2©2017 Vera Butkouskaya www.verapetrovna.com©2017 Vera Butkouskaya www.verapetrovna.com
COST VOLUME PROFIT (CVP) ANALYSIS
▰ helpful to understand the relationship among variable costs, fixed costs and profit.
▰ looks at the relationship between selling prices, sales volumes, costs, and profits.
3
?
COST VOLUME PROFIT ANALYSIS
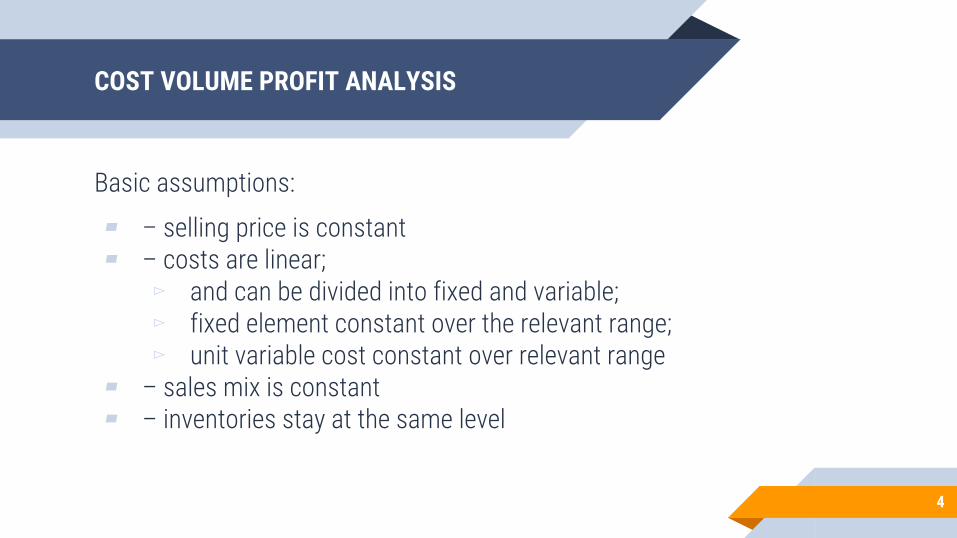
Basic assumptions:
▰ – selling price is constant▰ – costs are linear;
▻ and can be divided into fixed and variable; ▻ fixed element constant over the relevant range; ▻ unit variable cost constant over relevant range
▰ – sales mix is constant▰ – inventories stay at the same level
4

Contribution Margin (CM)
▰ Contribution Margin (CM) ▻ is the amount remaining from sales revenue ▻ after variable expenses have been deducted
▰ CM goes to cover fixed expenses.▰ After covering fixed costs,
▻ any remaining CM contributes to income.
5
Contribution Margin ratio (CMR)
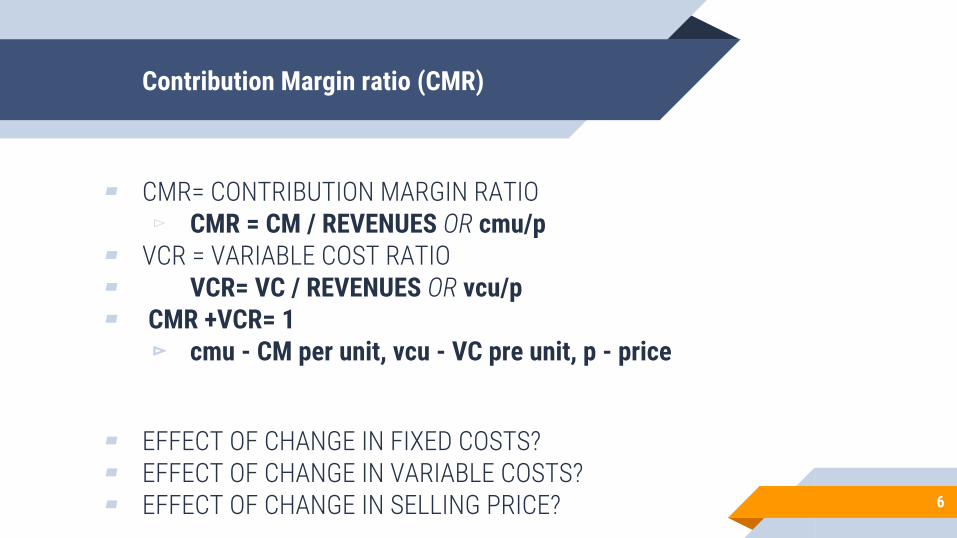
▰ CMR= CONTRIBUTION MARGIN RATIO▻ CMR = CM / REVENUES OR cmu/p
▰ VCR = VARIABLE COST RATIO▰ VCR= VC / REVENUES OR vcu/p▰ CMR +VCR= 1
▻ cmu - CM per unit, vcu - VC pre unit, p - price
▰ EFFECT OF CHANGE IN FIXED COSTS?▰ EFFECT OF CHANGE IN VARIABLE COSTS?▰ EFFECT OF CHANGE IN SELLING PRICE? 6

Contribution Margin calculation examples 7
Break Even Point (BEP)
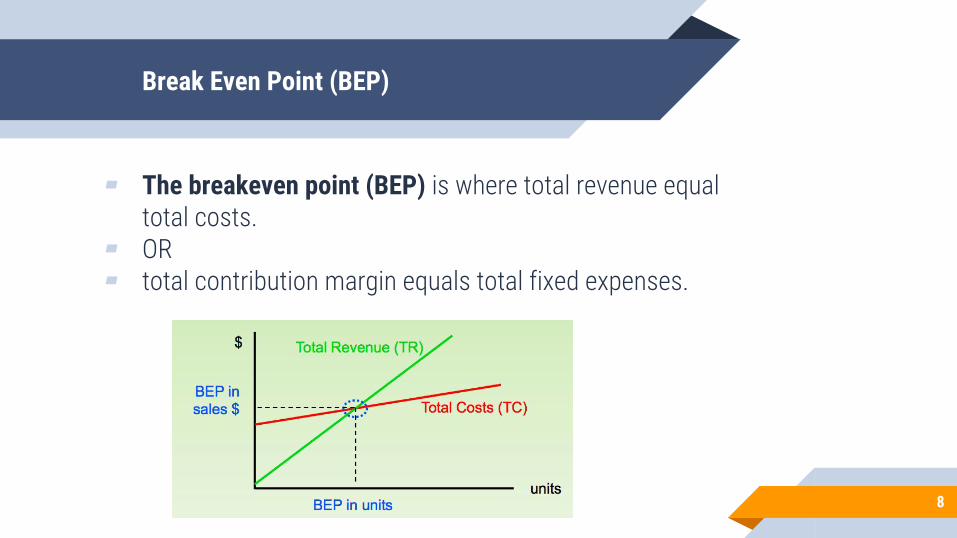
▰ The breakeven point (BEP) is where total revenue equal total costs.
▰ OR▰ total contribution margin equals total fixed expenses.
8

The Contribution Approach
9
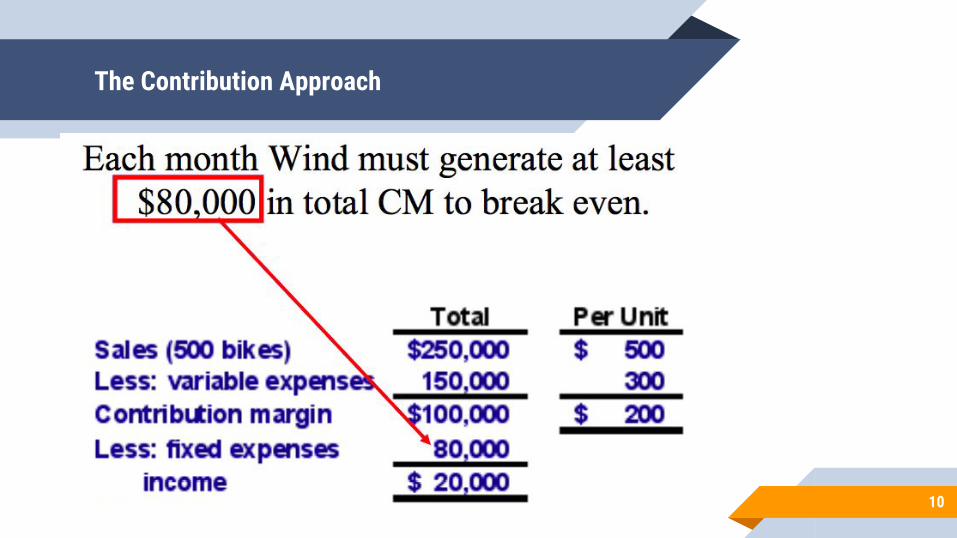
The Contribution Approach
10
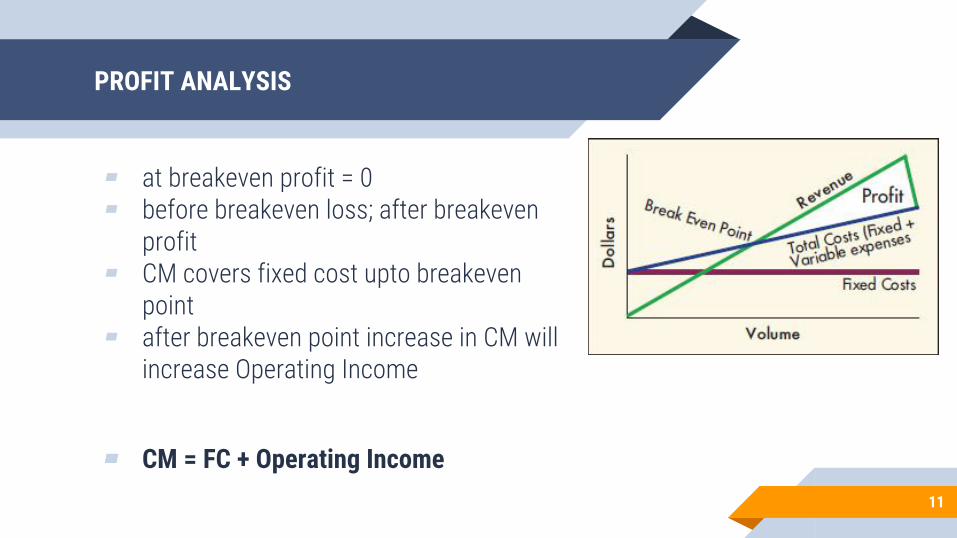
PROFIT ANALYSIS
▰ at breakeven profit = 0▰ before breakeven loss; after breakeven
profit▰ CM covers fixed cost upto breakeven
point▰ after breakeven point increase in CM will
increase Operating Income
▰ CM = FC + Operating Income11
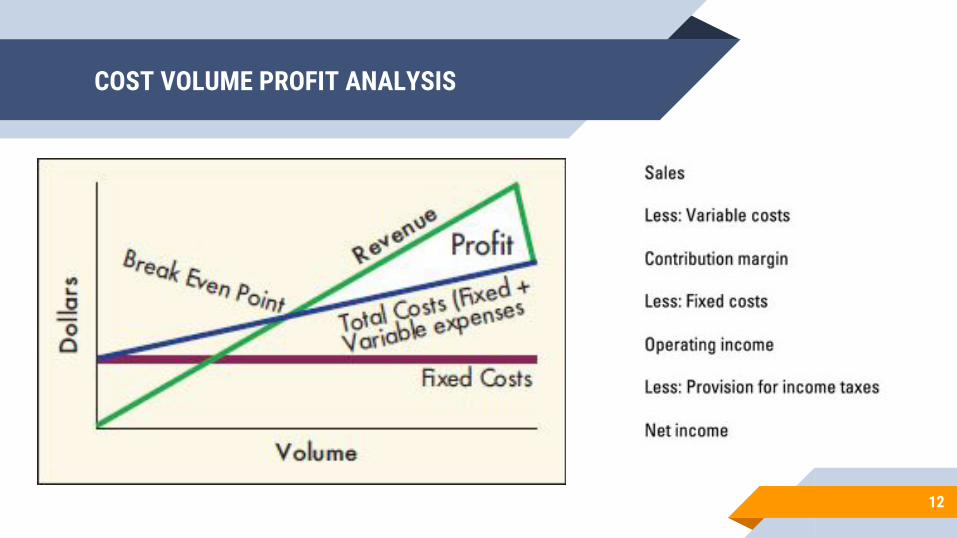
COST VOLUME PROFIT ANALYSIS
12
Break-Even Analysis
Break-even analysis can be approached in two ways:
1. Equation method2. Contribution margin method.
13
Equation Method
Operating Income =
Revenues – (Variable expenses + Fixed expenses)
Revenues = Variable expenses + Fixed expenses + Operating Income
OR
At the break-even point profits = 0.
14

DERIVATION OF EQUATIONS
▰ REVENUES= VARIABLE COSTS+FIXED COSTS + PROFIT▻ p*q= vcu *q + FC + 0 (*AT BREAKEVEN PROFIT = 0)▻ q * (p-vcu) = FC▻ q= FC / (p - vcu) OR q=FC / cmu
▰ CM= SALES - TOTAL VC▰ VC= SALES - CM *INCLUDE VARIABLE PRODUCTION AND SELLING EXPENSES▰ cmu= p - vcu OR cmu= CM/q▰ vcu= VC/ q▰ q - number of units, p - price, vcu - VC per unit, FC - total FC, cmu - CM per unit
15
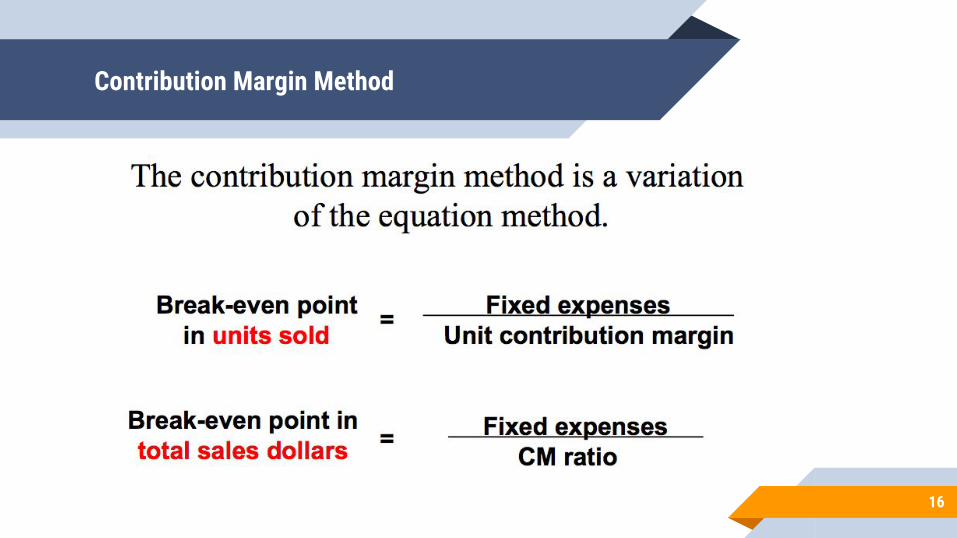
Contribution Margin Method
16
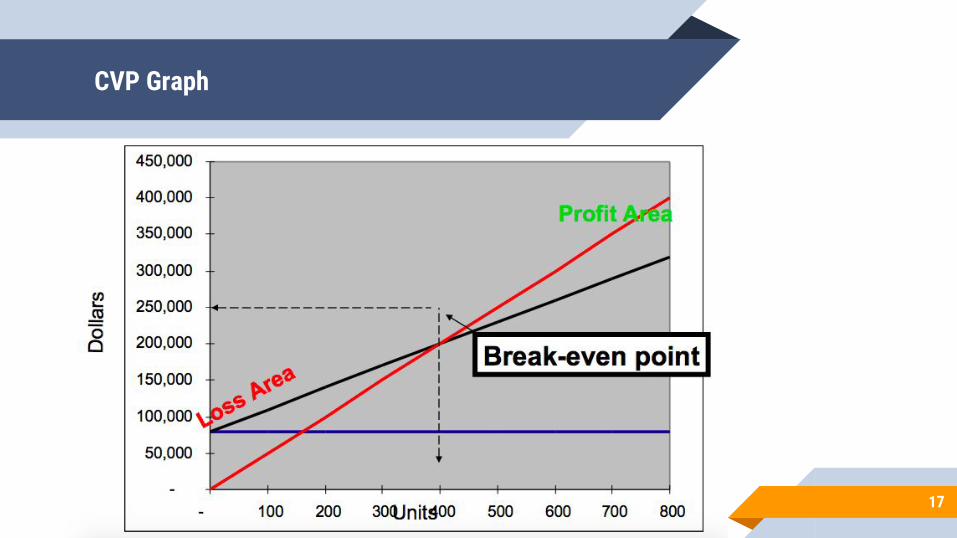
CVP Graph
17
Margin of Safety
▰ The Margin of Safety is▻ an excess of budgeted (or actual) sales▻ over the break-even volume of sales.
▰ Margin of safety = Total sales - Break-even sales
▰ The amount by which sales can drop before losses begin to be incurred.
18
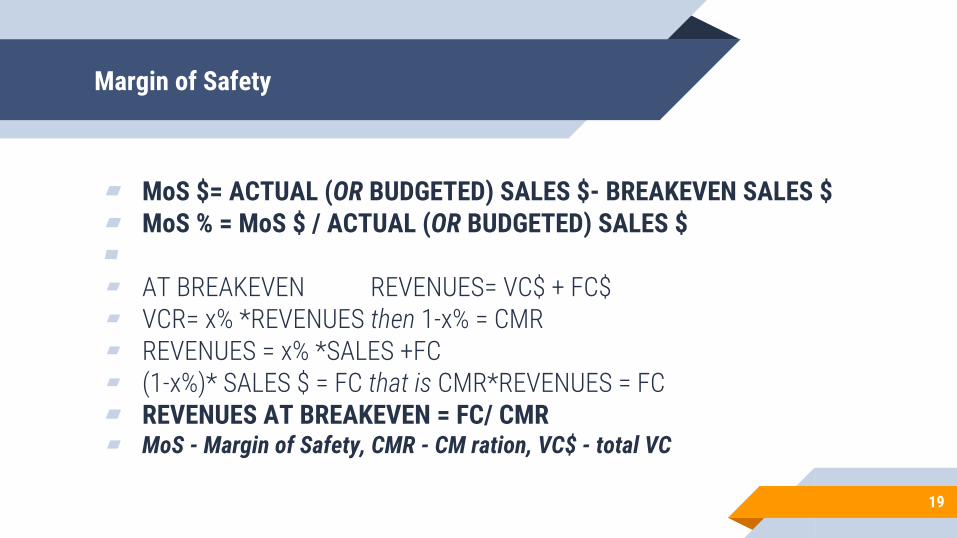
Margin of Safety
▰ MoS $= ACTUAL (OR BUDGETED) SALES $- BREAKEVEN SALES $▰ MoS % = MoS $ / ACTUAL (OR BUDGETED) SALES $▰▰ AT BREAKEVEN REVENUES= VC$ + FC$▰ VCR= x% *REVENUES then 1-x% = CMR▰ REVENUES = x% *SALES +FC▰ (1-x%)* SALES $ = FC that is CMR*REVENUES = FC▰ REVENUES AT BREAKEVEN = FC/ CMR▰ MoS - Margin of Safety, CMR - CM ration, VC$ - total VC
19
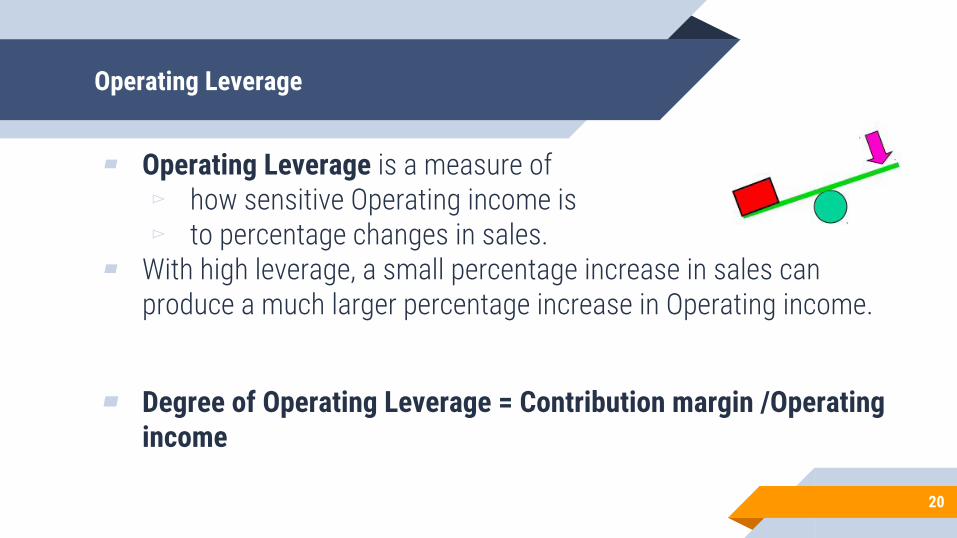
Operating Leverage
▰ Operating Leverage is a measure of ▻ how sensitive Operating income is ▻ to percentage changes in sales.
▰ With high leverage, a small percentage increase in sales can produce a much larger percentage increase in Operating income.
▰ Degree of Operating Leverage = Contribution margin /Operating income
20
COST STRUCTURE AND PROFITABILITY
▰ high variable costs lead to lower CM and less unsafe in crisis time▰ high fixed costs cause higher breakeven point;▰ after the breakeven point profits increase faster than the high variable cost
company▰ degree of operating leverage: contribution margin / net income▰ for a given % change in sales, income will increase by (% increase in sales
*degree of operating leverage)▰ degree of operating leverage decreases as the sales move away from the
breakeven point▰ if variable costs are high degree of operating leverage low; and vice versa
21

“ Bhimani A, Horngren CT, Datar SM and Rajan M. Management and Cost Accounting, 5/E. Financial Times Press 2012.
Chapter 8. Cost-volume-profit relationships.
22