


This dissertation has beenmicrofilmed exactly as received 70-9969
ATKINSON, Ian Athol Edward, 1932-RATES OF ECOSYSTEM DEVELOPMENT ONSOME HAWAIIAN LAVA FLOWS.
University of Hawaii, Ph.D., 1969Agriculture, soil science
University Microfilms, Inc., Ann Arbor, Michigan

RATES OF ECOSYSTEM DEVELOPMENT
ON SOME HAWAIIAN LAVA FLOWS
A DISSERTATION SUBMITTED TO THE
GRADUATE DIVISION OF THE UNIVERSITY OF HAWAII
IN PARTIAL FULFILLMENT OF THE REQUIREMENTS
FOR THE DEGREE OF
DOCTOR OF PHILOSOPHY
IN
SOIL SCIENCE
AUGUST 1969
By
Ian Athol Edward Atkinson
DISSERTATION COMl-fiTTEE:
L.D. Swindale, Cbairman
G. Donald Sherman
G. Uebara
Y. N. Tamimi
C.H. Lamoureux

iii
ACKNOWLEOOEMENTS
Many people have helped me in various ways during the course of
this work. In particular, I am especially grateful to the following
students and faculty at the University of Hawaii:
Dr. R.H. Jones, Information Science Dept., for his helpful advice
concerning the use and interpretation of multiple regression analyses.
Mr. C.L. Schroth, Agronomy and Soil Science Dept., for general
discussion of many aspects of the problem, particular assistance during
the running of the computer programs, and for collecting the samples
of Samoan lavas used in this study.
Mr. D.L. Taylor, Chemistry Dept., for his careful instruction and
help in the use of X-ray fluorescence techniques.
Mrs. Annie Chang, Agronomy and Soil Science Dept., and Mr. R.H.
Suehisa, Plant Physiology Dept., for their advice concerning technique
wi th the calcium analyses.
Miss Bernadette M. Paik, Agronomy and Soil Science Dept., for
carrYing out the C.E.C. determinations.
Dr. S.A. El-Swaify, Agronomy and Soil Science Dept., for helpful
discussion of many aspects of pH measurements.
Dr. H. Ikawa, Agronomy and Soil Science Dept., for introducing me
to the solution technique of Suhr and Ingamells (1966).
Dr. G.A. Macdonald, Geoscience Dept., for answering many questions
of a geological nature.
Dr. F.B. Thompson, Superintendent of the University Branch Station
at Hilo for his assistance in arranging transport during all phases of
the field work.
iv
Mr. Humphrey Ezumah, Agronomy and Soil Science Dept., for his
assistance with grinding the earliest batch of rock samples.
Mr. Renye Matsumura, Waiakea Experimental Farm, for accompanying
me on one of the more difficult field trips.
Dr. S. Pandey, Agronomy and Soil Science Dept., for patient
advice concerning thesis reproduction.
Mrs. Susan L. Aiu and Mr. R. Miura, Instructional Resources Center,
for final drafting and photographing of the diagrams.
Mrs. H.L. Ramage for her continuing patience and attention to
detail in typing the final copy of the dissertation.
My wife, Pamela, for her critical and constructive reading of
the manuscript, many hours of typing during preparation of the first
draft, and for carrying out all stages of photographic production.
The work reported in this thesis was funded through Project 140 F:
"Soils in introduced and indigenous forests", a Hawaii Agricultural
Experiment Station project.
My period of study in Hawaii was made possible through the
financial support of a National Research Fellowship awarded by the
New Zealand Government.

v
ABSTRACT
The objective of this study was to measure rates of plant
succession and rock weathering during the first 400 years of ecosystem
development on Hawaiian basalt lava flows. The flows chosen for study
were on the wettest slope s of Mauna Loa and Kilauea in a rainfall of
90 to 250 inches and between elevations of 40 to 4000 feet. These
flows are largely free from ash.
The oldest dated flow on Hawaii occurred little more than 200 years
ago (1750 A.D.), which gives insufficient time for much development. To
measure rates over a longer period, e.g. 400 years, it was necessary to
date older flows. Since obtaining carbon for C-14 dating of the older
flows was unlikely, a maj or part of the study was concerned with search
ing for a method of aging late prehistoric flows.
The vegetation of nine aa and two pahoehoe flows was examined and
samples obtained of unweathered and weathered rocks. Of the llEthods
investigated, compositional changes between unweathered and weathered
rocks showed most promise as age indices; in particular, pH change,
sodium lOSS, calcium loss, titanium gain, and a 110-350°C. weight loss
measuring adsorbed and hydrated water. These measurements from 5 dated
aa flows were used as dependent variables in a regr-ession analysis.
Included as independent variables were age, climate, effective plants
(biotic factor), rock composition, rock texture and porosity. Two of
the regression equations obtained were solved inversely to give an
estimation of age with confidence limits of -: 87 and ~ 108 years.
These equations, when used to age two prehistoric aa flows, gave ages
that agreed within 25 years (c. 360 years B.P.). The two equations

vi
used different compositional parameters, viz. pH, sodium and calcium
loss in one case, and the 110-350°C. weight loss in the other. Thus,
although no other dates are available for comparison with these ages,
the agreement in the results indicates that these methods are worthy of
further study.
Four trends in plant succession, all beginning on bare aa lava,
were recognized from the observations of vegetation in this high
rainfall region. A coastal succession appears to culminate in
Pandanus forest. At altitudes below 1000 feet, successional trends
are towards Metrosideros or Metrosideros!Diospyros forests. The latter
trend appears to be associated with areas where rainfall is less than
100 inches and where there is a tendency towards summer-dry periods.
At higher altitudes (3000 to 4000 feet), a relatively stable stage
commonly reached is that of Metrosideros!Cibotium forest.
Concerning rates of plant succession, it was concluded that in
the humid region with annual temperature of about 70°F., forest ( > 80f0
cover of trees) can develop on aa flows within 200 years of flow forma
tion. At higher altitudes (3000 - 4000 feet with annual temperatures
of c. 60°F.), forest is developed within 300 years. These rates are
slower than those reported elsewhere in the tropics but may be typical
of succession rates on aa lava that has little ash.
Considering rates of rock weathering, the following mean rates of
change over the 400 year period studied were found: pH changes of
0.76 - 1.50 pH units per century; sodium loss of < 0.1 - 0.3'/0 per
century; calcium loss of <:0.1 - 0.4% per century; relative titanium
gain of 0.05 - 0.18% per century; and gain in water of 0.6 - 0.% per
century. There was a clear indication that rates of weathering were
decreasing with time.

vii
In this high-rainfall region, the rate of succession was highest
at altitu.des below 1000 feet. However, the rate of weathering on
these flows was greater between 3000 and 4000 feet. It was concluded
that tempcra.ture, with its effects on plant growth, evaporation and
accumulation of organic matter, was the differentiating factor.

viii
TABLE OF CONTENTS
.......................................................ACKNOWLEDGEMENTS
ABSmACT
...............................................Page
iii
v
.................................................TABLE OF CONTENTS
LIST OF TABLES
.............................................. viii
xiv
· .· .
1
3
3
3
4
4
xvi
...............................................
......................................................... " .
...........................................
Thermoluminescence
Palaeomagnetism
Methods of Aging Lava-flow Ecosystems
Radioactive Isotope Methods
LIST OF FIGURES
INIRODUCTION
REVIEW OF LITERATURE
• ••••••••••••••••••••••••• II ••••••
Weathered Rock Parameters
· .
· . 5
5
5
6
7
8.......................
...........................
................................
Vegetation Parameters
Soil Parameters
Fission Track Method
Hydration Rind Method
Ecosystem Parameters
.....................................................
11
16
16
17
17
23
23
28
.......................................................
· .
· .
..................................................
· .
· .
Soils
Climate
Vegetation
Land Use
Topography
Geology
Trends and Rates of Ecosystem Development
DESCRIPTION OF STUDY AREA
ix
Weathered and Unweathered Samples from Aa Flows
Page
30
30
34
35
36
36
38
38
39
39
39
40
41
42
42
42
42
42
43
43
43
43
43
44
..............................................
..............................................
...............................
...............................
• •••••••••••••••••••••••••••••• 0
· .
· .
........................................................
............................................................
..........................................................
.......................................................
.......................................................................
...................................................................
.......................................
........................................................................
.......................................................................................................................................
......................................................................
............................................................................
.............................................
TABLES OF CONTENTS (Continued)
................................................
.....................................................................
Size of Rock Sample
Porosity of Rock Sample
Depth of Rock Sample
Cover
Tree Density and Mortality
Tree Volume Estimates
Floristic Composition
Metrosideros Juveniles
Strati fication
Selection of Lava Flows
Type of Sample Collected
Sample Variability
Plant Cover
Sampling of Flows
Sampling Area
Sampling Sites
Vegetation Analyses
Profile Diagrams
Vegetation Strata
-, Soil Profiles
SAMPLING
Weathered and Unweathered Samples from Pahoehoe Flows
ANALYTICAL METHODS

x
TABLE OF CONTENTS (Continued)Page
45
45
46
46
47
47
48
48
48
49
49
49
50
51
51
51
52
52
52
52
53
53
56
56
56
................
................
..................
..........................
............................
.............................
.., ~ .
...............................
................................
................................
.................................
.................................
....................................
....................................
......................................
......................................
...................................................................................
............................................
Crushing and Grinding
Extraction
Weight -loss Measurements
Rehydration Measurements
Variation, Losses and Gains
Titanium
Strontium
Accuracy and Precision
Silicon and Aluminum
Calcium and Magnesium
Sodium and Potassium
Iron
pH and Cation Exchange Capacity Measurements
:PH Measurements
Preparation of Rock Samples for Analysis
Removal of Organic Matter
Hydration-rind Examination
Oxidation Measurements
Density, Porosity and Texture Measurements
Cation Exchange Measurements (C.E.C.)
Hydration Measurements
Mineralogical Measurements
Elemental Analyses
Manganese and Nickel
Treatment of Results

xi
TABLE OF CONTENTS (Continued)
Regression Analyses 56
RESULTS AND DISCUSSION
Vegetation Changes
...................................................................................
57
57
Succession ............................................ 57
......................................
..............................
...................
Rockland - Metrosideros Treeland - PandanusForest
Rockland - Dicranopteris Fernland Metrosideros Forest
Rockland _ Dicranopteris Fernland Metrosideros!Cibotium Forest
Rockland - Metrosideros Forest - Metrosideros!Diospyros Forest .
57
68
68
Trends in Numbers of Species and Stratification
Age Para.m.eters . . . . . . . . . . . . . . . . . . . . . . . . . . . . . . . . . . . . . . . . 89
Growth Rings . . . . . . . . . . . . . . . . . . . . . . . . . . . . . . . . . . . . . . . . . . 90
Soil Horizon Development ................................... 90
prl Change s • • • • • • • • • • • • • • • • • • • • • • • • • • • • • • • • • • • • • • • • • • • • • • • • • 93
Rock pH • • • • • • • • • • • • • • • • • • • • • • • • • • • • • • • • • • • • • • • • • • • • • • • 93
Litter pH ............................................. 95
Hydration Changes
Weight -loss Measurements
Rehydration Measurements
..............................96
96
Felspars and Pyroxenes
..........................................Hydration-rinds
Oxidation Changes
Mineralogical Changes
.......................................
......................................................................
99
99
100
100
Oxide Minerals ........................................ 109

TABIE OF CONTENTS (Continued)
xii
Silicon and Aluminum
Elemental Changes ..........................................................................
111
111
Calcium and Sodium ................................... 113
Potassium and Magnesium .............................. 113
................... " .Iron
Titanium
Strontium
.........................................................................................
117
117
117
Manganese and Nickel 117
Vegetation Effects ........................................ 119
..............................................on Pahoehoe andWeathering and Vegetation Development
Aa Flows
Surface Glassy Crusts of Pahoehoe ....................119
119
Weathering on Pahoehoe and Aa Flows 121
Variables for Regression
AGE DETERMINATIONS ...............................................................................
123
123
Weathered Rock Parameters
Soil and Vegetation Parameters .......................123
124
Climatic Factors ..................................... 124
Selection of Regression Equations
.............................................................................................
Parent Material Factors
Age
Topography
Effective Plant Factor
..............................
........................................................
125
125
125
125
127
Regression Equations used for Aging
Results of Age Determinations ...............................................
133
133

xiii
TABLE OF CONTENTS (Continued)
Age Extrapolations ................................... 136
Sources of Error in Applying the Regression Equations. 136
Successional Trends on Pahoehoe Flows
Factors Affecting Trends and Rates of Weathering
Factors Affecting Trends and Rates of Succession
..................................... 138
138
138
139
140
141
142
142
145
.....
.....................................
••••••••••••••••• II ••••
........................
...............................Successional Trends on Aa Flows
Weatheri..fJ.g Trends on Aa Flows
Weathering Trends on Pahoehoe Flows
Trends Within the Ecosystem
Rates of Change in Lava-flow Ecosystems
DISCUSSION AND CONCLUSIONS
Rates of Succession .................................. 152
Rates of Weathering .................................. 155
Relationship Between Succession and Weathering onHawaiian Lava Flows ............•.••••••••...•.•..•.•• 158
Importance of the Stainback Flows as a Study Area •••••••••• 159
Aging a Lava-flow Ecosystem ............................... 162
SUMMARY OF CONCLUSIONS
LITERATURE CITED
........................................................................................
166
169
APPENDIX IPUBLISHED ANALYSES OF LAVA FLOWS SAMPLED IN STUDY 181
APPENDIX IIDATA FOR SITE FACTORS AND TIME USED IN 'lTflE REGRESSION EQUATIONS. 182
APPENDIX IIILIST OF PLANTS FOUND ON SAMPLING SITES ••••••••••••••••••••••••• 183
APPENDIX IVCORRELATION MATRIX FOR VARIABLES FROM HISTORIC FLOWS •••••••••••• 189

xiv
LIST OF TABLES
TABLE I. AVERAGE COMPOSITIONS OF THOLEIITIC BASALTSFROM MAUNA LOA AND KILAUEA ••••••••••••••••••••• 27
TABLE II. DETAILS OF LAVA FLOWS SAMPLED •••••••••••••••••• 31
TABLE III.
TABLE IV.
TABLE V.
ROCK SIZE AND pH •••••••••••••••••••••••••••••••
EFFECT OF ROCK POROSITY ON pH ••••••••••••••••••
COMPOSITION AND TYPE OF ECOSYSTEM SAMPLED
37
37
58
TABLE VI. HEIGHT -eJ..ASS DISTRIBUTION OF METROSIDEROSPOLYMORPH.A. • • • • • • • • • • • • • • • • • • • • • • • • • • • • • • • • • • • • • 59
HY'PERS'IIflENE RATIOS .
VEGETATION STRATIFICATION ••••••••••••••••••••••
pH MEASlJREl.m'NrS • • • • • • • • • • • • • • • • • • • • • • • • • • • • • • • •
110 - 350°C. WEIGHT-I.oSS MEASUREMENrS ••••••••••
DIFFRACTION PEAKS FOR STANDARD MINERALS ANDMINERALS FOUND IN HAWAIIAN ROCKS •••••••••••••••
PLAGIOCLASE/PIGEONITE AND PIGEONITE/
69
71
91
94
97
107
108
...........
TREE VOLUME, TREE DENSITY AND CANOPY COVER
DEPTH OF ORGANIC HORIZON AND SITE FACTORS
TABLE XIII.
TABLE IX.
TABLE VII.
TABLE X.
TABLE XI.
TABLE XII.
TABLE VIII.
. .TABLE XIV.
TABLE XY.
TABLE XVI.
TABLE XVII.
TABLE XYIII.
TABLE XIX.
TABLE XX.
CHANGES IN TOTAL SILICON AND ALUMINUM ••••••••••
CHANGES IN TOTAL CALCIUM (CaO)
CHANGES IN TOTAL SODIUM (Na20) ••••••••••••••••••
CHANGES IN TOTAL POTASSIUM (K20) ANDMAGNESIUM (MgO) ••••••••••••••••••••••••••••••••
CHANGES IN TOTAL TITANIUM (Ti02) •••••••••••••••
CHANGES IN TOTAL STRONrIUM (Sr ppm) ••••••••••••
COMPARISON OF ROCKS WEATHERED UNDER AMETROSIDEROS CANOPY WITH THOSE FROM ADJACENrBARE LAVA (1750L SITE) •••••••••••••••••••••••••
112
114
115
116
118
118
120
TABLE XXI.
TABLE XXII.
TABLE XXIII.
xv
LIST OF TABLES (Continued)
COMPARISON OF ROCKS WEATHERED BENEAmMETROSIDEROS ROOTS WITH THOSE WEATHEREDAMONG ROOTS: UPPER STAINBACK FLOW • • • • • • • • • • • • • • 120
COMPARISON OF GLASSY CRUSTS OF PAHOEHOEWITH WEATHERED AA ROCKS •••••••••••••••••••••••• 121
WEATEERING AND VEGETATION DEVELOPMENT ONTHREE PAIRS OF PAHOEHOE AND AA FLOWS • • • • • • • • • • • 122
TABLE XXIV· EFFECTIVE PLANT FACTORS FOR SITES SAMPLED ...... 128
TABLE XXV.
TABLE XXVI.
TABLE XXVII.
TABLE XXVIII.
TABLE XXIX.
TABLE XXX.
TABLE XXXI.
SUMMARY OF RmRESSIONS OF WEATHERED ROCKPARAMETERS ON INDEPENDENT VARIABLES: DATEDFLOWS, FIVE SITES • • • • • • • • • • • • • • • • • • • • • • • • • • • • • • 132
AGE DETERMINATIONS FROM mUATION 1:pRe REGRESSION • • • . • • • • • . • • • • • • • • • . • • • • • • • • • • • • . 134
AGE DETERMINATIONS FROM EQUATION 2:WEIGHT-LOSS REGRESSION ••••••••••••••••••••••••• 135
RANGE OF VALUES FOR INDEPENDENT VARIABLESUSED IN REGRESSION EQUATIONS ••••••••••••••••••• 137
SUMMARY OF FACTORS HAVING SIGNIFICANT REGRESSIONCOEFFICIENTS IN REGRESSIONS OF WEATHERED ROCKPARAMETERS ON SITE FACTORS AND TIME •• • • • •••• • • • 146
QUANTITATIVE EFFECTS OF INDEPENDENT VARIABLESON WEA~ING ••• • • • • • • • • • • • • • • • • • • • • • • • • • • • • • • • 151
RATES OF CHANGE OF WEATEERED ROCK ANDVEGETATION PARAMETERS ON SELECTED LAVA FLOWS ••• 153
xvi
LIST OF FIGURES
Vegetation profile drawn parallel to StainbackHig1:lway, Mauna Loa • . • . • • • • • • • • . • • • • . • • • • • . • • • • • • • 26
Location of study area and position ofsa.Dlpling 81te s . . . . . . . . . . . . . . . . . . . . . . . . . . . . . . . . . . . 19
Metrosideros treeland with juvenile Pandanuson aa flow: Kapoho district: 50 ft. elevation 63
Profile diagram of Metrosideros rockland on thel840L (aa) sampling site, Kilauea: 40 ft. elevation 61
21
55......................Standard curve for titanium
Rainfall in the study area
Profile diagram of Pandanus forest on theprehistoric Kapoho (aa) sampling site, Kilauea:90 ft. elevation . . . . . . . . . . . . . . . . . . . . . . . . . . . . . . . . . 65
Figure 1.
Figure 2.
Figure 3.
Figure 4.
Figure 5.
Figure 6.
Figure 7.
Figure 8. Pandanus tectorius forest, prehistoric Kapoho(aa) sampling site, Kilauea: 90 ft. elevation 67
Figure 9. Metrosideros forest near the Lower Stainback(aa) sampling site, Mauna Loa: 300 ft. elevation 73
Figure 10.
76
Figure 11.
........................................ 78
Figure 12. Profile diagram of Dicranopteris fernland on the1852 (aa) sampling site, Mauna Loa: 3660 ft.elevation . 80
Figure 13. Dicranopteris fernland on the 1852 (aa) samplingsite, Mauna Loa: 3660 ft. elevation •••••••••••••• 82
Figure 14. Profile diagram of Metrosideros Cibotium foreston the Upper Stainback aa sampling site, MaunaLoa: 3780 ft. elevation •••••••••••••••••••••••••• 84
Figure 15. Stereocaulon lichen field on the 1955 (aa) samplingsite, Kilauea: 930 ft. elevation ••••••••••••••••• 86

Figure 16.
Figure 17.
Figure 18.
Figure 19.
xvii
LIST OF FIGURES (Continued)
Profile diagram of Metrosideros fore st on the1750H (aa) sampling site, Kilauea: 990 ft.elevation 88
X-ray powder patterns of 1942 and 1852 aa samples 102
X-ray powder patterns of 1881 and 1855 pahoehoesaJIlples • • • • • • • • • • • • • • • • • • • • • • • • • • • • • • • • • • • • • • • • • • • 104
X-ray powder patterns of Upper Stainback aas8JIlple s . • . . . . . . . . . . . • . . . . . . . . . . . . • . . . . . . . . . . . . . . . . 106

INlRODUCTION
The slopes of Mauna Loa and Kilauea on the Island of Hawaii
provide an array of lava flows of differing age in a variety of
climates. Perhaps there is as fine an opportunity here as anywhere
in the tropics to study trends and rates of change within lava-flow
ecosystems. Although some information is available on the earliest
stages of succession, especially in areas of lower rainfall, there
is little recorded about the wetter regions with rainfall exceeding
100 inches. This is particularly the case when rates of change in soil
and vegetation properties are considered. Thus the first objective of
this study was to determine the trends of development occurring in this
region of higher rainfall and see if any generalizations concerning
rates of change were possible. Attention was focussed on two ecosystem
processes; weathering and plant succession.
Measurements of rates of change are not possible without sampling
sites of known age. The oldest dated lava flow on Hawaii was erupted
from Kilauea about 1750 A.D. This date gives a time span from the
present of little more than 200 years, a very short period in the devel
opment of a lava-flow ecosystem. No carbon-dates are available for older
flows and it is not easy to find suitable material for C-14 dating.
For this reason it became important to find some way of extending the
200 year time span, at least by a few hundred years. Without an adequate
time-scale it is difficult to follow trends or to measure rates of change.
Thus the major part of this study is concerned with exploring methods of
aging lava-flow ecosystems using measurements of the vegetation or
weathering rock.

2
A second objective of the study was to determine the relative
importance of factors that influence a lava-flow ecosystem during the
early stages of its development, particularly climate, physical and
chemical composition of the parent material, biota and the age of the
system. The general importance of these factors in influencing soil
and vegetation development is well established, but what are their
relative effects during early stages of weathering and succession? In
the final part of this study, it was found possible to combine data
from the historic flows with that from two prehistoric flows and reach
preliminary conclusions concerning this question.

REVIEW OF LITERATURE
Methods of Aging Lava-Flow Ecosystems
In geologically young lava flows the age of the rock and that of
the ecosystem developed from its surface are identical, except where
there has been major disturbance such as slips, fire, or more lava.
Methods of aging rocks that might be suitable for dating ecosystems are
included in this review.
Radioactive Isotope Methods
Many rocks have been aged using isotopic ratios such as the decay
pairs of potassium-argon, rubidium-strontium, thorium-lead and uranium
lead. The time-scale for these methods spans millions of years and
concentrations of these isotopes are usually too low for dating rocks in
the range 0 - 10,000 years B.P. The ionium method can be applied to the
time span from the present to about 300,000 years B.P. but it requires
a chronologically undisturbed sediment column (Volchok and Kulp 1957),
and is therefore unsuitable for solid rock.
At present the isotopic method with the greatest potential is still
the carbon-14 technique which can be used to cover the range 200 to
60,000 years B.P. Its disadvantage in this case is the difficulty of
finding carbonaceous material in or beneath the lava flow under investi
gation. There are numerous prehistoric flmvs in the study area but only
two 0-14 dates are available, one of <400 years for charcoal from a
flow in the Puna di strict and the other of approximately 2000 years based
on two charcoal samples collected in cinders at Waiakea (Macdonald and
Eaton 1964).

4
The carbon-14 method has been used also to determine minimum ages
for the humic B horizons of podzols (Perrin et al 1964) and to age humus
fractions of chernozem soils (Campbell et al 1967). In the present
study, a C-14 age for any humus fraction would only be an average age and
would not measure the absolute age of the ecosystem.
Thermoluminescence
Babels (1963) developed a technique of aging basalt lava flows using
natural alpha activity and thermoluminescence induced by X-rays. He
obtained good agreement with field evidence on northern Arizona basaltic
lavas in the time range of 900 to 35,000 years B.P. Babels concluded
that the method was applicable to volcanic fields in which a large number
of lava samples could be collected from flows of different age but
similar composition. Although thermoluminescence techniques have been
applied to the aging of limestones and ancient pottery, apparently no
further work has been published on the aging of lava flows.
Palaeomagnetism
R. L. Dubois has developed a method of archeomagnetic dating basedo
on the fact that magnetic iron oxides in clays, when heated to 1,100 F,
orientate with the earth I s magnetic field (Weaver 1967). By measuring
this orientation and relating it to a map of polar wanderings, an age can
be given for the time when the clay was heated.
It may be possible to apply this principle to soils that have been
covered and baked by young lavas, or alternatively measure the orientation
of the magnetic minerals in the lava itself. Doell and Cox (1961)
studied palaeomagnetism in Hawaiian lava flows and found that directions
of magnetization were varying more slowly in Hawaii than other parts of

5
the world. No attempt was made to develop this approach in the present
study since the time span required is large and more palaeomagnetic
information is needed.
Fission Track Method
Several methods of dating using radiation damage have been investi
gated and of these the fission track method of Price and Walker (1963)
covers the longest time-span. The method requires uranium contents in
excess of 1 ppm so that some way of concentrating the uranium-containing
zircons (which are usually rare in basalt) would be needed before this
technique could be applied to a basalt flow.
Hydration Rind Method
Friedman (1968) aged rhyolite flows by measuring the thickness of
the hydration rind developed at an exposed glass surface. Since volcanic
glass sometimes occurs in basaltic rock, a search for such hydration
rinds was made (p. 99).
Ecosystem Parameters
The soil, plants and animals of any particular part of the landscape
are continuously interacting through processes of accumulation, transfer
and loss of matter and energy. This interlocking but open system of
living and non-living components showing some degree of stability is
conveniently termed an ecosystem and may be of any size de~nding on what
is most useful to the aims of the particular study.
From the point of view of age determination, we may divide a lava
flow ecosystem into five components: atmosphere, animals, plants (vege
tation), soil, and weathering parent material. Of these, vegetation,
soil and parent material change most slowly and some of their properties
may be suitable as indices of age.

6
Vegetation Parameters: The most frequently used aging method in eco
system studies is that of dating a surface from ring counts of the
trees growing on it, e.g. Lawrence (1950), Dickson and Crocker (1953),
Olson (1958). Sometimes new volcanic surfaces have been aged by taking
sections from nearby trees and observing the point in the ring sequence
where ashfall has caused a narrow growth ring (Lawrence 1954, Druce
1966, Eggler 1967).
Growth rings are unreliable in most tropical trees and even when
clearly defined they may not be formed until after the tree has reached
a certain age (Richards 1952).
Density, cover and basal area all change with time although they
have not been used as age parameters in pUblished studies. Dickson and
Crocker (1953) working on Mt. Shasta, California, found a curvilinear
increase in shrub cover of land-slides between 60 and 566 years old.
In Alaska, Viereck (1966) found a steadily increasing cover of mosses in
a sequence of glacial outwash surfaces up to 300 years old. Many
vegetation variables increase or decrease with time but at varying rates,
thus preventing their use as age indices.
A lichenometric dating method has been developed by Beschel (1961)
in which diameter growth of the largest lichens is related to time. For
example, Stork's (1963) data from Northern Sweden shows an almost linear
relationship between lichen growth and time for the 200 year period
studied. Although this method is not suitable for forested lava flows,
it may have application to the sparsely vegetated flows of the drier
parts of Mauna Loa.
7
The disadvantage of relying on a vegetation parameter to age lava
flow ecosystems is that disturbance or destruction of the vegetation
often removes or complicates the evidence of age.
Soil Parameters: The upper soil horizon on the older forested flows of
Mauna Loa and Kilauea consists almost entirely of organic matter with
the rocky horizon beneath. Possibly some property of this organic
horizon could be used as an age index. Kosaka (1963) recognized stages
of humification in which there are decreasing amounts of methoxy1-carbon
with increasing humification. If methoxyl-carbon was used as an age
index, corrections would be needed for recent additions of methoxyl-C
from the vegetatj.on • The average age measured would then approach the
age of the oldest methoxy1 carbon more closely.
Many soil parameters change with time but often they are not single
valued functions of time. Thus the studies of Crocker and Major (1955)
and Crocker and Dickson (1957) show that total organic carbon and total
nitrogen, first increase with time and then decrease. Other parameters
show uniform trends at least for a portion of the time -scale studied,
e.g. decrease of carbonates in sand-dune ecosystems (Salisbury 1925,
Olson 1958) and decrease in PH accomPanying podzol development (Chandler
1942). Burges and Drover (1953), studying podzol development on sand,
found an increase in the depth and thickness of the B horizon with
increasing age.
Van Wambeke (1962) discusses criteria for classifying tropical
soils by relative age and lists soil structure, silt-elay ratios and
percentage of weatherable minerals as important. These parameters may
have application to fully developed soils but would not be useful in the

8
young soils of the present study where the amount of clay is very small
and the amount of weatherable material very large.
There are two main disadvantages of using a soil parameter to age
a lava-flow ecosystem. Many soil properties are resultants of both
losses and gains to the system so that total losses or gains cannot be
measured. This is particularly important where addition of volcanic
ash is a possibility. Although no evidence of ash was found in profiles
examined on the lavamflows studied, ash additions cannot be ruled out.
Wentworth (1938) records that dt~ing the 1852 eruption on the eastern
slope of Mauna Loa, ash fell thickly on the roofs of houses in Hilo,
25 miles away. In the 1868 eruption of Mauna Loa, showers of ash and
pumice were ejected distances of 10 to 15 miles in all directions.
The second disadvantage of soil parameters is that often they re
flect equilibrium conditions dependent on the local soil environment
rather than time. An example of this is the dependence of gibbsite
formation on pH and silicate ion concentration (Swindale and Uehara
1966). With no change in the soil environment, the amount of gibbsite
formed is time-dependent. However, with a change in pH, such as might
occur with establishment of a new plant in the succession, a new
equilibrium would develop in which the amount of gibbsite present
might, temporarily at least, be less than the amount present at an
earlier stage of development.
Weathered Rock Parameters: If changes in a particular parameter of the
weathering rock can be related to time using lava flows of known age,
it may be possible to use this relationship to estimate the ages of
prehistoric flows. Ideally a linear or at least a mathematically pre
dictable change of the parameter with time i13 required.

9
Chemical processes of weathering are dominant in the tropical
climate of Hawaii, but both physical and chemical changes are closely
associated as weathering proceeds. The principal chemical processes
are hydration and hydrolysis, oxidation and solution. Each of these
processes affects many rock properties, same of which may be useful age
parameters.
Hydration, or adsorption of water molecules, followed by hydrolysis
in which H ions replace metallic cations in primary minerals, are the
first steps in weathering. In their study of diorite weathering in
Antartica, Kelly and Zumberge (1961) measured a 1.23% increase in
uncombined water between fresh and 'VTeathered rock. Thus a direct measure
of change in the state of hydration may be suitable as an age parameter.
Volume increase and associated decrease in particle density resulting
from hydration changes can be expected to change many physical properties
which may provide fUrther possibilities for age indices.
The main oxidation change is that of ferrous ion changing to the
ferric state, although manganous ion (Mn2+) to manganic (Mn4+) and
sulfide -sulfate oxidation can also be expected. Kelly and Zumberge (1961)
found that oxidation of ferrous ion in pyrrhotite and biotite to ferric
ion in limonite was the principal change taking place in the early stages
of weathering they studied. Redox measurements would reflect change in
the ferrous-ferric ion ratio and determination of the magnetite-maghemite
ratio would also indicate change in the oxidation state of iron. Like
hydration, oxidation is an early weathering change and therefore could be
a sensitive indicator of age for the time span under study.
Decomposition of silicate crystals by incongruent solution results

10
in many mineralogical and elemental changes. In her study of the
weathering of basic igneous rocks, Smith (1962) found the following
sequence of increasing mineral stability: olivine, labradorite, augite,
magnetite, ilmenite and hematite, although the latter is both a primary
mineral and a secondary weathering product. Bates (1960) places
olivine, felspars and monoclinic pyroxene of Hawaiian rocks in a similar
order of stability.
The differential loss of elements from weathering rock, when ex
pressed on a percentage basis, results in relative gains and losses.
An indication of the trends to be expected in basic rocks can be obtained
from the data of Harrison (1933) Polynov (1937), Goldich (1938), Tiller
(1958), Wells (1960), Swindale (1966). Thus, Si, Ca, Mg, Na, and K
are lost while Ti, A1 and Fe concentrate with time • Although present
in initially much smaller amounts, the elements Sr, Ba, and Zn are lost
while Ga, Mo, Cr, and V tend to concentrate. The pattern of change
for Mn, Ni, Co, .Cu and Zr is not clear. Walker (1964) has shown how
total P decreases with time accompanied by a narrowing of the inorganic
P: organic P ratio.
Several of these elements are clearly worth measuring as potential
age indices. Some will be present in amounts too small for changes to
be measured in the 500 year time span under study; in other cases the
rate of change maur be too slow.
Some elemental ratios may be more suitable as age indices than
changes in single elements. Ratios that have been used as weathering
indices are summarized by Jenny (1941). These include si1ica:a1umina,
base:alumina, alkali:alumina, calcium:magnesium and potassium:sodium
ratios.

(iii)
(iv)
11
In the present study it was decided to concentrate attention on
parameters of the vegetation and the weathered rock. The possibilities
for age indices were listed in order of likelihood. Among the weathered
rock parameters, attention was given initially to elemental changes,
particularly strontium and titanium, and to hydration changes. As the
search continued and more information became available, the order of
possibilities was continually altered, so that the age index which
seemed to have the greatest potential was kept as the focus of interest.
Trends and Rates of Ecosystem DevelOpment
A grouping of ecosystem processes is necessary before discussing
rate s of development. For the purpose of this study six main groups of
processes are distinguished:
(i) plant succession: compositional change in the vegetation
resulting from replacement of one species by another.
(ii) stratification or layering: structural change in the
vegetation resulting from plant growth.
weathering: compositional change in the parent material.
biocycling: plant and animal uptake of minerals released
by weathering and their return to the soil in com
bination with carbonaceous and nitrogenous material.
(v) translocation/horizonation processes: redistribution and
loss by leaching and eluviation of both weathering
products and organic material; processes that are
associated with the development of soil horizons.
(vi) erosion/deposition processes: affect both vegetation and
soil.

12
Although many studies of tropical vegetation and soils have been
published it is seldom that vegetation and soil studies are integrated.
A notable exception is the study of Morison et ale (1948) who, in their
analysis of tropical soil-vegetation catenas in Africa, stressed the
importance of topography in determining the type of soil-vegetation
system that developed. Studies of rates of change in tropical ecosystems
appear to be lacking.
The earliest studies of plant succession on lava flows in Hawaii
appear to be those of Forbes (1912) and MacCaughey (1917). Further
contributions have been made by Robyns and Lamb (1939), Skottsberg (1941),
Doty (1956, 1961), Doty and Mueller-Dombois (1966) and Smathers (1966).
The trends of succession in the early stages are reasonably well under
stood but no measurements of succession rates under differing climatic
conditions have been made.
Elsewhere in the tropics, the best documented case of forest
development on a recent volcanic surface is that of Krakatau Island
(Richards 1952). Here, in a rainfall of more than 100 inches, a large
part of the surface bared by the 1884 eruption was covered by closed
forest within 45 years. Though made in a warm temperate climate rather
than a tropical one, the study of the vegetation of Sakurajima, Japan
by Tagawa (1964) is notable for its attention to rates of development.
A scrub stage was reached within 100 years and forest within 150 years.
One of the earliest studies of weathering in Hawaii is that of
McGeorge (1917) who compared the composition of fresh basaltic boulders
with that of their weathered shells. These shells are considerably more
weathered than the weathered rocks analysed in this study but McGeorge IS

13
results indicate the trends to be expected: losses of silicon, ferrous
ion, calcium, sodium and manganese; relatbr.~ gains of aluminum, ferric
ion, titanium and an absolute gain of water.
Most studies dealing with soil changes in the tropics have paid
attention to elemental changes during weathering and clay formation.
An exception is that of Jenny, Gessel and Bingham (1949) who compare
decomposition rates of organic matter between tropical and temperate
soils. Barton (1916) studied the weathering of granite in two very dry
parts of Egypt, Aswan and Gizeh. He found an average rate of disintegra
tion and exfoliation of 0.1 to 0.5 cm in 1000 years. Polynov1s (1937)
study was a major contribution towards understanding the relative
mobilities of elements lost during weathering and he concluded that
even in a moist tropical climate the conversion of rock to clay would
require "a very considerable time, measurable only on the geological
scale".
Sherman and Ikawa (1968) discuss factors influencing the rate of
weathering and soil formation in the Hawaiian Islands. They distinguish
intensity factors of environment and time from capacity factors which
determine the resistance of a mineral to weathering. Environmental
intensity factors 1llclude temperature, rainfall, drainage and vegetation
while capacity factors include rock texture, stability of minerals to
decomposition and the nature of the mineral surface or coating.
The weathering of olivine basalt was examined by Sherman and
Uehara (1956) who concluded that the direction of weathering was very
dependent on the rate of removal of bases. Uehara, Ikawa and Sherman
(1966), studied the desilication of halloysite, concluding that the rate

14
of this weathering process is a function of the amount of water passing
through unit volume of the material. In general agreement with this is
the conclusion of Ruxton (1968) whose study of andesitic ash soils in
Papua suggests that the rate of weathering is limited by rainfall and is
not primarily determined by temperature.
Examples of ecosystem studies where soil and vegetation changes
are correlated appear to be restricted to temperate or cold environments.
In perhaps the earliest study of this type, Salisbury (1925) working
with a dune sequence measured a mean annual percentage loss of calcium
carbonate varying between 0.6 and 0.8% per year over a period of about
250 years. Olson (1958) also working with a dune sequence found that
the loss of free carbonate could be fitted to a negative exponential
function over a period of 600 years. Dickson and Crocker (1953) in
their pioneering study of ecosystem development on a series of land
slides in California, measured changes in tree density, basal area,
shrub cover, ground cover, and correlated these with changes in pH,
organic carbon, total nitrogen, and grain numbers of plagioclases and
volcanic glasses. Crocker and Major (1955), in a similar type of study
on glacial outwash surfaces in Alaska, point out how the rate of change
in soil properties is very dependent on the micro-pattern of plant
colonization, this itself being influenced by chance factors of dispersal.
Te zuka , s (1961) study of ecosystem development in Japan is one of the
few such studies made in a volcanic environment. He used changes in
humus content (ignition loss) as his measure of time.
In the present study, attention was directed firstly towards
elucidating trends of succession and weathering in the earliest stages

15
of ecosystem devel0:PJI1ent on lava-flows. Secondly, it was aimed to
measure the rates of these processes and as far as possible to establish
the relative importance of each of the factors affecting these rates of
change.

DESCRIPTION OF STUDY AREA
The lava flows studied are on the volcanoes of Mauna Loa (13,018')
and Kilauea (4,090') on the Island of Hawaii lying between latitude
19° 20' - 19° 45' and longitude 154° 50' - 155° 20'. The study area
(Fig. 1) includes:
(i) the eastern slopes of Mauna Loa that lie west and south of
Hilo and extend from sea-level to 4,000 feet.
(ii) the northern and south-eastern slopes of the Puna rift zone
of Kilauea within 9 miles of Pahoa and extending from sea
level to 1,000 feet.
Climate
Mean annual temperatures vary from 73.1° near sea-level (Hilo
Airport) to about 59° F. at 4,000 feet (based on a temperature lapse
rate of 3.5° F. per thousand feet recommended by Mr. Saul Price, U.S.
Weather Bureau, pers. connn.) Mean summer and mean winter temperatures
are 74.8 and 71.4° F. near sea-level and approximately 61.5 and 59.5° F.
at 4,000 feet. The mean variation between warmest (August) and coldest
(February) months is between 5 and 6° F. and probably never exceeds
9° F. (Blumenstock and Price 1967). The area is frost-free.
Mean annual rainfall varies from about 80 inches in the coastal
Puna district to over 200 inches at 2,000 feet on Mauna Loa. Above this
elevation rainfall decreases to around 125 inches at 4,000 feet (Fig.
2a). Below 1,000 feet, rainfall is rather unevenly distributed with
the wettest month (December or March), often receiving more than twice

17
the rainfall of the driest month, June (Fig. 2b). At higher altitudes,
and particularly above 2000 feet, monthly rainfall distribution is
fairly uniform. Annual rainfall throughout the area is highly variable.
In areas where monthly averages are all above 10 inches, there may be
occasional months with only 1 or 2 inches of rain (Blumenstock and
Price, loco cit.). Rainfall intensities in excess of 9 inches in 24
hours occur once every two or three years at most localities including
those of high average rainfall.
The eastern slopes of Mauna Loa are exposed to the north-easterly
trade winds which blow for more than 7C!fo of the time, particularly from
May to September. Orographic cloud is frequent, particularly over the
Mauna Loa slopes above 1000 feet (Mordy 1957) and at most places the
average relative humidity is between 70 and 8C!fo (Blumenstock and Price,
loco cit.). Both widespread storms and intense local storms are in
frequent.
Topography
Because of their youth, lava flows of the area are undissected.
These lavas are highly permeable and without permanent streams. Surface
water is restricted to small unfissured areas on some pahoehoe flows.
Overall slopes are long and gentle averaging about 3 - 4° on Mauna Loa
and 1 - 4° in the Puna rift region. Locally, the land surface is
generally undulating except where broken by the more craggy surface of
recent aa flows.
Geology
The surface lava flows of the study area are either late Pleisto
cene or Recent in age. Those of Mauna Loa belong to the Kau volcanic

18
Figure 1. Location of study area and position
of sampling sites.

Honolulu
1600
I-K_A+U_A_I__-+- ~.- f------· 155
0
W
OAHU
MOLOKAI I--;----+----+--- ~--4",-_MAU 1---·-
ISTATE OF HAWAII i
--I~;:;~ ...~:~~~-----l200N
-40'
N
t
O_c=_c=:-.-=~======::iIO MILES
F------...L..10.,--~/--~---L:.:...---...~___;_-----------20'

20
Figure 2. Rainfall in the study area.

HAWAII
N
to 5 10 15 20
STATUTE MILES
2a. MEAN ANNUAL PRECIPITATION (in.), After Blumenstock and Price, 1967.
.....I--- l-
I-- .....-- ..... I-- I---
~
.- I-- I-
- I-
- I-
- I-
INCHES18------------------16
14
12
10
8
6
4
2
oJFMAMJJASOND
2b. MONTHLY RAINFALL AT PAHOA. After Blumenstock and Price, 1967.

22
series and those of Kilauea to the Puna series (Stearns and Macdonald
1946). Among the historic flows studied, the age of the 1750 (1)
Kilauea flow is not known for certain. The only reference is that of
Hitchcock (1911 p. 164) who gives the period 1730 to 1754 as the time
of an eruption at Kaimu. The 1750 date used for this study follows
that given on the geologic map of Hawaii (Stearns and Macdonald, loc.
cit.).
Both volcanic series include pahoehoe and aa flows. These are
generally 10 to 15 feet thick (Stearns 1966). Tubes and other cavities
originating from collapse after cooling are numerous in the pahoehoe
flows.
Numerous craters as well as cinder and spatter cones are aligned
along the Puna rift but these are largely absent from the sector of Mauna
Loa studied. Pumice deposits associated with cones and craters cover
only small areas (Stearns and Macdonald, loc. cit.). Wentworth (1938)
and Frazer (1960) record historic eruptions of Mauna Loa and Kilauea
that spread ash or dust over wide areas of Hawaii so that small amounts
of ash have certainly fallen on the later prehistoric and historic flows
studied. Field observation of the organic horizon overlying these flows
did not show any evidence of ash so that its contribution to the soils
here is likely to be small. The Pahala ash, widespread in the south
eastern half of the island, is thOUght to have originated largely from
phreatomagmatic explosions of Kilauea (Frazer 1960), and has been dated
from ch~rcoal as last glacial (Wisconsin) in age (Rubin and Berthold 1961).
The only way in which Pahala ash could contribute to soil formation on
young flows would be by· redistribution by wind. This would require a
drier climate than that of the study area.

23
All the lavas sampled belong to the tholeiitic suite as defined by
Macdonald and Katsura (1962). These include olivine basalts (>5% modal
olivine), basalts «5% modal olivine) and oceanites (picrite basalts
with very abundant phenocrysts of olivine and less than 3afo felspar)
(Macdonald and Katsura 1964). Macdonald (1949a) describes the olivine
basalts and basalts as usually porphyritic in texture with a ground
mass of 25 - 5afo plagioclase (labradorite dominant), 25 - 5afo monoclinic
pyroxene, 1 - 15% olivine and 7 - 15% magnetite and ilmenite. Apatite
is recognisable in a few specimens and some contain glass. The pheno
crysts are largely olivine (up to 8nnn long), plagioclase and augite
(both up to lOmm long). Average chemical analyses of rocks from
Kilauea and Mauna Loa are given in Table 1.
Soils
Cline (1955) mapped the soils of the later prehistoric and historic
flows as lithosols while those on Pahala ash and older flows were
mapped as hydrol humic latosols or humic latosols. The lithosols
occupy by far the larger area and, apart from small surface accumulations
of organic matter, they show little profile development.
In terms of the U.S. Comprehensive Classification the soils of the
later prehistoric and historic flows are classified as entisols and
lithic folists in the order of histosols (see Soil Survey Staff, 1968).
Vegetation
Forest dominated by Metrosideros (Metrosideros polymorpha) covers
the greater part of the study area even though much of this has been re
placed by settlements. This forest is classified by Krajina (1963) as
mesophytic marine tropical and subtropical forest (zone D-Ol). A

24
generaJ. description is given by Fosberg (196l). Figure 3 shows a
simplified vegetation profile, typical of the northern and wettest part
of the area. This diagram, based on surviving stands of vegetation, is
an interpretation of the forest pattern as it was before disturbance by
man and introduced animals. Pandanus (Pandanus tectorius) forest
dominates the coastaJ. fringe but this changes quickly to a mixed Pandanus
Metrosideros forest which extends up to half a mile inland. This in
turn gives way to Metrosideros forest which, though varying in height
and understorey composition according to age, shows a generaJ. increase
in species with increase in altitude. This trend reaches a maximum
between 1500 and 2500 feet, the zone of highest rainfall~ where scattered
groups of the palm Pritchardia bacheriana occur in the Metrosideros
canopy. In the understorey there are many small trees including
Psychotria spp., Cheirodendron trigynum, Ilex anomala, Gouldia terminaJ.is,
and the tree-ferns Cibotium splendens and C. glaucum. At higher altitudes
tree -ferns become increasingly important and between 3000 and 4000 feet
theycompose the lower layer of a tWO-layered canopy in which Metrosideros
is emergent.
On very recent flows the whitish-colored lichen Stereocaulon vulcani
is often abundant and the only frequent tree seedling is Metrosideros.
Introduced species are unconnnon.
On pahoehoe flows the Metrosideros trees are usuaJ.ly smaller and
more widely spaced. Between them and sometimes growing over them are
dense thickets of gleichenia fern (Dicranopteris linearis).
Land-clearing, fires and introduced animals, particularly pigs and
cattle, have modified or destroyed the originaJ. vegetation in many places
allowing severaJ. introduced plants to become widespread. The most

Figure 3. Vegetation profile dra'WD. ParaJ.lel to Stainback Highway,
Mauna Loa.
I\)VI

APPROXIMATE MEAN ANNUAL TEMPERATURE (OF)
62.7
66.7
69.7
73.2
59.2, I I , I
4000 3000 2000 1000 0
ELEVATION (ft.)
APPROXIMATE MEAN ANNUAL RAINFALL (in.)200
140
220
175140
130I I , I I 1
4000 3000 2000
ELEVATION (ft)
1000 500 o
VEGETATION PROFILEMetrosideros/Cibotium forest Metrollderos forest with Metrosideros forest Metrosideros-r-"" !ritchardia r-'" ~andanus forestI r--- \! ~I ~ I I I
ELEVAT~:;J ~ I I I(ft.) I I I
4000 ~ ~_? 'Cf ~ I""l. I I I: Metrosideros/Dicranopteris I
on pahoehoe I3000~--------~IT~11\1dJ~.'Y.'t:'M" _ I ~ I
I I II I
20001- - - - - - - - - - - - - - - - - - -~liYlI'\.T ""«"1(\ 1\ I I
1000
0' ::..........1

TABLE 1. AvERAGE COMPOSITIONS OF THOLEIITICBASALTS FROM MAUNA IDA AND KILAUEA
. (From Macdonald and Katsura 1964)
Element as oxide Ma1llla Loa Kilauea27 analyses 51 analyses
S102 51.11 % 49.96 %
Al203 12.93 " 13.25 "
Fe203 2.63 " 1.88 "
FeO 8.80 " 9.75 "
CaO 10.03 " 10.60 "
MgO 8.79 " 8.39 "
Ti02 2.52 " 2.86 "
Na20 2.19 " 2.26 "
K20 0.38 " 0.54 "
P205 0.24 " 0.30 "
MIlO 0.14 " 0.16 "
27
28
abundant are guava (Psidium guajava), Pluchea odorata and Indian
Rhododendron (Melastoma malabathricum).
In the drier Puna rift area, there are remnants of Pandanus and
Pandanus -Metrosideros forests near the coast but along the shoreline
itself grow thickets of naupaka (Scaevola taccada) and hau (Hibiscus
tiliaceus). Modification of the forest is more obvious in this Pahoa
area. Coconut groves and plantings of ironwood (Casuarina equisetifolia)
and mango (Mangifera indica) are connnon. Also present are small groves
of kamani (Calophyllum inophyllum) and kukui (Aleurites moluccana). A
mixed secondary scrub of guava, Pipturus, Java plum (Eugenia cumini)
and Pluchea has taken over in some parts.
Pahoehoe flows are more widespread in the Puna district where glei
chenia fernJ.ands with spaced Metrosideros trees are connnon. Around
Pahoa large areas of this vegetation have been burnt; the regrowth is
dominated by grasses, particularly Andro;pogon virginicus.
Land Use
Many of the prehistoric and historic flows in the study area below
an elevation of 1000 feet are being cleared for house construction.
Sugar-eane plantations are restricted to the relatively small areas of
older soil but in the Puna district plantations of coconut, papaya,
banana and coffee are growing successfully on recent lava flows. With
addition of volcanic ash and fertilizers, a large macadamia nut farm
(Macadamia integrifolia) has been established on the young flows of Mauna
Loa north of Olaa.
At higher elevations adjacent to the Stainback Highway, the Metro
sideros forest is being replaced by various forestry plantings: Queens
land lmaple I (Flindersia brayleyana) and Australian red I cedar I (Toona

29
ciliata) are growing at altitudes up to 3000 feet. At higher altitudes
towards 4000 feet there is flooded gum (EucalYl?tus saligna), Australian
blackwood (Acacia melanoxylon) and tropical ash (Fraxinus uhdei). Never
theless, at these higher elevations there are still stands of Metrosideros
forest which appear to have been little disturbed.

SAMPLING
Selection of Lava Flows
The flows studied were chosen because of their known age or rela
tive youth, their position in a high-rainfall zone where weathering
rates would be relatively fast, and their lack of recent ash additions
(Fig. 1). Details of each flow sampled are given in Table II and
published chemical analyses for samples of some of these flows are listed
in Appendix 1.
Seven dated flows were sampled on Hawaii, one site per flow except
ing two flows which had two sites each. All samples were collected
between August 1967 and August 1968. During the first part of the study
a chronosequence consisting of the 1942, 1881, 1855, and 1852 flows of
MatUla Loa was sampled. It soon became clear that the pahoehoe flows of
1881 and 1855 could not be grouped with aa flows because of their slow
rates of change. The Kilauea flows of 1955, 1840, and 1750 were then
sampled in order to increase the number of aa flows and extend the time
span for measuring changes •
Four prehistoric flows were sampled on Hawaii: two flows on MatUla
Loa adjacent to the Stainback Highway, one on the western side of MatUla
Loa in the HonatUlau district (limited sampling only) and one on a flow
from the east rift of Kilauea in the Kapoho district.
In addition to the Hawaiian samples, some analyses were made of
lavas collected from Western Samoa by Mr. C.L. Schroth (Dept. of Agron
omy and Soil Science, University of Hawaii) during July 1968. One coll
ection was from the 1760 pahoehoe flow on Savaii and the other was from a
prehistoric pahoehoe flow on Upolu. The Upolu flow overlies a 5-foot

TABLE II. DETAII8 OF LAVA FLOWS SAMPLED
NBJDe of No. of Alt. Mean ann. Mean ann.Volcano Flow Samples (ft.) rainfall temp. Type of Ecosystem
(in.) (OF .)
Kilauea 1955 10 930 1.00* 69.9* Stereocaulon lichenfieldMauna Loa 1.942 10 3720 150 60.2 " "
" " 1881 4 3880 220 59.9 Dicranopteris femland
" " 1855 5 3660 250 60.4 Metrosideros/Dicranopteris treeland**
" " 1852 10 3660 210 60.4 Dicranopteris fernlandKi1.auea 1840H 1.0 650 1.30 70.9 Metrosideros/Dicranopteris treeland
" 1840L 10 40 115 73.1 Metrosideros rockland
" 1750H 10 990 110 69.7 Metrosideros forest
" 1750L 6 300 90 72.1 Metrosideros treelandMauna Loa Upper
Stainback 4 3780 140 60.0 Metrosideros/Cibotium forest
" " LowerStainback 5 300 140 72.1 Metrosideros forest
Kilauea Prehist.Kapoho 5 90 105 72.9 Pandanus forest
Mauna Loa Honaunau 3 3250 88 61.8 Metrosideros forestSavai1i,
1760Samoa 5 550 125-150 77.0 TreelandUpolu, Prehist.Samoa Upolu 5 200 150-175 78.0 Forest
*Climatic data f'ram Blumenstock and Price (1967) **See p. 57.
v.>I-'

TABLE II (Continued). DETAILS OF LAVA FLOWS SAMPLED
32
Name of Flow
1955
1881
1855
l840H
l840L
1750H
l750L
Upper Stainback
Rock Type and Position of Sampling Site
basaJ.t; Puna aa.Approx. 5 miles south of Pahoa and ~ mile west ofPahoa-Kalapana road.
basalt; Kau aa.Approx. 5 miles north-west of Stainback HighwayaJ.ong a forestry planting road and approx. 400yards west of planting road.
hypersthene-rich basaJ.t; Kau pahoehoe.Approx. 13 miles west of Hilo and 1.9 miles southeast of Hilo-Kamuela saddle road along a forestryplanting road.
olivine basalt; Kau pahoehoe.Approx. 12 miles west of Hilo and 50 yards southof Hilo -Kamuela saddle road.
oceanite; Kau aa.Approx. 13 miles west of Hilo and 2.6 miles southeast of Hilo-Kamuela saddle road along a forestryplanting road.
oceanite; Puna aa.1.8 miles east of Pahoa and 25 yards north ofPahoa-Kapoho road.
oceanite; Puna aa.Approx. 4.5 miles north-west of Kapoho and 25 yardssouth of road.
olivine basaJ.t; Puna aa.Approx. 6 miles south of Pahoa and 2.5 miles westof Pahoa-KaJ.apana road. (3.4 miles west of 1955flow).
olivine basaJ.t; Puna aa.Approx. 7.6 miles south of Pahoa and 0.5 milesnorth-west of Pahoa-Kalapana road.
olivine basaJ.t; Kau aa.100 yards north of Stainback Highway and 13 milesfrom volcano road.

33
TABLE II (Continued). DETAILS OF LAVA FLOWS SAMPLED
Name of Flow
Lower Stainback
Honaunau
PrehistoricKapoho
Savaii 1760Samoa
PrehistoricUpolu, Samoa
Rock Type and Position of Sampling Site
olivine basalt; Kau aa.100 yards north of Stainback Highway and 0.6 milesfrom volcano road.
olivine basalt; Kau aa.Between 4 and 5 miles west of Kealakekua in theHonaunau Forest reserve.
basalt; Puna aa.1.5 miles north of northern edge of Kapoho 1960flow.
alkalic olivine basalt; Aopo pahoehoe.Approx. 2 miles west of A'opo, Savai'i and 60 to100 yards above road.
alkalic olivine basalt; Puapua pahoehoe.Approx. 1 mile east of Sa'agafou, Upolu, and 60to 100 yards above the road.

raised beach which has been correlated tentatively by Kear and Wood
(1959) with a New Zealand raised beach having a radiocarbon age of
2,220 ~ 70 years (Fergusson and Rafter 1957, p. 38 ).
Type of Sample Collected
A section of rock from a flow more than 10 years old shows an
irregular 'weathered crust'. lJ.'his was most distinct in dense non-
porous rock. In early stages of this study, a diamond saw was used to
cut off the crust which became the weathered sample, while the central
portion of the rock provided the 'unweathered' sample. However, it was
difficult to remove the weathered crust without including variable
amounts of less weathered rock.
An attempt to remove these crusts in a reproducible manner was
made using ultrasonic vibration. A Bronwill Biosonick II high-intensity
probe was run at 75% full power (= 90 watts of acoustic energy at 15
kcps) for 5 minutes. With 10-60 gm rocks from prehistoric flows, up to
0.6% by weight could be removed. With less weathered samples the rock
removed was-usually less than 0.1%, an insufficient amount for analysis.
For this reason, it was considered that small rocks might be more
suitable for use as weathered samples. A group of small rocks «2.5 cm
diam.) from the surface of the 1750H flow were compared to the weathered
crusts removed from large boulders, 0.5 to 1 meter in diameter on the
same flow. pH measurements (see "Analytical Methods") were used as a
basis for comparison.
Sample s from No. of Mean pH andsite 1750H samples stand. deviation
Weathered crustsfrom boulders 6 7.82 t 0.10 }
Small surface rocks 10 7.28 t 0.23
Probability
11< 0.01

35
The lower pH vaJ.ues for small rocks suggested that these are
weathering more rapidly and were therefore likely to be more sensitive
indicators of smaJ.l changes on very recent flows. Thus, further
collection of weathered samples on aa flows was restricted to smaJ.l
rocks, 1.5 - 2.5 cm in diameter.
With pahoehoe flows, the early samples used for weathered materiaJ.
consisted of the glassy, often loose, surface crust usually less than
1 cm in thickness. However, further observation showed that this glassy
crust was not always present and that its weathering was not typicaJ. of
the upper part of a pahoehoe flow. Fe203 and X-ray diffraction
analyses showed this material to be much more weathered than weathered
rocks from aa flows thus making comparisons difficult. In subsequent
samplings, weathered rock was collected from the upper 3 cm after first
removing any glassy crusts.
Sample Variability
If sampling can be planned to reduce sample variation to a minimum,
there is a greater chance of measuring significant differences in
weathering rates between flows. Variation was tested for by caJ.culating
coefficients of variation for titanium and strontium analyses made on
a collection of 4 samples from each of 5 flows (not reported in detail).
Coefficients ranged from 0.4 to 8.610 with a mean of 4.610. Weight loss
measurements (see "Results") made on the same samples indicated that
higher coefficients could be expected.
Apart from intrinsic variation in chemicaJ. composition of the lava,
several factors influence the rate of weathering of a particular rock
and thus contribute to sample variability. These include properties of

36
the particular rock such as size and porosity, its depth, and its
position relative to plants. These factors are investigated below by
use of pH measurements. General development of the work showed that
pH measurements were quite a sensitive index of weathering and therefore
useful for this purpose (see "Analytical Methods": pH measurements).
Both lower P!In20 values and higher
increased degree of weathering.
LlpH (1)\:01 - PHn20) indicate an
Variable content of organic matter which may influence variability
is also discussed under "Analytical Methods".
Size of Rock Sample
With aa flows, the presence of crusts of more weathered rock would
lead one to expect that the proportion of weathered to unweathered rock
would change with size of rock, the larger rocks having a larger amount
of unweathered material. The pH of 10 rocks 1.3 to 3.8 .em diameter
and collected from the same site (1750H) was measured but the results
(Table III) showed no relation between size and pH. Thus in this range,
size is unlikely to be a factor affecting sample variation.
Porosity of Rock Sample
To ascertain whether there was any relation between porosity and
weathering, the pH of 6 unweathered rocks from the 1852 Mauna Loa flow
was measured (Table IV). Three rocks (1852U) of typical porosity for
the site were compared to three rocks having markedly greater porosities
(1852Pl-P3). Sample P3 was highly vesicular and the only member of the
series that appeared more weathered judged by P!1r20 measurements.
Excepting highly vesicular rocks, excluded during subsequent sampling,
porosity does not appear to be an important factor affecting sample
variation at a site. However, differences in porosity between lava

37
TABLE III. ROCK SIZE AND pH
SmaJ.l Rocks Collected from Surface of Site 1750H
Rock Weight (gm) Average Rock Diam. (em) pHH20
56.4 4.0 7.11
29.0 3.0 7.62
20.1 3.0 7.24
16.4 3.0 7.64
14.3 2.5 6.98
10.4 2.5 7.11
7.8 2.0 7.38
3·5 1.5 7.41
3.0 1.5 7.04
2.1 1.5 7.41
Mean: 7.28
TABLE IV. EFFECT OF ROCK POROSITY ON pH
Sample No. of Est. %Surface Es·l:;. Mean Rock P11I20 ~pH*Rocks Occ. by Pores Pore Diam. Density
1852U 3 25-50 <: 0.25mm 2.65g/cc 9.54 - 0.01
" P1 2 75-100 0.25 " 1.22 II 9.33 - 0.06
" P2 2 75-100 1.0 " 1.62 II 9.66 - 0.01
II P3 2 75-100 2.0 II 1.54 II 9.01 - 0.28
* pH = I>11<:C1 - ~20
38
flows were estimated for each set of samples (p. 47).
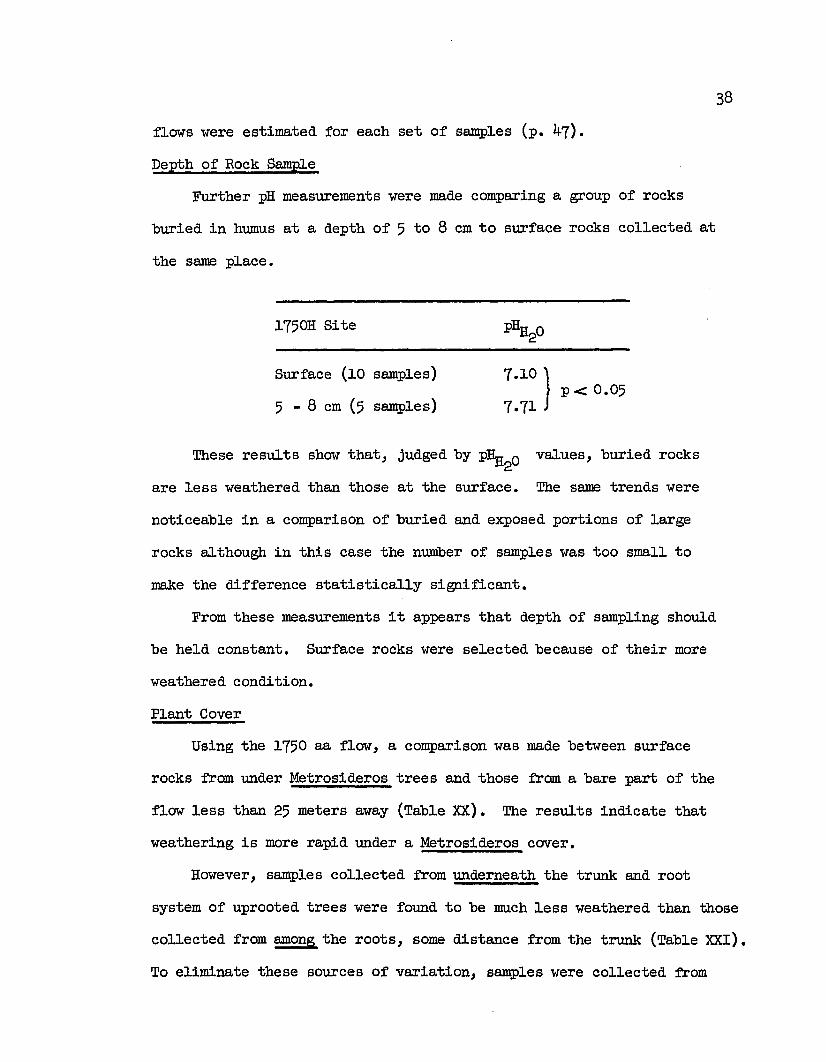
Depth of Rock Sample
Further pH measurements were made comparing a group of rocks
buried in humus at a depth of 5 to 8 cm to surface rocks collected at
the same place.
1750H Site
Surface (10 samples)
5 - 8 cm (5 samples)
7.10 }P < 0.05
7.71
These results show that, judged by P1iI20 vaJ.ues, buried rocks
are less weathered than those at the surface. The same trends were
noticeable in a comparison of buried and exposed portions of large
rocks aJ.though in this case the number of samples was too small to
make the difference statisticaJ.ly significant.
From these measurements it appears that depth of sampling should
be held constant. Surface rocks were selected because of their more
weathered condition.
Plant Cover
Using the 1750 aa flow, a comparison was made between surface
rocks from under Metrosideros trees and those f'rom a bare part of the
flow less than 25 meters away (Table XX). The results indicate that
weathering is more rapid under a Metrosideros cover.
However, samples collected from underneath the trunk and root
system of uprooted trees were found to be much less weathered than those
collected from among the roots, some distance from the trunk (Table XXI).
To eliminate these sources of variation, samples were collected f'rom

39
among tree roots at a distance greater than 1 meter from the trunk but
still under the tree crown. Whenever possible, samples were collected
from under Metrosideros polymorpha trees so that any differences result
ing from different plant species were avoided.
To summarize, when collecting aa basalt samples from high rainfall
areas for weathering studies, it appears that of the factors investi
gated, depth of sample and position relative to trees are the most
important; they should be kept constant as far as possible.
Sampling of Flows
Sampling Axea
For each flow the general area for sampling was selected by choosing
an altitude where rainfall and temperature were most similar to other
flows studied so that comparisons would be facilitated. The final
selection of a sample area depended on convenience of access.
Sampling Sites
At each flow, the exact location of the sampling site was determined
by sighting at right angles across its general slope to a distant object
and then, following this line, step~ng out 50 paces from the edge of
the flow. This was done to avoid bias and ensure that the sampling site
was not influenced by any conditions peculiar to the flow edge. Having
stepped the 50 paces, the site was checked to see if:
(i) its general slope was less than lCJfo (so that slope is rela
tively constant throughout sampling), and
(ii) its surface and vegetation were representative of the flow
in that area.
If these conditions were not met, another 50 paces were traversed, and

40
repeated if need be until a suitable site was reached.
The place where the pacing ended became one end of the sampling
line which was maintained in the same direction as before. Using a
table of random numbers, 5 to 20 sampling points were found at random
distances between 7 and 15 paces apart along this line. At each
sampling point, a sample was collected 1 to 2 meters from the trunk of
the nearest Metrosideros tree that had a crown in the canopy layer and
which was growing on a well-drained micro-site of gentle slope. On
very young flows the sample was collected from a point within 1 meter
of a Metrosideros seedling.
On one Hawaiian flow, the prehistoric Kapoho, absence of Metro
sideros trees necessitated collection from beneath Pandanus (Pandanus
tectorius) trees.
Samples from the Samoan flows were collected as described in this
section but the trees of these sites have not been identified.
Weathered and Unweathered Samples from Aa Flows
Each sample consisted of two subsamples both collected from the
surface of the flow: a tu' subsample representative of the 'unweathered'
(= least weathered) original rock and a 'WI subsample representative of
the weathered rock.
The Jut subl:lample was obtained by knocking out a cube of rock
approximately 3 x 3 x 3 cm from the center of a boulder 30 to 60 em in
diameter using a sledge -hammer and geologl. st 's hammer. With some of the
older flows it was difficult to find an 'unweathered' sample because of
the amount of weathering that had occurred. On the two Stainback pre
historic sites and the 1750L flow, the lUI subsamples were obtained by

41
lmocking out portions of much larger boulders. These had been recently
split during construction of a power-line access road and were within
100 yards of the sampling site.
The IW I subsample was obtained by collecting several small weathered
stones (between 1.5 and 2.5 cm diameter) to approximately equal the
weight of the 'UI subsample (usually 3 to 5 stones). Very vesicular
stones if atypical of the site were not collected. With the 1852 and
1840H sites the scarcity of small stones necessitated collection of
small protuberances and weathered cIlIstal fragments of larger rocks in
order to get an adequate IWI subsample.
Weathered and Unweathered Samples from Pahoehoe Flows
At each sampling point, a sample was collected from the nearest spot
beneath a Metrosideros tree where the lava surface is fissured enough
to allow one to prise out a lava block at least 20 cm (8") in thickness.
The lUI subsample was collected by lmocking out a cube of rock
approximately 3 x 3 x 3 cm from the lava block at a depth of 16 - 20
cm below the surface.
The IW I subsample was collected by first removing any thin glassy
crust present and then lmocking out a similar-sized cube of rock from the
uppermost 3 cm of the remaining block.

ANALYTICAL METHODS
Vegetation Analyses
Tree Density and Mortality
Tree density was obtained by counting the trees higher than 1 meter
in a 30 x 2 m belt transect along the sampling line. A mortality count
was obtained by counting standing dead trees in the sfWle transect. If
the number of live trees was less than 20, the transect was extended to
give a more adequate sample.
Tree Volume Estimates
Tree volume estimates (V) were calculated from the relationship
V • ht x basal area, where basal area = IT r 2 and r, the trunk radius,
is obtained from the diameter breast height (d.b.h.) measured 4.5 feet
above the ground. Tree heights were estimated by eye, excepting a few
that were measured by abney-level, and shorter trees measured with a 3 m
pole. The stem diameter of trees less than 1.5 m high was measured
half-way up the stem.
Mean tree volumes, for the number of trees measured on each site,
were expressed in cubic decimeters of tree growth per century and used
as a measure of the rate of succession.
Cover
The term canopy is used here to denote the plant crowns that form
the skyward surface of the vegetation. The term can be applied to any
type of vegetation, e.g. lichenfield, fernland, or forest.
The percentage of ground area covered by the canopy (canopy cover)
and the percentage covered by each species in the canopy was measured
by recording the plants, if any, growing vertically above 50 points

spaced 2 m apart along the sampling line (100 m transect). For shorter
vegetation such as fernland, the 50 points were spaced at 60 cm j.nter-
vals along a 30 m transect.
Floristic Composition
A list was made of all pteridophyte and spermatophyte species
represented by 3 or more plants on each site, i.e. in an area some 50
x 50 m.
Metrosideros Juveniles
The number of juveniles (plants less than 1 m high) of Metrosideros
polymor;pha were recorded as below:
A = Abundant .••. 5 or more individuals seen on the site(50 x 50 m).
I = Infrequent • • . Less than 5 individuals seen.
N.O. = None observed.
On a few sites, there were sufficient numbers of Metrosideros trees
present to allow a height-elass analysis that also gave information on
juvenile numbers.
Stratification
Profile Diagrams: On some sites, profile diagrams were prepared by
drawing all the plants greater than 0.5 m high that were present in a
belt transect 2 m wide and 20 or 30 m long. The length depended on what
was required to illustrate the structure of the vegetation. These
profiles were used as an aid in estimating the depths of plant crowns.
Vegetation Strata: Floristic change during early stages of lava-flow
successions in Hawaii involves only the additi. on of a few species whereas
the amount of structural change, from lichens to a scrub forest, is much

44
greater. Since a measure of this structural change was required, the
degree of stratification as indicated by stratum depth, defined below,
was chosen as a suitable criterion.
Objective criteria for distinguishing vegetation layers or strata
are not easy to defi~e and are seldom given in the literature although
Newman (1954) did attempt to clarify this matter.
In this study a vegetation stratum is defined as a horizontal zone
of plant crowns, of one or more species, that:
(i) forms a surface of foliage that is distinctly separate from
the crowns of taller plants for at least half its area, and
(ii) covers, when projected vertically downwards, 10% or more of
the ground surface.
In practice, many strata are so clearly defined that sampling to test for
.these criteria is not always necessary.
Crown depths of plants occurring in the line transects or profile
diagrams were estimated from the depth or thickness of a plant1s foliage.
The mean depth or thickness of a stratum was obtained from the mean
depth of all plant crowns sampled in the particular stratum.
The figures given in the "Results" section for total stratum depth
were obtained by adding the depths or thicknesses of all strata present
that exceeded 0.5 m in thickness. Rates of structural succession were
expressed as total stratum depths / century.
Soil Profiles
Where profiles were sufficiently developed, profile descriptions
were made following the methods of the Soil Survey Manual (Soil Survey
Staff, 1951).

In order to obtain a more representative sampling of the depth of
the organic horizon (excluding loose litter), 20 measurements at 2 m
intervals were made along the sampling line for 40 m using a tubular
auger.
Preparation of Rock Samples for Analysis
Removal of Organic Matter
Each weathered rock was brushed with a toothbrush to remove lichens,
moss and fine roots. If roots were abundant the rocks were dried for
2 - 3 hours at 1050 c. to loosen the roots before brushing. All rocks
were subjected to 10 minutes of low-intensity ultrasonic vibration under
water to remove any surface humus still adhering.
Following grinding, some rocks treated with hydrogen peroxide showed
a reaction indicating that some organic matter had been present. This
was probably composed of very fine roots that had penetrated pores in
the rock, and humus. Attempts were made to remove the organic matter by
the following procedures: flotation in water, flotation in carbon tetra
chloride, centrifuging, high-intensity ultrasonic dispersion, and
addition of a chelating resin. With some samples reweighing after treat
ment showed that all methods resulted in loss of some fine inorganic
material in addition to organic matter. Rather than risk loss of clay
size particles, only superficial roots and humus were removed using the
simple cleaning procedure described above. However, the amount of humus
remaining within the rock is likely to increase with weathering whereas
the amount surrounding a rock would be highly variable.
It may be noted that the zero values for cation exchange capacity,
measured in weathered rocks from the Stainback flow (p. 93), suggest
that the amount of organic matter present in these samples was very small.

46
Crushing and Grinding
All rocks were crushed in a 1 inch diameter steel mortar and passed
through a 2 nnn sieve. A glass vial containing a smaJ.l magnet was run
over the sample to remove any steel fragments present. By raising and
lowering the magnet in the vial, it was found possible to separate the
steel fragments from magnetite particles, which were less strongly
attracted, and return the magnetite to the sample.
For grinding, a Pitchford Model 3800 vibratory grinder was used with
a cylindrical shaker and ball both of tungsten-carbide steel. Enough
sample to provide 5 to 10 gIn of powder was ground for 3 minutes and
passed through a 100 mesh sieve. Any particles remaining on the sieve
were returned to the shaker for further grinding. After grinding, the
samples were stored in small glass vials.
Density, Porosity and Texture Measurements
Specific gravity measurements of rock particles (100 mesh size)
were made using the method of Wright (1934). Rock density (= bulk
density of individual rocks) was measured using iImnersion in paraffin wax
following the procedure of Blake (1965).
An attempt to use rock density as a means of characterizing rock
porosity was unsuccessful because although highly vesicular rocks tended
to have low densities, other rocks of a~parently very different poros
ities were found to have similar densities. For this reason, the per
centage area of the rock occupied by pores was estimated using a 10 x
hand lens as follows:

47
Porosity Rating
No obvious pores 0.0
<: lC/fo of surface with pores 0.5
10-25% " " " 2.0
25-5C/fo " " " 4.0
50-l0C/fo " " " 7.5
Texture of rock samples was assessed with the aid of a hand lens
according to the following scheme:
Texture Rating
No phenocrysts > 0·5 mm diameter 10.0
0-5% surface occupied by phenocrysts >0·5 mm diam. 9.0
5-2C/fo " " " " " " 7.0
20-5C/fo II II II " " " 4.0
50-l0C/fo II II II " " II 2.5
pH and Cation Exchange Ca;pacity Measurements
pH Measurements
Stevens and Carron (1948) describe a method of grinding mineral
fragments under water to make a heavy suspension and then, using indica
tor papers, measuring the "abrasion pHil of the suspension. They found
pH values varying from 1 to 12 for various minerals with felspars,
pYroxenes, amphiboles and olivine falling in the range 8 to 11.
In the present study, rock pH was determined by measuring the pH
in water and in KCL A 1:1 suspension of 100 mesh rock powder and
distilled water (2 gIn rock : 2 ml water) was equilibrated for 1 hour
at 23°C., stirred and tested for pH 60 seconds later. Approximately
0.15 gIn of KCl was then added to make a 1N KCl concentration and the
suspension allowed to equilibrate for another hour. pH measurements

48
were repeated and the PI1<:Cl - P~ 0 <llfference recorded as 6pH.2
Samples of partly decomposed litters from several plant species
were also tested for pH using 20 g of litter to 20 m1 of <llstilled water
and 1 hour r s equilibration. This measurement is referred to subsequently
as litter pH.
For all these measurements an Orion model 801 <llgital pH meter
with expanded scale was used together with a Beckman 39142 combination
electrode containing glass and reference electrodes in the same
assembly. With this instrument an accuracy of "t 0.025 pH units can be
obtained. The 5 m1 plastic vials used to hold the suspensions were
shielded from electrical interference by an earthed aluminum foil shield
during measurement.
Cation Exchange Capacity Measurements (C.E.C.)
C.E.C. measurements were made on 2 gIn samples of 100 mesh rock
powders. The samples were placed in porous porcelain crucibles and
leached under suction 5 times with 50 m1 portions of IN calcium acetate.
This calcium-saturated rock was washed 5 times with 50 m1 portions of
<llstilled water and then filtered with 100 m1 of ammonium acetate. The
calcium removed was measured by titration with E.D.T.A.
Hydration Measurements
Weight-loss Measurements
One gram samples of 100 mesh rock powder were weighed into 2 inch
<llameter vycor glass <llshes and dried overnight at 110~C. They were then
weighed and placed in a muffle furnace at 350°C. for 24 hours and the
resulting weight loss expressed as a percentage of the 110°C. weight.
This weight loss on heating is largely sorbed water and hydroxyl water

(Jackson 1956) together with CO2 losses from any organic matter present.
Small weight gains, up to 0.3% were observed at higher temperatures,
presumably related to ferrous -ferric ion oxidations. Thus measurement
of the hydroxyl water loss that occurs up to and above 500°C. was not
attempted.
Rehydration Measurements
With one group of samples, after the 110-350°C. weight-loss
measurements had been completed, the weight increases were measured
following equilibration for 1-3 days at 5afo, 79.3% and 9P1fo relative
humidities. Desiccators were used with 43% H2
S04
to maintain 5afo R.H.
and saturated solutions of NH4Cl and CuS04
•5H2
0 for 79.3% and 9P1fo R.H.
respectively.
Hydration-rind Examination
Friedman's (1968) method of examining the hydration rinds of obsid-
ian in rhyolite flows prompted a search for volcanic glass in some of
the basalt flows studied. Two fir three smooth-skinned lava droplets
that appeared to have been rapidly cooled were collected from each of 4
flows. Thin sections were cut across each droplet, using standard pro-
cedures, mounted on slides, and ground down to allow a microscopic search
for any hydrated glassy surfaces.
Oxidation Measurements
The method. used was that of' Bardossy and Bod (1961) who character-
ized the oxidation state of sedimentary rocks by dissolving them in a
strong oxidising agent - potassium dichromate. The change in the base
potential of the dichromate is taken as an indirect measure of the
oxidation state of the rock. The greater the change, the more reduced
was the rock.

50
100 ml portions of o.orn and o.oorn K2Cr204 were added to 1 gin
amounts of 100 mesh rock powder together with 2 ml 4~ sulphuric acid
to stabilize the pH below 1. The solutions were continually agitated
on a vibratory shaker and e.m.f. and pH measurements made at 0, 1, 3,
18, and 24 hours. A Beckman pH meter (expanded scale) with inert
platinum and calomel reference electrodes was used. Changes in pH that
occurred during the 24-hour period were corrected by using the Nernst
equation.
Mineralogical Measurements
X-ray diffraction patterns of powder samples were obtained using
a Norelco X-ray wide range diffractometer and Geiger-Muller tube
detector. The instrument conditions used were a scanning speed of 1
degree 28 per minute, chart speed of ~ inch per minute, divergent,
scatter, and receiving slits of 1°, 1° and 0.006 inch respectively,
tube voltage of 35 kv, current 20 ma, and copper radiation with nickel
filter. The range 25 to 37° 2(} was scanned to trace out plagioclase,
pyroxene, olivine and iron oxide peaks.
Two attempts were made to determine magnetite / maghemite ratios.
The same diffractometer was used with an autofocus attachment (AMR 3
201) that curves the specimen so that its surface is coincident with
the goniometer focussing circle at all diffraction angles, thus increas
ing resolution. Using a procedure outlined by Montagne (unpubl.), the
100 mesh samples were ground in acetone with a porcelain mortar and
pestle to a size <400 mesh and brushed onto a fiberglass slide. Four
drops of collodion were added andthe fine powder air-dired for 10
minutes before mounting. The instrument condi tions used were scanning
speeds of 0.5 and 1 degrees 20 per minute, chart speed of i- inch per

51
minute, divergent, scatter, and receiving slits of 4°, 4° and 0.006 inch
respectively, tube voltage of 35 kv, current 10 ma, and iron radiation
without filter. The range of 10 to 58° 28 was scanned.
A second approach for determining magnetite / maghemite ratios
was by using a magnetic susceptibility recorder designed and built by
Gilliard (unpubl.). This auto-recording analytical balance records
changes in weight of the sample as it is heated in a magnetic field of
4400 gauss to 700°C. and cooled in the same field.
Elemental Analyses
Extraction
The fusion technique of Suhr and Ingamells (1966) was used to
obtain solutions for analyses of Si, Al, Ca, Mg, K and Na. From 0.1
to 0.2 gm of 100 mesh rock powder was weighed accurately and mixed with
1 gm of lithium tetraborate and fused in a carbon crucible at 940°C.
for 15 minutes. The melt was poured into 60 ml of 1:25 nitric acid in
a teflon beaker and sti'rred until dissolved (15 to 30 minutes) with a
teflon-covered stirring bar. Each solution was filtered to remove
teflon and carbon fragments before being made to 100 ml. vol. with
dilute nitric acid (1:25).
Silicon and Aluminum
Silicon was determined within 8 hours of extraction using the method
of Shapiro and Brannock (1962). Silicon was measured by colorimeter
after development of a molybdenum blue co:J-or. Aluminum determinations
were made within 24 hours of extraction using the aluminon procedure of
Hsu (1963). Preparation of silicon and aluminum standards followed the
recommendations of Jackson (1958).

52
Calcium and Magnesium
These determinations were made by atomic absorption spectroscopy
using an air-acetylene flame. To diminish interference from. aluminum,
sufficient lanthanum oxide was added to make a 1'/0 concentration in the
test solution. Aliquots from a blank tetraborate fusion were added to
the standards and all final dilutions made with distilled water.
Accuracy and precision weI~ tested by making duplicate determinations
on a set of Hawaiian Institute of Geophysics (H.I.G.) rock standards as
well as duplicate determinations for some samples of each flow.
Sodium and Potassium
These elements were determined using aliquots of the tetraborate
extracts and a Beckman DU flame photometer. Accuracy and precision were
measured as above by making duplicate determinations on H.I.G. standard
rocks and duplicating some of the unknown samples.
Iron
Iron was determined as Fe203 under contract by the Rocky Mountain
Geochemical Corporation using 100 mesh rock powders and atomic absorp
tion spectroscopy.
Titanium
Titanium was determined by X-ray fluorescence using a Norelco Univer
sal Vacuum spectrometer and FA-60 tungsten anode X-ray tube at 50 kv and
40 mao The 100 mesh rock samples were poured into aluminum sample holders
equipped with 0.0005 inch Mylar windows and the holder gently tapped to
ensure an even distribution of rock powder over the window. A pulse-height
analysis plot of the TiKoC1
peak was made to select settings of 6.5 volts
for level and 9V for width thus excluding higher orders of X-rays. Count
ing strategy was based on that of Price and Angel (1968) who used the
spectrum of the chromium anode as an internal standard. In the present

53
case count rates of TiK 0< 1 peak and WL 0'1 were measured using a LiF
analysing crystal and flow-proportional counter (P-10 gas) with detector
voltage of 1600. The TiK jwl 1 ratio was plotted against the titaniumD(: 1 oC
concentrations of the H.I.G. standard rocks (Fig. 4) and similar ratios of
the unknown rocks interpolated on the standard curve obtained. A rock
standard was kept in the same sample holder throughout the measurements
and counts made on it between every three unknowns so that fluctuations
in the counting rate of the machine could be corrected for.
Strontium
This element was also determined by X-ray fluorescence using a
tungsten-anode et 50 kv and 40 ma with scintillation counter and detector
voltage of 1060. Sample s were placed in sample holders similarly to the
method used for titanium but the counting strategy of Champion et al
(1966) was followed with counts made of the SrKoc peak (25.23° 2& )
and at two points either side of the Sr peak (23.5 and 26.5° 2& ) to
obtain a background count. The ratio R of net peak to background was
calculated using the formula:
1 where ~ is the count rate at the peak
position
and nb is the interpolated background count
rate at the peak position.
Manganese and Nickel
Similar methods to those used for strontium were applied to manganese
and nickel except that a titanium filter was used with the tungsten tube
in order to exclude X··ray interference from elements of lower atomic
number.

Figure 4. Standard curve for titanium.
(X-ray fluorescence determinations of
H.I.G. standard rocks; analyses are mean
values from Japanese Analytic Laboratory
and U.S. Geological Survey).

1.0
0.8
-.J 0.6
3="
tf~
i= 0.4
0.2
1.0 2.0 3.0 4.0 5.0
56
Treatment of Results
Accuracy and Precision
Accuracy was determined from the difference between the reported
analysis for the standard rock and the measured value, div1.ded by the
standard rock figure. The precision of duplicate determinations was
determined from the relationship:
larger value - smaller valuemean value
Accuracy and precision figures given in the results section are means
and standard dev1.ations with the number of determinations on which each
mean is based, placed in parentheses.
Variation, Losses and Gains
Standard dev1.ations (S.D.) are used in the tables to indicate the
variation between samples from the same flow. The heading INo. I refers
to the number of samples measured. A standard ~ test (Snedecor 1956) was
used for testing the significance of the differences between weathered
and unweathered rocks. The symbol Ip lis used for the probability of
error if the null hypothesis is rejected. All differences that fall
below the 9afo level of significance (p = 0.1) are listwl as not signi
ficant (N.S.). For differences equal to and greater than this level of
significance, percentage losses or gains were calculated by expressing
the differences between measurements for weathered and unweathered rocks,
as percentages of the measurement for the unweathered rocks.
Regression Analyses
This work was carried out at the University Computing Center using
an IBM 360/65 computer. Correlation matrices and regression equations
were obtained using a stepwise multiple regression program (BMD02R)
based on that of Efroymson (1960).

RESULTS AND DISCUSSION
Vegetation Changes
Succession
In this section, emphasis 'Will be given to field observations made
on many flows, in addition to those sampled. The sampling results
(Tables V - VIII) are discussed more fully in the Discussion and Con
clusions section (p. 138). The list of species found on the sampling
sites is given in Appendix III.
In naming the ecosystems sampled (Table V), terms such as forest,
lichenfield and rockland are used according to whichever type of growth
form or ground material constitutes most of the uppermost surface. The
term 'treeland' rather than forest is used for a tree-dominated eco
system if the canopy cover of trees is less than 8afo. The type of
forest or fernland is designated from the generic names of the major
canopy species, Le. those 'With canopy cover equal or greater than 2afo.
An "/" sign between generic names indicates that the first species (e.g.
Metrosideros) forms a separate stratum above the second species (e.g.
Dicranopteris). (A hyphen separates species in the same stratum). Use
of this naming system enables one to convey concisely information on
composition and structure of the ecosystem.
Field observations indicate that four successional trends can be
distinguished:
1. Rockland-Metrosideros treeland -Pandanus forest: This trend is
restricted to the coastal zone having more than 70 inches annual rainfall.
It occurs on both pahoehoe and aa flows. Within 5 years of flow formation,
swordfern (Nephrolepis sp.) and the lichen Stereocaulon vulcani become

TABLE v. COMPOSITION .AND TYPE OF ECOSYSTEM SAMPLED
Flow Altitude(ft.)
TYPe of Ecosystem Principal Species No. ofSpecies
MetrosiderosJuveniles
Pandanus forest
Stereocaulon 1ichenfie1d
Dicranopteri s fernland
Dicranopteris fernland
A
N.O.
N.O.
I
N.O.
N.O.
A
N.O.*
A
A*
A
A
I*
11
12
19
11
20
14
1413
12
115
14
"
Cibotium
Stereocaulon
Diospyros
Stereocaulon
"
II
"
II
"
Coffea, Freycinetia
Metrosideros, Cibotium
Pandanus, Psidium,Cordy1ine
Stereocaulon, Metrosideros
" Rhacomitrium
Dicranopteris,Machaerina,Lycopodium, Metrosideros
Metrosideros, Dicranopteris,Stereocaulon, Lycopodium
Dicranopteri s, Metrosideros,MachaerinaMetrosideros, Dicranopteris
"
"
forest
forest
treeland
/Cibotium forest
"
"
II
""
"
Metrosideros!Dicranopteristreeland
Metrosideros rockland
Metrosideros!Dicranopteristree1and
90
300
40
990300
650
3250
3180
3660
930
3120
3800
3660
HonaunauPrehistoricKapoho
1840L
1150H
1150L
UpperStainback
LowerStainback
1855
1840H
1852
195519421881
*A = abundant; I = infrequent; N.O.:a not observed VIco

59
established. The lichen does not form the thick crusts that can be
found on some inland sites. Metrosideros pol;ymorpha is the pioneer
tree species, ap;pearing within 10 years, and an open treeland develops
as on the 1840L site (Fig. 5). The height-class distribution of Metro-
sideros on this site is shown in Table VI. Establishment of young
Metrosideros is still occurring on this open site, even after 120 years.
Since Pandanus tectorius is absent from the 1750 flow it must sometimes
be more than 200 years before this species enters the cOIlDllunity. How-
ever, on late prehistoric flows between the 1750 flow and the 1960
Kapoho flow, juvenile Pandanus can be seen among the Metrosideros
(Fig. 6). On older prehistoric flows, both between and south of these
flows, Pandanus-Metrosideros forests occur. In advanced stages of the
succession, Metrosideros decreases and may disap;pear as on the pre-
historic Kapoho flow (Table V, Figs. 7, 8).
TABLE VI. HEIGHT-CLASS DISTRIBUTION OF METROSIDEROS POLYMORPHA
Lava FlowHeight Class 1955 1942 1881 1855 1852 1840L
0-1 meters 10~ 95% 5% 2P$ % 5%
1-2 II5 17 33 26 10
2-3 II 13 19 36 53-4 II 6 11 25 554-5 II 2 3 3 15
>5II 3 6 3 10
No. of PlantsSampled 25 60 63 36 61 20

Figure 5. Profile diagram of Metrosideros rockland on the l840L (aa) sampling
site, Kilauea: 40 ft. elevation.
(M =Metrosideros polymorpha, N = Nephrolepis hirsutula,
S = Scaevola taccada.)
0\o
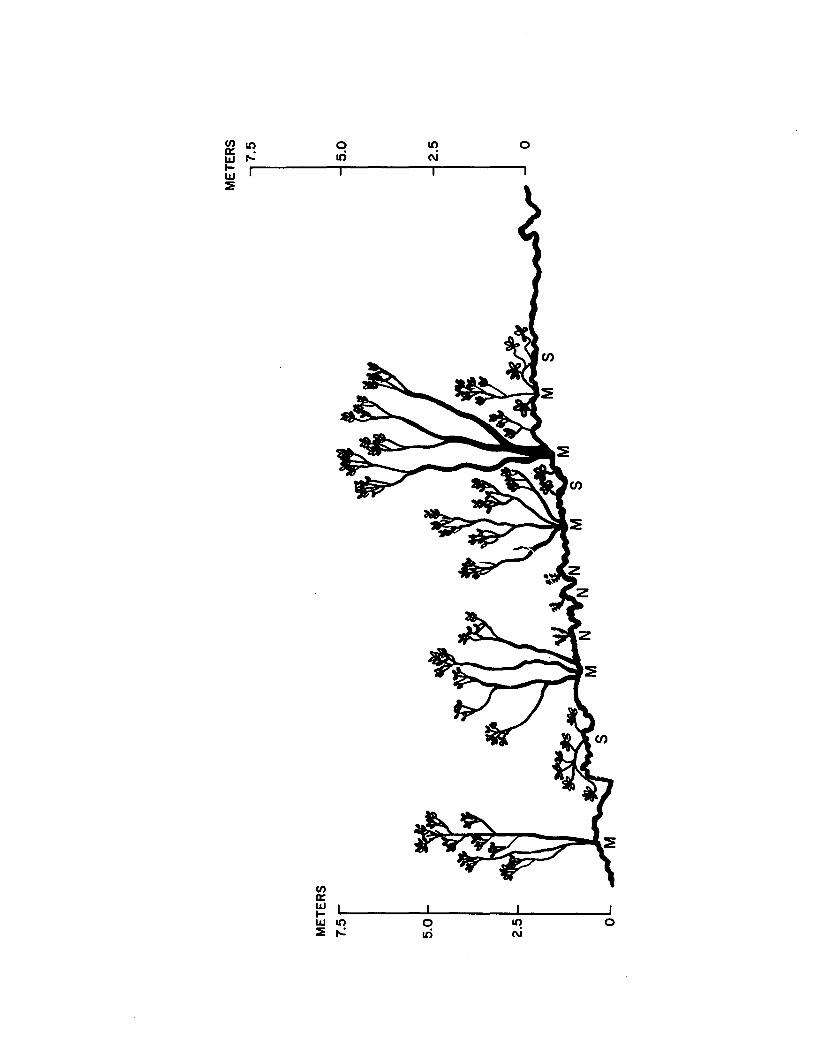
o(/) In 0 &qffi ,..: to (\J
I- "'1------'TI-----T'I----~UJ~
(/)0::UJ I 1 1 ,I-UJ In 0 In 0~ ,..: to N

62
Figure 6. Metrosideros treeland wi th juvenile
Pandanus on aa flow, Kapoho district
50 ft. elevation.

63

Figure 7. Profile diagram of Pandanus forest on the prehistoric Kapoho (aa)
sampling site, Kilauea : 90 f't. elevation.
0\-t='"
(A = Aleurites moluccana,
Mc = Morinda citrifolia,
Pg = Psidium guajava).
An = Asplenium nidus,
P =Pandanus tectorius,

1/)1() 6 I() 0 I() 00:: •2 ~ It'i C\iwC\l... I Iw
~
I/)0::WI-wo I() q I() 0~o ,...: I() C\i
66
Figure 8. Pandanus tectorius forest, prehistoric
Kapoho (aa) sampling site, Kilauea :
90 ft. elevation.

67

68
2. Rockland - Dicrano;pteris fernland - Metrosideros forest: Below
1000 feet elevation this is by far the most widespread trend of
succession on both aa and pahoehoe flows. The earliest stages have been
described in detail by Doty (1967). Mats of Stereocaulon are usually
very prominent on young flows. During intermediate stages of the
succession there is wide variation in the proportions of Dicrano;pteris
linearis and Metrosideros forming the canopy and all gradations from
fernland to treeland can sometimes be found on the same flow. The 1840H
site (Tables V, VII) exemplifies an intermediate stage while the Lower
Stainback stand shows a much later stage in which the Dicrano;pteris has
disappeared (Fig. 9). This stand has an understorey of Cibotium tree
ferns, Psidium guajava and Coffea sp. The rather dense spacing of the
Metrosideros and comparatively small mean tree volume (Table VIII)
suggest that the Lower Stainback forest may be secondary growth following
fire. No burnt stumps were noticed but charcoal was found in a soil
profile about 100 feet altitude lower in an area of similar rainfall.
Juvenile Metrosideros plants were not present on either the 1840H
or Lower Stainback sites, possibly because of the dense fern cover in
the first case and the dense understorey in the second.
3. Rockland - Dicrano;pteris fernland -Metrosideros!Cibotium forest:
;' This trend is found in the higher rainfall zone between 1000 and 4500
feet elevation. It is essentially similar to the second successional
trend discussed above but differs in that Cibotium tree ferns form a
major part of the canopy during later stages. The increased Cibotium
cover is probably related to the higher rainfall rather t.han the lower
temperature conditions at these higher elevations. Among the sites

TABLE VII. VEGETATION STRATIFICATION
Flow No. of Strata and Maximum Mean Heights Mean Depths Total StratumMajor Components Height of Plants of Strata Depth
(m) in Strata (m) (m) (m)
1955 1) Metrosideros 1.2 0.3 0.3 0.3
1942 1) " 2.0 0.4 0.4 0.4
1881 1) " 9.0 2.0 1.1 2.22) Dicranopteris 0.6 0.5
1855 1) Metrosideros 1.0 2.1 2.0 2.32) Dicranopteris 0.4 0.3
1852 1) Metrosideros 1.0 2.2 2.0 3.22) Dicranopteris 1.3 1.2
1840H 1) Metrosideros 9.0 1.5 5.0 6.02) Dicranopteris 1.5 1.0
1840L 1) Metrosideros 6.1 3.5 3.0 3.0
1150H 1) " 24.0 21.0 9.1 16.12) Diospyros 10.1 1.6
1150L 1) Metrosideros 12.0 10.1 10.0 10.0
Q'\\0

T.ABLE VII (Continued). VIDETATION STRATIFICATION
Flow No. of Strata and Maximum Mean Heights Mean Depths Total StratumMajor Components Height of Plants of Strata Depth
(m) in Strata (m) (m) (m)
Upper 1) Metrosideros 24.8 20.2 14.0 18.0Stainback 2) Cibotium 5.0 4.0
Lower 1) Metrosideros 19.0 18.0 12.2 14.6Stainback 2) Coffea, Cibotium 5.5 2.4
Honaunau 1) Metrosideros 26.6 25.0 8.0 12.02) Cibotium 5.0 4.0
Prebist. 1) Pandanus 12.0 10·7 8.2 11.9Kapoho 2) Psidium 5.5 3.7
<3
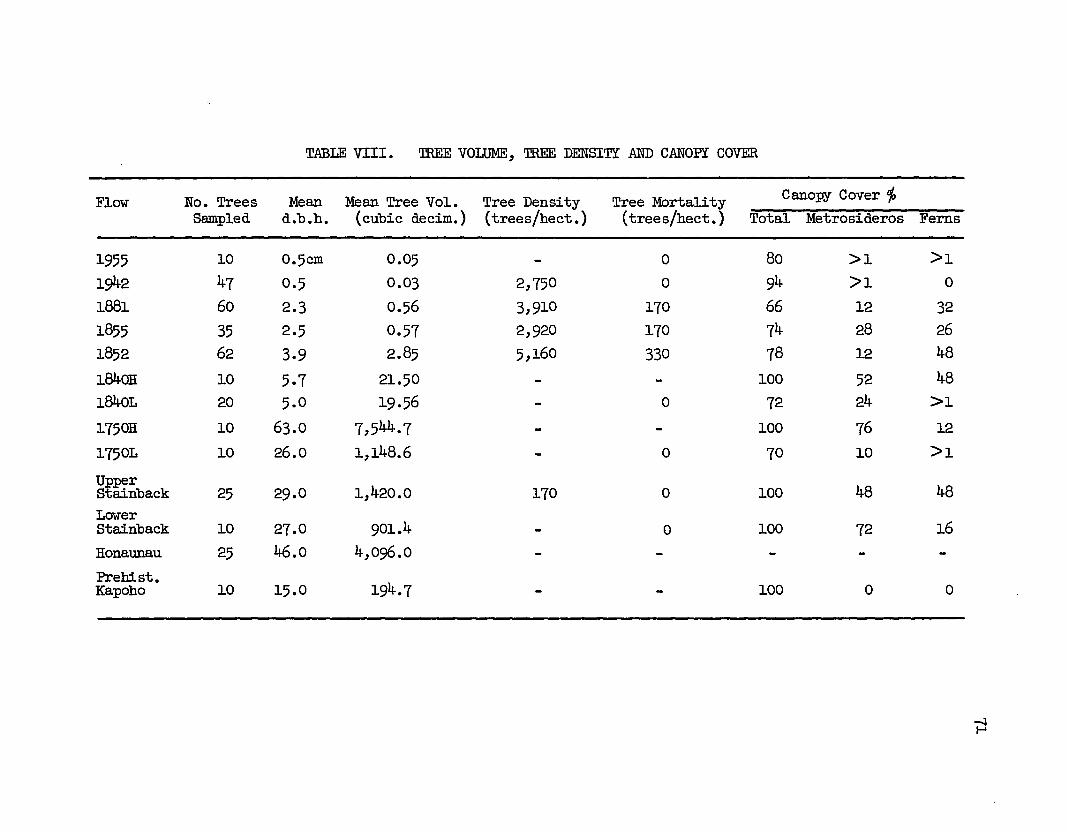
TABLE VIII. TREE VOLUME, TREE DENSITY .AND CANOPY COVER
Flow No. Trees Mean Mean Tree Vol. Tree Density Tree Mortality Canopy Cover '/JSampled d.b.h. (cubic decim.) (trees/hect.) (trees/hect •) Total Metrosideros Ferns
1955 10 0.5cm 0.05 - 0 80 >1 >1
1942 47 0.5 0.03 2,750 0 94 >1 0
1881 60 2.3 0.56 3,910 170 66 12 32
1855 35 2.5 0.57 2,920 170 74 28 26
1852 62 3.9 2.85 5,160 330 78 12 48
1840H 10 5.7 21.50 - - 100 52 48
1840L 20 5.0 19.56 - 0 72 24 >1
1750H 10 63.0 7,544 .7 - - 100 76 12
1750L 10 26.0 1,148.6 - 0 70 10 >1
Upper29.0 1,420.0 170 0 100 48 48Stainback 25
LowerStainback 10 27.0 901.4 - 0 100 72 16
Honaunau 25 46.0 4,096.0
Prehist.194.7Kapoho 10 15.0 - - 100 0 0
.....JI-'
72
Figure 9. Metrosideros forest near the Lower
Stainback (aa) sampling site, Mauna
Loa : 300 ft. elevation.
(Cibotium glaucum tree-ferns and the
vine Freycinetia arborea can be
seen in the understorey).

73
sampled, the vegetations of the 1942, 1881, 1855, 1852, Honaunau and
Upper Stainback flows appear to be stages in this succession (Figs.
10 - 14).
Changes in the age-structure of the Metrosideros population are
indicated by change in the height-elass of Metrosideros trees with time
on later historic flows (Table VI). With increasing time there is a
progressive shift of the largest frequency class to taller height classes.
Although no Metrosideros seedlings or saplings were seen at the Upper
Stainback site, there were a number of resprout shoots from semi
prostrate trunks. Elsewhere on the flow, seedlings of Metrosideros were
found occasionally growing on Cibotium trunks.
The succession on pahoehoe flows differs from that on aa in that
juvenile Cheirodendron trigYnum are more abundant on pahoehoe. If this
trend continues, one would expect to find Cheirodendron forming part of
the canopy on still older flows but such flows were not found on Mauna
Loa or Kilauea.
4. Rockland - Metrosideros forest - Metrosideros/Diospyros forest:
Stages in this succession were seen only on aa flows below 1000 feet in
the Ptma rift district. The 1955 site may be an early stage (Fig. 15).
The 1750H site (Fig. 16) is a later sta@e though the EdOSPyrOS ferrea is
still only an upper understorey species. That Diospyros will ultimately
form part of the canopy may be inferred from the absence of Metrosideros
juveniles or resprout growth and the presence of juvenile DiospyroS of
various heights. Dicranopteris, though present, appears to have been less
important during intermediate sta@es than in successions "2" and "3"
described above.

Figure 10. Profile diagram of Metrosideros!Dicranopteris treeland on the
1855 (pahoehoe) sampling site, Mauna Loa : 3660 ft. elevation.
(D = Dicranopteris linearis, M = Metrosideros polymorpha,
Ma = Machaerina angustifolia)
-..:J\Jl

o
o
10N
oU"i
oU"i
(/)0
fficiI- r-----..,...------r-------,r------...I1J::t
Figure ll. Metrosideros!Dicranopteris treeland on the l855 (pahoehoe)
sampling site, Mauna Loa : 3660 ft. elevation.
(The abundant sedge growing with the Dicranopteris is
Machaerina Bngustifolia. )
-...:I-...:I


~,
Figure 12. Profile diagram of Dicranopteris fernland on the 1852 (aa)
sampling site, Mauna Loa : 3660 ft. elevation.
(D = Dicranopteris linearis, L = Lycopodium cernuum,
M = Metrosideros polymorpha, Ma = Machaerina angustifolia,
S = Sadleria cyatheoides, V = Vaccinium calycinum.)
-...:]\D

oo.0
enct:W , I I I II-W 0 It) q It) 0::E 0 ~ It) t\i
enoffio~ ;;..----,...-----,-----r-----,::E

81
Figure 13. Dicranopteris fernland on the 1852 (aa)
sampling site, Mauna Loa: 3660 ft.
elevation.
(The sedge Machaerina angustifolia is
growing among Dicranopteris linearis
ferns in the foreground. Trees of
Metrosideros polymorpha appear in the
background) •

82

Figure 14. Profile diagram of Metrosideros/Cibotium forest on the Upper
Stainback (aa) sampling site, Mauna Loa: 3780 ft. elevation.
(C = Cibotium glaucum, M =Metrosideros ;polymorpha.)
CPw

en 0 q 0 0 00:: 0 It) 0 It)
I.LJ (\J
t-I.LJ::E

Figure 15. Stereocaulon lichenfield on the 1955 (aa) sampling site,
Kilauea: 930 f't. elevation.
(Metrosideros forest on prehistoric flow in background.)
&
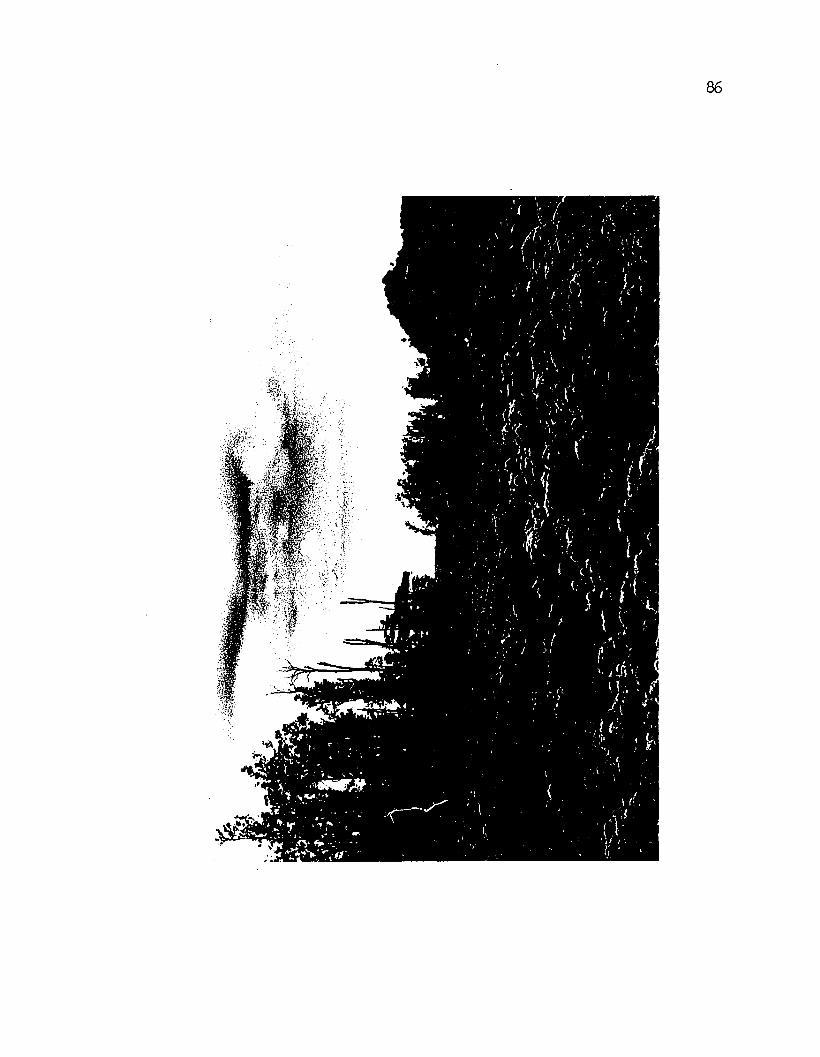
86

87
Figure 16. Profile diagram of Metrosideros forest
on the l750H (aa) sampling site,
Kilauea : 990 ft. elevation.
(An = Asplenium nidus, D = Diospyros
ferrea, F = Freycinetia arborea,
M =Metrosideros polymorpha,
Ph = Psychotria hawaiiensis).

METERS
20.0
15.0
10.0
5.0
o
o

89
No Diospyros was observed on the l750L site but Doty and Mueller
Dombois (1966) record this species from prehistoric flows at similar
altitudes near the 1955 Kii flow. Summer-dry periods are more frequent
on the l750L site than elsewhere in the study area.
Trends in numbers of species and stratification: There are no obvious
trends in numbers of species (Table V) apart from the fact of fewer
species during the earliest stages of development.
Two main strata ( > 0.5m) appear within 100 years of flow formation
but there appears to be no further increase in the number of strata on
older flows. In general, total stratum depth increases with age
although the l840L site is exceptional. This site has the highest mean
annual temperature among the historic flows and it is considered that
the increased evaporation may result in dry periods long enough to
restrict growth.
Age Parameters
Table VIII lists the parameters that were considered for age indices.
Tree density varies widely: at first increasing while Metrosideros
plants are still able to establish, then decreasing while natural thinning
occurs. Thus density is not a single -valued function of time. Each of
the parameters: mean trunk diameter (d.b.h.) of all trees sampled, mean
d.b.h. of the largest 10 trees, and mean tree volumes, were plotted
against time. It is clear that with increasing time and reduction of
growth rates, these parameters approach asymptotic values. Cover is
very variable depending on local site conditions • Thus none of the
vegetation parameters examined appears to be useful in aging a lava-flow
ecosystem.
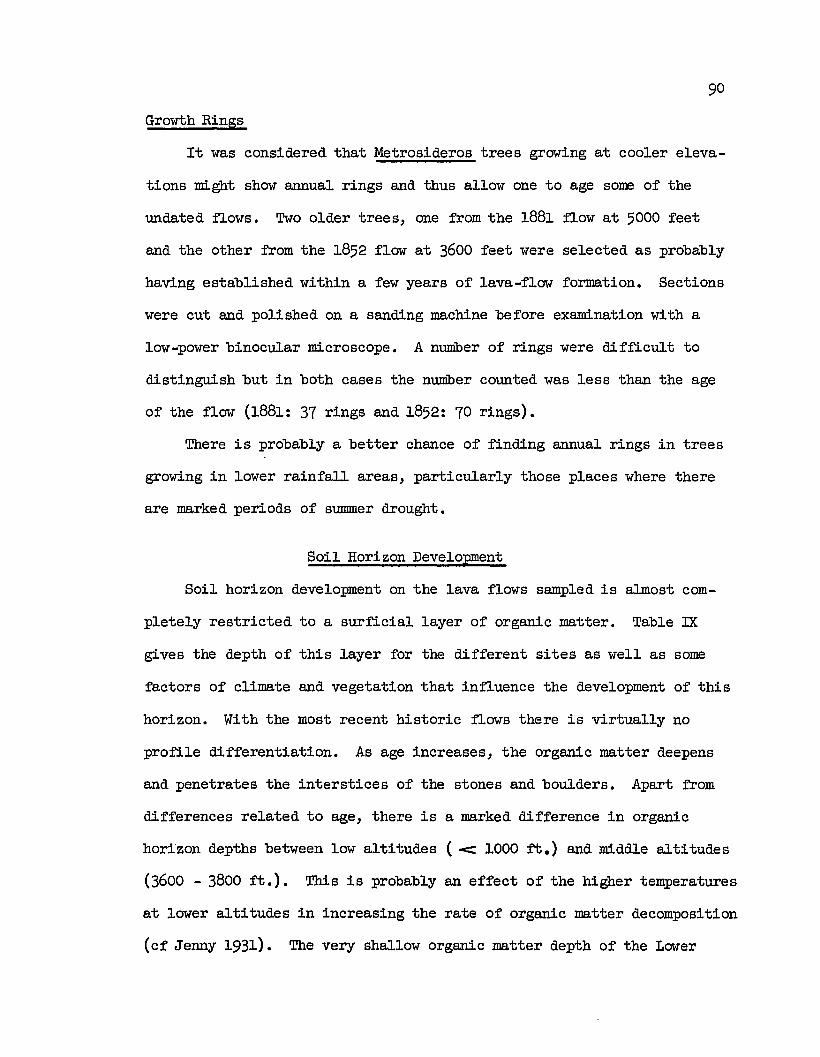
90
Growth Rings
It was considered that Metrosideros trees growing at cooler eleva
tions might show annual rings and thus allow one to age some of the
undated flows. Two older trees, one from the 1881 flow at 5000 feet
and the other from the 1852 flow at 3600 feet were selected as probably
having established within a few years of lava-flow formation. Sections
were cut and polished on a sanding machine before examination with a
low-power binocular microscope. A number of rings were difficult to
distinguish but in both cases the number counted was less than the age
of the flow (1881: 37 rings and 1852: 70 rings).
There is probably a better chance of finding annual rings in trees
growing in lower rainfall areas, particularly those places where there
are marked periods of sunnner drought.
Soil Horizon Development
Soil horizon development on the lava flows sampled is almost com
pletely restricted to a surficial layer of organic matter. Table IX
gives the depth of this layer for the different sites as well as some
factors of climate and vegetation that influence the development of this
horizon. With the most recent historic flows there is virtually no
profile differentiation. As age increases, the organic matter deepens
and penetrates the interstices of the stones and boulders. Apart from
differences related to age, there is a marked difference in organic
horizon depths between low altitudes (<: 1000 ft.) and middle altitudes
(3600 - 3800 ft.). This is probably an effect of the higher temperatures
at lower altitudes in increasing the rate of organic matter decomposition
(cf Jenny 1931). The very shallow organic matter depth of the Lower

TABLE IX. DEPrH OF ORGANIC HORIZON 100) SITE FACTORS
Flow Altitude Mean Ann. Mean Ann. Total Veg. Depth of Organic(ft. ) Rainfall Temp. Stratum Hori zon (em)
(in.) (OF. ) Depth (m) Mean S.D.
1955 930 lOO 69.9 0.3 0.0
1942 3720 l50 60.2 0.4 0.2
l88l 3800 220 59.9 2.2 l.0 0.9
l855 3660 250 60.4 2.3 5.0 5.0
l852 3660 210 60.4 3.2 ll.9 l2.0
l840H 650 l30 70.9 6.0 0.8 0.4l840L 40 ll5 73.l 3.0 0.5 0.5
l750H 990 llO 69.7 l6.7 l.7 0.4
l750L 300 90 72.l lO.O l.5 0.4
U~~r 3780 l40 60.0 l8.0 l6.5 9.7S ainbackLower
l40 l4.6Stainback 300 72.l 0.5
Prehist.Kapoho 90 l05 72.9 ll.9 l.0 0.8
)9

loose Dicranopteris litter with mosses.
black (5YR 2/1) humus; about 75'fo fine roots,
92
Stainback site cannot be attributed to fires or other disturbances that
have occurred here in the past; Jenny et al (1949) found that a near
equilibrium in the accumulation of organic matter was reached in less
than 10 years in tropical forest. The data of Table IX show that, even
allowing for temperature differences, there is no close relationship
between organic horizon depth and the total depth of vegetation strata.
Two representative profiles are described below:
(i) 1852 site, Mauna Loa: 3660 ft. Profile under Metrosideros
(8 m) and Dicranopteris (3 m).
4-0 cm
O-lOcm
densely matted; very fine granular structure,
abrupt boundary,
on aa stones (5 - 50 cm diam.) with thin black
colloidal coating; interstices between boulders
partially filled with black (5YR 2/1) humus;
slightly sticky; weakly developed very fine
granular structure; abundant fine roots, earth
worms present. Humic material decreases in
amount with depth •
.(ii) Upper Stainback site, Mauna Loa : 3780 ft. Profile under
Metrosideros (18 m) and Cibotium troe-fern (4 m).
5-0 cm loose Cibotium and Metrosideros litter.
0-3 cm mat of fine and coarse roots overlying and separate
from:
3-15cm dark reddish brown (5YR 2/2) humus; about 25'fo fine
roots; nonsticky; moderately developed fine

93
granular structure; abrupt boundary,
on aa stones (5 - 45 cm diam.) with reddish brown
colloidal coatings; dark reddish brown humus in
rock interstices; nonsticky; moderate to strongly
developed medium granular structure; abundant
fine roots. Humic material paler (5YR 3/2) with
increasing depth.
Humic material on the two pahoehoe flows examined (1881 and 1855)
was black (7.5 YR 2/0), nonsticky and structureless. Except near
fissures, it was evident that waterlogging of the organic horizon was of
much more frequent occurrence than on neighboring aa flows. This can be
related to the relatively impervious pahoehoe surface beneath.
;pH Changes
Rock pH
The results of the rock pH measurements are summarized in Table X.
The small fj" pH (~Cl - ~ 0) values of the 'unweathered' (U) samples2
from the 1852, 1840H and 1840L sites, indicate that the original value
for an unweathered rock at time zero may be very close to 0.0. A sample
of unweathered lava collected by Dr. G.A. Macdonald from the 1899 flow
in a high-altitude, low-rainfall zone of Mauna Loa gave a L1pH value of
-0.05. The fj pH values of the U samples from the 1750H and Upper Stain-
back sites' suggest that these rocks may bE slightly weathered.
The possibility that ~ pH values indicate the development of charged
surfaces in the weathering rock was investigated by making duplicate
measurements of C.E.C. in two samples: one from the 1840L site ( D. pH =
-0.26) and one from the Upper Stainback ( 6 pH = -1.07). There was no
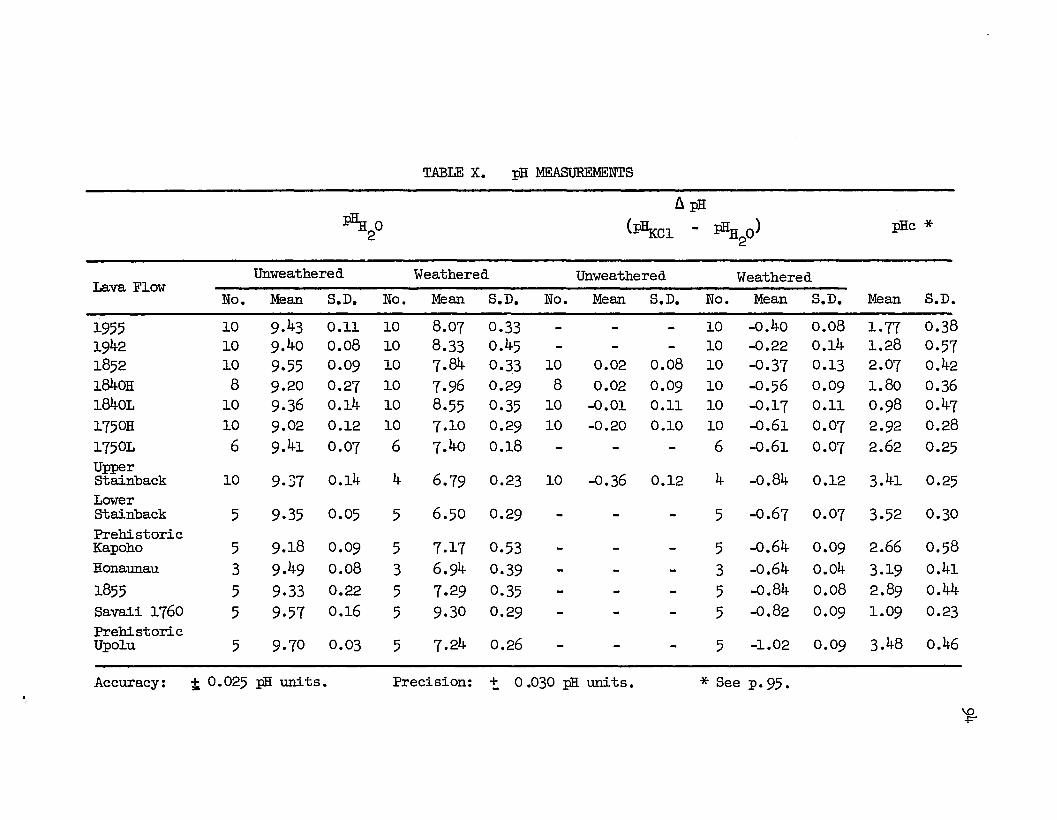
TABLE X. pH MEASUREMENTS
~pH
l'1I:H20 (~Cl - ~O) pHc*
2
Unweathered Weathered Unweathered WeatheredLava Flow
No. Mean S.D. No. Mean S.D. No. Mean S.D. No. Mean S.D. Mean S.D.
1955 10 9.43 0.11 10 8.07 0.33 - - - 10 -0.40 0.08 1.77 0.381942 10 9.40 0.08 10 8.33 0.45 - - - 10 -0.22 0.14 1.28 0.571852 10 9.55 0.09 10 7.84 0.33 10 0.02 0.08 10 -0.37 0.13 2.07 0.421840H 8 9.20 0.27 10 7.96 0.29 8 0.02 0.09 10 -0.56 0.09 1.80 0.361840L 10 9.36 0.14 10 8.55 0.35 10 -0.01 0.11 10 -0.17 0.11 0.98 0.471750H 10 9.02 0.12 10 7.10 0.29 10 -0.20 0.10 10 -0.61 0.07 2.92 0.281750L 6 9. 41 0.07 6 7.40 0.18 - - - 6 -0.61 0.07 2.62 0.25Upper
0.14 4 6.79 -0.36 4 -0.84 3.41Stainback 10 9.37 0.23 10 0.12 0.12 0.25LowerStainback 5 9.35 0.05 5 6.50 0.29 - - - 5 -0.67 0.07 3.52 0.30PrehistoricKapoho 5 9.18 0.09 5 7.17 0.53 - - - 5 -0.64 0.09 2.66 0.58Honaunau 3 9.49 0.08 3 6.94 0.39 - - - 3 -0.64 0.04 3.19 0.411855 5 9.33 0.22 5 7.29 0.35 - - - 5 -0.84 0.08 2.89 0.44Savaii 1760 5 9.57 0.16 5 9.30 0.29 - - - 5 -0.82 0.09 1.09 0.23PrehistoricUpolu 5 9.70 0.03 5 7.24 0.26 - - - 5 -1.02 0.09 3.48 0.46
Accuracy: ; 0.025 pH units. Precision: + o.030 pH units. * See p. 95.
\0-I=""

95
measurable C.E.C. in either case suggesting that the LipR measurements
are not reflecting charge density but rather differences in the solu-
bility of rock constituents. Apparently solubility changes with weather-
ing.
All differences between pRH20 values for unweathered and weathered
rocks are significant at the 9% level of probability. The difference
in pHH20 measurements between U and W samples in anyone flow appears to
be a useful index of weathering, indicating the extent to which the rock
has been leached of bases. The average pRH20 value for all the dated U
rocks from aa flows (excepting 1750H, see below) is 9.39, that for the
undated aa flows is 9.35, and for the two Samoan pahoehoe flows is 9.63.
The value for the 1750H site (9.02) looks rather low by comparison and
suggests again that the U rocks from this site are in fact somewhat
weathered. The value of 9.41 for the 1750L site (same flow) appears to
be nearer the true value. This figure was used for the 1750H site in
calculating the pR change value, discussed below.
The pH change (henceforth referred to as pRc) is another useful index
of weathering calculated from the mean di fference between PER ° of the2
U rocks and pRKCl of the W rocks (Table X), i.e.
pRc =n
~ (I>l1<:Cl of W rocks)
n
where n =number of rock samples measured.
This parameter was found to have a higher correlation coefficient with
time (0.58) than other pH measurements (see Appendix IV) and proved to be
a useful index of age.
Litter pH
Litter pH measurements for each of the major species occurring on the
sites samplt7d were made in order to characterize the effects of major
species on soil development (see discussion under "Effective Plant
Factor").
Species No. of Samples ~
Metrosideros polymorpha 4 4.32
Dicranopteris linearis 2 4.05
Cibotium sp. 2 3.82
Pandanus tectorius 4 7.10
Sherman and Kanehiro (1948) reported values of 3.9 and 3.8 for the
leaf moulds of Metrosideros and Dicranopteris respectively.
Hydration Changes
Weight -Loss Measurements
The 110 - 3500 C. weight-loss measurements (Table XI) were made in
order to measure the amount of water gained by hydration and hydrolysis
of primary minerals during weathering. The weight-loss measured in this
way includes both hydroxyl water and adsorbed water. Kelley et ale
(1936) working with minerals and soil colloids, found that most of the
loss below 4000 C. was adsorbed water. However, they found that OH ions
bought to the surface with grinding were released at lower temperatures.
The precision given is for the weathered rocks only. With the very
small weight-losses of some of the unweathered rocks the percentage
precision for duplicate measurements was usually high and occasionally
exceeded 10o{o. It may be noted also that the standard deviation for
different unweathered samples from the same flow, sometimes exceeded the
mean.

97
TABLE XI. 110 - 3500 C. WEIGHT-LOSS MEASUREMENTS(Percentages of 1100 C. wt.)
Flow Unweathered WeatheredNo. Mean S.D. No. Mean S.D.
1955 10 +0.05 0.07 10 0.80 0.20
1942 10 0.06 0.05 10 0.78 0.36
1852 10 0.06 0.06 10 0.94 0.65
1840H 8 0.25 0.09 10 1.21 0.20
1840L 10 0.03 0.04 .6 0.75 0.28
1750H 10 0.20 0.08 6 2.03 0.45
1750L 6 0,03 0.08 6 2.15 0.45
Upper Stainback 10 0.09 0.02 4 3.28 0.44
Lower Stainback 5 0.24 0.04 5 2.87 0.81
PrehistoricKapoho 5 0.17 0.01 5 1.97 0.61
Honaunau 3 0.17 0.05 3 2.41 0.57
1855 5 0.11 0.02 5 0.93 0.27
Savaii 1760 3 0.22 0.02 3 0.44 0.03
PrehistoricUpo1u 5 0.05 0.04 5 1.66 0.33
. Precision: 0.11 i;, 0.0% (9 determinations)

98
All differences between U and W rocks were significant at the 9%
level of probability. The weight losses for the U rocks of dated flows
averaged 0.13% and it seems likely that the value for a sample of newly
formed lava would be less than 0.05%. With this assumption, the weight
losses for the W rocks can be taken as an index of weathering on basalt
flows without correction for differences between flows at time zero of
soil formation. This parameter gave the highest correlation coefficient
with time (0.68) of any parameter measured and proved to be a useful
age index (see Appendix IV).
Comparing the values for U rocks between the two 1840 sites and
between the two 1750 sites it seems probable that the U rocks of the
l840H and l750H sites are slightly weathered. Both the H sites are in
cooler, higher rainfall areas than the L sites.
Rehydration Measurements
Weight gains on rehydration at 50, 79 and 9'21fo relative humidities
were small. The mean weight gains expressed as percentages of the 3500 C.
rock weight are shown below. All samples are from the 1852 site.
Relative Humidity U Rocks (2 samples) WRocks (4 samples)
5~ 0.07% 0.12%
79 0.14 0.21
98 0.16 0.46
Other rehydration weight-gains measured on two groups of 6 samples
ranged between 0.1% (5~ R.H.) and 0.98% (9'21fo R.H.) for the 1942 flow,
and 0.08 (5~ R.H.) to 0.43% (9'21fo R.H.) for the Upper Stainback flow.
Since variability was high and there appeared to be little relation to
age of rock, these lOOasurements were not made on other flows.

99
Hydration-rinds
Thin sections were prepared of lava droplets from the 1840, 1793
and 1750 flows of Kilauea and from the Lower Stainback flow of Mauna Loa.
Microscopic examination with normal viewing and cross niccols showed a
micro -crystalline structure with only isolated small areas of inter
stitial glass. Other sections of scoriaceous material were examined in
which a glassy matrix was present but there was insufficient glass at the
rock surface for any hydration-rind to be seen. This method of aging
appears unsuitable for basalt flows.
Oxidation Changes
A mVt values were obtained by subtracting the potential at the
varied time intervals of measurement from the potential at the beginning
of the experiment (Bardossy and Bod 1961). AmVt values were measured
in the range -58 mv to +269 mv with samples from three flows, but there
was no relationship with age. The above authors used the potential
differences between experiments with different concentrations of oxidising
agent as a quantitative index of the oxidation state of the rock ( I!:A mV1
values). Values of -80 to -341 mv were measured in the present study but
again there was no rela"tionship to age.
Reference to Appendix I shows that the ferrous/ferric ion ratio can
vary widely from about 10:1 (1840 flow) to almost 1:1 (1942 flow) with
associated large differences in the quantity of ferrous ion. Ferrous ion
content is probably the chief variable affecting the oxidation potential
of the rock. Differences in ferrous ion content between the flows
examined may be obscuring differences in the oxidation state that have
resulted from weathering.

100
Mineralogical Changes
Fels~ars and Pyroxenes
Figures 17 - 19 are exam~les of the ~owder diffraction ~atterns
obtained with sam~les from three aa flows (1942, 1852 and U~~er Stain
back) and two ~ahoehoe flows (1881 and 1855). Table XII gives the
three strongest X-ray reflections for common basaltic minerals (Smith
1960) and the wavelengths of the strongest ~aks found in the ~owder
sam~les examined.
The most clearly defined and consistently occurring ~eaks are at:
3.18 - 3.20A (inte~reted as ~lagioclase felspars and h~ersthene),
2.99A (clinopyroxenes such as ~igeonite and augite), 2.90 - 2.92A (lower
intensity ~eak for h~ersthene with other unidentified minerals) and
2.5lA (iron oxides and olivine). Clearly defined ~eaks for forsterite
a~~eared only in ~atterns from the olivine-rich 1852 and Stainback aa
flows, and in the 1855 ~ahoehoe flow. Although these inter~retations
are by no means unequivocal, Macdonald and Katsura (1964) found either
pigeonite, hy~ersthene or both minerals in coarse-grained tholeiitic
rocks. Augite was usually ~resent as well. They were not able to iden
tify the groundmass pyroxenes in fine-grained rocks.
Differences in ~article size, ~acking and preferred orientation
prevent a quantitative com~arison of mineral composition between flows.
This difficulty can be overcoIOO to some extent by working with internal
ratios of minerals and the differences in these ratios between samples.
Table XIII lists values for plagioclas~ / pigeonite and pigeonite /
th~ersthene' ratios based on measurements from diffraction patterns.
Since the h~ersthene identification is uncertain, this measurement is best

Figure 17. X-ray powder patterns of 1942 (left) and 1852 (right)
I-'
~
aa samples. (u = unweathered and W =weathered rocks)

2-51 2'55 2·93 2·99 3'18A
u
w
2'4520S0 2·76 2·99 3'20A
u
w
36-~~ 3"2 30 z8~~26
DEGREES 293'6 .~-. 32 30' 28 . 26
DEGREES 29

Figure 18. X-ray powder patterns of 1881 (left) and 1855 (right)
pahoehoe samples. (U = unweathered and W = weathered rocks)
I-'ow

2'51 2'91 299 318A
u
vw
2-51 2'~ 2-99 3-18A
u
vw
--3. . 34 31' 50 . 28 . 2i
DEGREES 29. --3& 34 32· 30 28 26
DEGREES 29

105
Figure 19. X-ray :powder :patterns of U:p:per
Stainback aa sam:p1es.
(U = unweathered and W =weathered
rocks)

2·51 2·90 2'99 3'18 A
u
w
•36 3'0
DEGREES 29
28 26

TABLE XII. DIFFRACTION PEAKS FOR STAIIDARD MI:NER.ALS AND MINERALS FOUND INHAWAIIAN ROCKS
Mineral Diffraction peaks (A)in Order of Intensity
Diffraction PeaksFotmd in
Hawaiian Samples
Interpretation
Hypersthen~ 3.?P_ 2.89 ._1. 49
Labradorite 3.203.20
3.184.07
4.042.53
3.18-3.20Plagioclase felsparsand hypersthene
Augite 2.99 1.62 1.43 2.99
2.89, 2.90-2.92
Clinopyroxene, e.g.pigeonite, augite
Hypersthene and tmidentified minerals
Fayalite
Forsterite
IJ.m.enite
Hematite
MagnetiteMagllemite
2.83 2.50 2.572.82 2.50 1.782.77 2.52 3.892.77 2.51 2.462.77 3.88 2.51
2.74 1.72 2.54
2.69 2.51 1.692.53 1.48 2.972.51 1.47 2.95
2.76-2.77
2.54-2.552.51
2.442.44-2.46
Olivine
TitanomagnetiteTitanomagllemite
?
I-'o-..:J

TABLE XIII. PLAGIOCLASE/PIGEONITE AND PIGEONITE/HYPERSTHENE RATIOS
Plagioclase/Pigeonite Pigeonite/'Hypersthene l
FlowNo. Peak Heights* Ratio No. Peak Height Ratio WRatio
Plag. Pign. Hyper. U Ratio
1942 (aa) U 4 59.0 42.0 1.40 3 25.5 1.65 } 0.88" W 4 56.5 37.5 1.51 3 25.8 1.45
1852 (aa) U 4 43.0 39.5 1.09 4 22.0 1.80 }
" 4 41.0 1.14-0.98
W 36.0 2 20.5 1.76UpperStainback U 4 43.0 36.5 1.18 4 22.0 1.66 }
(aa) loll
" W 4 29.5 42.5 0.69 4 23.0 1.85
1881(pahoehoe) U 2 55.3 39.0 1.42 2 25.0 1.56 } 0.88
" VW 2 15.8 11.0 1.44 2 8.0 1.381855(pahoehoe) U 2 57.8 45.0 1.28 2 27.0 1.67 } 1.90
" VW 2 18.5 19.0 0.97 2 6.0 3.17
*Arbitrary units.
I-'oCP

109
treated simply as a 2.90 - 2.92A peak. The three aa flows chosen give.
an indication of the weathering trend that occurs in a high-rainfall
zone between 3000 and 4000 feet elevation. The se flow's all have similar
mean annual temperatures (c. 60° F.) and occur in rainfalls varying from
140 to 210 inches.
The changes in the plagioclase/pigeonite ratios between unweathered
and weathered rocks of the aa flows, suggest that the rate of weathering
of pigeonite is at first more rapid than that of plagioclases, but with
increasing time the plagioclases are lost more rapidly. The very
weathered (VW) samples are surface glassy crusts of pahoehoe (p. 35).
The losses of all minerals between U and VW rocks (Fig. 18) are so great
that little significance can be attached to the differences in plagio
clase/pigeonite ratios.
The change in pigeonite/'hypersthene ' ratios between weathered
and unweathered rocks (also expressed as a ratio in Table XIII) shows
an increase with time. It is difficult to interpret this in terms of
absolute changes of the two minerals represented. However, the more
weathered conditions of the glassy pahoehoe crusts is again evident.
Further work on this aspect was not attempted because of the diffi
culty of quantifying the changes observed.
Oxide Minerals
No peaks corresponding to the first-order reflections for ilmenite
were recorded. The 2.51 - 2. 55A group of X-ray peaks, believed to include
oxides such as titanomagnetite and titanomaghemite, usually showed
changes in shape and numbers of peaks between weathered and unweathered
samples (Figs. 17 - 19). In all samples there was a rise in the

110
backgrmmd intensity of radiation from unweathered to weathered rocks.
This change increases with age of flow and degree of weathering. It
can be taken as a measure of the concentration of iron that has taken
place, particularly on crystal surfaces, which is causing increased
scatter of copper radiation from the target tube.
Since titanomaghemite in soils is largely an oxidation product
formed during weathering !'rom titanomagnetite (Matsusaka, Sherman and
Swindale 1964), an endeavor was made to determine relative amounts of
these two minerals. The three most intense diffraction peaks for
magnetite occur at 2.53, 1.48 and 2.97A and the corresponding figures
for maghemite are 2.51, 1.47 and 2.96A (Rooksby 1961). The equivalent
peaks for titanomagnetite and titanomaghemite differ from these values
slightly depending on the degree of substitution by titanium and other
minerals.
X-ray diffraction patterns of samples !'rom the 1852 and Upper
Stainback flows examined with iron radiation failed to show distinguish
able titanomagnetite and titanomaghemite peaks. The most intense
reflections of these minerals appear to be mixed with dif!'raction peaks
of olivine. Other iron oxide peaks were too small to distinguish.
Two samples !'rom the Upper Stainback flow, one unweathered and one
weathered, were examined using the magnetic susceptibility machine. The
heating and cooling curves obtained showed some differences but the
amount of magnetic minerals was too small to allow reliable measurements.
A difficulty with this method is that other minerals can contribute to
the magnetic susceptibility so that a true measure of the magnetite
maghemite ratio is not possible.
Separation of the magnetic !'raction using a hand magnet was done

111
with some samples. The possibility of using heavy liquids such as
Clerici solution for separating the heavy minerals was also considered.
The magnetic fraction separated by magnet was too small for analytical
purposes. Since the glass content included with the magnetite is variable
and dilutes the magnetic fraction separated, this approach was discon-
tinued.
Elemental Changes
Silicon and Aluminum
The results for these determinations are given in Table XIV.
Accura~y can be gauged by comparing the values obtained for unweathered
rocks with published analyses of previously collected samples from
different parts of the flow (Appendix I). The 1852 silica results show
close agreement but those for the 1942 flow average 2.6% of Si02 less
than the published figure. With alumina, the measurements obtained are
1 - 2% of Al ° lower than the figures pUblished. Thus these results2 3
can be used to compare the flows sampled but not as measures of the total
silicon and aluminum present.
The silica measured in the 'unweathered' 1750 samples is consider-
ably lower than the average for other unweathered rocks suggesting, in
accordance with earlier evidence (see pH and weight-loss measurements),
that these rocks are weathered.
The 'unweathered' sample s from the Upper Stainback flow are from
the centers of 30 - 60 cm diameter boulders about 45 cm below the surface.
Other analyses (sodium and calcium, not reported) showed that these
samples were more weathered than later samples collected from the centers
of large boulders split during recent road construction. These later

TABLE XIV. CHANGES IN TOTAL SILICON (Si02) .AND .ALUMINUM (Al203
)
Unweathered WeatheredElementas Oxide Flow No. Mean% S.D. No. Mean% S.D. P % Change
Si02 1942 3 49.46 2.54 3 46.70 3.90 N.S.
" 1852 4 48.18 1.59 5 46.68 1.70 ~ 0.05 -3.1
" 1750* 6 40.05 1.70 6 41.24 2.34 <: 0.05 +3.0
" Upper Stainback* 3 47.52 1.55 4 42.89 3.07 <:: 0.01 -9.8
Al203 1942 3 11.48 0.31 3 11.09 0.74 N.S.
" 1852 3 9.43 0.98 3 8.06 0.23 <0.01 -14.5
" Upper Stainback* 3 9.32 1.70 3 9.79 0.59 N.S.
*Unweathered samples from these flows are partially weathered.
Precision for Si02 =0.74 + 0.46% (6 determinations)-Precision for Al20
3 =0.72 + 0.31% (4 determinations)-
I-'I-'I\)

113 .
samples were used as an unweathered baseline for all subsequent analyses .
but silicon and aluminum determinations were not made. Thus the loss of
silicon and concentration of aluminum on the Upper Stainback flow are
almost certainly greater than the measurements reported in Table XV.
The difficulty of getting an unweathered sample together with the
rather large sample variability halted further work on silicon as a
possible age index. Neither does aluminum appear suitable because of the
apparent reversal in the direction of its change: a loss in the 1852 flow
followed by what is probably an incipient gain in the Upper Stainback.
Calcium and Sodium
Total calcium and sodium analyses are sunnnarized as oxide percent
ages in Tables XV and XVI. The results of analyses of unweathered rocks
from the 1955, 1942, 1852 and 1840 flows are similar to previously pub
li shed analyse s which are shown in Appendix I,.
The results from the Honaunau flow show a rather high calcium figure
and this, together with the high standard deviation, make this measure
ment suspect.
In general it appears that sodium is being lost at more than twice
the rate of calcium. This may make sodium a more useful index of weather
ing' and thus age, during the first two or three hundred years of
development, but for older flows calcium may be more useful.
Potassium and Magnesium
The potassium and magnesium changes measured are sunnnarized in
Table XVII. The concentration of magnesium with weathering on the Upper
Stainback flow is unexpected since these particular samples were collected
from beneath Metrosideros roots (see 'Vegetation Effects', p. 119).

114
TABLE XV. CHANGES IN TOTAL CALCIUM (CaO)
Unweathered Weathered
Flow No. Mean% S.D. No. Mean% S.D. P % Loss
1955 10 9.29 0.21 10 9.02 0.23 c:: 0.05 3.0
1942 10 10.48 0.17 10 10.28 0.54 N.S.
1852 10 8.07 0.30 10 7.69 0.25 c::: 0.01 4.8
1840H 8 7.33 0.21 10 7.16 0.24 N.S.
1840L 10 7.36 0.28 10 7.56 0.26 N.S.
1750H 10 10.22 0.20 10 9.74 0.13 c::: 0.01 4.7
1750L 6 10.09 0.17 6 9.90 0.32 N.S.
UpperStainback 9 9.77 0.27 4 8.37 0.09 c::= 0.01 14.3
LowerStainback 5 9.72 0.11 5 8.79 0.07 <0.01 9.6
Prehistoric 5 10.00 0.23 5 9.94 0.21 N.S.Kapoho
Honaunau 3 11.45 1.71 3 8.57 0.52 <0.05 25.2
1855 5 10.10 0.17 5 9.85 0.22 c::= 0.1 2.4
Samoa 1760 3 9.58 0.09 3 9.50 0.15 N.S.
Upolu 5 10.45 0.21 5 10.34 0.20 N.S.
Accuracy = 0.35 ~ 0.34% (5 determinations)
Precision = 0.12 t 0.0% (8 determinations)

115
TABLE XVI. CHANGES IN TOTAL SODIUM (Na2O)
Unweathered Weathered
Flow No. Mean% S.D. No. Mean% S.D. P %Loss
1955 10 3.11 0.09 10 2.84 0.07 <0.01 8.4
1942 10 2.34 0.06 10 2.18 0.06 < 0.01 7.2
1852 10 1.70 0.17 10 1.45 0.08 <:0.01 15.0
1840H 8 1.49 0.06 10 1.36 0.06 < 0.01 9.3
1840L 10 1.65 0.09 10 1.64 0.05 N.S.
1750H 10 2.52 0.14 10 2.20 0.09 -=: 0.01 13.0
1750L 6 2.58 0.03 6 2.49 0.05 <0.01 3.4
UpperStainback 9 2.53 0.06 4 1.31 0.11 < 0.01 48.3
LowerStainback 5 2.23 0.04 5 1.71 0.09 <:0.01 23.5
PrehistoricKapoho 5 2.41 0.07 5 2.18 0.09 -=: 0.01 9.6
Honaunau 3 2.69 0.62 3 1.92 0.15 N.S.
1855 5 2.42 0.07 5 2.44 0.08 N.S.
Samoa 1760 3 3.11 0.02 3 3.06 0.06 N.S.
Upolu 5 3.10 0.26 5 2.52 0.13 <0.01 19.0
Accuracy = 0.07 + 0.07% (9 determinations)-Precision = 0.07 + 0.04% (10 determinations)-

TABLE XVII. CHANGES IN TOTAL POTASSIUM (K20) .AND MAGNESIUM (MgO)
Elementas Oxide Flow
Unweathered
No. Mean% S.D.
Weathered
No. Mean% S. D. p % Change
K20 1750H 10 0.51 0.02 10 0.51 0.02 N.S.
" Upper Stainback 10 0.42 0.04 0.36 0.02 <.0.05
MgO 1852 5 17.13 0.60 5 16.61 0.77 N.S.
" 1750H 10 3.32 0.24 10 3.28 0.27 N.S.
" Upper Stainback* 5 7.90 0.47 5 8.93 0.25 <. 0.01
...iEWeathered samples for this analysis came from under tree roots (see p. 119).
Accuracy for K20 = 0.07 t. 0.05% (4 determinations)
Precision " " = 0.014 ~ 0.004% (4 determinations)
Accuracy for MgO = 0.19 ! 0.13% (4 determinations)
Precision " " = 0.26% (2 determinations)
-13.6
+13.1
I-'
~

117
Iron
Analyses for total iron (as Fe203) carried out by the Rocky Mountain
Geochemical Corporation showed wide divergence from published data and
the accuracy of these analyses is thus suspect. They may have some
value for comparing weathered and unweathered samples. The results
showed no significant gains in iron for the 1942 and 1852 flows but
showed a gain of 4C1fo of the amount of iron originally present for the
Upper Stainback flow. Losses of iron, in excess of 5C1fo of the amount
originally present, were measured for the very weathered glassy crusts
of the 1881 and 1855 flows.
Titanium
Analyses for this element are given in Table XVIII and in general
show significant gains that increase in magnitude with time. Perhaps
the most surprising result is the relatively large gain in Ti02 measured
with the 1840L samples, in contrast to the 1840H samples, where no
significant gain was found. This may be related partly to the more
marked dry periods of the 1840L site (p. 89 ).
Strontium
The measurements made on the Upper Stainback samp~es show that
strontium is being lost with weathering (Table XIX). However, since no
significant differences could be found between weathered and unweathered
rocks from dated flows, no further strontium measurements were made.
Manganese and Nickel
Comparison of count rates between unweathered and weathered samples
from the 1852 and Upper Stainback flows showed no significant differ
ences for either manganese or nickel.

118
TABLE XVIII. CHANGES IN TOTAL TITANIUM (Ti02)
Unweathered Weathered
Flow No. Mean% S.D. No. Mean% S.D. P %Gain
1955 10 3.84 0.10 10 3.91 0.03 < 0.1 1.8
1942 10 2.09 0.02 10 2.09 0.05 N.S.
1852 10 1.74 0.05 10 1.77 0.04 <0.1 2.2
1840H 8 1.73 0.05 10 1.74 0.04 N.S.
1840L 10 1.81 0.09 10 1.90 0.08 < 0.05 5.2
1750H 10 2.87 0.06 10 2.94 0.04 < 0.01 2.3
1750L 6 2.79 0.05 6 2.89 0.05 <0.01 3.5
Upper Stain-back 10 2.13 0.05 4 2.78 0.27 < 0.01 14.8
Lower Stain-back 5 1.83 0.07 5 2.30 0.08 < 0.01 25.8
PrehistoricKapoho 5 2.76 0.02 5 3.07 0.11 < 0.01 11.5
Honaunau 3 2.13 0.03 3 2.59 0.13 < 0.01 21.9
Upolu 5 3.75 0.03 5 4.30 0.11 < 0.01 14.7
Accuracy = 0.07 t 0.07'10 (10 determinations)Precision = 0.07 t 0.05% (9 determinations)
TABLE XIX. CHANGES IN TOTAL STRONTIUM (Sr p.p.m. )
Unweathered WeatheredP
Flow No. Mean S.D. No. Mean S.D.
1942 4 520 7 4 530 9 N.S.
1852 4 470 26 4 480 19 N. S.
Upper Stain- 2 510 4 260 50 < 0.01back
Accuracy = 30 ! 24 ppm (7 determinations)Precision = 85 t 47 ppm (5 determinations)

119
Vegetation Effects
It is important to know whether there is any significant change in
the rate of rock weathering following establishment of Metrosideros
trees. The 1750L site was chosen for a comparison between rocks from
beneath a Metrosideros canopy and nearby surface rocks partially covered
by lichens (Table XX). The Metrosideros sample was collected from under
trees that looked to be at least 100 years old. All the differences
found were small but sodium loss is definitely faster under trees. It
seems probable that the calcium loss and 110 - 350°C. weight loss would
have been found to be significantly greater under trees as well had it
been possible to analyse a larger number of samples.
On the Upper Stainback flow recent bUlldozing had overturned
several Metrosideros trees and samples of weathered rocks were collected
from beneath trunks or large roots. After analyses were completed it
was realized that this had biassed the sample. The comparison between
these results and those from weathered rocks collected in the usual way
(Table XXI) suggests that rocks immediately underneath a large tree are
protected from leaching and are markedly different from surrounding sur-
face rocks.
Weathering and Vegetation Development on Pahoehoe andAa Flows
Surface Glassy Crusts of Pahoehoe
Table XXII compares the measurements made of surface glassy crusts
(vw = very weathered samples) from the 1855 and 1881 pahoehoe flows with
those of weathered (W) rock samples from the 1852 aa flow. The sampling
sites were between 3660 and 3800 feet in altitude. From these figures it
appears that pahoehoe surfaces weather much more rapidly than small rocks
on aa surfaces.

TABLE XX. COMPARISON OF ROCKS WEATHERED UNDER A MEmOSIDEROSCANOPY WITH THOSE FROM ADJACENT BARE LAVA (1750L SITE)
120
Variable Measured
Weight loss %
Under Trees Bare Lava(6 samples) (6 samples) pMean S.D. Mean S.D.
7.40 0.18 7.37 0.16 N.S.
2.62 0.25 2.69 0.17 "2.49 0.05 2.59 0.06 <: 0.05
9.90 0.32 9.97 0.29 N.S.
2.15 0.45 2.02 0.22 "
TABLE XXI. COMPARISON OF ROCKS WEATHERED BENEATH METROSIDEROSROOTS WITH THOSE WEATHERED AMONG ROOTS:
UPPER STAINBACK FLOW
Variable Measured Beneath Roots Among Roots p(6 samples) (4 samples)Mean S.D. Mean S.D.
pHH20 7.26 0.23 6.79 0.23 <: 0.05
pHe 3.12 0.29 3.41 0.25 <: 0.01
Na20 % 2.21 0.10 1.31 0.11 <: 0.01
CaO % 9.75 0.12 8.37 0.09 <: 0.01
K20 % 0.44 0.02 0.36 0.02 <: 0.01
Ti02 % 2.23 0.06 2.78 0.27 <: 0.01
Weight loss % 1.17 0.56 3.28 0.44 <: 0.01
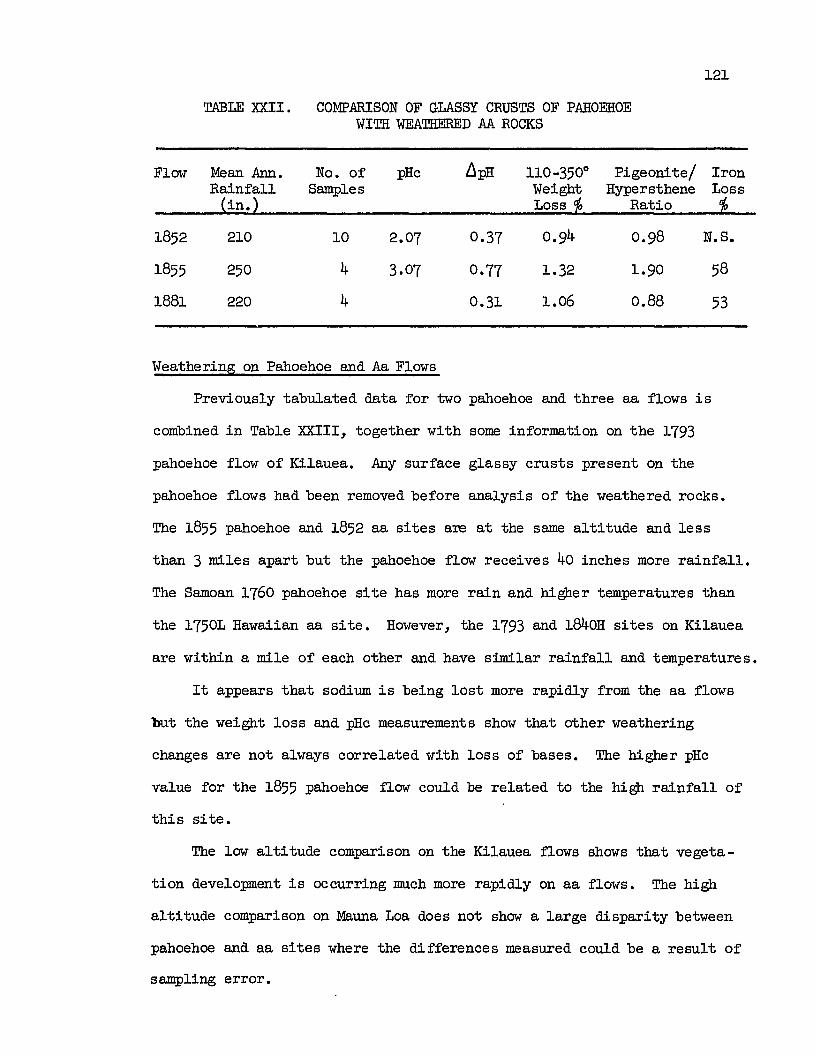
121
TABLE XXII. COMPARISON OF GLASSY CRUSTS OF PAHOEHOEWITH WEATHERED AA ROCKS
Flow Mean Ann. No. of pHc LlpH 110-350° Pigeonite/ IronRainfall Samples Weight Hypersthene Loss
(in.) Loss % Ratio %
1852 210 10 2.07 0.37 0.94 0.98 N.S.
1855 250 4 3.07 0.77 1.32 1.90 58
1881 220 4 0.31 1.06 0.88 53
Weathering on Pahoehoe and Aa Flows
Previously tabulated data for two pahoehoe and three aa flows is
combined in Table XXIII, together with some information on the 1793
pahoehoe flow of Kilauea. Any surface glassy crusts present on the
pahoehoe flows had been removed before analysis of the weathered rocks.
The 1855 pahoehoe and 1852 aa sites are at the same altitude and less
than 3 miles apart but the pahoehoe flow receives 40 inches more rainfall.
The Samoan 1760 pahoehoe site has more rain and higher temperatures than
the 1750L Hawaiian aa site. However, the 1793 and 1840H sites on Kilauea
are within a mile of each other and have similar rainfall and temperatures.
It appears that sodium is being lost more rapidly from the aa flows
but the weight loss and pHc measurements show that other weathering
changes are not always correlated with loss of bases. The higher pHc
value for the 1855 pahoehoe flow could be related to the high rainfall of
this site.
The low altitude comparison on the Kilauea flows shows that vegeta-
tion development is occurring much more rapidly on aa flows. The high
altitude comparison on Mauna Loa does not show a large disparity between
pahoehoe and aa sites where the differences measured could be a result of
sampling error.
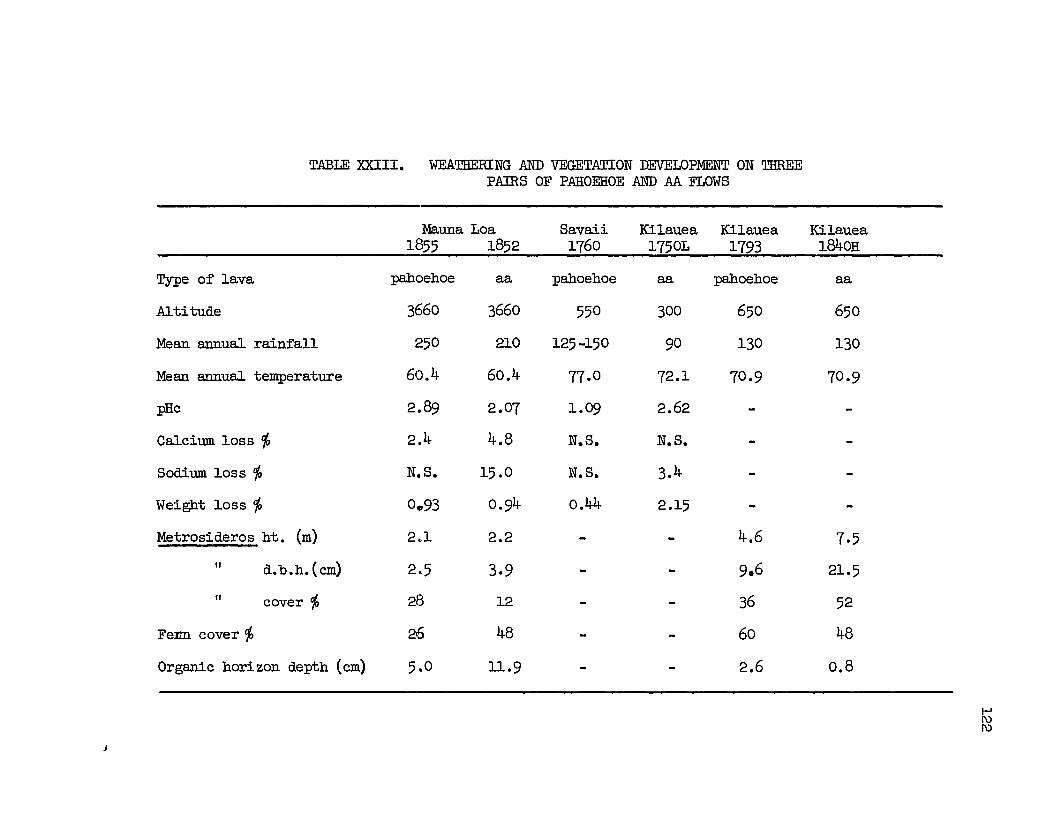
TABLE XXIII. WEATHERING AND VEGETATION DEVELOPMENT ON T8REEPAIRS OF PAHOEHOE AND AA FLOWS
Mauna Loa Savaii Kilauea Kilauea Kilauea1855 1852 1760 1750L 1793 1840H
Type of lava pahoehoe aa pahoehoe aa pahoehoe aa
Altitude 3660 3660 550 300 650 650
Mean annual rainfall 250 210 125-150 90 130 130
Mean annual temperature 60.4 60.4 77.0 72.1 70.9 70·9
pRc 2.89 2.07 1.09 2.62
Calcium loss % 2.4 4.8 N.S. N.S.
Sodium loss % N.S. 15.0 N.S. 3.4
Weight loss % 0..93 0.94 0.44 2.15
Metrosideros ht. (m) 2.1 2.2 - - 4.6 7.5
II d.b.h.(cm) 2.5 3.9 9.6 21.5- -II cover 'fa 28 12 36 52- -
Fenn cover % 26 48 - - 60 48
Organic hori zon depth (cm) 5.0 11.9 - - 2.6 0.8
I-'(\)(\)
J

AGE DETERMINATIONS
Multiple linear regression methods were considered to have the
greatest potential for estimating the ages of the undated prehistoric
flows. Using the data from the dated flows, regression equations were
computed with time as one of the variables. Such equations could then
be solved for time using measurements from the undated flows. Two
questions to be answered were:
(i) What variables should be used in the regression equations
and how should they be expressed?
(ii) Row could the "best" regression equation be selected?
Variables for Regression
Weathered Rock Parameters
Six parameters of the weathered rock were selected from those
measured as having greatest potential for age indices. These were
ApR, PH change, 110-350o C. weight lOSS, calcium loss, sodium loss, and
titanium gain. Three additional variables, derived from the above, were
also used in the regression equations: sodium loss relative to titanium
gain, calcium loss relative to titanium gain, and the combined loss of
calcium + sodium.
The regression analysis was made using the data for these variables
from the 5 historic aa flows (7 sites in all). Measurements had been
made on 10 samples from each of 6 sites while the seventh site (1750L)
had 6 samples. Thus there was a total of 66 groups of measurements from
flows ranging in age from 13 to 218 years.
The mean of the 10 unweathered samples was taken as the best estimate
of the original value of the variable in the unweathered lava. Changes

124
in pH, and elemental losses and gains were then calculated for each of
the 10 weathered samples using this mean as a baseline. On aa flows
there is no logical basis for pairing weathered and unweathered samples.
With the ApR and weight-loss measurements, only those from the
weathered rocks were used in the regression analysis.
The sodium and calcium losses relative to titanium were calculated
using a method based on that of Reiche (1943):
( V x Tiux 100)%loss = 100 w where V is thew
Vu x Tiw
measurement of sodium or calcium in the weathered rock, V is the meanu
of the sodium or calcium measurements for the unweathered samples, and
Tiw and Tiu are the means of the titanium measurements for weathered and
unweathered rocks. This calculation makes no assumptions about the
'constancy' of titanium but stretches the scale of differences.
All the above variables were used both as dependent and independent
variables in the regression equations.
Soil and Vegetation Parameters
Two parameters were .used in the regression analysis: depth of the
soil organic horizon and log. of tree volume.
Climatic Factors
Each site was given a single value for temperature and for rainfall.
A temperature x rainfall interaction was also used as an independent
factor in the regression analyses. Mean annual temperatures were calcula-
ted from the data of Blumenstock and Price (1967) using a lapse-rate of
3.5°F •/1000 feet. Mean annual rainfalls were taken from the map by the
same authors (see Table II).

125
Parent Material Factors
Four properties of the parent material were used: porosity, texture,
titanium content, and the combined calcium + sodium content~ Porosity
and texture were assessed for individual sample$ as described under
"Analytical Methods". The single value s for each site used in the
regression analysis were means of the individual ratings given to the
unweathered rocks. Titanium and the combined calcium + sodium contents
of the parent material were obtained from the mean values of the
unweathered samples.
Age
The age in years of each historic flow was calculated using 1968
as a baseline.
TopOgraphy
Since sampling was restricted to sites of less than 10° slope, the
effects of topography were assumed to be the same for all sites.
Effective Plant Factor
Jenny (1941, 1958, 1961) in developing his factorial approach to
soil genesis and ecosystem development, treated the biotic factor as
comprising all those species, or their propagules, which may migrate or
be carried into the ecosystem. With this approach, vegetation within
the ecosystem is a dependent variable or resultant, whereas the biotic
factor is relatively independent of the ecosystem studied and determines
the potential vegetation of the system. Jenny (1958) suggested that a
list of the species in the ecosystem and those living in the surrounding
area could be used to characterize the total biotic factor.
Crocker (1952) pointed out that in any particular case only some of
these species are effective pedogenetically, namely, the species present

126
in the system and those formerly present but lost during its development.
He suggested that an effective plant factor could be measured by listing
these species, using successional studies to indicate which had been
lost during development.
Species lists are difficult to quantify for analyses such as
correlation and regression. Furthermore, different species from differ
ent floral regions may have similar pedogenetic effects. Without knowing
what these effects are it is not possible to compare the biotic factor
of different ecosystems as we can compare temperature, rainfall or parent
material factors. As appreciated by Crocker (loc. cit.) the pedogenetic
effects of different plants are not simply associated with numbers.
Nevertheless, only those plants that have contributed a major portion of
the cover at any time during the succession need be considered. The
effects of many other plants are probably minor because of their small
size or number. The most needed information is how the major species
differ in their physical, chemical and biological effects on ecosystem
changes.
Because of the lack of information on the specific effects of plants
on pedogenesis, it was decided to use the litter pH of major species as
a measure of the chemical effect each might have. A major species was
defined as any species that had formed 2afo or more of the canopy at any
stage during the succession. For each major species the value 14 - litter
pH (=pOH) was calculated, which gives a scale from zero to 14 reflecting
the varYing effects on weathering of litters of different pH. The
effective plant factor for each site was calculated by averaging the
litter pOH of all major species. For example, on a 200 year old flow
where a major species A had been replaced by a major species B after 100

127
years, the effective plant factor would be:
(100 x litter paH of species A) + (100 x litter paH of species B)200
Effective plant factors for each site sampled on Hawaii are given
in Table XXIV together with the assumptions made in calculating these
factors.
An effective plant factor measured in this way is not wholly in-
dependent of the ecosystem studied. The degree of cover reached by a
particular species is partly related to local climate, parent material
and to time. Litter pH may be partly affected by site conditions.
However, the capacity of a species to affect soil and vegetation is
determined by its inherent physiological properties even though the
expression of these properties is conditioned by the particular eco-
system. The use of litter pH values is a first approximation towards
measuring differences between species in their pedogenetic effects and
thus quantify an effective plant factor to which differences in dependent
variables of the ecosystem (soil and vegetation properties) can be
related.
Climatic, parent material and effective plant factors are referred
to as site factors for the regression analyses and the values used are
given in Appendix II. Dependent variables are classified as either
weathered rock, soil or vegetation parameters.
Selection of Regression Equations
Two types of regression equation can be formed with the variables
discussed above. In the first, time can be treated as a dependent variable
and regressed against various combinations of the measured rock parameters
and site factors. In the second, a suitable parameter of the weathered
rock is chosen as the dependent variable and regressed against various

TABLE XXIV.
128
EFFECTIVE PLANT FACTORS FOR SITESSAMPLED
Flow Effective PlantFactor
1955 0.0
1942 0.0
1852 5.7
1840H 7.7
1840L 4.5
1750H 8.8
1750L 7.5
Upper Stainback 9.9
Lower Stainback 9.7
Honaunau 9.7
Prehistoric Kapoho 8.3
Assumptions
50 yrs for Dicranopteris to reach2dfO cover *-
30 years for Dicranopteris to reach2(jfO cover
60 years for Metrosideros to reach20% cover
20 years for Metrosideros to reach2dfO cover
50 years for Metrosideros to reach2dfO cover
Mean value of Metrosideros andCibotium litter pOH measurements
Metrosideros as major species foran unknown period of time
Metrosideros as major species foran unknown period of time
Mean value of Pandanus and Metrosideros litter pOH measurements
*An approximate time for a species to reach 20f0 cover was calculated
from the current percentage cover for that species and the age of the
siteo

129
combinations of site factors, other rock paraneters and time.
Krutchkoff (1967) using simulations, studied the first approach
when applied to the problem of calibrating a pressure gauge. He claimed
a uniformly smaller mean square error than that associated with the
second or classical procedure. However Williams (1969) pointed out
that the first approach gives estimates based on the false assumption
tbat tbe errors are independent of the values of the dependent variable,
thus violating tbe assumptions of a regression model. In an earlier
pUblication, Williams (1959) recommends using a classical type regression
equation in whicb the variable of interest (in this cas~ time) is solved
for inversely to give estimates together with confidence limits.
i.e. if Y = (?lo + ~TT + ja~X2 + ~3X3 + •••••••••• ~l Xj
then T = Y - ~o - ~2.X2 - f.>3X3 - ••••••••••••.• (?lj Xj
roTwbere Y = dependent variables, T = time, X2, X3 = other independent
variables and ~ 0 ••••••••• ~ j = regression coefficients.
Altbough both procedures were tried in the present study, the inverse
estimation method was used for the age deter.minations since it allows
statistically valid confidence limits to be calculated for time:
T=Y - A. - AX.
1""0 ""''''J J + residual mean square
(2)T
where t II the t statistic for n degrees of freedom wi tb 95 or 9%
confidence levels. These are the large sample confidence limits which
assume that the errors in estimating the regression coefficients are
small relative to tbe error in the regression equation. The sample sizes
used justify this assumption if inverse estimates are not attempted far

130
times too far beyond the data (Dr. R. Jones, Information Science Dept.,
University of Hawaii, pers. comm.).
A recent example of the use of an inverse procedure is that of
Julian and Fritts (1968). They first established a linear regression
relationship between tree-ring chronology and historic climatic data,
and then inverted this to derive climatic records from prehistoric
growth -ring sequences.
Initially, all the data from the dated flows was used in the
regressions but a number of these equations gave ages for prehistoric
flows that were clearly erroneous. Study of the residuals showed them
to be somewhat asymmetrically distributed. The correlation matrix
(Appendix IV) indicated that spurious correlations were arising because
the oldest flows (1840 and 1750) were at the lowest altitudes. Further
more, there were larger numbers of measurements for these two flows
both having two sampling sites. For these reasons the data from the
lower site of each (18401 and 17501) were excluded, leaving 5 flows with
one site per flow (50 sets of measurements = 49 degrees of freedom).
Separation of these lower sites from the remainder is probably
justified also on climatic grounds. Both sites are only partially
covered by vegetation whereas the l840H and l750H sites are completely
covered. The lower sites are fairly close to the coast where there is
apparently a greater tendency for summer-dry periods to occur. These
are accentuated by the excessively drained aa lava. The climate of the
remaining sites is both cooler and more humid.
Selection of the regression equation used for aging the Stainback
prehistoric flows was made by making several series of regressions and
then choosing the equation that met the following requirements most
completely:

131
1. Narrow confidence limits for time.
2. A high multiple R2 value (R = multiple correlation coefficient)
so that a large proportion of the total variability is
accounted for by the regression.
3. Statistically significant regression coefficients for the
variables used in the equation, particularly the regression
coefficient for time.
4. Residuals which when plotted against time do not show a trend.
Some equations with high R2 values gave ages that were very obvi
0usly incorrect. Presumably these equations did not describe any
general model of processes operating between the variables used.
Each of the weathered rock parameters together with their derived
variables (e.g. sodium loss relative to titanium, see preceding section)
were regressed on the variables of time, climate, parent material and
effective plants. Significant regression coefficients for time appeared
in only three cases: pRc, weight loss, and calcium loss relative to
titanium (Table XXV). The respective R2 values for each of these regress
ions were 65%, 55%, and 26%. From this it appeared that only pRc and
weight loss were likely to be useful age indices. A series of computer
runs was made in which pRc and weight lOSS, or their transgenerated
derivatives, were regressed on various combinations of variables. The
resulting equations were then tested for the requirements listed above.
The regression program (BMD02R) used in this work is a stepwise
procedure in which one variable is added at a time depending on which
makes the largest improvement in "goodness of fit". At later stages in
the regression a variable may be dropped, this being dependent on the F
level set for deletion of variables.

TABLE XXV. SUMMARY OF REGRESSIONS OF WEATHERED ROCK PARAMETERS ON INDEPENDENT VARIABLES: DATED FLOWS,
FIVE SITES
132
Rock Parameter
6. pR
pRc
Sodium loss
Calcium loss
Titanium loss
Weight loss
Sodium loss re1.to titanium
Calcium loss rel.to titanium
Total calcium +sodium loss
Independent Variables withSignificant Regression
Coefficients
Rainfall, effective plantfactor
Time, titanium content,rainfall
Temperature x rainfall, calcium + sodium content
No significant regression
No significant regression
Time, temperature x rainfall
Temperature x rainfall, calcium + sodium content
Time, titanium content,rainfall
Temperature x rainfall, calcium + sodium content
F Ratio
36.6 61%
29.0 65%
14.6 3Sfo
1.5 12%
2.5 lSfo
29.2 55%
20.1 46%
5.4 26%
4.8 1%

133
Results of Age Determinations
Regression Equations used for ~ng
A few equations met the requirements listed (p. 131 ). Of these,
the highest R2 (80%) and narrowest confidence interval (~ 87 years)
were associated with an equation which used (pHc)2 as a dependent
variable (Equation 1):
2(pRc) = -0.54 - 0.08 (Na loss) + 0.27 (Ca loss) +
0.02995 (Time) .. 0.29 (Rock porosity) +
1.21 (Ti content).
Regression coefficients and the analysis of variance for this
equation are given in Table XXVI together with age determinations for
the Upper and Lower Stainback flows.
The most satisfactory equation for weight-loss had an R2 value of
only 55% and a confidence interval of :. 108 years (Equation 2):
Weight loss = 0.66 + 0.00795 (Time) + 0.00005 (Temp. x rainfall)
Details of this equation and the associated age determinations are
given in Table XXVII.
There is reasonable agreement between the two equations for the ages
of the Upper and Lower Stainback flows. It may be noted that these two
equations use different sets of dependent and independent variables,
apart from time. The pRc ages of c. 360 years are probably more reliable
than those derived from the weight-loss regression because of the higher
R2 and narrower confidence interval of the pRc regression equation.
A calculation of the age of the Honaunau flow using equation 1 gave
an age within the historic period. It is more likely that the calcium
loss measurement for this site is too large (see p. 113) and therefore
the age determination based on the weight-loss regression (Table XXVII)
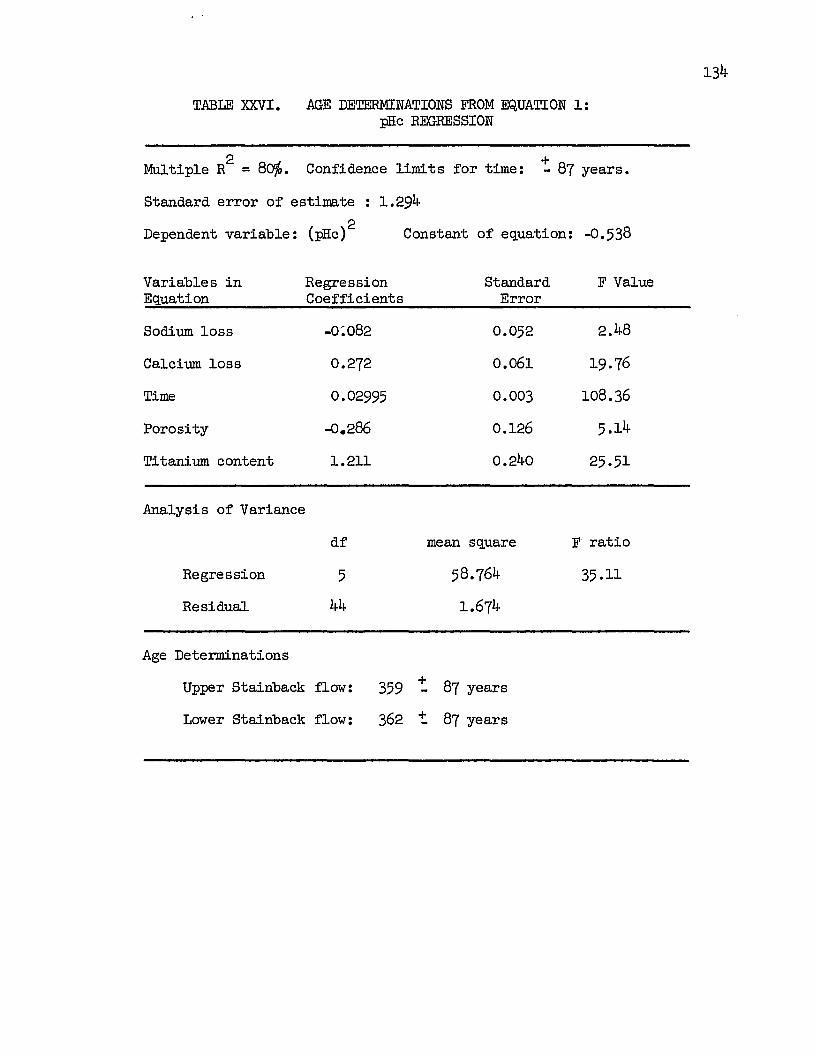
TABLE XXVI. AGE DETERMINATIONS FROM EQUATION 1:pRc REGRESSION
134
Multiple R2 = 80%. Confidence limits for time: +- 87 years.
Standard error of estimate 1.294
Dependent variable: (pRc)2 Constant of equation: -0.538
Variables in Regression Standard F ValueEquation Coefficients Error
Sodium loss -0:082 0.052 2.48
Calcium loss 0.272 0.061 19.76
Time 0.02995 0.003 108.36
Porosity -0.286 0.126 5.14
Titanium content 1.211 0.240 25.51
Analysi s of Variance
df mean square F ratio
Regression 5 58.764 35.11
Residual 44 1.674
Age Determinations
Upper Stainback flow: 359 ~ 87 years
Lower Stainback flow: 362 + 87 years
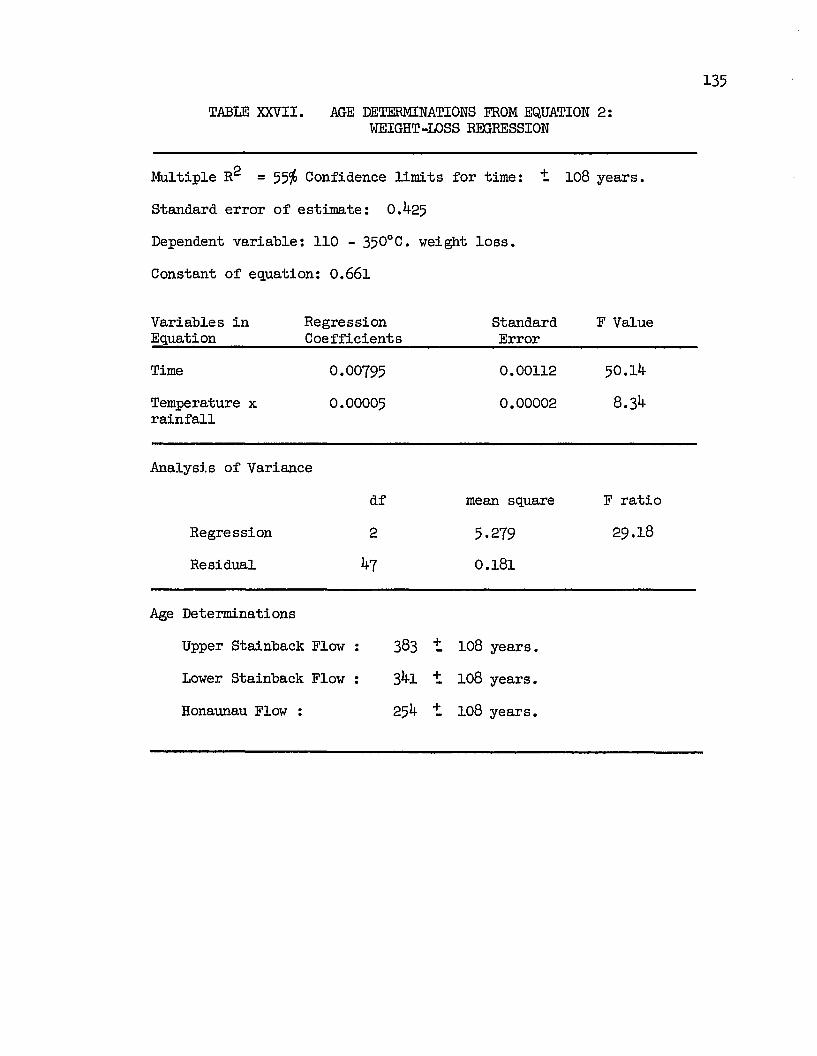
TABLE XXVII. AGE DETERMINATIONS :FROM EQUATION 2:WEIGHT -LOSS REGRESSION
135
Multiple R2 = 55% Confidence limits for time: + 108 years.
Standard error of estimate: 0.425
Dependent variable: 110 - 350°C. weight loss.
Constant of equation: 0.661
Variables in Regression Standard F ValueEquation Coefficients Error
Time 0.00795 0.00112 5°.14
Temperature x 0.00005 0.00002 8.34rainfall
Analysj.s of Variance
df mean square F ratio
Regression 2 5.279 29.18
Residual 47 0.181
Age Determinations
Upper Stainback Flow 383 + 108 years.-Lower Stainback Flow 341 + 108 years.
Honaunau Flow : 254 + 108 years.-

136
is probably nearer the real age of this flow. The number of samples
from the site (3) needs to be increased before further age calculations
are attempted.
Age Extrapolations
Eliminating the data of the 1840L and 1750L sites from the regress
ion analyses prevents use of the equations to age the prehistoric Kapoho
flow. On these two sites, time was again most strongly correlated with
pHc and weight-loss. Straight-line extrapolations of the measurements
from these sites, allowing for differences in altitude, gave a ":PHc age"
for the Kapoho site of 320 years and a "weight-l,oss age" of 305 years.
Similarly, any idea of the age of the prehistoric pahoehoe flow of
Upolu, Samoa, can only be approximated by extrapolation from the Savaii
1760 site. Both pHc and weight-loss extrapolations suggest the Upolu
flow is at least 600 to 900 years old.
Sources of Error in Applying the Regression Equations
As discussed by Esekiel and Fox (1959), applying a regression
equation to estimate values that are beyond the range of the observed
data on which the equation is based is hazardous, since the error esti
mates may no longer be accurate. In the present case, there are no dated
flows spanning the prehistoric period studied. Thus if a first approxi
mation of the ages of the prehistoric flows is to be made, there is no
alternative but to exceed the measured range of dependent variables such
as pHc and weight loss. Considering the independent variables apart from
time, the range of each of these variables used in computing the equations
is given in Table XXVIII. The mean annual temperature of the Lower
Stainback site (72.1o F.) slightly exceeds the original range. With
the Honaunau flow, both mean annual rainfall and the combined calcium +

TABLE :XXVIII.
Variable
Time
Rainfall
RANGE OF VALUES FOR INDEPENDENT VARIABLESUSED IN REGRESSION EQUATIONS
Range
13 - 218 years
100- 210 inches
137
Temperature x rainfall
Temperature
Effective plant factor
Rock texture
Rock porosity
Calcium + sodium content
Titanium content
7600 - 12,600 units
60 .2 - 70.9° F.
o - 8.8 units
4.0 - 9.6 units
2.5 - 6.6 units
8.83 - 12.82%
1.73 - 3.84%
sodium content of the rock, are beyond the range used for the regression
equation.
All these age calculations assume that the relationship between the
variables studied is linear. A curvilinear estimation from measurements
of only five dated flows, that are rather unevenly distributed with
respect to time, might be misleading. If, as seems probable, some
weathering changes are curvilinear in the time span covered, then the
real ages of these flows will tend to be older than those given.

DISCUSSION AND CONCLUSIONS
In this discussion the results for vegetation and rock measure
ments will be related to the question of trends and rates of change
in the lava-flow ecosystems studied. It must be borne in mind that
the conclusions reached are derived from studying the early stages
(c:::: 400 years) of development and that these flows are situated in a
comparatively wet part of Hawaii (90 - 250 inches rainfall). In the
final parts of the discussion some suggestions are made for further
studies.
Trends Within the Ecosystem
Successional Trends on Aa Flows
The most obvious feature of these early stages of lava-flow
succession, is the dominance of Metrosideros polymorpha, a fact
commented on by many observers. The only exception to this is on young
flows in the zone immediately behind the shoreline, where for 100
meters or more the species is largely absent. Further back from the
shoreline for a distance of 200 - 300 meters, Metrosideros increases
rapidly in numbers and size as for example on the coastal portions of
the Kilauea 1840 and 1750 flows. Further inland again the number and
size of Metrosideros plants become typical for the lower part of the
flow as a whole.
In spite of the widespread dominance of Metrosideros, in no part
of the area studied does it appear that the species is stable. The
figures for height-class distribution (Table VI) indicate a steadily
decreasing rate of seedling establishment with increasing time.

139
Although Metrosideros density was found to be extremely variable, it is
clear that seedlings may continue to establish for at least 100 years
if suitable rock crevices are available (Table V). Thus on anyone
site, Metrosideros tends to increase in numbers and cover during the first
100 years of succession.
Sometime during the second hundred years of succession, regeneration
of Metrosideros ceases, and trends of partial replacement by other
species are imtiated. Near the coast there is evidence of replacement
by Pandanus tectoriusj while inland below 1000 feet, there are indica
tions of partial replacement by Diospyros ferrea and Psychotria
hawaiiensis. At higher altitudes Cibotium tree-ferns form more of the
canopy with increasing time. In the rainfall zone of 180 inches or
more, many other specie s appear in the canopy, as for example along the
Stainback Highway. However the trends here have not been studied. The
evidence for decreasing Metrosideros cover and numbers lies in the
absence of seedlings and saplings from shaded ground. It is not unlikely,
however, that at a future stage beyond the 400 year time-span studied,
the Metrosideros could reach an equilibrium when replacement balances
mortality. Such replacement could occur by resprouting from old trees
and occasional establi shment of seedlings on tree -fern trunks.
Successional Trends on Pahoehoe Flows
From the point of view of floristic composition there appears to be
little difference between the successions on aa and pahoehoe flows in
this wet region. In comparing plant establishment on the drier aa and
pahoehoe flows of Hawaii, Forbes (1912), Robyns and Lamb (1939) and
Skottsberg (1941) found that lichens established more rapidly on aa

140
surfaces, while on pahoehoe higher plants established first, particu
larly in crevices. This may also be true for flows in wet regions but
recent pahoehoe flows were absent from the study area. As remarked
earlier, on older pahoehoe flows in the Stainback-8addle road segment
of Mauna Loa, juvenile Cheirodendron trigynum appears to be more frequent
than on aa flows of comparable age.
Considering vegetation structure, the density of Metrosideros trees
is often lower on pahoehoe than aa although thisis by no means
invariably the case. The reasons for this are discussed on p. 143.
Weathering Trends on Aa Flows
The main trends among the weathered rock parameters measured are
clear. With increase in weathering there is a decrease in rock pH,
an increase in ApH, a loss of sodium and calcium, and a relative gain
in titanium. Water and hydroxyl ions are added to the system. Sodium
and calcium losses can be related to weathering of the plagioclase
felspars, and would be an important factor influencing decrease in pH.
These ions, though lost from the weathering rock, are not necessarily
lost from the ecosystem: wherever accumulation of organic matter has
occurred there is the possibility of cation adsorption on the organic
exchange complex.
These trends in elemental percentages are similar to those already
known for more weathered lavas (McGeorge 1917, Harrison 1934, Goldich
1938). This study shows that some of these changes are considerable
even on flows less than 50 years old.
Similar trends to those for rock pH have been ~QUIid for the abrasion
pH of vTeathered andesites (Hendricks and Whittig 1968) and granite
141
(Grant 1963). Again, the magnitude of the change within the historic
period is noteworthy.
The elemental, pH a....'"ld weight-loss parameters could all be used as
weathering indices, separately from any value they may have as age
indices.
Losses of silicon, potassium and strontium, and gains of aluminum
and iron are apparently not significant during the first 200 years of
weathering but become so during the following 200 years (Tables XIV,
XVII, XIX). The magnesium gains measured on the Upper Stainback flow
(Table XVII) may possibly be related to the comparatively large size
o~ the olivine phenocrysts which would retard their rate of weathering.
No measurements were made of the amounts of clay formed but it
was apparent that some clay formation had occurred at the two Stainback
sites.
The local effects of tree growth on the rate of rock weathering
must not be ignored when sampling an historic or late prehistoric flow
(p. 119). These effects could result in a marked pattern of hetero
geneity on a flow during the early stages of succession. With increas
ing time and after several generations of trees, it seems likely that
these local differences will disappear.
Weathering Trends on Pahoehoe flows
The main trends described for aa flows are occurring also on pahoehoe
nows , although usually more slowly 0 However, in the surficial glassy
crusts discussed earlier (po 119) rapid weathering occurs with consequent
release of mineral nutrients 0 This will be of most significance to
plant growth where moisture is not limiting, as for example on the

142
pahoehoe flows of the study area. Since the vesicles are rather un
connected in pahoehoe, it is relatively impervious to water. Thus
heavy rain would tend to wash the nutrients released from the weathering
crusts into crevices and fissures.
It can be expected that both weathering and succession on pahoehoe
flows will be inc:i.'eased where aolian or colluvial material has
collected in depressions on the lava surface.
Rates of Change in Lava-Flow Ecosystems
Factors Affecting Trends and Rates of Succession
Only tree-volume estimates were used in the regression analyses
because of the limited number of vegetation samples. However, some
generalizations are possible based on the sampling and other observa
tions made over a wider area.
General observation shows that the most important factor affecting
the rate of succession is available moisture as determined by total
rainfall, rainfall distribution and edaphic factors. Even in the high
rainfall of the area studied, it appears that available moisture can
still restrict plant growth on a lava flow. The two most important
edaphic factors influencing available moisture on an aa flow are the
size distribution of boulders and stones and the porosity of individual
rocks. A flow composed mainly of large boulders has less cover of
Metrosideros trees than one consisting of smaller stones and gravels.
For example, the Metrosideros cover of the 1852 site (Table VIII) is
less than half that of the 1855 pahoehoe site.
Rock porosity appears to influence especially the establishment
of the lichen Stereocaulon vulcani. The 1955 site is particularly
scoriaceous and porous and here Stereocaulon is extremely abundant.

mhe rock porosity rating was 4.88 (Appendix II), second only to the
1840H site, but this rating does not appear to reflect fully the very
porous and crumbly condition of this flaw. It seems that a measure of
the particle coherence of rock samples is also needed.
On pahoehoe flows, the establishment of Metrosideros appears to be
at least partly controlled by the presence of fissures and cracks, a
point appreciated particularly by Skottsberg (1941). A flow with few
fissures tends to have a lower density of Metrosideros than a strongly
fissured flaw. The fissures act as traps for wind-blown dust and
possibly also for mineral nutrients released during weathering of the
pahoehoe crust (see "Weathering Trends on Pahoehoe Flaws"). Accumula
tion of this fine material would increase moisture storage. Forbes
(1912) remarked on the fertile soil that develops in pahoehoe cracks.
In addition to these factors of nutrient and moisture supply, a fissure
provides space for the development of roots. Thus a strongly fissured
pahoehoe flow can support a Metrosideros stand of similar density to an
adjacent aa flaw of the same age.
A feature particularly characteristic of pahoehoe flaws is the
common occurrence of "air-gaps" or small tunnels several feet below the
surface. These are formed during emission of the flow after the upper
surface has solidified but while molten lava is still moving deeper down.
These tunnels, in removing water rapidly, may also contribute to moisture
shortage on pahoehoe flaws.
An indirect effect of moisture on the trend of succession occurs
with the fern Dicranopteris linearis. On both aa and pahoehoe flaws,
Metrosideros regeneration largely ceases as this fern spreads. Where
Dicranopteris forms dense tangled thickets, particularly at lower

144
altitudes, Metrosideros seedlings are not found. Establishment and
growth of Dicranopteris appears to be intimately related to available
moisture: on drier sites such as the lower part of the 1750 flow, this
fern is infrequent.
An interesting question concerns the reason why succession, in terms
of the development of a tree understorey and the partial replacement of
the canopy, has progressed further on the upper 1750 site (990 feet)
than on the much older (c. 1600 A.D.) Lower Stainback site (300 feet).
The 1750 site has a well developed understorey of Diospyros ferrea and
in some places this species is replacing Metrosideros. A Cibotium tree
fern understorey has developed on the Stainback site although there is
little mortality of Metrosideros. Because of its probable secondary
status, the Lower Stainback forest may not be greatly different in age
from that of the 1750 site. However there is no evidence that Diospyros
will ever be an important species there.
It seems possible that rainfall differences may explain these con
trasting successional trends since l~eller-Dombois (1966) describes open
Metrosideros-Diospyros forest on steep slopes within Hawaii Volcanoes
National Park. In the Park this community is associated with a summer-dry
climate. Such conditions may occur to a limited extent in the 110 inch
rainfall of the Kilauea 1750 site, but are unlikely in the Stainback area
of Mauna Loa, where the rainfall is 140 inches and cloud cover is frequent.
From this it can be inferred that increasing rainfall in the range 110
to 140 inches, or possibly increasing cloud cover associated with this
rainfall difference, has altered the trend of succession. Whether the
rate of succession has also been altered is not clear in this case.
Comparison of the 1750 H site with the l750L site (90 inch rainfall)
145
shows a reduced growth rate on the latter site (Table VIII), indicating
that here the rate of succession has been reduced. Although Diospyros
was not present on the 1750L site, Metrosideros-Diospyros forest occurs
in still lower rainfall within the National Park and thus there is no
reason to suppose that the trend of succession has been altered.
The regression analysis of tree-volume estimates on the historic
flows (Table XXIX), showed that time, rock porosity and rainfall (with a
negative regression coefficient) were the most important factors
"accounting" for differences in mean tree volume. The negative
coefficient for rainfall is a result of the fact that the highest growth
rates are associated with the driest (and warmest) sites.
From the foregoing discussion it can be seen that rainfall, or fac
tors associated with it, is affecting trends and rates of succession in
this high-rainfall region. With aa flows having similar rainfall, differ
ences in the rate of succession may still develop because of differences
in rock porosity and rock size that affect available moisture.
Factors Affecting Trends and Rates of Weathering
The regression analyses allow the effects of time and the various
site variables to be separated. Table XXIX sunnnarizes the results from
regressing weathered rock and tree volume parameters on site factors
and time. The first group of regressions is that based on the 66
samples from the historic flows. The second group based on 75 samples,
includes data from the two most reliably dated prehistoric flows: the
Upper and Lower Stainback. The independent variables of the equations
(site factors and time) having significant regression coefficients are
numbered in order of their F values. Negative regression coefficients
are indicated after the number. The variables in regression equations
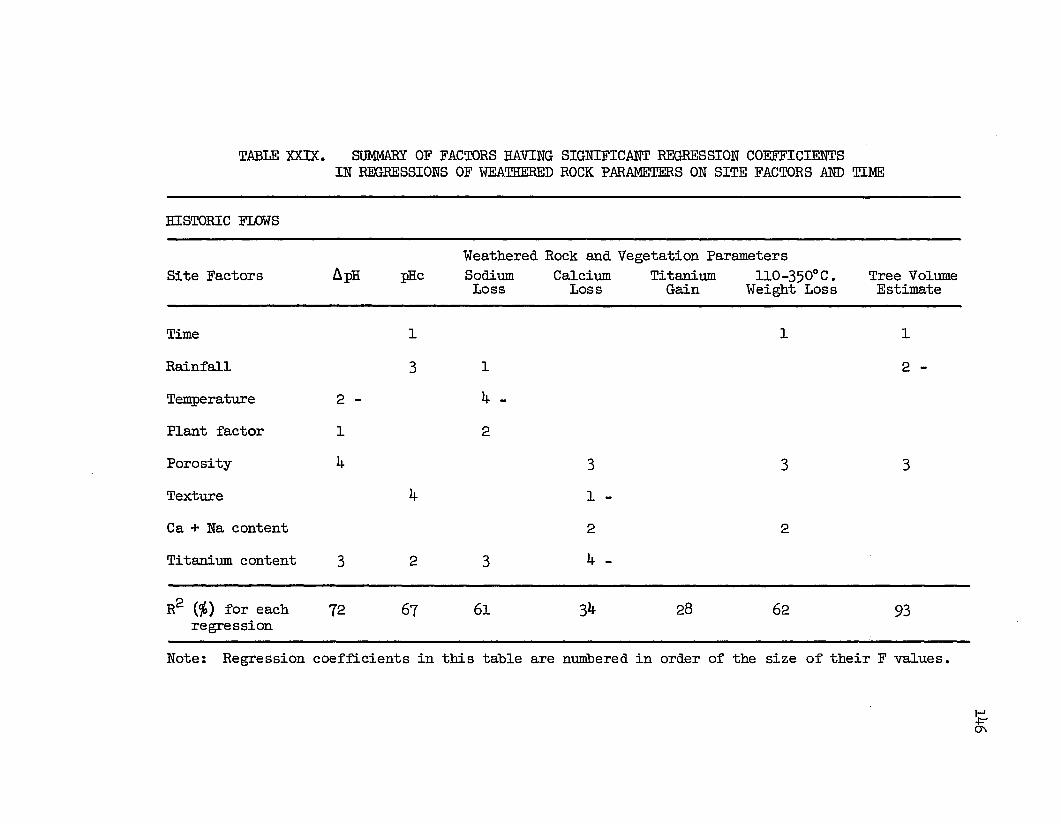
TABLE XXIX. SUMMARY OF FACTORS HAVING SIGNIFICANT REGRESSION COEFFICIENTSIN REGRESSIONS OF WEATHERED ROCK P.ARAMETERS ON SITE FACTORS AND TIME:
HISTORIC FLOWS
Weathered Rock and Vegetation ParametersSite Factors LipR pRc Sodium Calcium Titanium 11O-350o C. Tree Volume
Loss Loss Gain Weight Loss Estimate
Time 1 1 1
Rainfall 3 1 2 -
Temperature 2 - 4 -
Plant factor 1 2
Porosity 4 3 3 3
Texture 4 1 -
Ca + Na content 2 2
Titanium content 3 2 3 4 -
R2 (%) for each 72 67 61 34 28 62 93regression
Note: Regression coefficients in this table are numbered in order of the size of their F values.
~0\
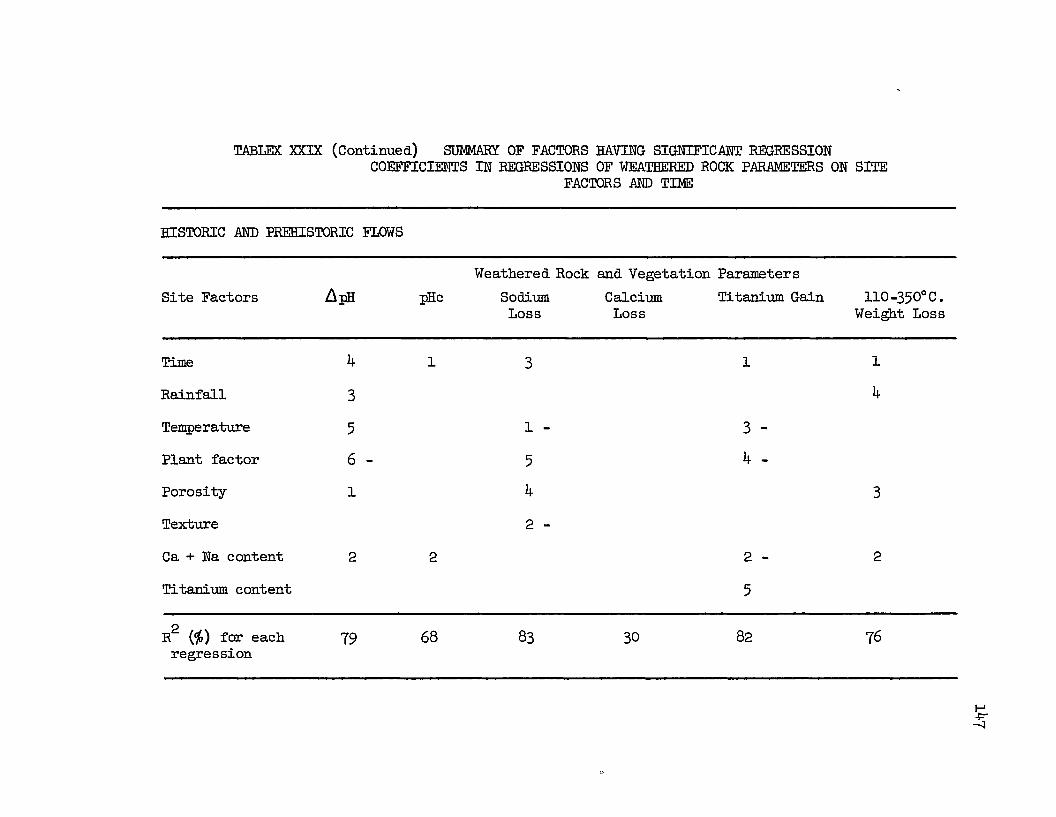
TABLE}{ XXIX (Continued) SUMMARY OF FACTORS HAVING SIGNIFICANT REGRESSIONCOEFFICIENTS IN REGRESSIONS OF WEATHERED ROCK PARAMETERS ON SITE
FACTORS AND TIME
HISTORIC AND PREHISTORIC FLOWS
Weathered RoCk and Vegetation Parameters
Site Factors LlpR pRc Sodium Calcium Titanium Gain 110-350°C.Loss Loss Weight Loss
Time 4 1 3 1 1
Rainfall 3 4
Temperature 5 1 - 3 -
Plant factor 6 - 5 4 -
Porosity 1 4 3
Texture 2 -
Ca + Na content 2 2 2 - 2
Titanium content 5
268 83 82 76R (%) for each 79 30
regression
I-'+:
-..:J

148
having R2 values of 30f0 or less, have not been listed. The frequency
of each of the independent variables in the equations for the weathered
rock parameters (only) is listed below.
Independent Variable Historic Historic andFlows Prehistoric Flows
Climate: rainfall
:}4 :}5temperature
Time 2 5
Effective plant factor 2 3
Rock composition: Ca + Na content
:}6 :}5Ti content
Rock structure: texture
:}5 :J 4porosity
From this analysis it is apparent that no one factor or group of
factors stand out as being of paramount importance in weathering.
Differences in climate, t.ime, effective plants, rock composition,
porosity and texture are all influencing variation in the parameters
measured. Slope and other topographic variables could not be included
since these factors had been kept constant during sampling. A different
regression program (e.g. a step-down fitting procedure in which variables
are progressively deleted) might have picked different combinations of
variables. However it seems unlikely that their overall distribution
would be greatly altered.
Temperature may be related to weathering positively by increasing
the rate of chemical reactions, or negatively by increasing evaporation
and thus decreasing the amount of water that passes through the surface

rocks. In 4 out of 5 cases, temperature appears in the equations with
a negative coefficient. This suggests that, in the climatic range
studied, it is the evaporation effect which is more important. It may,
explain why the Savaii 1760 pahoehoe flow in Samoa, at a mean annual
temperature of 77°F., is weathering more slowly than the 1855 pahoehoe
flow in Hawaii at a mean annual temperature of 60°F. (Table XXIII).
Some of the site variables are significantly correlated with each
other (Appendix IV). This can sometimes result in the replacement of
one variable by another that has no functional relationship with the
dependent variables regressed. Highly correlated site variables can
also result in changes of sign in the regression coefficients that are
difficult to interpret. For example, the titanium content invariably
appears in the equations with a positive coefficient. At first sight
this would imply that the rate of weathering increases with increase in
titanium content of the parent rock: a surprising conclusion in view of
the known stabilizing effect of titanium on mineral structure. However,
a plotting of titanium content of the parent rock against sodium
content, showed that with the historic flows sampled, the two variables
are highly correlated. The rate of weathering may well be associated
with sodium content since this would reflect the content of easily
weatherable minerals. Study of Macdonald and Katsura IS (1964) data shows
that there is no general relationship between titanium and sodium content
in tholeiitic lavas.
An estimate of the quantitative effects on weathering of site
factors and time, (the state factors of Jenny, 1961), is possible by
considering the magnitude of the regression coe fficients associated with
those regression equations having high R2 values. These coefficients

150
correspond to the partial differentials of a Jenny-type equation. This
has been done for the factors time, rainfall, temperature, effective
plants, porosity and calcium + sodium content of the unweathered rock
(Table XXX). The figures of this table are taken directly from the
regression coefficients. They show the amount of change in a dependent
variable that can be associated with a fixed amount of change in a
particular independent variable. In each case the effects of other
independent variables are nullified.
Porosity and Ca + Na content of the rock, appear to be the most
important factors affecting change in 6.plI values. As shown earlier
(p. 93), ApE measurements probably indicate change in solubility
of the rock constituents rather than develoPment of cation exchange
capacity.
Combined Ca + Na content is also of importance in affecting pRc
values. This factor appears with porosity in the regression equations
for weight loss. While an effect of porosity on weathering is not
surprising, an effect of chemical composition was not expected since
all the flows sampled are essentially either basalts or olivine basalts.
With the regressions for calcium loss and titanium gain on the
historic flows, and calcium on the combined historic and prehistoric
flows, the percentage of variability explained by the regressions is
very low (Table XXIX). This implies either that there are unknown
variables causing variation in these parameters or that the relationship
is curvilinear rather than linear.
The equations for sodium loss indicate a considerable effect of the
effective plant factor ( > 2% loss of sodium per pOR unit of effective
plants). This is in agreement with the results obtained for sodium
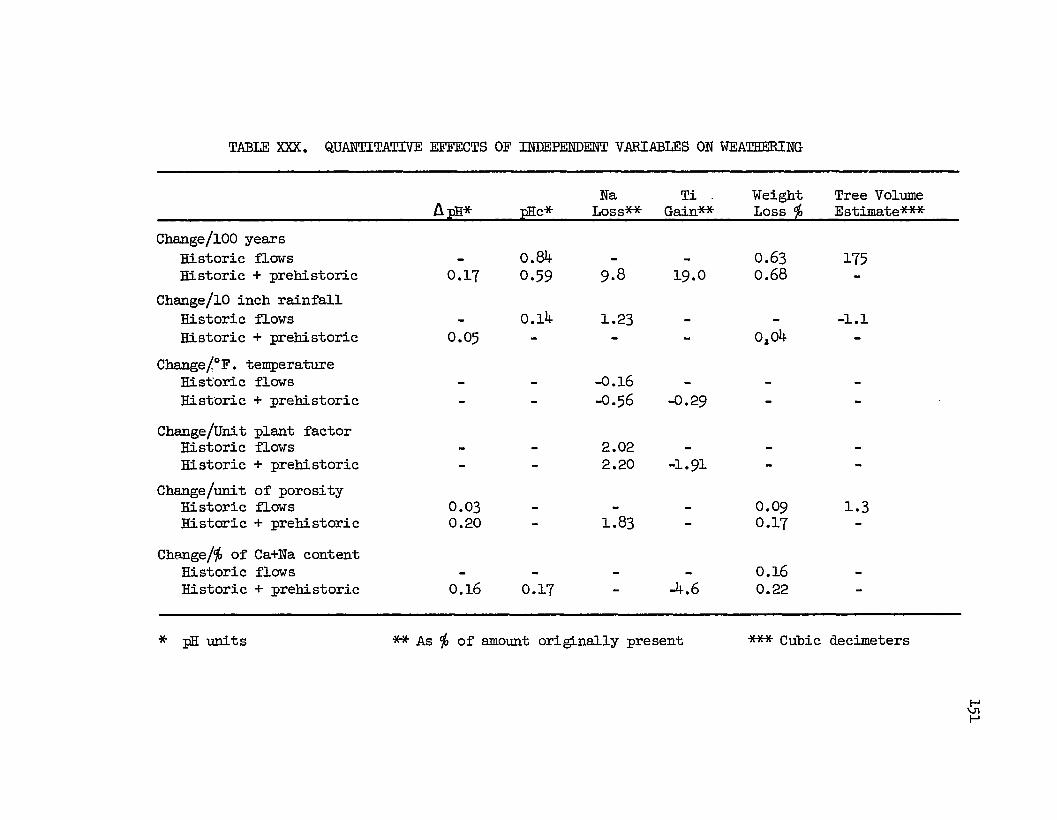
TABLE XXX. QUANTITATIVE EFFECTS OF IIIDEPENDENT VARIABI..ES ON WEATlIERING
Na Ti Weight Tree VolumeApR* pRc* Loss** Gain** Loss % Estimate***
Change/IOO yearsHistoric flows - 0.84 - - 0.63 175Historic + prehistoric 0.17 0.59 9.8 19.0 0.68
Change/IO inch rainfallHistoric flows - 0.14 1.23 - - -1.1Historic + prehistoric 0.05 - - - 0.. 04
Change/oF. temperatureHistoric flows - - -0.16Historic + prehistoric - - -0.56 -0.29
Change/Unit plant factorHistoric flows - - 2.02Historic + prehistoric - - 2.20 -1.91
Change/unit of porosityHistoric flows 0.03 - - - 0.09 1.3Historic + prehistoric 0.20 - 1.83 - 0.17
Change/% of Ca+Na contentHistoric flows - - - - 0.16Historic + prehistoric 0.16 0.17 - -4.6 0.22
* pH units ** As % of amount origLnally present *** Cubic decimeters
I-''VII-'

152
losses of rocks under trees and those on bare lava on the 1750 flow
(Table XX). The large loss of sodium from rocks among roots as com
pared to those in a protected position underneath the trunk (Table XXI)
may also indicate that plant litter has a considerable effect on
weathering. Here, however, some of the rocks under trunks may be almost
completely protected from leaching. Taken as a whole, the data lends
some support to the assumption that the effective plant factor, as
defined in this study (1'. 125), is measuring a factor of significance
to weathering.
Rates of Succession
Consideration can now be given to the question of overall rates
of change i.e. the resultant rates of change when all ecosystem factors
are included. Because of the number of factors influencing rates,
generalizations are not readily made. In Table XXXI rates of change,
based on sample averages, have been summarized for the three major
climatic zones of the study area. Rainfall in the coastal zone is 115
inches, that in the low-altitude zone varies from 110 to 140 inches,
and rainfall in the mid-altitude zone covers the range 140 to 210 inches.
Mean annual te:m:Peratures vary from 73°F. at the coast to 60°F. at 3800
feet. The figures for the coastal zone are from the 1840L site alone,
since the estimated age of the prehistoric Kapoho flow is too uncertain.
The low-altitude rates are means der±1ced from the 184oH, 1750H and
Lower Stainback sites. Figures for the mid-altitude zone are from the
1852 and Upper Stainback measurements. An age of 360 years is assumed
for both the Upper and Lower Stainback flows (see Age Determinations).
The results for both these flows are shown separately since they may
give a more representative figure for average rates of change during the
first 400 years of ecosystem development.

TABLE XXXI. RATES OF CHANGE OF WEATHERED ROCK .AND VEGETATION PARAMETERSON SELECTED LAVA FLOWS
AA FLOWS PAHOEHOECoastal
Parameter Zone Low -Alt. Zone Mid-Alt. Zone Low- Mid-40 ft. 300-1000 ft. 3600-3800 ft. Alt. Alt.
1840L Mean Lr. Stbk. Mean Upr. Stbk. Samoa 18553 Flows 2 Flows 1160
6.pH (pH units/0.28century) 0.13 0.30 0.19 0.23 0.39 0.15
pHc II 0.16 1.50 0.98 1.31 0.95 0.53 2·55Na loss (% O.d.wt.{
N.S. 0.14 0.15 0.28 0.34 N.S. N.S.centuryCa loss II N.S. 0.20 0.26 0.36 0.39 N.S. 0.22Ti gain II 0.01 0.05 0.13 0.10 0.18Si loss II 1.29 1.29- - -Kloss II 0.01- - - -Mg gain II 0.29- - - -Weight loss % 0.60 0.90 0.80 0.85 0.90 0.20 0.80Tree vol. estimate
(cub. am/cent.) 15.3 1112* (250) 198 394 - 0·5Height growth
(meters/cent.) 2.1 1.1* (5.0) 3.8 5.6 - 1.9Stratum depth
4.4(meters/cent.) 2.3 4.1 (4.1) 3.6 - 2.0
* Means for 1840H and 1150H sites only.I-'VIW

154
Since the amount of floristic difference between flows of differ
ing age is not very great (Appendix III), rates of succession on the
flows studied are best examined in terms of structural change.
Considering first the early stages of succession, rates of lichen
cover were calculated by dividing the transect percentages for lichen
cover by the age of the flow. The results for an open site in each of
the three zones were:
Coastal (1840L: 40 ft. alt. ) ...• .•0.3% per year
Low-altitude (1955 990 ft. alt.) ••••• •6.';!fo per year
Mid-altitude (1942 3720 ft. alt. ) .•.. •• 2.3% per year
Both the 1955 and the 1942 sites have higher than average rock
porosities, so that the rates of lichen cover measured here may be
faster than usual.
Rates of chan@e for later stages of succession are included in
Table XXXI. Since the Metrosideros forest of the Lower Stainback site is
probably secondary, the vegetation and organic horizon measurements for
this site have been enclosed in brackets. Excluding this site, it can be
seen that tree volume estimates, height growth and total stratum depth
all show higher rates of change in the low-altitude zone. A specific
comparison can be made between the low-altitude 1840H site with a rate of
tree-volume increase of 82.7 cubic decimeters per century, and the mid
altitude 1852 site with a rate of only 2.46 cubic decimeters per century.
Although there are insufficient sites to give precise times for
stages of succession, a general statement is possible. It seems probable
that on aa flows in a mid-altitude zone having a humid climate and a mean
annual temperature of 60°F., forest (8~ or more canopy cover of trees)
is developed within 300 years of flow formation. At lower altitudes

155
(c. 70°F.) forest can develop wi thin 200 years, provided the climate is
generally humid rather than having frequent summer-dry periods.
These rates are slower than those recorded for Krakatoa by
Richards (1952) and by Tagawa (1964) for S8.kurajima, Japan. However,
neither case is really comparable to the Hawaiian flows studied, since
both the Krakatoa and Sakurajima flows were covered by pumice.
It may be pointed out that these rates of forest development are
almost certainly not the maximum rates of Metrosideros succession that
can occur on ash-free lava flows in Hawaii. General observations in
the Honaunau district (Kona) indicate that climatic conditions there
may be nearer the optimum for Metrosideros growth. If a figure of
approximately 250 years is taken as the age of the Honaunau site
(Table XXVII), this gives a rate of tree-volume increase of 1,640 cubic
decimeters per century. This site is at 3,250 feet, so that the rate of
development may be considerably higher at lower altitudes, if summer
dry conditions are not dominating.
More data are needed from pahoehoe flows in humid areas but some
comparison with succession on aa flows is possible. Vegetation para
meters measured on the Mauna Loa 1852 aa and 1855 pahoehoe sites, and
similarly on the 1840H aa and 1793 pahoehoe sites of Kilauea (Tables VIII
and XXIII), show that vegetation succession is more rapid on the aa flows
(cf. Forbes 1912). However, as cautioned by Skottsberg (1941), pahoehoe
varies a great deal with regard to hardness and frequency of cracks,
so that it cannot be assumed that weathering and plant succession will
always be slower.
Rates of Weathering
In Table XXXI the weathered rock measurements for the 1955 and 1942

156
flows were excluded because, in both cases, rates of change appear to
be faster than usual. These high rates of change may be related to
high porosity and weak particle coherence, mentioned earlier. They
may also be a result of rapid initial rates of release from weathering
minerals as found by McClelland (1950) in laboratory experiments.
Rates of change for weathering parameters (Table XXYJ) show
definite differences between the climatic zones distinguished. However,
the weight-loss measurements, apart from two sites where summer-dry
conditions prevail (l84oL and Samoa 1760), show a very consistant rate
of change of 0.8 to 0.% per century.
Although there are data from only one coastal site (l84oL), the
changes are generally slower than in the inland wetter districts.
Rates of change in pH are highest in the low-altitude zone whereas the
rates for sodium loss, calcium loss and titanium gain ·tend to be
highest in the mid-altitude zone where rainfall is highest. Hough, Gile
and Foster (1941) and Tanada (1951) found that titanium accumulation
increased with increasing rainfall.
Assuming the Lower and Upper Stainback sites to be of similar age
(c. 360 years), a direct comparison can be made in rates of weathering
at the two altitudes (300 and 3660 feet). Rainfall is similar (140
inches) but mean annual temperatures differ by approximately 12°F. There
is little difference in the pH measurements but rates of sodium and
calcium loss, titanium gain and the weight-loss measurement are all
greater at the higher altitude. So far as elemental changes are concerned,
these measurements indicate that weathering is more rapid at mid-
altitudes than at lower levels.
An explanation for these observations may lie in the development of
a relatively deep organic horizon (16.5 cm) at mid-altitudes. As

157
discussed in the results, this can probably be related to decreased
decomposition rates associated with the decreased temperature. With
accumulation of an organic horizon there would be many changes in the
micro-environment of a weathering rock. Evaporation would be reduced
so that surface rocks would be permanently moist. Acid plant litters
would acidify the water moving through the profile. pH measurements
of the organic horizon on the 1852 and Upper Stainback sites gave values
ranging from 3.8 to 4.5. The solubility of aluminum increases very
rapidly below a pH of 4.5 (Correns 1949, Krauskopf 1959) and this is
perhaps why it was not possible to demonstrate a significant concentration
of aluminum in rocks from the Upper Stainback site (Table XIV). The
1852 flow with an organic horizon averaging nearly 12 cm in depth
(Table IX) actually showed a loss of aluminum (Table XIV).
Data for weathered rock parameters from the pahoehoe samples is
insufficient to allow a proper comparison with aa flows. However the
pH measurements show that rates of change are not always slower on
pahoehoe flows.
A further important question concerns the manner in which the rate
of weathering can change with time. The surmnation of the rates of
change per century for each of the parameters: ~pH, pHc, Na. lOSS,
Ca loss, Ti gain and 110-350°C. weight lOSS, can be used as an index of
the overall rate of weathering. The indices for 4 flows in the low
altitude range (300 to 1000 feet) are:
1955 1840H 1750H Lower Stainback
27.53 3.77 2.92 2.51
Even though the rate of weathering of the 1955 rocks may be higher
than usual, the trend in the above figures is clear: a decreasing

158
weathering rate with increasing time. When plotted, these figures
approximate to a negative exponential function.
Two reasons for this trend can be suggested. Following develop
ment of a closed vegetation cover, microclimate conditions would be
subject to much less fluctuation than during earlier stages of weather
ing. Secondly, McClelland (1950) investigated mineral weathering under
laboratory conditions and found that while bases were released from
fresh minerals at a fast rate, it appeared that with increasing time,
residual primary weathering products were retarding the release of bases
from the minerals.
Relationship between Succession and Weathering on Hawaiian Lava Flows
It is sometimes considered that soil and vegetation development
are so closely related, that the stage reached by one process, will
parallel the stage reached by the other. However, even allowing the
close connection between the two processes brought about by biocycling
of minerals, it seems unwise to correlate soil and vegetation develop
ment on lava flows too closely. A fully developed forest can occur
on a flow where, although there has been some weathering, the formation
of mineral or organic soil material is negligible, e.g. the 1750H site.
The results from this study show that while the rate of succession
is highest at 10101 elevations, the rate of rock weathering and develop
ment of an organic horizon is highest at mid-altitudes. In this whole
region of relatively high rainfall, it is considered that temperature
is the differentiating factor. The higher temperatures at low altitudes
increase the rate of plant growth and reduce the rate of leaching, and
therefore weathering, by increasing evaporation. The lower temperatures
at middle altitudes decrease plant growth and facilitate weathering by
increasing the accumulation of organic matter.

159
Importance of the Stainback Flows as a Study Area
The Stainback Highway stretches for 19 miles from the Volcano
Highway (280 feet) up the slopes of Mauna Loa to the Kulani prison
(c. 4700 feet). The area was originally completely covered in thick
forest; extensive stands of Metrosideros forest are still present on
both sides of the road for the greater part of its length. The
detailed land classification for Hawaii (Baker et al, 1965) shows sev-
eral soil bounaaries crossing the Stainback road. This would imply
that the road crossed several old flows. However, after a preliminary
reconnaissance of the area, it was considered possible that this flow
might be continuous all the way from below the junction of the Stain
back road with the Volcano Highway up to an altitude of about 4600 feet.
At this elevation it is overlain by a more recent prehistoric flow.
The rock analyses of the unweathered rocks from the Upper and
Lower Stainback sites, are consistent with the idea of these sites
being on the same flow or on very similar flows:
pHH20 1'il'a CJfo CaCJfo Ti02% Wt-loss %2
Upper Stainback (3780 feet) 9.37 2.53 9.77 2.13 0.09
Lower Stainback (300 feet) 9.35 2.23 9.72 1.83 0.24
The differences between these two anaJ.yses are wi thin the range of
sample variation that can be found on a single flow (see Results). The
largest difference, that of titanium content, may be the result of
gravitative differentiation in the magma reservoir before eruption.
Macdonald (1944) describes a case of gravitative crystal differentiation
in the 1840 eruption of Kilauea where the iron content of the ground
mass (determined by optical measurement) was 7% lower in the flows near
sea-level than that of later flows produced at higher levels. Since

160
titanium is associated with iron oxides, it could be expected that the
earlier erupted, lower part of a flow, would have a lower titanium
content.
The age determinations from Equations 1 and 2 suggest that the two
Stainback sites, if not on the same flow, are on flows little different
in age. Age calculations from three other regre ssion equations, with
R2 values less than that of Equation 1 (65 -7510), gave ages for the two
sites that ranged from 308 to 347 years. However these equations were
consistent in giving a slightly younger age (10 to 39 years) to the
Lower Stainback site.
If this hypothesis of similar age for the two Stainback sites is
substantiated, there are good opportunities here to make further
comparisons of rates of development at di fferent altitudes. Since most
of the ecosystem factors, particularly rainfall, are similar, differences
in rates of weathering, leaching, clay formation and other processes can
be related to differing temperature and possibly disturbance factors tha"c
have affected the vegetation.
The boundaries of the Stainback flow (or flows) are not known, but
the flow is probably represented for some distance at higher and lower
altitudes than those sampled. Lobes of adjacent flows may cross the
road in some places. If the pattern of flows in this di strict can be
mapped, much more could be learnt from comparisons between different
altitudes and between adjacent flows. For example, koa (Acacia koa)
occurs on what is presumably an older flow immediately to the north of
the main Stainback flow. This species was not seen nearer the highway
except as planted trees.

161
Detailed mapping of contours, using aerial photograph techniques,
together with field mapping of the vegetation, using both understorey
and overstorey composition, may be the easiest way to distinguish
separate flows. The following points may' help future investigators:
1. In some places the Stainback flow grades into II semi -pahoehoe II
and then back to aa again. This" semi -pahoehoe II surface is associated
with shallower depths in the organic horizon and Metrosideros forest
of lower density than typical of the aa surface. Such variation can
mislead one into thinking that another flow has been encountered.
2. Disturbance of the original forest, apparently by fire as well
as cutting, is more marked below 1800 feet than above this altitude.
This disturbance pattern is superimposed on gradients of increasing
forest height, tree diameter and species diversity that are associated
with the zone of highest rainfall between 1500 and 3000 feet.
Apart from particular studies of the vegetation and rock weather
ing that could be made, the Stainback area appears to be a suitable
location for study of the genesis of tropical histosols. No attempt was
made to classify the organic soils present but auger borings made at
different altitudes showed that few of these soils would meet the depth
requirement of a typic folist. A class such as 1I1ithic tropofolist ll
may be needed.
The flows of the Stainback area are only part of a soil-vegetation
sequence that extends from sea-level to 13000 feet. This sequence is
unique both floristically and faunistically and though damaged or
destroyed in places, there can be few places in the Pacific region where
such a complete sequence can still be studied. There is thus ample
reason for permanently reserving representative areas of 5 to 10 acres
162
at intervals of 300 to 500 feet altitude from the shoreline to the
summit of Mauna Loa.
Aging a Lava-Flow Ecosystem
In using parameters of weathered rock to age lava-flow ecosystems,
there are two main limitations to be overcome. The first is to find a
method of sampling the flow in a representative and reproducible manner.
The second is to find a rock parameter that changes with time in a pre
dictable manner. If the parameter is dependent on rainfall and tempera
ture, the effects of these factors can be maasured. Ideally, the
parameter should be little influenced by differences in rock composition,
porosity and texture within the one type of lava, e.g. olivine basalt.
Considering the sampling problem, it can be seen from the earlier
discussionG that there was sometimes doubt concerning the degree of
weathering o£ the 'unweathered' samples, particularly on older flows.
This problem of a shifting baseline in the 'unweathered' rock could
cause considerable error if an attempt was made to age flows older than
the 400 year period covered in this study. If a particular parameter of
unweathered rock of a given composition was found to be relatively
constant between flows, then this could be taken as a baseline. This
would overcome the difficulty of obtaining accurate measurements for
unweathered rocks on every flow sampled.
In this study the 110-350°C. weight loss and the pRc measurements
approach the idealized situation described above more closely than the
other parameters measured. With some refinements to the weight-loss
measurement, (e.g. rigid control over particle size during grinding), it
may be possible to increase the precision of this measurement. By
experimenting with temperatures above and below 350°C., a temperature

basalts fall within a narrow range (Table X).
163
level might be found at which the weight -loss of an unweathered sample
was nearly constant for a given range of rock composition. The weight
losses of unweathered rocks at this temperature would then be a measure
of the degree of weathering and could be used as an age index as was
done in this study. Judging by the results obtained here, hydrolysis
and hydration of rocks, as measured by weight-loss, are more influenced
by effective rainfall than other factors. This is a further advantage
as pointed out above.
Attention could also be given to stUdying the factors that
influence rock pH. It seems likely that the pH values for unweathered
Thus the pHH 0 or2
pHKCl value of unweathered rocks, can possibly be used as an accurate
measurement of the degree of weathering; measurements of large numbers
of unweathered samples would again be unnecessary.
Data for pahoehoe fLows were insufficient to allow use of regression
analyses for aging purposes. However, the magnitude of both the
weight -loss and the pH measurements for pahoehoe rocks was larger than
expected. It now seems that with further study it may be possible to
develop methods for aging pahoehoe flows.
There are other lines of attack on the general problem of aging
that could be pursued. One approach would be to apply the principle
used in dating with radioactive isotopes. The amount of parent isotope
decrease s continually as it changes to the daughter isotope. The
daughter isotope is stable and is retained in the rock so that the total
amount of change can be measured. In the absence of suitable isotopic
pairs, the next choice would be an element which is slowly changed to a
rather insoluble compound, that is retained within the fabric of the

164
weathering rock. For example, Nakamura and Sherman (1961) found that
vanadium accumulates in Hawaiian soils in sufficient amounts to make
it potentially useful as a weathering index. This element is probably
present in magmas as the V3+ ion (Mason 1966) and is associated with
pyroxenes and magnetite (Wager and Mitchell 1951). If vanadates can be
determined separately from elemental vanadium, a ratio of total vanadium
(all oxidation states) to vanadate ion (V5+) could be useful as an age
index. The molybdenum/molybdate ratio may also be worth examining from
the same point of view. Here, however, the total amounts present are
sometimes less than 1 ppm (Wager and Mitchell 1953) as compared. to 100
- 400 ppm for vanadium (Nakamura and Sherman, loc. cit.).
The regression equations of the present study give a quantitative
description of the effects of various environmental factors on weather
ing although they do not provide mathematical models for the processes
operating. Thus Equation 2 (see Age Determinations) states that weight
loss is a function of time, temperature and rainfall. This rather
simple equation could be used as a starting point for a more general
equation that was applicable to a wider range of conditions. By taking
one of the older dated flows and sampling a weathering parameter through
the full range of site conditions present, it should be possible to get
sufficient information to build some general equations.
An assumption made in the age determinations is that of climatic
stability throughout the period for which age extrapolation has been
made. There is good evidence that this is not so even during the last
400 years. Thus, on a world basis, Lamb and Johnson (1961) summarize
evidence for a "Little Ice Age" that culminated in the 1600's. In
Hawaii, Selling (1948) gives pollen evidence for climatic deterioration

165
about 1200 A.D. although here the possibility must be considered that
the changes in pollen frequency are related to forest destruction by the
early Hawaiians.
In the present case, error arising from climatic change is probably
minor. Equation 1 does not utilize measurements of current climatic
variables but rather calcium and sodium losses which would integrate
the leaching effect of past climate. This equation may be invalid in
climates beyond the range of climatic data from which it was built.
Equation 2 is dependent on current rainfall and temperattU'e measurements
at the site being representative of the past climate, and is therefore
more vulnerable to error due to climatic change. However the measure
ments for the effects of rainfall and temperattU'e on weight loss
(Table XXX) indicate that climatic change would have to be considerable
before large errors could be expected.
As more information 0:.1 past climates becomes available it should
be possible to correct for these changes by using information of the
type recorded in Table XXX. Within the climatic range studied, the
measured effects on pRc or weight loss of a 10 inch change in rainfall
are not large.
The aging Irethods developed in this study can be used for assigning
relative ages to lava-flow ecosystems within the limits of the confidence
intervals. It would be interesting to see how the dating of some lava
flows by the methods of this study compares with carbon-dating. Approx
imately two to three hundred grams of carbonaceous material is needed in
order to age a 300400 year lava flow with a possible error of ~ 50 years.
The methods of this study may prove to be very useful in indicating the
ages of lava-flow ecosystems, particularly in cases where carbonaceous
material cannot be found.

SUMMARY OF CONCLUSIONS
1. With the aid of regression analysis and inverse estimations from
dated lava flows, it is possible to use measurements of the weathered
rock to obtain meaningful ages for previously undated prehistoric aa
flows in the age range 200 to 400 years B. P. and rainfall range of 90
to 150 inches per annum. With further study this time span and climatic
range could probably be extended.
2. Study of successional trends in this high-rainfall region shows
that during the first 200 years of succession the main coloni7~ng tree
species, Metrosideros polymorpha, first increases and then decreases
in numbers. With decrease in numbers it is partly replaced by several
species of trees, e.g. Pandanus tectorius, Diospyros ferrea and
Cibotium tree -ferns depending on available moisture and position rela
tive to the coastline.
3. There is little difference between successional trends on aa and
pahoehoe flows in the climatic region studied.
4. Rates of succession in this high-rainfall region are very variable.
At altitudes below 1000 feet and at mean annual temperatures of about
70°F., forest can develop within 200 years. At 60°F. mean annual
temperature (3000 to 4000 feet) forest can develop within 300 years of
flow formation.
5. The main factor determining the rate of plant succession appears to
be available moisture as governed by rainfall, temperature, inter-rock
porosity (i.e. size distribution of rocks and the frequency of crevices),
and the porosity of individual rocks.
6. Weathering trends in the young rocks analysed (<: 400 years old)
are similar to those described in the literature for more weathered

167
rocks. The regression analysis shows that climatic factors, plant
factors and physical and chemical properties of the weathering rock
are all influencing the rate of weathering with no one factor being
dominant.
7. Rates of rock weathering for the 400 year period studied were as
follows: pH changes of 0.76 to 1.50 pH units per century, sodium loss
of < 0.1 - 0.3% per century, calcium loss of <:. 0.1 - 0.4% per century,
relative titanium gain of 0.05 - 0.18% per century, and gain in water
of 0.6 - 0.910 per century.
8. Rates of rock weathering are decreasing with increasing time.
9. In this high-rainfall region, the most important effect of higher
temperatures is in increasing evaporation and thus decreasing
leaching, rather than in increasing the rate of chemical reactions.
10. Evidence from comparisons on the same flow and from the regression
analysis of the data from all flows, indicates that plants can have a
significant weathering effect, particularly on rates of sodium loss.
11. In this high-rainfall region, the rate of succession is highest
at altitudes below 1000 feet whereas the rate of rock weathering, at
least as far as elemental changes are concerned, is greater between
3000 and 4000 feet. Temperature, with its effects on plant growth,
evaporation and accumulation of organic matter, appears to be the
differentiating factor.
12. There is an unusually good opportunity to study processes of
succession and ~_e8:thering in a wide range of climates by using the
sequence of soils and vegetation that extends from sea-level to the
summit of Mauna Loa in the Stainback highway region. For this reason

168
it is considered that a series of representative areas in this sequence
should be permanently reserved for future study.

LITERATURE CITED
Baker, H.L., T. Sahara, T.M. Ryan, E.T. Murabayashi, A.Y. Ching,
F.N. Fujimura and I. Kuwahara. 1965. Detailed land classification
Island of Hawaii. Land StUdy Bulletin No.6, Land Study Bureau,
University of Hawaii, Honolulu, Hawaii.
Bardossy, G. and M. Bod. 1961. A new method to characterize the state
of oxidation of rocks. Acta Geologica 7: 29 - 35.
Barton, D.C. 1916. Notes on the disintegration of granite in Egypt.
J. Geol. 24: 382 - 393.
Bates, T.F. 1960. A mineralogical study of parent rock to clay mineral
alteration in the Hawaiian Islands. Dept. of Mineralogy, College
of Mineral Industries, Penn. State University.
Beschel, R.E. 1961. Dating rock surfaces by lichen growth and its
application to glaciology and physiography (lichenometry). In
Raash, G.O. (ed.), Geology of the Arctic. Univ. Toronto Press,
Toronto, v. 2: 1044 - 1062.
Blake, G.R. 1965. Bulk density. In Black, C.A. (Ed.). Methods of
Soil Analysis. Pt. 1, Chap. 30. American Soc. Agron. Monog. No.9.
Blumenstock, D.I. and Saul Price. 1967. Climates of the States. Hawaii.
Climatography of the United States No. 60-51, U.S. Dept. of
Commerce, Washington.
Burges, A. and D.P. Drover. 1953. The rate of podzol development in
the sands of the Woy Woy district, New South Wales. Aust. J. Bot.
1: 83 - 94.
Campbell, C.A., E.A. Paul, D.A. Rennie and K.J. McCallum. 1967. Applica
bility of the carbon-dating method of analysis to soil humus

170
studies. Soil Sci. 104: 217 - 224.
Champion, K.P., J.C. Taylor and R.N. Whitten. 1966. Rapid X-ray
fluorescence determinations of traces of strontium in samples of
biological and geological origin. Anal. Chem. 38 (1): 109 - 112.
Chandler, R.F. 1942. The time required for podzol profile formation
as evidenced by the Mendenhall glacial deposits near Juneau,
Alaska. Soil Sci. Soc. Amer. Proc. 7: 454 - 459.
Cline, M.G. 1955. Soil Survey of the Territory of Hawaii. U.S. Dept.
of Agric. Soil Survey Series 1939, No. 25.
Correns, D.W. 1949. Einfuhrung in die Mineralogie, Springer -Verlag,
Berlin.
Crocker, R.L. 1952. Soil genesis and the pedogenic factors. Quart.
Rev. Biol. 27: 139 - 168.
Crocker, R.L. and B.A. Dickson. 1957. Soil development on the
recessional moraines of the Herbert and Mendenhall glaciers, South
eastern Alaska. J. Ecol. 45: 169 - 185.
Crocker, R.L. and J. Major. 1955. Soil development in relation to
vegetation and surface age at Glacier Bay, Alaska. J. Ecol. 43:
427 - 448.
Cross, Whitman. 1915. Lavas of Hawaii and their relations. U. S. Geol.
Surv. Pap. 88.
Daly, R.A. 1911. Magmatic differentiation in Hawaii. J. Geol. 19:
289 - 316.
Dickson, B.A. and R.L. Crocker. 1953. A chronosequence of soils and
vegetation near Mt. Shasta, California. J. Soil Sci. 4: 123
154.
Doell, R.R., and A. Cox. 1961. Palaeomagnetism of Hawaiian lava flows.
Nature 192: 645 - 646.

171
Doty, M. S. 1961. Lava flow pioneer populations. ~ Fosberg, F.R.
(prep. by) Guide to Excursion III, pp. 139 - 146. Tenth Pac.
Sci. Cong. and Univ. of Hawaii.
_____ 1967. Contrast between the pioneer populating process on
land and shore. Bull. Southern Calif. Acad. of Sci. 66: 175 - 194.
Doty, M.S., and D. Mueller-Dombois. 1966. Atlas for Bioecology Studies
in Hawaii Volcanoes National Park. Hawaii Botanical Science Paper
No.2. University of Hawaii.
Druce, A.P. 1966. Tree-ring dating of recent volcanic ash and lapilli,
Mt. Egmont. New Zealand Jl. Bot. 4: 3 - 41.
Eggler, ~i.A. 1967. Influence of volcanic eruptions on xylem growth
patterns. Ecology 48: 644 - 647.
Efroymson, M.A. 1960. "Multiple Regression Analysis ll in Ralston, A.
and H. S. Wilf (Ed.). Mathematical Methods for Digital Computers,
Pt V. Chap. 17.
Esekiel, M., and K.A. Fox. 1959. Methods of Correlation and Regression
Analysis. 3rd Ed. John Wiley and Sons, Inc.
Fergusson, G.J., and T.A. Rafter. 1957. New Zealand l4C age measure-
ments - 3. New Zealand J. Sci. Tech. B.38: 732 - 749.
Forbes, C.N. 1912. Preliminary observations concerning the plant
invasion on some of the lava flows of Mauna Loa, Hawaii. Bernice
P. Bishop Mus., Occ. Papers 5 (1): 15 - 23.
Fosberg, F.R. (prep. by) 1961. Guide to Excursion III, Tenth Pacific
Science Congress. Tenth Pac. Sci. Congo and Univ. of Hawaii.
Frazer, G.D. 1960. Pahala Ash - an unusual deposit from Kilauea Volcano,
Hawaii. U. S. Geol. Surv. Prof. Pap. 400: B - 354 -5.
Friedman, I. 1968. Hydration rind dates rhyolite flows. Science 159:
878 - 880.

172
Gilliard, T. Unpbl. Identification and characterization of clay
mineral species in soils of the western region W-87. Unpub.
rept. to Dept. of Agronomy and Soil Science, University of Hawaii.
Goldich, S.S. 1938. A study in rock-weathering. J. Geol. 46: 17 - 58.
Grant, W.H. 1963. Weathering of Stone Mountain granite. Clays and
Clay Minerals. Proc. Eleventh National Conf. on clays and clay
minerals: 65 - 73.
Harrison, J.B. 1934. The katamorphism of igneous rocks under humid
tropical conditions. Imp. Bur. Soil Sci. (Harpenden), pp 79.
Hawaii Institute of Geophysics Interlaboratory Standards. Unpubl.
analyses by Japan Anal. Chem. Res. Inst. Rept. JAC 652B and U.S.
Geological Survey Lab. Rept. 66DC -7.
Hendricks, D.M. and L.D. Whittig. 1968. Andesite weathering II.
Geochemical changes from andesite to saprolites. J. Soil Sci. 19:
147 - 153.
Hitchcock, C.H. 1911. Hawaii and its volcanoes, 2nd ed. The
Hawaiian Gazette Co. Honolulu.
Hough, G.J., P.L. Gile and Z.C. Foster. 1941. Rock weathering and
soil profile development in the Hawaiian Islands. U.S. Dept. Agri.
Tech. Bull. 752.
Hsu, P.H. 1963. Effect of initial pH, phosphate, and silicate on the
determination of aluminum with aluminon. Soil Sci. 96: 230 - 238.
Jackson, M.L. 1956. Soil Chemical Analysis - Advanced Course. (Third
Printing, 1967). Publ. by the author, Dept. Soil Sci. University
of Wisconsin, Madison, Wisconsin.
______ 1958. Soil Chemical Analysis. Prentice-Hall.

173
Jenny, H. 1931. Soil organic matter-temperature relationships in the
eastern United States. Soil Sci. 31: 247 -252.
________ 1941. Factors of Soil Formation, a system of quantitative
pedology. McGraw-Hill Book Co. Inc. New York.
_______ 1958. Role of the plant factor in the pedogenic functions.
Ecology 39: 5 - 16.
1961. Derivation of sta.te factor equations of soils and--------ecosystems. Soil Sci. Soc. Amer. Prac. 25: 385 - 388.
Jenny, H., S.P. Gessel and F.T. Bingham. 1949. Comparative study of
decomposition rates of organic matter in temperate and tropical
regions. Soil Sci. 68: 419 - 432.
Julian, P.R. and H.C. Fritts. 1968. On the possibility of quantita
tively extending climatic records by means of dendroclimatological
analysis. Proc. 1st Statistical Meteorological Conf., Connecticut.
Amer. Met. Soc.
Kear, D. and B.L. Wood. 1959. The Geology and Hydrology of Western
Samoa. New Zealand Geol. Surv. Bull. 63.
Kelly, W.C. andJ.H. Zumberge. 1961. Weathering of a quartz diorite
at Marble Point, McMurdo Sound, Antarctica. J. Geo1. 69: 433 - 446.
Kelley, W.P., H. Jenny and S.M. Brown. 1936. Hydration of minerals and
soil colloids in relation to crystal structure. Soil Sci. 41:
259 - 274.
Kosaka, J. 1963. Division of the process of humification in upland
soils, and its application to soil classification. Soil Sci. and
P1. Nutr. 9: 14 - 18.
Krajina, V.J. 1963. Biogeoclimatic zones on the Hawaiian Islands.
Newsletter of the Hawaiian Botanical Society 2 (7): 93 - 98.

Krauskopf, K.B. 1959. The geochemistry of silica in sedimentary
environments: silica in sediments. Soc. Economic Palae. and Min.
Symposium 7: 4 - 18•.,
Krutchkoff, R.G. 1967. Classical and inverse regression methods of
calibration. Technometrics 9: 425 - 439.
Lamb, H.H. and A.I. Johnson. 196L Climatic variation and observed
changes in the general circulation. Geografiska Annaler 43:
363 - 400.
Lawrence, D.B. 1950. Estimating dates of recent glacier advances
and recession rates 'by studying tree growth layers. Trans. Am.
Geophys. Union 31: 243 - 248.
1954. Diagrannnatic history of the northeast slope of Mt.-----St. Helens, Washington. Mazama 36: 41 - 44 (Ponland, Oregon).
l-facCaughey, V. 1917. Vegetation of Hawaiian lava flows. Bot. Gaz.
64: 386 - 420.
Macdonald, G.A. 1944. The 1840 eruption and crystal differentiation
in the Kilauean magma column. Amer. J. Sci. 242: 177 - 189.
1949a. Petrography of the Island of Hawaii. U. S.------GeoL Surv. Prof. Pap. 214 -D.
1949b. Hawaiian Petrographic Province. BulL GeoL------Soc. Amer. 60: 1541 - 1596.
Macdonald, G.A. and J.P. Eaton. 1964. Hawaiian volcanoes during 1955.
U.S. Geol. Surv. Bull. 1171: 156 - 157.
Macdonald, G.A. and T. Katsura. 1962. Relationship of Petrographic
Suites in Hawaii. Amer. Geoph. Un. Monog. 6: 187 - 195.
1964. Chemical composition of Hawaiian
Lavas. J. Petrol. 5: 82 - 133.

175
Mason, B. 1966. Principles of Geochemistry (Third Ed.). John Wiley
and Sons.
Matsusaka, Y., G.D. Sherman, and L.D. Swindale. 1964. Nature of
magnetic minerals in Hawaiian soils. Soil Sci. 100: 192 - 199.
McClelland, J.E. 1950. The effect of time, temperature, and particle
size on the release of bases from some common soil-forming
minerals of different cry~tal structure. Soil Sci. Soc. Amer.
Froc. 15: 301 - 307.
McGeorge, W.T. 1917. Composition of Hawaiian soil particles. Hawaii
Agric. Expt. Sta. Bull. 42.
Montagne, Hebel W. Unpbl. Unpubl. rept. to Dept. Agronomy and Soil
Science, University of Hawaii.
Mordy, W.A. 1957. Geographic and Climatic notes on the Proj ect Shower
area. Tellus 9: 472 - 474.
Morison, C.G.T., A.C. Hoyle and J.F. Hope-S~mpson. 1948. Tropical
soil-vegetation catenas and mosaics. J. Ecol. 36: 1 - 84.
Mueller-Dombois, D. 1966. The Vegetation Map and Vegetation Profiles.
Chap. 8 ~ Doty, M.S. and D. Mueller-Dombois, Atlas for Bioecology
Studies in Hawaii Volcanoes National Park. Hawaii Bot. Sci. Pap.
No.2. University of Hawaii.
Nakamura, M.T. and G.D. Sherman. 1961. The vanadium content of Hawaiian
Island soils. Hawaii Agric. Expt. Stn. Tech. Bull. 45.
Newman, I.V. 1954. Locating strata in tropical rain forests. J. Ecol.
42: 218 - 219.
Olson, J.S. 1958. Rates of succession and soil changes on Southern
Lake Michigan sand dunes,. Bot. Gaz. 119: 125 - 170.

176
Perrin, R.M. S., E.H. Willis and C.A.H. Hodge. 1964. Dating of humus
podzols by residual radiocarbon activity. Nature 202: 165 - 166.
Price, N.B. and G.R. AngelL 1968. Determination of minor elements
in rocks by thin :fIlm X-ray fluorescence techniques. AnaL
Chern. 40 (3): 660 - 663.
Price, P.B. and R.M. Walker. 1963. Fossil tracks of charged particles
in micas and the age of minerals. J. Geophys. Res. 68: 4847
4862.
Polynov, B.B. 1937. The Cycle of Weathering. TransL by A. Muir.
Thomas Murby and Co., London.
Reiche, Parry. 1943. Graphic representation of chemical weathering.
J. Sediment. Petrol. 13: 58 - 68.
Richards, P.W. 1952. The Tropical Rain Forest. Cambridge Univ. Press.
Robyns, W. and S.H. Lamb. 1939. Preliminary ecological survey of the
Island of Hawaii. BulL Jord. Bot., Brux 15: 241 - 293.
Rooksby, H.P. 196L Oxides and hydroxides of aluminum and iron. Chap.
X in Brown, G. (Ed.). The X-ray Identification and Crystal
Structure of Clay Minerals. Mineralogical Society, London.
Rubin, M. and S.M. Berthold. 196L U.S. GeoL Survey radiocarbon dates
VI. Radiocarbon 3: 86 - 98.
Ruxton, B.P. 1968. Rate:.d of weathering of quaternary volcanic ash in
North-east Papua. Trans. 9th Int. Congo Soil Sci. 1968. Vol. IV:
367 - 376. Int. Soc. Soil Sci.
Sabels, B.E. 1963. Age studies on basaltic lava flows using natural
alpha activity and thermoluminescence. In Radioactive Dating.
International Atomic Energy Agency, Vienna.

177
Salisbury, E.J. 1925. Note on the edaphic succession in some dune
soils with special reference to the time factor. J. Ecol. 13:
322 - 328.
Selling, O.H. 1948. Studies in Hawaiian pollen statistics. Part III.
On the late quaternary history of the Hawaiian vegetation. B.P.
Bishop Museum Spec. Pub. 39.
Shapiro, L. and W.W. Brannock. 1962. Rapid analysis of silicate,
carbonate and phosphate rocks. Geol. Surv. Bull. 1144 - A.
Sherman, G.D. and H. Ikawa. 1968. Soil sequences in the Hawaiian
Islands. Pac. Sci. 22: 458 - 464.
Sherman, G.D. and Y. Kanehiro. 1948. The chemical composition of
certain forest floors in the Hawaiian Islands. Biennial Report.
University of Hawaii Ag:dc. Expt. Stn. Honolulu, p. 54.
Sherman, G.D. and G. Uehara. 1956. The weathering of olivine basalt
in Hawaii and its pedogenic significance. Soil Sci. Soc. Amer.
Proc. 20: 337 - 340.
Skottsberg, C. 1941. Plant succession on recent lava flows in the
Island of Hawaii. Gotteborgs Kungl Vetenskapoch Vitterhelssamhalles
Handlinger Sjatte fojden, sere B., Bd. 1, No.8.
Smathers, G. 1966. Succession on new surfaces. In Atlas for Bio
ecology Studies in Hawaii Volcanoes National Park (pp 341 - 345)
by M.S. Doty and D. Mueller-Dombois. Hawaii Bot. Sci. Paper No.2
Univ. of Hawaii.
Smith, W.W. 1962. Weathering of some Scottish basic igneous rocks with
reference to soil for.mation. J. Soil Sci. 13: 202 - 215.
Snedecor, G.W. 1956. Statistical Methods. Iowa State University Press.

Geology and Ground-water
Bull. 9. Hawaii Division of
178
Soil Survey Staff. 1951. Soil Survey Manual. U.S. Dept. Agriculture
Handbook No. 18.
1968. Supplement to Soil Classification System (7th--------Approximation). Histosols. Soil Conservation Service, U.S.
Dept. of Agriculture.
Stearns, H.T. 1966. Geology of the State of Hawaii. Pacific Books,
Palo Alto, California.
Stearns, H.T. and G.A. Macdonald. 1946.
Resources of the Island of Hawaii.
Hydrography.
Stevens, R.E. and M.K. Carron. 1948. Simple field test for distinguish
ing minerals by abrasion pH. Am. Mineral. 33: 31 - 50.
Stork, A. 1963. Plant immigration in front of retreating glaciers,
with examples from the Kebnekajse area, Northern Sweden. Geo
grafiska Ann. 45: 1 - 22.
Suhr, N.H. and C.O. Ingamells. 1966. Solution technique for analysis
of silicates. Anal. Chem. 38: 730 - 734.
Swindale, L.D. 1966. A mineralogical study of soils derived from basic
and ultrabasic rocks in New Zealand. New Zealand Jl. Sci. 9:
484 - 506.
Swindale, L.D. and G. Uehara. 1966. Ionic relationships in the pedo
genesis of Hawaiian soils. Soil Sci. Soc. Amer. Proc. 30: 726
730.
Tagawa, H. 1964. A study of the volcanic vegetation in Sakurajima,
south-west Japan. I. Dynamics of vegetation. Memoirs of the
Faculty of Science, KYushu University, Series E (Biology) 3:
165 - 228.

179
Tanada, T. 1951. Certain properties of the inorganic colloidal
fraction of Hawaiian soils. J. Soil Sci. 2: 83 - 96.
Tezuka, Y. 1961. Development of vegetation in relation to soil forma
tion in the volcanic Island of Oshima, Izu, Japan. Jap. Jour.
Bot. 17: 371 - 496.
Tiller, K.G. 'rhe geochemistry of basaltic materials and associated
soils of south-eastern South Australia. J. Soil Sci. 9: 225 - 241.
Uehara, G., H. Ikawa and G.D. Sherman. 1966. Desilication of halloy
site and its relation to gibbsite formation. Pacific ScL 20:
119 - 124.
Volchok, H.L. and J.L. Kulp. 1957. The ionium method of age determina
tion. Geocrrlm. et Cosmochim. Acta 11: 219 - 246.
Viereck, L.A. 1966. Plant succession and soil development on gravel
outwash of the Muldrow glacier, Alaska. Eco1. Monog. 36: 181 - 199.
Wager, L.R. and R.L. Mitchell. 1951. The distribution of trace elements
during strong fractionation of basic magma - a further study of the
Skaergaard intrusion, East Greenland. Geochim. et Cosmochim. Acta 1:
129 - 208.
1953. Trace elements in a suite of Hawaiian------lavas. Geochim. et Cosmocbim. Acta 3: 217 - 223.
Walker, T.W. 1964. The significance of phosphorus in pedogenesis. In
Hallsworth, E.G. and D.V. Crawford (Ed.). Experimental Pedology,
pp 295 - 316. Butterworths, London.
Wambeke, A.R. van 1962. Criteria for classifying tropical soils by age.
J. Soil Sci. 13: 124 - 132.
Washington, H.S. 1923. Petrology of the Hawaiian Islands: II. Hualalai
and Mauna Loa. Amer. J. Sci. 5th sere 6: 100 - 126.

180
Weaver, K.F. 1967. Magnetic clues help date the past. Nat. Geog.
131 (5): 696 - 701.
Wells, N. 1960. Total elements in topsoils from igneous rocks: an
extension of geochemistry. J. Soil Sci. 11: 409- 424.
Wentworth, C.K. 1938. Ash Formations on the Island of Hawaii. 3rd
Spec. Rept. Hawaii Volcano Observatory, Honolulu.
Williams, E.J. 1959. Regression Analysis. John Wiley and Sons. New
York.
1969. A note on regression methods in calibration.
Technometrics 11: 189 - 192.
Wright, C.H. 1934. Soil Analysis. A Handbook of Physical and Chemical
Methods.

181
APPENDIX I
PUBLISHED ANALYSES OF LAVA FLOWS SAMPLED IN STUDY
Element as Oxide 1840 1881 1955
CaO
MgO
Ti02
Na2
0
K20
P2
05
MnO
HO+2
47.25% 48.57% 52.65% 52.02% 51.06%
9.07 10.51 12.12 13.54 13.72
1.45 2.1~ 2.19 5.25 2.44
10.41 9.45 8.87 6.58 10.34
7.88 8.06 10.12 10.23 9.46
19.96 17.53 1.43 7.31 5.44
1.61 1.48 3.52 2.09 3.65
1.38 1.59 2.25 2.30 2.62
0.35 0.34 0.35 0.41 0.76
0.21 0.19 0.25 0.27 0.39
0.13 0.16 0.11 0.09 0.18
0.04 0.37 0.24 0.06 0.12
1840 Pierite -basalt, Kilauea 1840 lava flow at Nanawa1e Bay, Punadistrict (Cross 1915).
1852 Picrite-basa1t, Mauna Loa 1852 flow (Daly 1911).
1881 Hypersthene-bearing basalt, Mauna Loa 1880-81 flow near Hi10(Washington 1923).
1942 Basalt, earliest lava of 9200' vent of Mauna Loa 1942 flow,0.4 miles west of main cone (Macdonald 1949b).
1955 Basalt, Kilauea lava flow from westernmost vents, erupted Mar.20, 1955. Collected at Pahoa~a1apana road5 miles south of Pahoa, east Puna (Macdonaldand Eaton 1964).
Note: These figures are analyses from particular parts of the flows thatinterested the investigator. They are not necessarily representativeof the composition of the flow as a whole.
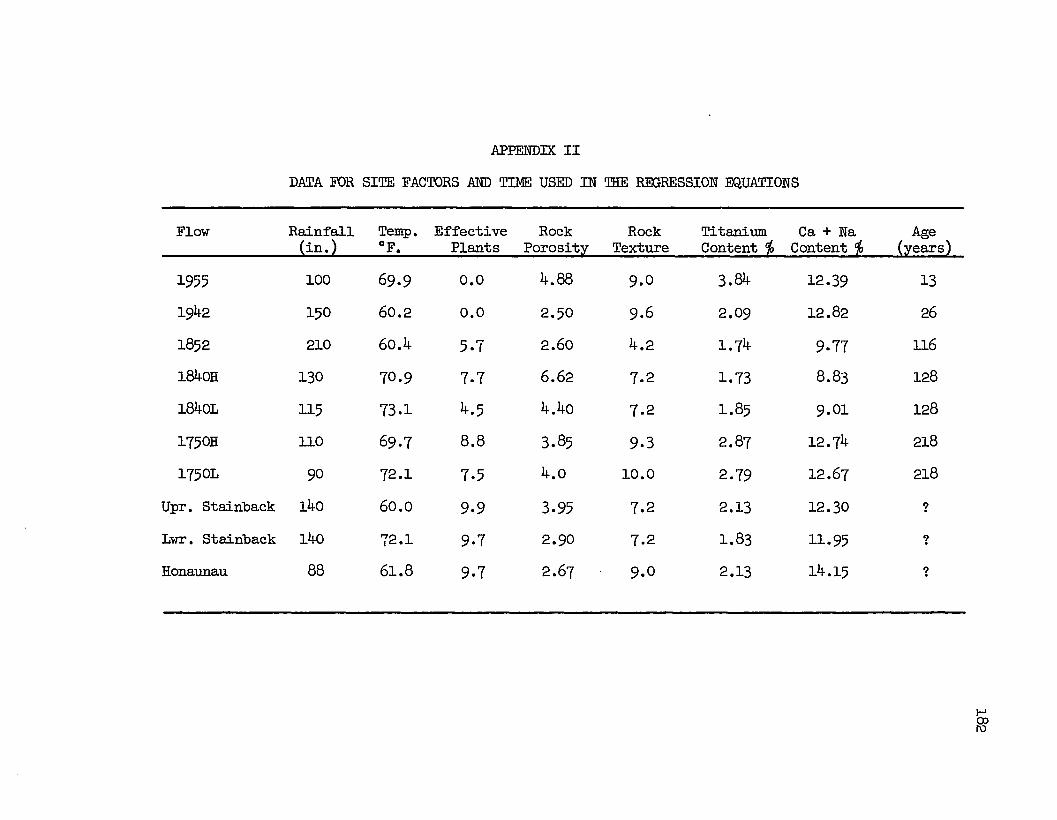
APPENDIX II
DATA FOR SITE FACTORS AND TIME USED IN TEE RIDRESSION EQUATIONS
Flow Rainfall Temp. Effective Rock Rock Titanium Ca + Na Age(in.) of. Plants Porosity Texture Content % Content % (years)
1955 100 69.9 0.0 4.88 9.0 3.84 12.39 13
1942 150 60.2 0.0 2.50 9.6 2.09 12.82 26
1852 210 60.4 5.7 2.60 4.2 1.74 9.77 116
1840H 130 70·9 7.7 6.62 7.2 1.73 8.83 128
1840L 115 73.1 4.5 4.40 7.2 1.85 9.01 128
1750H 110 69.7 8.8 3.85 9.3 2.87 12.74 218
1750L 90 72.1 7.5 4.0 10.0 2.79 12.67 218
Upr. Stainback 140 60.0 9.9 3.95 7.2 2.13 12.30 ?
Lwr. Stainback 140 72.1 9.7 2.90 7.2 1.83 11.95 ?
Honaunau 88 61.8 9.7 2.67 9.0 2.13 14.15 ?
I-'CPlU

183
APPENDIX III
LIST OF PLANTS FOUND ON SAMPLING SITES
Note: Lower plants are not recorded excepting Stereocaulon vulcaniand Rhacomitriurn. lanuginosum••
(X) = introduced species
..~I-l 0
~ 13 ~ .!l:l
~.g l!'\ f3 C\J r4 l!'\ C\J +'
l!'\~
l!'\ l!'\ ~ co l!'\~
(J)
! 0'. t-- t-- (J) 0'. co cor4 r4 r4 r4 r4 r4 r4 r4 r4 ..
~~ p
PTERlDOPRYTA:ASPIDIACEAE
Cyclosorus parasiticus (L.)Farwell +
C. sandwichensis (Brack.) Copel. +
C. truncatus (Poir.) Farwell +
ASPLENIACEAE
Asplenium nidus L. + +
Asplenium sp. + + +
BLECHNACEAE
Sadleria cyatheoides Kaulf. + + + + + + +
DAVALLIACEAE
Nephrolepis ?exaltata(L.)Schott + + + +
~rsutula (Forst.f.) Presl (X) + + + + + + +
GLEICHENIACEAE
icranopteris linearis (Burm.) + + + + +Underwood
MENOPRYLLACEAE
andenboschia cyrtotheca (Hilleb. ) + +Copel.
;YCOPODIACEAE
copodium cernuum L. + + + + +Ly
D
v
HY

APPENDIX III (Continued). LIST OF PLANTS FOUND ON SAMPLING SITES
184
.. ..!I:l
t3 gs t3 gs ..!I:l f30 f3.g 1..1"\ C\l r-l 1..1"\ C\l u.l
~1..1"\~
1..1"\ 1..1"\ u.l -a\ eo 1..1"\ 1..1"\
~ 0\ t- t- eo eo eo .r-l r-l r-l r-l r-l . r-l r-l r-l r-l f-t
~ ~ ~
MARATTIACEAE
Marratia douglasii (Presl)Baker +
OPHIOGLOSSACEAE
Ophioglossum pendulum (Presl) + + +Clausen
POLYPODIACEAE
Pleopeltis thunbergiana Kaulf. +
Polypodium pellucidum Kaulf. +
PSlLOTACEAE
Psilotum nudum (L.) Beauv. + + +
PTERIDACEAE
Cibotium chamissoi Kaulf. +
C. glaucum (Smth) Hook. et Arn. + + +
Coniogramme pilosa (Brack.) Hieron. +
Pellaea ternifolia (Cav.) Link +
Sphenomeris chusana (L.) Copel. +
MONOCOTYLEDONAE: CYPERACEAE
Fimbristylis cymosa R. Br. +
Machaerina angustifolia (Gaud.) + + + + +Koyama
Uncinia uncinata (L.) Kukenth. + +
GRAMINAE
Andropogon ?glomeratus (Walt.) BSP. +(X)

185
APPENDIX III (Continued). LIST OF PLANTS FOUND ON SAMPLING SITES
.. ..!o:l
H ~ § ~..!o:l :f30 :f3
~.g I.I'\ C\J r-I I.I'\ C\J t:r.l
I.I'\ ...::I" I.I'\ I.I'\ t:r.l ...::I" co is is~ 0\ co t- t- 0\ co .r-I r-I r-I r-I r-I . r-I r-I r-I r-I J.l
::.::: ~ ~
GRAMINAE (Continued)
Oplismenus hirtellus (L.) Beauv. + +
LILIACEAE
Astelia sp. +.
Cordyline fruticosa (L.) Goepp. + +
Smilax. sandwicensis Kunth + +
ORCHIDACEAE
Arundina bambusae folia Lindl. (X) + + + +
Spathoglottis plicata Bl. (X) + + + +
PALMAE
Cocos nucifera L. +
PANDANACEAE
reycinetia arborea Gaud. + +
andanus tectorius Park. +
ICOYLEDONAE: ANACARDIACEAE
Schinus terebinthifolius Raddi (X) +.CYNACEAE
lyxia olivaeformis Gaud. +
ACEAE
heirodendron trigynum (Gaud. ) + +Heller
A
F
D
P
APO
ARALI
C

186
APPENDIX III (Continued). LIST OF PLANTS FOUND ON SAMPLING SITES
An
Al
GO
V
G
. ...!I:l ..!I:l
~0
~ c1 ~ :f3 :S.g It'\ tr.l (\J r-I It'\ (\J tr.l
~It'\~
It'\ It'\ ...::r ~ ~ ~~
0\ t- t- . 0\ .r-I r-I r-I r-I r-I
~r-I r-I r-I r-I a.~ p
CASUARINACEAE
Casuarina equisetifolia L. (X) +
COMPOSITAE
Dubautia scabra (D.C.) Keck +
Pluchea odorata (L.) Casso (X) +
Vernonia cinerea (L.) Less (X) +
EBENACEAE
Diospyros ferrea var. J2ubescens + +Fosb.
EPACRIDACEAE
Styphelia tameiameiae (Cham. et + + + + +Schlecht.) F. Muell.
ERICACEAE
Vaccinium calycinum Smith + + +
• reticulatum Smith + + + + -I-
EUPHORBIACEAE
eurites moluccana (L. )Willd. +
tidesma ?platyphyllum Mann +
ESNERIACEAE
Cyrtandra ?platyphylla Gray +
ODENIACEAE
Scaevola taccada (Gaertn. )Roxb • +

187
APPENDIX III (Continued). LIST/~F PLANTS FOUND ON SAMPLING SITES/
p
E
Me
Ar
R
p
o
o
P
p
p
R
MYR
(i .. .!4
cJ 0~ cJ ~
.!4 ~.g I.!"\ ~ C\I r-I I.!"\ C\I Cf.l
~I.!"\~
I.!"\ I.!"\ Cf.l .=t' co I.!"\ I.!"\
~0\ t- t- 0\ co co co .
r-I r-I r-I r-I r-I . r-I r-I r-I r-I~::.:: ~ ::>
.LOBELIACEAE
Lobelia sp. +
LOGANIACEAE
'1~~sp. +
MORACEAE
~cropia pe1tata L. (X) +
SINACEAE
Ardisia e11iptica Thunb. +
disia sp. + +
TACEAE
trosideros po1ymorpha Gaud. + + + + + + + + + + +
sidium catt1eianum Sabine + + +- - - o••_
. guajava L. + + +I
NAGRACEAE
pi10bium '1cinerium A.Rich. (X) '*lPERACEAE
eperomia '1cookiana C.DC. +
eperomia sp. + +
OSACEAE
steome1es anthy11idifo1ia (Sm.) +Lindl.
ubus rosaefo1ius Sm. (X) +
MYR

APPENDIX III (Continued). LIST OF PLANTS FOUND ON SAMPLING SITES
188
. ...!4 ..!4
§ 0~ § l=§ ~ ~
-§ l!'\ tr.l C\J g3 l!'\ C\J rf)
~l!'\~
l!'\ l!'\~
l!'\ l!'\
~0\ I:'- I:'- . co co .
r-l r-l r-l r-l r-l
~r-l r-l r-l r-l r-t
::.::: ~
RUBIACEAE
Coffea sp. +
Coprosma ernodeoides Gray + +
C. menziesii Gray + + +
Coprosma sp. +
Gouldia terminali sHook. et Arn. +
Hedyotis centranthoides (H.and A.) + + +Steud.
Morinda citri folia L. +
Psychotria hawaiiensis Gray + + +
URTICACEAE
Pipturus sp. + + +
Stereocaulon vulcani + + + + + + +
Rhacomitrium lanuginosum + + + + + +

APPENDIX IV
CORRELATION MATRIX FOR VARIABLES FROM HISTORIC FLOWS(Variables listed at end of appendix)
1 1 2 3 4 5 6 7 8 9 10 11
1 1.000 0.819 0.308 0.387 0.048 0.544 0.294 0.356 0.394 -0.024 0.539
2 1.000 0.460 0.498 0.133 0.651 0.480 0.503 0.527 0.154 0~.547~
3 1.000 0.588 -0.270 0.194 0.966 0.448 0.750 0.525 0.0201
4 1.000 -0.347 0.220 0.544 0.923 0.974 0.296 0.054
5 1.000 0.035 -0.140 -0.145 -0.356 0.049 0.216
6 1.000 0.235 0.268 0.229 -0.076 0.677
7 1.000 0.503 0.704 0.569 0.147
8 1.000 0.874 0.307 0.235
9 1.000 0.368 0.037
10 1.000 -0.055
11 I 1.000I
I-'ex>\0

APPENDIX IV (Continued)
CORRELATION MATRIX FOR VARIABLES FROM HISTORIC FLOWS
12 13 14 15 16 17 18 19
1 0.531 -0.250 0.165 0.169 0.412 0.254 0.571 0.3572 0.584 -0.100 0.129 0.360 0.025 0.306 0.533 0.3063 0.074 0.455 -0.301 0.101 -0.112 0.030 0.190 -0.0134 0.077 0.201 -0.049 0.239 -0.076 0.163 0.113 -0.068
5 0.240 -0.159 -0.091 -0.176 -0.008 -0.010 0.172 0.3216 0.681 -0.305 0.299 0.301 0.095 0.179 0.583 0.408
7 0.208 0.410 -0.379 0.008 -0.122 0.022 0.300 0.1618 0.262 0.089 -0.121 0.115 -0.081 0.164 0.249 0.1739 0.067 0.265 -0.102 0.243 -0.087 0.176 0.122 -0.080
10 0.098 0.556 -0·551 -0.236 -0.238 -0.273 0.181 0.18711 0.957 -0.285 0.044 -0.091 0.205 -0.103 0.911 0.83612 1.000 -0.183 -0.016 -0.083 0.094 -0.171 0.935 0.86213 1.000 -0.781 -0.347 -0.502 -0.611 -0.030 -0.03114 1.000 0.765 0.093 0.594 -0.236 -0.38915 1.000 -0.374 0.700 -0.335 -0.56616 l.000 0.126 0.292 0.29217 1.000 -0.325 -0.42018 1.000 0.92519 1.000
Note: Correlation coefficients must be greater than 0.246 (sign ignored) inorder to reach the 95'!o confidence level (65 degrees of freedom).
I-'\00

APPENDIX IV (Continued)
CORRELATION MATRDCroR VARIABLES FROM HISTORIC FLOWS
List of Variables
191
1
2
3
4
5
6
7
8
9
10
11
12
13
14
15
16
17-_.-.-...- ...."..._. 18
19
~pR
pRc
Sodium loss
Calcium loss
Titanium gain
110-350° F. weight loss
Sodium loss relative to titanium
Calcium loss relative to titanium
Combined calcium + sodium loss
Depth of organic horizon
Timber volume estimate
Time (=Age)
Mean annual rainfall
Rock texture
Combined calcium + sodium content of unweathered rock
Rock porosity
Titanium content of unweathered rock
Effective plant factor
Mean annual temperature


![Master Harold and the Boys - Athol Fugard [Text]](https://static.cupdf.com/doc/110x72/542e50ec219acd46518b57e6/master-harold-and-the-boys-athol-fugard-text.jpg)


![Master Harold and the Boys By Athol Fugard. Athol Fugard [AtOl´ fyOO´gard] White South African Born June 11,1932 in the remote village of Middleburg,](https://static.cupdf.com/doc/110x72/56649cda5503460f949a3d89/master-harold-and-the-boys-by-athol-fugard-athol-fugard-atol-fyoogard.jpg)
