Marquette Universitye-Publications@Marquette
Chemistry Faculty Research and Publications Chemistry, Department of
4-1-2006
Thermal Stability and Degradation Kinetics ofPoly(methyl Methacrylate)/Layered CopperHydroxy Methacrylate CompositesEverson KandareMarquette University
Hongmei DengMarquette University
Dongyan WangCornell University
Jeanne HossenloppMarquette University, [email protected]
Accepted version. Polymers for Advanced Technologies, Vol. 17, No. 4 (April 2006): 312-319. DOI. ©Wiley 2006. Used with permission.

NOT THE PUBLISHED VERSION; this is the author’s final, peer-reviewed manuscript. The published version may be accessed by following the link in the citation at the bottom of the page.
Polymers for Advanced Technology, Vol. 17, No. 4 (April 2006): pg. 312-319. DOI. This article is © Wiley and permission has been granted for this version to appear in e-Publications@Marquette. Wiley does not grant permission for this article to be further copied/distributed or hosted elsewhere without the express permission from Wiley.
1
Thermal Stability and Degradation
Kinetics of Poly(methyl
Methacrylate)/Layered Copper
Hydroxy Methacrylate Composites
Everson Kandare Department of Chemistry, Marquette University
Milwaukee, WI
Hongmei Deng Department of Chemistry, Marquette University
Milwaukee, WI
Dongyan Wang Department of Materials Science and Engineering, Cornell
University
416 Bard Hall, Ithaca, NY
Jeanne M. Hossenlopp Department of Chemistry, Marquette University
Milwaukee, WI
Abstract:
Poly(methyl methacrylate) (PMMA)/copper hydroxy methacrylate
(CHM) composites were prepared via solution blending and bulk
polymerization. Addition of 3% by weight of the CHM additive using solution
blending resulted in a significant increment (∼45°C) in thermogravimetric
NOT THE PUBLISHED VERSION; this is the author’s final, peer-reviewed manuscript. The published version may be accessed by following the link in the citation at the bottom of the page.
Polymers for Advanced Technology, Vol. 17, No. 4 (April 2006): pg. 312-319. DOI. This article is © Wiley and permission has been granted for this version to appear in e-Publications@Marquette. Wiley does not grant permission for this article to be further copied/distributed or hosted elsewhere without the express permission from Wiley.
2
analysis (TGA) T50, the temperature at which 50% of the original polymeric
mass is lost. The value T50 increased by 30°C for a PMMA composite with 4%
CHM, synthesized via bulk polymerization. Activation energies, Ea, were
calculated as a function of conversion fractions (TGA decomposition profile)
for the polymeric materials. Analysis of multiple heating rate data using the
Flynn–Wall–Ozawa method resulted in Ea values that were 50 kJ mol−1 higher
for conversions above 0.5 in the solution blended composite compared to a
reference sample of pure PMMA recrystallized from the same solvent. Similar
results were obtained for bulk polymerization process with differences in Ea
values > 30 kJ mol−1 relative to pure PMMA. However, in contrast to previous
studies of bulk polymerized samples, the solution-blended composite
exhibited no improvement in cone calorimetry determination of total heat
release as compared with the reference PMMA sample
Keywords: poly(methyl methacrylate), layered hydroxy salt, degradation,
thermogravimetric analysis (TGA), composites.
Introduction
Inorganic/organic hybrid layered materials with
nanodimensional interlayer spacings can form nanocomposites with
polymers either via intercalation or exfoliation.1–7 Marked
improvements, relative to the pure polymer, have been reported in
physical properties of these nanocomposites including the tensile
strength, tensile modulus, flexural strength, thermal, and corrosion
stability compared to virgin polymers.8–15 In addition to natural cationic
clays, synthetic anion clays such as layered double hydroxides and
hydroxy double salts (HDSs) have been utilized for this purpose.16
HDSs are formed from two divalent metals and have the general
formula , where M2+and M’2+ represent
the different divalent metals and An--represents the interlayer anions.
Similarly, layered hydroxy salts (LHSs), with a general formula,
, consist of positively charged metal hydroxide layers
and exchangeable interlayer anions, . The advantage of synthetic
‘‘clays’’ is the possibility of varying the identity and composition of
constituent metal elements hence providing additional design
parameters to optimize additive effects on the properties of the virgin
polymer.
Thermal degradation patterns of poly(methyl methacrylate)
(PMMA) and PMMA-clay nanocomposites have been extensively

NOT THE PUBLISHED VERSION; this is the author’s final, peer-reviewed manuscript. The published version may be accessed by following the link in the citation at the bottom of the page.
Polymers for Advanced Technology, Vol. 17, No. 4 (April 2006): pg. 312-319. DOI. This article is © Wiley and permission has been granted for this version to appear in e-Publications@Marquette. Wiley does not grant permission for this article to be further copied/distributed or hosted elsewhere without the express permission from Wiley.
3
studied.17–20 Addition of copper-containing layered hydroxides to PMMA
through bulk polymerization has been shown in previous work to result
in a dramatic improvement in the thermal stability of the resultant
composites.21 In particular, a significant reduction in the total heat
release (THR) (~20–30%) from combustion of the composites was
observed using cone calorimetry for these microcomposites. However,
the need to improve the HDS or LHS additive dispersion was noted and
further work was needed to investigate the details of how the additives
serve to enhance PMMA thermal stability.21 Nanoscale dispersion of the
additives in the polymer matrix results in a large interfacial area
between the polymer chains and the additive leading to physical
property enhancements observed for polymer nanocomposites. In clay
nanocomposites, typically nanodispersion occurs via intercalation and
exfoliation. However, nanocomposites may be more broadly defined,
as the dispersion of nano-sized particles in the polymer matrix, thus
leading to polymer/additive interaction at the nanoscale. For example
polymer nanocomposites containing metal, silica or metal oxide
nanoparticles have been shown to exhibit enhanced mechanical,
magnetic, optical, or electrical properties.8,12,15,22–24
In the work reported here, a LHS additive, copper hydroxy
methacrylate (CHM) is added to PMMA via solution blending and bulk
polymerization. Composites are analyzed using X-ray diffraction
(XRD), transmission electron microscopy (TEM), and Fourier transform
infrared (FT-IR) spectroscopy. The effects of sample preparation
method on the composite thermal stability are determined via
thermogravimetric analysis (TGA), differential thermal analysis (DTA),
and cone calorimetry. XRD analysis is used to follow the evolution of
the copper content of the additive during heating in order to explore
the potential roles that the metal may play in thermal stabilization of
PMMA.
Kinetics studies of the thermal degradation of PMMA and its
composites have also been shown to be helpful for analyzing thermal
stabilization effects.25–31 In the work reported here, activation energies
are determined via an isoconversional method over the range of mass-
loss conversions (a) in multiple-heating-rate TGA experiments.
NOT THE PUBLISHED VERSION; this is the author’s final, peer-reviewed manuscript. The published version may be accessed by following the link in the citation at the bottom of the page.
Polymers for Advanced Technology, Vol. 17, No. 4 (April 2006): pg. 312-319. DOI. This article is © Wiley and permission has been granted for this version to appear in e-Publications@Marquette. Wiley does not grant permission for this article to be further copied/distributed or hosted elsewhere without the express permission from Wiley.
4
Experimental
Monomeric methyl methacrylate (MMA), benzoyl peroxide (BPO)
initiator, reagent grade acetone, NaOH, and commercial PMMA
(molecular weight of 996,000 g mol-1) were obtained from Aldrich
Chemical Co. Copper(II) methacrylate hydrate (97%)
[(H2C=C(CH3)CO2)2Cu · xH2O] and FT-IR-grade KBr were obtained
from Alfar Aesar. All chemicals were used without further purification
with the exception of the MMA solution where the hydroquinone mono
methyl ether inhibitor was removed by passing through an inhibitor
removal column (Aldrich).
The LHS additive, CHM, was prepared via a standard literature
method used for the preparation of isomorphic LHSs like
Cu2(OH)3(CH3CO2) · xH2O.32 NaOH (0.1 M; 500 ml) was added in a
dropwise fashion to 500 ml of 0.1 M copper(II) methacrylate hydrate
yielding a pH of 8.1 ± 0.1. The dispersion was filtered, washed, and
dried at room temperature.
A 3% loaded PMMA/layered CHM (PMMA/CHM-3) composite was
made via solution blending by mixing 97 g of the commercial PMMA,
dissolved in 800 ml of acetone for 3 hr, with 3 g of CHM which had
been dispersed in 200 ml of acetone for 1 hr. The resultant mixture
was mechanically stirred for 96 hr. The resulting viscous liquid was
poured out onto an aluminum foil boat to maximize the evaporation of
acetone. The composite was then oven dried at 100°C for 6 hr after
which it was crushed and dried again until a constant mass was
achieved. A reference sample was made from dissolving 100 g of
commercial PMMA in 1 l of acetone then allowing the solvent to
evaporate. This sample, (PMMA/ CHM-0) was cured in the same way
as PMMA/CHM-3.
A 4% CHM loaded PMMA composite (PMMA/CHM-4B) was
synthesized via bulk polymerization as described previously.21 MMA
monomer was introduced into a 200 ml beaker together with the
initiator, BPO (1%), and the CHM additive. The mixture was initially
heated to 90°C with vigorous stirring until viscous after which the
temperature was then lowered to 60°C and held constant for 24 hr.
The temperature was then raised to 80°C and held at that temperature
for another 24 hr followed by drying the sample at 100°C for 12 hr to
NOT THE PUBLISHED VERSION; this is the author’s final, peer-reviewed manuscript. The published version may be accessed by following the link in the citation at the bottom of the page.
Polymers for Advanced Technology, Vol. 17, No. 4 (April 2006): pg. 312-319. DOI. This article is © Wiley and permission has been granted for this version to appear in e-Publications@Marquette. Wiley does not grant permission for this article to be further copied/distributed or hosted elsewhere without the express permission from Wiley.
5
drive off excess monomer. Pure PMMA was made in a similar fashion
without the additive.
Powder X-ray diffraction (PXRD) patterns of the synthesized
layered materials were obtained from a 2θ circle Rikagu diffractometer
using Cu-Kα (λ = 1.54 Å) radiation source operated at 50 kV and 20
mA, with data acquisition done in 2θ steps of 0.036° per 20 sec.
Powdered samples were mounted on quartz slides using 10% (v/v) GE
7031 epoxy in ethanol after it was found that the mounting process did
not perturb the XRD patterns. Polymer composite samples were
pressed into 1 mm thick platelets, which were then mounted onto
vertically oriented sample holders for XRD analysis. Basal spacing of
the synthesized clays and polymer composites were obtained from 00l
(l = 1–3) reflections after fitting the raw spectra to a pseudo-Voight
XFIT33 program, stripping off the Cu-Kα2 contribution. Average
crystallite sizes, 𝜏, were determined using the Debye–Scherrer
equation:
(1)
Where K is a constant (0.9 for powders),34β 𝜏 is the full width at half-
maximum height of the target diffraction peak of the material after
correction for Cu-Kα2 and the instrumental broadening, and λ is the X-
ray wavelength, 1.54 Å for Cu-Kα1.
FT-IR spectra of the composites were determined using the KBr
method on a Nicolet Magna-IR 560 spectrometer. FT-IR spectra were
acquired at 1 cm-1 resolution, in the 400–4000 cm-1 region, averaging
40 scans. TGA and DTA were performed on a SDT 2960 simultaneous
DTA–TGA instrument from 50 to 600°C using constant heating rates of
10, 15, 20, and 25 K/min in air, flowing at 85 ± 5 ml min-1, with
sample sizes of 21.0 ± 1.0 mg contained in aluminum cups. A
Mattson–Cahn TG–131-TGA coupled to a FT-IR (TGA-FTIR) instrument
was employed in this study to monitor the gases evolved during
combustion processes. TGA-FTIR experiments were performed on 50 ±
5 mg samples that were heated between 50 and 600°C at 20°C min-1
with air as the purge gas (flow rate, 85 ± 5 ml min-1).

NOT THE PUBLISHED VERSION; this is the author’s final, peer-reviewed manuscript. The published version may be accessed by following the link in the citation at the bottom of the page.
Polymers for Advanced Technology, Vol. 17, No. 4 (April 2006): pg. 312-319. DOI. This article is © Wiley and permission has been granted for this version to appear in e-Publications@Marquette. Wiley does not grant permission for this article to be further copied/distributed or hosted elsewhere without the express permission from Wiley.
6
PMMA composite samples (30g) were compression molded into
10 cmx10 cm square plaques of uniform thickness (~2 mm) before
cone calorimetry was performed on an Atlas Cone 2 instrument,
incident flux of 35 kW m-2. Bright field TEM images were collected at
60 kV with a Zeiss 10c electron microscope at Cornell University.
Results and Discussion
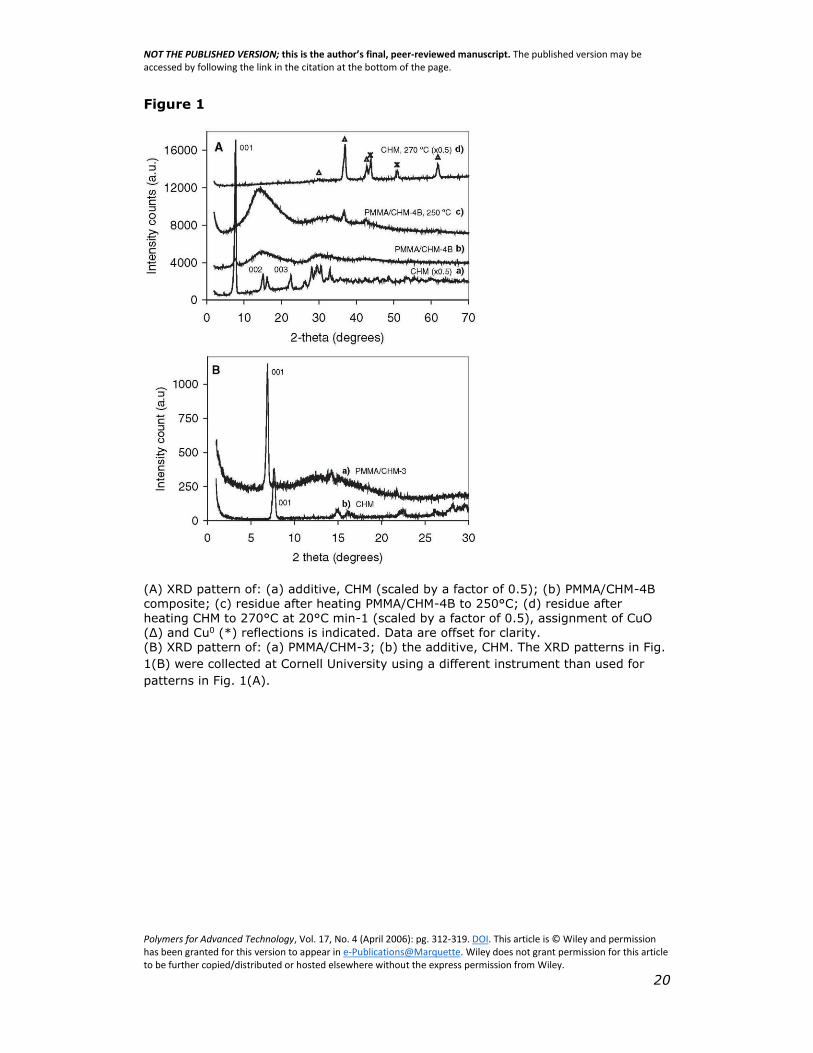
The PXRD pattern of the CHM additive, Cu2(OH)3
(H2C=C(CH3)CO2) · zH2O, is shown in trace (a) in Fig. 1(A). The XRD
data exhibit similar features to isomorphic Cu2(OH)3(CH3CO2) · zH2O
which has been reported to have a botallackite-type structure.35 Using
Bragg’s equation, , and the 001 reflection, the basal
spacing, d, is found to be 11.5 Å. No significant change in the d
spacing was observed for PMMA/CHM-4B made through bulk
polymerization as shown in Fig. 1(A). The XRD patterns of CHM and
PMMA/CHM-3, obtained on a different X-ray diffractometer (Cornell
University), are shown in Fig. 1(B). After solution blending of the
model compound, CHM, with PMMA in acetone, the basal spacing
increased to 12.8 Å indicating that the structure has been swelled as a
result of sample preparation, suggesting some minor intercalation.
XRD alone cannot sufficiently characterize the nature of the
dispersion of the additive in PMMA. TEM was employed to examine the
microstructure of the PMMA/CHM-3 composite. TEM provides
information about spatial distribution of the additive in a local area of
the composite. Figure 2 shows TEM images for the PMMA/CHM-3
sample at both low and high magnification. The low magnification TEM
image shows that CHM is fairly well distributed. Dark lines running
approximately parallel to each other are clearly seen in the low
magnification image. The average thickness of these dark lines is 458
± 7 Å corresponding to 36 ± 1 layers of the copper hydroxyl sheets
stacked upon each other taking the basal spacing to be 12.8 Å as
calculated for PMMA/CHM-3. The crystallite size of CHM in the c-axis
direction was calculated independently using the Debye-Scherrer
equation to be 390 ± 25 Å corresponding to 34 ± 3 copper hydroxide
layers stacked together. These data suggest that some of the CHM
phase remains intact during polymerization. While the 001 peak in the
PMMA/CHM-3 composite is narrower than for CHM itself, this effect
cannot be attributed to particle size increase since mixed-layering and

NOT THE PUBLISHED VERSION; this is the author’s final, peer-reviewed manuscript. The published version may be accessed by following the link in the citation at the bottom of the page.
Polymers for Advanced Technology, Vol. 17, No. 4 (April 2006): pg. 312-319. DOI. This article is © Wiley and permission has been granted for this version to appear in e-Publications@Marquette. Wiley does not grant permission for this article to be further copied/distributed or hosted elsewhere without the express permission from Wiley.
7
preferred orientations are known to perturb XRD measurements in
organo-clay dispersions.36
The high magnification TEM image is consistent with neither
delamination nor exfoliation. Nanoscale tactoids are observed but
there is not enough evidence to suggest intercalation. This is
consistent with a small increase in d spacing from XRD, which suggest
no meaningful intercalation. Even though XRD patterns and TEM
images do not give conclusive evidence of nanocomposite formation
via the routes typically observed for polymer/clay samples, the
presence of nanometric crystallite sizes of CHM in at least one
dimension suffices to describe PMMA/CHM-3 as a nanocomposite.
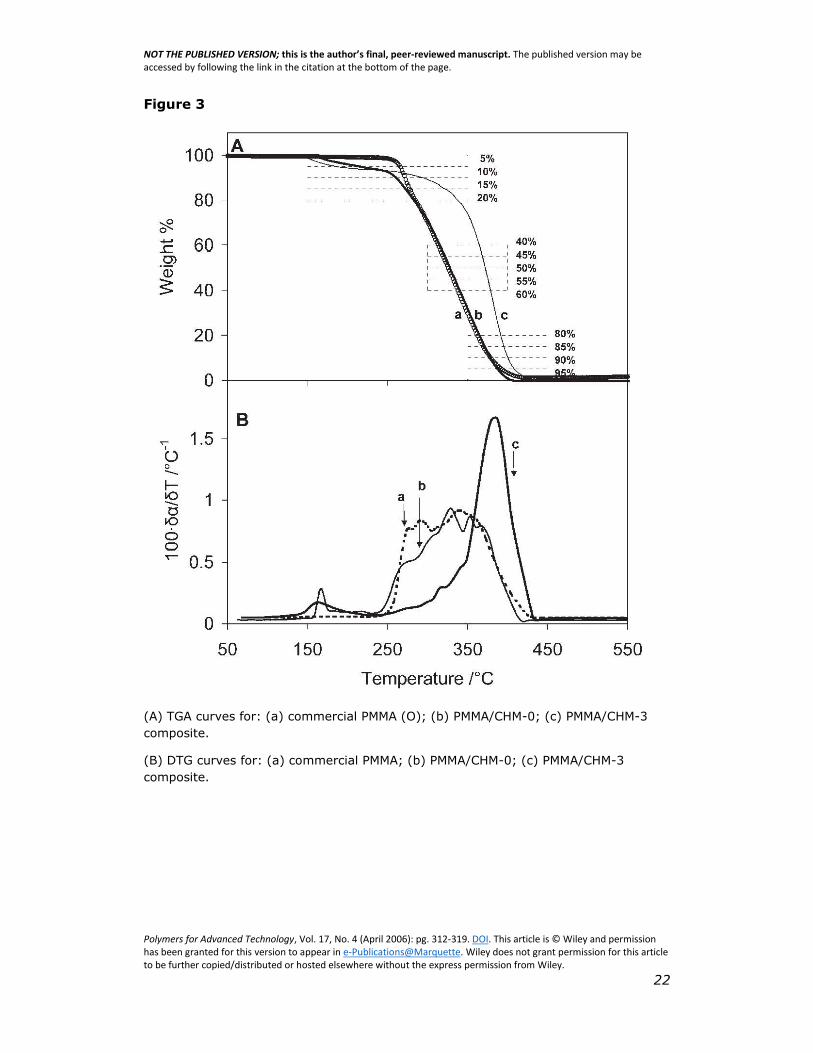
TGA curves showing the variation of undecomposed mass
percentage as a function of temperature for pure PMMA, PMMA/CHM-0,
and PMMA/CHM-3 are presented in Fig. 3(A). The thermal degradation
of pure PMMA prepared by free radical polymerization is expected to
show three stages of mass loss.26,37–39 The first stage of thermal
degradation is initiated by scission of weak peroxide and
hydroperoxide linkages mainly due to the combination of monomer
with O2 during synthesis.40 Head-to-head (H–H) linkages from
termination by combination are also easily broken at relatively low
temperatures, leading to the production of free radicals, which will
participate in the further depolymerization at higher temperatures
through chain transfer processes. The second weight loss is largely a
result of scission at the unsaturated ends due to termination by
disproportionation. This process involves homolytic cleavage of the C–
C bond β to the vinyl group while the last step is mainly due to the
random chain scission of the PMMA backbone.38
From Fig. 3(A), commercial PMMA shows no weight loss at low
temperatures (<250°C) as is also evident in the corresponding
derivatized thermal gravimetric analysis (DTG) plot of versus
temperature shown in Fig. 3(B). However, multiple overlapping weight
losses are observed from approximately 250°C to 440°C for pure
PMMA. This is consistent with a previous report of TGA of commercial
PMMA with the same molecular weight.26 In contrast, for the
recrystallized sample (PMMA/CHM-0), a significant (~10%) mass loss
occurs at a lower temperature as compared to the commercial sample.
TGA-FTIR analysis confirms that this is due to the loss of acetone, the
NOT THE PUBLISHED VERSION; this is the author’s final, peer-reviewed manuscript. The published version may be accessed by following the link in the citation at the bottom of the page.
Polymers for Advanced Technology, Vol. 17, No. 4 (April 2006): pg. 312-319. DOI. This article is © Wiley and permission has been granted for this version to appear in e-Publications@Marquette. Wiley does not grant permission for this article to be further copied/distributed or hosted elsewhere without the express permission from Wiley.
8
solvent used to prepare solution-blended samples. The first stage of
weight loss for PMMA/CHM-3, begins at about 150°C and corresponds
to the loss of the water and methacrylate from the additive as well as
residual acetone. However, the remainder of the degradation pattern
for PMMA/CHM-3 is significantly shifted to higher temperatures (see
Fig. 3A and 3B) suggesting that the polymeric composite is more
thermally stable than the commercial PMMA and the PMMA/CHM-0
sample.
From Fig. 3(A), the temperatures at which 10, 50, and 90%
mass of the polymer composite are lost, T10, T50, T90 are 33, 45, and
20°C higher for PMMA/CHM-3 than for PMMA/ CHM-0 respectively.
Chen and coworkers reported a positive shift of 45°C in the T50 value
by modifying PMMA with 30 wt% MgAl (dodecyl sulfate), a layered
double hydroxide.41 However, such high loadings can significantly
affect the mechanical properties of the composites in an undesirable
way. The significant improvement in the threshold temperatures of
PMMA/CHM-3 at 3% loading is promising for development of this new
class of additives.
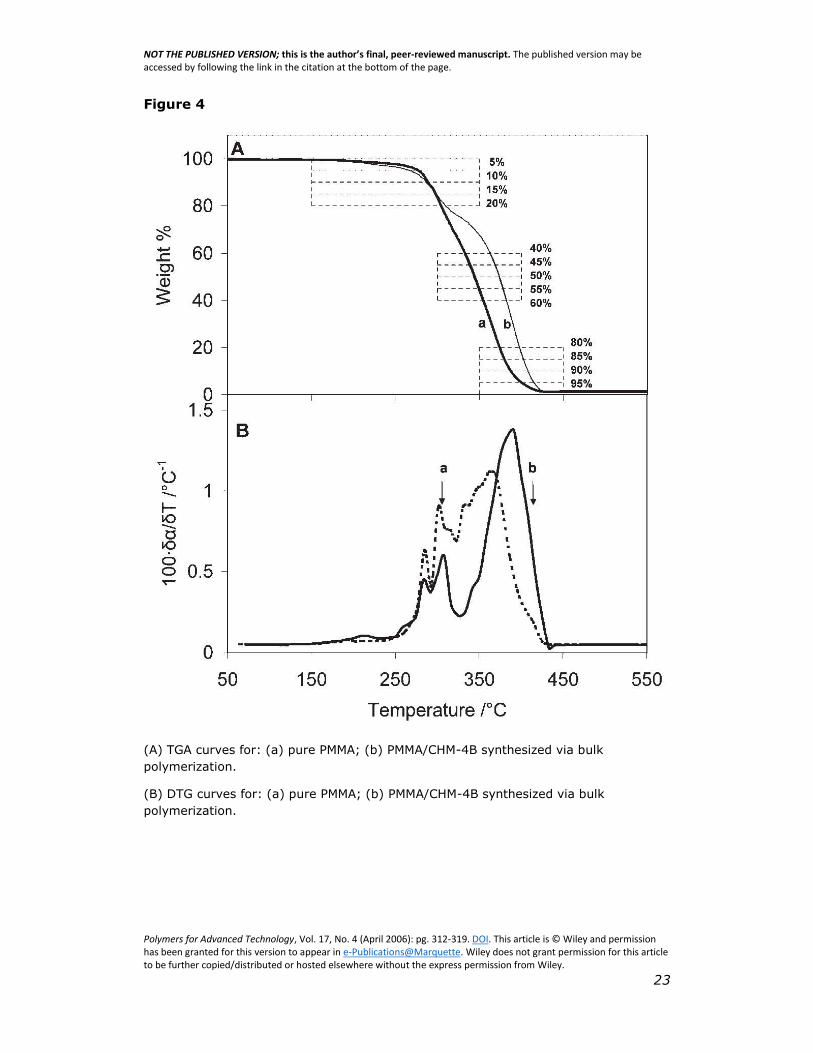
Figure 4(A) shows TGA curves for pure PMMA and PMMA/CHM-
4B synthesized via bulk polymerization, with corresponding DTG plots
provided in Fig. 4(B). Three stages of thermal decomposition are
clearly seen for pure PMMA. The first stage in mass loss at about
200°C should correspond to depolymerization initiated by weak H–H
linkages together with weak peroxides and/or hydroperoxides
linkages.40 However, this stage is insignificant, suggesting that there
are few of the above-mentioned linkages. The second stage at about
300°C is a result of radical transfer to unsaturated chain ends while
the last stage around 365°C corresponds to random scission.38
PMMA/CHM-4B shows a similar behavior except that the degradation
temperatures at maximum weight loss for the three stages are shifted
to higher values, implying improved thermal stability. The second and
last stages of mass losses for pure PMMA in the DTG plots are
substantial and equally important while for PMMA/CHM-4B the second
mass loss (~300°C) is less pronounced than the last stage, which is
also shifted to higher temperatures, (~390°C) relative to pure PMMA.
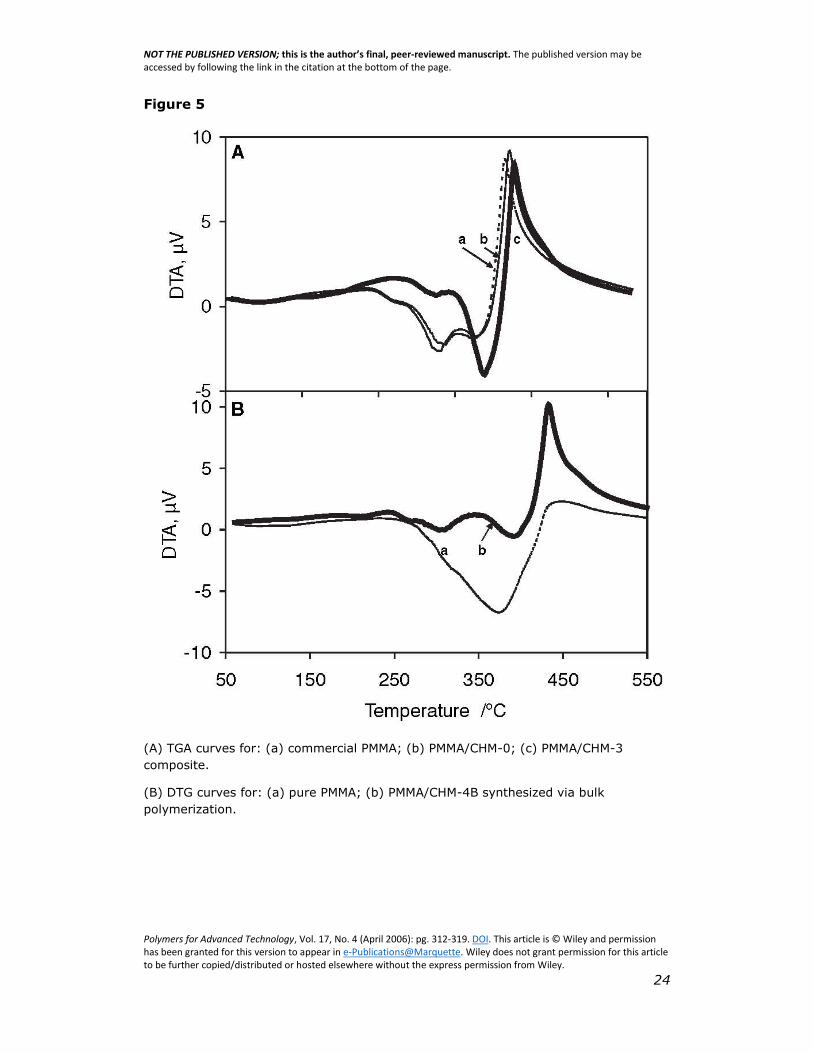
Figure 5(A) shows DTA curves for pure PMMA, PMMA/ CHM-0,
and PMMA/CHM-3 composite. The DTA curves are shown to draw a

NOT THE PUBLISHED VERSION; this is the author’s final, peer-reviewed manuscript. The published version may be accessed by following the link in the citation at the bottom of the page.
Polymers for Advanced Technology, Vol. 17, No. 4 (April 2006): pg. 312-319. DOI. This article is © Wiley and permission has been granted for this version to appear in e-Publications@Marquette. Wiley does not grant permission for this article to be further copied/distributed or hosted elsewhere without the express permission from Wiley.
9
comparison between thermal degradation behaviors of pure PMMA and
PMMA/CHM-0 to that of the polymer composite, PMMA/CHM-3. The
DTA curves for pure PMMA and PMMA/CHM-0 show similar behavior
throughout the decomposition process. Three endotherms are seen
around 270, 330, and 380°C while one exotherm is observed at about
420°C. In contrast, the PMMA/CHM-3 composite shows an exotherm
around 280°C (possibly due to oxidation of organic interlayer species)
followed by an endotherm at about 330°C similar to the reference
samples.
The second endothermic process for PMMA/CHM-3 occurs at a
slightly higher temperature, 390°C, as compared to about 380°C for
the reference samples consistent with improved thermal stability of the
composite. The last exothermic process for the composite is slightly
shifted to a higher temperature but is of similar magnitude to pure
PMMA, and PMMA/CHM-0. This suggests that the mass losses at higher
conversion fractions in both the reference materials and the composite
are due to the same basic mechanism.
Figure 5(B) shows DTA curves for pure PMMA and PMMA/CHM-
4B composite synthesized via bulk polymerization. The DTA curve for
pure PMMA shows two overlapping endotherms starting at 250 to
420°C and a small exothermic feature at 430°C. However, three
endotherms are seen at around 265, 300, and 400°C for PMMA/CHM-
4B. An exotherm at around 250°C is due to the thermal degradation of
interlayer organic species contained in the additive. An exothermic
process at 430°C in the PMMA/CHM-4B sample is enhanced relative to
that observed for the pure PMMA. This suggests that a significant mass
loss occurs at elevated temperatures for the composite material,
mainly due to random chain scission. The notable difference in the DTA
curves for pure PMMA and PMMA/CHM-4B might suggest a change in
the relative contribution of the different degradation processes for
these polymeric materials. Further work is required to test this
hypothesis.
Thermogravimetric measurements provide a qualitative means
of estimating the thermal stability of polymeric materials.42,43 Thermal
stability is defined here as the onset temperature for degradation and
the rate of degradation of the respective materials. As noted earlier,
the thermal degradation of PMMA and PMMA/CHM composites involves
NOT THE PUBLISHED VERSION; this is the author’s final, peer-reviewed manuscript. The published version may be accessed by following the link in the citation at the bottom of the page.
Polymers for Advanced Technology, Vol. 17, No. 4 (April 2006): pg. 312-319. DOI. This article is © Wiley and permission has been granted for this version to appear in e-Publications@Marquette. Wiley does not grant permission for this article to be further copied/distributed or hosted elsewhere without the express permission from Wiley.
10
multiple degradation steps. A simple means of extracting effective
kinetic parameters from these rather complicated decomposition
processes is analysis of multiple heating rate kinetics (MHRKs),
applying the commonly used Flynn–Wall–Ozawa44,45 method specifically
derived for heterogeneous chemical reactions under linear heating
rates. The Flynn-Wall-Ozawa method is expressed by the equation:
(2)
Where is known as the conversional functional relationship;
A is the pre-exponential factor (in min-1), Ea is the apparent activation
energy (in kJ mol-1), R is the gas constant, β is the heating rate (in K
min-1), and T is the absolute temperature (in K).
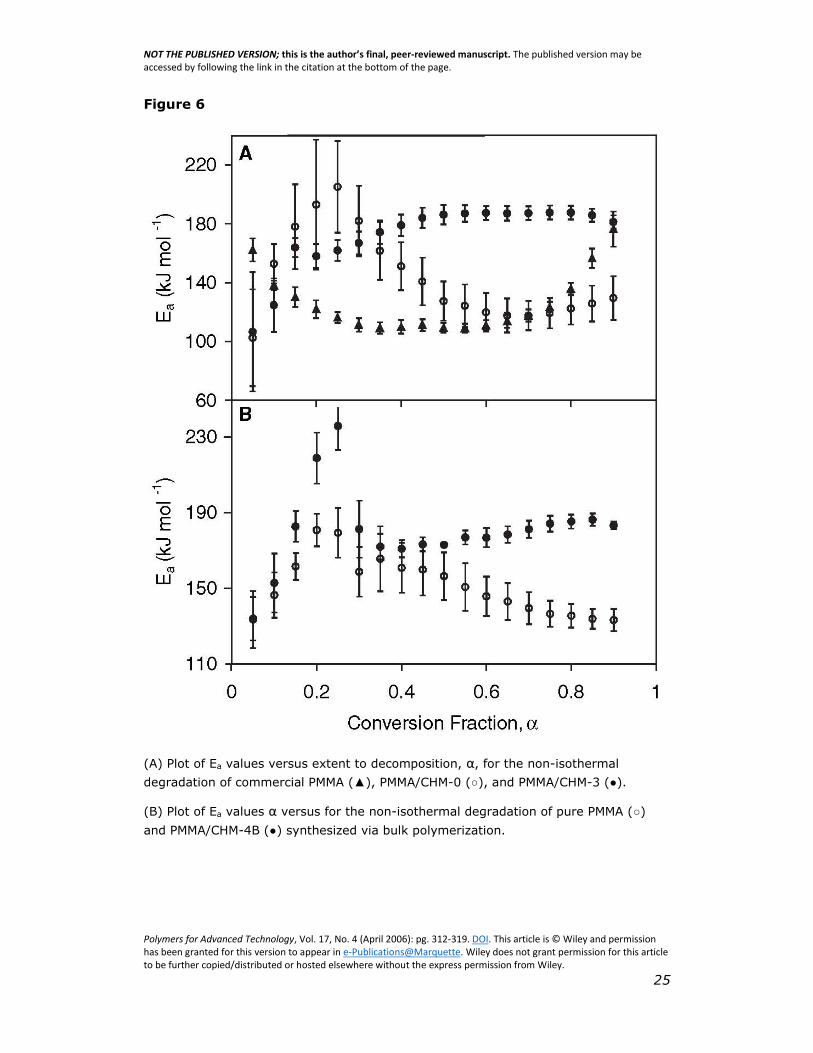
The Ea values for the virgin PMMA, PMMA/CHM-0, PMMA/CHM-3,
bulk polymerized pure PMMA, and PMMA/CHM-4B were calculated from
slopes of the isoconversional plots of log (β) versus 1/T. The Ea values
were calculated for fractional conversions α = 0.05 - 0.90 at intervals of
0.05. These values are plotted in Fig. 6(A) and 6(B). The value for the
pure commercial PMMA, as received, decreased from 160 to 110 kJ
mol-1 between and 0.55. The value then increased in a parabolic
fashion to a value of 180 kJ mol-1 at α = 0.9. Laachachi et al. reported
similar results for the thermal degradation of PMMA in air.37 The
observed apparent Ea value for the PMMA/CHM-3 increased with
conversion to reach a constant Ea value of ~187 kJ mol-1 from until the
end of the reaction. For decomposition via a single step, the MHRKs
are expected to result in constant values as a function of α45. Multistep
processes, such as those observed here, may result in variations in Ea
values over the conversion range, however, unambiguous
interpretation of such changes is difficult. There is no significant
difference, within experimental error, between the Ea value for
PMMA/CHM-0, and PMMA/CHM-3 in the region, α = 0.05 to 0.40. Both
samples show higher Ea values than the commercial sample at low
temperatures/conversions. However, the complicated nature of mass
loss at the earlier degradation stages, particularly in the solution
blended samples where solvent loss is occurring, precludes attributing
Ea differences at low conversions to significant changes in polymer

NOT THE PUBLISHED VERSION; this is the author’s final, peer-reviewed manuscript. The published version may be accessed by following the link in the citation at the bottom of the page.
Polymers for Advanced Technology, Vol. 17, No. 4 (April 2006): pg. 312-319. DOI. This article is © Wiley and permission has been granted for this version to appear in e-Publications@Marquette. Wiley does not grant permission for this article to be further copied/distributed or hosted elsewhere without the express permission from Wiley.
11
stability without additional experimental characterization of
degradation products.
A difference of >50 kJ mol-1 between the Ea value of
PMMA/CHM-0 and PMMA/CHM-3, (α = 0.5 – 0.9 ) is, however,
consistent with the suggestion that the thermal stability of PMMA is
greatly enhanced by addition of the LHS, CHM. Similar trends in the Ea
values are seen for the samples prepared via bulk polymerization. In
contrast to results obtained through solution blending, the Ea values at
specific fractional conversions, α, is always higher for PMMA/CHM4B
than for pure PMMA. Differences of >30 kJ mol-1 in for PMMA/CHM-4B
relative to pure PMMA are seen for α = 0.55 – 0.9. However, the
general shapes of Ea curves as a function of α are similar for the two
preparative methods, suggesting that there is no significant change in
the degradation mechanism of composites made from solution
blending as compared to those made via bulk polymerization. In both
cases the elevated Ea values correlate, as expected, with the observed
improved thermal stability of the polymer composites seen in TGA
profiles acquired at a single heating rate.
The positive shift in maximum mass-loss temperature for
PMMA/CHM-3 implies that the presence of the LHS in the polymer
matrix severely limits or prevents depolymerization processes by
radical chain transfer (second stage). A greater portion of the polymer
composite is then lost through random scission occurring at elevated
temperatures. This might be as a result of the formation of organic/
inorganic networks, such as Cu salt ionomers that are thermally more
stable than PMMA.46 In addition these networks may serve to prevent
the rapid diffusion of free radicals, which are known to promote the
depolymerization process.47 Also, the presence of the inorganic
moieties may serve to stabilize or even trap free radicals by
participation in redox reactions as previously hypothesized in the
authors’ laboratory with HDS and LHS/PMMA composites.21
In previous work,21 differences in copper oxidation states in
cone residues were observed for composites made with CHM and a
zinc/copper methracrylate HDS. In order to further explore the
evolution of copper oxidation states, the PMMA-CHM-4B and pure CHM
were heated for TGA at 20°C min-1 and the resulting residues were
analyzed via XRD. The presence of Cu(I) oxide (PDF# 35-1091)48 in

NOT THE PUBLISHED VERSION; this is the author’s final, peer-reviewed manuscript. The published version may be accessed by following the link in the citation at the bottom of the page.
Polymers for Advanced Technology, Vol. 17, No. 4 (April 2006): pg. 312-319. DOI. This article is © Wiley and permission has been granted for this version to appear in e-Publications@Marquette. Wiley does not grant permission for this article to be further copied/distributed or hosted elsewhere without the express permission from Wiley.
12
the residue of PMMA/CHM-4B after heating to 250°C is observed in the
XRD pattern shown in trace (c) of Fig. 1(A). Cu(I) oxide and Cu metal
(PDF# 4-836)48 were seen in the XRD pattern of the pure CHM residue
after heating to 270°C. The absence of metallic Cu in the residue of
PMMA/CHM-4B at similar temperature suggests that the products of
degradation of PMMA may participate in redox reactions with the
additive.
Cu(II), in the form of CuCl2, has been reported49 to have a
stabilizing effect on the thermal degradation of PMMA, while Cu(I)
(CuCl) did not have any effect on the thermal degradation of PMMA in
air. However, several authors have shown that Cu(I) based catalysts
can be used in the polymerization of PMMA through atom transfer
radical polymerization (ATRP) with high efficiency.50–52 The presence of
Cu(I) ions at temperatures as low as 250°C could establish conditions
suitable for living polymerization through radical, MMA · , combination.
This could lead to retardation of the depolymerization process as more
polymer chains are generated concomitant with the combustion of the
starting material. Therefore, the presence of Cu ions in the polymeric
matrix during combustion may serve to stabilize the composite
materials, consistent with the enhanced TGA residue reported
previously for CHM additives with PMMA.21 Analysis of PMMA/CHM
residues to test this hypothesis will be the subject of future work.
The potential effect of additive on the extent of initial
polymerization during sample preparation must also be considered,
particularly for the bulk polymerized samples. Kashiwagi et al.38 have
suggested that a difference in the molecular weights of polymers
synthesized via bulk polymerization will affect their degradation
profiles. The presence of a Cu(II)-based additive in PMMA/CHM-4B
could have an effect on its average molecular weight as compared to
pure PMMA. Polymers with fewer unsaturated chain ends would lose
less mass in the second degradation stage. To rule out the possibility
of having significantly different molecular weights in pure PMMA
compared to PMMA/CHM-4B FT-IR analysis was performed for the bulk
polymerized samples and the results are presented in Fig. 7. As
reported by Suske et al.,53 comparison of the integrated intensities of
the C–H stretching bands at about 3000 cm-1 to the C=O anti-
symmetric stretch at around 1730 cm-1 can be used to estimate the
extent of crosslinking in PMMA. More highly crosslinked samples have
NOT THE PUBLISHED VERSION; this is the author’s final, peer-reviewed manuscript. The published version may be accessed by following the link in the citation at the bottom of the page.
Polymers for Advanced Technology, Vol. 17, No. 4 (April 2006): pg. 312-319. DOI. This article is © Wiley and permission has been granted for this version to appear in e-Publications@Marquette. Wiley does not grant permission for this article to be further copied/distributed or hosted elsewhere without the express permission from Wiley.
13
lower C-H/C=O ratios. Based on the data shown in Fig. 7, the C-
H/C=O ratios were found to be 0.74 ± 0.06 and 0.78 ± 0.06 for PMMA
and PMMA/CHM-4B respectively, suggesting that there is no significant
difference in crosslinking due to the presence of the CHM additive.
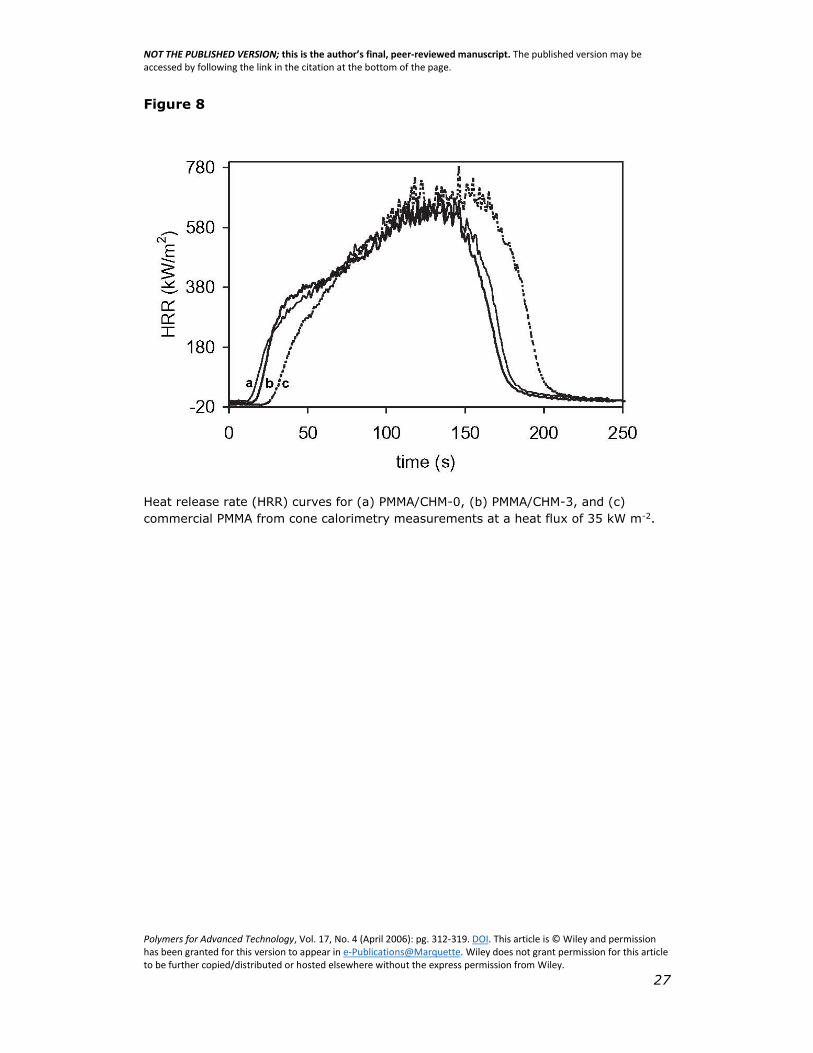
Cone calorimetry experiments were performed to investigate the
relative flammability of PMMA/CHM-0 to PMMA/CHM-3. Figure 8 shows
the variation of heat released with combustion time for the commercial
PMMA, PMMA/CHM-0, and PMMA/CHM-3. The THR as depicted by the
integrated areas under the respective heat release rate versus time
curves are 82.2 ± 2.2, 72.6 ± 0.7, and 71.5 ± 17 MJ m-2 for the
commercial PMMA, PMMA/CHM-0, and PMMA/CHM-3 respectively. Even
though there is a significant reduction in the THR for the recrystallized
polymer composites relative to the commercial PMMA, there is,
however, no meaningful difference between PMMA/CHM-0 and
PMMA/CHM-3.
The obtained kinetic information (activation energies) used to
estimate the thermal stability of these polymeric materials is derived
from weight loss profiles of thermal degradation processes. The
mathematical function used to describe the degradation process is
modeled for the released products, i.e., from weight loss, and provides
no information about which, or how many bonds are broken at any
given conversion fraction.54 The extracted effective Ea values are thus
useful here to explain the shift to higher threshold temperatures for
PMMA/CHM-3 but not necessarily its flammability. While TGA curves
and apparent Ea values suggest a significant improvement in the
thermal stability of PMMA/CHM-3 relative to PMMA/CHM-0, cone
calorimetry measurements suggest no difference in their flammability.
Conclusions
CHM has been used as an additive to provide thermal stability to
PMMA. Solution blending and bulk polymerization in the presence of 3-
4% by mass of the additive result in a significant shift in the
temperature for 50% mass loss. Apparent Ea values were significantly
higher for the PMMA/CHM-3 composite a difference >50 kJ mol-1) for
the later stages of the thermal decomposition process (α = 0.5 – 0.9)
compared to the reference sample PMMA/CHM-0. A similar trend was
observed for PMMA/CHM-4B with values for the composite being 30 kJ
NOT THE PUBLISHED VERSION; this is the author’s final, peer-reviewed manuscript. The published version may be accessed by following the link in the citation at the bottom of the page.
Polymers for Advanced Technology, Vol. 17, No. 4 (April 2006): pg. 312-319. DOI. This article is © Wiley and permission has been granted for this version to appear in e-Publications@Marquette. Wiley does not grant permission for this article to be further copied/distributed or hosted elsewhere without the express permission from Wiley.
14
mol-1 greater than the pure PMMA in the region α = 0.55 – 0.9.
However, in contrast to bulk polymerized samples, no significant
difference was observed in the THR in cone calorimetry measurements
for the solution blended composite, PMMA/CHM-3, relative to
PMMA/CHM-0.
Acknowledgments
The authors thank Marquette University Committee on Research for
financial assistance and Charles A. Wilkie and coworkers at Marquette
University for fruitful discussions.
References
1. Huang X, Brittain WJ. Synthesis and characterization of PMMA
nanocomposites by suspension and emulsion polymerization.
Macromolecules 2001; 34: 3255–3260.
2. Qu X, Guan T, Liu G, She Q, Zhang L. Preparation, structural
characterization, and properties of poly(methyl
methacrylate)/montmorillonite nanocomposites by bulk
polymerization. J. Appl. Polym. Sci. 2005; 97: 348–357.
3. Hwu JM, Jiang GJ, Gao ZM, Xie W, Pan WP. The characterization of organic
modified clay and clay-filled PMMA nanocomposite. J. Appl. Polym. Sci.
2002; 83: 1702–1710.
4. Yang F, Nelson GL. PMMA/silica nanocomposite studies: synthesis and
properties. J. Appl. Polym. Sci. 2004; 91: 3844– 3850.
5. Lee DC, Jang LW. Preparation and characterization of PMMA-clay hybrid
composite by emulsion polymerization. J. Appl. Polym. Sci. 1996; 61:
1117–1122.
6. Shen Z, Simon GP, Cheng Y-B. Nanocomposites of poly(methyl
methacrylate) and organically modified layered silicates by melt
intercalation. J. Appl. Polym. Sci. 2004; 92: 2101–2115.
7. Kumar S, Jog JP, Natarajan U. Preparation and characterization of
poly(methyl methacrylate)-clay nanocomposites via melt intercalation:
the effect of organoclay on the structure and thermal properties. J.
Appl. Polym. Sci. 2003; 89: 1186–1194.
8. Aymonier C, Bortzmeyer D, Thomann R, Mulhaupt R. Poly(methyl
methacrylate)/palladium nanocomposites: synthesis and

NOT THE PUBLISHED VERSION; this is the author’s final, peer-reviewed manuscript. The published version may be accessed by following the link in the citation at the bottom of the page.
Polymers for Advanced Technology, Vol. 17, No. 4 (April 2006): pg. 312-319. DOI. This article is © Wiley and permission has been granted for this version to appear in e-Publications@Marquette. Wiley does not grant permission for this article to be further copied/distributed or hosted elsewhere without the express permission from Wiley.
15
characterization of the morphological, thermomechanical, and thermal
properties. Chem. Mater. 2003; 15: 4874–4878.
9. Zhu J, Morgan AB, Lamelas FJ, Wilkie CA. Fire properties of polystyrene-
clay nanocomposites. Chem. Mater. 2001; 13: 3774–3780.
10. Laachachi A, Leroy E, Cochez M, Ferriol M, Lopez Cuesta JM. Use of oxide
nanoparticles and organoclays to improve thermal stability and fire
retardancy of poly(methyl methacrylate). Polym. Degrad. Stab. 2005;
89: 344–352.
11. Bourbigot S, Gilman JW, Wilkie CA. Kinetic analysis of the thermal
degradation of polystyrene-montimorillonite nanocomposite. Polym.
Degrad. Stab. 2004; 84: 483–492.
12. Mallikarjuna NN, Venkataraman A, Aminabhavi TM. A study on 𝛄-Fe2O3
loaded poly(methyl methacrylate) nanocomposites. J. Appl. Polym. Sci.
2004; 94: 2551–2554.
13. Yeh J-M, Liou S-J, Lai M-C, Chang Y-W, Huang C-Y, Chen C-P, Jaw J-H,
Tsai T-Y, Yu Y-H. Comparative studies of the properties of poly(methyl
methacrylate)-clay nanocomposite materials prepared by in situ
emulsion polymerization and solution dispersion. J. Appl. Polym. Sci.
2004; 94: 1936–1946.
14. Yeh J-M, Liou S-J, Lin C-Y, Cheng C-Y, Chang Y-W. Anticorrosively
enhanced PMMA-clay nanocomposite materials with quaternary
alkylphosphonium salt as an intercalating agent. Chem. Mater. 2002;
14: 154–161.
15. Kashiwagi T, Morgan AB, Antonucci JM, VanLandingham MR, Harris RH,
Awad WH, Shields JR. Thermal and flammability properties of a silica-
poly(methyl methacrylate) nanocomposite. J. Appl. Polym. Sci. 2003;
89: 2072–2078.
16. Rajamathi M, Thomas GS, Kamath PV. The many ways of making anionic
clays. Proc. Indian Acad. Sci., Chem. Sci. 2001; 113: 671–680.
17. Chandrasiri JA, Wilkie CA. Thermal degradation of poly(methyl
methacrylate) in the presence of tin(IV) chloride and tetraphenyltin.
Polym. Degrad. Stab. 1994; 45: 91–96.
18. Wang D, Zhu J, Yao Q, Wilkie CA. A comparison of various methods for
the preparation of polystyrene and poly(methyl methacrylate) clay
nanocomposites. Chem. Mater. 2002; 14: 3837–3843.
NOT THE PUBLISHED VERSION; this is the author’s final, peer-reviewed manuscript. The published version may be accessed by following the link in the citation at the bottom of the page.
Polymers for Advanced Technology, Vol. 17, No. 4 (April 2006): pg. 312-319. DOI. This article is © Wiley and permission has been granted for this version to appear in e-Publications@Marquette. Wiley does not grant permission for this article to be further copied/distributed or hosted elsewhere without the express permission from Wiley.
16
19. Du J, Zhu J, Wilkie CA, Wang J. An XPS investigation of thermal
degradation and charring on PMMA clay nanocomposites. Polym.
Degrad. Stab. 2002; 77: 377–381.
20. Su S, Wilkie CA. Exfoliated poly(methyl methacrylate) and polystyrene
nanocomposites occur when the clay cation contains a vinyl monomer.
J. Polym. Sci., Part A: Polym. Chem. 2003; 41: 1124–1135.
21. Kandare E, Hall D, Jiang DD, Hossenlopp JM. Development of new fire
retardant additives based on hybrid inorganic/ organic
nanodimensional layered compounds: thermal degradation of PMMA
composites. ACS Symposium Series 922, Fire and Polymers IV:
Materials and Concepts for Hazard Prevention. Wilkie CA, Nelson GL
(eds), American Chemical Society: Washington, DC, 2006; 131–143.
22. Beecroft LL, Ober CK. Nanocomposite materials for optical applications.
Chem. Mater. 1997; 9: 1302–1317.
23. Sidorov SN, Volkov LV, Davankov VA, Tsyurupa MP, Valetsky PM,
Bronstein LM, Karlinsey R, Zwanziger JW, Matveeva VG, Sulman EM,
Lakina NV, Wilder EA, Spontak RJ. Platinum-containing hyper-cross-
linked polystyrene as a modifier-free selective catalyst for L-sorbose
oxidation. J. Am. Chem. Soc. 2001; 123: 10502–10510.
24. Landry CJT, Coltrain BK, Landry MR, Fitzgerald JJ, Long VK. poly(viny1
acetate)/silica filled materials: material properties of in situ vs fumed
silica particles. Macromolecules 1993; 26: 3702–3712.
25. Jellinek HHG, Luh MD. Thermal degradation of isotactic and syndiotactic
poly(methyl methacrylate). J. Phys. Chem. 1996; 70: 3672–3680.
26. Ferriol M, Gentilhomme A, Cochez M, Oget N, Mieloszynski JL. Thermal
degradation of poly(methyl methacrylate) (PMMA): modelling of DTG
and TG curves. Polym. Degrad. Stab. 2003; 79: 271–281.
27. Gao Z, Kaneko T, Hou D, Nakada M. Kinetics of thermal degradation of
poly(methyl methacrylate) studied with the assistance of the fractional
conversion at the maximum reaction rate. Polym. Degrad. Stab. 2004;
84: 399–403.
28. Hu Y-H, Chen C-Y. The effect of end groups on the thermal degradation of
poly(methyl methacrylate). Polym. Degrad. Stab. 2003; 82: 81–88.
29. Hu Y-H, Chen C-Y. Study of the thermal behavior of poly(methyl
methacrylate) initiated by lactams and thiols. Polym. Degrad. Stab.
2003; 80: 1–10.
NOT THE PUBLISHED VERSION; this is the author’s final, peer-reviewed manuscript. The published version may be accessed by following the link in the citation at the bottom of the page.
Polymers for Advanced Technology, Vol. 17, No. 4 (April 2006): pg. 312-319. DOI. This article is © Wiley and permission has been granted for this version to appear in e-Publications@Marquette. Wiley does not grant permission for this article to be further copied/distributed or hosted elsewhere without the express permission from Wiley.
17
30. Peterson JD, Vyazovkin S, Wight CA. Kinetic study of stabilizing effect of
oxygen on thermal degradation of poly(metyl methacrylate). J. Phys.
Chem. B. 1999; 103: 8087–8092.
31. Holland BJ, Hay JN. The kinetics and mechanisms of the thermal
degradation of poly(methyl methacrylate) studied by thermal analysis-
Fourier transform infrared spectroscopy. Polymer 2001; 42: 4825–
4835.
32. Jimenez-Lopez A, Rodriguez-Castellon E, Olivera-Pastor P, Maireles-Torres
P, Tomlinson AAG, Jones DJ, Roziere J. Layered basic copper anion
exchangers: chemical characterization and X-ray absorption study. J.
Mater. Chem. 1993; 3: 303–307.
33. Cheary RW, Coelho AA. Programs XFIT and FOURYA, deposited in CCP14.
Powder Diffraction Library, Engineering and Physical Sciences Research
Council, Daresbury Laboratory, Warrington.
http://www.ccp14.ac.uk/tutorial/xfit-95/xfit.htm 1996.
34. Jenkins R, Synder RL. Introduction to X-ray Powder Diffractometry. Wiley:
New York, 1996.
35. Yamanaka S, Sako T, Seki K, Hattori M. Anion exchange reactions in
layered basic copper salts. Solid State Ionics 1992; 53–56: 527–533.
36. Eckel DF, Balogh MP, Fasulo PD, Rodgers WR. Assessing organo-clay
dispersion in polymer nanocomposites. J. Appl. Polym. Sci. 2004; 93:
1110–1117.
37. Laachachi A, Cochez M, Ferriol M, Leroy E, Lopez Cuesta JM, Oget N.
Influence of Sb2O3 particles as filler on the thermal stability and
flammability properties of poly(methyl methacrylate) (PMMA). Polym.
Degrad. Stab. 2004; 85: 641–646.
38. Kashiwagi T, Inaba A, Brown JE, Hatada K, Kitayama T, Masuda E. Effects
of weak linkages on the thermal and oxidative degradation of
poly(methy1 methacrylates). Macromolecules 1986; 19: 2160–2168.
39. Laachachi A, Cochez M, Ferriol M, Lopez Cuesta JM, Leroy E. Influence of
TiO2 and Fe2O3 fillers on the thermal properties of poly(methyl
methacrylate) (PMMA). Mater. Lett. 2005; 59: 36–39.
40. Holland BJ, Hay JN. The effect of polymerization conditions on the kinetics
and mechanisms of thermal degradation of PMMA. Polym. Degrad.
Stab. 2002; 77: 435–439.
41. Chen W, Feng L, Qu B. In situ synthesis of poly(methyl
methacrylate)/MgAl layered double hydroxide nanocomposite with high

NOT THE PUBLISHED VERSION; this is the author’s final, peer-reviewed manuscript. The published version may be accessed by following the link in the citation at the bottom of the page.
Polymers for Advanced Technology, Vol. 17, No. 4 (April 2006): pg. 312-319. DOI. This article is © Wiley and permission has been granted for this version to appear in e-Publications@Marquette. Wiley does not grant permission for this article to be further copied/distributed or hosted elsewhere without the express permission from Wiley.
18
transparency and enhanced thermal properties. Solid State Commun.
2004; 130: 259–263.
42. Vyazovkin S, Wight CA. Isothermal and nonisothermal reaction kinetics in
solids: in search of ways toward consensus. J. Phys. Chem. A. 1997;
101: 8279–8284.
43. Khawam A, Flanagan DR. Complementary use of model-free and
modelistic methods in the analysis of solid-state kinetics. J. Phys.
Chem. B. 2005; 109: 10073–10080.
44. Ozawa T. A new method of analyzing thermogravimetric data. Bull. Chem.
Soc. Jpn 1965; 38: 1881–1886.
45. Vyazovkin S. Evaluation of activation energy of thermally stimulated
solid-state reactions under arbitrary variation of temperature. J. Comp.
Chem. 1997; 18: 393–402.
46. Kosyanchuk LF, Lipatova TE, Vilensky VA, Lipatov YS, Shtompel VI.
Polyurethanes crosslinked by metals and their complexes with crown
ether. J. Polym. Sci., Part A: Polym. Chem. 1998; 36: 1379–1386.
47. Wang H, Xu P, Zhong W, Shen L, Du Q. Transparent poly(methyl
methacrylate)/silica/zirconia nanocomposites with excellent thermal
stabilities. Polym. Degrad. Stab. 2005; 87: 319–327.
48. Powder Diffraction File Alphabetical Indexes. Inorganic Phases. JCPDS,
International Centre for Diffraction Data, Swartmore, PA, 1999.
49. Chandrasiri JA, Roberts DE, Wilkie CA. The effect of some transition metal
chlorides on the thermal degradation of poly(methyl methacrylate): a
study using TGA-FTIR spectrometry. Polym. Degrad. Stab. 1994; 45:
97–101.
50. Darcos V, Monge S, Haddleton DM. In situ Fourier transform near infrared
spectroscopy monitoring of copper mediated living radical
polymerization. J. Polym. Sci., Part A: Polym. Chem. 2004; 42: 4933–
4940.
51. Miura Y, Satoh T, Narumi A, Nishizawa O, Okamoto Y, Kakuchi T. Atom
transfer radical polymerization of methyl methacrylate in fluoroalcohol:
simultaneous control of molecular weight and tacticity. Macromolecules
2005; 38: 1041–1043.
52. Percec V, Asandei AD, Asgarzadeh F, Bera TK, Barboiu B. CuI and CuII
salts of group VIA elements as catalysts for living radical
polymerization initiated with sulfonyl chlorides. J. Polym. Sci., Part A:
Polym. Chem. 2000; 38: 3839–3843.
NOT THE PUBLISHED VERSION; this is the author’s final, peer-reviewed manuscript. The published version may be accessed by following the link in the citation at the bottom of the page.
Polymers for Advanced Technology, Vol. 17, No. 4 (April 2006): pg. 312-319. DOI. This article is © Wiley and permission has been granted for this version to appear in e-Publications@Marquette. Wiley does not grant permission for this article to be further copied/distributed or hosted elsewhere without the express permission from Wiley.
19
53. Suske E, Scharf T, Krebs H-U, Panchenko E, Junkers T, Egorov M, Buback
M, Kijewski H. Tuning of cross-linking and mechanical properties of
laser-deposited poly(methyl methacrylate) films. J. Appl. Phys. 2005;
97: 63501–63504.
54. Maciejewski M. Thermal analysis and kinetic concepts of solid-state
reactions. J. Therm. Anal. 1988; 33: 1269–1277.
About the Authors
Jeanne M. Hossenlopp : Department of Chemistry, Marquette University,
P. O. Box 1881, Milwaukee, WI 53201-1881, USA.
Email : [email protected]
NOT THE PUBLISHED VERSION; this is the author’s final, peer-reviewed manuscript. The published version may be accessed by following the link in the citation at the bottom of the page.
Polymers for Advanced Technology, Vol. 17, No. 4 (April 2006): pg. 312-319. DOI. This article is © Wiley and permission has been granted for this version to appear in e-Publications@Marquette. Wiley does not grant permission for this article to be further copied/distributed or hosted elsewhere without the express permission from Wiley.
20
Figure 1
(A) XRD pattern of: (a) additive, CHM (scaled by a factor of 0.5); (b) PMMA/CHM-4B composite; (c) residue after heating PMMA/CHM-4B to 250°C; (d) residue after heating CHM to 270°C at 20°C min-1 (scaled by a factor of 0.5), assignment of CuO (Δ) and Cu0 (*) reflections is indicated. Data are offset for clarity. (B) XRD pattern of: (a) PMMA/CHM-3; (b) the additive, CHM. The XRD patterns in Fig.
1(B) were collected at Cornell University using a different instrument than used for
patterns in Fig. 1(A).

NOT THE PUBLISHED VERSION; this is the author’s final, peer-reviewed manuscript. The published version may be accessed by following the link in the citation at the bottom of the page.
Polymers for Advanced Technology, Vol. 17, No. 4 (April 2006): pg. 312-319. DOI. This article is © Wiley and permission has been granted for this version to appear in e-Publications@Marquette. Wiley does not grant permission for this article to be further copied/distributed or hosted elsewhere without the express permission from Wiley.
21
Figure 2
TEM images at low (left) and high (right) magnification for PMMA/CHM-3. For low
magnification, the scale bar (bottom left) represents 500 nm while for high
magnification, the scale bar (bottom left) represents 100 nm.
NOT THE PUBLISHED VERSION; this is the author’s final, peer-reviewed manuscript. The published version may be accessed by following the link in the citation at the bottom of the page.
Polymers for Advanced Technology, Vol. 17, No. 4 (April 2006): pg. 312-319. DOI. This article is © Wiley and permission has been granted for this version to appear in e-Publications@Marquette. Wiley does not grant permission for this article to be further copied/distributed or hosted elsewhere without the express permission from Wiley.
22
Figure 3
(A) TGA curves for: (a) commercial PMMA (О); (b) PMMA/CHM-0; (c) PMMA/CHM-3
composite.
(B) DTG curves for: (a) commercial PMMA; (b) PMMA/CHM-0; (c) PMMA/CHM-3
composite.
NOT THE PUBLISHED VERSION; this is the author’s final, peer-reviewed manuscript. The published version may be accessed by following the link in the citation at the bottom of the page.
Polymers for Advanced Technology, Vol. 17, No. 4 (April 2006): pg. 312-319. DOI. This article is © Wiley and permission has been granted for this version to appear in e-Publications@Marquette. Wiley does not grant permission for this article to be further copied/distributed or hosted elsewhere without the express permission from Wiley.
23
Figure 4
(A) TGA curves for: (a) pure PMMA; (b) PMMA/CHM-4B synthesized via bulk
polymerization.
(B) DTG curves for: (a) pure PMMA; (b) PMMA/CHM-4B synthesized via bulk
polymerization.
NOT THE PUBLISHED VERSION; this is the author’s final, peer-reviewed manuscript. The published version may be accessed by following the link in the citation at the bottom of the page.
Polymers for Advanced Technology, Vol. 17, No. 4 (April 2006): pg. 312-319. DOI. This article is © Wiley and permission has been granted for this version to appear in e-Publications@Marquette. Wiley does not grant permission for this article to be further copied/distributed or hosted elsewhere without the express permission from Wiley.
24
Figure 5
(A) TGA curves for: (a) commercial PMMA; (b) PMMA/CHM-0; (c) PMMA/CHM-3
composite.
(B) DTG curves for: (a) pure PMMA; (b) PMMA/CHM-4B synthesized via bulk
polymerization.
NOT THE PUBLISHED VERSION; this is the author’s final, peer-reviewed manuscript. The published version may be accessed by following the link in the citation at the bottom of the page.
Polymers for Advanced Technology, Vol. 17, No. 4 (April 2006): pg. 312-319. DOI. This article is © Wiley and permission has been granted for this version to appear in e-Publications@Marquette. Wiley does not grant permission for this article to be further copied/distributed or hosted elsewhere without the express permission from Wiley.
25
Figure 6
(A) Plot of Ea values versus extent to decomposition, α, for the non-isothermal
degradation of commercial PMMA (▲), PMMA/CHM-0 (○), and PMMA/CHM-3 (●).
(B) Plot of Ea values α versus for the non-isothermal degradation of pure PMMA (○)
and PMMA/CHM-4B (●) synthesized via bulk polymerization.

NOT THE PUBLISHED VERSION; this is the author’s final, peer-reviewed manuscript. The published version may be accessed by following the link in the citation at the bottom of the page.
Polymers for Advanced Technology, Vol. 17, No. 4 (April 2006): pg. 312-319. DOI. This article is © Wiley and permission has been granted for this version to appear in e-Publications@Marquette. Wiley does not grant permission for this article to be further copied/distributed or hosted elsewhere without the express permission from Wiley.
26
Figure 7
FT-IR spectra of pure PMMA and PMMA/CHM-4B collected at room temperature. The
patterns are offset for clarity but otherwise not scaled.
NOT THE PUBLISHED VERSION; this is the author’s final, peer-reviewed manuscript. The published version may be accessed by following the link in the citation at the bottom of the page.
Polymers for Advanced Technology, Vol. 17, No. 4 (April 2006): pg. 312-319. DOI. This article is © Wiley and permission has been granted for this version to appear in e-Publications@Marquette. Wiley does not grant permission for this article to be further copied/distributed or hosted elsewhere without the express permission from Wiley.
27
Figure 8
Heat release rate (HRR) curves for (a) PMMA/CHM-0, (b) PMMA/CHM-3, and (c)
commercial PMMA from cone calorimetry measurements at a heat flux of 35 kW m-2.


![Methyl 2-{[(4-hydroxyphenyl)(methoxycarbonyl)methyl]aminocarbonyl}ethanoate hemihydrate](https://static.cupdf.com/doc/110x72/631be1f05a0be56b6e0ded67/methyl-2-4-hydroxyphenylmethoxycarbonylmethylaminocarbonylethanoate-hemihydrate.jpg)