(Chapter 14) (Page-1)
Second Edition
The Saudi Arabian EconomyPolicies, Achievements and Challenges
Mohamed A. Ramady

(Chapter 14) (Page-2)
CHAPTER
SAUDI ARABIA’S GLOBAL RELATIONS: GCC AND
BEYOND
© Springer. 2010

(Chapter 14) (Page-3)
Overview• Over the past three decades the Kingdom has
deepened its economic, political and military relationship with its immediate neighbors of the Gulf Cooperation Council (GCC).
• More recently, under King Abdullah, Saudi Arabia has expanded its economic and geo-political relationship with key emerging global economic powers, especially China and India.
• At the same time, Saudi Arabia has tried to maintain friendly relations with long established western and USA trading partners.
• The GCC bloc remains a key strategic economic bloc policy for Saudi Arabia.
© Springer. 2010

(Chapter 14) (Page-4)
Table 14.1. Regional bloc membership competitiveness upgrading benefits.
Business Environment Macroeconomic policies
Political Institutions and Governance
Improving efficiency and interconnectivity of transportation infrastructure
Coordinating macroeconomic policies
Sharing best practices in government operations
Enhancing regional communications Regional development banks – or Central bank.
Creating regional institutions
Creating an efficient energy network Coordinated capital requirements
- Dispute resolution mechanisms
- Harmonizing economic statistics
Linking financial markets Coordinated monetary policy intervention or policy signed.
Developing a regional position with international organizations
Opening the movement of students for training or higher education
Having one voice on international issues of importance to bloc.
Eliminating trade and investment barriers within the region
Simplifying and harmonizing cross-border regulations, paperwork and visas
Coordinating antitrust and competition policies Harmonizing environmental and energy standards Harmonizing product safety standards Establishing reciprocal consumer protection laws Opening government procurement within the region Source: Adapted from Porter, 2010
© Springer. 2010

(Chapter 14) (Page-5)
The first milestone: the GCC• On 25 may 1981 in Abu Dhabi, the GCC was formed
encompassing Saudi Arabia, UAE, Kuwait, Qatar, Oman and Bahrain.
• The objectives of the GCC were:– To effect coordination and interconnection between member
states in all fields.– To achieve unity between them.– To deepen and strengthen relations and cooperation between
their peoples.– Formulating similar economic and financial affairs, agriculture,
industry, commerce, customs, communications, education, culture, social and health, information and tourism.
– Coordinated military and political affairs.
© Springer. 2010

(Chapter 14) (Page-6)
• Administratively, the GCC is managed through the Secretariat General, headquartered in Riyadh.
• This Secretariat is headed by a Secretary General who is appointed by the Supreme Council on a 3 year term, renewable only once.
• The Supreme Council is the GCC’s highest authority and is composed of the member states.
• Since 1981, the GCC has evolved into a powerful economic bloc with strong negotiating authority with other economic blocs such as the European Union.
• There have been various phases of evolution of the GCC bloc since its establishment that reflects regional and international economic and political events.
© Springer. 2010
(Chapter 14) (Page-7)
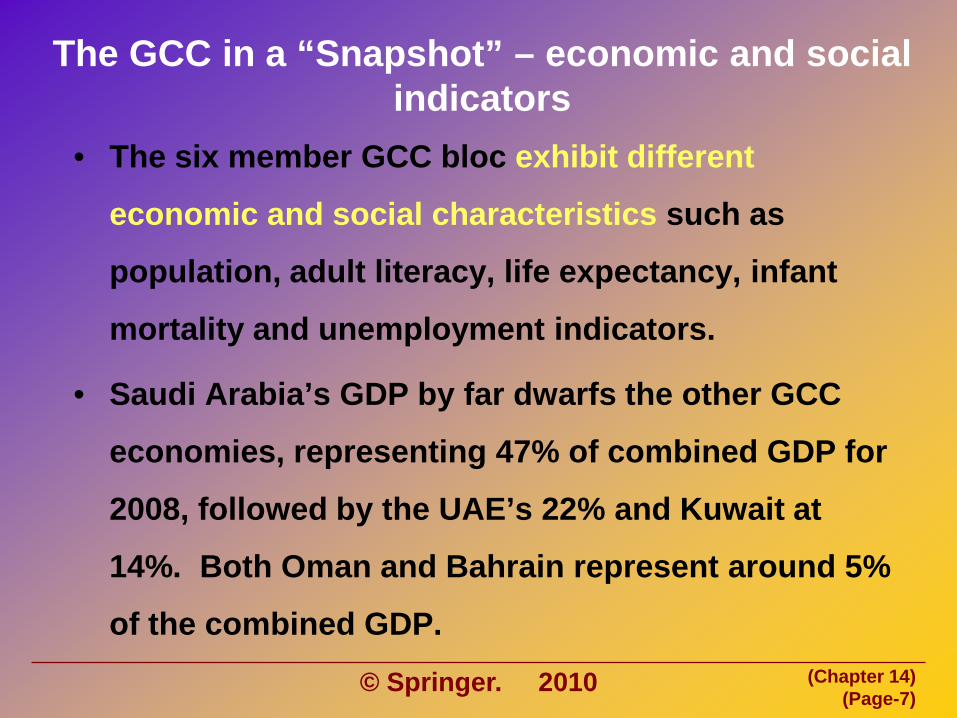
The GCC in a “Snapshot” – economic and social indicators
• The six member GCC bloc exhibit different
economic and social characteristics such as
population, adult literacy, life expectancy, infant
mortality and unemployment indicators.
• Saudi Arabia’s GDP by far dwarfs the other GCC
economies, representing 47% of combined GDP for
2008, followed by the UAE’s 22% and Kuwait at
14%. Both Oman and Bahrain represent around 5%
of the combined GDP.
© Springer. 2010
(Chapter 14) (Page-8)
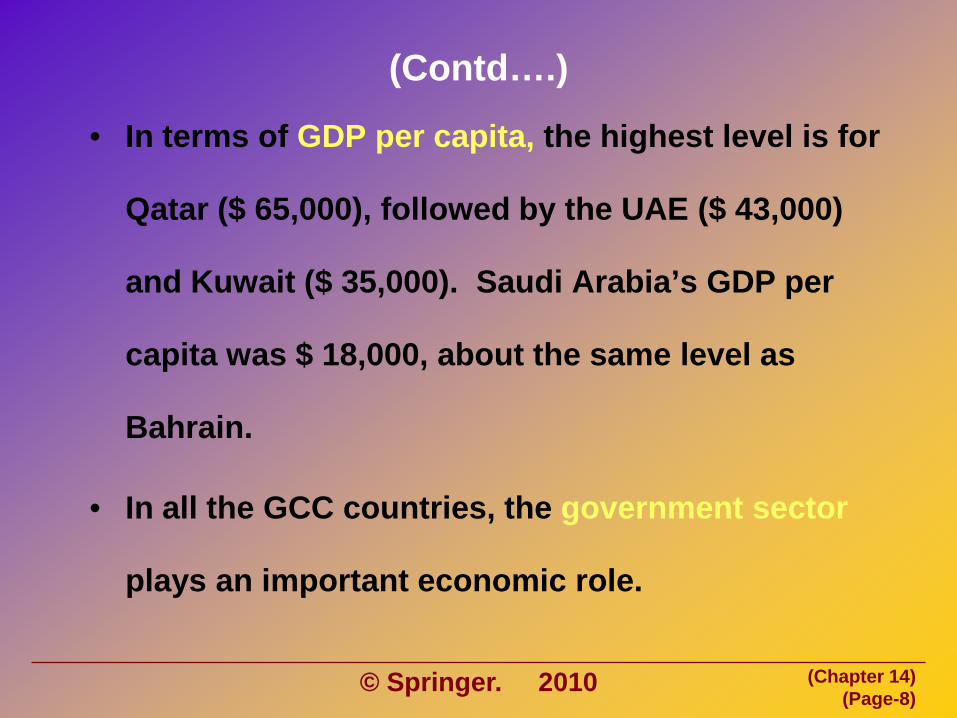
(Contd….)
• In terms of GDP per capita, the highest level is for
Qatar ($ 65,000), followed by the UAE ($ 43,000)
and Kuwait ($ 35,000). Saudi Arabia’s GDP per
capita was $ 18,000, about the same level as
Bahrain.
• In all the GCC countries, the government sector
plays an important economic role.
© Springer. 2010

(Chapter 14) (Page-9)
Bahrain Kuwait Oman Qatar Saudi Arabia U.A.E Demographic indicators
Population (million) Aged 0-14 (percent of total Aged 15 and over (percent of total) Population growth (percent, 1997-2008 average) Population gender ratio (men: women) Age dependency ratio (1) Urban population (percent of total)
1.1 27.3 72.7 2.0
57:43 0.6 90
3.4 17.8 82.2 3.10
56:44 0.6 97
2.9
31.6 68.4 4.7
53:47 1.0 32
0.8
22.5 77.5 6.0
63:37 0.5 94
24.2 33.9 66.1 2.2
55:45 0.9 82
5.6 19.5 80.5 4.9
63:37 0.5 92
Labour force indicators Total labour force (millions) Male (percent of total) Female (percent of total) Labour force growth (percent, 1993-1999 average) Participation rate (percent) Unemployment %
0.35 76.8 23.2 2.3 54 4.0
1.68 77.6 22.4 -1.6 49 0.7
0.66 75.3 24.7 5.2 25 8.0
0.09 69 31 3.9 52 ---
7.58 84.5 15.5 3.3 33
13.0
2.56 86.5 13.5 3.9 46 2.3
Social indicators School enrolment (percent) Primary Secondary Tertiary Adult literacy rate (percent) Population per physician Access to safe water (percent of population Life expectancy at birth (years) Infant mortality rate (per 1,000 live births)
100 100 30 92
760 100 76 19
100 100 30 90
650 100 78 11
90 65 15 45
1200 85 70 18
100 99 40 80
667 100 76 18
100 95 35 80
749 93 73 20
100 75 35 82
1208 98 79 16
Sources: World Bank, Social Indicators of Development, UNDP, Human Development Report, Arab World Competitiveness Report. (1) Population under the age of 15 and over the age of 65 as a share of the total working-age population
Table 14.2. GCC Countries: Population, Labour Force, and Social Indicators (1997 or most recent year)
© Springer. 2010

(Chapter 14) (Page-10)
Figure 14.1. Country share of total GCC GDP: 2008
Saudi Arabia47%
UAE22%
Bahrain5%
Kuw ait14%
Oman5%
Qatar7%
Source: SAMA
© Springer. 2010

(Chapter 14) (Page-11)
Table 14.3: GCC countries: economic indicators 2008 Bahrain Kuwait Oman Qatar Saudi
Arabia UAE
Nominal GDP ($ billion) 18.5 148.8 53.1 104.6 468.8 239.5 Real GDP Growth (%) 6.1% 6.3% 6.2% 16.4% 4.4% 7.4% GDP per capita ($) $18,810 $35,930 $19,480 $65,060 $18,700 $43,350 Inflation (%) 7.0% 10.8% 12.5% 15.1% 9.9% 14.0% Imports ($ billion) 14.6 26.1 16.7 21.2 100.6 116.6 Exports ($ billion) 16.9 88.8 33.3 53.2 313.3 180.9 Current Account ($ billion) 1.3 59.5 4.8 18.3 134.0 28.7 Government Balance (% of GDP) 2.7% 30.8% 4.2% 9.6% 33.6% 12.2%
Oil and gas reserves (Billion boe) 1.6 112.7 11.8 174.7 308.8 135.9
Oil sector (% of nominal GDP) 33% 55.8% 47.2% 62.1% 56% 34.4%
Net foreign assets ($ billion) 3 295 23 100 403 272 External debt to GDP ratio (%) 157% 25% 16% 87% 23% 76%
Cross border foreign claims / GDP (%) 70% 21% 25% 51% 12% 67%
Ease of doing business (2009) (1=best, 178 = worst) 20 61 65 39 13 33
Global competitiveness ranking 37 30 38 31 35 37
Rating (S&P) A AA- A AA- AA- AA Source: GCC Central Banks, IMF, World Bank.
© Springer. 2010

(Chapter 14) (Page-12)
Economic diversification and economic integration
• A key aspiration for many of the GCC
economies that are dependent on the oil
sector, is to reduce their overwhelming
dependence on oil revenues.
• Some have argued that oil revenue is the “glue”
that holds the GCC together and that a collapse
in oil prices could put pressure on the bloc.
© Springer. 2010

(Chapter 14) (Page-13)
(Contd…..)
• All of the GCC states, except Bahrain, have large oil
reserves, and together account for around 45% of
world oil reserves. Saudi oil reserves are the
largest, followed by Kuwait and the UAE while
Qatar’s gas reserves dwarfs all others.
• The contribution of the oil sector to the different
GCC economies varies from around 80% for the
UAE over the period 2003-2005, to 23% for Bahrain.
© Springer. 2010

(Chapter 14) (Page-14)
Table 14.4: GCC hydrocarbon indicators 2008
Bahrain Kuwait Oman Qatar Saudi
Arabia UAE Global share %
A. Proven oil reserve (Billion Barrels) 0.12 101.5 5.3 15.2 262.9 97.8 45%
B. National gas reserves (Billion cubic meters)
102 1,784 690 25,466 7,570 6,091 22.8%
C. Export of crude oil (‘000 barrels/day)
0.1 1,738 592.7 703 7,321 2,334 20%
D. Gross oil exports revenues ($ billion)
0.3 57.2 14.9 15.4 207.1 60.7 N/A
E. Contribution of the energy sector to GDP (%)
13.3% 78% 48.9% 55% 60.7% 35.8% N/A
Soruce: GCC Secreteriat, OPEC, OAPEC, BP.
© Springer. 2010

(Chapter 14) (Page-15)
Table 14.5. Contribution of the oil sector to GDP 1977-2005
Country 1977 1986-1990 1996-1998 1992-2002 2003-2005 Bahrain 27 12.8 16.8 21.5 23.6
Kuwait 61 37.2 38.7 45.5 45.9
Oman 61 47.2 37.7 24.9 30.9
Qatar 68 34.7 38 35.3 29.1
Saudi Arabia 63 28.9 34.4 24.7 36.4
UAE 59 38.1 28.2 16.6 79.7
Sources: ESCWA and the League of Arab States, Statistical Indicators of the Arab World for the Period 1970-1979, ESCWA, Statistical Abstract of the ESCWA Region, 17th and 19th issues, 1999, GCC Central Banks Annual Reports.
© Springer. 2010

(Chapter 14) (Page-16)
GCC comparative performance rankings• In comparison with other regional trade blocs such as the
EU, North American Free Trade Association (NAFTA), Latin America, the GCC bloc is below the EU in terms of growth of real GDP per capita adjusted for purchasing power parity (PPP).
• The GCC bloc does better against the Latin American and African blocs, as well as ASEAN (Association of South East Asian Nations) although ASEAN does not include China.
• One major ingredient to achieve growth in real GDP is through “ease of doing business” in a country and in this respect the GCC countries reflect differences.
• Saudi Arabia ranks the highest in terms of ease of doing business for 2009, compared with the other GCC countries.
© Springer. 2010

(Chapter 14) (Page-17)
Saudi ease of doing business
• The surprise Saudi ranking (13th World ranking
against 20th for Bahrain and 33rd for UAE) is due to
some high rating in such factors as:
– Protecting investors, registering property,
starting a business and getting credit.
• The more problematical areas for Saudi Arabia were
in employing workers, enforcing contracts, closing
a business and dealing with licenses.
© Springer. 2010

(Chapter 14) (Page-18)
Figure 14.2. Comparative performance of GDP growth rates for selected regional groupings (2001-2009)
© Springer. 2010Source: Porter, 2010, Economist Intelligence Unit, 2009.
$0
$5,000
$10,000
$15,000
$20,000
$25,000
$30,000
$35,000
$40,000
0% 1% 2% 3% 4% 5% 6% 7% 8% 9% 10% Growth of Real GDP per Capital (PPP- adjusted). CAGR, 2001 to 2009 (adjusted)
NAFTA Scandinavia World Average: 4.09%
Western Europe
European Union (27 countries) GCC
Eastern Europe
Sub-Saharan Africa
World Average: $11,070Latin
America
MERCOSUR
Baltic Region
Balkans
SACU
ASEANAndean Community
South Asia
North Africa
PPP-adjusted GDP per Capita, 2009 (estiamted)

(Chapter 14) (Page-19)
Country Ease of doing
business
Starting a business
Dealing with
licenes
Employ. workers
Regist. property
Getting credit
Protect. investors
Paying taxes
Trading across borders
Enforcing contracts
Closing a business
Saudi
Arabia
13 13 33 73 1 61 16 7 23 140 60
Bahrain 20 63 14 13 22 87 57 13 32 117 26
UAE 33 44 27 50 7 71 159 4 5 134 143
Qatar 39 68 28 68 55 135 93 2 41 95 33
Kuwait 61 137 81 24 89 87 77 11 109 113 69
Oman 65 62 130 21 20 127 93 8 123 106 66
Soruce: Global Competitiveness Report, Global Economic Forum, 2009.
Table 14.6. Ease of doing business: GCC countries 2009 rankings
© Springer. 2010

(Chapter 14) (Page-20)
Diversifying the economic base: manufacturing
• Some progress has been made in the GCC to
diversify the economic base into high value
manufacturing.
• Analysis of value-added by manufacturing sector
to GCC countries’ GDP for the period 1980-2008,
reveals that it ranges from 7-12% ,with Bahrain
having the highest, and Kuwait the lowest ratio.
• The Saudi ratio for the period was 9.3%.
© Springer. 2010

(Chapter 14) (Page-21)
Table 14.7. GCC: Value added by manufacturing sector to GDP 1980-2008 ($ billion and % of GDP)
Country 1980 1991 1998 2008 Bahrain 558
(18.0%) 517
(11.2%) 788
(12.7%) 1,705
(12.8%) Kuwait 1,609
(5.9%) 536
(3.0%) 3,009
(11.9%) 5,866 (7.2%)
Oman 45 (0.8%)
390 (3.4%)
669 (4.7%)
2,566 (8.2%)
Qatar 410 (5.2%)
852 (12.4%)
718 (7.4%)
3,582 (8.4%)
Saudi Arabia 6,555 (4.2%)
9,559 (8.1%)
12,542 (9.7%)
29,522 (9.3%)
UAE 1,142 (3.8%)
2,661 (7.8%)
5,500 (11.8%)
16,663 (12.2%)
Source: ESCWA, SAMA, UNDP.
© Springer. 2010

(Chapter 14) (Page-22)
The GCC manufacturing base: by sector, investment and labor force
• The GCC manufacturing sector exhibits wide sectoral diversification, with chemical production, metal fabrication and food products accounting for around 61% of all sectors. Other significant sectors are building materials and wood and furniture.
• In terms of investment made into the manufacturing sector, the main investments have been in chemicals (55%), building materials (13%) and metal production and food (around 8% each).
• The employment profile of these industries reveals that metal fabrication employed 25% of the labor force, followed by 21% in chemicals, and 15% in building materials, although textiles accounted for 10%.
© Springer. 2010

(Chapter 14) (Page-23)
Figure 14.3: GCC manufacturing sector breakdown (2008)
(A) By different manufacturing sector firms
Food Products13%
Textiles6%
Wood & Furniture8%
Paper & Paper Products
6%
Chemical Products
21%
Building Materials
16%
Basic Materials1%
Metal Fabrication Products
27%
Other Manufacturing
2%
© Springer. 2010

(Chapter 14) (Page-24)
Figure 14.3: GCC manufacturing sector breakdown (2008) Contd….
(B) By Investment (C) By Labor force
Basic Materials
13 %
Building Materials
15%ChemicalProducts
21%
Paper & PaperProducts
5%
Wood & Furniture
5%
Textiles10%
Food Products14%
Other Manufacturing
2%Metal FabricationProducts
25%
Building Materials
13%ChemicalProducts
55%
Basic Materials
10%
Metal FabricationProducts
9%
Paper & PapeProducts
2%
Wood & Furniture
1%
Other Manufacturing
1%
Food Products
8%
Textiles1%
Source: GOIC, 2009
© Springer. 2010

(Chapter 14) (Page-25)
Majority of GCC manufacturing units employ few workers
• Breakdown of the GCC manufacturing units according to the distribution of the work force by different categories, indicates that nearly 60% of the labor force were employed in units employing less than 60 employees.
• Only 30% of manufacturing units employed more than 60 workers.
• The above indicates that throughout the GCC, the importance of SME’s (Small and Medium Sized Enterprises) is evident.
© Springer. 2010

(Chapter 14) (Page-26)
Figure 14.4. Gulf Cooperation Council: % distribution of manufacturing firms according to size of work force (2007)
(Not stated)9.00%
(30<60)23.50%
(0<30)37.30%
(>60)30.20%
Source: Gulf Organization for Industrial Consulting, 2008.
© Springer. 2010
(Chapter 14) (Page-27)
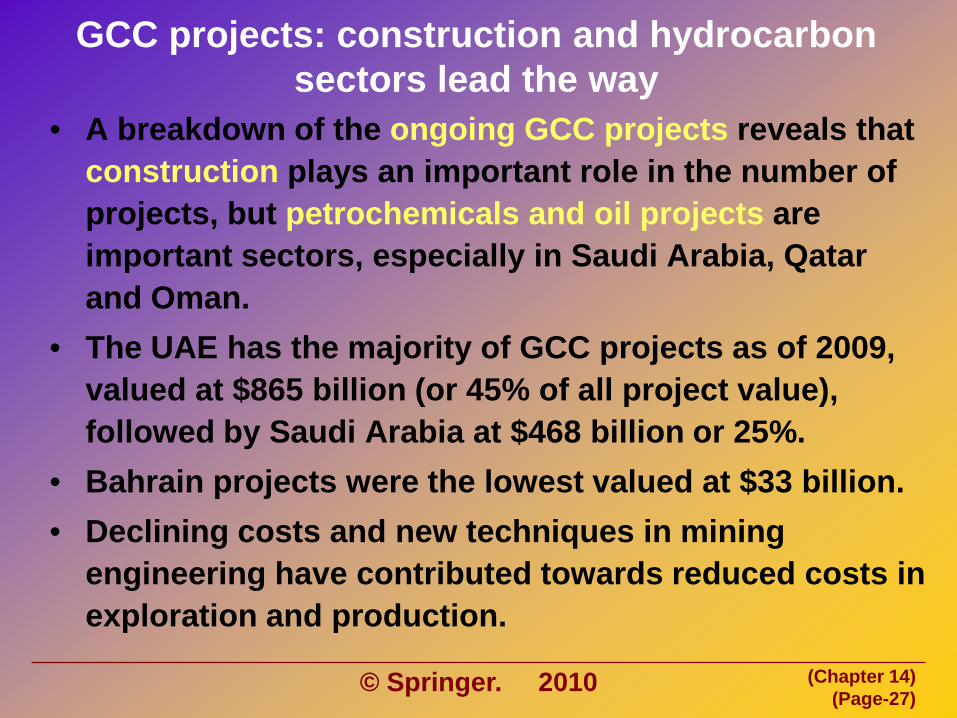
GCC projects: construction and hydrocarbon sectors lead the way
• A breakdown of the ongoing GCC projects reveals that construction plays an important role in the number of projects, but petrochemicals and oil projects are important sectors, especially in Saudi Arabia, Qatar and Oman.
• The UAE has the majority of GCC projects as of 2009, valued at $865 billion (or 45% of all project value), followed by Saudi Arabia at $468 billion or 25%.
• Bahrain projects were the lowest valued at $33 billion.• Declining costs and new techniques in mining
engineering have contributed towards reduced costs in exploration and production.
© Springer. 2010

(Chapter 14) (Page-28)
Figure 14.5. GCC Projects: Share by Country and Sector (2009)
UAE
Water 1%
Construction 83%
Industry 3%
Oil & Gas 8%
Petrochemical1%
Power4%
Saudi Arabia
Power9%
Petrochemical21%
Water 3%
Const. 46%
Oil & Gas 21%
KuwaitPower
3%
Indus. 1%
Water 1%
Petro-chem.
2%
Oil & Gas 19%
Const. 74%
Qatar
Const. 39%
Power8%
Water 4%
Industry 3%
Petro-chem.
9%
Oil & Gas 37%
Oman
Water 3%
Power7%
Industry 3%
Petro-chem.27%
Oil & Gas 19%
Const. 41%
BahrainPower8%Water
1%
Oil & Gas3%
Industry 11%
Const. 77%
© Springer. 2010

(Chapter 14) (Page-29)
Table 14.8 Selected major upstream oil and gas projects in the GCC 2009Country Project Cost
($ Million) Scope of Work Status
i. Saudi Arabia •Saudi Aramco Khurais Field
Development 3,000
Full Field Development Gas project.
•Saudi Aramco Eastern Province Straddle Plant
1,100 Construction of 800 million cu. ft./day plant to handle NGL
Jacobs Engineering . In production
•Saudi Aramco Haradh Gas Plant Expansion
400 Increasing capacity by 500,000 cu. ft/day
In production
•Saudi Aramco Hawiyah Gas Plant Expansion
400 Increasing capacity by 800,000 cu. ft/day
Jacobs Engineering. In production
•Saudi Aramco-Total Refinery. Jubail 10,000 Refinery capacity 400,000 b/d to process Arabian heave crude
2013 commissioning of plant.
•Saudi Aramco-Sumitomo Petro Rabigh
Petro-Chemical 10,000 World’s largest integrated petrochemical complex
Ethylene/propylene contractor-foster wheeler ethylene process technology show stone & Webster operation since 2008.
•Saudi Aramco Ras Tanura refinery/ petrochemical complex
N/A Upgrade of existing refinery capacity by 400,000 bpd and build new petrochemical complex
At FEED stage, completed 2009. Production 2013.
ii. Qatar • Qatargas II Trains 4 & 5 12,000 Two trains of 7.8 million tons/year
each Chiyoda doing downstream feed, while McDermott upstream. First gas production in 2008
• Rasgas III Trains 5 & 6 12,000 Two trains of started 7.8 million tons/year each
Qatar Petroleum and Exxon Mobil. First gas 2008/2009
• QP/Royal Dutch/Shell
Ras Laffan GTL Plant 5,000 140,000 barrel/day First production started 2008/2009
• QP/DEL Dolphin Gas Pipeline. 3,500 120 km. Pipeline Gas pipeline to Dubai operational. iii. UAE • GASCO/ ADCO
NGL feed gas 2,300 Additional volumes of NGL/Gas Tenders submitted
• ADMA/OPCO Umm Shaif Gas Re-injection
1,200 600 million cu. ft./day GAS Company selection
• ADNOC District gas grid 380 Construction of new LPG train on Das Island
Chiyoda
• GASCO Habshan gas expansion
350 350 million cu. ft./day train Fluor Daniel
© Springer. 2010

(Chapter 14) (Page-30)
Contd…. from previous page
iv. Kuwait • KPC Project Kuwait 7,000 Doubling oil
production from fields to 900,000 barrel/day
International Oil Companies
• KOC Flowlines replacement
800 Replacement of flowlines
Operational
• KOC Water Disposal 150 Western oil fields Operational v. Oman • PDO Haweel Phase II
gas injection 850 Construction of gas
injection in seven fields
AMEC Operational
• PDO 48 inch loop 350 265 km. gas pipeline Operational • PDO Kawther Field
Development 250 Gas field
development New gas project
Source: Middle East Economic Digest.
© Springer. 2010

(Chapter 14) (Page-31)
The GCC financial sector: surviving the global turmoil
• Over the past decade, the GCC financial system
has become more integrated with international
markets.
• Several countries such as Dubai and Bahrain have
established themselves as world financial centers,
and Qatar and Saudi Arabia are also aiming to do
the same with Saudi Arabia setting King Abdullah
Financial City in Riyadh.
© Springer. 2010

(Chapter 14) (Page-32)
(Contd….)• Global integration brings both benefits and threats,
as evidenced by the contagion of the global financial crisis of 2007/2008 and which affected Dubai.
• While there has been significant advances in the GCC financial markets, the overall financial system still lacks depth and diversification. Overall the six GCC countries have adopted an open economic system with free movement of capital and fixed exchange rate systems.
© Springer. 2010

(Chapter 14) (Page-33)
Index Saudi Arabia UAE Bahrain Qatar Oman Kuwait Exchange Rate Arrangement Currency Saudi Riyal UAE
Dirham Bahrain Dinar
Qatar Riyal Omani Riyal Kuwait Dinar
Exchange Rate Structure Unitary Unitary Unitary Unitary Unitary Mixed currency Classification Conventional
Pegged Conventional Pegged
Conventional Pegged
Conventional Pegged
Conventional Pegged
Conventional Pegged
Exchange Tax No No No No No No Exchange Subsidy No No No No No No Forward Exchange Market Yes Yes Yes Yes Yes Yes Controls on Current Payments and Transfers Arrangements for Payments and Receipts No No No No No No Control on Payments for Invisible Transactions and Current transfers
No No No No Yes No
Proceeds from Exports and/or Invisible Transactions
No No No No No No
Capital Controls Capital Market Securities Yes Yes Yes No Yes Yes Money Market Instruments Yes Yes No No No Yes Collective Investment Securities Yes Yes No No No Yes Derivatives and other instruments Yes No No No No Yes Commercial Credit Yes No No No No No Financial Credit Yes No No No No No Direct Investment Yes Yes Yes Yes Yes Yes Liquidation of Direct Investment Yes Yes Yes Yes No No Real Estate Transactions Yes Yes Yes No Yes Yes Personal Capital Movement Yes No Yes Yes No No Provisions specific to commercial banks Yes Yes Yes No Yes Yes Provision specific to institutional investors No No No No No No Source: World Economic Forum “Arab World Competitiveness Report
Table 14.9 The Gulf Cooperation Council: exchange rate and capital restrictions
© Springer. 2010

(Chapter 14) (Page-34)
Not all GCC central banks have the same operating instruments
• Despite having roughly similar foreign exchange regimes and capital controls in place, not all the GCC central banks have used similar monetary policies.
• Some have relied more on “open market” instruments to control money supply and interest rates.
• With the exception of Saudi Arabia’s SAMA, all the other GCC central banks support their commercial banks through overnight lending, discount window facilities or certificates of deposit.
• During the global financial crisis of 2007/2008 all GCC central banks actively intervened to provide liquidity injections and foreign exchange SWAPS, and also guaranteed commercial bank deposits.
© Springer. 2010

(Chapter 14) (Page-35)
Table 14.10 GCC central banks’ main operating instruments
Bahrain: Open market operations (purchase/sales of government securities, repos of government securities); open-market type operations (outright sales in the primary market); Central Bank lending operations (overdraft window, overnight lending)
UAE: The UAE Central Bank relies mainly on purchases of foreign exchange and swap facility in Central Bank Certificates of Deposit
Qatar: Same as UAE, plus a discount window facility Saudi Arabia: Repo operations in government and reverse repos for liquidity
investments; foreign exchange swaps and government deposits with banks
Oman: Mixture of FX purchase/sales and discount window Kuwait: Same as Bahrain; Central bank of Kuwait also has a “liquidity
scheme” in the form of one month deposits with the Central Bank
Source: Annual Reports, IMF.
© Springer. 2010

(Chapter 14) (Page-36)
GCC banking sector• The GCC banking sector is a relatively new one established
since the 1950’s, but today plays a vital development role in the GCC.
• In terms of GCC banking assets, the Saudi banking sector dominates the other countries, with over 40% of the total assets, followed by the UAE at 33% and Kuwait at 14%.
• In terms of return on assets Bahraini, Omani, and UAE banks outperformed the other GCC.
• In terms of return on equity Bahraini and Omani banks showed the best returns.
• The GCC banking sector is highly concentrated with Kuwait's 3 bank concentration ratio (ie the largest three banks in the sector) having a 78% concentration, 82% for Qatar, and 50% for Saudi Arabia.
© Springer. 2010

(Chapter 14) (Page-37)
Figure 14.6. GCC countries distribution of GCC banks private sector assets(2007): banking sector indicator
Qatar6.4%Oman
3.5%
0.0%
Saudi Arabia40.2%
Kuwait14.1%
UAE33.4%
Bahrain 2.4%
Source: GCC Secretariat, GOIC.
© Springer. 2010

(Chapter 14) (Page-38)
GCC capital markets• Equity markets in the GCC are expanding as scope for
private enterprises is increasing and demand for equity investment in rising.
• The Saudi equity market is the largest in the GCC in terms of capitalization, ($ 333 billion as of June 2009 or 52% of the total GCC market capitalization).
• In all the GCC capital markets, the financial, telecom and industrial sectors are the primary sectors, but basic materials, consumer goods and services are also important players.
• In common with Saudi Arabia, GCC equity markets exhibit few traded companies and low turnover ratios, and foreign access is still limited.
© Springer. 2010

(Chapter 14) (Page-39)
Table 14.11. GCC stock market by capitalization , % of GDP, P/E ratios and sector weighting (June 2009)
Stock Market Capitalization $ billion % of GDP PIE*
Saudi 333 90 16.2 UAE 102 47 9.3 * Abu Dhabi 68 52 9.2 * Dubai 34 39 9.5 Kuwait 93 93 13.4 Qatar 80 94 11.7 Oman 18 33 12.1 Bahrain 17 101 9.4 GCC 643 77 13.2
Sector Weight In GCC Stock Market Indices
Financials Telecom industry Saudi 45.3 8 10.8 UAE 54.8 27.7 8 * ADX 43.9 39 5.5 * DFM 76.5 5 13 Kuwait 42.3 3.4 24 Qatar 71.4 0.0 25.9 Oman 51.7 9.5 23 Bahrain 79.2 14.6 1.8
© Springer. 2010

(Chapter 14) (Page-40)
Table 14.11. Contd…………
Basic
Material Con.
Goods Con.
Services Saudi 23.9 4.2 3.9 UAE 1.7 0.8 3.4 * ADX 2.6 0.9 2.3 * DFM 0.0 0.0 5.5 Kuwait 3.7 5.1 10.9 Qatar 0.0 0.2 2.4 Oman 0.6 2.6 1.7 Bahrain 0.0 0.4 4.0
Source: Bloomberg, CMA
© Springer. 2010

(Chapter 14) (Page-41)
GCC debt market is expanding
• From 2007, the pace of debt security issuance in
the GCC picked up, despite the global financial
crisis.
• The GCC was also a prime issuer of SUKUK or
Islamic bonds, mostly issued by UAE and Saudi
Arabian prime government owned institutions
such as SABIC and the Saudi Electricity
Corporation.
© Springer. 2010
(Chapter 14) (Page-42)
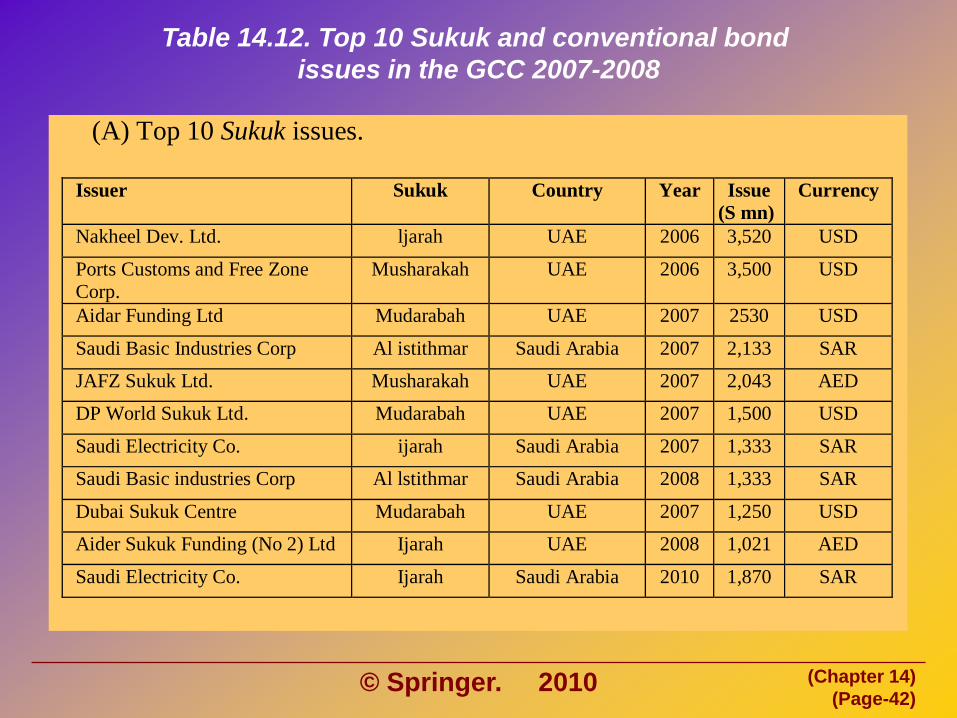
Table 14.12. Top 10 Sukuk and conventional bond issues in the GCC 2007-2008
(A) Top 10 Sukuk issues.
Issuer Sukuk Country Year Issue (S mn)
Currency
Nakheel Dev. Ltd. ljarah UAE 2006 3,520 USD
Ports Customs and Free Zone Corp.
Musharakah UAE 2006 3,500 USD
Aidar Funding Ltd Mudarabah UAE 2007 2530 USD
Saudi Basic Industries Corp Al istithmar Saudi Arabia 2007 2,133 SAR JAFZ Sukuk Ltd. Musharakah UAE 2007 2,043 AED DP World Sukuk Ltd. Mudarabah UAE 2007 1,500 USD
Saudi Electricity Co. ijarah Saudi Arabia 2007 1,333 SAR Saudi Basic industries Corp Al lstithmar Saudi Arabia 2008 1,333 SAR
Dubai Sukuk Centre Mudarabah UAE 2007 1,250 USD Aider Sukuk Funding (No 2) Ltd Ijarah UAE 2008 1,021 AED
Saudi Electricity Co. Ijarah Saudi Arabia 2010 1,870 SAR
© Springer. 2010

(Chapter 14) (Page-43)
Table 14.12. Contd…….
(B) Top 10 Conventional bond issues
Issuer Industry Country Maturity
year Issue year
Amount (5 mn)
DP World Corporate UAE 2037 2007 1748
TAQA Corporate UAE 2012 2007 1500 TAQA Corporate UAE 2036 2006 1500 RAS LAFFAN LNG 5 Corporate Qatar 2020 2005 1400
Emirates Airlines Corporate UAE 2013 2006 1380 DP World Corporate UAE 2037 2007 1115
Dubai Sovereign UAE 2013 2008 1088 TAQA Corporate UAE 2016 2006 1000 ABU DHABI COM BK Corporate UAE 2010 2005 1000
TAQA Corporate UAE 2013 2008 999 Source: NCB Capital Research
© Springer. 2010

(Chapter 14) (Page-44)
GCC capital market developments• The GCC capital markets are evolving but some further
developments are required: A greater need for effective disclosure by local companies and
a reliable data base and international accounting standards.
Strengthening independent regulatory authorities.
Deepening current stock markets by listing privately held and family owned companies.
Linking the GCC stock markets and cross-listing key stocks.
Establishing new specialist investment banks to provide stronger financial analysis and underwriting of share issues.
Continuing GCC efforts at economic and financial integration and monetary union.
© Springer. 2010

(Chapter 14) (Page-45)
GCC trade: non-regional bound.• The trade composition of GCC economies is “asymmetrical”
– exports are concentrated largely in crude oil and petroleum products, while imports are more diversified.
• This translates into the GCC being vulnerable to pricing developments in international commodity prices over which they have limited control.
• The GCC economies are amongst the most open in the world, with no foreign exchange controls, and relatively low tariff and quota protection.
• The current major export markets are Japan, China, South East Asia, the European Union, and the USA.
• The EU tends to dominate imports (32% of total) while South East Asia, China, USA and Japan follow in importance.
© Springer. 2010

(Chapter 14) (Page-46)
Figure 14.7 Geographical distribution of GCC foreign trade in 2007 (%)
0%
10%
20%
30%
40%
50%
60%
Exports 10.1% 15.6% 8.8% 13.6% 26.2% 4.8% 15.9% 5.9%
Imports 31.9% 9.3% 12.5% 14.3% 16.5% 7.9% 2.6% 5.0%
EU Japan U.SA. China South East Asia
GCC Other Arab Countries
Other Countries
Source: Gulf Organization for Industrial Consulting
© Springer. 2010

(Chapter 14) (Page-47)
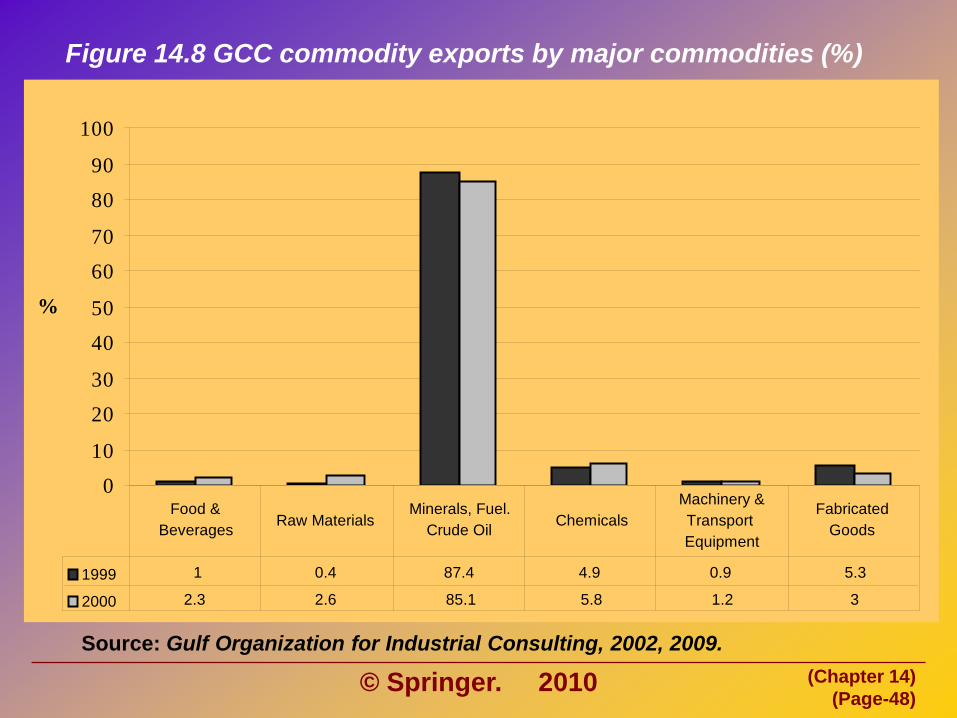
Lack of export diversification is worrying.
• There is a lack of meaningful diversification in the
pattern of GCC exports.
• The minerals, fuel and crude oil sector are over 80% of
total exports, with chemicals, fabricated goods and raw
minerals accounting for around 10% of exports.
• Only Bahrain has a more diversified export clusters
compared with the GCC countries.
© Springer. 2010
(Chapter 14) (Page-48)
Figure 14.8 GCC commodity exports by major commodities (%)
010
2030
4050
6070
8090
100
%
1999 1 0.4 87.4 4.9 0.9 5.3
2000 2.3 2.6 85.1 5.8 1.2 3
Food & Beverages Raw Materials
Minerals, Fuel. Crude Oil Chemicals
Machinery & Transport Equipment
Fabricated Goods
Source: Gulf Organization for Industrial Consulting, 2002, 2009.
© Springer. 2010

(Chapter 14) (Page-49)
Figure 14.9. GCC: Share of total exports by broad cluster for individual countries (2007).
© Springer. 2010
Export Share of Total
0%
10%
20%
30%
40%
50%
60%
70%
80%
90%
100%
SaudiArabia
Bahrain Kuwait Oman Qatar UAE
(1) Other
(2) Textiles & Apparel
(3) Jewelry & Previous Metals
(4) Agriculture and Food
(5) Metal Mining and Manufacturing
(6) Bldg. & Const.
(7) Communications Services
(8) Fin. Services
(9) Transp. & Logistics
(10) Business Serv.
(11) Plastics
(12) Chem. Products
(13) Oil & Gas Products
123410111213
4
5
6
7
8
9
10
1113
123
45910
11
12
1234 2
3456
911
13
1
1112
13
Source: GOIC, GCC Secretariat Riyadh

(Chapter 14) (Page-50)
GCC demographics and the labor market.
• The GCC countries have one of the highest population growth rates in the world.
• The GCC also has a large proportion of expatriates,reaching around 67% for the UAE and Qatar, and 23% for Oman as percentage of the total population.
• The situation becomes even more unbalanced when the expatriate labor force is calculated as percentage of total labor force. The UAE’s ratio rises to 92%, Kuwait 82%, and 68% for Oman. The Saudi ratio is around 51%.
© Springer. 2010

(Chapter 14) (Page-51)
Figure 14.10. GCC demographics and labour force (2003 or latest)
(A) Expatriate as percentage of total population
%
39.0%
55.6%
23.6%
66.1%
27.0%
64.5%
0%10%20%30%40%50%60%70%80%90%
100%
Bahrain Kuwait Oman Qatar SaudiArabia
UAE
© Springer. 2010

(Chapter 14) (Page-52)
Figure 14.10. GCC demographics and labour force (2003 or latest)
(B) Expatriate labour as percentage of total labour
%
58.3%
81.3%68.2%
58.6%51.0%
92.0%
0%10%20%30%40%50%60%70%80%90%
100%
Bahrain Kuwait Oman Qatar SaudiArabia
UAE
Source: World Bank, ESCWA, World Health Organization
© Springer. 2010

(Chapter 14) (Page-53)
GCC monetary union: a long and hard road.• During the annual GCC summit of December 2001, the
GCC countries signed an economic agreement that laid out some specific steps to achieve Monetary Union by 1st January 2010.
• The target date was not met, as Oman opted out in December 2006, and Kuwait declared that it would abandon the dollar peg in May 2007.
• In May 2009, the GCC rulers agreed to locate the proposed GCC Monetary Council (the forerunner of a GCC central bank) in Riyadh.
• This promoted the UAE to withdraw from the GCC common currency in November 2009.
© Springer. 2010

(Chapter 14) (Page-54)
GCC common currency – where next?• Following Oman and UAE withdrawal from the planned common
currency, what are the chances of a GCC common currency?
• In most probability, the issue will be shelved amongst the four remaining members, and instead the focus will be on strengthening monetary union of the GCC.
• This could involve the following:– Harmonizing regulatory policies and risk management practices.
– Deepening economic ties.
– Liberalizing inter-region trade and capital movement.
– Full labor movement.
• The above could follow the European Union model as there are some CONVERGENCE CRITERIA that needs to be adopted before monetary union could be established.
© Springer. 2010

(Chapter 14) (Page-55)
Table 14.13. Monetary union convergence criteria: Maastricht and GCC comparative analysis (2008)
Criterion Maastricht GCC GCC Compliance* Exchange rates Fluctuations within
normal margins for two years; no
devaluation against any other member
states currency
Long-term stability of GCC exchange
rates means that this criterion has not
been an issue
N/A Compliance
Foreign reserves
No such criterion To cover four months of Imports
Bahrain X Qatar √ Oman √ Kuwait √ KSA √ UAE √
Interest rates Long-term rates must not exceed a
margin of 2 percentage points
over the average of the three lowest - inflation members
As Maastricht but for short term rates
(3 months)
Bahrain √ Oman √ Kuwait √ UAE √ Qatar √ KSA √
Inflation rates Must not exceed more than 1.5
percentage points of the average of the
three lowest-inflation members.
As Maastricht Bahrain √ Qatar X Kuwait √ KSA √ Oman √ UAE X
Fiscal deficits Must not exceed 3 percent of GDP
As Maastricht when OPEC basket oil price is $25/b or
more
Bahrain √ KSA X Kuwait √ UAE √ Qatar √ Oman √
Government debt
Must not exceed 60 percent of GDP
As Maastricht Bahrain √ Oman √ UAE √ Kuwait √ KSA √ Qatar √
Note: √ = criteria met X = criteria not met. Source: Adapted from Rutledge, 2009.
© Springer. 2010

(Chapter 14) (Page-56)
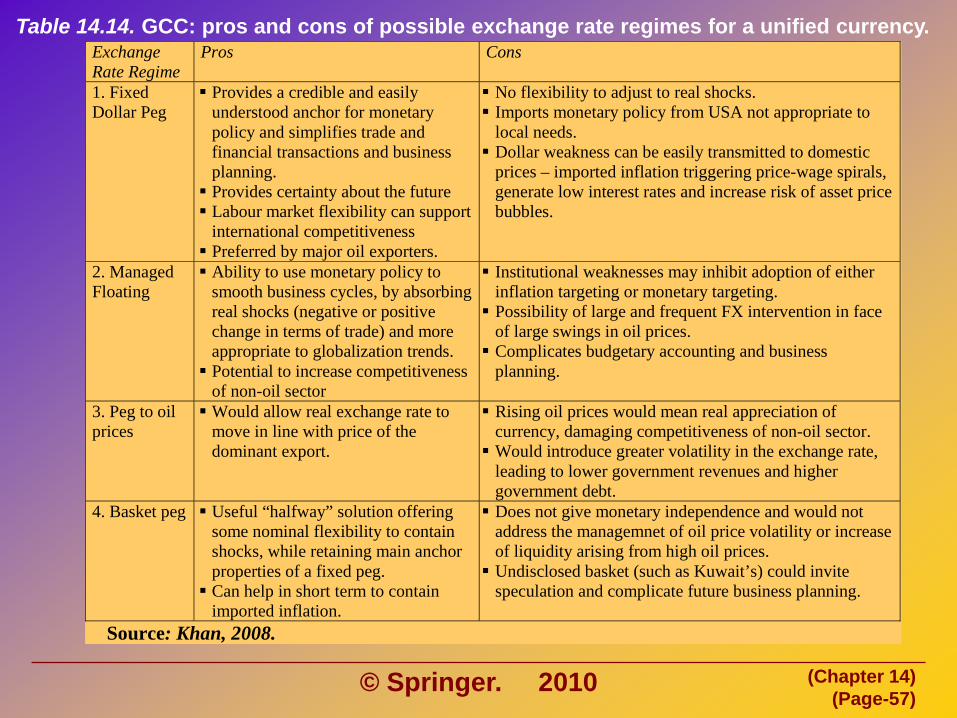
To peg or not to peg against the dollar?• One issue that the remaining GCC members who are
still interested in establishing a common GCC currency is whether to peg (fix) against the dollar or to establish other exchange rate regimes.
• The opting out of the fixed dollar peg by Kuwait makes agreeing on a dollar peg even more difficult.
• The options for the GCC are:– Fixed Dollar Peg– Managed Floating– Peg to Oil Prices– Basket Peg
• Each option has advantages and disadvantages.© Springer. 2010
(Chapter 14) (Page-57)
Table 14.14. GCC: pros and cons of possible exchange rate regimes for a unified currency.Exchange Rate Regime
Pros Cons
1. Fixed Dollar Peg
Provides a credible and easily understood anchor for monetary policy and simplifies trade and financial transactions and business planning. Provides certainty about the future Labour market flexibility can support
international competitiveness Preferred by major oil exporters.
No flexibility to adjust to real shocks. Imports monetary policy from USA not appropriate to
local needs. Dollar weakness can be easily transmitted to domestic
prices – imported inflation triggering price-wage spirals, generate low interest rates and increase risk of asset price bubbles.
2. Managed Floating
Ability to use monetary policy to smooth business cycles, by absorbing real shocks (negative or positive change in terms of trade) and more appropriate to globalization trends. Potential to increase competitiveness
of non-oil sector
Institutional weaknesses may inhibit adoption of either inflation targeting or monetary targeting. Possibility of large and frequent FX intervention in face
of large swings in oil prices. Complicates budgetary accounting and business
planning.
3. Peg to oil prices
Would allow real exchange rate to move in line with price of the dominant export.
Rising oil prices would mean real appreciation of currency, damaging competitiveness of non-oil sector. Would introduce greater volatility in the exchange rate,
leading to lower government revenues and higher government debt.
4. Basket peg Useful “halfway” solution offering some nominal flexibility to contain shocks, while retaining main anchor properties of a fixed peg. Can help in short term to contain
imported inflation.
Does not give monetary independence and would not address the managemnet of oil price volatility or increase of liquidity arising from high oil prices. Undisclosed basket (such as Kuwait’s) could invite
speculation and complicate future business planning.
Source: Khan, 2008.
© Springer. 2010

(Chapter 14) (Page-58)
Thinking West but moving East: Saudi Arabia’s new strategic partnerships.
• There has been a significant deepening of relationship between Saudi Arabia and emerging world economic powers such as China and India, as well as Brazil and Russia (the so-called BRIC economies).
• King Abdullah made his first overseas official visit to Chinaand India in January 2006, which was reciprocated by the Chinese President in April 2006.
• The issue of diversification of emerging markets for Saudi Arabia, and ensuring secure of supplies for China are important elements for both countries.
• Over the past few decades, China and Saudi Arabia have increased the scope and size of bilateral energy related cooperation, as well as bi-lateral trade which rose sharply.
© Springer. 2010

(Chapter 14) (Page-59)
• The bi-lateral trade relations with India has also risen. In 2008, exports to China represented around 9% of total exports, while exports to India represented 7.2%.
• Imports from China represented 11% of total imports, while those from India represented 4.2% for 2008. Saudi Arabia enjoys substantial trade surpluses with both countries.
• Energy security remains at the heart of the Asian relationship, especially for China, which is the second largest oil consuming nation after the USA, and faces a net import gap of oil demand.
© Springer. 2010

(Chapter 14) (Page-60)
Table 14.15. Saudi trade with China and India 1984-2008 ($ millions)
Year Exports to China
Imports from
China
Exports to India
Imports from India.
1984 6.4 183.4 1,119 265.9
1991 92.2 625.0 1,094 292.5
1998 328.0 958.0 1,622 815.1
2002 2,885.3 1,718 3,931 2,630
2006 15,957 8,710 17,098 3,074.4
2008 27,987 12,677 22,744 4,803.2 (2008) % to Total Saudi
Export/Imports 8.9% 11.0% 7.2% 4.2%
Source: SAMA
© Springer. 2010

(Chapter 14) (Page-61)
Figure 14.11. China’s oil production and consumption, 1990-2010*
Consumption
01,0002,0003,0004,0005,0006,0007,0008,0009,000
1990 1992 1994 1996 1998 2000 2002 2004 2006 2008 2010(F)
Production
Thou
sand
s bar
rel p
er d
ay
Forecast
Net Importgap
* Forecast.Source: IEA, 2009.
© Springer. 2010

(Chapter 14) (Page-62)
The Middle East remains China’s main oil import region• Despite import diversification from different regions,
especially Africa (Angola and Sudan), the majority of Chinese oil imports comes from the Middle East.
• Saudi Arabia and Iran are the largest exporters followed by Oman and Kuwait.
• Saudi-Chinese relations are not only concentrated on oil supplies, but involves a range of bi-lateral relations, including:– Security and defense.– Health.– Petrochemical joint ventures in China between SABIC and
Aramco with Chinese companies.– Oil exploration joint ventures.
© Springer. 2010

(Chapter 14) (Page-63)
Figure 14.12. China’s crude oil imports by source (Thousand barrels per day)
Kuw ait118
Kazakhistan113
UAE31
Oman291
Iran425Russia
232
Sudan209
Venezuela121
Saudi Arabia725
Angola536
Others646
2008 (Total 3,568)
© Springer. 2010

(Chapter 14) (Page-64)
Figure 14.12. Contd……
2009 (Jan-May) Total 3,505
Others582 Saudi Arabia
740
Iran544
Angola451Russia
299
Oman275
Sudan217
Congo115
Kazakhistan37
Libya33
Kuwait171
Source: FACTS Global Energy, 2009.
© Springer. 2010

(Chapter 14) (Page-65)
Saudi-India relations: technology and trade• Saudi Arabia and India share long trading and cultural
links, as India is home to about 170 million Muslims, second largest after Indonesia.
• Indian expatriates represent around 20% of Saudi Arabia’s expatriate population.
• Indian companies are evident in technology and IT, and have established joint ventures in Saudi Arabia following Saudi WTO accession.
• In 2010 a high level Saudi-Indian Economic Agreementfurther cemented the relationship in IT and renewable energy research.
© Springer. 2010

(Chapter 14) (Page-66)
Conclusion
• The GCC countries have come a long way since
1981 and had to deal with the most radical
economic, social and political transformation in
their history.
• They are all facing similar issues of finding
employment for their nationals, introducing
domestic reforms and meeting the challenges of
globalization.
© Springer. 2010

(Chapter 14) (Page-67)
(Contd….)• There is still more coordination required,
especially for labor mobility within the GCC, and in managing their expatriate labor force.
• The GCC Monetary Union is going ahead, minus two member states concerning the common currency.
• Saudi Arabia is also developing new global strategic alliances with Asian countries, which will become a more prominent feature of Saudi economic and foreign policy in the years ahead.
© Springer. 2010