Photo by kind permission of Matt Stuart
The psychosocial & educational
consequences of inequality for childrenRichard Wilkinson
Emeritus Professor of Social Epidemiology

3

Child outcomes found to be worse
in more unequal societies
• In rich countries
– Infant mortality
– Low birth weight
– Overweight
– Maths & literacy
scores
– Teenage births
– Child Conflict &
Bullying
– Social mobility
– UNICEF Index of
Child Wellbeing
• In US states
– Infant mortality
– Low birth weight
– Overweight
– Maths & literacy
scores
– Teenage pregnancy
– Mental health
problems
– Juvenile homicides
– High School drop outs
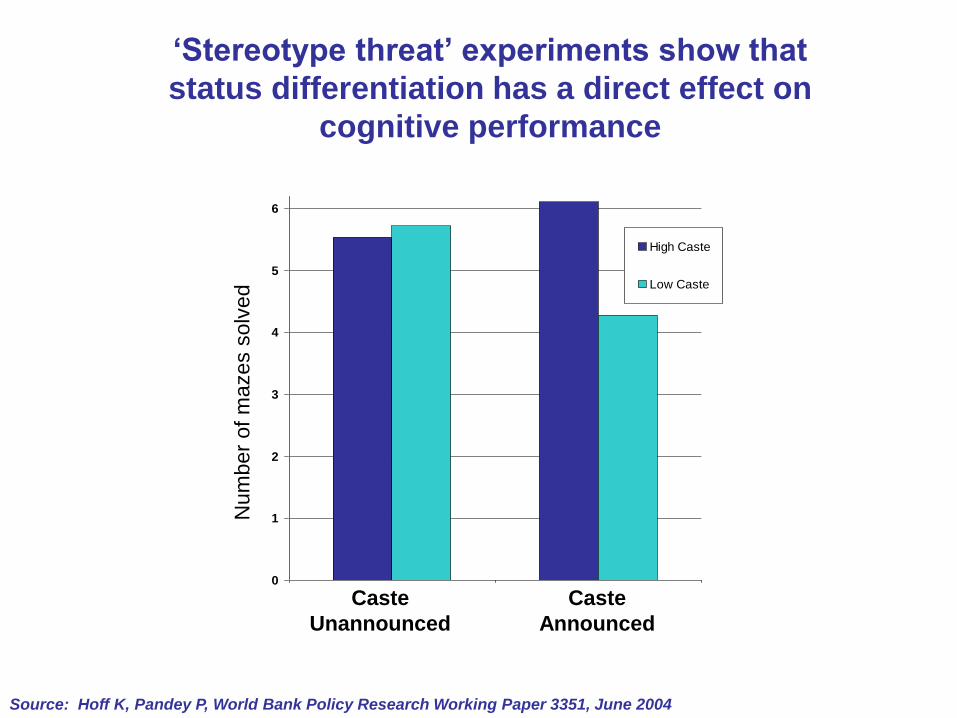
Caste
Unannounced
Caste
Announced
0
1
2
3
4
5
6
High Caste
Low Caste
Nu
mbe
r of
mazes s
olv
ed
Source: Hoff K, Pandey P, World Bank Policy Research Working Paper 3351, June 2004
‘Stereotype threat’ experiments show that
status differentiation has a direct effect on
cognitive performance
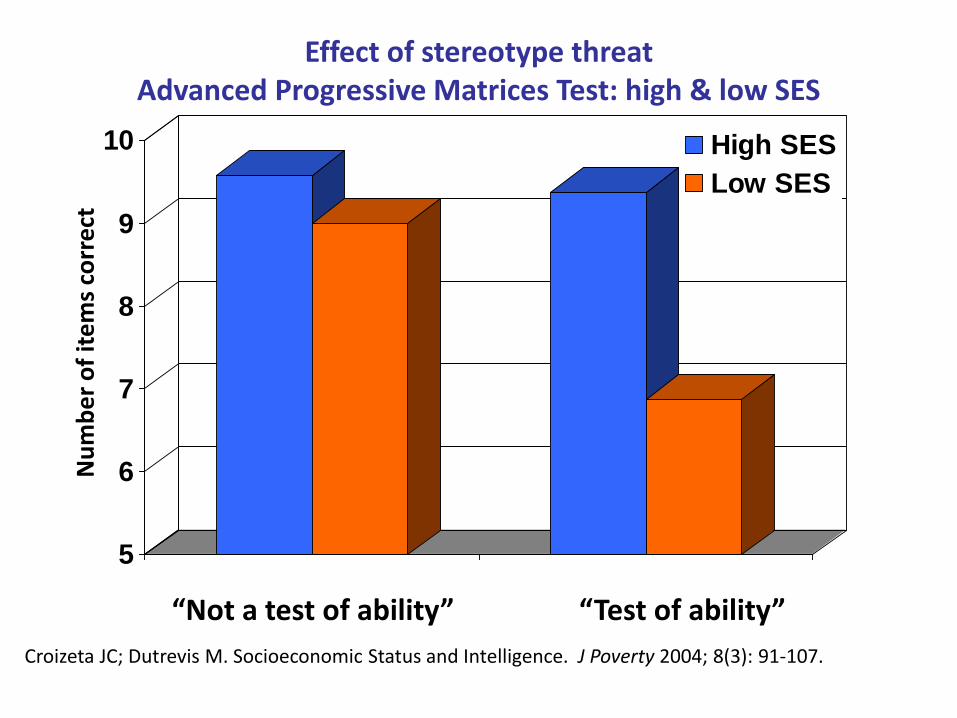
“Not a test of ability”
5
6
7
8
9
10 High SES
Low SES
“Test of ability”
Effect of stereotype threat Advanced Progressive Matrices Test: high & low SES
Croizeta JC; Dutrevis M. Socioeconomic Status and Intelligence. J Poverty 2004; 8(3): 91-107.
Nu
mb
er
of
ite
ms
corr
ect

7
Income per head and life-expectancy: rich & poor countries
Source: Wilkinson & Pickett, The Spirit Level (2009) www.equalitytrust.org.uk

www.equalitytrust.org.ukWilkinson & Pickett, The Spirit Level
Life expectancy in rich countries is
no longer related to National Income per head

70
71
72
73
74
75
76
77
78
79
80
Local Neighbourhoods
(in England & Wales)
Life
exp
ecta
ncy (
ye
ars
)
Richest Poorest
Wilkinson & Pickett, The Spirit Level www.equalitytrust.org.uk
Life expectancy is strongly related to
income within rich countries

3.7 3.94.3
4.6 4.85.2 5.3
5.6 5.6 5.6 5.76.1 6.2
6.7 6.8 6.87.2
8.5
9.7
4.0
8.0
7.0
3.4
Japan
Fin
land
No
rway
Sw
eden
Denm
ark
Belg
ium
Au
str
iaG
erm
an
yN
eth
erl
ands
Sp
ain
Fra
nce
Canada
Sw
izte
rland
Irela
nd
Gre
ece
Italy
Isra
el
New
Zeala
nd
Au
str
alia
UK
Po
rtugal
US
AS
ingap
ore
Income gaps
How many times richer
are the richest fifth than
the poorest fifth?
Wilkinson & Pickett, The Spirit Level www.equalitytrust.org.uk
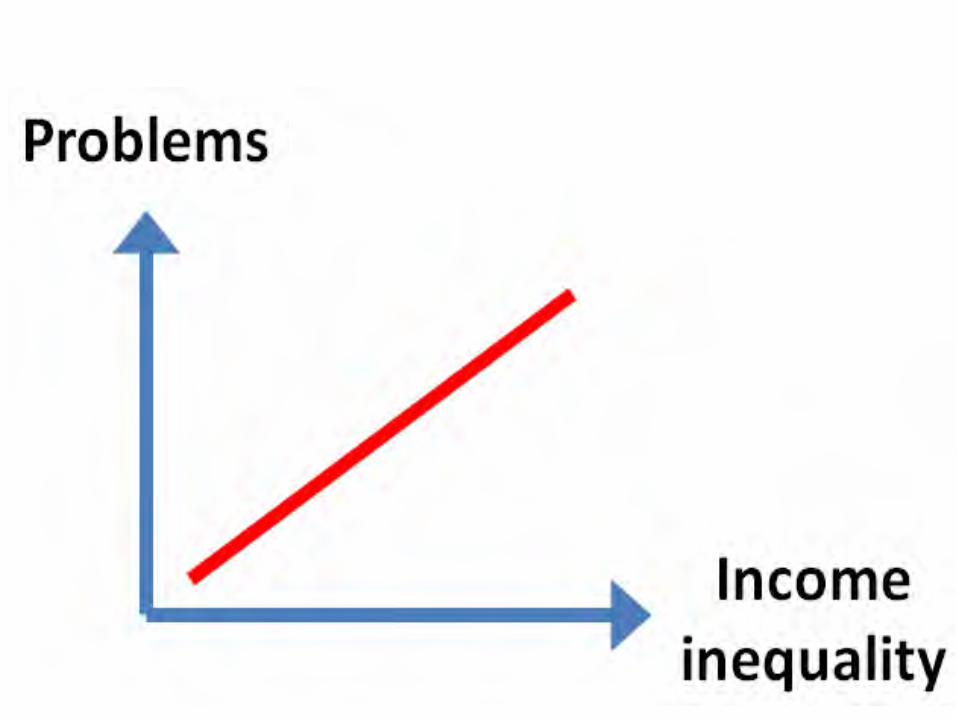
Inequality...
How much richer are the richest 20% in
each country than the poorest 20%?

Health and social problems with social gradients
and internationally comparable data
• Life expectancy
• Math & Literacy
• Infant mortality
• Homicides
• Imprisonment
• Teenage births
• Trust
• Obesity
• Mental illness – incl. drug &
alcohol addiction
• Social mobility
Wilkinson & Pickett, The Spirit Level
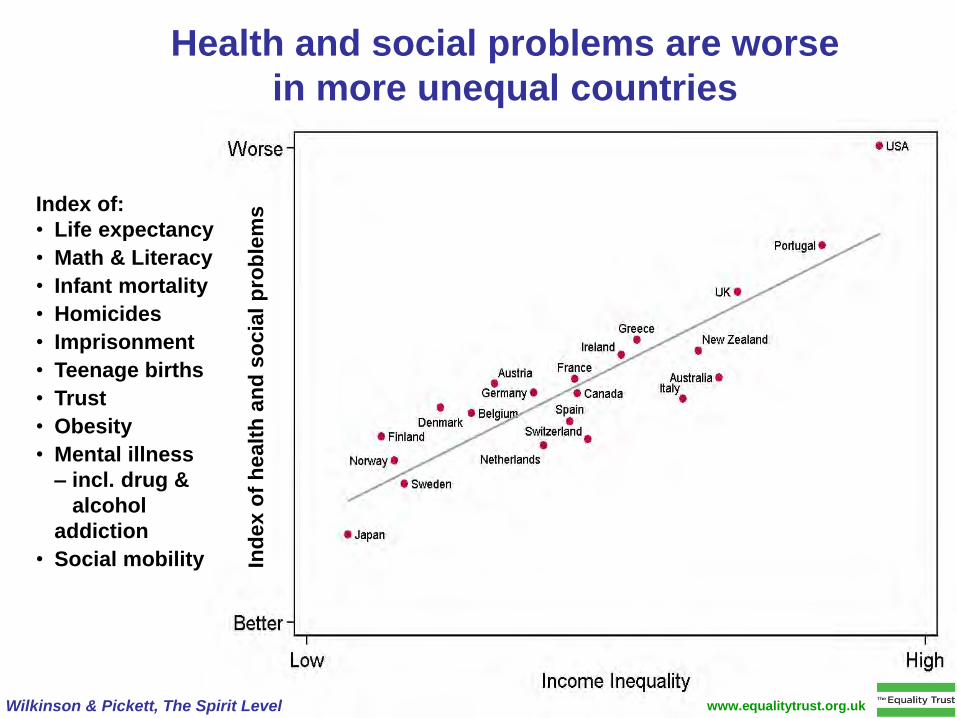
Index of:
• Life expectancy
• Math & Literacy
• Infant mortality
• Homicides
• Imprisonment
• Teenage births
• Trust
• Obesity
• Mental illness
– incl. drug &
alcohol
addiction
• Social mobility
www.equalitytrust.org.uk
Health and social problems are worse
in more unequal countries
Ind
ex
of
hea
lth
an
d s
oc
ial
pro
ble
ms

www.equalitytrust.org.ukWilkinson & Pickett, The Spirit Level
Neither health nor social problems are
related to national income per head
Index of:
• Life expectancy
• Math & Literacy
• Infant mortality
• Homicides
• Imprisonment
• Teenage births
• Trust
• Obesity
• Mental illness
– incl. drug &
alcohol
addiction
• Social mobility Ind
ex o
f h
ealt
h a
nd
so
cia
l p
rob
lem
s

www.equalitytrust.org.ukWilkinson & Pickett, The Spirit Level
Child Wellbeing is not related to National Income per head

www.equalitytrust.org.ukWilkinson & Pickett, The Spirit Level
Child well-being is better in more equal countries

Wilkinson & Pickett, The Spirit Level www.equalitytrust.org.uk
People in more unequal countries
trust each other less

0
30
60
90
120
150
180
Income Inequality
Ho
mic
ide
s p
er
millio
n p
eo
ple
Low High
Daly M, Wilson M, Vasdev S. Income inequality and homicide rates in Canada and the United States. Can J Crim 2001; 43: 219-36.
Homicide rates are higher in more unequal
US states and Canadian provinces
USA states
Canadian provinces

18
Cuernavaca, Mexico

‘Armed Response’ - Pretoria, South Africa.

Bowles & Jayadev, NYT 2014
Societies with wider Income differences need more “guard labor”
Inequality (Gini)
Pro
tec
tive
se
rvic
e e
mp
loye
es
pe
r 1
0,0
00
wo
rke
rs
20
The proportion
of ‘guard’ labor
grew with
inequality.
USA 1979-2000

www.equalitytrust.org.ukWilkinson & Pickett, The Spirit Level
Imprisonment rates are higher in
more unequal countries
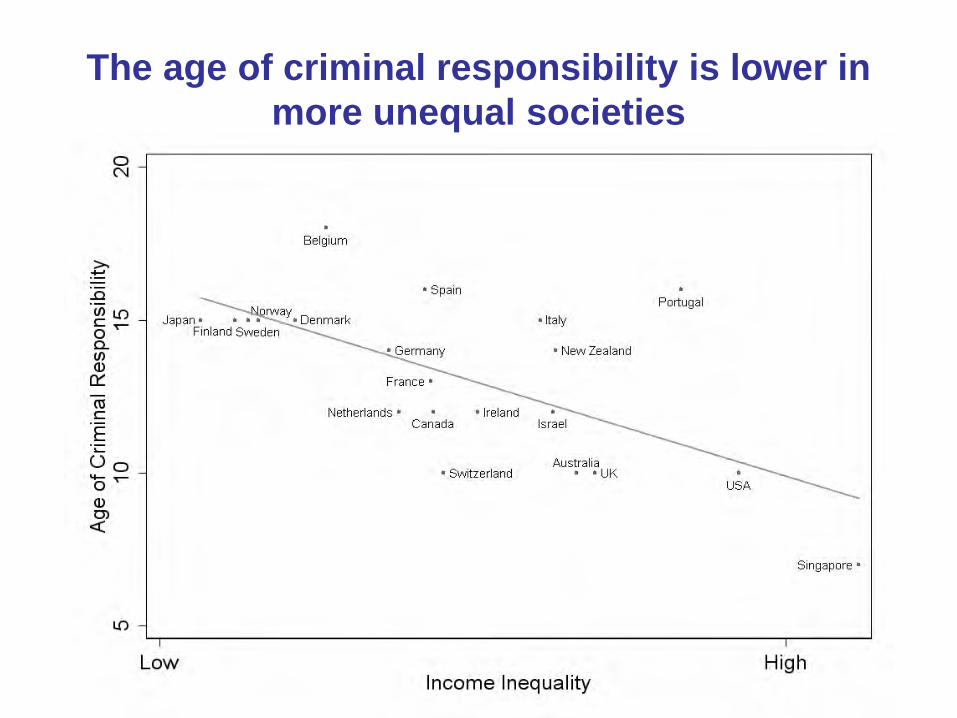
The age of criminal responsibility is lower in
more unequal societies

Layte R, Whelan CT. Who Feels Inferior? A Test of the Status Anxiety Hypothesis of
Social Inequalities in Health. European Sociological Review, 2014.
Status Anxiety across income deciles for
high, medium and low inequality countriesS
tatu
s A
nxie
ty
Income deciles
Countries with:
High inequality
Medium inequality
Low inequality
0
0.2
0.4
0.6
0.8
1
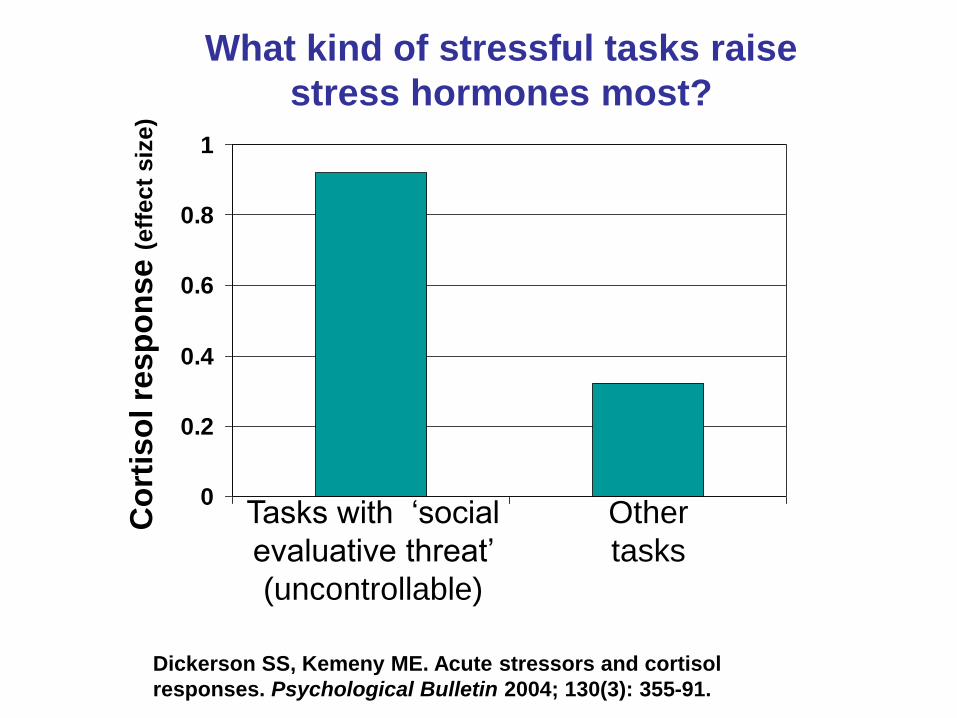
Other
tasks
Tasks with ‘social
evaluative threat’
(uncontrollable)
Co
rtis
ol re
sp
on
se
(eff
ect
siz
e)
Dickerson SS, Kemeny ME. Acute stressors and cortisol
responses. Psychological Bulletin 2004; 130(3): 355-91.
What kind of stressful tasks raise
stress hormones most?

Alan Bennett, Untold Stories, Faber/Profile, 2005
“(My parents) put…down…most of their imagined
shortcomings to their not having been educated, education
(was) to them a passport to everything they lacked: self-
confidence, social ease and above all the ability to be like
other people.
Put simply and as they themselves would have put it, both my
parents were shy, a shortcoming they thought of as an
affliction while at the same time enshrining it as a virtue.
I assured them, falsely, that everybody felt much as they did
but that social ease was something that could and should be
faked.
‘Well, you can do that,’ Dad would say, ‘you've been
educated,’ adding how often he felt he had nothing to
contribute. ‘I'm boring, I think. I can't understand why anybody
likes us. I wonder sometimes whether they do, really.’

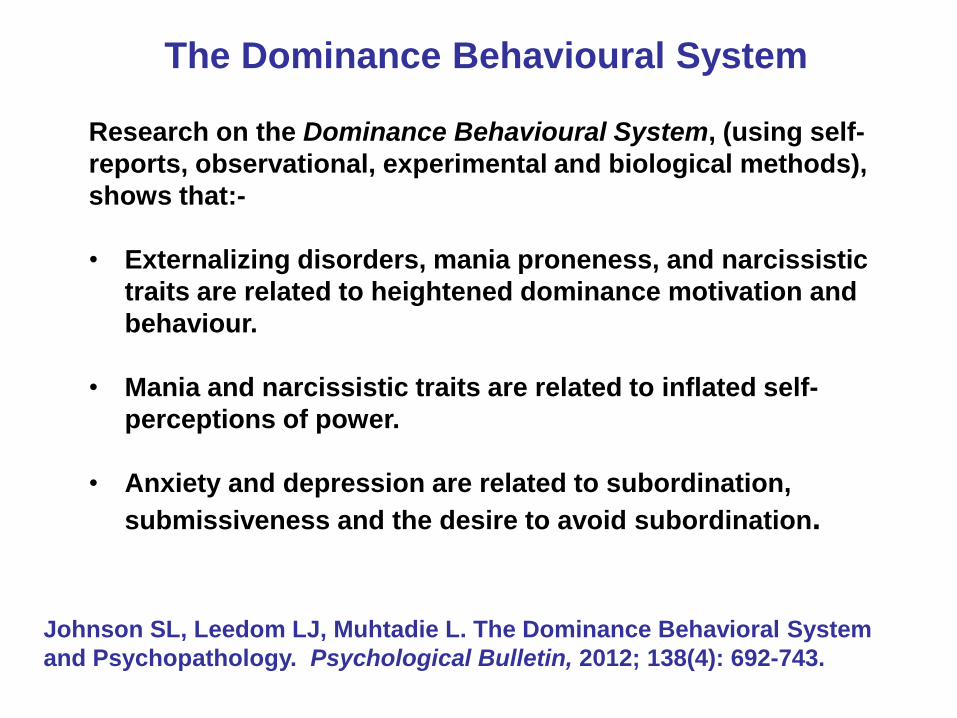
The Dominance Behavioural System
Research on the Dominance Behavioural System, (using self-
reports, observational, experimental and biological methods),
shows that:-
• Externalizing disorders, mania proneness, and narcissistic
traits are related to heightened dominance motivation and
behaviour.
• Mania and narcissistic traits are related to inflated self-
perceptions of power.
• Anxiety and depression are related to subordination,
submissiveness and the desire to avoid subordination.
Johnson SL, Leedom LJ, Muhtadie L. The Dominance Behavioral System
and Psychopathology. Psychological Bulletin, 2012; 138(4): 692-743.
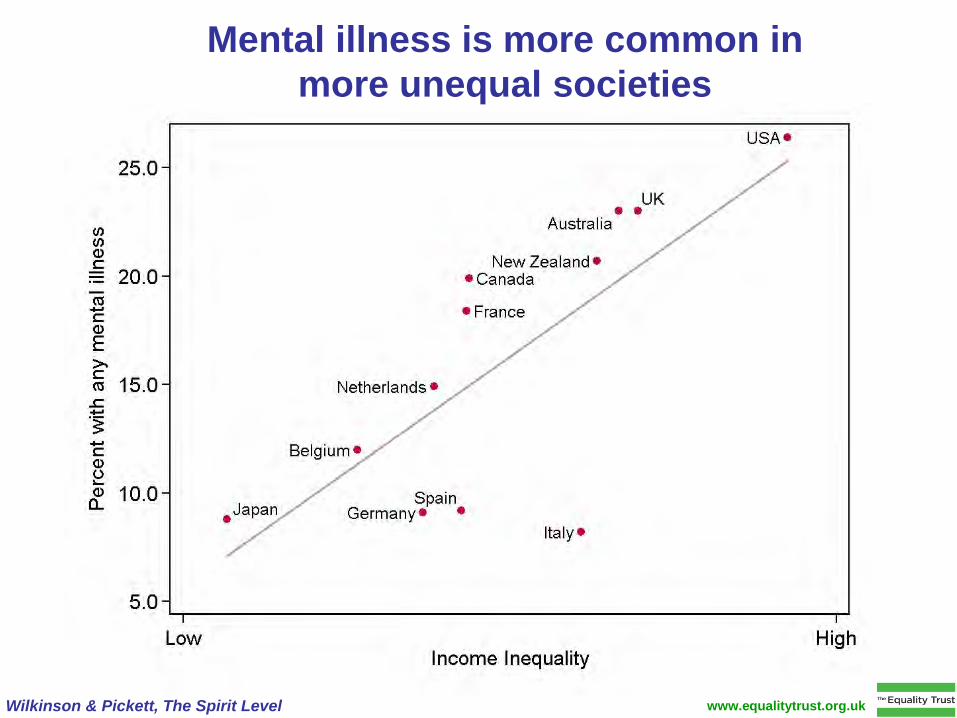
www.equalitytrust.org.ukWilkinson & Pickett, The Spirit Level
Mental illness is more common in
more unequal societies
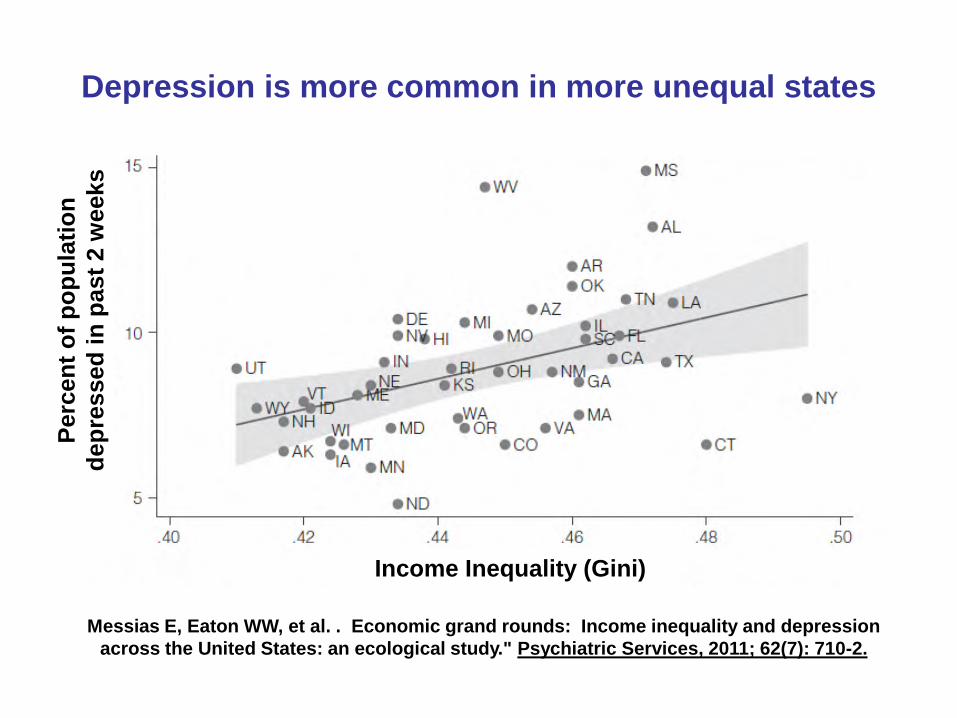
Messias E, Eaton WW, et al. . Economic grand rounds: Income inequality and depression
across the United States: an ecological study." Psychiatric Services, 2011; 62(7): 710-2.
Depression is more common in more unequal statesP
erc
en
t o
f p
op
ula
tio
n
dep
ressed
in
past
2 w
eeks
Income Inequality (Gini)

Inequality data from World Top Incomes Database
Narcissism data from Twenge JM, et al., Journal of Personality 2008; 76(4): 875-901.
Na
rcis
sim
Sc
ore
(N
PI)
Rising Narcissism & Income Inequality in the USA

Loughnan S, et al. Economic Inequality is linked to biased self-perception. Psychological Science, 2011; 22: 1254
Self enhancement increases in more unequal
societies

Two recent studies show that inequality
increases conspicuous consumption
and consumerism
• People in more unequal areas of the USA
are more likely to buy high status cars
• Data from Google searches shows that
people in more unequal states and more
unequal countries are more likely to
search for status goods

More children drop out of High School in more unequal US states
Low Income inequality High
% d
rop
pin
g o
ut
of
hig
h s
ch
oo
l
Wilkinson & Pickett 2009

School bullying is much more common in more
countries with bigger income differences.11-year-olds in 37 countries (r = .62)
Elgar FJ. et al. School bullying, homicide and income inequality. International Journal
of Public Health 58, 237-245, 2013.
Income inequality (Gini)
% o
f 11yr
old
s w
ho
bu
llie
d o
thers
two
or
mo
re t
imes p
er
mo
nth

Source: Wilkinson and Pickett. Lancet 2006; 367:1126-8. Data from: OECD
(2004), Learning for Tomorrow’s World: first results for PISA 2003.
Maths & Literacy scores and Income Inequality
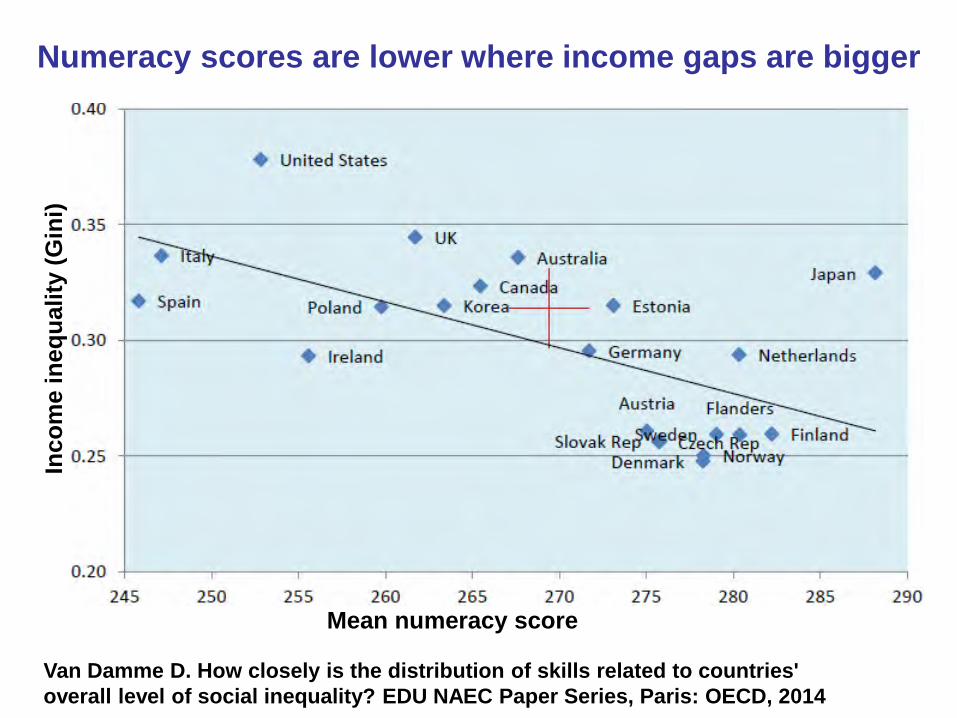
Mean numeracy score
Inco
me i
neq
uality
(G
ini)
Numeracy scores are lower where income gaps are bigger
Van Damme D. How closely is the distribution of skills related to countries'
overall level of social inequality? EDU NAEC Paper Series, Paris: OECD, 2014
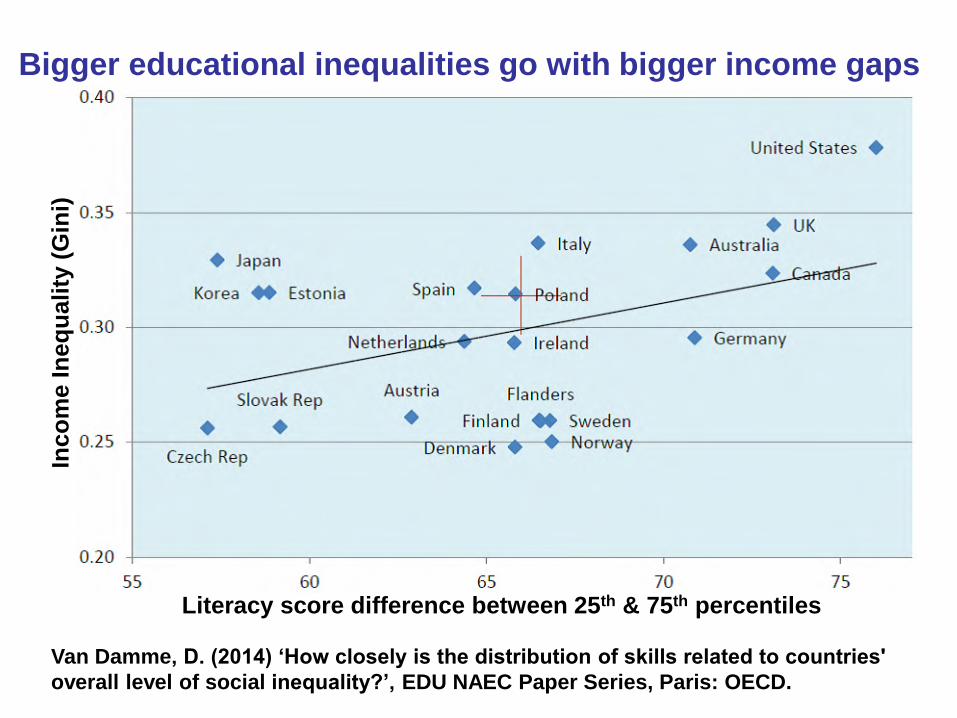
Van Damme, D. (2014) ‘How closely is the distribution of skills related to countries'
overall level of social inequality?’, EDU NAEC Paper Series, Paris: OECD.
Literacy score difference between 25th & 75th percentiles
Inco
me I
neq
uality
(G
ini)
Bigger educational inequalities go with bigger income gaps
Hig
h
So
cia
l M
ob
ilit
y
Lo
w
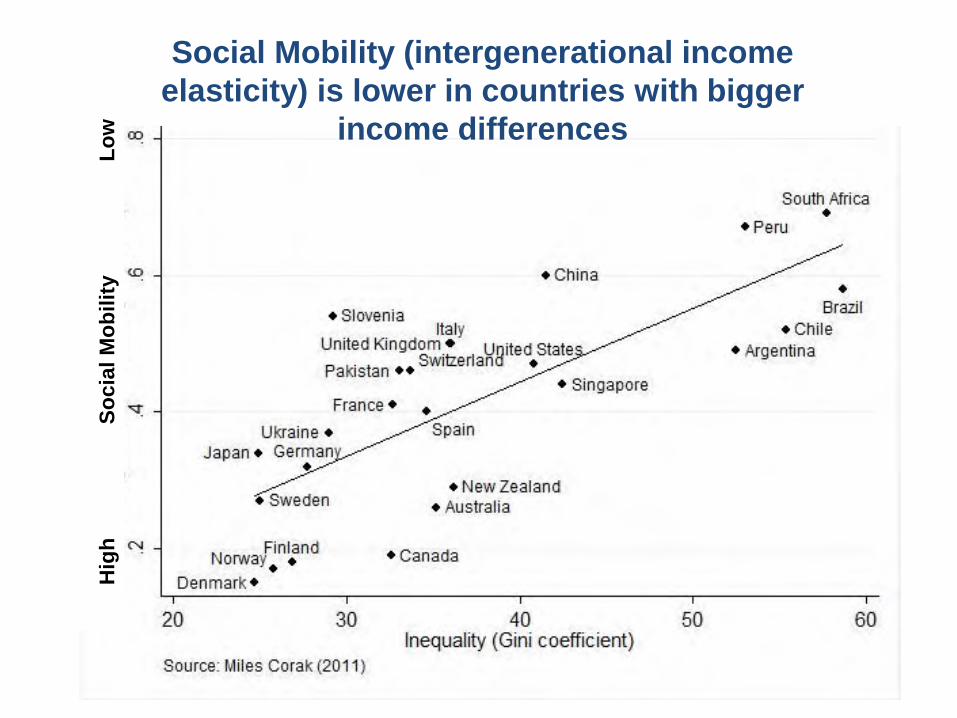
Social Mobility (intergenerational income
elasticity) is lower in countries with bigger
income differences

More children are overweight in more unequal countries
Source: Wilkinson & Pickett, The Spirit Level (2009)

40
Teenage Birth Rates are Higher in More Unequal Rich Countries
Source: Wilkinson & Pickett, The Spirit Level (2009) www.equalitytrust.org.uk

www.equalitytrust.org.ukWilkinson & Pickett, The Spirit Level
Imprisonment rates are higher in
more unequal countries

The age of criminal responsibility is lower in
more unequal societies

The Jekyll & Hyde of
Public Health?
• Friendship in contrast, is based on
reciprocity, mutuality, social
obligations, sharing and a recognition
of each other’s needs.
• Social status (dominance hierarchies,
pecking orders) are orderings based on
power, coercion and privileged access to
resources – regardless of the needs of
others.
Companion Spanish: Compañero;
French: Copain
from the Latin “Con” (with)
and “Pan” (bread)
- someone with whom you eat bread

Marshall
Sahlins
“Gifts make friends and
friends make gifts”
Stone Age Economics (1974)

FJ Elgar , W Craig , SJ Trites. Journal of Adolescent Health, 2013; 52(4): 433-8
Children in families that eat together
have better mental health
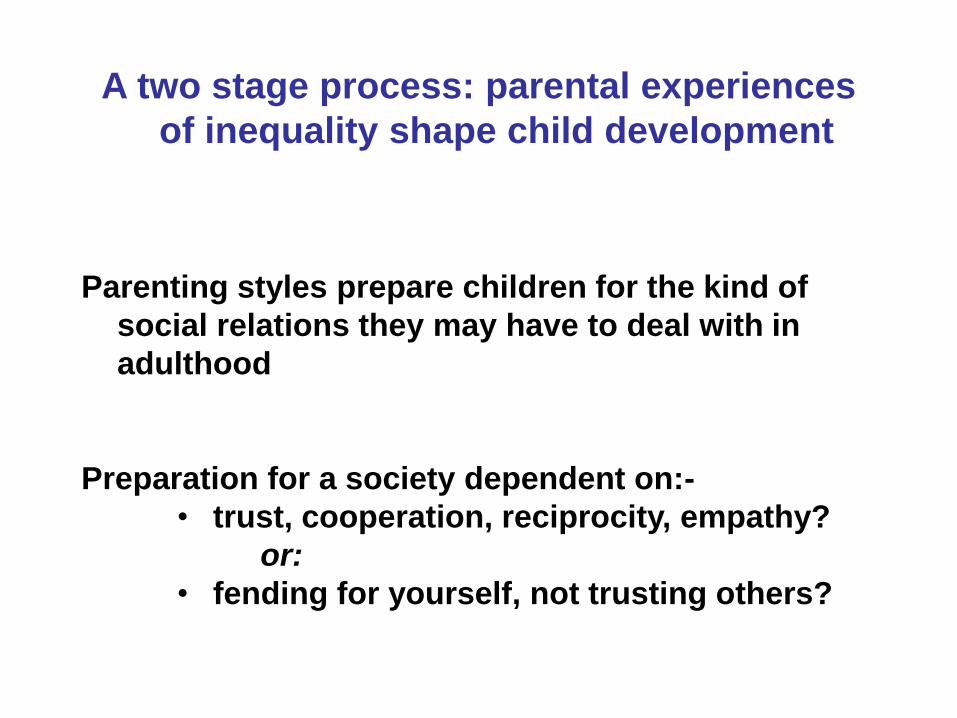
A two stage process: parental experiences
of inequality shape child development
Parenting styles prepare children for the kind of
social relations they may have to deal with in
adulthood
Preparation for a society dependent on:-
• trust, cooperation, reciprocity, empathy?
or:
• fending for yourself, not trusting others?
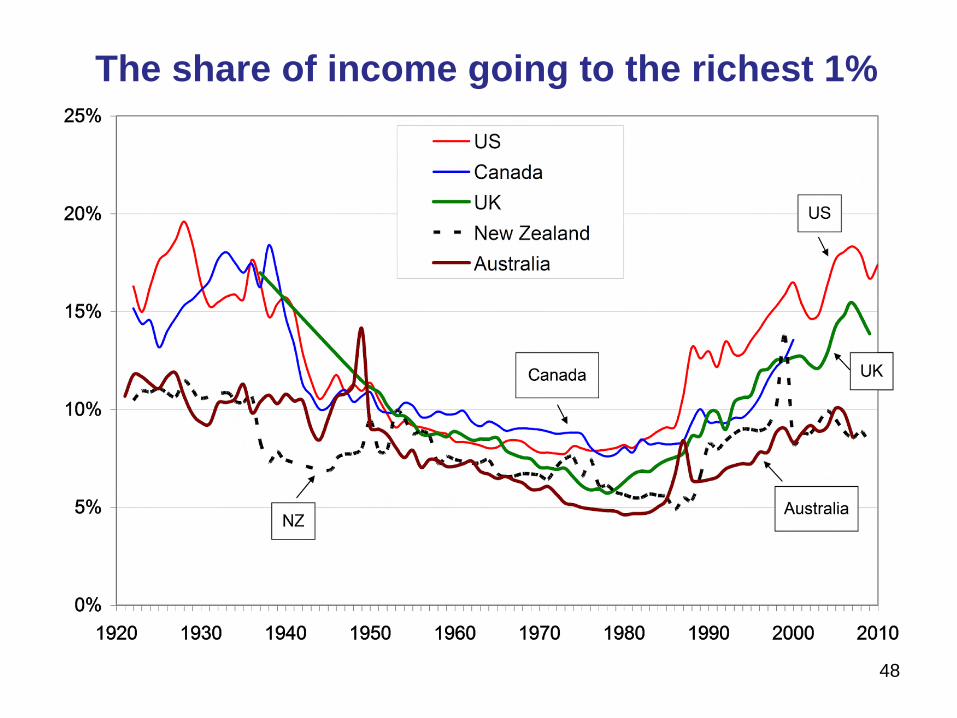
The share of income going to the richest 1%
48
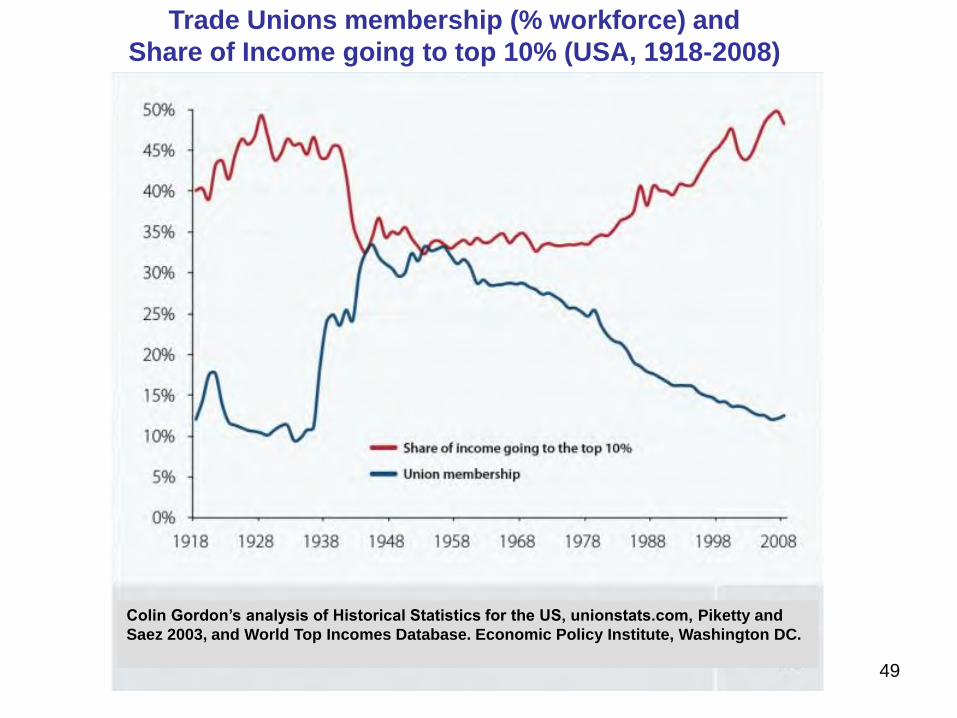
Colin Gordon’s analysis of Historical Statistics for the US, unionstats.com, Piketty and
Saez 2003, and World Top Incomes Database. Economic Policy Institute, Washington DC.
Trade Unions membership (% workforce) and
Share of Income going to top 10% (USA, 1918-2008)
49

http://www.fabians.
org.uk/publications
/a-convenient-
truth/

51
http://www.equalitytrust.org.uk
For more information:
… a book
and a
website…

The growing income share of the richest 1%
Belfield et al, Living Standards, Poverty & Inequality.
Institute of Fiscal Studies, 2015

Mishel L, Sabadish N. Economic Policy Institute Brief #331. Washington, May 2012
Changing ratio of CEO pay to average pay of production &
non-supervisory workers in top 350 US companies
Between 1979-2007 the income of the:-
Top 0.1% increased by 362%
Top 1% increased by 156%
Bottom 90% increased by17%

Literacy Scores of 16-25 year olds by
Parents' Education
-1.5
-1
-0.5
0
0.5
1
2 3 4 5 6 7 8 9 10 11 12 13 14 15 16 17
Parents' Education (years)
Lit
era
cy s
co
re
Sweden
Canada
United States
Source: Willms JD. 1997. Data from OECD Programme for International Student Assessment.

0
5
10
15
Single
mothers
Low HighFather's occupational class
Infa
nt
death
s p
er
1000 England & Wales
Sweden
Leon, D. A., D. Vagero, et al. (1992). "Social class differences in infant mortality
in Sweden: comparison with England and Wales." Brit Med J 305(6855): 687-91.
The benefits of greater equality are not confined
to the poor but extend to all social classes
Infant mortality by class: Sweden compared with England & Wales

More children (10-17yrs) are overweight
in more unequal US states
Wilkinson and Pickett, 2009
Perc
en
t of
child
ren
overw
eig
ht

57
The effects of inequality probably
involve two stages:
• First come the adult experience of social
relations in a more unequal society
• Then parenting styles serve to pass on the
adult experience of adversity to children –
(sometimes involving epigenetic changes)

Australia
Austria
Belgium Canada
Denmark
Finland
France
Germany
Greece
Ireland
Israel
Italy
Japan
Netherlands
New Zealand
Norway
Portugal
Spain
Sweden
UK
USA
Worse
Better
UN
ICE
F in
de
x o
f child
well-
bein
g
0 10 20 30Lone parents as % of all households with dependent children
Single parents and child wellbeing
Source: Wilkinson RG, Pickett KE, 2009.

A woman, her mother and two sisters all
received 12-month suspended sentences for
goading her toddlers to fight each other.
A video of the toddlers fighting was found by their father on
leave from the army.
The video showed the women laughing as the children hit
each other. The boy, aged two, is seen crying after being
punched in the face by his three-year-old sister and is told
by one of the four women in the room "not to be a wimp or a
faggot" and to hit the girl back after she struck him.
When interviewed by police, the toddler’s grandmother said:
"I didn't see any harm in toughening them up - I done the
same with my own children."

Child maltreatment is more common in
more unequal counties of the USA
(controlling for child poverty, demographic and economic factors)
Eckenrode J, Smith EG, McCarthy ME, Dineen M.
Income inequality and child maltreatment in the United States.
Pediatrics 133, 454-461, 2014.

Child conflict & Inequality: rich countries11, 13 & 15 yr olds fighting, bullying, peers not kind & helpful
Pickett & Wilkinson, BMJ 2007
Data from WHO, Health Behaviour in School-age Children study, 2001.
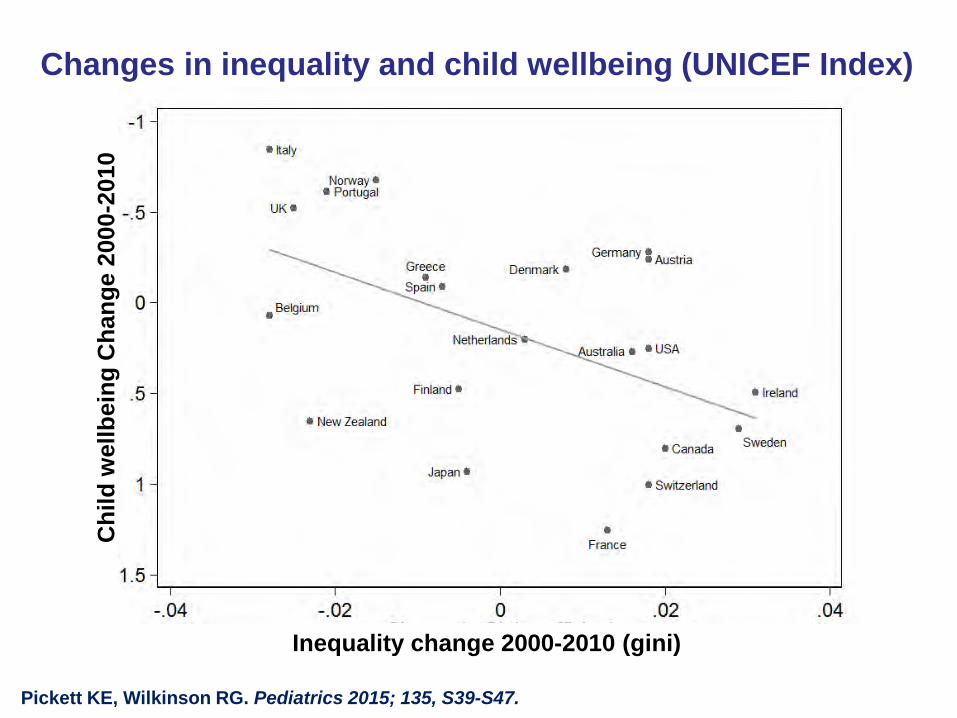
Inequality change 2000-2010 (gini)
Ch
ild
wellb
ein
g C
han
ge 2
000
-2010
Changes in inequality and child wellbeing (UNICEF Index)
Pickett KE, Wilkinson RG. Pediatrics 2015; 135, S39-S47.
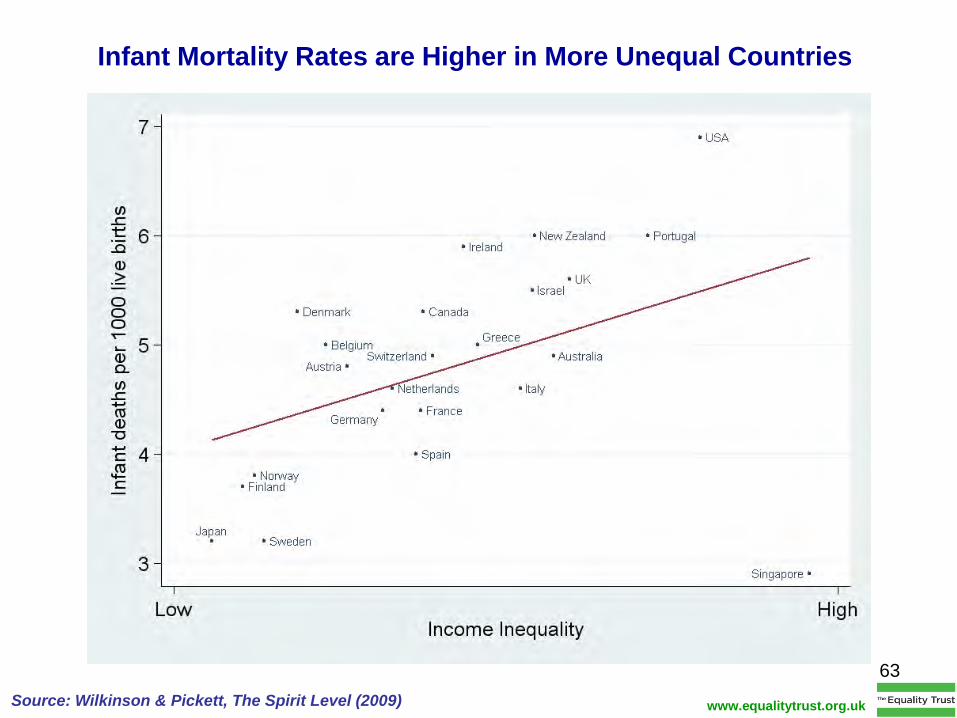
63
Infant Mortality Rates are Higher in More Unequal Countries
Source: Wilkinson & Pickett, The Spirit Level (2009) www.equalitytrust.org.uk

www.equalitytrust.org.ukWilkinson & Pickett, The Spirit Level
Social mobility is lower in more unequal countries