The Platypi Present: Coca-Cola
The Platypi Present: Coca-Cola

BackgroundBackgroundFounded in 1886 by Dr. John Smith Pemberton Developed a syrup that was sampled by his customers at the local pharmacyCustomers loved it, so it was placed on sale for five cents a glassLater combined with carbonated water to produce what we now know as sodaSince grown into the largest beverage manufacturer in the world
Founded in 1886 by Dr. John Smith Pemberton Developed a syrup that was sampled by his customers at the local pharmacyCustomers loved it, so it was placed on sale for five cents a glassLater combined with carbonated water to produce what we now know as sodaSince grown into the largest beverage manufacturer in the world

(7) Coca Cola has an ROE of 31.7% and P/E Ratio of 29.34, which are higher than our major competitor—Pepsi.
Coca Cola Pepsi
(7) Coca Cola has an ROE of 31.7% and P/E Ratio of 29.34, which are higher than our major competitor—Pepsi.
Coca Cola PepsiReturn on Equity 31.7%Return on Invested Capital 28.1%Gross Profit Margin 69.3%Pre-Tax Profit Margin 28.0%Post-Tax Profit Margin20.8%Net Profit Margin 20.8%Debt/Equity Ratio 0.13
Return on Equity 31.7%Return on Invested Capital 28.1%Gross Profit Margin 69.3%Pre-Tax Profit Margin 28.0%Post-Tax Profit Margin20.8%Net Profit Margin 20.8%Debt/Equity Ratio 0.13
Return on Equity 30.9%Return on Invested Capital 25.9%Gross Profit Margin 59.6%Pre-Tax Profit Margin 18.3%Post-Tax Profit Margin13.9%Net Profit Margin 14.0%Debt/Equity Ratio 0.19
Return on Equity 30.9%Return on Invested Capital 25.9%Gross Profit Margin 59.6%Pre-Tax Profit Margin 18.3%Post-Tax Profit Margin13.9%Net Profit Margin 14.0%Debt/Equity Ratio 0.19

(3) Recently, Coca Cola is not in highly risk situation, because the net income, pre-tax
income and sales have been increasing, while cost of goods sold is not really increasing. Coca
Cola still has concerns about the major competitors in the soft drink industry, while they
try to gain more sales and market share.

CocaCola CocaCola 20062006 20052005 20032003 20022002 20012001
Current= Current Current= Current Assests/Current Liabilities Assests/Current Liabilities
1.44 1.44 1.19 1.19 1.49 1.49 1.10 1.10 0.73 0.73
Liquidity: Coca-Cola’s liquidity has been rising. Currently it’s current ratio tells us Coke has enough liquidity to cover it’s current liabilities. This number is well in line with the industry average of 1.8.
Liquidity: Coca-Cola’s liquidity has been rising. Currently it’s current ratio tells us Coke has enough liquidity to cover it’s current liabilities. This number is well in line with the industry average of 1.8.

CocaCola CocaCola 20062006 20052005 20032003 20022002 20012001
Total Asset turnover= net Total Asset turnover= net sales/average total assets sales/average total assets
1.03 1.03 0.96 0.96 0.90 0.90 0.92 0.92 0.96 0.96
Asset Management: Coke turned over it’s assets 1.03 times in 2006. This is above the industry average of .81, which is positive for Coke.
Asset Management: Coke turned over it’s assets 1.03 times in 2006. This is above the industry average of .81, which is positive for Coke.

CocaCola CocaCola 20062006 20052005 20032003 20022002 20012001
Times Interest Times Interest earned=EBIT/interest earned=EBIT/interest
2.05 2.05 1.92 1.92 1.99 1.99 1.90 1.90 1.26 1.26
Debt Management: Coca-Cola’s times interest earned of 2.05 is in line with the industry average. Their debt management is good.
Debt Management: Coca-Cola’s times interest earned of 2.05 is in line with the industry average. Their debt management is good.

CocaCola CocaCola 20062006 20052005 20032003 20022002 20012001
Net Profit Margin on Net Profit Margin on Sales=net income/sales Sales=net income/sales
1.66%1.66% 1.74%1.74% 2.54%2.54% 1.83%1.83% 0.93%0.93%
Return on equity=net Return on equity=net income/stock holder's equity income/stock holder's equity
30.55%30.55% 33.90%33.90% 58.51%58.51% 69.44%69.44% 55.44%55.44%
Equity multiplier=total Equity multiplier=total assets/equity assets/equity
17.86 17.86 20.39 20.39 25.73 25.73 41.18 41.18 62.32 62.32
Return on assets=net Return on assets=net Income/average assets Income/average assets
1.73%1.73% 1.64%1.64% 2.27%2.27% 1.89%1.89% 0.89%0.89%
Profitability: Coca-cola’s profitability is very good for it’s industry. Their profit margin is higher than the industry average. Coke’s return on equity is nearly equal to the industry average of 30.98. Their equity multiplier is high, and their return on assets is also higher than the industry.
Profitability: Coca-cola’s profitability is very good for it’s industry. Their profit margin is higher than the industry average. Coke’s return on equity is nearly equal to the industry average of 30.98. Their equity multiplier is high, and their return on assets is also higher than the industry.

DuPont DuPont 20062006 20052005 20032003 20022002 20012001
(Net Income/Sales) (Net Income/Sales) 1.66%1.66% 1.74%1.74% 2.54%2.54% 1.83%1.83% 0.93%0.93%
(Sales/Total Asset) (Sales/Total Asset) 1.03 1.03 0.96 0.96 0.90 0.90 0.92 0.92 0.96 0.96
(Total Asset/Common (Total Asset/Common Equity) Equity)
17.86 17.86 20.39 20.39 25.73 25.73 41.18 41.18 62.32 62.32
ROE= ROE= 30.55%30.55% 33.90%33.90% 58.51%58.51% 69.44%69.44% 55.44%55.44%
In the past 5 years, Coca Cola’s ROE is higher than Pepsi. The trend of Coca Cola’s ROE is declining from 2002. And our major competitor’s ROE is going very constant and flat.
In the past 5 years, Coca Cola’s ROE is higher than Pepsi. The trend of Coca Cola’s ROE is declining from 2002. And our major competitor’s ROE is going very constant and flat.

Pepsi ROE
20052005 20042004 20032003 20022002
Net IncomeNet Income 4,0784,078 4,2124,212 3,5683,568 3,3133,313
Common EquityCommon Equity 14,32014,320 13,57213,572 11,83311,833 9,2989,298
ROEROE 28.48%28.48% 31.03%31.03% 30.15%30.15% 35.63%35.63%
Coca Cola ROECoca Cola ROE
Net IncomeNet Income 22.95 22.95 21.85 21.85 30.70 30.70 22.82 22.82
ROEROE 30.55%30.55% 33.90%33.90% 58.51%58.51% 69.44%69.44%
0 . 0 0 %
1 0 . 0 0 %
2 0 . 0 0 %
3 0 . 0 0 %
4 0 . 0 0 %
5 0 . 0 0 %
6 0 . 0 0 %
7 0 . 0 0 %
8 0 . 0 0 %
1 2 3 4 5
P e p s i
C o c a C o l a
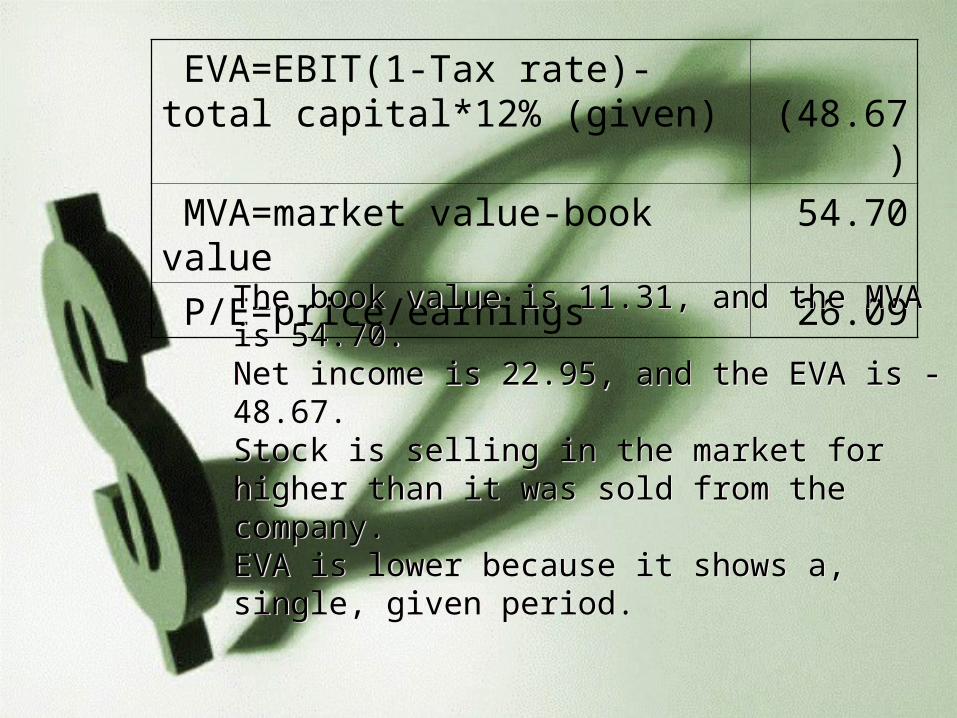
EVA=EBIT(1-Tax rate)-total capital*12% (given)
(48.67
)
MVA=market value-book value 54.70
P/E=price/earnings 26.09 The book value is 11.31, and the MVA is 54.70.Net income is 22.95, and the EVA is -48.67.Stock is selling in the market for higher than it was sold from the company.EVA is lower because it shows a, single, given period.
The book value is 11.31, and the MVA is 54.70.Net income is 22.95, and the EVA is -48.67.Stock is selling in the market for higher than it was sold from the company.EVA is lower because it shows a, single, given period.

Tax RateTax Rate 36.87%36.87%
FCF 2006FCF 2006 38.138.1
Debt to Assets RatioDebt to Assets Ratio 57.90%57.90%
NOWC 2006NOWC 2006 132.87132.87
NOPAT 2006NOPAT 2006 52.7352.73

Free Cash Flow vs. Net Income
Free Cash Flow vs. Net Income
20062006 20052005 20042004 20022002
Free Free Cash Cash FlowsFlows
38.138.100
70.170.111
40.240.211
--12.8512.85
Net Net IncomIncomee
22.922.955
21.821.855
30.730.700
22.8222.82

Area to improveArea to improve
Lower long term debtLower long term debt
Areas of concernAreas of concernHigh long term debt
Overall, no major concernsHigh long term debt
Overall, no major concerns