Glasgow Theses Service http://theses.gla.ac.uk/
Adebiyi, Adekunle Olalekan (2014) The nutritional value for poultry and pigs of biofuel co-products. PhD thesis’ http://theses.gla.ac.uk/5432/ Copyright and moral rights for this thesis are retained by the author A copy can be downloaded for personal non-commercial research or study, without prior permission or charge This thesis cannot be reproduced or quoted extensively from without first obtaining permission in writing from the Author The content must not be changed in any way or sold commercially in any format or medium without the formal permission of the Author When referring to this work, full bibliographic details including the author, title, awarding institution and date of the thesis must be given
THE NUTRITIONAL VALUE FOR POULTRY AND PIGS OF
BIOFUEL CO-PRODUCTS
ADEKUNLE OLALEKAN ADEBIYI
B.Agric, MSc
A thesis submitted to the College of Medical, Veterinary and Life Sciences,
University of Glasgow for the degree of Doctor of Philosophy
April 2014
2
ABSTRACT
A total of five studies were conducted to determine the nutritional value of co-products of
bioethanol production for poultry and pigs.
The objective in the first study was to evaluate the relationship between the chemical
components of maize- and wheat distillers dried grains with solubles (DDGS) as well as
develop prediction equations for indispensable amino acids (IAA), total indispensable amino
acid (TIAA) and total amino acid (TAA) contents using nutrient composition data available in
literature. The relationship between the chemical constituents of maize- and wheat-DDGS and
associated probability values were determined by correlation analysis. Prediction models for
determining the IAA, TIAA and TAA contents of maize- and wheat-DDGS from their crude
protein (CP) and amino acids (AA) contents were developed using step-wise multiple
regression analyses. Maximum improvement in adjusted r2
(adj r2) and reduction in Mallows
Cp were the model selection criteria. The chemical composition of maize- and wheat-DDGS
varied among sources with coefficient of variation (CV) ranging from 8.5% to 53.5% for total
P and Ca respectively in maize-DDGS and 10.5% to 36.1% for CP and acid detergent fibre
(ADF) in wheat-DDGS respectively. Of the IAA, Lys, Met and Trp were most variable in
maize-DDGS with CV of 13.1%, 12.0%, 10.3%, respectively, whereas Lys, Phe and Met
were the most variable IAA in wheat-DDGS with CV of 20.2%, 17.3%, and 16.9%,
respectively. For maize-DDGS, there were positive correlations (P < 0.05) between CP and
CF, NDF, Ca, ash (r ranged from 0.45 and 0.61). Adjusted r2
ranged from 0.57 to 0.99 in the
best models for predicting the IAA in maize- and wheat-DDGS from CP and AA. Except for
Trp and Lys, the IAA contents of maize- and wheat-DDGS can be predicted from their CP
content alone. The best models for predicting TIAA and TAA in maize-DDGS included Arg,
His and Leu (adj r2= 0.98) and His, Leu and Trp (adj r
2= 0.90) respectively, the regression
equations being TIAA (% DM) = 0.77 + 1.36 (Arg) + 3.87 (His) + 1.99 (Val) and TAA = -
3.03 + 14.1 (His) + 3.79 (Leu) + 23.4 (Trp) respectively. For wheat-DDGS, the best three
variables for predicting TIAA were Arg, Leu and Val (adj r2=0.99), the regression equation
being TIAA (% DM) = -0.07 + 1.11 (Arg) + 0.99 (Leu) + 5.02 (Val). Predicted values were
close to actual values in the prediction models for IAA, TIAA and TAA. It was concluded
that the IAA, TIAA and TAA contents of both maize- and wheat-DDGS can be predicted
from their CP contents with high accuracy.
In the second study, the nutritional value of wheat-DDGS without- or with exogenous
enzymes for broiler was determined using three experiments. The N-corrected- and apparent
metabolisable energy contents (AMEn and AME, respectively) without- or with added
3
admixture of xylanase, amylase and protease (XAP) was determined in experiment 1, true P
digestibility without- or with supplemental phytase was determined in experiment 2, whereas
the apparent- or standardised ileal digestibility (AID and SID, respectively) of AA without- or
with added protease was determined in experiment 3. Birds were fed a nutrient adequate pre-
experimental diet from d 1 to 14 post-hatch followed by the dietary treatments from d 14 to
21 in experiment 1 and 2, or from d 25 to 28 in experiment 3, respectively. Each of the 3
experiments was arranged as a randomised complete block design consisting of 7 replicate
pens and 3 birds per pen. Six dietary treatments consisting of 3 levels of wheat-DDGS (0, 300
or 600 g/kg of diet) and 2 levels of XAP (0 or 0.25 g/kg) were used in experiment 1. Six diets
consisting of 3 levels of wheat-DDGS (200, 400 or 600 g/kg of diet) and 2 levels of phytase
(0 or 1000 FTU/kg) were used in experiment 2, whereas four treatments consisting of a
nitrogen-free diet (NFD) and an assay diet, both diets without- or with supplemental protease
were used in experiment 3. In experiment 1, increasing the level of wheat-DDGS in the basal
diet decreased linearly (P < 0.001) dry matter (DM) and energy retention, AME and AMEn.
Supplemental XAP tended to improve both the dietary AME (P = 0.059) and AMEn (P =
0.085) values of the diet. The AME value of wheat-DDGS without- or with supplemental
XAP was determined to be 15.0 or 15.5 MJ/kg, respectively. Corresponding values for AMEn
were 14.0 and 14.5 MJ/kg, respectively. Supplemental XAP did not improve the energy value
of wheat-DDGS for broilers. In experiment 2, increasing the level of wheat-DDGS in the diet
decreased linearly (P < 0.05) ileal DM digestibility, DM retention and apparent P retention
but there was no difference in apparent ileal P digestibility. Except for Fe and Zn at the ileal,
and Mn and Zn at the total tract level, increasing the level of wheat-DDGS in the diet
increased linearly (P < 0.05) the flow of all other minerals. Flow of minerals at the ileal and
total tract level were not different with phytase supplementation. True ileal P digestibility in
the wheat-DDGS for broilers was 93.6 or 96% without- or with added phytase, respectively.
Corresponding values at the total tract level were 92.4 and 93.5%, respectively. Phytase
addition did not improve P utilisation at the ileal or total tract level. In experiment 3, AID
ranged from 33% (Asp) to 75% (Pro) without added protease whereas the range was 31%
(Asp) to 82% (Pro) with protease supplementation. The AID of Lys was nil regardless of
protease supplementation. Supplemental protease improved (P < 0.05) the AID of Arg and
Pro and tended to improve (P < 0.10) the AID of Met. Without protease supplementation, SID
ranged from 43% (Asp) to 84% (Pro) whereas the range was from 54% (Asp) to 93% (Pro)
with added protease. Supplemental protease improved (P < 0.05) the SID of Arg, Leu, Phe,
Met, Val and Pro by 21, 14, 13, 26, 13 and 10 percentage points, respectively. It was
concluded that wheat-DDGS is a good dietary source of metabolisable energy and P for
4
broilers. The ileal AA digestibility of wheat-DDGS for broilers is quite variable and generally
low. Further, the ileal digestibility of some AA in the wheat-DDGS improved with protease
supplementation.
Using three experiments the third study determined the metabolisable energy content, true P
digestibility and retention and AIAAD and SIAAD of wheat-DDGS for turkey. The AMEn
and AME content of wheat-DDGS without- or with XAP was determined in experiment 1, the
true P digestibility and retention without- or with supplemental phytase was determined in
experiment 2, whereas the AIAAD and SIAAD of wheat-DDGS without- or with a protease
were determined in experiment 3. Experiment 1 and 2 lasted for 21 days whereas experiment
3 lasted for 28 days. Experimental diets were fed for 7, 5 or 3 d in experiment 1, 2 or 3,
respectively. Each of the 3 experiments was arranged as a randomised complete block design
consisting of 7 replicate pens and 3 birds per pen. Six dietary treatments consisting of 3 levels
of wheat-DDGS (0, 300 or 600 g/kg of diet) and 2 levels of XAP (0 or 0.25 g/kg) were used
in experiment 1. Six diets consisting of 3 levels of wheat-DDGS (200, 400 or 600 g/kg of
diet) and 2 levels of phytase (0 or 1000 FTU/kg) were used in experiment 2, whereas four
diets consisting of a NFD and an assay diet, both diets without- or with supplemental protease
were used in experiment 3. In experiment 1, increasing the dietary inclusion of wheat-DDGS
from 0 to 600 g/kg decreased linearly (P < 0.05) DM and energy retention. There was wheat-
DDGS × XAP interaction (P < 0.05) for dietary AME and AMEn. Dietary AME and AMEn
values decreased linearly (P < 0.001) as the level of wheat-DDGS increased in the diets
without XAP, whereas there was no effect of increasing wheat-DDGS level on dietary AME
or AMEn for the XAP-supplemented diets. From the regression of wheat-DDGS-associated
energy intake (MJ) against wheat-DDGS intake (kg), the AME values (MJ/kg of DM) of
wheat-DDGS without- or with supplemental XAP were determined to be 14 or 14.9,
respectively. Corresponding AMEn values (MJ/kg of DM) were 13 and 13.8, respectively.
Supplemental XAP did not improve the energy value of wheat-DDGS for turkey. In
experiment 2, increasing the dietary inclusion level of wheat-DDGS decreased linearly (P <
0.05) DM intake, ileal DM digestibility and DM retention. Apparent ileal P digestibility and
apparent P retention were not affected by either wheat-DDGS inclusion level or phytase
supplementation. Except for Mn and Zn, flow of minerals at either the ileal or total tract level
increased linearly (P < 0.05) with graded levels of wheat-DDGS in the diet. Flow of minerals
(Cu, Fe, Mg, Mn, K, Na, Zn) at the ileal or total tract level (mg/kg of DM intake) were not
different with phytase supplementation. True ileal P digestibility was determined to be 75.8%
or 82.1% for wheat-DDGS without- or with supplemental phytase, respectively. Respective
values at the total tract were 70.7% and 81.6%. In experiment 3, the ileal digestibility of Lys
5
was zero regardless of protease supplementation. Apparent ileal digestibility was lower than
50% for all AA except for Glu (70%) and Pro (81%) in the wheat-DDGS without
supplemental protease. Also, SIAAD ranged from 41% (Thr) to 89% (Pro) without added
protease whereas the range was from 56% (Arg) to 88% (Pro) with added protease. With the
exception of Cys and Pro, supplemental protease increased (P < 0.05) the AIAAD and
SIAAD of all other AA from between 5 to 19 percentage points. It was concluded that wheat-
DDGS is a good source of metabolisable energy and P for turkey. The ileal digestibility of
AA in wheat-DDGS is generally low. In addition, supplemental protease improved the ileal
digestibility of majority of the AA in the wheat-DDGS for turkey.
The metabolisable energy, digestible AA and P values of wheat-DDGS determined and
reported in the second study were used in a fourth study to formulate diets for broilers. These
diets were used to determine the effect of XAP or phytase added individually or in
combination on growth performance, jejunal morphology, intestinal pH and caecal volatile
fatty acids (VFA) production in broilers receiving a wheat-SBM based diet containing wheat-
DDGS. Two hundred and eighty-eight 1-d old broiler chicks were allocated to eight dietary
treatments in a randomized complete block design consisting of 6 replicate pens and 6 birds
per pen. The treatments were 1) a positive control (PC1); wheat-soyabean meal (wheat-SBM)
diet and adequate in metabolisable energy (ME) and all nutrients, 2) a second positive control
(PC2); wheat-SBM based diet containing wheat-DDGS and adequate in ME and all nutrients;
3) a negative control (NC1) marginal in ME (minus 0.63 MJ/kg), 4) NC1 plus XAP added to
provide per kg of diet, 2000, 200 and 4000 U of xylanase, amylase and protease, respectively
5) a negative control (NC2) marginal in available P (minus 0.15%) 6) NC2 plus phytase
added to provide 1000 FTU per kg of diet, 7) a negative control (NC3) that is low in ME and
available P (minus 0.63 MJ/kg and 0.15%, respectively), 8) NC3 plus a combination of XAP
and phytase at the rates in diets 4 and 6, respectively. Wheat-DDGS was included in the diet
at the rate of 12, 22 or 25% at the starter (d 1 to 10), grower (d 11 to 24) or finisher (d 25 to
42) phases. Reducing the ME and non-phytate P in the NC diets depressed (P < 0.05)
bodyweight gain (BWG), final bodyweight (FBW) and gain:feed (G:F) compared with the PC
diets. From d 1 to 24, birds receiving the PC diet containing wheat-DDGS were heavier and
consumed more (P < 0.01) compared with birds receiving the PC diet containing no wheat-
DDGS. An admixture of XAP improved (P ≤ 0.05) BWG and G:F above the NC1 diet from d
1 to 24 whereas supplemental phytase had no effect on growth performance. From d 25 to 42,
BWG and FBW did not differ between the birds receiving the PC1 and PC2 diets, but G:F
was superior (P < 0.01) for birds receiving the PC1 diet. From d 1 to 42, addition of XAP
improved (P < 0.05) G:F and tended to improve (P < 0.10) BWG above the NC diet. Further,
6
performance responses did not differ between birds receiving the PC2 and XAP diet.
Inclusion of wheat-DDGS in the diet reduced (P < 0.05) digesta pH at the caeca, but pH did
not differ among treatments at the duodenum. Volatile fatty acids production in the caeca was
not affected by either XAP or phytase supplementation, but wheat-DDGS reduced (P < 0.05)
the production of n-butyric acid. Jejunal villi height was not different among the dietary
treatments but XAP increased crypt depth. In conclusion, the addition of an admixture of
XAP to a wheat-SBM based diet containing wheat-DDGS produced modest improvements in
the growth performance of broilers whereas phytase had no effect.
There is substantial data about the nutritional value of maize- and wheat-DDGS for pigs but
there is no information about the effect of dietary fibre type on nutrient digestibility due to
differences in the chemical characteristics of the protein feedstuff used. The fifth study
determined the effect of dietary fibre type and protein level on ileal amino acids digestibility
for growing pigs. Twenty boars (Yorkshire × Landrace) with average initial bodyweight of 35
kg and fitted with a simple T-cannula at the terminal ileum were used in the current study.
The dietary treatments were three fibre types (SBM, canola meal (CM) or maize-DDGS) and
two levels of CP (adequate (18%) or reduced (14%)). In each period, two pigs with
bodyweights closest to the mean bodyweight of the twenty pigs were offered a nitrogen free
diet to determine basal endogenous ileal amino acid flow. The remaining eighteen pigs were
allocated to the experimental diets using a replicated 6 × 2 Youden square design. Ileal
digesta was collected for two days in each period after five days of adaptation to the diet. In
comparison, AIAAD for the SBM diet were greater (P < 0.05) compared with the CM diet
except for Met, Trp, Cys and Pro. Apparent ileal digestibility of DM, Gly and Asp were
greater (P < 0.05) for the SBM diet compared with the maize-DDGS diet. The AID of the
following AA were greater in the maize-DDGS diet compared with the CM diet: Ile, Leu,
Phe, Val, Ala, Tyr and Asp. There was fibre type × protein level interaction (P < 0.05) for the
AID of Lys because in the CP-adequate diets, the AID of Lys differed (P < 0.05) amongst the
dietary fibre sources, whereas the AID of Lys was not different in low-CP diets. The SIAAD
of the SBM diet was greater (P < 0.05) than those of the CM diet for all AA except for Trp
and Pro, whereas Gly and Asp were more digestible (P < 0.05) in the SBM diet compared
with the maize-DDGS diet. Standardised ileal digestibility of the following AA was greater in
the maize-DDGS diet compared with the CM diet: Ile, Leu, Val, Ala, Tyr and Asp. Reducing
dietary protein level by 4% did not affect DM utilisation or the AID or SID of N and AA in
the current study. It was concluded that the choice of protein feed ingredient used in swine
diets in relation to the fibre composition affects ileal amino acids digestibility. Furthermore,
7
AA digestibility is not affected by a 4% reduction in dietary crude protein level for growing
pigs.
Collectively, it was concluded from these experiments that mathematical models are a useful
tool to predict the amino acids content of maize- and wheat-DDGS. The ME in wheat-DDGS
was comparable to those of wheat and maize grain for broilers and turkey, therefore, wheat-
DDGS may be used as a substitute for wheat or maize in diets for broiler and turkey. The
digestible P content in wheat-DDGS for broilers and turkey is greater than in most other
major feedstuffs. The use of wheat-DDGS in poultry diet may therefore reduce the quantity of
inorganic P compounds used, reduce P loss in manure and overall may reduce feed cost. Ileal
AA digestibility in the wheat-DDGS for broilers and turkey was variable and generally low. It
was recommended that the low digestibility of essential AA in wheat-DDGS should be
accounted for when using wheat-DDGS as a feedstuff for poultry. Although maize-DDGS
contain greater levels of fibre, ileal AA digestibility are similar to that of SBM for pigs but
CM was inferior to the other two protein sources. The differences in fibre characteristics of
protein feedstuffs affects ileal AA digestibility.
8
Table of Contents
Abstract 2
Table of Contents 8
List of Tables 13
List of Figures 18
Publications 19
Awards 20
Dedication 21
Acknowledgements 22
Authors Declaration 23
Lists of Abbreviations 24
CHAPTER 1 - LITERATURE REVIEW
1.1 Introduction 28
1.2 Effect of Processing on DDGS Quality 30
1.3 Physical Characteristics of DDGS 31
1.3.1 Colour 31
1.4 Chemical Characteristics of DDGS 32
1.4.1 Energy Value 32
1.4.2 Crude Protein and Amino Acid Composition 32
1.4.3 Mineral Composition: Phosphorus and Other Minerals 34
1.4.4 Non-Starch Polysaccharides 36
1.5 Biological Characteristics of DDGS 36
1.6 Use of DDGS in Poultry Diets and Effect on Bird Performance 37
1.6.1 Effect on Growth Performance 37
9
1.6.2 Effect on Egg Production and Quality 40
1.6.3 Effect on Carcass Characteristics and Meat Quality 42
1.7 Nutrient Digestibility of DDGS for Poultry 43
1.7.1 Metabolisable Energy 43
1.7.2 Amino Acid Digestibility 44
1.7.3 Nutrient Retention and Excretion 46
1.8 Dietary Fibre Type and Crude Protein Level 47
1.9 Improving DDGS Nutritional Quality 48
1.9.1 Exogenous Enzymes in Poultry Diets and Potential Value for DDGS 48
1.9.1.1 Carbohydrases 49
1.9.1.2 Phytases 51
1.9.1.3 Proteases 53
1.9.1.4 Enzyme Combinations 53
1.9.1.5 Effect of Diet and Exogenous Enzymes on Gut Morphology 54
1.9.2 Fractionation 54
1.10 Knowledge Gaps 55
1.11 Study Objectives 56
CHAPTER 2 - CHEMICAL COMPOSITIONS AND PREDICTION OF AMINO
ACID CONTENT OF MAIZE- AND WHEAT DISTILLER’S DRIED GRAINS WITH
SOLUBLES
2.1 INTRODUCTION 58
2.2 MATERIALS AND METHODS 59
2.2.1 Data Collection and Statistical Analyses 59
2.3 RESULTS 60
2.4 DISCUSSION 76
10
CHAPTER 3 - METABOLISABLE ENERGY CONTENT AND STANDARDISED
OR TRUE DIGESTIBILITY OF AMINO ACIDS AND PHOSPHORUS OF WHEAT
DISTILLERS’ DRIED GRAINS WITH SOLUBLES WITHOUT- OR WITH
EXOGENOUS ENZYMES FOR BROILERS
3.1 INTRODUCTION 82
3.2 MATERIALS AND METHODS 83
3.2.1 Animals and Management 83
3.2.2 Dietary Treatments and Sample Collection 84
3.2.3 Chemical Analysis 90
3.2.4 Calculations and Statistical Analysis 94
3.3 RESULTS 97
3.3.1 Metabolisable Energy Value of Wheat Distillers Dried Grains with Solubles
without- or with an Admixture of Xylanase, Amylase and Protease for Broilers 97
3.3.2 True Phosphorus Digestibility of Wheat Distillers Dried Grains with Solubles
without- or with Supplemental Phytase for Broilers 103
3.3.3 Apparent- and Standardised Ileal Amino Acids Digestibility of Wheat
Distillers Dried Grains with Solubles without- or with Protease for Broilers 109
3.4 DISCUSSION 111
CHAPTER 4 - METABOLISABLE ENERGY CONTENT, TRUE PHOSPHORUS
DIGESTIBILITY AND ILEAL DIGESTIBILITY OF AMINO ACIDS OF WHEAT
DISTILLERS’ DRIED GRAINS WITH SOLUBLES WITHOUT OR WITH
EXOGENOUS ENZYMES FOR TURKEY
4.1 INTRODUCTION 122
4.2 MATERIALS AND METHODS 123
4.2.1 Animals and Management 123
4.2.2 Diets and Sample Collection 123
4.2.3 Chemical Analysis 133
11
4.2.4 Calculations and Statistical Analysis 133
4.3 RESULTS 137
4.3.1 Metabolisable energy content of wheat Distillers Dried Grains with Solubles
without- or with an Admixture of Xylanase, Amylase and Protease for Turkey 137
4.3.2 True Phosphorus Digestibility of Wheat Distillers Dried Grains with Solubles
without- or with Supplemental Phytase for Turkey 143
4.3.3 Apparent- and Standardised Ileal Amino Acids Digestibility of Wheat-Distillers
Dried Grains with Solubles without- or with Supplemental Protease for Turkey 147
4.4 DISCUSSION 151
CHAPTER 5 - GROWTH PERFORMANCE AND GASTROINTESTINAL
TRACT CHARACTERISTICS OF BROILERS RECEIVING A DIET
CONTAINING WHEAT DISTILLERS DRIED GRAINS WITH SOLUBLES
SUPPLEMENTED WITH AN ADMIXTURE OF XYLANASE, AMYLASE AND
PROTEASE OR PHYTASE INDIVIDUALLY OR IN COMBINATION
5.1 INTRODUCTION 161
5.2 MATERIALS AND METHODS 162
5.2.1 Animals and Management 162
5.2.2 Dietary Treatments 163
5.2.3 Growth Performance and Gut Profiling 167
5.2.4 Chemical Analysis 167
5.2.5 Statistical Analysis 168
5.3 RESULTS 168
5.3.1 Diets 168
5.3.2 Growth Performance 169
5.3.3 Gastrointestinal Tract Characteristics 174
5.4 DISCUSSION 180
12
CHAPTER 6 - APPARENT- OR STANDARDISED ILEAL AMINO ACID
DIGESTIBILITY RESPONSE TO DIETARY FIBRE TYPE AND CRUDE
PROTEIN LEVEL FOR GROWING PIGS
6.1 INTRODUCTION 187
6.2 MATERIALS AND METHODS 188
6.2.1 Animals and Management 188
6.2.2 Experimental Design, Dietary Treatments and Sample Collection 189
6.2.3 Chemical Analysis 189
6.2.4 Calculations 190
6.2.5 Statistical Analysis 190
6.3 RESULTS 191
6.4 DISCUSSION 198
CHAPTER 7 - GENERAL DISCUSSION, CONCLUSIONS AND
RECOMMENDATIONS
7.1 GENERAL DISCUSSION 204
7.2 CONCLUSIONS AND RECOMMENDATIONS 207
REFERENCES 209
13
List of Tables
Table 2-1. Chemical compositions of maize- and wheat-distillers dried grains
with solubles 61
Table 2-2. Amino acid compositions of maize- and wheat-distillers dried grains
with solubles 62
Table 2-3. Correlation matrices for chemical components in wheat-distillers
dried grains with solubles 63
Table 2-4. Correlation matrix of crude protein and amino acids of maize-
distillers dried grains with solubles 64
Table 2-5. Correlation matrix of crude protein and amino acids of wheat-
distillers dried grains with solubles 65
Table 2-6. Prediction models for the amino acids contents of maize- and
wheat-distillers dried grains with solubles 69
Table 2-7. Best prediction models for indispensable amino acids in maize-
and wheat-distillers dried grains with solubles 70
Table 2-8. Best model subsets for the total indispensable amino acids and
total amino acids of maize- and wheat-distillers dried grains with solubles 71
Table 2-9. Prediction models for total indispensable amino acid and total
amino acids content of maize- and wheat-distillers dried grains with solubles 72
Table 2-10. Predicted- and actual amino acids values for prediction models
developed from the crude protein content of maize- and wheat-distillers
dried grains with solubles 73
Table 2-11. Predicted- and actual amino acids values for prediction models
developed from the crude protein and individual amino acids content of
maize-distillers dried grains with solubles 74
Table 2-12. Predicted- and actual amino acids values for prediction models
developed from the crude protein and individual amino acids content of
wheat-distillers dried grains with solubles 75
Table 3-1. Ingredient and nutrient composition of pre-experimental standard diet 85
Table 3-2. Analysed nutrient composition of wheat distillers’ dried grains with
solubles 86
Table 3-3. Ingredient and analysed nutrient composition of experimental diets
to determine metabolisable energy value of wheat-DDGS for broilers with- or
without added xylanase, amylase and protease 88
14
Table 3-4. Ingredient and chemical composition of experimental diets to
determine phosphorus utilisation of wheat-DDGS for broilers 89
Table 3-5. Ingredient composition of experimental diets to determine ileal amino
acids digestibility of wheat-DDGS for broilers 92
Table 3-6. Analysed chemical composition of experimental diets to determine
ileal amino acids digestibility of wheat-DDGS for broilers 93
Table 3-7. Growth performance of broilers fed graded levels of wheat-DDGS
without or with an admixture of xylanase, amylase and protease 99
Table 3-8. Dry matter and energy utilisation for broilers fed diets containing
graded levels of wheat-DDGS without or with an admixture of xylanase,
amylase and protease 100
Table 3-9. Linear terms showing the apparent metabolisable energy content of
wheat-DDGS without or with added admixture of xylanase, amylase and
protease for broilers 101
Table 3-10. Dry matter and dietary P utilisation by broiler chicks fed graded
levels of wheat-distillers dried grains with solubles without or with a phytase 104
Table 3-11. True phosphorus digestibility determined from regressing ileal or
total tract P output against dietary P intake for broilers fed wheat-DDGS
supplemented without or with phytase 105
Table 3-12. Flow of minerals at the ileal level (mg/kg of DM intake) for
broilers fed graded levels of wheat-DDGS without or with supplemental phytase 107
Table 3-13. Flow of minerals at the total tract (mg/kg of DMI) for chicks fed
graded levels of wheat-DDGS without or with supplemental phytase 108
Table 3-14. Apparent- and standardised ileal amino acids digestibility of
wheat-DDGS without or with supplemental protease for broilers 110
Table 4-1. Ingredient and nutrient composition of pre-experimental standard diet 125
Table 4-2. Analysed nutrient composition of wheat distillers’ dried grains with
solubles 126
Table 4-3. Ingredient and analysed nutrient composition of experimental diets
to determine metabolisable energy value of wheat-DDGS for turkey with- or
without added xylanase, amylase and protease 128
Table 4-4. Ingredient and chemical composition of experimental diets to
determine P utilisation of wheat-DDGS for turkey 129
Table 4-5. Ingredient composition of experimental diets to determine ileal
amino acids digestibility of wheat-DDGS for turkey 131
15
Table 4-6. Analysed chemical composition of treatment diets to determine ileal
amino acids digestibility of wheat-DDGS for turkey 132
Table 4-7. Growth performance responses of turkey fed graded levels of
wheat-DDGS without or with an admixture of xylanase, amylase and protease 139
Table 4-8. Dry matter and energy utilisation for turkey fed diets containing
graded levels of wheat-DDGS without or with an admixture of xylanase,
amylase and protease 140
Table 4-9. Linear terms for the metabolisable energy value of wheat-DDGS
without or with added admixture of xylanase, amylase and protease for
turkey 141
Table 4-10. Dry matter and dietary P utilisation for turkey fed graded levels
of wheat-distillers dried grains with solubles 144
Table 4-11. True P digestibility determined from regressing ileal or total tract
P output against dietary P intake for turkey fed wheat-DDGS supplemented
without or with phytase 145
Table 4-12. Flow of minerals at the ileal level (mg/kg of DM intake)
for turkey fed graded levels of wheat-DDGS without or with supplemental
phytase 148
Table 4-13. Flow of minerals at the total tract (mg/kg of DM intake)
for turkey fed graded levels of wheat-DDGS without or with supplemental
phytase 149
Table 4-14. Apparent- and standardised ileal amino acids digestibility (%) of
wheat-DDGS without or with supplemental protease for turkey 150
Table 5-1. Ingredient and chemical composition (g/kg) of the positive and
negative control diets for the starter period 164
Table 5-2. Ingredient and chemical composition (g/kg) of the positive and
negative control diets for the grower phase 165
Table 5-3. Ingredient and chemical composition (g/kg) of the positive and
negative control diets for the finishing period 166
Table 5-4. Growth performance of broilers receiving a wheat-soyabean meal
based diet containing wheat-distillers dried grains with solubles supplemented
with a enzyme mixture containing xylanase, amylase and protease activities
or phytase alone or a combination of both from 1 to 24 days of age 171
Table 5-5. Growth performance of broilers receiving a wheat-soyabean meal
based diet containing wheat-distillers dried grains with solubles supplemented
16
with a enzyme mixture containing xylanase, amylase and protease activities or
phytase alone or a combination of both from 25 to 42 days of age 172
Table 5-6. Growth performance of broilers receiving a wheat-soyabean meal
based diet containing wheat-distillers dried grains with solubles supplemented
with a enzyme mixture containing xylanase, amylase and protease activities
or phytase alone or a combination of both from 1 to 42 days of age 173
Table 5-7. Digesta pH at the duodenum and caecum of broilers receiving a
wheat-soyabean meal based diet containing wheat-distillers dried grains
with solubles supplemented with a enzyme mixture containing xylanase,
amylase and protease activities or phytase alone or a combination of both 175
Table 5-8. Volatile fatty acids production (mg/kg) at the caecum of broiler
receiving a wheat-soyabean meal based diet containing wheat-distillers dried
grains with solubles supplemented with a enzyme mixture containing xylanase,
amylase and protease activities or phytase alone or a combination of both 176
Table 5-9. Volatile fatty acids production (mg/kg) at the caecum of broiler
receiving a wheat-soyabean meal based diet containing wheat-distillers
dried grains with solubles supplemented with a enzyme mixture containing
xylanase, amylase and protease activities or phytase alone or a combination
of both 177
Table 5-10. Jejunal morphology of broilers receiving receiving a wheat-soyabean
meal based diet containing wheat-distillers dried grains with solubles supplemented
with a enzyme mixture containing xylanase, amylase and protease activities or
phytase alone or a combination of both 178
Table 6-1. Ingredient and chemical composition of experimental diets to determine
the effect of dietary fibre type and crude protein level on apparent- or
standardised ileal amino acids digestibility of growing pigs 193
Table 6-2. Dry matter utilisation and apparent ileal digestibility (%) of nitrogen
and indispensable amino acids for growing pigs in response to dietary fibre
type and crude protein level 194
Table 6-3. Apparent ileal digestibility of total- and dispensable amino acids
for growing pigs in response to dietary fibre type and crude protein level 195
Table 6-4. Standardised ileal digestibility (%) of nitrogen and indispensable
amino acids for growing pigs in response to dietary fibre type and crude
protein level 196
17
Table 6-5. Standardised ileal digestibility (%) of total- and dispensable amino
acids for growing pigs in response to dietary fibre type and crude protein level 197
18
List of Figures
Figure 1-1. The dry-grind process of bioethanol production 29
Figure 3-1. Regression line showing the AME and AMEn values of wheat-
DDGS for broiler 102
Figure 3-2. True phosphorus indigestibility of wheat-DDGS at the ileal and
total tract level for broilers 106
Figure 3-3. An image of the wheat distillers’ dried grains with solubles used
in the current study and a maize distillers’ dried grains with solubles colour score
chart 120
Figure 4-1. Regression line showing the AME or AMEn value of wheat-DDGS
for turkey 142
Figure 4-2. True phosphorus indigestibility of wheat-DDGS at the ileal and total
tract level for turkey 146
Figure 5-1. Micrographs of the jejunal villi height and crypt depth of broilers 179
19
Publications
Peer reviewed journal
Olukosi, O. A. and A. O. Adebiyi. 2013. Chemical composition and prediction of amino acid
content of maize- and wheat-Distillers Dried Grains with Solubles. Animal Feed Science and
Technology 185: 182 – 189.
Popular press
Adebiyi A, O. and O. A. Olukosi. 2014. Apparent and standardised amino acids digestibility
in broilers of Distillers’ Dried Grains with Solubles supplemented with or without exogenous
protease. Feed Compounder. March-April 2014. Pages 36 – 39.
Conference abstracts
Adebiyi, A., D. Ragland, O. Adeola and O. Olukosi. 2014. Apparent and standardized ileal
amino acids digestibility for different protein feedstuffs fed at two dietary protein levels for
growing pigs. ADSA ASAS Joint Annual Meetings, Kansas City, MO, USA.
Adebiyi, A., and O. Olukosi. 2014. Growth performance and gastrointestinal tract
characteristics of broilers receiving a diet containing wheat distillers dried grains with
solubles supplemented with exogenous enzymes. WPSA Annual Spring Meeting, Nottingham.
UK. April 29 – 30, 2014.
Adebiyi, A., and O. Olukosi. 2013. The utilizable energy contents of wheat distillers dried
grains with solubles for turkey without or with supplementation of xylanase, amylase and
protease using regression method. Poultry Science 92 (E-Suppl. 1): 13.
Adebiyi, A., and O. Olukosi. 2013. Apparent and standardized ileal amino acids digestibility
of wheat-distillers dried grains with solubles without or with exogenous protease for broilers
and turkey. Journal of Animal Science 91 (E-Suppl. 2): 410.
Adebiyi, A., A. Amerah, and O. Olukosi. 2013. Determination of the metabolisable energy of
wheat-Distillers Dried Grains with Solubles without or with an admixture of xylanase,
amylase and protease for broiler chickens using the regression method. WPSA (UK branch)
Spring Meeting. Abstract no 096.
Adebiyi, A and O. A. Olukosi. 2012. Chemical composition and prediction of the total amino
acids and total indispensable amino acids contents of maize- and wheat-Distillers' Dried
Grains with Solubles. WPSA (UK branch) Spring Meeting. Abstract no 011.
20
Awards
Alltech Young Scientist 1st place winner for United Kingdom 2014
Alltech Young Scientist 3rd
place winner for Europe/Africa/Middle-East 2014
Jones Hamilton Co (USA) Travel Award 2013
British Poultry Council Research Scholarship 2012
Edgar Pye Research Scholarship 2012
Other
Visiting scholar at Animal Sciences Department, Purdue University (USA) Feb-Jul. 2013
21
Dedication
This thesis is dedicated to my Wife and Son, Oluwatola and Adedunmola Adebiyi; you are
the best. And to mum, Patience Adebiyi; the tuitions you paid made all the difference.
22
Acknowledgements
I will like to thank Dr. Oluyinka Olukosi for his supervision, teaching, understanding,
guidance and support during this project. You have made me a better scientist.
I also like to thank Dr. Peter Hastie for his supervision and support during this project. Your
tutorship was greatly appreciated.
The contributions of Prof. Nick Sparks, Margaret Fagan, Dr. Farina Khattak, Dr. Vicky
Sandilands, Dr. Sarah Broklehurst, Dr. Laura Dixon, Dr. Tom Pennycott, Laurence Baker and
Fraser Whyte are acknowledged. I will also like to thank Derek Brown, Irene Yuill and all
stock workers for their technical support.
I thank Prof. Layi Adeola, Dr. Tayo Adedokun and the Adeola Lab postgraduate students for
making my time at Purdue University a productive one.
The assistance of fellow graduate students; Rita Goncalves, Krysta Morrissey, Laura Beeson
and Jessica Hopkins is greatly appreciated, thank you.
To my wife and son, Oluwatola and Adedunmola, the joy you brought to my life during this
challenging time is priceless.
To my mum, sisters and brother in London, your prayers, encouragement and effort to make
sure myself and family do not feel alone in Scotland is appreciated.
23
Authors Declaration
This thesis has been written by the author and has not been presented in any previous
application for a degree. The studies in this thesis were done by me, and all sources of
information have been acknowledged using appropriate references.
---------------------------------------------
ADEKUNLE OLALEKAN ADEBIYI
July 2014
24
List of Abbreviations
AA: amino acid
ADF: acid detergent fibre
ADL: acid detergent lignin
AID: apparent ileal digestibility
AIAAD: apparent ileal amino acids digestibility
AME: apparent metabolisable energy
AMEn: nitrogen-corrected apparent metabolisable energy
Ala: alanine
Arg: arginine
Asp: aspartic acid
BWG: bodyweight gain
Ca: calcium
CD: crypt depth
CDS: condensed distillers solubles
CF: crude fibre
CM: canola meal
CP: crude protein
Cr: chromium
Cu: copper
CV: coefficient of variance
Cys: cystine
DDGS: distillers dried grains with solubles
DM: dry matter
EAAF: endogenous amino acids flow
EE: ether extract
E-mill: enzymatic milling
EPL: endogenous phosphorus loss
25
FBW: final bodyweight
FCR: feed conversion ratio
Fe: iron
G:F: ratio of gain to feed
GE: gross energy
Glu: glutamic acid
Gly: glycine
His: histidine
HPmaize-DDGS: high-protein maize distillers dried grains with solubles
IAA: indispensable amino acids
Ile: isoleucine
K: potassium
Kcal: kilocalories
Kg: kilograms
Leu: leucine
Lys: lysine
ME: metabolisable energy
Met: methionine
Mg: magnesium
MJ: megajoules
Mn: manganese
N: nitrogen
Na: sodium
NDF: neutral detergent fibre
NFD: nitrogen free diet
NSP: non-starch polysaccharide
P: phosphorus
Phe: phenylalanine
26
Pro: proline
SBM: soyabean meal
Ser: serine
SIAAD: standardised ileal amino acids digestibility
SID: standardised ileal digestibility
TAA: total amino acid
Ti: titanium
TiO2: titanium dioxide
TIAA: total indispensable amino acids
TIAAD: true ileal amino acids digestibility
Thr: threonine
TID: true ileal digestibility
TMEn: nitrogen-corrected true metabolisable energy
Trp: tryptophan
TPI: true phosphorus indigestibility
TPD: true phosphorus digestibility
TPR: true phosphorus retention
Tyr: tyrosine
U: unit
Val: valine
VFA: volatile fatty acids
VH: villi height
WDG: wet distiller’s grains
XAP: mixture of xylanase, amylase and protease
Zn: zinc

27
CHAPTER 1
LITERATURE REVIEW
28
1.1 INTRODUCTION
Biofuels are expected to replace up to 20% of the total gasoline used in the UK by 2020, and
the vast majority of these are expected to be produced from wheat and oilseeds. Bioethanol
production from wheat is currently on the increase in the UK and this industry is expected to
expand rapidly. Bioethanol production from wheat will also result in an increase in the
quantity of wheat Distillers Dried Grains with Solubles (wheat-DDGS) available as a feed
ingredient for poultry and pigs. Although co-products of ethanol production from beverage-
ethanol facilities have been available for decades, they have usually been used for feeding
ruminants. However, with the anticipated increase in its availability, coupled with a high
crude protein (CP) and bioavailable P content (Nyachoti et al., 2005; Thacker and
Widyaratne, 2007), DDGS is a viable feedstuff for poultry and pigs. So far, the preponderance
of published literature (mainly from the USA) has reported the nutritive value of maize-
DDGS. On the other hand, there is very little information about the nutritive value of wheat-
DDGS for poultry, and there is hardly any information for UK-produced wheat-DDGS. In
view of the potential of using wheat-DDGS in poultry diets in the UK, data on its nutritional
value for poultry, especially broilers and turkey is essential. In the case of pigs, the energy
value and nutrient digestibility of maize- and wheat-DDGS has been described by Widyaratne
and Zijlistra (2007) and Stein and Shurson (2009). However, the effects on nutrient
digestibility when common protein sources such as soyabean meal (SBM) or canola meal
(CM) are replaced with biofuel co-products (maize-DDGS) in pig diet are not known and
require investigation.
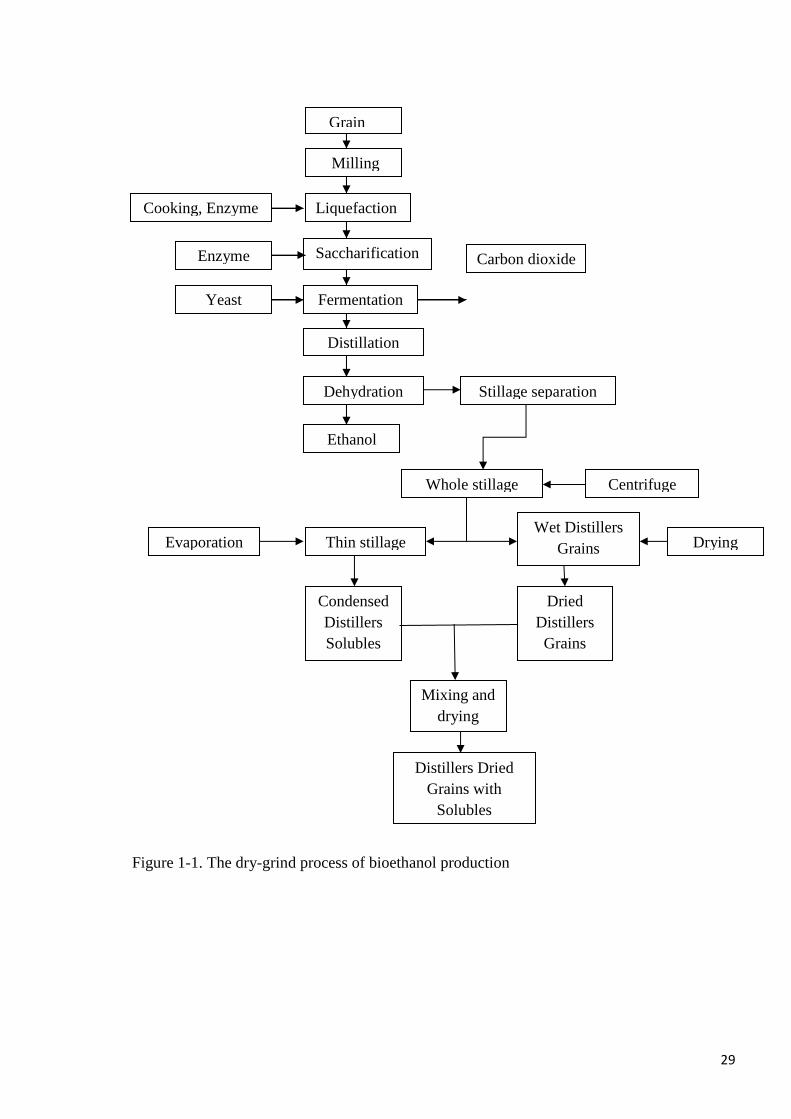
There are two main methods for producing ethanol from cereal grains, namely; dry grind and
wet milling process. The major co-product of ethanol by the dry grind process is DDGS,
whereas gluten meal and gluten feed are the co-products in wet milling. An overview of the
dry-grind process is presented in Figure 1-1. Briefly, the dry-grind process begins with the
milling of the grain, mixing with water and cooking. Alpha-amylase enzymes are added to aid
conversion of starch to sugars such as glucose, maltose and α-limit dextrins; yeast is
employed to convert the resultant sugars to ethanol. Post-fermentation, the grain solid
components (thick stillage) are separated from the liquid by centrifugation or by pressing,
after which the ethanol is removed from the liquid component by distillation. The remaining
liquid, known as condensed distillers soluble (CDS) are often mixed with the thick stillage
also known as wet distillers grains (WDG) and dried to form DDGS. Alternatively, the grains
may be dried without the CDS component as dried distillers grains or the CDS dried without
the grains. During the fermentation process of bioethanol production, the starch fraction of the
29
Figure 1-1. The dry-grind process of bioethanol production
Grain
Milling
Liquefaction
Saccharification
Cooking, Enzyme
Enzyme
Fermentation Yeast
Ethanol
Distillation
Condensed
Distillers
Solubles
Centrifuge
Dehydration
Drying
Carbon dioxide
Stillage separation
Evaporation Wet Distillers
Grains Thin stillage
Whole stillage
Dried
Distillers
Grains
Distillers Dried
Grains with
Solubles
Mixing and
drying
30
grain is converted to ethanol, as such; other chemical components in the grain are
concentrated approximately 3-fold in DDGS (Nyachoti et al., 2005). Typically, each unit
mass of wheat grain produces approximately equal proportions of ethanol, carbon dioxide and
wheat-DDGS.
The quantity of bioavailable P is also increased in DDGS because yeast phytase hydrolyses
phytate P (the insoluble storage form of P in the grain) releasing available P in the process
(Spiehs et al., 2002). Essentially, the concentration of nutrients in DDGS and increased
concentration of available P makes it a potential source of protein, amino acids (AA) and
minerals for poultry and other livestock (pig, horse) feeds. However, the use of DDGS in
poultry feed is currently limited because the physical, chemical and nutritional characteristics
of DDGS vary widely among sources (Fastinger et al., 2006; Bandegan et al., 2009; Belyea et
al., 2010).
The chemical properties of DDGS vary with the type of cereal grain from which it is
produced (maize or wheat) (Nuez-Ortin and Yu, 2009), however, the processes (grinding,
cooking, enzyme treatment, fermentation, distillation and drying) before the production of
DDGS may be more culpable for the variations observed when the same type of grain is used
(Belyea et al., 2004; Liu, 2011). The DDGS produced by beverage-ethanol producers may
also be different to the increasingly available DDGS produced by fuel-ethanol facilities due to
differences in processing techniques and efficiency of starch fermentation.
1.2 Effect Of Processing on DDGS Quality
A number of factors are responsible for the wide variability in the physical, chemical and
nutritional characteristics of DDGS. These factors include, but are not limited to; variations in
the chemical composition of the grain (maize or wheat), differences in processing techniques
among bioethanol plants, and differences in analytical methods (Kim et al., 2008; Belyea et
al., 2010; Liu, 2011). It is thought that variation in chemical composition of cereal grains due
to differences in variety and growing conditions may affect the chemical characteristics of the
DDGS (Stein et al. 2009). However, a lack of correlation between the chemical components
in maize grain and corresponding maize-DDGS has been reported (Stein et al., 2009; Belyea
et al., 2004). This may suggest that factors other than differences in the chemical composition
of the grain are more important in causing variability to the physical and chemical properties
of the DDGS.
Because the efficiency of fermentation, types of enzymes used, the ratio of CDS combined
with WDG to form DDGS and temperature and duration of drying often vary among
31
bioethanol plants, the characteristics of DDGS produced among these sources also differ
(Spiehs et al., 2002; Noll et al., 2007a; Nuez-Ortin and Yu, 2009). During bioethanol
production ammonia, urea, sodium hydroxide and sulphuric acid are often added to the mash
to control pH and to sanitize plant equipment (Liu, 2011). Differences in the quantity of these
exogenous substances among bioethanol facilities may influence the chemical composition of
the DDGS. High concentrations (more than 100-fold increase compared to maize grain) of Ca,
S and Na in maize-DDGS that may be attributed to the addition of exogenous substances
during the dry-grind process have been reported in literature (Oryschak et al., 2010; Liu and
Han, 2011; Liu, 2011). In addition, whereas ethanol and DDGS are the primary end-product
of the dry-grind process, other substances such as yeast protein, ethyl acetate, acetaldehyde
and methanol may also be produced and remain in DDGS (Cozannet et al., 2010a) and these
substances may also influence its chemical characteristics.
1.3 Physical Characteristics of DDGS
1.3.1 Colour
The colour of DDGS is often used as a measure of the intensity and duration of heat treatment
(Fastinger et al., 2006). The colour of DDGS is particularly relevant because of the negative
effect of heat treatment on the concentration and digestibility of AA such as Lys. Cromwell et
al. (1993) observed that Lys concentrations were lower in darker coloured maize-DDGS
samples compared with samples that were lighter in colour. Similarly, using the Hunterlab
colour grading system (L*; lightness, a*; redness and b*; yellowness), Fastinger et al. (2006)
reported that the concentration of Lys in maize-DDGS decreased as the L* value decreased.
Because there was a high correlation between colour score and Lys content in maize-DDGS
in the Fastinger et al. (2006) study, the authors suggested colour as a good predictor of AA
concentration in maize-DDGS.
The digestibility of Lys in maize-DDGS has been widely reported to decrease in poultry as
the colour of maize-DDGS becomes darker (Ergul et al., 2003; Batal and Dale, 2006).
Similarly, low concentrations and digestibility of Lys in dark coloured wheat-DDGS samples
has been reported by Cozannet et al. (2010a; 2011) in broilers. Fastinger et al. (2006) and
Noll et al. (2007b) investigated the relationship between the colour of maize-DDGS and
nitrogen-corrected true metabolisable energy (TMEn) value whereas Cozannet et al. (2010b)
investigated the same in wheat-DDGS. Based on the poor correlation and variations in data
currently available in the literature, the relationships between colour of maize-/wheat-DDGS
and TMEn values are not yet established. Because CDS is darker in colour compared to WDG,
32
the amount of CDS combined with WDG in DDGS may also influence the colour of DDGS
(Noll et al., 2007a). Kingsly et al. (2010) noted that the L* colour value of maize-DDGS
decreased as the proportion of CDS in maize-DDGS increased when drying was conducted at
the same temperature and duration between treatments. As such, although colour may be used
to rapidly predict the quality of DDGS, the effects of drying may not be the only factor
affecting the colour of the final product.
1.4 Chemical Characteristics of DDGS
1.4.1 Energy Value
Because the starch fraction in the grain is converted to ethanol, the concentration of CP, AA,
ether extract, crude fibre and minerals is two to three times greater in DDGS. However,
because the fermentation process cannot effectively convert all the starch in the substrate
(maize/wheat grain) into ethanol under normal processing conditions, there are usually
residual starch and sugars in the co-product at variable quantities depending on the efficiency
of fermentation (Vilarino et al., 2007). Thus, it is possible that the differences in the quantity
of residual sugars in DDGS among sources are responsible, at least in part, for the variability
in its gross energy (GE) value. However, although the GE value of DDGS varies among
sources, the GE in DDGS is usually similar or greater than in the grain. Nyachoti et al. (2005)
reported a higher GE in wheat-DDGS compared to wheat (20.5 vs 16.9 MJ/kg, respectively)
and Cozannet et al. (2010b) similarly reported a higher GE value for wheat-DDGS compared
with wheat (18.7 vs. 16.2 MJ/kg, respectively). The GE value of wheat-DDGS was reported
to be higher than in wheat grain and soyabean meal (SBM) (19.8, 18.6 and 18.2 MJ/kg
respectively) in a study by Thacker and Widyaratne (2007). The GE value of maize-DDGS
ranged from 20.5 to 23.2 MJ/kg and averaged 22.1 MJ/kg in 5 different studies (Fastinger et
al., 2006; Stein, 2007; Olukosi et al., 2010; Oryschak et al., 2010; Rochell et al., 2011); this
value is greater than the average GE value of 18.9 MJ/kg for maize grain (Zhao et al., 2008).
The higher GE value in maize-DDGS compared to maize may be due to the increased
concentrations of CP and ether extract fractions in the DDGS which also negates the energy
diluting effect of the increased fibre fractions. Futhermore, the GE value of maize-DDGS is
higher compared with wheat-DDGS; and this may be due to the higher lipid (i.e. from ether
extract) content in maize compared to wheat (Nuez Ortin and Yu, 2009).
1.4.2 Crude Protein and Amino Acid Composition
The CP and AA composition of DDGS varies widely among sources (Fastinger et al., 2006;
Vilarino et al., 2007). However, there is usually a much wider variation in the concentrations
33
of AA compared to CP content in DDGS. Cozannet et al. (2011) observed more than three-
fold difference in the concentrations of Lys in 19 wheat-DDGS samples obtained from 7
different plants around Europe, whereas less variation was observed for the CP levels.
Similarly, Fastinger et al. (2006) reported the total Lys content in 5 maize-DDGS samples to
vary between 0.48 and 0.76%, whereas the range of CP in their study was much narrower
(27.0 – 29.8%). More than two-fold differences in the concentrations of AA such as Arg
(Cromwell et al., 1993), Leu and Val (Vilarino et al., 2007) and Met (Spiehs et al., 2002) in
maize-DDGS have also been reported previously.
A number of factors may cause variation in the CP and AA composition of DDGS among
sources. They include; differences in the quantity of exogenous non-protein-nitrogen
substances added during the bioethanol process, temperature and duration of drying DDGS,
differences in the contribution of yeast AA to total amino acid (TAA) content in DDGS as
well as differences in the analytical methods used for estimating the chemical components in
DDGS (Kim et al., 2008).
Drying techniques (rotary kiln vs ring drying), drying temperatures, amount of solubles added
in relation to duration of drying (Noll et al., 2007a), over-drying, inconsistent drying leading
to localised burning or “hot spots”, and pre-cooking of the grain during processing have all
been implicated for the variability in the protein quality of DDGS (Kingsly et al., 2010; Liu,
2011). This is particularly important with respect to Lys digestibility which varies and
decreases substantially due to its susceptibility to heat damage (Nyachoti et al., 2005).
Excessive heat treatment of DDGS may cause the amino group on Lys to react with the
carbonyl group on the reducing sugars in a Malliard reaction. Because poultry speciess lack
the enzymes capable of breaking the bond between Lys and the sugar residue, the Malliard
reaction product is generally not available for hydrolysis in the gastrointestinal tract and is
excreted (Cromwell et al., 1993). However, the amount of free sugars would be expected to
be lower in the DDGS, since fermentation should change them to alcohol. The reduction in
sugars may not however reduce the potential for Maillard reactions, since the amount of free
AA are thought to increase with fermentation (Vilarino et al., 2007).
The duration and temperature of drying influences the composition and digestibility of Lys in
maize-DDGS (Cromwell et al., 1993; Stein et al., 2009) and wheat-DDGS (Cozannet et al.,
2010a). Cromwell et al. (1993) observed that Lys concentrations were lowest in the darkest
coloured, and highest in the lightest coloured maize-DDGS samples. Fastinger et al. (2006)
also reported the lowest Lys content in the darkest of 5 maize-DDGS samples. However, Liu
34
(2011) observed that drying causes minimal changes to the CP and AA concentrations of
maize-DDGS.
Ingledew (1999) reported that yeast may constitute up to 5.3% of the total protein in maize-
DDGS. Belyea et al. (2004) noted that yeast protein contribute approximately 55% to the total
protein content of maize-DDGS. However, the value by Belyea et al. (2004) may have
overestimated the contribution of yeast protein to total protein in DDGS because they did not
account for dispensable AA in their approach. Martinez-Amezcua (2005) reported that
approximately 10% of the TAA in maize-DDGS is contributed by yeast. Belyea et al. (2004)
also argued that AA, Lys that is found in low concentrations in maize grain (0.24g/100g) and
in much higher concentrations in yeast (3.32g/100g) increased in maize-DDGS (0.77g/100g).
In the Liu (2011) study, the authors found that post-fermentation of maize, there were rapid
increases in the concentration of some AA, the concentration of some AA remained
unchanged and other AA decreased in concentration.
1.4.3 Mineral Composition: Phosphorus and Other Minerals
The concentration of minerals in DDGS vary widely among sources (Spiehs et al., 2002;
Batal and Dale, 2003; Martinez-Amezcua et al., 2004). Wide variability in the concentrations
of minerals in maize-DDGS have been reported in literature; P (Martinez-Amezcua et al.,
2004), Zn (Spiehs et al., 2002), Na (Belyea et al., 2004), and S (Liu and Han, 2011).
Martinez-Amezcua et al. (2004) reported a P bioavailability of between 69 to 102% (relative
to monopotassium phosphate) in 4 commercial maize-DDGS samples and noted that the
highest bioavailability values were observed in the darkest coloured samples. Martinez-
Amezcua and Parsons (2007) in another study demonstrated that increased heating of maize-
DDGS for varying amounts of time (by autoclaving at 121°C and 124 KPa or by dry oven-
heating at 55°C and 121°C) increased the bioavailability of P but reduced the digestibility of
all AA with large negative effects on Lys digestibility (decreased from 68 to 8%) in broiler
chicks. Lumpkins and Batal (2005) also reported the relative bioavailability of P in maize-
DDGS to be 54 and 68% in 2 different experiments. The P content of maize-DDGS may also
be affected by the fractionation method used during processing (Martinez-Amezcua et al.,
2007; Kim et al., 2008). The P content of high-protein maize-DDGS (HPmaize-DDGS) was
reported to be lower than that of maize-DDGS, although, there was no differences in relative
P bioavailability of HPmaize-DDGS compared to maize-DDGS (Kim et al., 2008).
Variability in the concentration of minerals in DDGS may be due to a number of factors that
include; differences in the ratio of WDG and CDS in DDGS, exogenous addition of mineral
35
compounds, and differences in processing techniques among bioethanol plants. Because
WDG is composed mainly of the CP and crude fibre fractions of the grain, whereas CDS
contains the soluble EE, ash and residual sugar fractions (Kim et al., 2008), the ratio of WDG
and CDS combined influences the mineral characteristics of DDGS (Belyea et al. 2004). An
unusual wide variation in sodium concentration among maize-DDGS samples from the same
plant have been reported by Shurson et al. (2003) and among plants by Batal and Dale, (2003)
and Noll et al. (2007b). High concentrations of calcium and sodium (more than 260-fold
increase compared with maize) have also been reported for maize-DDGS (Noll et al., 2007b;
Oryschak et al., 2010; Liu and Han, 2011).
Variable and high concentrations of sulphur in maize-DDGS samples have been reported by
Nuez-Ortin and Yu (2009). High dietary contents of sulphur (through high dietary inclusions
of maize-DDGS) may interfere with calcium and other trace-mineral absorption and
consequently affect bone mineralisation and egg quality in poultry (Pineda, 2008). The wide
variability and abnormal high concentrations of minerals in DDGS may be due to the addition
of exogenous substances to control pH as well as sanitize plant equipment (Liu, 2011). The
addition of exogenous sulphuric acid, ammonia and sodium hydroxide during bioethanol
production has been documented in literature (Parsons et al. 2006; Kingsly et al. 2010; Liu
and Han, 2011).
Distillers dried grains with solubles is considered to be an economic source of available P
because the fermentation and drying processes increases the concentration of inorganic P by
releasing some of the phytate-bound P in the grain (Martinez-Amezcua et al. 2004; Martinez-
Amezcua and Parsons, 2007, Widyaratne and Zijlstra, 2007). Steiner et al. (2007) noted that
about 67% of the total P in legume seeds, cereals and cereal by-products may be bound as
phytate. Because the bulk of poultry feed is composed almost entirely of plant materials, the
amount of phytate in livestock and poultry feeds may become high. Not only does phytate
level differ between feedstuffs, its location also varies. The largest portion of phytate in maize
is located within the germ (88%), whereas 87% of the phytate in wheat resides in the aleurone
layer (Szczurek, 2009). This is significant because the germ is generally highly digestible
whereas the contents within the aleurone remain mostly undisturbed because they are
protected by a fibrous cell wall. Liu and Han (2011) assessed the concentrations of different
forms of P (non-phytate bound P, phytate P, and total P) in different streams of the bioethanol
production process and reported an increase in maize-DDGS over maize grain of 1.8 fold in
phytate P and 10.8 fold in non-phytate bound P. The authors (Liu and Han, 2011) found that
during the fermentation process, percent phytate P in total P decreased significantly whereas
36
percent non-phytate bound P in total P increased. These observations suggest that phytate
underwent degradation through the actions of yeast phytase.
1.4.4 Non-Starch Polysaccharides
The fibre fraction in cereal grains are composed mainly of cellulose, hemicellulose and lignin.
The non-cellulosic polysacharrides consist predominantly of arabinoxylans and β-glucans and
other small fractions of arabinogalactans, galactans and pectic polysaccharides (Zijlstra et al.,
2007). Cellulose is an un-branched linear molecule and is highly insoluble in water.
Conversely, arabinoxylans and β-glucans are highly water-soluble and digestive and nutrient
absorption processes in the gastrointestinal tract are compromised when they are ingested in
excessive amounts (Choct et al., 2004). Water-soluble non starch polysaccharides (NSP) exert
their anti-nutritive properties by their high affinity to water and formation of gel-like
substances. The formation of the gel medium causes an increase in digesta viscosity, slower
rate of digesta transit in the gastrointestinal tract and also a reduction in nutrient absorption by
encapsulation of other nutrients and enzymes within the gel medium (Choct et al., 2004;
Adeola and Cowieson, 2011). These effects have negative consequences on energy and
nutrient utilisation. Carre et al. (2002) found a negative correlation between in vitro viscosity
and metabolisable energy (ME) of wheat in broilers, Adeola and Bedford (2004) also reported
that nutrient and energy digestibility decreased with increased digesta viscosity in wheat,
Boros et al. (2002) reported a 9% reduction in feed conversion and fat digestion in broilers
due to an increase in dietary concentration of soluble arabinoxylans from 3.4 to 7.7% whereas
a negative correlation between digestible energy and total NSP, soluble NSP and xylose
concentration were reported by Zijlstra et al. (1999) in growing pigs.
The anti-nutritive effects of NSP may limit the use of DDGS in practical poultry diets
(Thacker and Widyaratne, 2007; Wang et al., 2008). Because wheat grain contains about 5-
8% arabinoxylans, up to 1% β-glucans and 2-3% cellulose (Choct et al., 2004), NSP
degrading enzymes are often used during bioethanol production to reduce the viscosity of the
mash in view of improving the efficiency of starch fermentation. Although NSP degrading
enzymes are used during bioethanol production, the concentration of NSP increases 3-fold in
DDGS compared to the grain (Widyaratne and Zijlstra, 2007).
1.5 Biological Characteristics of DDGS
Mycotoxins such as aflatoxins, deoxynivalenol, fumonisms and zearalenone are secondary
metabolites of fungi that are often found on plant materials and cereal grains. Ingestion of
excessive amount of mycotoxins may cause illness and death of poultry and livestock animals
37
(Zhang et al., 2009). One potential problem with the transportation and storage of DDGS is
mycotoxin contamination. Because fermentation of wheat concentrates the chemical
components in DDGS, it is possible that the concentration of mycotoxins also increases in
DDGS. Schaafsma et al. (2009) found the concentration of deoxynivalenol in CDS to be four
times greater than in maize grain. Similarly, Rodrigues (2008) reported 99 percent of 103
samples of maize-DDGS tested contained at least one detectable mycotoxin. Zhang et al.
(2009) found varying concentrations of aflatoxins, deoxynivalenol, fumonisms and
zearalenone among 10 sources of maize-DDGS. On the other hand, Pineda (2008) found no
detectable levels of aflatoxin, vomitoxin, zearalenol, zearalenone and T-2 toxin in maize-
DDGS in their study. However, the reported mycotoxin concentrations in maize-DDGS are
usually lower than recommended harmful concentrations (Rodrigues 2008; Schaafsma et al.,
2009; Zhang et al., 2009).
1.6 Use of DDGS in Poultry Diets and Effect on Bird Performance
A few studies have argued that a correctly balanced feeding ration of DDGS may successfully
replace some of the well characterized feedstuffs in poultry diets. Apart from the increased
concentration of CP, AA, and minerals in DDGS, the crude fibre composition also increases
3-fold. Because poultry are not efficient at utilizing dietary fibre, it is essential to evaluate
how much DDGS can be incorporated into poultry diets without compromising performance.
The few studies that have evaluated the use of wheat-DDGS in monogastric diets have
focused more on broilers, fewer still on pigs (Thacker, 2006; Widyaratne and Zijlstra, 2007;
Lan et al., 2008) and it appears that the currently available studies with turkey have used only
maize-DDGS. The review is thus concentrated on the use of maize-DDGS as a possible
indication of opportunities and limitations of using wheat-DDGS in poultry. It is
acknowledged that the characteristics of these two DDGS are different because wheat-DDGS
contain greater levels of CP and fibre compared with maize-DDGS.
1.6.1 Effect on Growth Performance
The inclusion of maize-DDGS in poultry diets is not new (Matterson et al., 1966; Morrison,
1954; Waldroup et al., 1981; Parson et al., 1983), however, majority of the DDGS described
in growth performance and digestibility studies in poultry and swine before the last decade
were mostly from the brewing industry. The DDGS produced by the brewing industry may
however be different in chemical composition to the DDGS produced by modern bioethanol
facilities due to improved fermentation techniques. Morrison (1954) observed that up to 8%
maize-DDGS may be included in practical broiler chick diet without detrimental effects on
38
body weight. In addition, the author also reported that including 10% maize-DDGS in layer
hen diets did not cause a reduction in egg production. In another study, up-to 25% maize-
DDGS was included in nutritionally-adequate broiler diets without causing a reduction in
body weight or feed intake (Waldroup et al., 1981). Further studies using maize-DDGS by
Parsons et al. (1983), proposed that up-to 40% of SBM protein can be replaced by maize-
DDGS as long as the dietary Lys content is adequate.
There is a general trend that growth performance is depressed as the quantity of DDGS in the
diet is increased. The decline in growth performance as the level of maize-DDGS in the diet is
increased may be due to the inefficiency of poultry at utilising dietary fibre. Stated differently,
along with other nutrients the crude fibre composition of DDGS is increased about 3-folds by
fermentation. As such, high inclusion levels of DDGS may increase dietary fibre content
which in turn may impede nutrient digestibility. Thacker and Widyaratne (2007) evaluated the
inclusion of wheat-DDGS in broiler chick diets at a rate of 0, 5, 10, 15 and 20%. In that study,
there were no differences in body weight gain (BWG), feed intake and feed conversion ratio
(FCR) in all the dietary treatments compared with the controls. However, because there was a
high mortality at 20% DDGS inclusion, the authors recommended that wheat-DDGS be
incorporated at 15% provided that the low energy and Lys contents of wheat-DDGS are
compensated for during diet formulation. Similarly, Loar et al. (2010) reported no differences
in the final body weight (FBW), feed intake and FCR of broilers fed 0 or 8% maize-DDGS in
their diets during the starter period.
Wang et al. (2007a) observed that broilers fed 15% maize-DDGS did not differ from control
in body weight, feed intake, and FCR at 42 days of age; however, 30% inclusion of maize-
DDGS reduced feed efficiency without any effect on feed intake or BWG. In another study by
the same authors (Wang et al., 2007b) it was noted that 15 to 20% maize-DDGS may be
incorporated into broiler diets formulated on digestible AA without detrimental effects on bird
performance. Shim et al. (2011) observed greater BWG in the starter period of broilers fed
24% maize-DDGS against the control.
Lumpkins et al. (2004) recommended an optimum inclusion rate of maize-DDGS at 9% in
broiler starter diets and 12 to 15% in the grower to finisher period because above these levels,
maize-DDGS depressed growth performance. In Hoskova et al. (2010) study, including 0 or
25% wheat-DDGS in broiler diets from 12 to 35 days of age produced similar feed intake and
FCR but the treatment containing 0% wheat-DDGS produced superior growth performance.
Vilarino et al. (2007) observed improvement in FCR for broilers fed either 10 or 20% wheat-
DDGS from day old to 10 days of age compared with controls (0% wheat-DDGS), but feed
39
intake and final body weight at 37 days of age reduced as the level of wheat-DDGS increased.
Similarly, Richer et al. (2006) observed a reduction in BWG and feed intake of broilers at the
finisher phase as the level of wheat-DDGS increased to 20% in the diet. Lukasiewicz et al.
(2009) observed improvement in FCR for broilers receiving 7%, 9.5% and 9.5% wheat-
DDGS during the starter, grower and finisher periods respectively, however mean BWG was
consistently higher in the control groups (0% wheat-DDGS) and also in males fed wheat-
DDGS compared to females. Lukasiewicz et al. (2009) further noted that the inclusion of
wheat-DDGS in the diet for broilers increased the number of beneficial micro-organisms in
the gut (there was a decline in caecal population of Enterobacteriaceae).
According to Potter (1966), if Lys and ME content of feed are appropriately balanced, up to
20% maize-DDGS could be fed to turkey without any detrimental effect on body weight or
FCR. Roberson (2003) fed diets formulated on digestible AA basis and including between 0
and 27% maize-DDGS to female turkey, the authors observed a linear decrease in body
weight as the level of maize-DDGS increased in the diet as well as a linear increase in FCR.
Because there was an increase in the incidence of pendulous crop as the level of maize-DDGS
increased (with incidence highest at 18 to 27% inclusion levels) in that study, the authors
recommended that maize-DDGS be used at no more than 10% during the grower/finishing
period in female turkey.
Extensive feeding trials by Noll et al. (2002; 2003ab) in turkey investigated the possibility of
using maize-DDGS in grower/finishing diets of heavy toms receiving diets formulated on
digestible AA basis. In those studies there were no differences observed in live performance
of turkey relative to body weight and FCR at 10% inclusion rate of maize-DDGS. In another
study, 15 and 20% levels of maize-DDGS in turkey diets resulted in performance similar to
the control (Noll, 2004), however 20% inclusion of maize-DDGS depressed FBW at 19
weeks of age in a similar but subsequent study by the same authors (Noll et al., 2005). Further
studies by Noll et al. (2009) showed that body weight was greater at 5 weeks of age in turkey
fed on diets containing 10, 20 and 30% maize-DDGS compared with turkey fed diets with no
maize-DDGS.
Because exogenous enzymes in poultry diets can help promote growth, efficiency of nutrient
utilisation, and nutrient excretion, some authors have assessed their benefits in poultry diets
containing DDGS. Slominski (2010) observed growth performance response of broilers to
feeding a blend of maize-DDGS and wheat-DDGS with or without enzyme supplementation.
The authors noted that 10% inclusion of the maize-/wheat-DDGS blend supported growth
performance similar to the control diet (0% DDGS) in the absence of enzyme and that in the
40
presence of enzyme, 15% DDGS level supported growth similar to the control. In Olukosi et
al. (2010) study, inclusion of 10% maize-DDGS in broiler diets supplemented with an
admixture of phytase, xylanase, amylase and protease enzymes produced superior BWG, feed
intake and feed efficiency at 3 weeks of age compared with diets without maize-DDGS or
supplemental enzymes.
Due to the potential anti-nutritive effects of NSP in DDGS, some authors have studied the
effect of processing techniques to reduce the NSP level. Oryschak et al. (2010) examined the
use of extruded (physical disruption of cell wall and reduction in molecular weight of
substrate) and non-extruded maize-DDGS and wheat-DDGS between 0 to 30% in broiler diet.
The authors recommended an inclusion rate of no more than 10% for either maize-DDGS or
wheat-DDGS with or without extrusion because above this level growth performance
responses were depressed. Overall, it was generally consistent in the literature that increasing
the inclusion level of maize- or wheat-DDGS in broiler and turkey diets compromised growth
performance. It was also noted that the maize- or wheat-DDGS inclusion rates at which a
decline in growth performance was noted also varied among studies. Although differences in
the nutritional quality of the DDGS used may be responsible for the variations in growth
performance response reported among studies, factors such as the chemical characteristics of
the diet used, breed and age of bird and enviromental conditions may also affect bird
performance. On the other hand, there is possibility that a diet containing DDGS that is
formulated using digestible nutrient values will support growth performance and further
benefits may be derived by supplementing such diet with exogenous enzymes.
1.6.2 Effect on Egg Production and Quality
Some authors have assessed the possibility of using DDGS in laying hens diets. Richter et al.
(2006) fed laying hens diets containing up to 15% wheat-DDGS with or without an admixture
of supplemental xylanase, amylase, glucanase, cellulase and protease enzymes between 20 to
64 weeks of age. In that study, egg number or quality was not affected by the inclusion of
15% wheat-DDGS. Lumpkins et al. (2003) fed laying hens 15% maize-DDGS from 21 to 43
weeks of age and observed no detrimental effect on egg production, quality or egg shell
quality compared with the controls (0% maize-DDGS). Wu-Haan et al. (2010) observed that
feeding laying hens diets containing up to 20% maize-DDGS had no effect on egg weight,
egg production, feed intake or BWG between 21 to 26 weeks of age. Similarly, Scheideler et
al. (2008) noted that egg production, feed intake, and BWG were not affected by dietary
maize-DDGS inclusion up to 25% in laying hen diets.
41
Inclusion of 10% maize-DDGS in layer hen diets produced similar egg production, egg
weight, feed intake or BWG compared with the controls (0% maize-DDGS) in a study by
Roberts et al. (2007a). Jung and Batal (2009) demonstrated the effect of feeding up to 12%
HPmaize-DDGS to laying hens and found that inclusion levels of 3 and 12% improved hen
day egg production compared to those fed the control diet without HPmaize-DDGS, and also
that, egg mass was significantly improved in hens fed the 3% HPmaize-DDGS diets.
Two experiments were conducted by Roberson et al. (2005) to evaluate the effect of maize-
DDGS inclusion at a level increasing from 0 to 15% on the performance of laying hens and
egg production indices. In the first experiment the authors observed a linear decrease in egg
production as the level of maize-DDGS in the diets increased at 52 to 53 weeks of age.
However no effect of maize-DDGS inclusion was observed at other periods (49, 51, 55
weeks) in the study. In the same experiment there was a decrease in egg mass at 51 and 53
weeks of age as the level of maize-DDGS increased in diet, but shell quality was not affected
by dietary treatments. In the second experiment, although egg production and egg mass were
not affected by 15% inclusion of maize-DDGS in the diets there was a linear decrease in egg
weight while maize-DDGS inclusion at levels as low as 5% led to darker coloured yolks in
both experiments. Maize-DDGS is a good source of the pigment (carotenoids) that produce
the desirable dark-yellow coloured egg yolks in layers, however, the concentration of
xanthophylls in maize-DDGS vary among sources due to its susceptibility to heat damage
(Roberson et al., 2005).
The effect of feeding graded levels of maize-DDGS (0, 5, 10, 15, and 20%) in diets
formulated to be isocaloric and isonitrogenous on laying hen performance and egg quality was
investigated by Swiatkiewicz and Koreleski (2006). The authors observed no significant
effect of maize-DDGS inclusion on all production indices during the first phase of the study
(26 - 43 weeks); however a reduction in egg production and daily egg weight was reported in
laying hens fed 20% maize-DDGS during the second phase (44 - 68 weeks). Supplementation
of the diet with an NSP hydrolyzing enzyme mix (endo-1,4-β-xylanase, endo-1,3-β-glucanase,
pentosanase, hemicellulase and pectinase) during the 44 to 68-week feed phase helped offset
the drop in lay rate and daily egg mass in that study (Swiatkiwicz and Koreleski, 2006).
Shurson (2003) evaluated the effect of feeding 10% maize-DDGS on egg production, egg
quality and egg yolk colour in layer hens and observed no difference in average hen body
weight compared to the control (0 % maize-DDGS) during the first 2 weeks. In that study,
total egg production and body weight at 3 to 12 weeks of age was greater for hens fed 10%
42
maize-DDGS compared with the controls. Inclusion of maize-DDGS in the diet also resulted
in darker coloured egg yolks.
Green et al. (2010) studied the effect of using high levels of maize-DDGS on the long term
performance of laying hens; the authors observed a linear decrease in both feed intake and egg
production as the level of maize-DDGS increased towards 50% in the diet. The authors
attributed the decline in egg production to methionine deficiency in hens fed the maize-DDGS
diets. In Pineda (2008) study, 0, 23, 46 or 69 % maize-DDGS was incorporated into layer hen
diets and fed for 8 weeks. Although there was no significant differences among dietary
treatments with regards to body weight, egg production decreased whereas egg weight
increased linearly with increasing levels of maize-DDGS in the diets.
There is limited information on the use of DDGS in duck nutrition; however Huang et al.
(2006) fed laying ducks from 14 to 50 weeks of age on dietary treatments of 0, 6, 12 and 18%
maize-DDGS. The authors showed that inclusion of maize-DDGS at levels up to 18% had no
effect on feed intake, FCR or egg quality, and egg production rate increased with increasing
maize-DDGS inclusion during cold weather conditions. The differences in egg production and
quality among studies may be due in part to differences in the nutritional quality of the maize-
DDGS used, although it is noted that other factors such the age of the bird, inclusion level of
maize-DDGS and chemical composition of the diet used may also be implicated.
1.6.3 Effect on Carcass Characteristics and Meat Quality
Many of the studies evaluating the use of bioethanol co-products in poultry diets have focused
largely on increasing inclusion rates without compromising performance. However, the
chemical profile of the feed or feedstuff (fatty acid and AA composition) may have an effect
on the chemical properties and partitioning of nutrients in livestock tissues (Loar et al. 2010).
Information in the literature regarding effects of feeding maize-DDGS on poultry meat quality
is rare and is non-existent for wheat-DDGS. Corzo et al. (2009) using diets that were
formulated to be both isocaloric and isonitrogenous studied the effect of feeding 0 or 8%
maize-DDGS on meat quality in broilers. The authors reported the mean breast meat pH to be
similar at 15 minutes and at 24 hours post-mortem between the two dietary treatments as well
as colour, cooking loss percentage, tenderness and sensory analysis in the breast meat for both
treatments. The effect of feeding up to 24% maize-DDGS on broiler meat quality was
determined by Schillings et al. (2010). Although the authors noted increasing breast meat pH
with increasing maize-DDGS inclusion in the diet (indicative of less acidity and hence better
meat quality), the other meat quality indices were not affected by the treatments.
43
1.7 Nutrient Digestibility of DDGS for Poultry
1.7.1 Metabolisable Energy
Although performance data can give an indication of the potential value of a feedstuff, diet
formulation requires more specific information on nutrient utilisation. In the case of DDGS,
variable and generally lower digestibility of nutrients (compared to conventional feed
ingredients) has been reported. Fastinger et al. (2006) evaluated the TMEn values of 5
samples of maize-DDGS using adult caecectomized roosters, the authors reported an average
value of 2871 kcal/kg with large differences among the 5 samples (±563 kcal/kg). Such large
variations in TMEn values were also reported by Parsons et al. (2006), in a study to determine
the energy value of 20 maize-DDGS samples. Furthermore, Fastinger et al. (2006) reported
the lowest TMEn value in the darkest of 5 maize-DDGS samples analysed (600 kcal/kg less
TMEn in the darkest compared to lightest) and noted a colour threshold (L* between 28 and
34) where the AA and TMEn value in maize-DDGS is reduced. Also investigating the
relationship between colour and energy value of DDGS, Noll et al. (2007a) reported a
negative correlation (r = –0.98) between the L* value of maize-DDGS and the amount of
solubles added back to DDG and further observed that darker coloured maize-DDGS samples
have higher TMEn values. The observation that darker coloured DDGS contain greater ME in
the study of Noll et al. (2007a) is direct opposite of the observations in the study of Fastinger
et al. (2006). It is speculated that the dark colour of the maize-DDGS used in the Noll et al.
(2007a) study may have been due to greater proportions of CDS in the DDGS rather than
excessive heat treatment of the DDGS.
Lumpkins et al. (2004) analyzed the TMEn and true AA digestibility of maize-DDGS using
cecectomized roosters, and reported an average TMEn value of 2905 kcal/kg. A study by
Batal and Dale (2006) using maize-DDGS from 17 different samples and 6 different plants in
the Midwest region of the USA reported a TMEn value ranging from 2490 to 3190 kcal/kg
and a coefficient of variation of 6.4% in cecectomized roosters. The authors developed a
prediction equation for TMEn based on fat, protein, fiber and ash content of maize-DDGS, but
reported fat as the single best predictor of TMEn content, however the overall regression
coefficient was also low (r2
= 0.29). Using the precision-fed intact rooster assay, Jung and
Batal (2009) analysed the TMEn value of 8 samples of HPmaize-DDGS for laying hens. The
average TMEn value of the HPmaize-DDGS samples was 2851 kcal/kg with a range between
2667 and 3282 kcal/kg. In another study, Kim et al. (2008) determined the TMEn contents of
conventionally processed maize-DDGS, HPmaize-DDG, and maize germ. The TMEn content
of HPmaize-DDG and maize germ was 2694 and 4137 kcal/kg respectively, whereas the
44
TMEn value for maize-DDGS was 3266 kcal/kg. Kim et al. (2008) also showed that the
HPmaize-DDG contained about 17% less TMEn than the maize-DDGS and the maize germ
contained about 22% more TMEn than the maize-DDGS which was attributed to the
differences in fat and protein contents between the co-products.
Cozannet et al. (2010a) measured the apparent metabolisable energy (AME) and nitrogen-
corrected apparent metabolisable energy (AMEn) value of 10 wheat-DDGS samples in
roosters, broilers, layers and growing turkey, although the AMEn:GE ratios in the study were
generally low for all speciess, the values reported (10.3, 9.9, 9.6, and 9.9 MJ/kg of DM for
roosters, broilers, layers and turkey respectively), showed that AMEn for wheat-DDGS
differed between the poultry speciess. The authors further suggested that AMEn can be
predicted from either the ADF content (r2
= 0.79) or L* score (r2
= 0.77) of wheat-DDGS. The
AMEn value of two different batches of wheat-DDGS was measured in adult cockerels by
Vilarino et al. (2007) using the difference method, the authors noted that the AMEn values
differed between batches of wheat-DDGS (11.19 vs 10.57 MJ/kg) and also observed a low
AMEn:GE for the two batches of wheat-DDGS (55.8 and 52.1%) compared to wheat (78%).
However AMEn:GE values of wheat-DDGS were higher than those of rapeseed meal (34%)
and similar to SBM (54%) in that study.
Adeola and Ilekeji (2009) compared practical and semi-purified diets in determination of the
AME and AMEn value of maize-DDGS for broiler chickens using the regression method. The
authors observed a linear decrease in energy retention as the level of maize-DDGS increased
from 0 to 60 % in the practical diets (78.6 - 58.6%) and a rather lesser decrease when using
the semi-purified diet (86.8 - 75.4%). Based on this result the authors (Adeola and Ilekeji,
2009) suggested that the ME value of maize-DDGS may be affected by the basal diet used in
the bioassay and that the greater proportional dietary energy utilisation in the semi-purified
nitrogen-free diet may be due to associative effects of dietary energy sources. In summary the
wide differences in reported energy values of both maize-DDGS and wheat-DDGS shows the
need to develop a standardised method for determining the energy value of DDGS. Although
it is already known that DDGS nutrient contents vary among sources, the methodology, age
and speciess of poultry used for estimating energy value are also potential sources of
variation.
1.7.2 Amino Acid Digestibility
Crude protein and AA digestibility of maize- and wheat-DDGS have been reported to vary
substantially in poultry (Batal and Dale, 2006; Fastinger et al., 2006; Cozannet et al., 2010a).
45
As mentioned earlier, a factor that may reduce as well as cause variability in the digestibility
of CP and AA in DDGS for poultry is heat treatment. Excessive application of heat during
drying reduces the digestibility of AA (especially Lys) in feedstuffs for monogastrics due to
the formation of insoluble AA-carbohydrate compounds by the Malliard reaction. This may
be exascerbated in DDGS because several steps in bioethanol production (jet cooking,
liquefaction, saccharification, drying) involve heat application. Liu and Han (2011) noted that
the formation of carbohydrate-AA complexes in maize-DDGS may not be solely limited to
drying, because a proportion of Lys in WDG and CDS are already bound by the Malliard
reaction before the drying process.
The TMEn and true ileal amino acid digestibility (TIAAD) value of eight maize-DDGS
samples were analysed using precision-fed caecectomized rooster assay by Batal and Dale
(2006). In that study, the effect of heat damage on Lys digestibility during processing was
demonstrated; with the highest and lowest apparent ileal digestibility (AID) for Lys observed
in the lightest- and darkest coloured maize-DDGS samples respectively. Furthermore, Batal
and Dale (2006) also reported strong correlations between digestible Lys, Thr, Arg, His and
Trp contents and L* values (r = 0.87, 0.53, 0.71, 0.84 and 0.72 respectively) and b* values
(0.96, 0.76, 0.87, 0.88 and 0.77 respectively) of maize-DDGS. Correlations between L*
values and standardised ileal digestibility (SID) of Lys (L* = 53.8; b* = 42.8 associated with
0.65 digestible Lys) was reported by Ergul et al. (2003) in 22 samples of maize-DDGS using
caecectomized roosters. The authors also noted that except for Leu and Ser, the digestible AA
content was highly variable among the 22 maize-DDGS sources investigated.
Fastinger et al. (2006) reported the AID and true ileal digestibility (TID) of AA to be 30 and
15 percentage units lower in the darkest coloured of five maize-DDGS samples assessed. The
authors also noted that in addition to reducing AA digestibility, excessive heat treatment also
reduced the total Lys content of maize-DDGS. The AID and SID of AA in maize-DDGS for
broilers was assessed by Bandegan et al. (2009). In that study, the most variable and lowest
AID estimates were observed for Lys (24 - 48%), Thr (48 - 61%) and His (57 - 69%) but the
overall SID for CP was 69.1%. Furthermore, the lowest average SID was observed for Lys
(40%) whereas Phe, Met and Leu were the most digestible AA (SID; 86.4, 75.7 and 75.6%,
respectively).
Cozannet et al. (2010b) determined the standardised ileal amino acid digestibility (SIAAD) of
7 wheat-DDGS samples using caecectomized roosters and reported wide variability in the
SID of Lys (49 - 71%). In the same study, the SID of CP ranged from 76 and 85%. Further
studies by Cozannet et al. (2011) also reported a wide variability in SID of Lys (-0.04 – 0.71)
46
in 10 samples of wheat-DDGS assessed using caecectomized roosters. Furthermore, Cozannet
et al. (2011) also observed a positive relationship between colour score (L* value) and the
Lys content of wheat-DDGS (r = 0.63), as well as the SID value of Lys (r = 0.64) for broilers.
In addition, the authors developed predictive models which indicated that the Lys content of
wheat-DDGS can be determined from a quadratic (R2
= 0.94) or a linear-plateau model (R2
=
0.90; breakpoint for 1.9 g/100g Lys in CP and a 0.63 plateau SID value).
Nutrient digestibility increases with age and differs between poultry speciess and feed
ingredients (Batal and Parsons, 2002). Adedokun et al. (2008) assessed the SIAAD of five
plant-based feed ingredients (light and dark coloured maize-DDGS, canola meal, maize, and
SBM) in 5 and 21 day-old broiler chicks and turkey poults. In that study, the SIAAD of the
feed ingredients evaluated increased with age in all poultry speciess, except for the dark
coloured maize-DDGS. The lack of improvement in the digestibility of the dark coloured
maize-DDGS with age in the Adedokun et al. (2008) study may be due to the poor solubility
of AA in the gastrointestinal tract as a consequence of their presence as Malliard complexes.
Collectively, it was consistent in the literature that excessive heat treatment reduces protein
and AA digestibility in DDGS for poultry and that darker coloured DDGS samples are less
digestible compared with lighter coloured DDGS.
1.7.3 Nutrient Retention and Excretion
The excretion and volatilization of nutrients of dietary origin are responsible for a large part
of the environmental issues associated with poultry production. Nitrogen and P from poultry
litter have been reported to have potentially negative effects on air, soil and water quality in
terms of eutrophic conditions that result from excess P in excreta in run-off water and
acidification of the environment resulting from ammonia, S compounds, volatile organic
compounds and nitrogen oxides (Roberts et al., 2007b; Pineda, 2008). A main disadvantage
of using high levels of DDGS has been identified to be an increase in nutrient and dry matter
(DM) excretion (Widyaratne and Zijlstra, 2007; Pineda, 2008). Because DDGS contains a
higher level of CP and P compared to maize and SBM, high level of DDGS inclusion and its
lower digestibility compared to maize or wheat may lead to an increase in excretion of
nutrients (Leytem et al. 2008). Additionally, increased N excretion demands metabolic energy
for N removal, consequently leaving less energy available for the animal for maintenance and
productive purposes.
Widyaratne and Zijlstra (2007) studied the effect of feeding 40% wheat-DDGS in pigs and
found N output to increase linearly with increasing inclusion rates. Similarly, Leytem et al.
47
(2008) demonstrated the effect of feeding 20% wheat-DDGS on nutrient excretion in broilers.
The authors noted that the apparent retention of both N and P decreased linearly with
increasing DDGS inclusion and led to an increase in N and total P excretion. The authors also
observed an increase in excretion of phosphate P and a concomitant decrease in phytate-P.
Pineda (2008) observed an increase in N retention in laying hens fed up to 69% maize-DDGS,
however due to the excessive amount of CP and higher N consumption, there was also an
increase in N excretion in their study. The nutritional value of HPmaize-DDGS for broilers
and its effect on nutrient excretion was assessed by Applegate et al. (2009), the authors found
that the dietary treatments satisfactorily optimized BWG and carcass yields, but there was
also 21.9 and 31.8% more manure DM and N, respectively in birds fed the 50% HPmaize-
DDGS compared to the control maize-SBM diet.
Although increased ammonia emission from the manure will presumably be associated with
increased N excretion, dietary DDGS appear to have an attenuating effect on ammonia
emissions (Roberts et al., 2007b). Crude fibre is not digested by the birds, and some of the
fibre is fermented by microbes in the large intestines, producing short chain fatty acids, which
in turn lowers the manure pH. The lowered pH is thought to result in a shift in the NH3
equilibrium toward the less volatile ammonium ion (NH3 + H+ ↔ NH4
+). Therefore, birds
receiving DDGS may excrete more N, but the N does not volatilize. This effect of dietary
fibre on manure acidification and NH3 emission has been demonstrated in laying hens using
diets containing maize-DDGS. Roberts et al. (2007b) fed laying hens 10% maize-DDGS and
crude fibre from wheat middlings and soyabean hulls between 28 and 58 weeks of age and
then determined their effect on NH3 emissions. In that study, there were differences in N
excretion between treatments fed 10% maize-DDGS and the control (maize-SBM diet). Wu-
Haan et al. (2010) fed laying hens up to 20% maize-DDGS and reported a reduction in the
mass of NH3 emissions as the level of maize-DDGS increased in the diet (daily emissions
were 105.4, 91.7 and 80.2 mg/g of N consumed for 0, 10 and 20% maize-DDGS
respectively). Overall the authors indicated that the inclusion of maize-DDGS at 20% in diets
of laying hens can reduce NH3 emissions by approximately 24%. In the same study a 58%
reduction in H2S emissions was also observed when laying hens were fed 20% maize-DDGS.
1.8 Dietary Fibre Type and Crude Protein Level
The digestible energy and nutrient digestibility in maize- and wheat-DDGS are reasonably
well defined for pigs and will not be reviewed in the current report. However, it is not known
whether the choice of protein feedstuff in relation to its fibre characteristics affects nutrient
digestibility. It is intuitive that a diet formulated for pigs using maize-DDGS as protein source
48
will contain greater levels of soluble fibre compared with a diet formulated using SBM as
protein source. Dietary fibre is found in different forms and quantities in feed ingredients that
are used in diets for pigs. Although, the NSP found in cereals exert greater anti-nutritive
effects compared with legumes and oil seeds, the contributions of NSP by legumes cannot be
underestimated because legumes often constitute a large proportion of the diet. A plethora of
studies have reported a decrease in energy utilisation and/or, protein and AA digestibility with
increased dietary fibre in pigs (Sauer et al., 1991; Wang et al., 2006; Wilfart et al., 2006).
Due to the environmental implications, there is an increased need to mitigate excess N
excretion from pigs. One of the means of reducing N excretion by pigs is by reducing dietary
CP intake. Decreasing the CP content of the diet by 2 to 4% resulted in an average of 20%
decrease in N excretion by finishing pigs (Lee et al., 2001). In addition, it appears that pigs
are able to compensate for the reduction in CP intake by increasing the efficiency of nutrient
utilisation. Christensen (1984) noted that animals may respond to restricted protein intake by
increasing intestinal amino acid (AA) absorption. Otto et al. (2003) reported an increase in
ileal AA digestibility for growing pigs by decreasing dietary CP concentration from 15 to 6%.
In most cases, dietary CP level is reduced by replacing SBM with a feed ingredient with low
CP content relative to SBM. Usually such feed ingredient also contains greater levels of fibre.
This is important because the physical and chemical properties of dietary fibre may affect
nutrient utilisation (Sauer et al., 1991). Because feed ingredients contain different types and
levels of fibre, it is important to investigate whether the type of feed ingredient used as protein
source has an effect on the digestibility of AA or the ability of growing pigs to cope with a
reduction in dietary CP level.
1.9 Improving DDGS Nutritional Quality
The main anti-nutritive factors in DDGS as a feed ingredient for poultry are the high crude
fibre content and the low digestibility of CP and AA. These factors are known to play a major
negative role in feed utilisation and nutrient excretion in poultry (Widyaratne and Zijlstra,
2007; Pineda, 2008). Altogether, based on present knowledge, there may be a potential for
enhancing DDGS digestibility for poultry. Methods such as enzyme supplementation and
fractionation (removal of the fibre fraction) have been demonstrated by a few studies as
having the potential of improving the value and encourage the use of DDGS at higher
inclusion rates (Swiatkiewicz and Koreleski, 2006; Kim et al., 2010; Olukosi et al., 2010).
1.9.1 Exogenous Enzymes in Poultry Diets and Potential Value for DDGS
49
The use of exogenous enzymes in poultry nutrition is well documented in scientific literature
and has been reviewed (Cowieson et al., 2006; Slominski, 2010; Adeola and Cowieson,
2011). Generally, the main objectives of supplementing enzymes in poultry diets are to break
down the anti-nutritive factors in feed ingredients, to enhance the overall digestibility of the
feed, to make certain nutrients biologically more available, and to reduce environmental
pollution from animal excreta by reducing nutrient and DM excretion. Other benefits, such as
the use of exogenous enzymes in improving nutrient digestion in young poultry at early ages
due to a lack or insufficiency of digestive enzymes have also been reported in literature
(Slominski, 2010).
Exogenous enzymes such as carbohydrases, phytases and proteases or a combination of these
enzymes are often incorporated into poultry diets but there is a dearth of information on the
efficacy of these enzymes in poultry diets containing varying levels of DDGS. In addition to
improving digestibility, supplementing diets containing DDGS with exogenous enzymes may
reduce variability in the nutritive value of the product, as well as ameliorate the adverse
effects of the anti-nutritional factors. Reduction in the variability in nutrient quality of feed
ingredients with the use of exogenous enzymes has been reported in literature (Bedford and
Schulze, 1998; Bedford, 2000) and improvement in growth performance and nutrient
utilisation have also been observed to be greater for poor quality raw materials (Classen et al.,
1995; Bedford and Schulze, 1998).
1.9.1.1 Carbohydrases
Carbohydrases are enzymes that hydrolyse NSP into oligosaccharides and monosaccharides.
The nutritive benefits of supplemental carbohydrases in diets includes reduced digesta
viscosity in the gastrointestinal tract due to the hydrolysis of soluble arabinoxylans and β-
glucans, the release of nutrients encapsulated in the NSP structure and gel matrix and a
greater exposure of substrates to digestive enzymes (Bedford, 2000). The types and
concentrations of NSP vary among feedstuffs. For example, wheat, maize, triticale and rye
contain predominantly arabinoxylans, whereas barley and oats are rich in β-glucans.
Therefore the types of carbohydrases that are supplemented to diets vary according to the
dietary NSP composition. Hence, xylanases are supplemented to wheat, maize, triticale and
rye-based diets, whereas β-glucanases are more effective in barley and oat-based diets.
Xylanases are hydrolases depolymerising the plant cell wall component xylan. The
depolymerisation action of endo-xylanase results in the conversion of the polymeric substance
into xylooligosaccharides and xylose. The complex structure of xylan requires different
50
enzymes for its complete hydrolysis. Endo-1, 4- β-xylanases depolymerise xylan by the
random hydrolysis of xylan backbone and 1, 4- β-D-xylosidases split off small
oligosaccharides. The side groups present in xylan are liberated by α-L-arabinofuranosidase,
α-D-glucuronidase, galactosidase and acetyl xylan esterase. Diverse forms of these enzymes
exist, displaying varying folds, mechanisms of action, substrate specificities, hydrolytic
activities (yields, rates and products) and physicochemical characteristics (Adeola and
Cowieson, 2011). Research has focused mainly on only two of the xylanase containing
glycoside hydrolase families, namely families 10 and 11, yet enzymes with xylanase activity
belonging to families 5, 7, 8 and 43 have also been identified and studied, although to a lesser
extent (Collins et al., 2005).
The plant cell wall is a composite material in which cellulose, hemicellulose (mainly xylan)
and lignin are closely associated. Wheat contains 5 to 8% arabinoxylans (pentosans consisting
of the monosaccharides; arabinose and xylose linked in β-1-4 linkages), up to 1% β-glucans
and 2-3% cellulose (Choct et al. 2004). Supplementation of wheat-based diets with exogenous
xylanase has been documented to be effective at ameliorating the negative effects of NSP in
poultry diet (Choct et al. 2004; Adeola and Cowieson, 2011).
Improvements in growth responses and nutrient digestibility with the supplementation of
xylanase in wheat-based poultry diets have been widely reported in literature. Olukosi et al.
(2007) reported improvement in BWG, feed intake and feed efficiency in broilers using low
and high levels of supplemental xylanase. Improvement in FCR in broilers fed either ground
or whole wheat supplemented with a xylanase was reported by Wu et al. (2004). Amerah and
Ravindran (2009) observed an increase in feed intake and BWG in broiler starters fed
xylanase supplemented soft wheat-based diet; xylanase supplementation of high-viscosity
wheat-based diet improved weight gain and feed efficiency by 13 and 12%, respectively, and
true metabolisable energy in ducks (Adeola and Bedford 2004).
Veldman and Vahl (1994) reported an improvement in FCR and BWG in broilers fed
xylanase supplemented diets related to lowering of digesta viscosity, Nian et al. (2011)
reported an improvement in FCR, diet AME and ileal digestibility of hemicellulose in 4 week
old broilers. An increase in ileal digestibility of insoluble NSP in low-ME wheat was reported
by Choct et al. (2004). Improvement in the AID of 17 AA (average of 4.8%) was observed by
Selle et al. (2009) in xylanase supplemented diets for broilers whereas supplementation of
xylanase and β-glucanase enzymes yielded modest improvements in FCR of turkey receiving
wheat-, barley- or wheat-based diets (Mathlouthi et al., 2003). The use of xylanases in wheat-
based diets reduced the viscosity of digesta by 30% and 50% in studies by Wu et al. (2004)
51
and Steenfeldt et al. (1998), respectively. Reducing digesta viscosity for poultry using
carbohydrases is important because in a recent review, Adeola and Cowieson (2011) noted
that the benefits derived from a reduction in digesta viscosity are often greater than
improvement in energy utilisation and the effect of digesta viscosity are usually more
pronounced in poultry compared to most other monogastrics.
The few studies examining the efficacy of exogenous enzymes for improving the nutritive
value of DDGS have focused entirely on maize-DDGS, whereas wheat is expected to contain
higher levels of arabinoxylans than maize. In a study investigating the effect of supplemental
xylanase on growth performance and nutrient digestibility in broilers, Liu et al. (2011)
reported an increase of 20% and 620 MJ/kg in the dissapearance of hemicelluloses and ME
respectively in maize-DDGS diets with supplemental xylanase. Addition of an NSP
hydrolysing enzyme to a 20% maize-DDGS diet for broilers increased the SID of all AA and
AME of ME-deficient diets in a study by Lee et al. (2010). Similarly, Emiola et al. (2009)
observed improvement in AA digestibility in pigs using a multi-carbohydrase supplemented
DDGS diet. Overall, it appears that supplementing a diet containing DDGS with an enzyme
mixture containing carbohydrases and protease may help mitigate the negative effects of fibre
in DDGS, thus improve its nutritional value and encourage its use for poultry.
1.9.1.2 Phytases
Phytase (myo-inositol hexakisphosphate phosphohydrolases) catalyzes the hydrolysis of
phytate into myo-inositol and free phosphates. Phytases can be classified into 3-phytase (EC
3.1.3.8), 5-phytase or 6-phytase (EC 3.1.3.26) depending on where dephosphorylation begins
(Selle and Ravindran, 2007), but the two most common in nature are the 3- and 6-phytases. A
3-phytase initiates catalysis by removing the phosphate in the carbon 3 position, whereas a 6-
phytase begins with the phosphate in the carbon 6 position. Both types of phytase are
effective at removing the phosphate groups, with the exception of the axial phosphate in the
second position. The use of phytases in animal diets is not new; a plethora of studies have
documented the value of exogenous phytases in releasing phytate bound P and improving P
utilisation for both poultry and swine. Generally, most of these studies focused more on
determining the ability of phytase to replace inorganic P supplementation. Responses of
interest have included BWG, feed intake, feed efficiency (Ravindran et al., 2001; Selle et al.,
2007; Letourneau-Montminy et al., 2008; Olukosi et al., 2008a) tibia, femur or toe breaking
strength and ash content (Ravindran et al., 2001; Martinez-Amezcua et al., 2006), and egg
production in layers (Wu et al., 2006). Phytase activity is defined as fytase units (FTU),
52
where 1 fytase unit is defined as the quantity of enzyme required to liberate 1 μmol inorganic
orthophosphate/min at pH 5.5 from an excess of 15 μM-sodium phytate at 37 oC.
Phytate is thought to negatively affect the digestibility of energy and AA. Selle and Ravindran
(2008), proposed three possible mechanisms by which these negative effects may occur. First,
phytate may form a binary protein-phytate complex, which would cause protein to be excreted
along with the phytate bound P. Second, phytate may increase endogenous AA flows, which
will reduce the AID of AA. Third, intestinal absorption of AA may be compromised by the
presence of phytate in the gut lumen because AA may bind to the phytate molecule, which
cannot be absorbed. However, the response in AA or protein digestibility with phytase
supplementation is not consistent. Some studies have reported improvements in CP and AA to
phytase supplementation of diets for poultry (Yi et al., 1996; Rutherford et al., 2002;
Martinez-Amezcua et al., 2006; Ravindran et al., 2006; Selle et al., 2006, 2007), whereas
others have found no benefits (Biehl and Baker, 1997; Ravindran et al., 1999; Augspurger
and Baker, 2004). Further importance of phytase in improving DM and energy utilisation for
poultry has also been evaluated. Ravindran et al. (2001) demonstrated that increasing the level
of supplemental phytase to Lys deficient diets increased AME in addition to improving the
digestibility of CP and AA in broilers. The authors further calculated that phytase
supplementation in that experiment was the equivalent to adding 0.074% Lys to the diet.
There are only few studies that have assessed the use of microbial phytase in diets containing
DDGS, more focus have been on multi-enzyme complexes (combination of xylanase,
amylase, protease and phytase). Although available P in DDGS is greater than in many other
plant feedstuffs, more than 25% of the P is still thought to be non-bioavailable (Martinez-
Amezcua et al., 2004). Martinez-Amezcua et al. (2006) conducted 3 experiments to determine
the effects of phytase and citric acid in releasing phytate-P in diets containing maize-DDGS,
and on AMEn and AA digestibility in New Hampshire x Columbian chicks. In the first
experiment, phytase increased tibia ash but had no effect on AMEn, phytase supplementation
increased AID of AA in the second experiment, whereas a combination of phytase and citric
acid increased tibia ash in the third experiment. Improvements in the coefficient of apparent
ileal dry matter digestibility was reported by Olukosi et al. (2010) in broilers fed diets
containing 10% maize-DDGS supplemented with a phytase. There are few studies in the
literature that have determined the benefits of supplemental phytase in diets containing
DDGS. Although the levels of phytate-bound P in DDGS have been reported to be low due to
phytate hydrolysis by yeast phytase during the fermentation process (Liu, 2011), birds may
benefit from “extra-phosphoric” effects of supplemental phytase. Apart from releasing phytate
53
bound P, phytase have also been shown to improve AME, AA and mineral digestibility in the
diet for poultry (Ravindran et al., 2001). Nonetheless, the extra-phosphoric effects of phytase
are generally inconsistent in the literature and require further investigation.
1.9.1.3 Proteases
Protease refers to a group of enzymes whose catalytic function is to hydrolyze peptide bonds
of proteins. Over the years, the use of proteases as feed additives has been a regular practice
in cereal-based diets usually as an integral part of enzyme admixtures. A number of potential
modes of action have been suggested two of which are: 1) proteases may supplement
endogenous peptidase production, reducing the requirement for AA and energy and 2)
proteases may hydrolyse protein-based anti-nutrients such as lectins or trypsin inhibitors,
improving the efficiency by which the bird utilizes AA and reducing protein turnover (Adeola
and Cowieson, 2011).
The benefits of supplementing proteases in diets containing DDGS may be particularly
significant in view of variability in the quality and quantity of the CP and AA components in
such diets. However, reports of using proteases alone are scarce as they are more often
incorporated as a part of a mix of enzymes. Odetallah et al. (2003) determining the efficacy of
a broad-spectrum protease enzyme (keratinase) in maize-SBM broiler starter diet reported
improved growth performance, BWG and FCR in broiler chicks fed either low or high
amounts of protein. Brenes et al. (1993) similarly observed improved FCR and AME in a
protease-based enzyme preparation fed to chicks and laying hens.
1.9.1.4 Enzyme Combinations
It is reasonable to assume that if carbohydrases can breakdown NSP and elicits beneficial
improvements, a combination with other enzymes (proteases and phytases) exhibiting
different catalytic activities and producing positive effects might improve the scale and
consistency of response. Several studies have reported beneficial effects of supplemental
enzyme admixtures in wheat-, maize- and barley-based poultry diets (Cowieson and Adeola,
2005; Thacker, 2005; Francesch and Geraert, 2009; Olukosi et al., 2007; Olukosi et al.,
2008b; Selle et al., 2009) Therefore, the use of a multi-enzyme complex in diets containing
DDGS may help improve the nutritive worth for poultry and swine. Masa’deh et al. (2010)
reported no negative effect of feeding 30% maize-DDGS in diets of broilers supplemented
with an admixture of enzymes containing phytase, protease, pentosanase, pectinase, cellulase,
beta-glucanase and amylase activities. Jung et al. (2010) evaluated the importance of a
supplemental enzyme admixture (hemicell and Avizyme) on carcass characteristics and
54
performance of broilers fed diets containing 12% maize-DDGS and observed improvements
in BWG and FCR. In Olukosi et al. (2010) study, the use of phytase alone improved nutrient
utilisation in broilers fed 10% maize-DDGS in their diets but a combination of enzymes
(phytase, carbohydrases and protease) did not produce greater benefits than using the phytase
alone.
1.9.1.5 Effect of Diet and Exogenous Enzymes on Gut Morphology
The efficiency of digestion and absorption of dietary nutrients by poultry is affected by the
development and health of the gastrointestinal tract. The physical and chemical characteristics
of the diet have been reported to have an effect on the morphology of the small intestinal
absorptive structure (Smits and Annison, 1996). The changes to the morphology of the
gastrointestinal tract are often due to the presence of toxins or the anti-nutritive effects of
dietary fibre. (Smits and Annison, 1996). Short villi are an indication of less surface area for
nutrient absorption. The crypt depth may give an indication of the rate of cell proliferation
and an increase in crypt depth is an indication of faster cell turnover and greater metabolic
cost for cell replacement (Yang et al., 2008; Rebole et al. 2010). Exogenous enzymes may be
used in diets containing wheat-DDGS for poultry to ameliorate the anti-nutritive effects of
dietary fibre which may lead to improvements in the small intestinal absorptive structure.
However, the effect of exogenous enzymes on gastrointestinal tract morphology of broilers
has not been consistent. Mathlouthi et al. (2002) reported improvements in the gut
morphology of broilers with xylanase supplementation of a rye-based diet whereas Yang et al.
(2008) noted that supplemental xylanase did not affect jejunal villi height but reduced crypt
depth of broilers receiving a wheat-SBM based diet at seven days of age. Using supplemental
phytase, Wu et al. (2004) noted an increase in duodenal villi height but no effect on crypt
depth in broilers at 21 days of age. In the study of Iji et al. (2001) there was no effect of
xylanase on gut morphology of broilers receiving a wheat-based diet in their study. The
responses noted in the studies described above indicate that the effect of exogenous enzymes
on cellular development of the gastrointestibnal tract structure is inconsistent and requires
further investigation.
1.9.2 Fractionation
Fractionation is designed to separate or reduce the CF fraction in DDGS consequently
reducing NSP content, increasing the concentration of energy and other nutrients in the
product. Based on a study by Kim et al. (2010), the CF fraction of DDGS can be successfully
removed before fermentation or in the finished product by two newly developed processing
55
technologies namely; the enzymatic milling (E-mill) or the elusieve process. The E-mill
process uses proteases and starch-degrading enzymes to separate the non-fermentable fibre
and germ before fermentation which consequently creates a modified DDGS low in fibre and
increased in protein content. On the other hand, the elusieve method involves the recovery of
the fibre fraction from DDGS by sieving into different size categories. This process is usually
performed by elutriating fibre components via different air velocities and as expected both
methods produced DDGS that was higher in CP and lower in CF content in this study (Kim et
al., 2010). Digestibility studies using precision-fed caecectomized roosters showed an
increase in the TMEn and AA digestibility for both methods compared to conventional
DDGS, although digestibility was greater with the E-mill method (Kim et al., 2010).
Extrusion is another processing technology that could increase the nutritional value of DDGS
by physical disruption of cell walls and cleavage of NSP into smaller fragments as
demonstrated by Oryschak et al. (2010). This process involves the combined treatments of
moisture, pressure, temperature and mechanical shear using a single or twin screw extruder.
In the study by Oryschak et al. (2010), extrusion of maize-DDGS significantly increased the
AID of all AA with Lys, Thr, Val and Arg increased by 31, 26, 23 and 21% respectively at
15% inclusion rate in broiler diets. A similar trend in improvement in nutrient digestibility
was also recorded at 30% dietary inclusion of extruded wheat-DDGS. Parsons et al. (2006)
compared the nutritional value of maize-DDGS as affected by different processing techniques
reported in literature. The processes evaluated were namely; the modified dry grind process,
the quick germ-quick fibre process (these two processes are slight modifications of the E-mill
process earlier described) and the elusieve process. Although the authors observed higher CP
and lower CF contents in maize-DDGS from all methods of processing compared to
conventional maize-DDGS, digestibility results using caecectomized roosters assay indicated
that processing method had little or no effect on the digestibility of AA in the processed
maize-DDGS samples. It was generally reported in the literature that removing the fibre
fraction in DDGS increases its nutritional value for poultry. However, the fractionation
processes currently available are costly and may increase the cost of DDGS which will defeat
the purpose of using DDGS as a low cost alternative for wheat or maize.
1.10 Knowledge Gaps
The use of maize-/wheat-DDGS for poultry is not new, but a rapid increase in bioethanol
production for fuel is expected in the future and this will increase the quantity of DDGS
available as a feed ingredient for poultry. Because wheat is more available in the UK
compared with other cereal grains, it is the quantity of wheat-DDGS that is projected to
56
increase. However, in comparison to maize-DDGS, the nutritional value of wheat-DDGS is
poorly described for poultry. A review of the literature indicated that the chemical
composition of maize- and wheat-DDGS varies widely among sources and the energy value
and nutrient digestibility also varies among poultry speciess (broilers, turkey, laying hens and
ducks). In addition, only a few studies have assessed the growth and nutrient utilisation
responses of broilers and turkey to enzyme-supplemented diets containing wheat-DDGS. To
facilitate the use of wheat-DDGS as a feed ingredient for poultry, it is essential to determine
its nutritional value for broilers and turkey. Whilst the use of DDGS for pigs is becoming
more popular, the effect of dietary fibre in protein feedstuffs on nutrient digestibility is not
known. Because maize-DDGS will normally contain greater levels of soluble and insoluble
fibre compared with SBM, it is important to evaluate the effect of changes in dietary fibre on
nutrient digestibility for pigs.
1.11 STUDY OBJECTIVES
1. Develop prediction models for nutrients, particularly amino acids (AA), for maize- and
wheat-DDGS
2. Evaluate the energy value and apparent, true or standardized digestibility of AA and P of
wheat-DDGS with and without added enzymes for broilers and turkey
3. Evaluate the growth performance and gastrointestinal tract characteristics of broilers in
response to receiving wheat-DDGS and exogenous enzymes in their diet
4. Determine the effect of dietary fibre type and CP level on ileal amino acids digestibility for
growing pigs.
57
CHAPTER 2
CHEMICAL COMPOSITIONS AND PREDICTION OF AMINO
ACID CONTENT OF MAIZE- AND WHEAT DISTILLER’S
DRIED GRAINS WITH SOLUBLES
58
2.1 INTRODUCTION
The main co-product of producing ethanol from cereal grains by the dry-grind process is
Distillers Dried Grains with Solubles (DDGS). Because the starch fraction of the grain is
converted to ethanol by fermentation, other chemical components in the grain are
concentrated approximately 3-fold in DDGS. The increased concentration of protein, amino
acid (AA) and phosphorus in DDGS is desirable for poultry; however, the use of DDGS as
feedstuff for poultry is limited because its chemical composition varies widely among
sources. Whilst the chemical composition of DDGS is generally characteristic of the grain
(maize, wheat, triticale, sorghum or combination of these) from which it is produced (Zijlstra
et al., 2007), variability in the AA (Fastinger et al., 2006), P (Belyea et al., 2004) and gross
energy (Cozannet et al., 2010a) contents of DDGS when the same type of grain is used have
been reported.
A number of factors that include variations in the chemical composition of the grain,
differences in processing techniques among bioethanol plants, and differences in analytical
methods may act singly or in combination to cause variability in the chemical composition of
DDGS. In addition, the DDGS produced by newly constructed fuel-ethanol plants may differ
in chemical composition to the DDGS produced by beverage-alcohol manufacturers due to
differences and improvements in the technique and efficiency of fermentation. However,
although the variability in the chemical composition of maize- and wheat-DDGS amongst
sources is well documented in literature (Cozannet et al., 2010b; Fastinger et al., 2006;
Belyea et al., 2004), majority of these descriptions are often based on data collected from
relatively few (less than 10) and closely related bioethanol plants.
For the purpose of rapid assessment of the nutritive value of DDGS, it is necessary to develop
reliable predictions of the individual or total amino acids from the chemical composition of
the DDGS, such prediction equations are lacking in the literature. Prediction models have
been employed to determine the indispensable amino acids (IAA) (Fiene et al., 2006) and
total amino acids (TAA) (Roush and Cravener, 1997) contents in feedstuffs based on their
chemical compositions. Therefore, the objective of this study was to evaluate the relationship
between the chemical components of maize- and wheat-DDGS and to develop prediction
equations for individual IAA, total indispensable amino acid (TIAA) and TAA contents using
their nutrient composition data.
59
2.2 MATERIALS AND METHODS
2.2.1 Data Collection and Statistical Analyses
Nutrient composition data of maize- and wheat-DDGS were compiled from 52 recently
published literatures and summarised. All data analyses were done using Genstat 11 (VSN
International, 2008). Correlations among chemical components and the associated probability
values for maize- and wheat-DDGS were determined. Prediction models for determining the
IAA, TIAA and TAA contents of maize- and wheat-DDGS from their crude protein (CP) and
AA contents were developed using stepwise multiple regression analysis. Maximum
improvement in adjusted r2
(adj r2) and reduction in Mallows Cp were the model selection
criteria. The best model subset for each response variable was identified using a balance
between maximum improvement in adj r2, lowest Cp value and lowest number of explanatory
variables possible.
The adj r2 indicates the best of a number of models based on the largest variance explained
and unlike r2, adj r
2 increases only if the addition of an extra predictor variable improves the
model more than would be expected by chance. Mallows Cp is a useful tool for selecting
among many alternative subset regressions by comparing the error sums of squares. This
criterion helps eliminate the effect of multicollinearity among predictor variables and over-
fitting of the regression model. Within each combination of subsets, the model with the least
Cp value (or ideally with Cp equal to or less than the number of explanatory variables) is
considered the best and least biased.
For a linear regression model fitted to a data set with relatively small number of observations,
the presence of an outlier may cause severe distortion to the fitted regression line and may
improperly suggest a lack of fit. Therefore, in this study, data points with high standardised
residuals (outliers) and high leverage (influential points) were removed and the data re-
analysed. The difference between the estimated regression coefficients based on all data
points and the regression coefficients when outlying points are removed, denoted as
DFBETAS, was used to measure the influence of the outlying cases on the fit of the
regression line. Generally, a large value of DFBETAS (greater than 1) is indicative of a large
influence. In cases where the distribution of error terms was unequal, transformation of the
dependent variable (using the square root in the regression equation) was used to normalise
the error variances. Model validation was performed using information from a data set that
was not used in developing the models.
60
2.3 RESULTS
The range, mean, SD and CV (%) of the chemical and amino acids compositions of maize-
and wheat-DDGS are presented in Tables 2-1 and 2-2, respectively. For maize-DDGS, ADF
and Ca were the most variable (CV; 24.2 and 53.5% respectively) in maize-DDGS whereas
CP was the least variable (CV = 8.51%). The order of variability for the chemical components
in maize-DDGS from highest to lowest was; Ca > ADF > EE > NDF > crude fibre (CF) > Ash
> total P > CP. Amongst the chemical components in wheat-DDGS (Table 2-2), CP was the
least variable (CV = 10.8) whereas ADF and Ca were the most variable (CV = 37.8 and
31.5% respectively). For wheat-DDGS, the components varied from highest to lowest in the
following order; ADF > Ca > NDF > EE > Total P > Ash > CF > CP.
Of the AA in maize-DDGS, Glu, Lys and Met were most variable, whereas, Thr, Leu and Val
were the least variable (Table 2-2). In line with the CV values, the AA in wheat-DDGS that
were most variable are Lys, Cys and Phe, whereas, Trp, Thr and Asp were the least variable
(Table 2-2). The TIAA contents (% DM) in maize- and wheat-DDGS were 11.63 and 12.56,
respectively, corresponding TAA contents (% DM) for maize and wheat-DDGS were 24.47
and 32.94, respectively (data not shown). In addition, on the average (% DM), maize-DDGS
contained more Leu and Lys whereas mean values for all remaining IAA were higher in
wheat-DDGS. The correlation coefficients for the chemical compositions in wheat-DDGS are
presented in Table 2-3. There were positive correlations (P < 0.05) between CP and CF (r =
0.46), CP and NDF (r = 0.61), CP and Ca (r = 0.56), and CP and ash (r = 0.45) contents of
maize-DDGS (data not shown). Also in maize-DDGS, there was a positive correlation (P <
0.01) between ash and CF, the r being 0.59 (data not shown). There were trends for negative
correlations between EE and CP as well as ADF (P < 0.10), with EE explaining 49 and 60%
of the variations in CP and ADF respectively. The correlation matrix for correlations between
CP, IAA, TIAA and TAA of maize-DDGS is presented in Tables 2-4. Except for Arg, Ile, Lys
and Trp, there were positive correlations (P < 0.05) between CP and other IAA. In addition,
there were positive correlations (P < 0.01) between all IAA (except Trp) and TIAA as well as
TAA in maize-DDGS with r ranging from 0.58 to 0.96. The correlation matrix for correlations
between CP, IAA and TIAA in wheat-DDGS is presented in Tables 2-5.
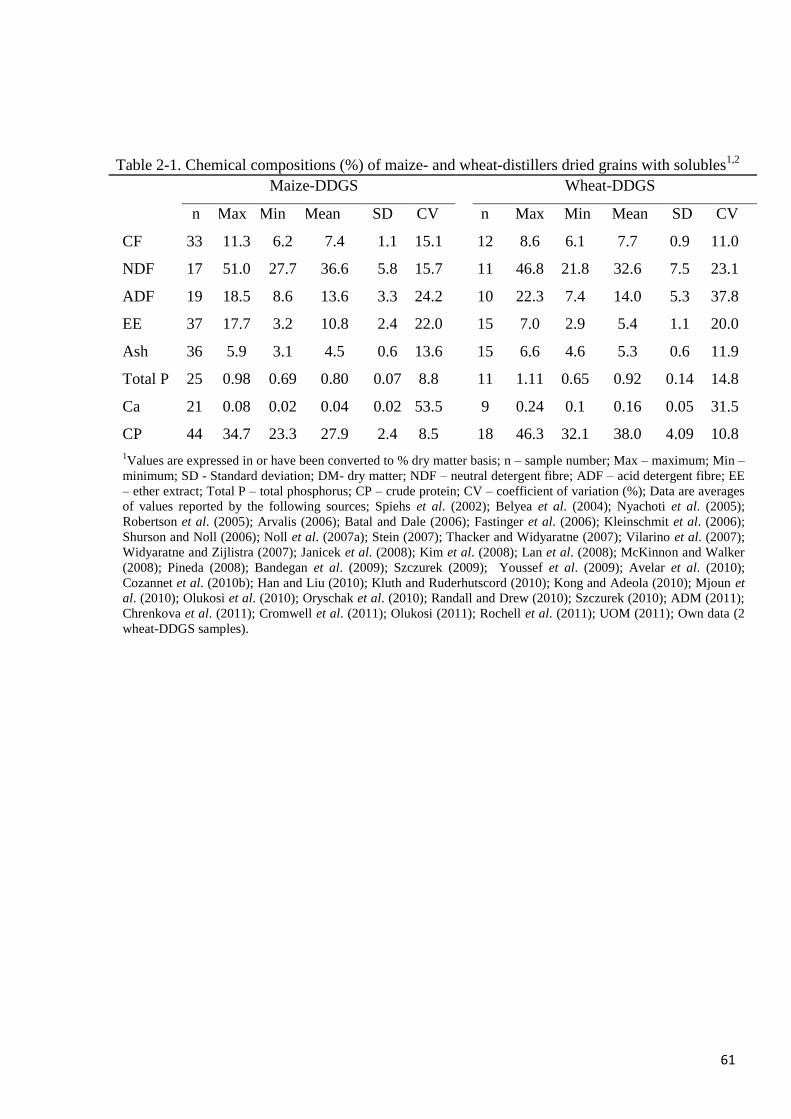
61
1Values are expressed in or have been converted to % dry matter basis; n – sample number; Max – maximum; Min –
minimum; SD - Standard deviation; DM- dry matter; NDF – neutral detergent fibre; ADF – acid detergent fibre; EE
– ether extract; Total P – total phosphorus; CP – crude protein; CV – coefficient of variation (%); Data are averages
of values reported by the following sources; Spiehs et al. (2002); Belyea et al. (2004); Nyachoti et al. (2005);
Robertson et al. (2005); Arvalis (2006); Batal and Dale (2006); Fastinger et al. (2006); Kleinschmit et al. (2006);
Shurson and Noll (2006); Noll et al. (2007a); Stein (2007); Thacker and Widyaratne (2007); Vilarino et al. (2007);
Widyaratne and Zijlistra (2007); Janicek et al. (2008); Kim et al. (2008); Lan et al. (2008); McKinnon and Walker
(2008); Pineda (2008); Bandegan et al. (2009); Szczurek (2009); Youssef et al. (2009); Avelar et al. (2010);
Cozannet et al. (2010b); Han and Liu (2010); Kluth and Ruderhutscord (2010); Kong and Adeola (2010); Mjoun et
al. (2010); Olukosi et al. (2010); Oryschak et al. (2010); Randall and Drew (2010); Szczurek (2010); ADM (2011);
Chrenkova et al. (2011); Cromwell et al. (2011); Olukosi (2011); Rochell et al. (2011); UOM (2011); Own data (2
wheat-DDGS samples).
Table 2-1. Chemical compositions (%) of maize- and wheat-distillers dried grains with solubles1,2
Maize-DDGS Wheat-DDGS
n Max Min Mean SD CV n Max Min Mean SD CV
CF 33 11.3 6.2 7.4 1.1 15.1 12 8.6 6.1 7.7 0.9 11.0
NDF 17 51.0 27.7 36.6 5.8 15.7 11 46.8 21.8 32.6 7.5 23.1
ADF 19 18.5 8.6 13.6 3.3 24.2 10 22.3 7.4 14.0 5.3 37.8
EE 37 17.7 3.2 10.8 2.4 22.0 15 7.0 2.9 5.4 1.1 20.0
Ash 36 5.9 3.1 4.5 0.6 13.6 15 6.6 4.6 5.3 0.6 11.9
Total P 25 0.98 0.69 0.80 0.07 8.8 11 1.11 0.65 0.92 0.14 14.8
Ca 21 0.08 0.02 0.04 0.02 53.5 9 0.24 0.1 0.16 0.05 31.5
CP 44 34.7 23.3 27.9 2.4 8.5 18 46.3 32.1 38.0 4.09 10.8
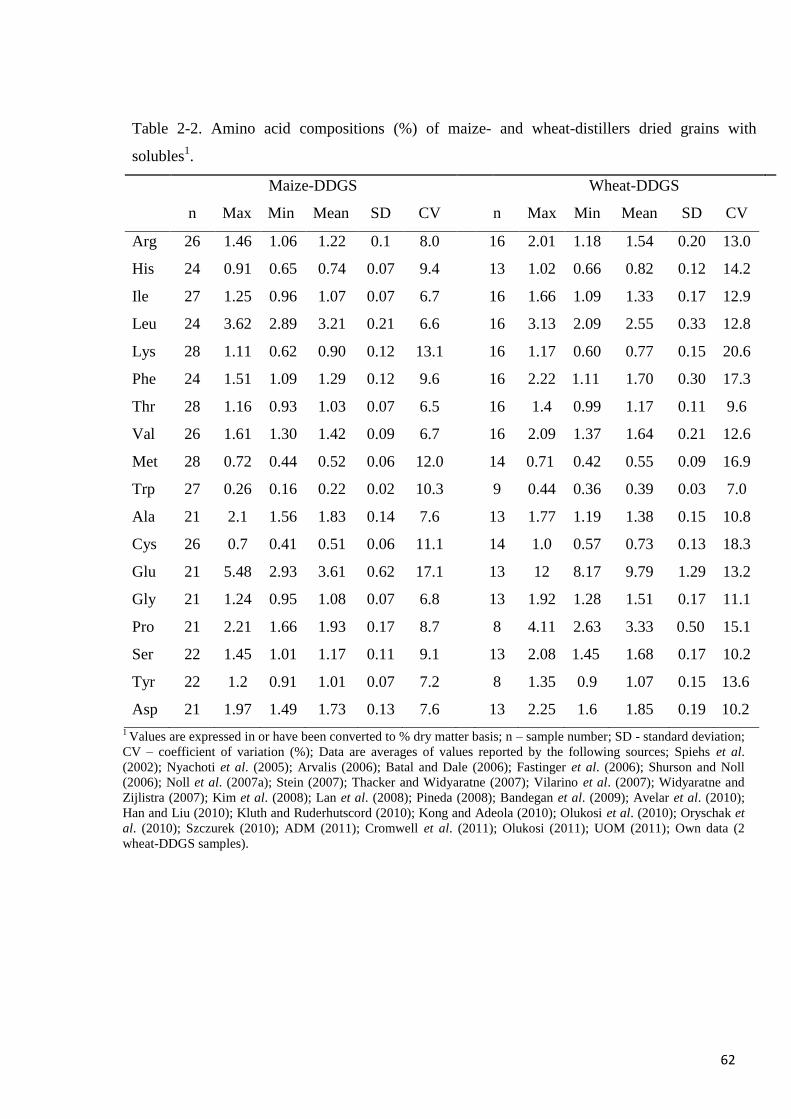
62
1 Values are expressed in or have been converted to % dry matter basis; n – sample number; SD - standard deviation;
CV – coefficient of variation (%); Data are averages of values reported by the following sources; Spiehs et al.
(2002); Nyachoti et al. (2005); Arvalis (2006); Batal and Dale (2006); Fastinger et al. (2006); Shurson and Noll
(2006); Noll et al. (2007a); Stein (2007); Thacker and Widyaratne (2007); Vilarino et al. (2007); Widyaratne and
Zijlistra (2007); Kim et al. (2008); Lan et al. (2008); Pineda (2008); Bandegan et al. (2009); Avelar et al. (2010);
Han and Liu (2010); Kluth and Ruderhutscord (2010); Kong and Adeola (2010); Olukosi et al. (2010); Oryschak et
al. (2010); Szczurek (2010); ADM (2011); Cromwell et al. (2011); Olukosi (2011); UOM (2011); Own data (2
wheat-DDGS samples).
Table 2-2. Amino acid compositions (%) of maize- and wheat-distillers dried grains with
solubles1.
Maize-DDGS Wheat-DDGS
n Max Min Mean SD CV n Max Min Mean SD CV
Arg 26 1.46 1.06 1.22 0.1 8.0 16 2.01 1.18 1.54 0.20 13.0
His 24 0.91 0.65 0.74 0.07 9.4 13 1.02 0.66 0.82 0.12 14.2
Ile 27 1.25 0.96 1.07 0.07 6.7 16 1.66 1.09 1.33 0.17 12.9
Leu 24 3.62 2.89 3.21 0.21 6.6 16 3.13 2.09 2.55 0.33 12.8
Lys 28 1.11 0.62 0.90 0.12 13.1 16 1.17 0.60 0.77 0.15 20.6
Phe 24 1.51 1.09 1.29 0.12 9.6 16 2.22 1.11 1.70 0.30 17.3
Thr 28 1.16 0.93 1.03 0.07 6.5 16 1.4 0.99 1.17 0.11 9.6
Val 26 1.61 1.30 1.42 0.09 6.7 16 2.09 1.37 1.64 0.21 12.6
Met 28 0.72 0.44 0.52 0.06 12.0 14 0.71 0.42 0.55 0.09 16.9
Trp 27 0.26 0.16 0.22 0.02 10.3 9 0.44 0.36 0.39 0.03 7.0
Ala 21 2.1 1.56 1.83 0.14 7.6 13 1.77 1.19 1.38 0.15 10.8
Cys 26 0.7 0.41 0.51 0.06 11.1 14 1.0 0.57 0.73 0.13 18.3
Glu 21 5.48 2.93 3.61 0.62 17.1 13 12 8.17 9.79 1.29 13.2
Gly 21 1.24 0.95 1.08 0.07 6.8 13 1.92 1.28 1.51 0.17 11.1
Pro 21 2.21 1.66 1.93 0.17 8.7 8 4.11 2.63 3.33 0.50 15.1
Ser 22 1.45 1.01 1.17 0.11 9.1 13 2.08 1.45 1.68 0.17 10.2
Tyr 22 1.2 0.91 1.01 0.07 7.2 8 1.35 0.9 1.07 0.15 13.6
Asp 21 1.97 1.49 1.73 0.13 7.6 13 2.25 1.6 1.85 0.19 10.2
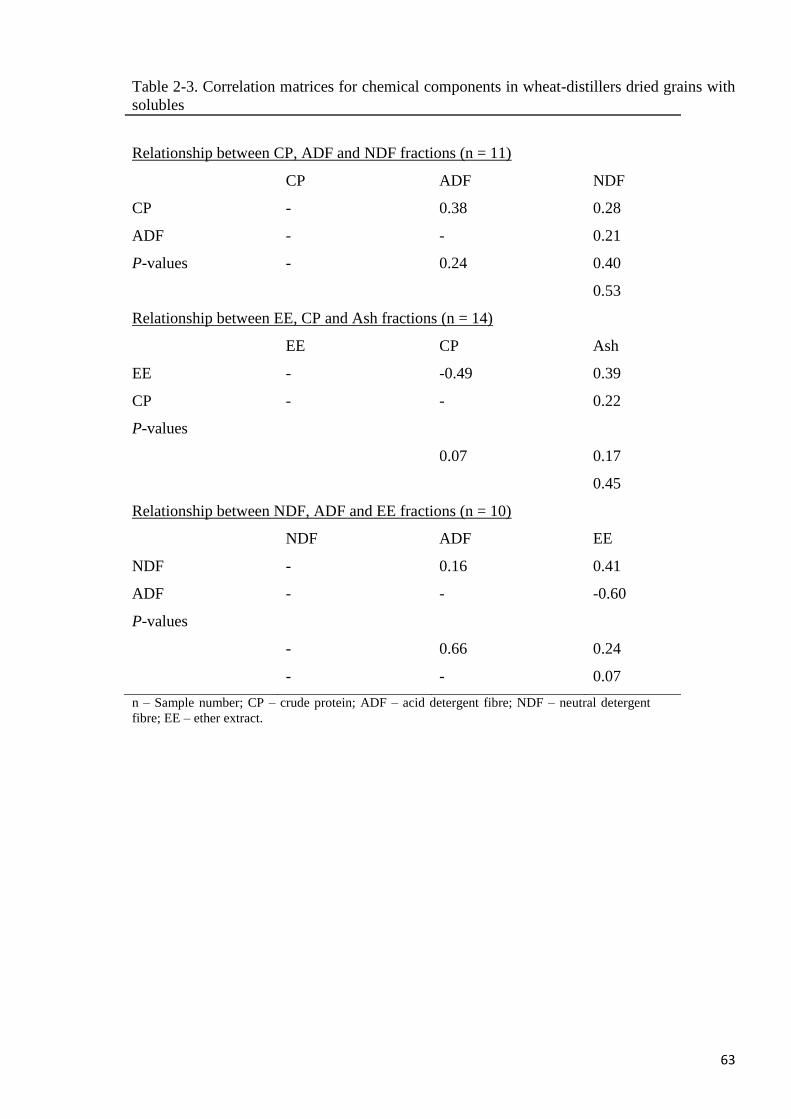
63
Table 2-3. Correlation matrices for chemical components in wheat-distillers dried grains with
solubles
Relationship between CP, ADF and NDF fractions (n = 11)
CP ADF NDF
CP - 0.38 0.28
ADF - - 0.21
P-values - 0.24 0.40
0.53
Relationship between EE, CP and Ash fractions (n = 14)
EE CP Ash
EE - -0.49 0.39
CP - - 0.22
P-values
0.07 0.17
0.45
Relationship between NDF, ADF and EE fractions (n = 10)
NDF ADF EE
NDF - 0.16 0.41
ADF - - -0.60
P-values
- 0.66 0.24
- - 0.07
n – Sample number; CP – crude protein; ADF – acid detergent fibre; NDF – neutral detergent
fibre; EE – ether extract.
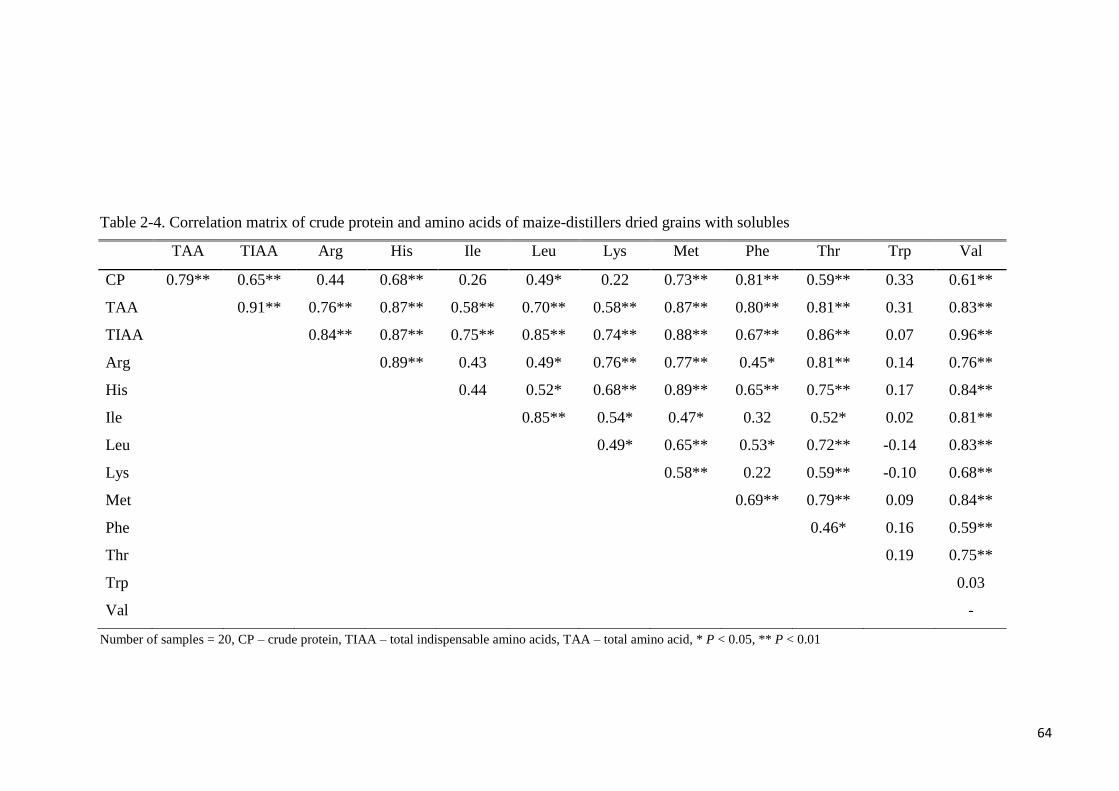
64
Table 2-4. Correlation matrix of crude protein and amino acids of maize-distillers dried grains with solubles
Number of samples = 20, CP – crude protein, TIAA – total indispensable amino acids, TAA – total amino acid, * P < 0.05, ** P < 0.01
TAA TIAA Arg His Ile Leu Lys Met Phe Thr Trp Val
CP 0.79** 0.65** 0.44 0.68** 0.26 0.49* 0.22 0.73** 0.81** 0.59** 0.33 0.61**
TAA 0.91** 0.76** 0.87** 0.58** 0.70** 0.58** 0.87** 0.80** 0.81** 0.31 0.83**
TIAA 0.84** 0.87** 0.75** 0.85** 0.74** 0.88** 0.67** 0.86** 0.07 0.96**
Arg 0.89** 0.43 0.49* 0.76** 0.77** 0.45* 0.81** 0.14 0.76**
His 0.44 0.52* 0.68** 0.89** 0.65** 0.75** 0.17 0.84**
Ile 0.85** 0.54* 0.47* 0.32 0.52* 0.02 0.81**
Leu 0.49* 0.65** 0.53* 0.72** -0.14 0.83**
Lys 0.58** 0.22 0.59** -0.10 0.68**
Met 0.69** 0.79** 0.09 0.84**
Phe 0.46* 0.16 0.59**
Thr 0.19 0.75**
Trp 0.03
Val -
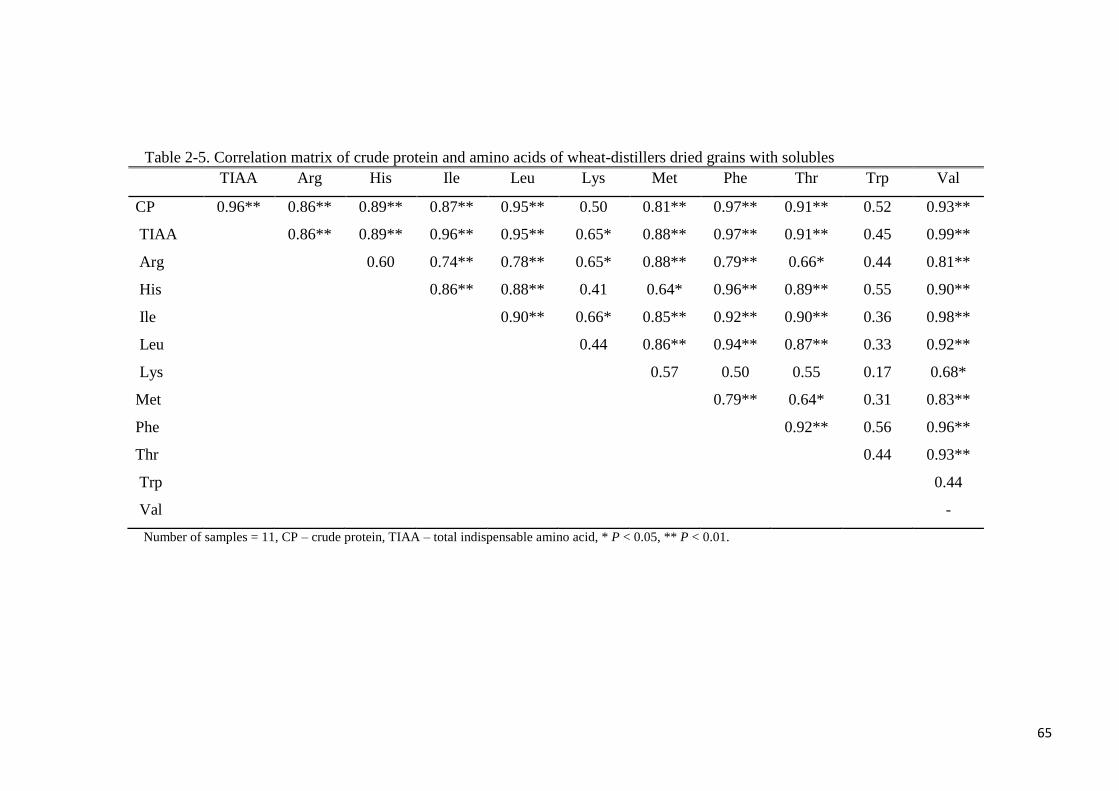
65
Table 2-5. Correlation matrix of crude protein and amino acids of wheat-distillers dried grains with solubles
TIAA Arg His Ile Leu Lys Met Phe Thr Trp Val
CP 0.96** 0.86** 0.89** 0.87** 0.95** 0.50 0.81** 0.97** 0.91** 0.52 0.93**
TIAA 0.86** 0.89** 0.96** 0.95** 0.65* 0.88** 0.97** 0.91** 0.45 0.99**
Arg 0.60 0.74** 0.78** 0.65* 0.88** 0.79** 0.66* 0.44 0.81**
His 0.86** 0.88** 0.41 0.64* 0.96** 0.89** 0.55 0.90**
Ile 0.90** 0.66* 0.85** 0.92** 0.90** 0.36 0.98**
Leu 0.44 0.86** 0.94** 0.87** 0.33 0.92**
Lys 0.57 0.50 0.55 0.17 0.68*
Met 0.79** 0.64* 0.31 0.83**
Phe 0.92** 0.56 0.96**
Thr 0.44 0.93**
Trp 0.44
Val -
Number of samples = 11, CP – crude protein, TIAA – total indispensable amino acid, * P < 0.05, ** P < 0.01.
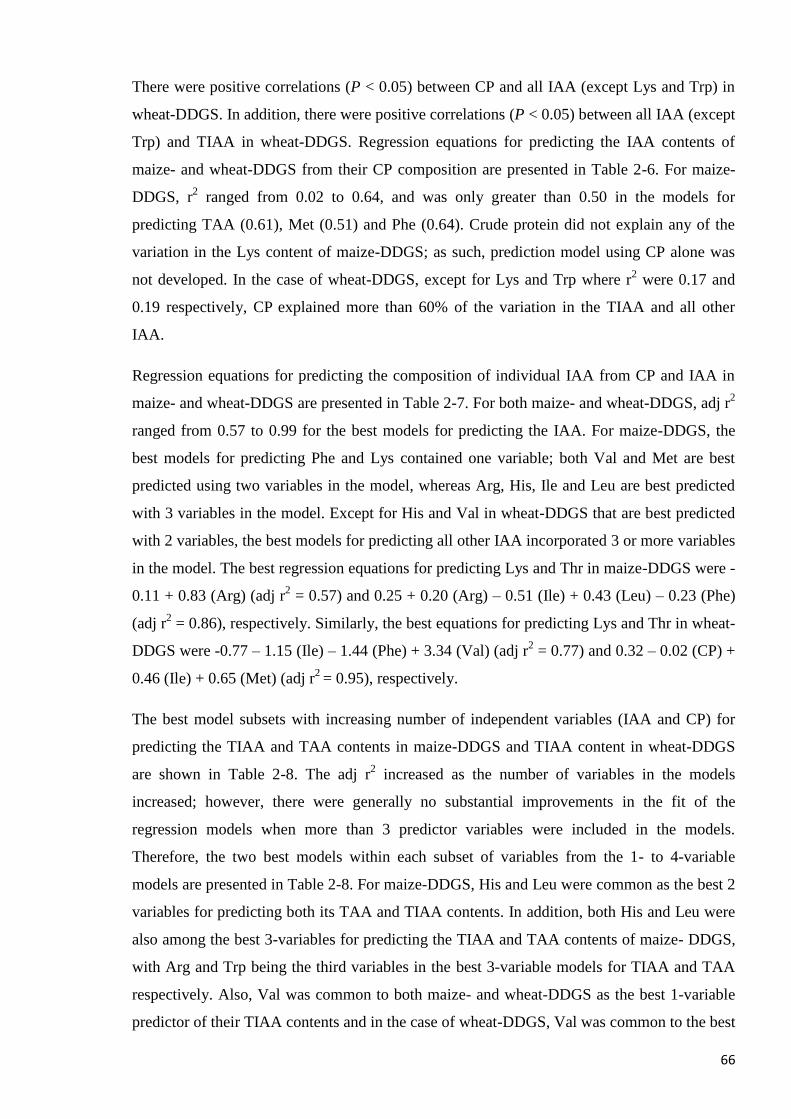
66
There were positive correlations (P < 0.05) between CP and all IAA (except Lys and Trp) in
wheat-DDGS. In addition, there were positive correlations (P < 0.05) between all IAA (except
Trp) and TIAA in wheat-DDGS. Regression equations for predicting the IAA contents of
maize- and wheat-DDGS from their CP composition are presented in Table 2-6. For maize-
DDGS, r2 ranged from 0.02 to 0.64, and was only greater than 0.50 in the models for
predicting TAA (0.61), Met (0.51) and Phe (0.64). Crude protein did not explain any of the
variation in the Lys content of maize-DDGS; as such, prediction model using CP alone was
not developed. In the case of wheat-DDGS, except for Lys and Trp where r2 were 0.17 and
0.19 respectively, CP explained more than 60% of the variation in the TIAA and all other
IAA.
Regression equations for predicting the composition of individual IAA from CP and IAA in
maize- and wheat-DDGS are presented in Table 2-7. For both maize- and wheat-DDGS, adj r2
ranged from 0.57 to 0.99 for the best models for predicting the IAA. For maize-DDGS, the
best models for predicting Phe and Lys contained one variable; both Val and Met are best
predicted using two variables in the model, whereas Arg, His, Ile and Leu are best predicted
with 3 variables in the model. Except for His and Val in wheat-DDGS that are best predicted
with 2 variables, the best models for predicting all other IAA incorporated 3 or more variables
in the model. The best regression equations for predicting Lys and Thr in maize-DDGS were -
0.11 + 0.83 (Arg) (adj r2 = 0.57) and 0.25 + 0.20 (Arg) – 0.51 (Ile) + 0.43 (Leu) – 0.23 (Phe)
(adj r2 = 0.86), respectively. Similarly, the best equations for predicting Lys and Thr in wheat-
DDGS were -0.77 – 1.15 (Ile) – 1.44 (Phe) + 3.34 (Val) (adj r2 = 0.77) and 0.32 – 0.02 (CP) +
0.46 (Ile) + 0.65 (Met) (adj r2
= 0.95), respectively.
The best model subsets with increasing number of independent variables (IAA and CP) for
predicting the TIAA and TAA contents in maize-DDGS and TIAA content in wheat-DDGS
are shown in Table 2-8. The adj r2 increased as the number of variables in the models
increased; however, there were generally no substantial improvements in the fit of the
regression models when more than 3 predictor variables were included in the models.
Therefore, the two best models within each subset of variables from the 1- to 4-variable
models are presented in Table 2-8. For maize-DDGS, His and Leu were common as the best 2
variables for predicting both its TAA and TIAA contents. In addition, both His and Leu were
also among the best 3-variables for predicting the TIAA and TAA contents of maize- DDGS,
with Arg and Trp being the third variables in the best 3-variable models for TIAA and TAA
respectively. Also, Val was common to both maize- and wheat-DDGS as the best 1-variable
predictor of their TIAA contents and in the case of wheat-DDGS, Val was common to the best
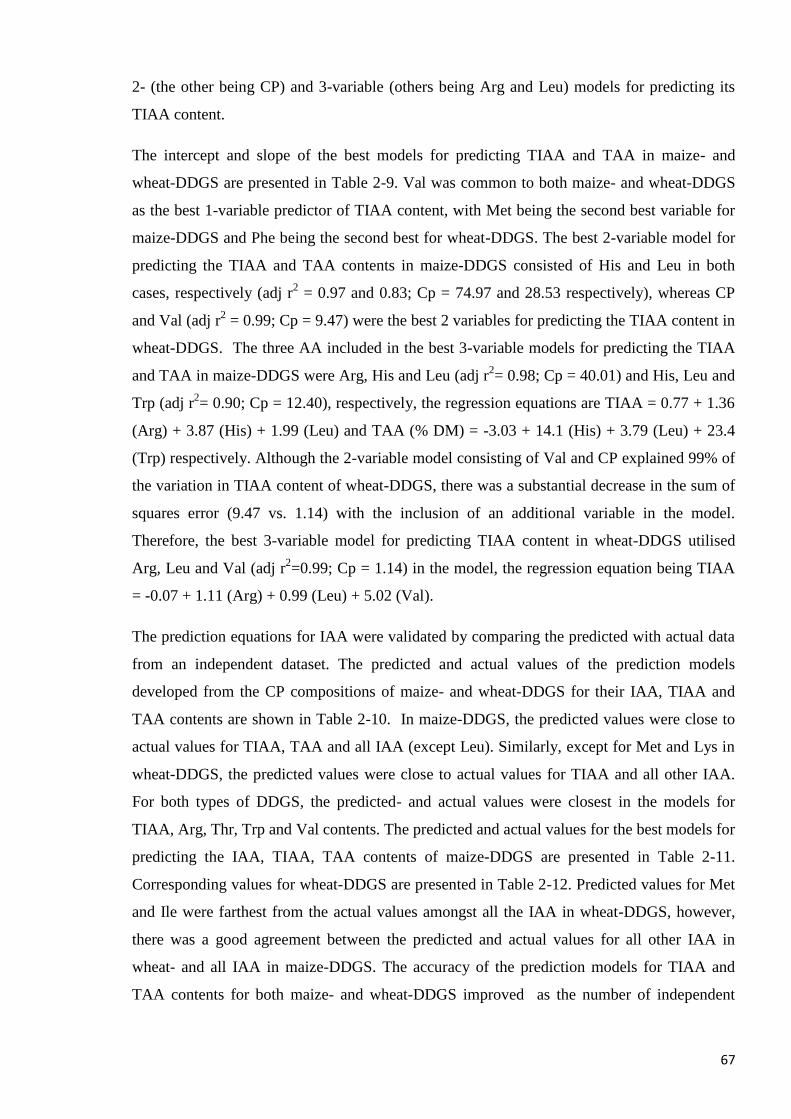
67
2- (the other being CP) and 3-variable (others being Arg and Leu) models for predicting its
TIAA content.
The intercept and slope of the best models for predicting TIAA and TAA in maize- and
wheat-DDGS are presented in Table 2-9. Val was common to both maize- and wheat-DDGS
as the best 1-variable predictor of TIAA content, with Met being the second best variable for
maize-DDGS and Phe being the second best for wheat-DDGS. The best 2-variable model for
predicting the TIAA and TAA contents in maize-DDGS consisted of His and Leu in both
cases, respectively (adj r2 = 0.97 and 0.83; Cp = 74.97 and 28.53 respectively), whereas CP
and Val (adj r2 = 0.99; Cp = 9.47) were the best 2 variables for predicting the TIAA content in
wheat-DDGS. The three AA included in the best 3-variable models for predicting the TIAA
and TAA in maize-DDGS were Arg, His and Leu (adj r2= 0.98; Cp = 40.01) and His, Leu and
Trp (adj r2= 0.90; Cp = 12.40), respectively, the regression equations are TIAA = 0.77 + 1.36
(Arg) + 3.87 (His) + 1.99 (Leu) and TAA (% DM) = -3.03 + 14.1 (His) + 3.79 (Leu) + 23.4
(Trp) respectively. Although the 2-variable model consisting of Val and CP explained 99% of
the variation in TIAA content of wheat-DDGS, there was a substantial decrease in the sum of
squares error (9.47 vs. 1.14) with the inclusion of an additional variable in the model.
Therefore, the best 3-variable model for predicting TIAA content in wheat-DDGS utilised
Arg, Leu and Val (adj r2=0.99; Cp = 1.14) in the model, the regression equation being TIAA
= -0.07 + 1.11 (Arg) + 0.99 (Leu) + 5.02 (Val).
The prediction equations for IAA were validated by comparing the predicted with actual data
from an independent dataset. The predicted and actual values of the prediction models
developed from the CP compositions of maize- and wheat-DDGS for their IAA, TIAA and
TAA contents are shown in Table 2-10. In maize-DDGS, the predicted values were close to
actual values for TIAA, TAA and all IAA (except Leu). Similarly, except for Met and Lys in
wheat-DDGS, the predicted values were close to actual values for TIAA and all other IAA.
For both types of DDGS, the predicted- and actual values were closest in the models for
TIAA, Arg, Thr, Trp and Val contents. The predicted and actual values for the best models for
predicting the IAA, TIAA, TAA contents of maize-DDGS are presented in Table 2-11.
Corresponding values for wheat-DDGS are presented in Table 2-12. Predicted values for Met
and Ile were farthest from the actual values amongst all the IAA in wheat-DDGS, however,
there was a good agreement between the predicted and actual values for all other IAA in
wheat- and all IAA in maize-DDGS. The accuracy of the prediction models for TIAA and
TAA contents for both maize- and wheat-DDGS improved as the number of independent

68
variables in the models increased up to 3; there were no further improvements with addition
of a fourth predictor variable in the models.
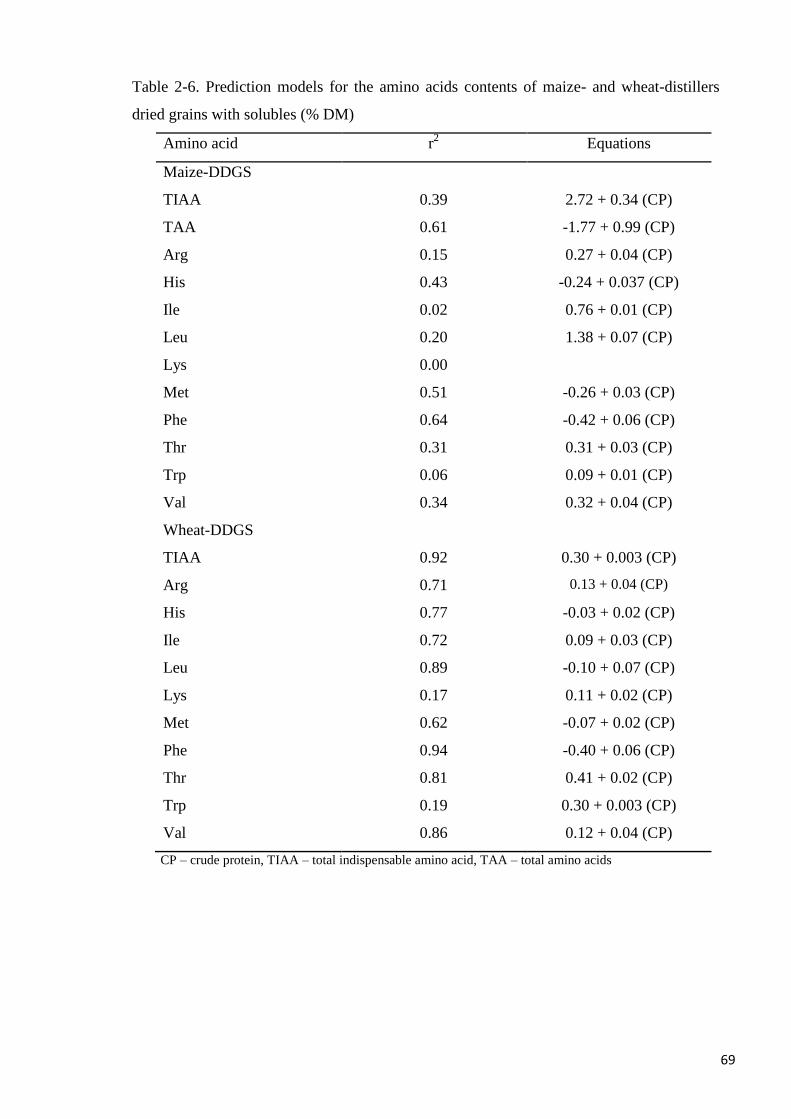
69
Table 2-6. Prediction models for the amino acids contents of maize- and wheat-distillers
dried grains with solubles (% DM)
Amino acid r2 Equations
Maize-DDGS
TIAA 0.39 2.72 + 0.34 (CP)
TAA 0.61 -1.77 + 0.99 (CP)
Arg 0.15 0.27 + 0.04 (CP)
His 0.43 -0.24 + 0.037 (CP)
Ile 0.02 0.76 + 0.01 (CP)
Leu 0.20 1.38 + 0.07 (CP)
Lys 0.00
Met 0.51 -0.26 + 0.03 (CP)
Phe 0.64 -0.42 + 0.06 (CP)
Thr 0.31 0.31 + 0.03 (CP)
Trp 0.06 0.09 + 0.01 (CP)
Val 0.34 0.32 + 0.04 (CP)
Wheat-DDGS
TIAA 0.92 0.30 + 0.003 (CP)
Arg 0.71 0.13 + 0.04 (CP)
His 0.77 -0.03 + 0.02 (CP)
Ile 0.72 0.09 + 0.03 (CP)
Leu 0.89 -0.10 + 0.07 (CP)
Lys 0.17 0.11 + 0.02 (CP)
Met 0.62 -0.07 + 0.02 (CP)
Phe 0.94 -0.40 + 0.06 (CP)
Thr 0.81 0.41 + 0.02 (CP)
Trp 0.19 0.30 + 0.003 (CP)
Val 0.86 0.12 + 0.04 (CP)
CP – crude protein, TIAA – total indispensable amino acid, TAA – total amino acids
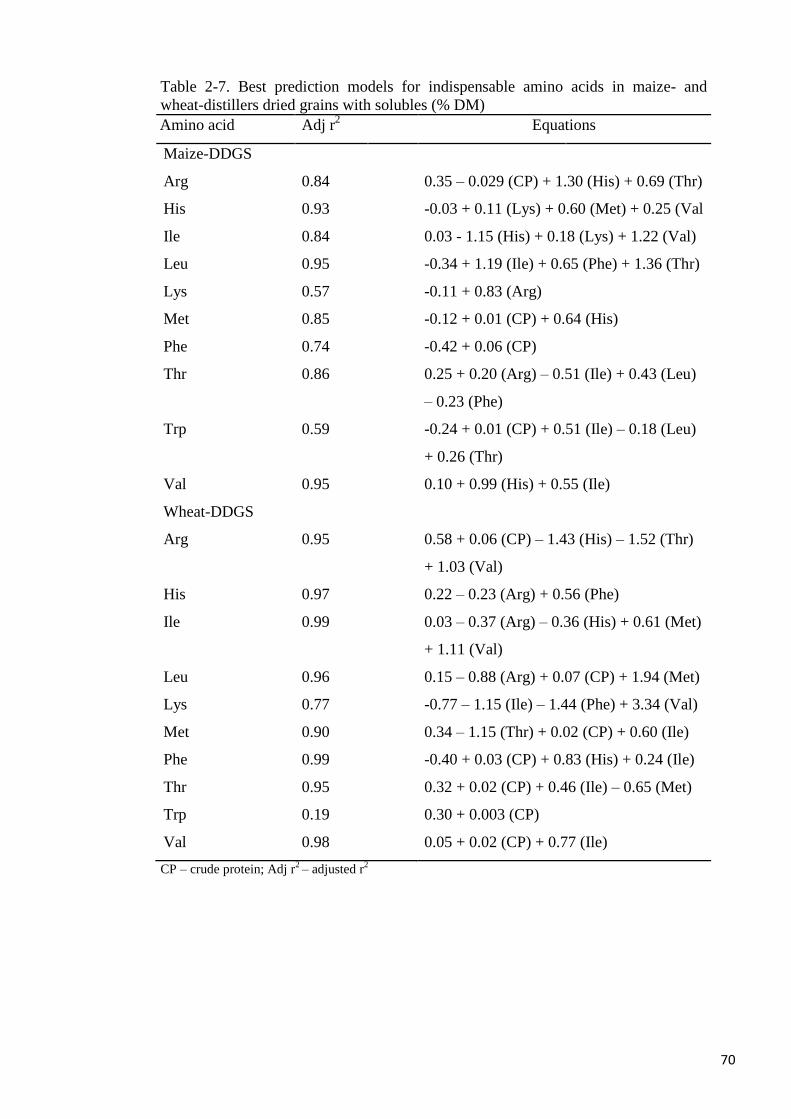
70
Table 2-7. Best prediction models for indispensable amino acids in maize- and
wheat-distillers dried grains with solubles (% DM)
Amino acid Adj r2 Equations
Maize-DDGS
Arg 0.84 0.35 – 0.029 (CP) + 1.30 (His) + 0.69 (Thr)
His 0.93 -0.03 + 0.11 (Lys) + 0.60 (Met) + 0.25 (Val
Ile 0.84 0.03 - 1.15 (His) + 0.18 (Lys) + 1.22 (Val)
Leu 0.95 -0.34 + 1.19 (Ile) + 0.65 (Phe) + 1.36 (Thr)
Lys 0.57 -0.11 + 0.83 (Arg)
Met 0.85 -0.12 + 0.01 (CP) + 0.64 (His)
Phe 0.74 -0.42 + 0.06 (CP)
Thr 0.86 0.25 + 0.20 (Arg) – 0.51 (Ile) + 0.43 (Leu)
– 0.23 (Phe)
Trp 0.59 -0.24 + 0.01 (CP) + 0.51 (Ile) – 0.18 (Leu)
+ 0.26 (Thr)
Val 0.95 0.10 + 0.99 (His) + 0.55 (Ile)
Wheat-DDGS
Arg 0.95 0.58 + 0.06 (CP) – 1.43 (His) – 1.52 (Thr)
+ 1.03 (Val)
His 0.97 0.22 – 0.23 (Arg) + 0.56 (Phe)
Ile 0.99 0.03 – 0.37 (Arg) – 0.36 (His) + 0.61 (Met)
+ 1.11 (Val)
Leu 0.96 0.15 – 0.88 (Arg) + 0.07 (CP) + 1.94 (Met)
Lys 0.77 -0.77 – 1.15 (Ile) – 1.44 (Phe) + 3.34 (Val)
Met 0.90 0.34 – 1.15 (Thr) + 0.02 (CP) + 0.60 (Ile)
Phe 0.99 -0.40 + 0.03 (CP) + 0.83 (His) + 0.24 (Ile)
Thr 0.95 0.32 + 0.02 (CP) + 0.46 (Ile) – 0.65 (Met)
Trp 0.19 0.30 + 0.003 (CP)
Val 0.98 0.05 + 0.02 (CP) + 0.77 (Ile)
CP – crude protein; Adj r2 – adjusted r
2
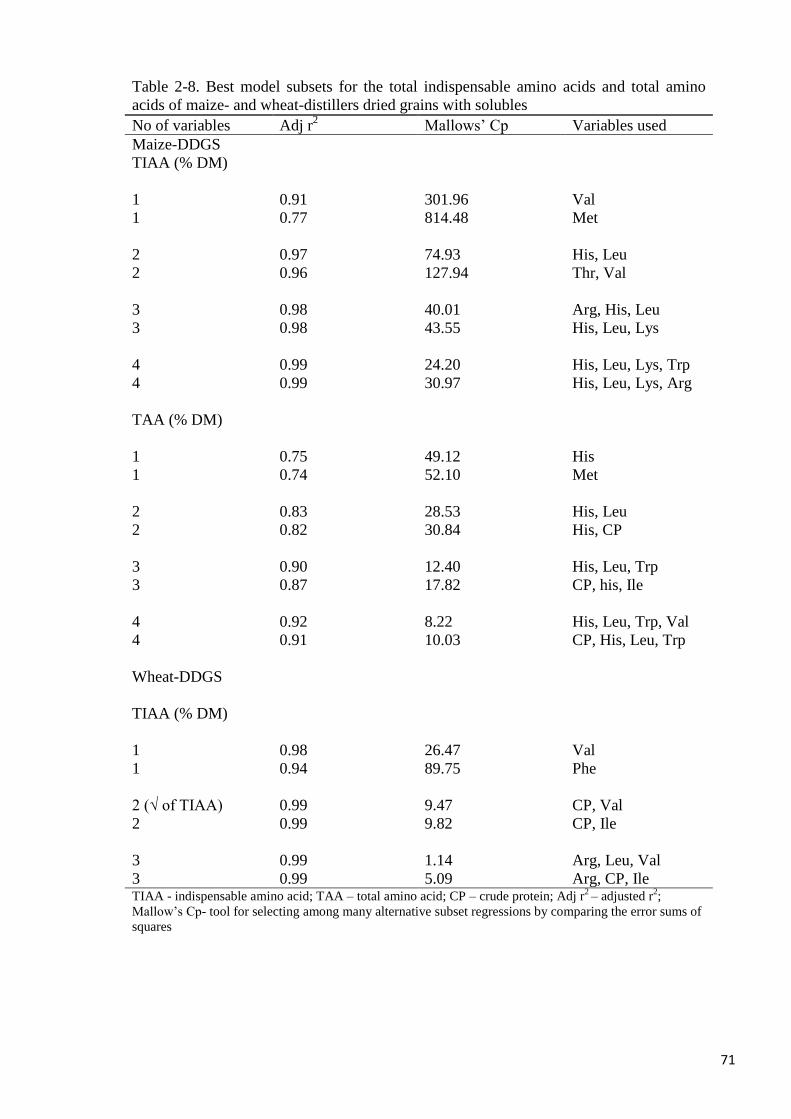
71
Table 2-8. Best model subsets for the total indispensable amino acids and total amino
acids of maize- and wheat-distillers dried grains with solubles
No of variables Adj r2 Mallows’ Cp Variables used
Maize-DDGS
TIAA (% DM)
1 0.91 301.96 Val
1 0.77 814.48 Met
2 0.97 74.93 His, Leu
2 0.96 127.94 Thr, Val
3 0.98 40.01 Arg, His, Leu
3 0.98 43.55 His, Leu, Lys
4 0.99 24.20 His, Leu, Lys, Trp
4 0.99 30.97 His, Leu, Lys, Arg
TAA (% DM)
1 0.75 49.12 His
1 0.74 52.10 Met
2 0.83 28.53 His, Leu
2 0.82 30.84 His, CP
3 0.90 12.40 His, Leu, Trp
3 0.87 17.82 CP, his, Ile
4 0.92 8.22 His, Leu, Trp, Val
4 0.91 10.03 CP, His, Leu, Trp
Wheat-DDGS
TIAA (% DM)
1 0.98 26.47 Val
1 0.94 89.75 Phe
2 (√ of TIAA) 0.99 9.47 CP, Val
2 0.99 9.82 CP, Ile
3 0.99 1.14 Arg, Leu, Val
3 0.99 5.09 Arg, CP, Ile TIAA - indispensable amino acid; TAA – total amino acid; CP – crude protein; Adj r
2 – adjusted r
2;
Mallow’s Cp- tool for selecting among many alternative subset regressions by comparing the error sums of
squares
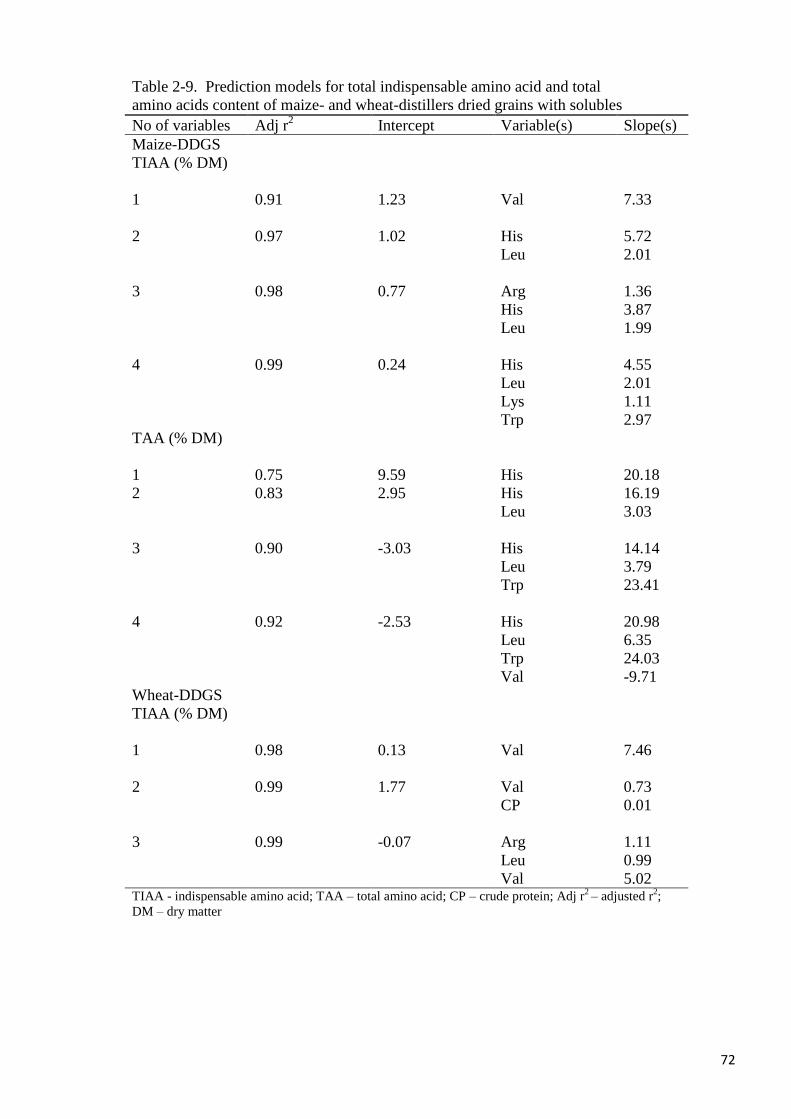
72
Table 2-9. Prediction models for total indispensable amino acid and total
amino acids content of maize- and wheat-distillers dried grains with solubles
No of variables Adj r2 Intercept Variable(s) Slope(s)
Maize-DDGS
TIAA (% DM)
1 0.91 1.23 Val 7.33
2 0.97 1.02 His 5.72
Leu 2.01
3 0.98 0.77 Arg 1.36
His 3.87
Leu 1.99
4 0.99 0.24 His 4.55
Leu 2.01
Lys 1.11
Trp 2.97
TAA (% DM)
1 0.75 9.59 His 20.18
2 0.83 2.95 His 16.19
Leu 3.03
3 0.90 -3.03 His 14.14
Leu 3.79
Trp 23.41
4 0.92 -2.53 His 20.98
Leu 6.35
Trp 24.03
Val -9.71
Wheat-DDGS
TIAA (% DM)
1 0.98 0.13 Val 7.46
2 0.99 1.77 Val 0.73
CP 0.01
3 0.99 -0.07 Arg 1.11
Leu 0.99
Val 5.02 TIAA - indispensable amino acid; TAA – total amino acid; CP – crude protein; Adj r
2 – adjusted r
2;
DM – dry matter
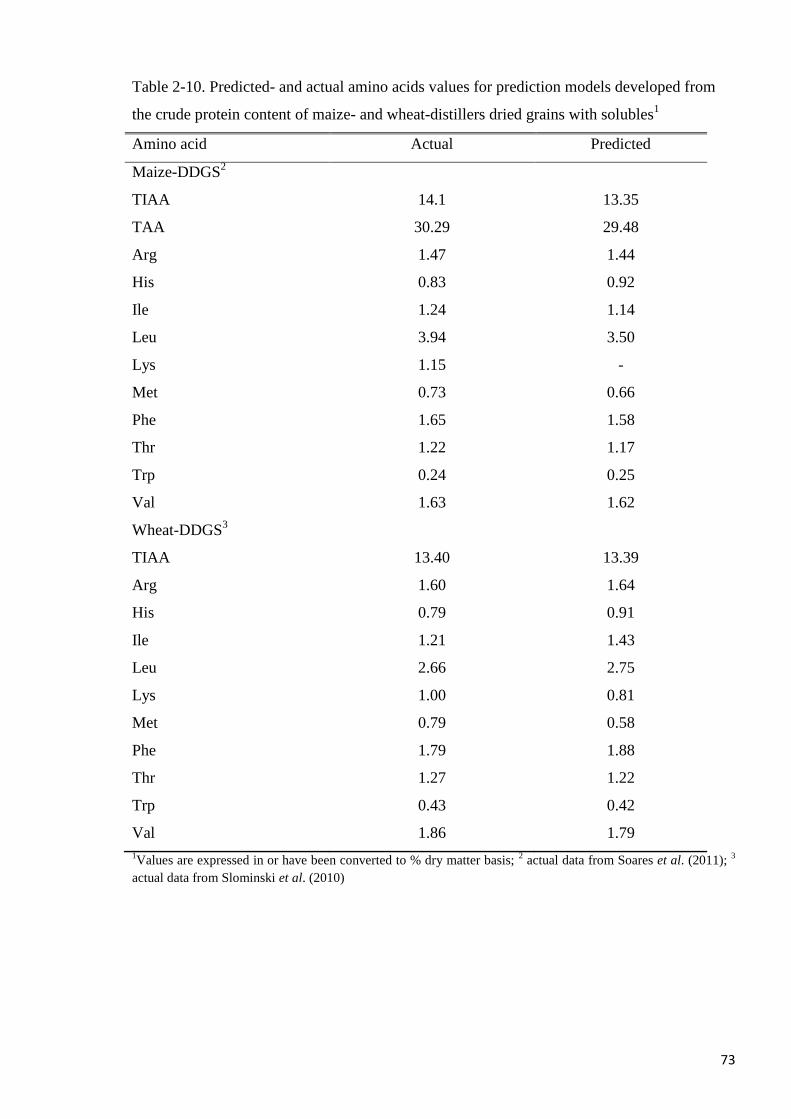
73
Table 2-10. Predicted- and actual amino acids values for prediction models developed from
the crude protein content of maize- and wheat-distillers dried grains with solubles1
Amino acid Actual Predicted
Maize-DDGS2
TIAA
TAA
Arg
His
Ile
Leu
Lys
Met
Phe
Thr
Trp
Val
Wheat-DDGS3
TIAA
Arg
His
Ile
Leu
Lys
Met
Phe
Thr
Trp
Val
14.1
30.29
1.47
0.83
1.24
3.94
1.15
0.73
1.65
1.22
0.24
1.63
13.40
1.60
0.79
1.21
2.66
1.00
0.79
1.79
1.27
0.43
1.86
13.35
29.48
1.44
0.92
1.14
3.50
-
0.66
1.58
1.17
0.25
1.62
13.39
1.64
0.91
1.43
2.75
0.81
0.58
1.88
1.22
0.42
1.79
1Values are expressed in or have been converted to % dry matter basis;
2 actual data from Soares et al. (2011);
3
actual data from Slominski et al. (2010)
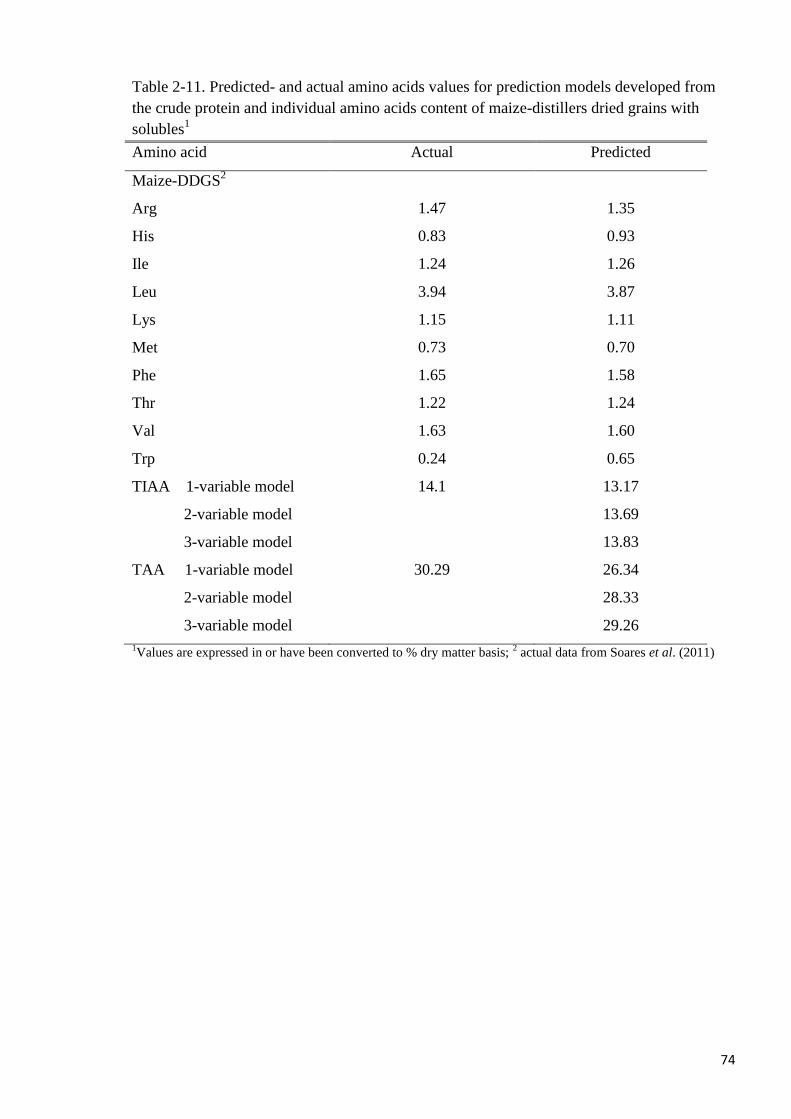
74
Table 2-11. Predicted- and actual amino acids values for prediction models developed from
the crude protein and individual amino acids content of maize-distillers dried grains with
solubles1
Amino acid Actual Predicted
Maize-DDGS2
Arg 1.47 1.35
His 0.83 0.93
Ile 1.24 1.26
Leu 3.94 3.87
Lys 1.15 1.11
Met 0.73 0.70
Phe 1.65 1.58
Thr 1.22 1.24
Val 1.63 1.60
Trp 0.24 0.65
TIAA 1-variable model 14.1 13.17
2-variable model 13.69
3-variable model 13.83
TAA 1-variable model 30.29 26.34
2-variable model 28.33
3-variable model 29.26
1Values are expressed in or have been converted to % dry matter basis;
2 actual data from Soares et al. (2011)
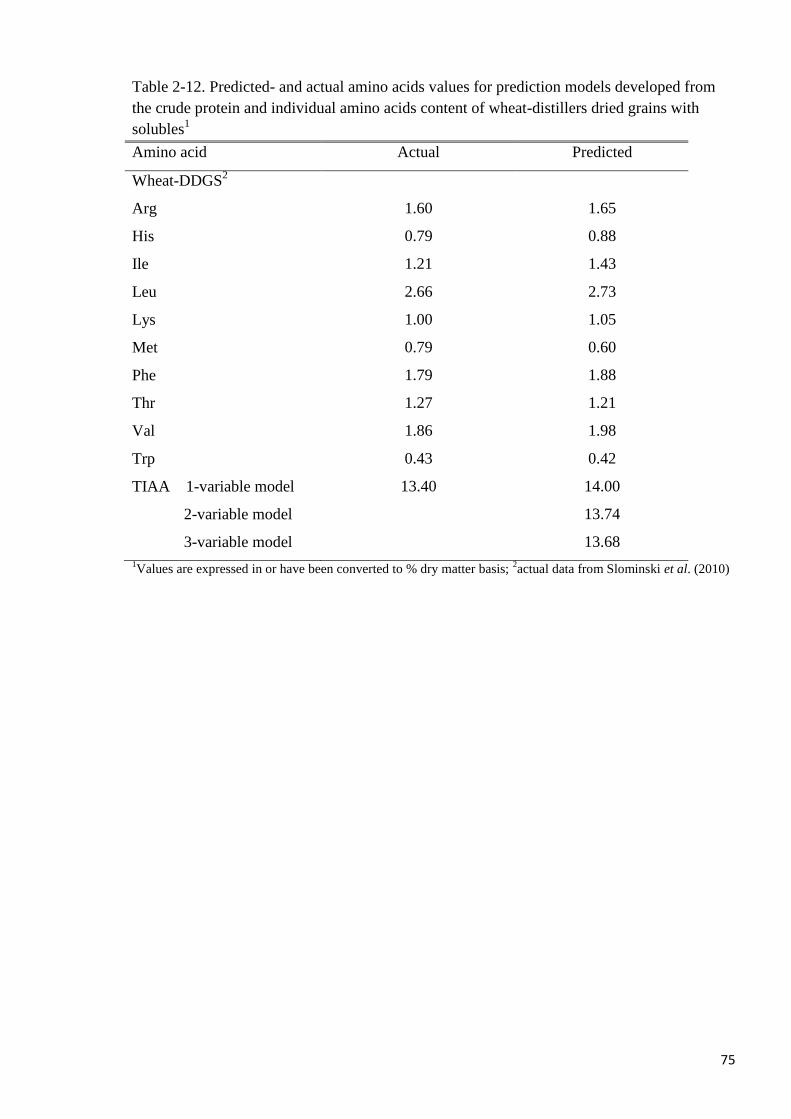
75
Table 2-12. Predicted- and actual amino acids values for prediction models developed from
the crude protein and individual amino acids content of wheat-distillers dried grains with
solubles1
Amino acid Actual Predicted
Wheat-DDGS2
Arg 1.60 1.65
His 0.79 0.88
Ile 1.21 1.43
Leu 2.66 2.73
Lys 1.00 1.05
Met 0.79 0.60
Phe 1.79 1.88
Thr 1.27 1.21
Val 1.86 1.98
Trp 0.43 0.42
TIAA 1-variable model 13.40 14.00
2-variable model 13.74
3-variable model 13.68
1Values are expressed in or have been converted to % dry matter basis;
2actual data from Slominski et al. (2010)
76
2.4 DISCUSSION
The objectives of this study were to examine the variability in the chemical components of
maize- and wheat-DDGS, evaluate the relationships between the chemical components in
maize- and wheat-DDGS as well as develop prediction equations for IAA, TIAA and TAA
contents from their CP alone or CP and IAA contents. It was anticipated that the use of data
from a wide range of sources would provide an adequate representation of the variability in
the chemical composition of both maize- and wheat-DDGS.
A number of factors that may affect the chemical composition of DDGS have been identified
and they include; variations in the chemical composition of the grain, differences in
processing techniques, and differences in analytical methodologies (Belyea et al., 2004; Kim
et al., 2008; Kingsly et al., 2010). In addition, heterogeneity in the efficiency of fermentation,
types of enzyme used, the ratio of wet distillers grains (WDG) to condensed distillers soluble
(CDS) combined to produce DDGS and differences in temperature and duration of drying
have all been reported to influence the chemical characteristics of the final product (Cromwell
et al., 1993; Kingsy et al., 2010; Liu 2011). However, among these factors, the ratio of WDG
and CDS combined to form DDGS may be the most important. This is because WDG is
composed mostly of CP and CF whereas CDS contains mainly the EE, ash and residual sugar
fractions (Kim et al., 2008).
Although the variations in chemical composition of the grain among sources are usually low,
it is possible that the concentration of nutrients in DDGS post-fermentation exaggerates the
differences. However, Belyea et al. (2004) reported no correlation (r ranged from -0.21 to
0.16) between the chemical components (EE, CP, residual starch, CF and ADF) of maize
grain and maize-DDGS using data collected in one bioethanol plant over a three-year period.
Therefore, it is possible that the variability in the chemical composition of DDGS is caused by
external factors apart from the chemical composition of the grain.
In the current study, there was wide variability in the concentrations of CP and AA of the
DDGS samples, but the variability in CP was narrower compared with that of AA in both
maize- and wheat-DDGS. The variability in CP and AA compositions of DDGS may be due
to several factors that include; differences in non-protein-nitrogen content among samples,
temperature and duration of drying, and the contribution of yeast AA to TAA in DDGS (Kim
et al., 2008; Liu, 2011). In ascending order of variability, Met, Lys and Glu were the most
variable AA in maize-DDGS whereas Phe, Cys and Lys were the most variable AA in wheat-
DDGS in the current study. On the other hand, the least variable AA were Thr and Leu for
77
maize-DDGS and Trp and Thr for wheat-DDGS. Although there does not appear to be a
obvious explanation for the wide variability observed for Glu, Met and Phe composition of
maize- or wheat-DDGS compared with other AA, it is possible that these particular AA are
more affected by factors (or their combination) causing variability in the chemical
composition of the DDGS. However, formation of insoluble Lys-carbohydrate moieties and
partial destruction of Cys in oilseeds, animal protein meals and plant-based feedstuffs due to
excessive heat treatment has been reported in literature (Cromwell et al., 1993; Cozannet et
al., 2010b).
During bioethanol production, non-protein nitrogenous compounds such as ammonia and urea
are added to the mash to control the pH as well as serve as sources of N for the yeast (Liu,
2011). Variability in the quantity of exogenous nitrogenous substances added to the mash
among bioethanol facilities may cause variability in the N value and consequently the CP
value of the co-product. Since the CP and AA profile of DDGS are derived from the grain and
yeast, the proportional contribution of either source will confer considerable variability in
DDGS. Ingledew (1999) observed that yeast contributes approximately 5.3% of the total
protein in maize-DDGS.
Belyea et al. (2004) observed that yeast protein constitutes up to 55% to the total protein
content in maize-DDGS. However, the value by Belyea et al. (2004) may have overestimated
the contribution of yeast protein to total protein in maize-DDGS because the approach used
by the authors did not account for dispensable AA. However, Belyea et al. (2004) showed that
AA such as Lys, that is typically low in maize grain (0.24g/100g) and higher in yeast protein
(3.32g/100g), increased substantially in maize-DDGS after yeast fermentation (0.77g/100g).
Liu (2011) similarly observed that after fermentation of maize grain by yeast, there were rapid
increases in the concentration of some AA, the concentration of some AA remained
unchanged and other AA decreased in concentration. On the other hand, Martinez-Amezcua
(2005) reported that only about 10% of the TAA in maize-DDGS is contributed by the yeast
AA.
In the current study, the compositions of P and Ca also varied. Wide variability in the
concentrations of other minerals such as Zn, Na, and S in maize-DDGS has been reported
(Spiehs et al., 2002; Belyea et al., 2006; Liu and Han, 2011). The variability in the
concentrations of minerals in DDGS may be due to the differences in the ratio of WDG and
CDS combined among DDGS sources.
78
Apart from the correlations between the fiber fractions (CF, NDF and ADF) in maize-DDGS,
there were significant positive correlations between CP and the fiber fractions (CF, NDF, and
ADF), CP and ash and CP and Ca. As earlier mentioned, DDGS is composed of the WDG and
CDS fractions, and these fractions differ in chemical characteristics. Kingly et al. (2010)
noted a strong positive correlation between CP and CF in maize-DDGS, as well as negative
correlations between CP and CF and the chemical components (EE, ash, and residual sugars)
of CDS. This is in line with the negative correlations between the EE and CP (-0.49) and EE
and NDF (-0.60) of wheat-DDGS observed in the current study. On the contrary, there were
significant positive correlations between CP and ash (0.45) and also CP and Ca (0.56)
contents of maize-DDGS in the current study. The positive correlation between CP and ash in
the current study may be due to the much wider variability in the nutrient composition data of
maize-DDGS used, compared with Kingsly et al. (2010) study where the negative
correlations were reported.
In the current study, there were significant positive correlations amongst all IAA (except Trp)
and TIAA and TAA for both maize- and wheat-DDGS. Although CP, His and Phe explained
greater than 50% of the variability in Trp content of wheat-DDGS in the current study, these
correlations were not significant (P > 0.05). However, the relationship between Trp and the
chemical components of maize-DDGS was generally poor. Weak correlations between Trp
and the proximate fractions, as well as other IAA in maize-DDGS have been reported
previously (Fiene et al., 2006).
The reasons for the poor correlation between Trp and other IAA as well as TIAA and TAA in
maize- and wheat-DDGS are not clear. However, it is possible that differences in analytical
techniques and errors during Trp determination may cause inconsistencies in the ratio of Trp
to other chemical components in DDGS leading to the weak relationships observed (Nurit et
al., 2009). The effect of variable or incomplete extraction of Trp during AA analysis of
DDGS may also be of significance considering the fact that the concentration of Trp is low
compared with that other IAA in DDGS.
It is desirable to be able to predict the chemical composition of DDGS from other chemical
components. But more importantly, it is important to be able to predict individual AA from
the CP level of DDGS or to predict some essential AA from other AA with high accuracy.
Consequently, in the current study prediction models for essential AA using CP contents of
maize- and wheat-DDGS were developed. For maize-DDGS, r2 for predicting individual AA
from CP content was generally low and was greater than 0.50 only for TAA, Met and Phe. On
79
the other hand, r2 for predicting individual AA from wheat-DDGS CP content was greater
than 0.60 (except for Lys and Trp).
In a study by Fiene et al. (2006), the authors noted the possibility of predicting the IAA
contents of maize-DDGS from the analysed values of CP, EE and CF. In that study, r2 ranged
from 0.31 to 0.86 for the regression models and were lowest for Trp and Lys. Whereas the
reasons for the poor r2
observed for Trp in the current study and that of Fiene et al. (2006) are
not clear, in the case of Lys, it is possible that the low r2 is a result of the wide variability in
Lys concentration caused by the formation of insoluble carbohydrate-Lys compounds during
the drying process.
In the current study, the best candidate models for predicting the TIAA and TAA contents of
both maize- and wheat-DDGS were selected using adj r2 and Mallows Cp as criteria. It was
noted that models containing 3 independent variables were optimal for predicting TIAA and
TAA in either maize- or wheat-DDGS because there were minimal improvements in the adj r2
and no further substantial reductions in the sum of square errors (Mallows Cp) with the
inclusion of a fourth variable. Valine was common to both maize- and wheat-DDGS as the
best 1-variable predictor of TIAA contents. Although the adj r2 explained majority of the
variation in the TIAA contents of maize- and wheat-DDGS in the 1-variable model consisting
of Val (adj r2 = 0.91 and 0.98, respectively), addition of a second predictor variable (and up-to
the third variable) into the models increased their accuracy because there were substantial
reductions in the sum of square error of the models.
The validity of the prediction models developed in the current study was tested by comparing
predicted with actual values from an independent data set. The accuracy of the prediction
models for TIAA and TAA in maize-DDGS and TIAA in wheat-DDGS increased as the
number of predictor variables (up to 3 variables) in the models increased. Although, it did not
appear that His, Leu, Arg and Val were different from the other IAA in the current study, it
was noted that these IAA combined, were the most important for predicting the TIAA and
TAA contents of maize- and wheat-DDGS. It is however surprising that despite the poor
correlation between Trp and TAA in maize-DDGS (r = 0.31), Trp was amongst the best 3-
and 4-variables for predicting the TAA composition of maize-DDGS. The authors are not
aware of reported prediction models for TIAA and TAA in maize- or wheat-DDGS, therefore
it is not possible to compare our findings with any other.
In conclusion, the results of this study showed that there is wide variability in the chemical
compositions of maize- and wheat-DDGS from the different sources. The study also

80
established that the indispensable amino acids and total amino acids contents of maize- and
wheat-DDGS can be predicted from their crude protein and/or amino acids contents with
reasonable accuracy.
81
CHAPTER 3
METABOLISABLE ENERGY CONTENT AND
STANDARDISED OR TRUE DIGESTIBILITY OF AMINO
ACIDS AND PHOSPHORUS OF WHEAT DISTILLERS’
DRIED GRAINS WITH SOLUBLES WITHOUT- OR WITH
EXOGENOUS ENZYMES FOR BROILERS
82
3.1 INTRODUCTION
Wheat Distillers’ Dried Grains with Solubles (wheat-DDGS) is the main co-product of
bioethanol produced from wheat by the dry-grind process. Recently, the quantity of wheat-
DDGS available in the UK has increased because wheat is increasingly being used as
feedstock for bioethanol production. It is possible to use wheat-DDGS in the diets of poultry
because the conversion of starch in the wheat into ethanol increases the concentration of crude
protein (CP), amino acids (AA) and P approximately 3-fold in the wheat-DDGS. The majority
of the wheat-DDGS described previously in the literature as a feed ingredient for poultry
originated from beverage-alcohol production. On the other hand, there is limited information
about the nutritive value of wheat-DDGS derived from bioethanol production. It is important
to determine the nutritive value of wheat-DDGS from bioethanol plants for broilers because
their chemical characteristics may differ from those produced by beverage-alcohol producers
(Liu, 2011).
Wheat grain is commonly used as a source of ME and nutrients for poultry and it is likely that
wheat-DDGS will also be a good source of ME and nutrients for poultry. The apparent
metabolizable energy (AME), nitrogen-corrected AME (AMEn) contents and amino acids
(AA) digestibility of maize-DDGS have been determined for broilers (Batal and Dale, 2006;
Adeola and Ilekeji, 2009) and the inclusion of maize-DDGS in diets for broilers have been
reported to support growth performance (Thacker and Widyaratne, 2007; Loar et al. 2010).
Compared with maize-DDGS, there is a dearth of information about the nutritive value of
wheat-DDGS for broilers. In addition, the use of wheat-DDGS for poultry may reduce
competition between wheat demand for poultry and bioethanol production. In view of the
possibility of using wheat-DDGS as a feedstuff for broilers, it is essential to determine its
nutritional value.
Exogenous enzymes such as carbohydrases, proteases and phytases or a combination of these
are often incorporated into poultry diets. These enzymes have the ability to enhance the
overall digestibility of feed or feedstuffs (Selle et al., 2009) and reduce environmental
pollution from poultry (Adeola and Cowieson, 2011). In addition, exogenous enzymes are
effective at ameliorating the negative effects of non-starch polysaccharide and phytate, in
wheat-based diets for poultry (Choct et al. 2004; Adeola and Cowieson, 2011). Data about the
use of exogenous enzymes to improve nutrient digestibility of wheat-DDGS for broilers are
scanty. Such data are important to inform nutritional-adequate feed formulations without
excessive surfeit.
83
It was hypothesized that wheat-DDGS will be a valuable dietary source of metabolisable
energy (ME), AA and P for broilers. The overall objective of the current study was to provide
data on ME value, AA digestibility and P utilisation of wheat-DDGS for broilers. The specific
objectives were to: 1) determine the AME and AMEn contents of wheat-DDGS without- or
with an admixture of xylanase, amylase and protease (XAP) for broilers by the regression
method, 2) evaluate the true ileal digestibility or total tract P retention of wheat-DDGS
without- or with phytase for broilers and 3) determine apparent or standardised ileal AA
digestibility (AIAAD or SIAAD, respectively) of wheat-DDGS without- or with protease for
broilers.
3.2 MATERIALS AND METHODS
3.2.1 Animals and Management
The Animal Experimentation Committee of the Scotland’s Rural College approved all bird
handling and sample collection procedures.
A total of 336 male broiler chicks (Ross 308) were brooded together and fed a nutrient
adequate pre-experimental starter diet (Table 3-1) from d 0 to 14 in experiment 1 and 2 or
from d 0 to 24 in experiment 3. On d 14, birds were weighed individually and divided into 3
groups of similar bodyweight consisting of 126, 126 or 84 birds for experiment 1, 2 or 3,
respectively. In each experiment, birds were allocated to one of the experimental diets in a
randomized complete block design using d 14 bodyweight as blocking criterion and
transferred to metabolism cages on d 14. Each treatment had seven replicate cages and three
birds per replicate cage. Birds were weighed individually on d 14 and at the end of the
experimental period (d21 or 28). In experiment 2 and 3, birds were euthanized by cervical
dislocation on d 28 to allow collection of ileal digesta samples. Birds were provided ad
libitum access to the experimental diets and water throughout the pre- and experimental
periods. The birds were reared in a house with facilities to control temperature, light, and
humidity. Room temperature was maintained at 35oC, 32
oC, 27
oC and 23
oC for day 1 to 7, 8
to 14, 15 to 21 and 22 to 28, respectively. Titanium dioxide (TiO2) was added to the diets (3
g/kg of diet) as an indigestible marker to enable determination of ME content and P and AA
utilisation by the index method.
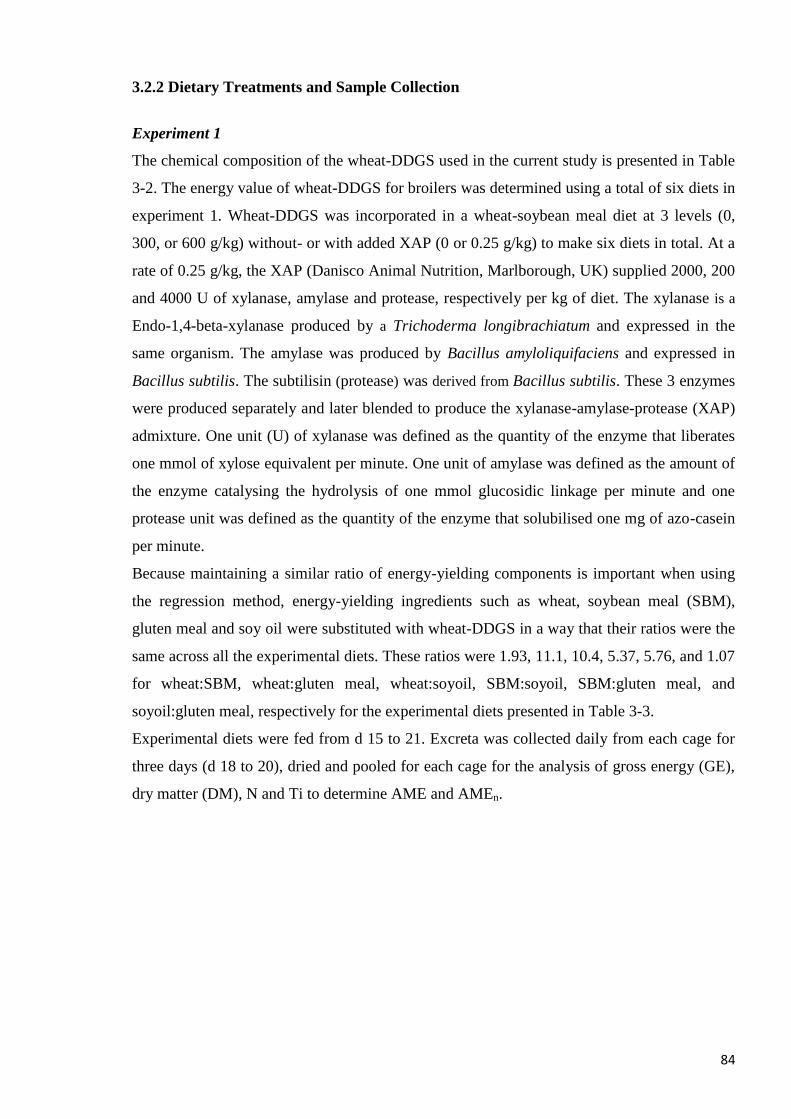
84
3.2.2 Dietary Treatments and Sample Collection
Experiment 1
The chemical composition of the wheat-DDGS used in the current study is presented in Table
3-2. The energy value of wheat-DDGS for broilers was determined using a total of six diets in
experiment 1. Wheat-DDGS was incorporated in a wheat-soybean meal diet at 3 levels (0,
300, or 600 g/kg) without- or with added XAP (0 or 0.25 g/kg) to make six diets in total. At a
rate of 0.25 g/kg, the XAP (Danisco Animal Nutrition, Marlborough, UK) supplied 2000, 200
and 4000 U of xylanase, amylase and protease, respectively per kg of diet. The xylanase is a
Endo-1,4-beta-xylanase produced by a Trichoderma longibrachiatum and expressed in the
same organism. The amylase was produced by Bacillus amyloliquifaciens and expressed in
Bacillus subtilis. The subtilisin (protease) was derived from Bacillus subtilis. These 3 enzymes
were produced separately and later blended to produce the xylanase-amylase-protease (XAP)
admixture. One unit (U) of xylanase was defined as the quantity of the enzyme that liberates
one mmol of xylose equivalent per minute. One unit of amylase was defined as the amount of
the enzyme catalysing the hydrolysis of one mmol glucosidic linkage per minute and one
protease unit was defined as the quantity of the enzyme that solubilised one mg of azo-casein
per minute.
Because maintaining a similar ratio of energy-yielding components is important when using
the regression method, energy-yielding ingredients such as wheat, soybean meal (SBM),
gluten meal and soy oil were substituted with wheat-DDGS in a way that their ratios were the
same across all the experimental diets. These ratios were 1.93, 11.1, 10.4, 5.37, 5.76, and 1.07
for wheat:SBM, wheat:gluten meal, wheat:soyoil, SBM:soyoil, SBM:gluten meal, and
soyoil:gluten meal, respectively for the experimental diets presented in Table 3-3.
Experimental diets were fed from d 15 to 21. Excreta was collected daily from each cage for
three days (d 18 to 20), dried and pooled for each cage for the analysis of gross energy (GE),
dry matter (DM), N and Ti to determine AME and AMEn.
85
Table 3-1. Ingredient and nutrient composition of pre-experimental standard
diet.
Ingredients, g/kg
Maize
538.8
Soybean meal -48%
370
Soybean oil
50
Limestone (38% Ca)
10
Dicalcium phosphate1
19
Common salt
3.25
Vitamin/mineral premix2
4
DL-Methionine
2.8
L-Lysine HCl
1.6
Threonine
0.6
Calculated nutrient composition
Protein, g/kg
230
ME, MJ/kg
12.7
Calcium, g/kg
11.5
Total phosphorus, g/kg
6.8
Non-phytate P, g/kg
4.3
Ca:P
1.7
Indispensable amino acids, g/kg
Arg
14.5
His
5.1
Ile
9.4
Lys
9.4
Met
12.8
Phe
10.0
Thr
2.8
Trp
13.4
Val 5.3 1Contain 21.3% Ca and 18.7% P.
2Vitamin/mineral premix supply per kilogram of diet: vitamin A, 16,000 IU; vitamin D3, 3,000 IU;
vitamin E, 25 IU; vitamin B1, 3 mg; vitamin B2, 10 mg; vitamin B6, 3 mg; vitamin B12, 15 µg; hetra, 5
mg; nicotinic acid, 60 mg; pantothenic acid, 14.7 mg; folic acid, 1.5 mg; Biotin, 125 µg; choline chloride,
25 mg; iron, 20 mg; copper, 10 mg; manganese, 100 mg; cobalt, 1.0 mg; zinc, 82.222 mg; iodine, 1 mg;
selenium, 0.2 mg; and molybdenum, 0.5 mg.
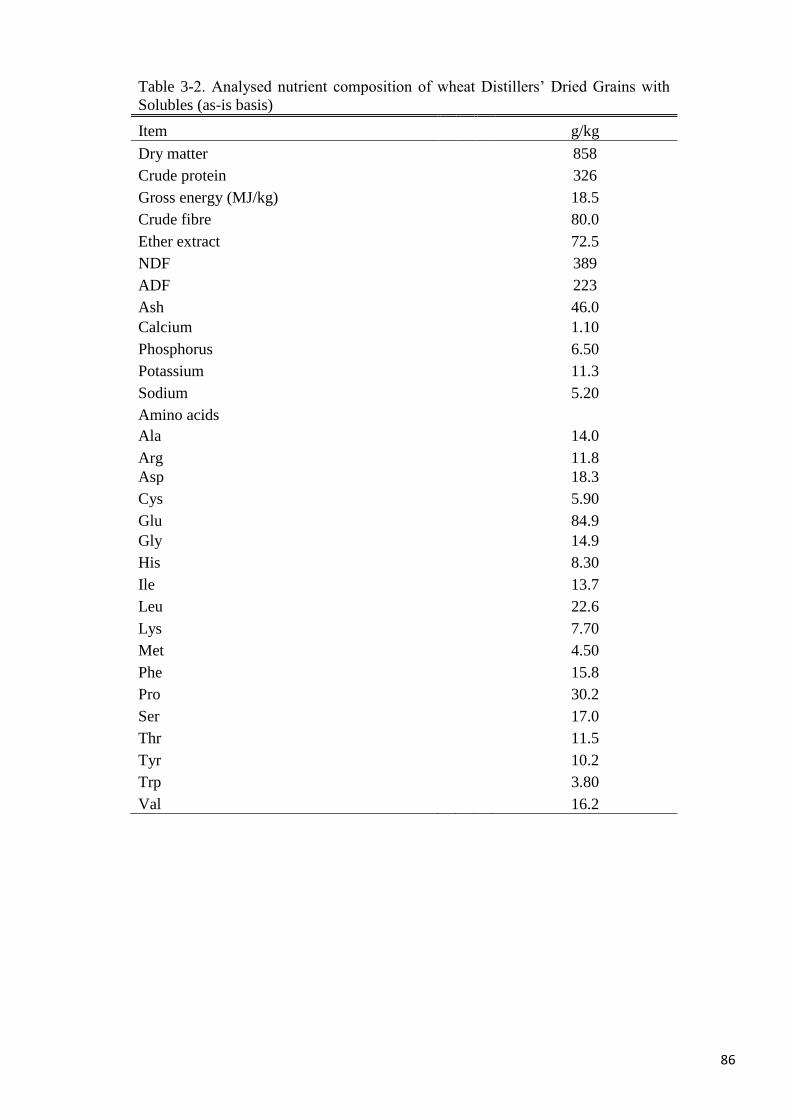
86
Table 3-2. Analysed nutrient composition of wheat Distillers’ Dried Grains with
Solubles (as-is basis)
Item g/kg
Dry matter
858
Crude protein
326
Gross energy (MJ/kg)
18.5
Crude fibre
80.0
Ether extract
72.5
NDF
389
ADF
223
Ash
46.0
Calcium
1.10
Phosphorus
6.50
Potassium
11.3
Sodium
5.20
Amino acids
Ala
14.0
Arg
11.8
Asp
18.3
Cys
5.90
Glu
84.9
Gly
14.9
His
8.30
Ile
13.7
Leu
22.6
Lys
7.70
Met
4.50
Phe
15.8
Pro
30.2
Ser
17.0
Thr
11.5
Tyr
10.2
Trp
3.80
Val 16.2
87
Experiment 2
A total of six diets were used in experiment 2. Three levels of wheat-DDGS (200, 400 or 600
g/kg) was incorporated in a corn-starch based diet (wheat-DDGS being the only source of P)
without- or with added phytase. The phytase (Danisco Animal Nutrition, Marlborough, UK)
was added to the diet to supply 1000 FTU/kg. The phytase was derived from Escherichia coli
and expressed in Schizosaccharomyces pombe. One phytase unit was defined as the quantity
of enzyme required to liberate 1 µmol of inorganic P per minute, at pH 5.5 from an excess of
15 µM sodium phytate at 37oC. The ingredient and analysed chemical compositions of the
experimental diets are presented in Table 3-4. Diets were fed from d 15 to 21. Excreta
samples were collected daily for 3 days (d 18 to 20) for the determination of total tract P
utilisation. On d 21, all birds were euthanized by cervical dislocation and ileal digesta samples
were collected from the Meckel’s diverticulum to approximately 1 cm proximal to the ileo-
cecal junction by flushing with distilled water. Ileal digesta samples were pooled per cage and
stored frozen (-20oC) pending chemical analysis.
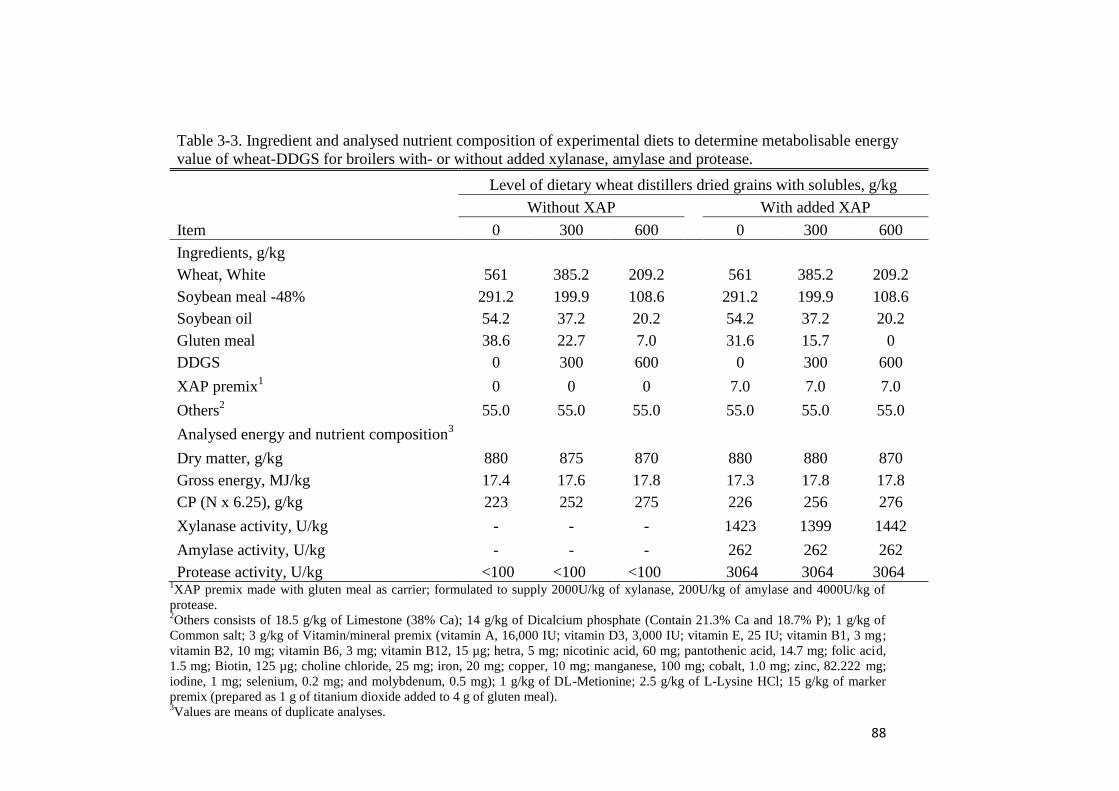
88
Table 3-3. Ingredient and analysed nutrient composition of experimental diets to determine metabolisable energy
value of wheat-DDGS for broilers with- or without added xylanase, amylase and protease.
Level of dietary wheat distillers dried grains with solubles, g/kg
Without XAP
With added XAP
Item 0 300 600
0 300 600
Ingredients, g/kg
Wheat, White 561 385.2 209.2
561 385.2 209.2
Soybean meal -48% 291.2 199.9 108.6
291.2 199.9 108.6
Soybean oil 54.2 37.2 20.2
54.2 37.2 20.2
Gluten meal 38.6 22.7 7.0
31.6 15.7 0
DDGS 0 300 600
0 300 600
XAP premix1 0 0 0
7.0 7.0 7.0
Others2 55.0 55.0 55.0
55.0 55.0 55.0
Analysed energy and nutrient composition3
Dry matter, g/kg 880 875 870
880 880 870
Gross energy, MJ/kg 17.4 17.6 17.8
17.3 17.8 17.8
CP (N x 6.25), g/kg 223 252 275
226 256 276
Xylanase activity, U/kg - - -
1423 1399 1442
Amylase activity, U/kg - - -
262 262 262
Protease activity, U/kg <100 <100 <100 3064 3064 3064 1XAP premix made with gluten meal as carrier; formulated to supply 2000U/kg of xylanase, 200U/kg of amylase and 4000U/kg of
protease. 2Others consists of 18.5 g/kg of Limestone (38% Ca); 14 g/kg of Dicalcium phosphate (Contain 21.3% Ca and 18.7% P); 1 g/kg of
Common salt; 3 g/kg of Vitamin/mineral premix (vitamin A, 16,000 IU; vitamin D3, 3,000 IU; vitamin E, 25 IU; vitamin B1, 3 mg;
vitamin B2, 10 mg; vitamin B6, 3 mg; vitamin B12, 15 µg; hetra, 5 mg; nicotinic acid, 60 mg; pantothenic acid, 14.7 mg; folic acid,
1.5 mg; Biotin, 125 µg; choline chloride, 25 mg; iron, 20 mg; copper, 10 mg; manganese, 100 mg; cobalt, 1.0 mg; zinc, 82.222 mg;
iodine, 1 mg; selenium, 0.2 mg; and molybdenum, 0.5 mg); 1 g/kg of DL-Metionine; 2.5 g/kg of L-Lysine HCl; 15 g/kg of marker
premix (prepared as 1 g of titanium dioxide added to 4 g of gluten meal). 3Values are means of duplicate analyses.
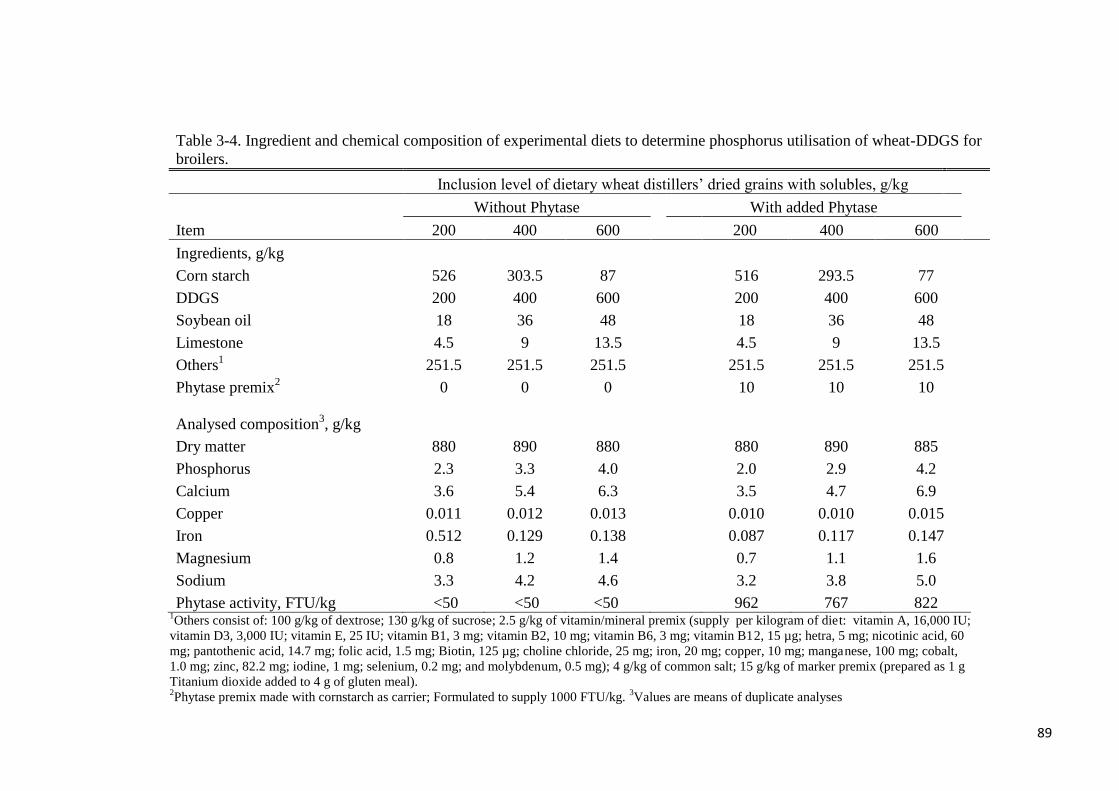
89
Table 3-4. Ingredient and chemical composition of experimental diets to determine phosphorus utilisation of wheat-DDGS for
broilers.
Inclusion level of dietary wheat distillers’ dried grains with solubles, g/kg
Without Phytase
With added Phytase
Item 200 400 600
200 400 600
Ingredients, g/kg
Corn starch 526 303.5 87
516 293.5 77
DDGS 200 400 600
200 400 600
Soybean oil 18 36 48
18 36 48
Limestone 4.5 9 13.5
4.5 9 13.5
Others1 251.5 251.5 251.5
251.5 251.5 251.5
Phytase premix2 0 0 0
10 10 10
Analysed composition3, g/kg
Dry matter 880 890 880
880 890 885
Phosphorus 2.3 3.3 4.0
2.0 2.9 4.2
Calcium 3.6 5.4 6.3
3.5 4.7 6.9
Copper 0.011 0.012 0.013 0.010 0.010 0.015
Iron 0.512 0.129 0.138 0.087 0.117 0.147
Magnesium 0.8 1.2 1.4 0.7 1.1 1.6
Sodium 3.3 4.2 4.6 3.2 3.8 5.0
Phytase activity, FTU/kg <50 <50 <50 962 767 822 1Others consist of: 100 g/kg of dextrose; 130 g/kg of sucrose; 2.5 g/kg of vitamin/mineral premix (supply per kilogram of diet: vitamin A, 16,000 IU;
vitamin D3, 3,000 IU; vitamin E, 25 IU; vitamin B1, 3 mg; vitamin B2, 10 mg; vitamin B6, 3 mg; vitamin B12, 15 µg; hetra, 5 mg; nicotinic acid, 60
mg; pantothenic acid, 14.7 mg; folic acid, 1.5 mg; Biotin, 125 µg; choline chloride, 25 mg; iron, 20 mg; copper, 10 mg; manganese, 100 mg; cobalt,
1.0 mg; zinc, 82.2 mg; iodine, 1 mg; selenium, 0.2 mg; and molybdenum, 0.5 mg); 4 g/kg of common salt; 15 g/kg of marker premix (prepared as 1 g
Titanium dioxide added to 4 g of gluten meal). 2Phytase premix made with cornstarch as carrier; Formulated to supply 1000 FTU/kg.
3Values are means of duplicate analyses
90
Experiment 3
Four dietary treatments were used to determine ileal AA digestibility of wheat-DDGS in
experiment 3. The dietary treatments were 2 nitrogen-free diets (NFD) (without- or with
protease) and 2 semi-purified diets in which wheat-DDGS was the only source of AA
(without- or with protease). The protease was added to provide 4000 U per kg of diet
(Danisco Animal Nutrition, Marlborough, UK). One protease unit was defined as the quantity
of the enzyme that solubilises one mg of azo-casein per minute. Basal ileal endogenous AA
flow from birds fed a NFD without- or with protease was used to correct AIAAD values to
SIAAD. The ingredient compositions of the experimental diets are presented in Table 3-5.
The analysed CP and AA compositions for the diets are presented in Table 3-6. The assay
diets were formulated to contain 22% CP and balanced for mineral and vitamins to meet
breeder nutrient specifications. Experimental diets were fed from d 25 to 28. Because of
health and welfare issues associated with feeding birds NFD, experimental diets were fed for
three days in experiment 3. A 3-d feeding period is optimal to fulfil the objectives of the
experiment (Kluth and Rudehurscord, 2010). On d 28, ileal digesta samples were collected
from the Meckel’s diverticulum to approximately 1 cm proximal to the ileo-cecal junction by
flushing with distilled water. Ileal digesta samples were pooled for each cage and stored
frozen (-20 oC) prior to chemical analysis.
3.2.3 Chemical Analysis
Where necessary, diet, wheat-DDGS, ileal digesta and excreta samples were analysed for GE,
DM, Ti, N, AA and P. Except for the ileal digesta samples for AA analysis that were
lyophilized, all other samples were oven dried and ground to pass through a 0.5 mm screen
using a mill grinder (Retsch ZM 100, F. Kurt Retsch GmbH & Co.KG, Haan, Germany)
before chemical analysis. For DM determination, samples were dried at 105 oC for 24 hours in
a drying oven (Uniterm, Russel-Lindsey Engineering Ltd., Birmingham, England. UK)
(AOAC International 2006, method 934.01). Gross energy was determined in an adiabatic
oxygen bomb calorimeter using benzoic acid as an internal standard (Model 6200, Parr
Instruments, Moline, Illinois, USA). Nitrogen was determined by combustion method (AOAC
International 2006, method 968.06). For AA analysis, samples were hydrolysed for 24 hours
in 6 N hydrochloric acid at 110 oC under an atmosphere of N. For Met and Cys, performic
acid oxidation was carried out before acid hydrolysis. The AA in the hydrolysate were
determined by HPLC after post-column derivatization [(AOAC International 2000, method
982.30E (a, b, c)]. Analysis for Ti was performed as described by Short et al. (1996). Mineral
concentrations in the samples were determined using inductively coupled plasma
91
spectrophotometry (ICP) according to the procedures of Olsen and Sommers (1982).
Xylanase activity in diets was measured using a kit (Megazyme International Ireland Ltd.,
Bray, Ireland) using the method of McCleary (1991). Amylase activity in the diet was
measured using Phadebas (Megazyme International Ireland Ltd.) tablets using the method
described by McCleary and Sheehan (1989). Protease activity was analysed using the
modified method of Lynn and Clevette-Radford (1984) with azocasein used as substrate.
Phytase activity in the diets was analysed using the AOAC official method (2000.12, AOAC,
2000).
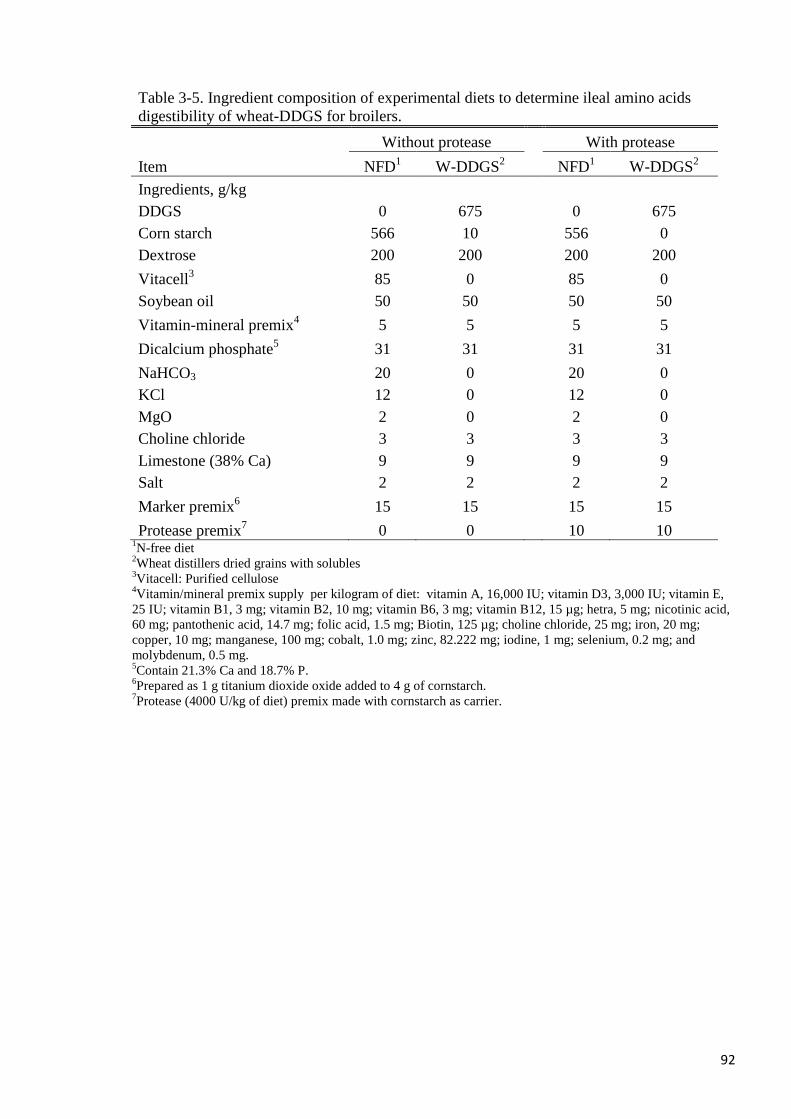
92
Table 3-5. Ingredient composition of experimental diets to determine ileal amino acids
digestibility of wheat-DDGS for broilers.
Without protease
With protease
Item NFD1 W-DDGS
2 NFD
1 W-DDGS
2
Ingredients, g/kg
DDGS 0 675
0 675
Corn starch 566 10
556 0
Dextrose 200 200
200 200
Vitacell3 85 0
85 0
Soybean oil 50 50
50 50
Vitamin-mineral premix4 5 5
5 5
Dicalcium phosphate5 31 31
31 31
NaHCO3 20 0
20 0
KCl 12 0
12 0
MgO 2 0
2 0
Choline chloride 3 3
3 3
Limestone (38% Ca) 9 9
9 9
Salt 2 2
2 2
Marker premix6 15 15
15 15
Protease premix7 0 0
10 10 1N-free diet
2Wheat distillers dried grains with solubles
3Vitacell: Purified cellulose
4Vitamin/mineral premix supply per kilogram of diet: vitamin A, 16,000 IU; vitamin D3, 3,000 IU; vitamin E,
25 IU; vitamin B1, 3 mg; vitamin B2, 10 mg; vitamin B6, 3 mg; vitamin B12, 15 µg; hetra, 5 mg; nicotinic acid,
60 mg; pantothenic acid, 14.7 mg; folic acid, 1.5 mg; Biotin, 125 µg; choline chloride, 25 mg; iron, 20 mg;
copper, 10 mg; manganese, 100 mg; cobalt, 1.0 mg; zinc, 82.222 mg; iodine, 1 mg; selenium, 0.2 mg; and
molybdenum, 0.5 mg. 5Contain 21.3% Ca and 18.7% P.
6Prepared as 1 g titanium dioxide oxide added to 4 g of cornstarch.
7Protease (4000 U/kg of diet) premix made with cornstarch as carrier.
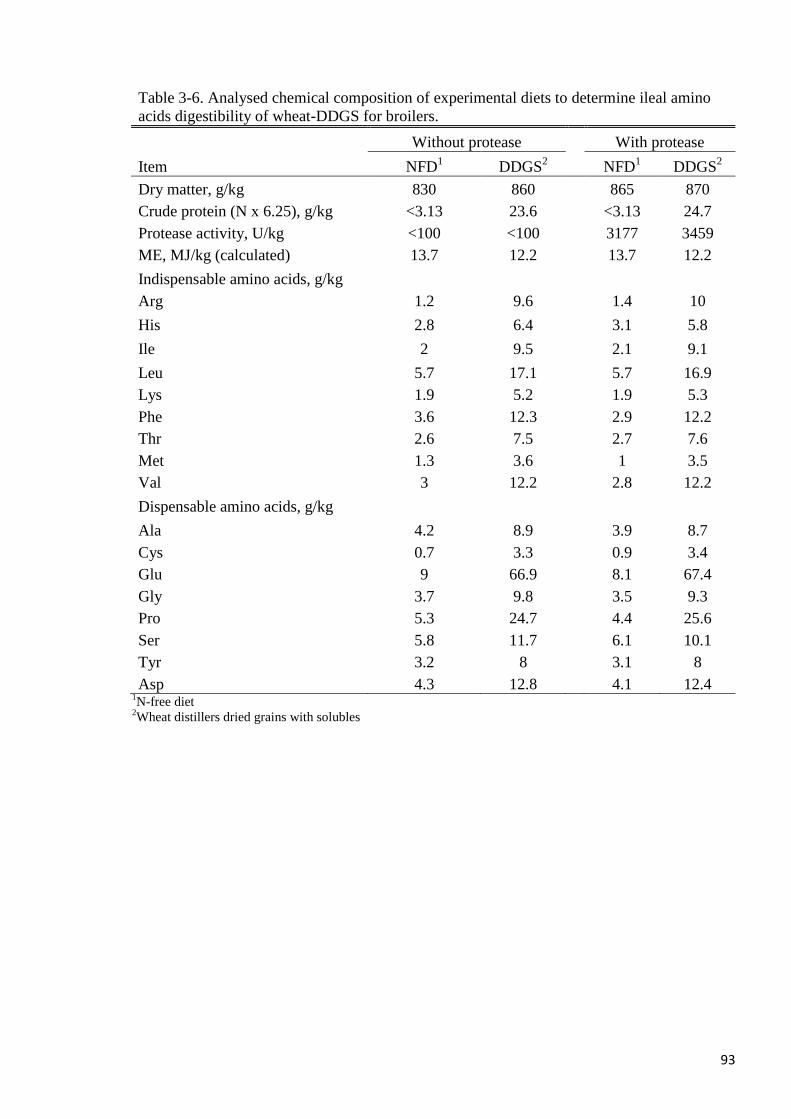
93
Table 3-6. Analysed chemical composition of experimental diets to determine ileal amino
acids digestibility of wheat-DDGS for broilers.
Without protease
With protease
Item NFD1 DDGS
2 NFD
1 DDGS
2
Dry matter, g/kg 830 860
865 870
Crude protein (N x 6.25), g/kg <3.13 23.6
<3.13 24.7
Protease activity, U/kg <100 <100
3177 3459
ME, MJ/kg (calculated) 13.7 12.2 13.7 12.2
Indispensable amino acids, g/kg
Arg 1.2 9.6
1.4 10
His 2.8 6.4
3.1 5.8
Ile 2 9.5
2.1 9.1
Leu 5.7 17.1
5.7 16.9
Lys 1.9 5.2
1.9 5.3
Phe 3.6 12.3
2.9 12.2
Thr 2.6 7.5
2.7 7.6
Met 1.3 3.6
1 3.5
Val 3 12.2
2.8 12.2
Dispensable amino acids, g/kg
Ala 4.2 8.9
3.9 8.7
Cys 0.7 3.3
0.9 3.4
Glu 9 66.9
8.1 67.4
Gly 3.7 9.8
3.5 9.3
Pro 5.3 24.7
4.4 25.6
Ser 5.8 11.7
6.1 10.1
Tyr 3.2 8
3.1 8
Asp 4.3 12.8 4.1 12.4 1N-free diet
2Wheat distillers dried grains with solubles
94
3.2.4 Calculations and Statistical Analysis
All statistical analyses were performed using GenStat program (VSN International, 2011).
Statistical significance was set at P < 0.05 and tendency at 0.05 < P < 0.1 for all mean
comparisons.
Experiment 1
Energy utilisation coefficient was calculated using the following equation:
1. (
) (
)
where MEc is energy utilisation coefficient, Ti is the concentration of titanium in diet
(mg/kg), To is the concentration of titanium in excreta (mg/kg), Eo and Ei are the GE in
excreta and diet, respectively (MJ/kg).
Apparent metabolisable energy was calculated using the following equation:
2.
where AME is apparent metabolisable energy (MJ/kg), MEc is the energy utilisation
coefficient and GEdiet is the GE (MJ/kg) in the diet.
Nitrogen-corrected AME was calculated using the following equation:
3.
where AMEn is nitrogen-corrected apparent metabolisable energy (MJ/kg), N gain is nitrogen
retained (g/kg of DM intake) and 8.73 is the caloric correction factor for retained nitrogen
(Titus, 1956).
Nitrogen gain was calculated using the following equation:
4.
where Ndiet and Nexcreta are the nitrogen in diet and excreta, respectively (g/kg of DM), Ti and
To are the concentration of titanium (mg/kg) in the diet and excreta, respectively.
Wheat-DDGS-associated AME intake was calculated as illustrated by Adeola et al. (2010)
using the following equations:
If the coefficients of AME for the assay diet, basal diet and test ingredient (wheat-DDGS) are
represented by Cad, Cbd and Cti, respectively. Assuming additivity in diet formulation, the
95
proportional contribution of energy by the basal (Pbd) and test ingredients (Pti) to the assay
diet will be equal to 1. Mathematically; Pbd + Pti = 1 or Pbd = 1 – Pti.
Therefore;
5.
By solving for Cti,
6.
Substituting 1 – Pti for Pbd;
7. [
]
The product of Cti at each level of wheat-DDGS substitution rate (300 or 600 g/kg), the GE of
wheat-DDGS, and wheat-DDGS intake in kg is the wheat-DDGS-associated AME intake in
MJ.
Energy utilisation data were analysed as a randomised complete block design of 3 levels of
wheat-DDGS (0, 300 and 600 g/kg) and 2 levels of enzyme supplementation (not added or
added). In the 7 blocks, each consisting of 3 cages containing one of 0, 300, or 600g of wheat-
DDGS per kg of diet without- or with added XAP, AME or AMEn intake (MJ) was regressed
against wheat-DDGS intake (kg) for each block to generate intercepts and slopes for each of
the 7 blocks per XAP (not added or added). The intercept and slope data were analysed as a
one-way analysis of variance in a completely randomized design using intercept or slope as
the dependent variable and XAP (not added or added) as the independent variable. The
additional energy provided by the XAP was determined using ANOVA procedures as the
difference between the slopes of dietary treatments without and those with supplemental
XAP. Orthogonal contrast was used to determine the differences in metabolisable energy
between the dietary treatments with different inclusion levels of wheat-DDGS and those
without- or with added XAP.
Experiment 2
Apparent ileal P digestibility or apparent P retention was calculated using the following
equation:
8. [ (
) (
)]
96
where APD/APR is apparent P digestibility (%) or apparent P retention (%); Ti and To are
the concentrations (mg/kg) of titanium in diet and ileal digesta or excreta, respectively. Po is
the phosphorus in the ileal digesta or excreta (g/kg of DM output) and Pi is the phosphorus in
the diet (g/kg of DM).
Mineral flow at the ileum or total tract was calculated using the following equation:
9.
where MO-dmi and MO-dmo are mineral output (ileal or total tract) on DM intake and DM
output basis, respectively (mg/kg); Ti and To are the concentrations of titanium (mg/kg) in the
diet and digesta or excreta, respectively.
True P digestibility or retention was determined from regressing P output (ileal or total tract)
against dietary P intake per block of 3 treatments within each block (one block without-, the
other with added phytase) using the following model;
10.
where PO-dmi is phosphorus output (mg/kg) on DM intake basis (dependent variable); TPI is
the slope of the model or true P indigestibility; Pi is the phosphorus in the diet (g/kg of DM
intake) (independent variable) and EPL is the intercept of the model or mean endogenous
phosphorus loss (DM intake basis).
True P digestibility or retention was calculated from the measure of P indigestibility using the
following equation:
11.
where TPD or TPR are true P digestibility or true P retention and TPI is true P indigestibility
(%), respectively.
Experiment 3
Basal ileal AA flow was calculated using the following equation:
12. (
)
where EAAF is endogenous ileal AA flow (mg/kg of DM intake); AAo is the AA in ileal
digesta (mg/kg of DM); Ti and To are the concentrations of titanium (mg/kg) in diet and ileal
digesta, respectively.
97
Apparent ileal AA digestibility was calculated using the following equation:
[ (
) (
)]
where AIAAD is apparent ileal amino acid digestibility (%); Ti and To are the concentrations
(mg/kg) of titanium in diet and ileal digesta, respectively; AAo is the amino acid in the digesta
(g/kg of DM) and AAi is the amino acid in the diet (g/kg of DM).
Standardised ileal AA digestibility was calculated using the following equation:
13. (
)
where SIAAD is standardized ileal AA digestibility (%); AIAAD is apparent ileal AA
digestibility (%); EAAF is the endogenous basal ileal AA flow (g/kg of DM intake) and AAi
is the amino acid in the diet (g/kg of DM).
Data for the AIAAD and SIAAD without- or with supplemental protease were subjected to a
one-way analysis of variance to determine differences.
3.3 RESULTS
3.3.1 Metabolisable Energy Value of Wheat Distillers Dried Grains with Solubles
without- or with an Admixture of Xylanase, Amylase and Protease for Broilers
The wheat-DDGS used in the current study contained by analysis 18.5 MJ/kg of GE, 326 g/kg
of CP, 6.5 g/kg of P, 80 g/kg of crude fibre and 858 g/kg of DM (Table 3-2). The ingredient
and analysed nutrient composition of the experimental diets are presented in Table 3-3. The
average xylanase activity in the diets containing 0, 300 or 600 g/kg of wheat-DDGS with
supplemental XAP was 1421 U/kg and this value is lower than the formulated value of 2000
U/kg. On the average, amylase and protease activity in these diets were 262 and 3064 U/kg,
respectively compared to the formulated value of 200 and 4000 U/kg, respectively. Enzyme
activity in the diets without supplemental XAP was generally below the detectable limit.
The effects of wheat-DDGS inclusion level and XAP supplementation on growth performance
responses are presented in Table 3-7. Increasing the inclusion level of wheat-DDGS from 0 to
600 g/kg in the diet decreased body weight gain (BWG) and gain to feed ratio (G:F) in a
quadratic (P < 0.001) manner. Final bodyweight (FBW) at d 21 and feed intake (FI) decreased
in a quadratic manner (P < 0.05) as the dietary inclusion of wheat-DDGS increased to 600
98
g/kg. Weight gain, FI, G:F, and FBW were greatest (P < 0.001) for birds fed diets containing
300 g/kg of wheat-DDGS, these responses were lowest (P < 0.001) for the birds fed the diets
containing 600 g/kg of wheat-DDGS whereas these responses were intermediate for the birds
fed the reference diet without wheat-DDGS. Addition of XAP to the diets did not improve the
BWG, G:F or FBW of the birds.
Dry matter retention and energy utilisation for broilers fed graded levels of wheat-DDGS
without- or with added XAP are shown in Table 3-8. Increasing the inclusion level of wheat-
DDGS from 0 to 600 g/kg in the diet decreased linearly (P < 0.001) DM and energy retention.
Dry matter retention decreased (P < 0.001) by 11% when wheat-DDGS was increased from 0
to 300 g/kg in the reference diet. The decrease was 16% when the level of wheat-DDGS was
increased from 0 to 600 g/kg. Similarly, energy retention decreased (P < 0.001) by 9% when
wheat-DDGS was increased from 0 to 300 g/kg in the reference diet whereas the decrease was
13% when the dietary inclusion of wheat-DDGS was increased to 600 g/kg. Increasing the
level of wheat-DDGS from 0 to 600 g/kg in the reference diet decreased linearly (P < 0.001)
dietary AME whereas the decrease was quadratic in manner (P < 0.05) for dietary AMEn.
Substitution of 300 g/kg of wheat-DDGS in the reference diet decreased (P < 0.001) both the
AME and AMEn (MJ/kg) by 8%. The decrease (P < 0.001) in dietary AME and AMEn
(MJ/kg) was 10% when the inclusion level of wheat-DDGS was increased to 600 g/kg.
Supplemental XAP tended to improve (P < 0.1) dietary AME and AMEn.
The AME and AMEn values of wheat-DDGS without- or with added XAP determined from
regressing wheat-DDGS-associated energy intake against wheat-DDGS intake are presented
in Table 3-9. The slope for the regression analyses are shown in Figures 3-1. From the slope
of the linear regression, the AME values (MJ/kg DM) of wheat-DDGS for broilers without- or
with supplemental XAP were determined to be 15 or 15.5, respectively. Corresponding AMEn
(MJ/kg DM) were 14 or 14.5, respectively. Comparison using ANOVA procedures indicated
that the slope when XAP was added was not greater than when XAP was not added.
Numerical increases in AME and AMEn (MJ/kg DM) values of wheat-DDGS with
supplemental XAP were 0.47 and 0.43, respectively.
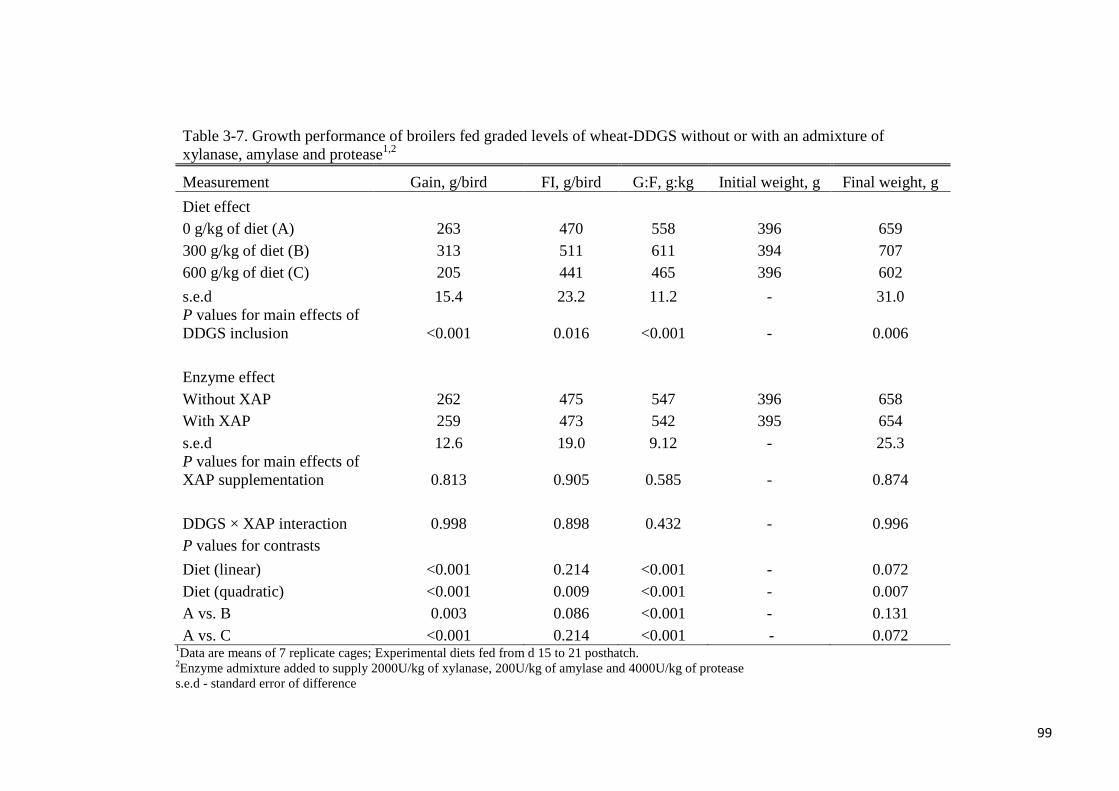
99
Table 3-7. Growth performance of broilers fed graded levels of wheat-DDGS without or with an admixture of
xylanase, amylase and protease1,2
Measurement Gain, g/bird FI, g/bird G:F, g:kg Initial weight, g Final weight, g
Diet effect
0 g/kg of diet (A) 263 470 558 396 659
300 g/kg of diet (B) 313 511 611 394 707
600 g/kg of diet (C) 205 441 465 396 602
s.e.d 15.4 23.2 11.2 - 31.0
P values for main effects of
DDGS inclusion <0.001 0.016 <0.001 - 0.006
Enzyme effect
Without XAP 262 475 547 396 658
With XAP 259 473 542 395 654
s.e.d 12.6 19.0 9.12 - 25.3
P values for main effects of
XAP supplementation 0.813 0.905 0.585 - 0.874
DDGS × XAP interaction 0.998 0.898 0.432 - 0.996
P values for contrasts
Diet (linear) <0.001 0.214 <0.001 - 0.072
Diet (quadratic) <0.001 0.009 <0.001 - 0.007
A vs. B 0.003 0.086 <0.001 - 0.131
A vs. C <0.001 0.214 <0.001 - 0.072 1Data are means of 7 replicate cages; Experimental diets fed from d 15 to 21 posthatch.
2Enzyme admixture added to supply 2000U/kg of xylanase, 200U/kg of amylase and 4000U/kg of protease
s.e.d - standard error of difference
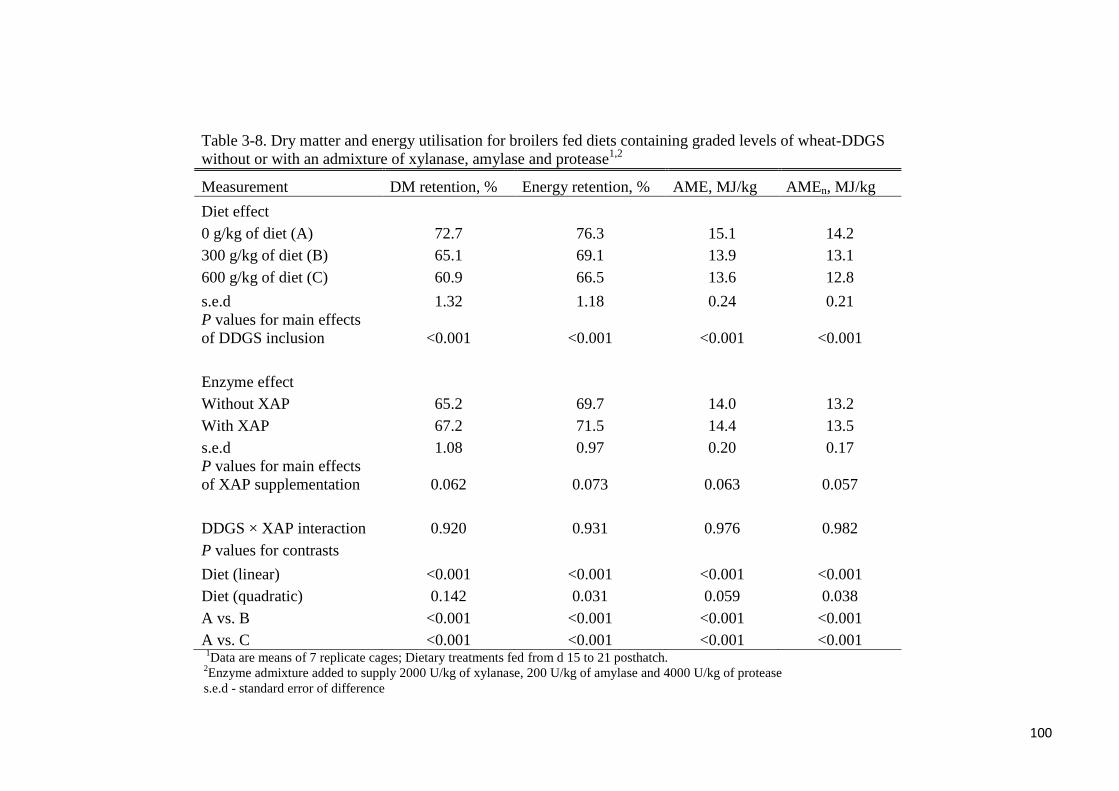
100
Table 3-8. Dry matter and energy utilisation for broilers fed diets containing graded levels of wheat-DDGS
without or with an admixture of xylanase, amylase and protease1,2
Measurement DM retention, % Energy retention, % AME, MJ/kg AMEn, MJ/kg
Diet effect
0 g/kg of diet (A) 72.7 76.3 15.1 14.2
300 g/kg of diet (B) 65.1 69.1 13.9 13.1
600 g/kg of diet (C) 60.9 66.5 13.6 12.8
s.e.d 1.32 1.18 0.24 0.21
P values for main effects
of DDGS inclusion <0.001 <0.001 <0.001 <0.001
Enzyme effect
Without XAP 65.2 69.7 14.0 13.2
With XAP 67.2 71.5 14.4 13.5
s.e.d 1.08 0.97 0.20 0.17
P values for main effects
of XAP supplementation 0.062 0.073 0.063 0.057
DDGS × XAP interaction 0.920 0.931 0.976 0.982
P values for contrasts
Diet (linear) <0.001 <0.001 <0.001 <0.001
Diet (quadratic) 0.142 0.031 0.059 0.038
A vs. B <0.001 <0.001 <0.001 <0.001
A vs. C <0.001 <0.001 <0.001 <0.001 1Data are means of 7 replicate cages; Dietary treatments fed from d 15 to 21 posthatch.
2Enzyme admixture added to supply 2000 U/kg of xylanase, 200 U/kg of amylase and 4000 U/kg of protease
s.e.d - standard error of difference
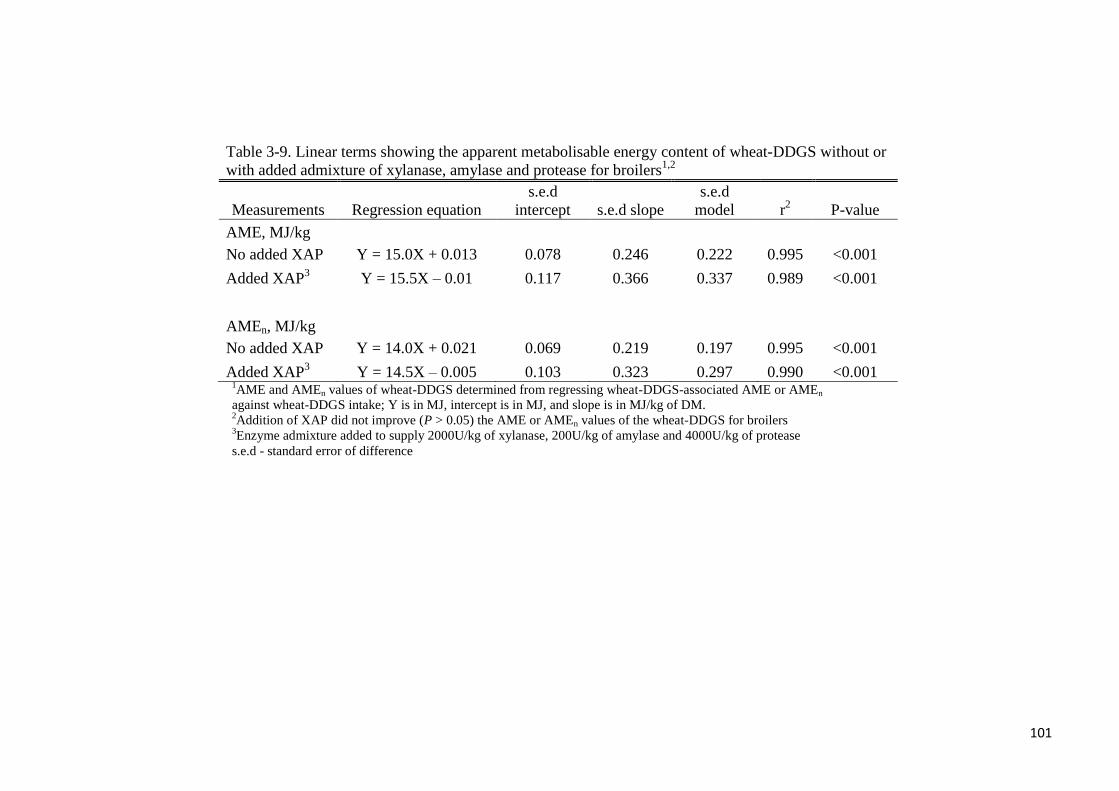
101
Table 3-9. Linear terms showing the apparent metabolisable energy content of wheat-DDGS without or
with added admixture of xylanase, amylase and protease for broilers1,2
Measurements Regression equation
s.e.d
intercept s.e.d slope
s.e.d
model r2 P-value
AME, MJ/kg
No added XAP Y = 15.0X + 0.013 0.078 0.246 0.222 0.995 <0.001
Added XAP3 Y = 15.5X – 0.01 0.117 0.366 0.337 0.989 <0.001
AMEn, MJ/kg
No added XAP Y = 14.0X + 0.021 0.069 0.219 0.197 0.995 <0.001
Added XAP3 Y = 14.5X – 0.005 0.103 0.323 0.297 0.990 <0.001
1AME and AMEn values of wheat-DDGS determined from regressing wheat-DDGS-associated AME or AMEn
against wheat-DDGS intake; Y is in MJ, intercept is in MJ, and slope is in MJ/kg of DM. 2Addition of XAP did not improve (P > 0.05) the AME or AMEn values of the wheat-DDGS for broilers
3Enzyme admixture added to supply 2000U/kg of xylanase, 200U/kg of amylase and 4000U/kg of protease
s.e.d - standard error of difference
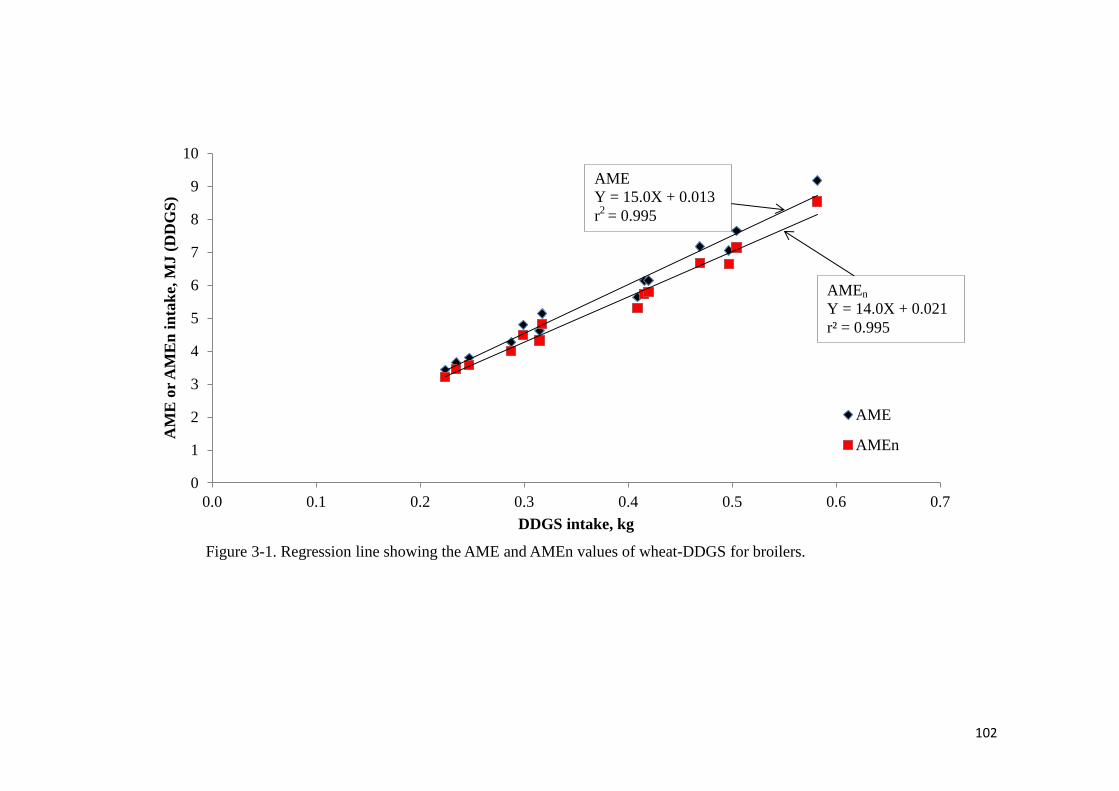
102
0
1
2
3
4
5
6
7
8
9
10
0.0 0.1 0.2 0.3 0.4 0.5 0.6 0.7
AM
E o
r A
ME
n i
nta
ke,
MJ (
DD
GS
)
DDGS intake, kg
Figure 3-1. Regression line showing the AME and AMEn values of wheat-DDGS for broilers.
AME
AMEn
AMEn
Y = 14.0X + 0.021
r² = 0.995
AME
Y = 15.0X + 0.013
r2
= 0.995
103
3.3.2 True Phosphorus Digestibility and Retention of Wheat Distillers Dried Grains with
Solubles without- or with Supplemental Phytase for Broilers
The ingredient and analysed chemical compositions for the six dietary treatments in the
current study are presented in Table 3-4. Analysed phytase activities were 962, 767 or 822
FTU/kg in the phytase-supplemented diets containing 200, 400 or 600 g/kg of wheat-DDGS,
respectively, but these values are marginally lower than the formulated value of 1000 FTU/kg.
Diets not supplemented with phytase contained less than 50 FTU/kg of diet. The utilisation of
DM and P at the ileal and total tract for broilers fed graded levels of wheat-DDGS without- or
with supplemental phytase are presented in Table 3-10. Increasing the dietary inclusion of
wheat-DDGS from 200 to 600 g/kg did not affect dry matter intake (DMI), but decreased ileal
DM digestibility and retention in a linear manner (P < 0.001). Further, increasing the level of
wheat-DDGS from 200 to 600 g/kg in the diet did not affect apparent ileal P digestibility but
decreased apparent P retention in a linear manner (P < 0.05).
The true ileal digestibility and total tract retention of P in wheat-DDGS for broilers are
presented in Table 3-11. From the regression of P output (mg/kg of DMI) at the ileal level
against dietary P intake (mg/kg of DM), true P digestibility of wheat-DDGS without- or with
supplemental phytase were determined to be 93.6 or 96.0%, respectively. Corresponding
values at the total tract level were 92.4 and 93.5%, respectively. The regression lines showing
the TPI of wheat-DDGS at the ileal and total tract level for broilers are shown in Figure 3-2.
True P digestibility or retention was not different between the treatments without- and with
phytase. The true digestible P and true retainable P contents of the wheat-DDGS were
calculated as the coefficient of TPD/TPR multiplied by the analysed P composition (%) of the
wheat-DDGS. The true digestible P (%) in the wheat-DDGS for broilers without- or with
added phytase was 0.60 or 0.62, respectively. Respective values for true retainable P (%) were
0.60 or 0.61.
Flow of minerals at the ileal level is presented in Table 3-12 and those at the total tract level
in Table 3-13. Increasing the dietary inclusion of wheat-DDGS from 200 to 600 g/kg
increased linearly (P < 0.05) the flow of Cu, Mg, Mn, K, and Na but not those of Fe or Zn at
the ileal level. Increasing the dietary inclusion of wheat-DDGS from 200 to 600 g/kg linearly
increased (P < 0.05) the flow of Cu, Fe, Mg, K, and Na but did not affect the flow of Mn and
Zn at the total tract level. Phytase supplementation did not affect (P > 0.05) the flow of any of
the minerals at the ileal or total tract levels.
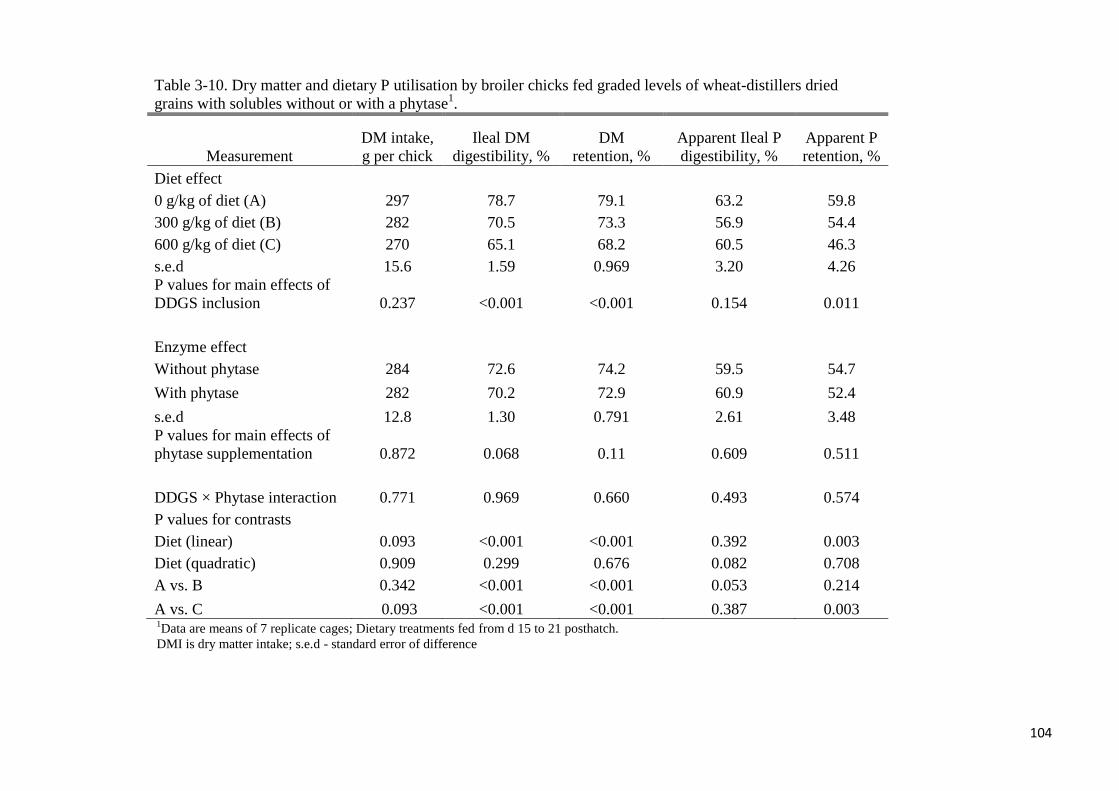
104
1Data are means of 7 replicate cages; Dietary treatments fed from d 15 to 21 posthatch.
DMI is dry matter intake; s.e.d - standard error of difference
Table 3-10. Dry matter and dietary P utilisation by broiler chicks fed graded levels of wheat-distillers dried
grains with solubles without or with a phytase1.
Measurement
DM intake,
g per chick
Ileal DM
digestibility, %
DM
retention, %
Apparent Ileal P
digestibility, %
Apparent P
retention, %
Diet effect
0 g/kg of diet (A) 297 78.7 79.1 63.2 59.8
300 g/kg of diet (B) 282 70.5 73.3 56.9 54.4
600 g/kg of diet (C) 270 65.1 68.2 60.5 46.3
s.e.d 15.6 1.59 0.969 3.20 4.26
P values for main effects of
DDGS inclusion 0.237 <0.001 <0.001 0.154 0.011
Enzyme effect
Without phytase 284 72.6 74.2 59.5 54.7
With phytase 282 70.2 72.9 60.9 52.4
s.e.d 12.8 1.30 0.791 2.61 3.48
P values for main effects of
phytase supplementation 0.872 0.068 0.11 0.609 0.511
DDGS × Phytase interaction 0.771 0.969 0.660 0.493 0.574
P values for contrasts
Diet (linear) 0.093 <0.001 <0.001 0.392 0.003
Diet (quadratic) 0.909 0.299 0.676 0.082 0.708
A vs. B 0.342 <0.001 <0.001 0.053 0.214
A vs. C 0.093 <0.001 <0.001 0.387 0.003
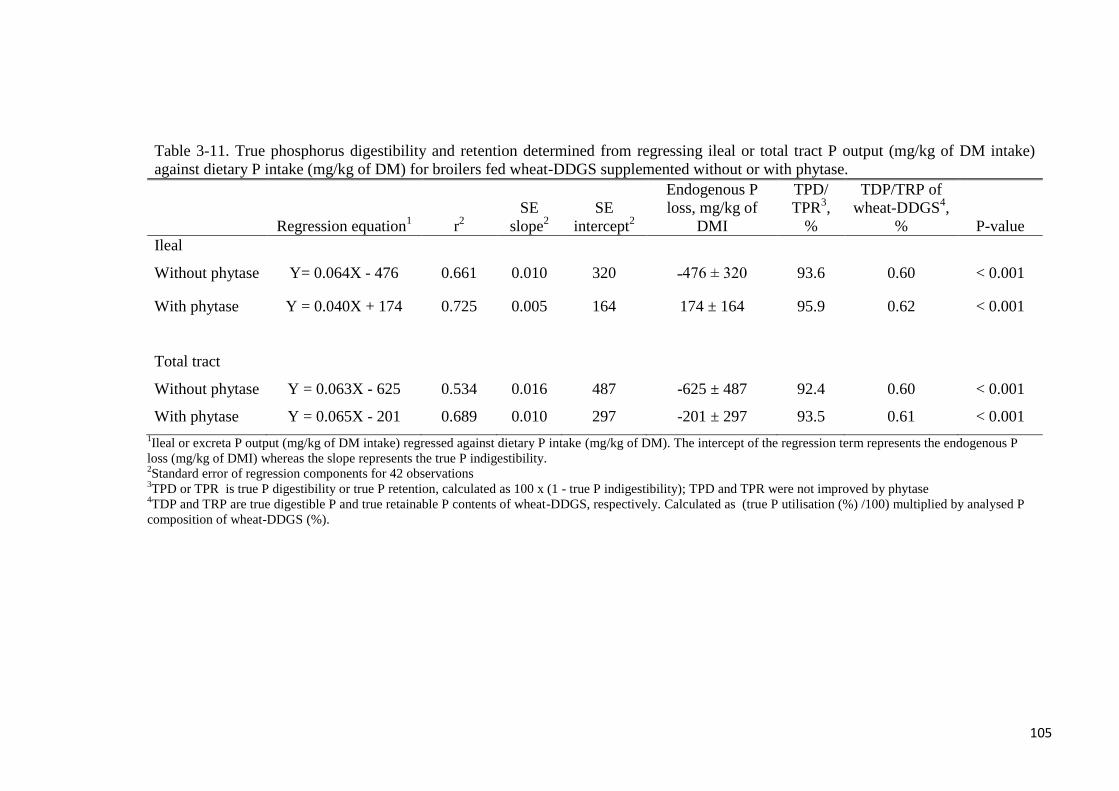
105
Table 3-11. True phosphorus digestibility and retention determined from regressing ileal or total tract P output (mg/kg of DM intake)
against dietary P intake (mg/kg of DM) for broilers fed wheat-DDGS supplemented without or with phytase.
Regression equation1 r
2
SE
slope2
SE
intercept2
Endogenous P
loss, mg/kg of
DMI
TPD/
TPR3,
%
TDP/TRP of
wheat-DDGS4,
% P-value
Ileal
Without phytase Y= 0.064X - 476 0.661 0.010 320 ˗476 ± 320 93.6 0.60 < 0.001
With phytase Y = 0.040X + 174 0.725 0.005 164 174 ± 164 95.9 0.62 < 0.001
Total tract
Without phytase Y = 0.063X - 625 0.534 0.016 487 -625 ± 487 92.4 0.60 < 0.001
With phytase Y = 0.065X - 201 0.689 0.010 297 -201 ± 297 93.5 0.61 < 0.001
1Ileal or excreta P output (mg/kg of DM intake) regressed against dietary P intake (mg/kg of DM). The intercept of the regression term represents the endogenous P
loss (mg/kg of DMI) whereas the slope represents the true P indigestibility. 2Standard error of regression components for 42 observations
3TPD or TPR is true P digestibility or true P retention, calculated as 100 x (1 - true P indigestibility); TPD and TPR were not improved by phytase
4TDP and TRP are true digestible P and true retainable P contents of wheat-DDGS, respectively. Calculated as (true P utilisation (%) /100) multiplied by analysed P
composition of wheat-DDGS (%).
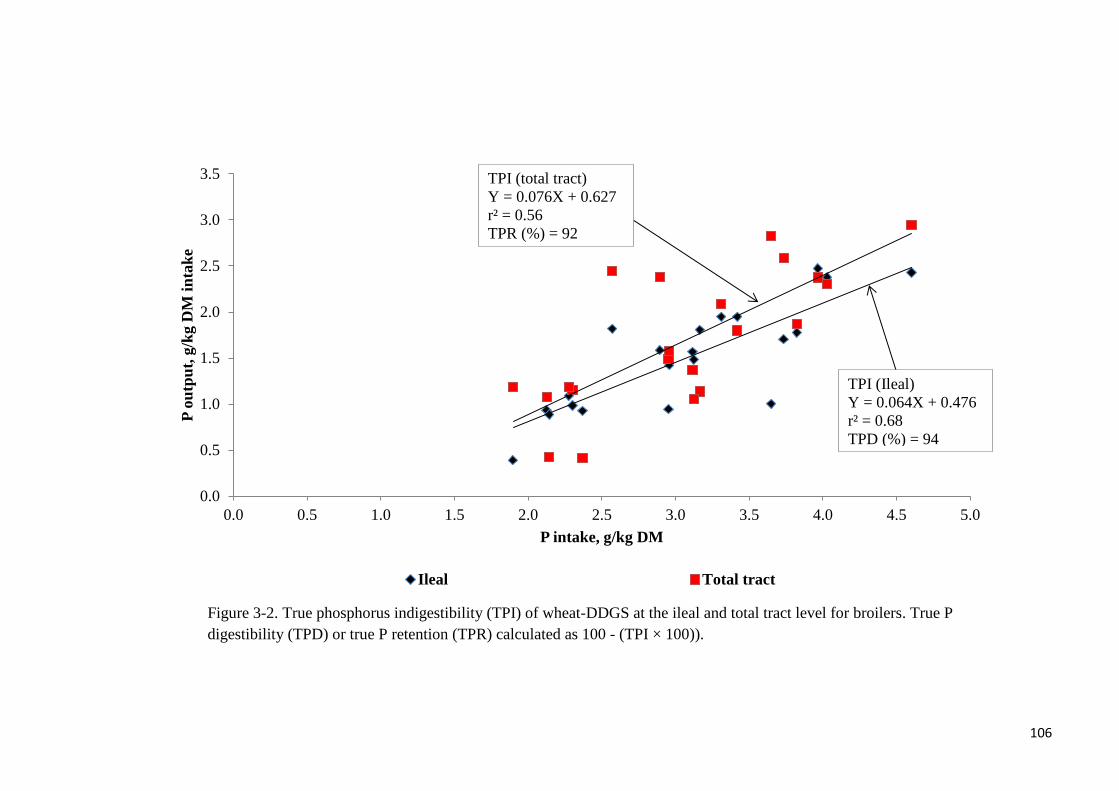
106
Figure 3-2. True phosphorus indigestibility (TPI) of wheat-DDGS at the ileal and total tract level for broilers. True P
digestibility (TPD) or true P retention (TPR) calculated as 100 - (TPI × 100)).
0.0
0.5
1.0
1.5
2.0
2.5
3.0
3.5
0.0 0.5 1.0 1.5 2.0 2.5 3.0 3.5 4.0 4.5 5.0
P o
utp
ut,
g/k
g D
M i
nta
ke
P intake, g/kg DM
Ileal Total tract
TPI (total tract)
Y = 0.076X + 0.627
r² = 0.56
TPR (%) = 92
TPI (Ileal)
Y = 0.064X + 0.476
r² = 0.68
TPD (%) = 94
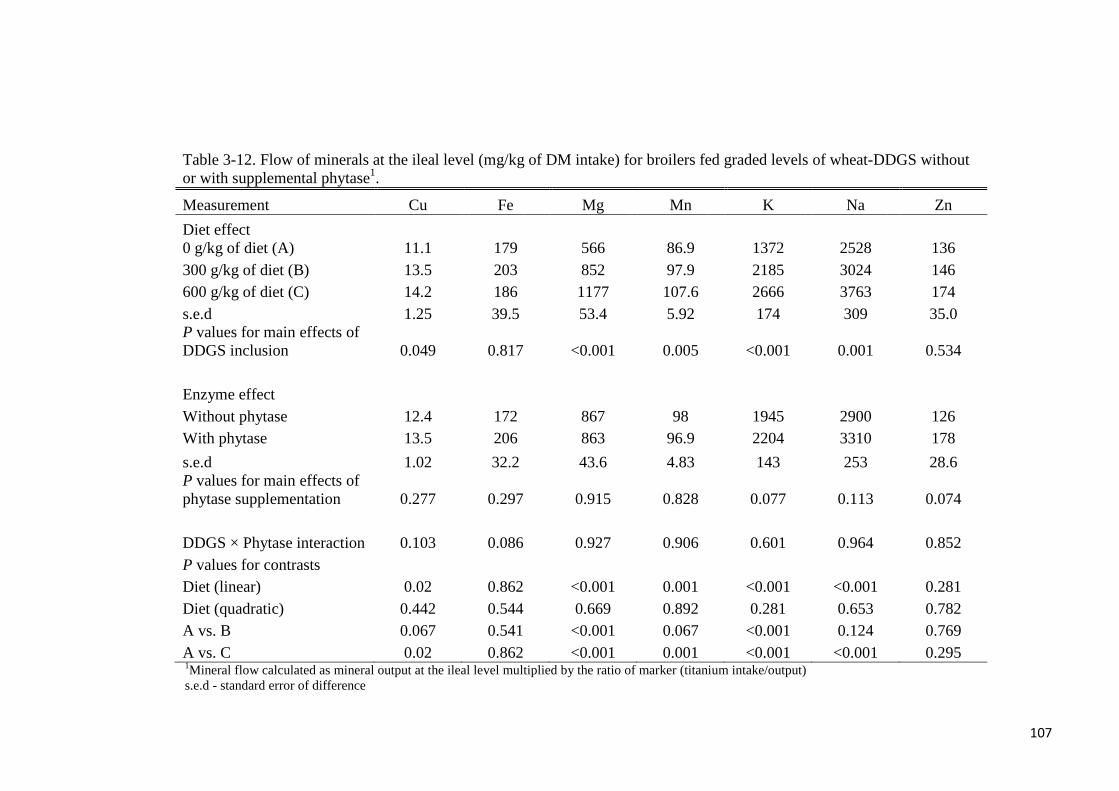
107
Table 3-12. Flow of minerals at the ileal level (mg/kg of DM intake) for broilers fed graded levels of wheat-DDGS without
or with supplemental phytase1.
Measurement Cu Fe Mg Mn K Na Zn
Diet effect
0 g/kg of diet (A) 11.1 179 566 86.9 1372 2528 136
300 g/kg of diet (B) 13.5 203 852 97.9 2185 3024 146
600 g/kg of diet (C) 14.2 186 1177 107.6 2666 3763 174
s.e.d 1.25 39.5 53.4 5.92 174 309 35.0
P values for main effects of
DDGS inclusion 0.049 0.817 <0.001 0.005 <0.001 0.001 0.534
Enzyme effect
Without phytase 12.4 172 867 98 1945 2900 126
With phytase 13.5 206 863 96.9 2204 3310 178
s.e.d 1.02 32.2 43.6 4.83 143 253 28.6
P values for main effects of
phytase supplementation 0.277 0.297 0.915 0.828 0.077 0.113 0.074
DDGS × Phytase interaction 0.103 0.086 0.927 0.906 0.601 0.964 0.852
P values for contrasts
Diet (linear) 0.02 0.862 <0.001 0.001 <0.001 <0.001 0.281
Diet (quadratic) 0.442 0.544 0.669 0.892 0.281 0.653 0.782
A vs. B 0.067 0.541 <0.001 0.067 <0.001 0.124 0.769
A vs. C 0.02 0.862 <0.001 0.001 <0.001 <0.001 0.295 1Mineral flow calculated as mineral output at the ileal level multiplied by the ratio of marker (titanium intake/output)
s.e.d - standard error of difference
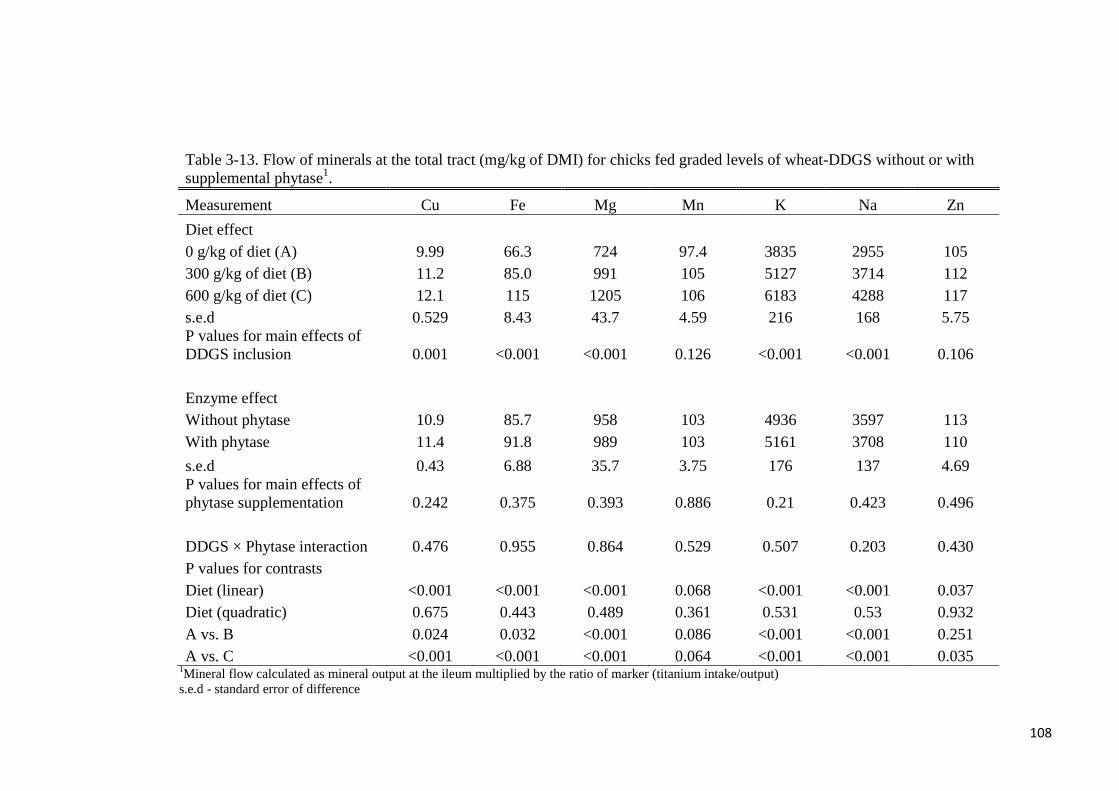
108
Table 3-13. Flow of minerals at the total tract (mg/kg of DMI) for chicks fed graded levels of wheat-DDGS without or with
supplemental phytase1.
Measurement Cu Fe Mg Mn K Na Zn
Diet effect
0 g/kg of diet (A) 9.99 66.3 724 97.4 3835 2955 105
300 g/kg of diet (B) 11.2 85.0 991 105 5127 3714 112
600 g/kg of diet (C) 12.1 115 1205 106 6183 4288 117
s.e.d 0.529 8.43 43.7 4.59 216 168 5.75
P values for main effects of
DDGS inclusion 0.001 <0.001 <0.001 0.126 <0.001 <0.001 0.106
Enzyme effect
Without phytase 10.9 85.7 958 103 4936 3597 113
With phytase 11.4 91.8 989 103 5161 3708 110
s.e.d 0.43 6.88 35.7 3.75 176 137 4.69
P values for main effects of
phytase supplementation 0.242 0.375 0.393 0.886 0.21 0.423 0.496
DDGS × Phytase interaction 0.476 0.955 0.864 0.529 0.507 0.203 0.430
P values for contrasts
Diet (linear) <0.001 <0.001 <0.001 0.068 <0.001 <0.001 0.037
Diet (quadratic) 0.675 0.443 0.489 0.361 0.531 0.53 0.932
A vs. B 0.024 0.032 <0.001 0.086 <0.001 <0.001 0.251
A vs. C <0.001 <0.001 <0.001 0.064 <0.001 <0.001 0.035 1Mineral flow calculated as mineral output at the ileum multiplied by the ratio of marker (titanium intake/output)
s.e.d - standard error of difference
109
3.3.3 Apparent- and Standardised Ileal Amino Acids Digestibility of Wheat Distillers
Dried Grains with Solubles without- or with Protease for Broilers
The analysed chemical composition and protease activities for the four experimental diets
used in the current study are presented in Table 3-6. The analysed nutrient composition for the
four diets was in good agreement with the expected values. Average protease activity in the
experimental diets supplemented with protease was 3318 U/kg. The analysed protease activity
is lower than the expected value of 4000 U/kg.
The AIAAD and SIAAD of wheat-DDGS without- or with supplemental protease for broilers
are presented in Table 3-14. Apparent ileal digestibility (AID) of N in wheat-DDGS without-
or with added protease for broilers was 49.3 or 60.2%, respectively. Respective standardised
ileal digestibility (SID) values were 51.3 and 62.8%. Protease supplementation increased (P <
0.05) the AID or SID of N by 10.9 or 11.5 percentage units, respectively. The AID of Lys in
the wheat-DDGS for broilers was zero. The lowest AID were observed for Asp (34%) and
Ala (35%), whereas, Pro (75%), Glu (75%) and Phe (56%) were the most digestible AA in the
wheat-DDGS. Apparent ileal AA digestibility ranged from 35% (Ala) to 75% (Pro) in the
dietary treatments without added protease whereas the range was 42% (Thr) to 82% (Pro) in
the protease supplemented diets. Of the indispensable AA, the highest and lowest AID was
observed for Phe (56%) and Met (37%), respectively, for the diets without supplemental
protease. Protease improved (P < 0.05) the AID of Arg and Pro and tended to improve (P <
0.10) the AID of Met.
The mean SID for Lys in the wheat-DDGS without- or with supplemental protease for
broilers was 2 or 43%, respectively. A large increase in the SID of Lys was noted with the
addition of protease (41%). The lowest and highest SID values (excluding Lys) were observed
for Asp (43%) and Pro (84%), respectively. This range was from 54% (Asp) to 93% (Pro),
respectively with the addition of protease. Histidine (72%) and Phe (71%) were the most
digestible (SID) amongst the indispensable AA in the wheat-DDGS. Protease addition
improved (P < 0.05) the SID of Arg, Leu, Phe, Met, Val and Pro by 21, 14, 13, 26, 13 and 10
percentage points, respectively.
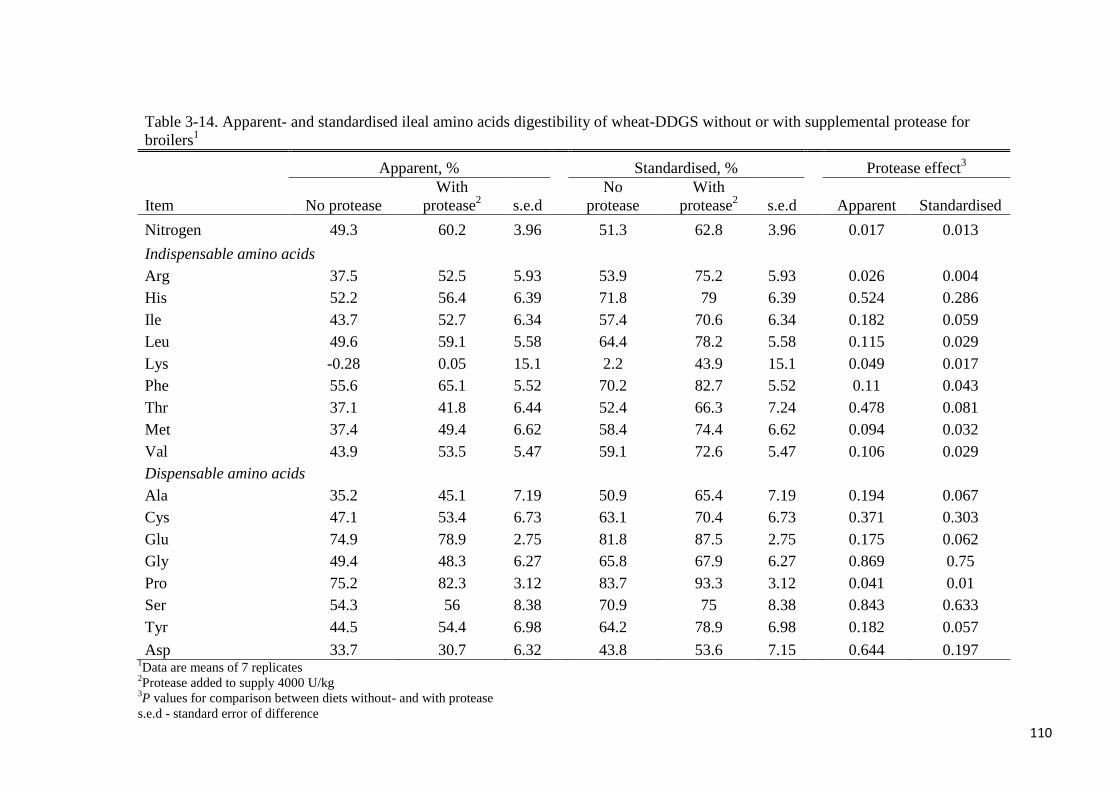
110
Table 3-14. Apparent- and standardised ileal amino acids digestibility of wheat-DDGS without or with supplemental protease for
broilers1
Apparent, %
Standardised, %
Protease effect3
Item No protease
With
protease2 s.e.d
No
protease
With
protease2 s.e.d Apparent Standardised
Nitrogen 49.3 60.2 3.96
51.3 62.8 3.96
0.017 0.013
Indispensable amino acids
Arg 37.5 52.5 5.93
53.9 75.2 5.93
0.026 0.004
His 52.2 56.4 6.39
71.8 79 6.39
0.524 0.286
Ile 43.7 52.7 6.34
57.4 70.6 6.34
0.182 0.059
Leu 49.6 59.1 5.58
64.4 78.2 5.58
0.115 0.029
Lys -0.28 0.05 15.1
2.2 43.9 15.1
0.049 0.017
Phe 55.6 65.1 5.52
70.2 82.7 5.52
0.11 0.043
Thr 37.1 41.8 6.44
52.4 66.3 7.24
0.478 0.081
Met 37.4 49.4 6.62
58.4 74.4 6.62
0.094 0.032
Val 43.9 53.5 5.47
59.1 72.6 5.47
0.106 0.029
Dispensable amino acids
Ala 35.2 45.1 7.19
50.9 65.4 7.19
0.194 0.067
Cys 47.1 53.4 6.73
63.1 70.4 6.73
0.371 0.303
Glu 74.9 78.9 2.75
81.8 87.5 2.75
0.175 0.062
Gly 49.4 48.3 6.27
65.8 67.9 6.27
0.869 0.75
Pro 75.2 82.3 3.12
83.7 93.3 3.12
0.041 0.01
Ser 54.3 56 8.38
70.9 75 8.38
0.843 0.633
Tyr 44.5 54.4 6.98
64.2 78.9 6.98
0.182 0.057
Asp 33.7 30.7 6.32 43.8 53.6 7.15 0.644 0.197 1Data are means of 7 replicates
2Protease added to supply 4000 U/kg
3P values for comparison between diets without- and with protease
s.e.d - standard error of difference
111
3.4 DISCUSSION
Metabolisable energy content of wheat-DDGS without- or with a combination of xylanase,
amylase and protease enzymes for broilers
Because of the increased availability of wheat-DDGS, it is now possible to substitute wheat
with wheat-DDGS as a dietary source of energy for broilers. The current study determined
therefore, the AME and AMEn value of wheat-DDGS for broilers as well as the improvements
to the energy value of wheat-DDGS by supplementation of a combination of exogenous
xylanase, amylase and protease. The hypotheses were that wheat-DDGS is a good dietary
source of energy for broilers and that XAP will increase the energy value of wheat-DDGS for
broilers.
The wheat-DDGS used in the current study was produced and acquired from a new fuel
bioethanol production facility in the UK. The wheat-DDGS contained by analysis, 858 g/kg
of DM, 326 g/kg of CP, 18 MJ/kg of GE, 80 g/kg of CF, 73 g/kg of ether extract (EE), 389
g/kg of neutral detergent fibre (NDF), 223 g/kg of acid detergent fibre (ADF) and 46 g/kg of
ash. In comparison, the chemical characteristics of this wheat-DDGS is close to those used in
the study of Bolarinwa and Adeola (2012) as well as the mean values of 930 g/kg of DM, 38
g/kg of CP, 20 MJ/kg of GE, 77 g/kg of CF, 54 g/kg of EE, 344 g/kg of NDF, 139 g/kg of
ADF and 53 g/kg of ash from 11 sources of wheat-DDGS (Chapter 2).
A limitation with using wheat-DDGS as a feed ingredient for poultry is the variation in its
chemical composition among sources (Fastinger et al., 2006). The NDF and ADF contents for
the wheat-DDGS used in the current study was slightly greater compared with those reported
by Nyachoti et al. (2005) or Bolarinwa and Adeola, (2012). The greater levels of NDF and
ADF observed for the wheat-DDGS used in the current study compared with those of
Nyachoti et al. (2005) and Bolarinwa and Adeola, (2012) may be due to a high level of NDF
and ADF fractions in the wheat used to produce the DDGS or a greater efficiency in the
conversion of starch into ethanol leading to a much larger concentration of the fibre fractions
in the wheat-DDGS due to a lower dilution from residual starch. Another notable practice that
may cause variability in wheat-DDGS composition is the amount of condensed solubles
added back to distillers grains, and this is because the fibre composition of these two products
differ significantly (Liu 2011).
Increasing the level of wheat-DDGS in the reference diet decreased linearly DM retention,
AME and AMEn, regardless of XAP supplementation. Inclusion of 30% wheat-DDGS to the
112
reference wheat-SBM diet reduced DM retention by 11% and energy utilisation by 8%
whereas the reductions were 16 and 11%, respectively when wheat-DDGS inclusion was
increased to 60%. It is common knowledge that dietary fibre reduces DM retention in broilers
due to its low digestibility (Adeola et al. 2010). The increase in dietary fibre associated with
increasing wheat-DDGS levels may explain the reductions in DM retention and energy
utilisation observed in the current study. Bolarinwa and Adeola (2012) noted a linear
reduction in DM and energy utilisation of the reference diet when wheat-DDGS was
incorporated at an inclusion level of 20%. Similarly, Adeola et al. (2010) reported an average
reduction in AME and AMEn of 23% when using maize-DDGS at 600 g/kg in a maize-SBM
reference diet. Also, Adeola and Ileleji (2009) noted a linear decrease from 79 to 59% in
energy retention as the level of maize-DDGS increased from 0 to 60% in the reference maize-
SBM diet.
Despite the fact that non starch polysaccharide (NSP) degrading enzymes are used during
bioethanol production to reduce mash viscosity, the concentration of NSP in maize-DDGS
have been reported to still increase substantially (Widyaratne and Zijlstra, 2007). The anti-
nutritional effects of NSP for poultry are well described in literature (Adeola and Bedford
2004; Choct et al., 2004). Carbohydrases are able to hydrolyse NSP into sugars that can be
utilised by the bird (Bedford, 2000) whereas proteases help to improve protein utilisation
(Adeola and Cowieson, 2011). The wheat-DDGS used in the current study contained 389 g/kg
of NDF that could be substrates for carbohydrase enzymes. These enzymes have been shown
to be effective in improving energy value and nutrient digestibility of wheat-based diets for
poultry (Choct et al. 2004; Adeola and Cowieson, 2011). Therefore, it was expected that an
enzyme admixture containing xylanase, amylase and protease activities will increase the
nutritive value of the diet for broilers by improving energy and protein utilisation. Indeed,
XAP increased the dietary AME and AMEn contents of the wheat-DDGS for broilers in the
current study; however the improvements in dietary energy utilisation noted were not
statistically significant. Previously, Liu et al. (2011) reported a 20% reduction in
hemicellulose levels and a 2.59 MJ/kg increase in AME in diets containing maize-DDGS
when investigating the effect of supplemental xylanase on growth performance and nutrient
digestibility in broilers. Also, addition of an NSP hydrolysing enzyme to a diet containing
20% of maize-DDGS increased significantly the dietary AME for broilers in a study by Lee et
al. (2010). In the current study, the improvements noted in the energy value of the wheat-
DDGS due to XAP supplementation were marginal and were not statistically significant. The
lack of XAP effect in the current study is least expected because feed ingredients or diets that
contain substantial concentrations of fibre respond to a greater extent to carbohydrase
113
supplementation (Bedford, 2000). The effect of XAP to improve the ME value of wheat-
DDGS for broilers may require further investigation.
The AME value of wheat-DDGS for broilers was determined to be 15.01 MJ/kg of DM in the
current study. This value is greater compared with the 11.1 or 9.27 MJ/kg of DM for 2
wheat-DDGS samples, reported in the Bolarinwa and Adeola (2012) study, as well as the
range of 8.97 to 12 MJ/kg of DM for 10 samples of wheat-DDGS noted in the study of
Cozannet et al. (2010a). The AME derived for wheat-DDGS in the current study was at the
least 4.81 MJ/kg of DM greater compared with average AME values noted by Bolarinwa and
Adeola (2012) and Cozannet et al. (2010a). It is common practice to correct the AME value
of feed ingredients for nitrogen retention in order to account for variability in energy
utilisation that may occur due to differences in age and species of the animal as well as the
protein quality of a diet. Correction for N retention resulted in a 6.4% reduction in the AME
value of the wheat-DDGS in the current study which is similar to the 6 to 7% reduction
reported by Bolarinwa and Adeola (2012). The AMEn value of wheat-DDGS was determined
to be 14.04 MJ/kg of DM in the current study. Similarly, the AMEn value determined in the
current study was greater compared with the mean values of 9.53, 9.93 and 10.9 MJ/kg of DM
reported by Bolarinwa and Adeola (2012), Cozannet et al. (2010a) and Vilarino et al. (2007),
respectively.
The reason/s for the greater energy value for wheat-DDGS noted in the current study
compared with other studies (Cozannet et al; 2010a; Bolarinwa and Adeola, 2012) may be
due to the differences in the characteristics of the co-product. Under normal circumstances,
the fermentation process cannot effectively convert all the starch in the grain into ethanol.
Thus, there are usually residual starch and sugars in the co-product at variable quantities
depending on the efficiency of fermentation (Vilarino et al., 2007). This may explain some of
the differences observed in the GE values of the DDGS among sources. Because sugars and
starch are more readily utilised in the gut, it is possible that differences in the quantity of
residual sugars and starch in the DDGS among sources may also affect its AME value. The
GE in the wheat-DDGS used in the current study was greater compared with the average of
those used in the study of Bolarinwa and Adeola (2012) (21.6 vs 18.9 MJ/kg DM,
respectively). Nonetheless, energy metabolisability in the wheat-DDGS in the current study
was 68% and was close to the 63% reported by Bolarinwa and Adeola (2012). It therefore
appears that the GE of the wheat-DDGS is vital to determining its metabolisable energy
content for broilers.
114
The efficacy of exogenous enzymes to improve the nutritive value of bioethanol co-products
has been determined predominantly for maize-DDGS (Adeola and Ileleji, 2009; Liu et al.,
2011). Greater benefits may be derived from using exogenous enzymes in diets containing
wheat-DDGS because wheat contains higher levels of NSP than maize. An admixture of XAP
did not improve the AME or AMEn of the wheat-DDGS for broilers in the current study. It is
not clear why the analysed xylanase and protease activities were about 20% lower than the
expected values; nonetheless, the disparity should have little effect on the outcomes given that
the analysed enzyme activities were within the range where an improvement in the energy
value of the wheat-DDGS could still be expected. In a broiler study using a mixture of
xylanase and amylase enzymes, Adeola et al. (2010) reported a 5.7 or 6.2% improvement in
AME or AMEn values, respectively for maize-DDGS. More studies are needed to examine the
benefits of supplemental XAP on the energy value of wheat-DDGS for broilers considering
that wheat-DDGS contains a greater quantity of dietary fibre compared with maize-DDGS.
In conclusion, the AME and AMEn values of wheat-DDGS are 15.01 and 14.04 MJ/kg of DM,
respectively for broilers. There is possibility that the gross energy value of wheat-DDGS may
define its metabolisable energy content for broilers and this may explain some of the
differences in the AME values noted among sources. A combination of xylanase, amylase and
protease marginally increased the metabolisable energy content in the wheat-DDGS for
broilers in the current study.
True P digestibility and retention of wheat-DDGS without- or with supplemental phytase
for broilers
Excessive P in poultry manure is harmful to the environment whereas below optimal levels of
dietary P reduces animal productivity. Therefore, evaluating the digestible P for feed
ingredients used for broilers is essential to avoid oversupply or under provision of P in the
diet. The objective of the current study was to determine the digestible P in wheat-DDGS
without- or with exogenous phytase for broilers. It was hypothesized that wheat-DDGS is a
good source of digestible P for broilers and that supplemental phytase will increase P in
wheat-DDGS.
During bioethanol production, the concentration of P is increased 3-fold in the wheat-DDGS
after the removal of starch from the wheat by fermentation, but what is more important is that
a large proportion of the phytate-bound P in the wheat are dissociated from phytate by yeast
phytase. For this reason, DDGS is generally considered a valuable source of digestible P for
115
monogastrics (Spiehs et al., 2002). The wheat-DDGS used in the current study contained 7.6
g/kg DM of total P which is lower compared with the 12.3 g/kg DM reported by Thacker and
Widyaratne (2007) or the 9.4 g/kg DM noted by Nyachoti et al. (2005). The differences in the
P content of wheat-DDGS highlights the variability in its chemical composition among
sources. The variability in the total P concentration of wheat-DDGS among sources is likely
due to differences in the P composition of the wheat used to produce the DDGS.
Increasing the dietary inclusion level of wheat-DDGS decreased apparent P retention in a
linear manner, whereas, apparent ileal P digestibility did not differ among all treatments.
Because the diets were formulated to contain total P at levels lower than are required by the
bird so as to achieve a linear response in P utilisation, it is likely that the increase in dietary
fibre level as wheat-DDGS replaced the more readily digestible corn starch impaired nutrient
digestibility as explained by the reduction in dietary ileal DM digestibility and total tract
retention. Thacker and Widyaratne (2007) reported a reduction in apparent P retention when
using graded levels of wheat-DDGS in a practical wheat-SBM diet for broilers. Dilger and
Adeola (2006) on the other hand reported a linear increase in diet apparent ileal P digestibility
and total tract retention when determining the true P digestibility and retention of SBM for
broiler chicks. The difference between the observations made in the study of Dilger and
Adeola, 2006 and the current may be partly explained by the lower levels of dietary insoluble
fibre levels in SBM compared with the wheat-DDGS being tested in the current study.
Supplemental phytase did not improve dietary ileal P digestibility or total tract P retention in
the current study. The efficacy of phytase to hydrolyse phytate P into non phytate bound P
have been extensively described and reviewed (Selle and Ravindran, 2007; Woyengo and
Nyachoti, 2011). Liu and Han (2011) assessed the concentrations of different forms of P (non
phytate-P, phytate-bound P, and total P) in different streams of the bioethanol production
process and reported an increase in maize-DDGS over maize grain of 1.8 fold in phytate-P
and 10.8 fold in non-phytate P. The authors found that during the fermentation process,
percentage phytate-P in total P decreased significantly whereas percentage non phytate-P in
total P increased. These observations suggest that phytate underwent degradation through the
actions of yeast phytase. It is acceptable to speculate that the lack of improvement in P
digestibility and retention noted in the current study may be because the majority of the
phytate bound P in the wheat are already hydrolysed during the production of wheat-DDGS;
thus leaving little or no substrate for phytase to hydrolyse.
116
The regression method utilises the relationship between undigested P and dietary P intake to
simultaneously determine the true P digestibility or retention and basal endogenous P loss. In
the current study, there was a strong relationship between undigested P and dietary P intake; a
relationship that is pre-requisite for the use of the regression technique. The linear regression
method has been used previously to determine true P retention of feed ingredients for broilers
(Dilger and Adeola, 2006) and swine (Akinmusire and Adeola, 2009) as well as for
determination of true ileal AA digestibility of feed ingredients for broilers (Kong and Adeola,
2011). True P digestibility or retention of wheat-DDGS for broilers was greater than 90% in
the current study. This observation suggests that majority of the P in wheat-DDGS may have
been present in the form that is readily utilisable for the bird (Liu and Han, 2011).
Martinez-Amezcua et al. (2004) observed that more than 25% of the total P may be bound to
phytate in maize-DDGS, and this is a reason why it is necessary to determine the efficacy of
supplemental phytase in improving P utilisation for DDGS. Phytate may increase endogenous
mineral losses by increasing secretion of mucin (Cowieson et al., 2004), forming complexes
with cations and making them unavailable for absorption or bonding with endogenous
enzymes and as a result reducing their efficacy (Dilworth et al., 2005), or cause a
modification to the gastrointestinal electrolyte balance leading to less efficient mineral
utilisation (Ravindran et al., 2008). On the other hand, phytase improves the utilisation of
minerals by counteracting the anti-nutritional effects of phytate (Cowieson et al., 2004; Liu
and Ru, 2010). Except for Fe and Zn at the ileal, and Mn and Zn at the total tract level,
increasing the dietary inclusion of wheat-DDGS increased the flow of all other minerals in the
current study. Because the current study was designed primarily to determine the TPD or TPR
of wheat-DDGS for broilers, the dietary treatments were formulated in such a way that P was
the only mineral that was limiting. It is therefore not surprising that increasing the inclusion
level of wheat-DDGS resulted in an increase in the flow of majority of the minerals at the
ileal and total tract as increasing the level of wheat-DDGS would have caused a further
increase in the dietary intake of minerals beyond the levels required by the birds.
Supplemental phytase did not affect the flow of minerals at either the ileal or total tract level
in the current study. Compared with other studies (Cowieson et al., 2004; Liu and Ru, 2010)
where exogenous sodium phytate was used to increase the levels of phytate in the diet; wheat-
DDGS was the only possible source of phytate in the current study. It is speculated that the
level of phytate in the wheat-DDGS may have been low as evidenced by the high P
digestibility and retention values noted, therefore, there would have been a low levels of
117
substrate (phytate) for the supplemental phytase to hydrolyse which may be a possible reason
for the lack of phytase effect on mineral flow.
In conclusion, the results from the current study indicate that wheat-DDGS is a good source
of digestible P for broilers; therefore the inclusion of wheat-DDGS in the diet will reduce the
use of inorganic P sources in the diet. The true ileal digestibility of wheat-DDGS for broilers
is 96% and true P retention is 93% at the total tract level. Supplemental phytase did not
improve the P digestibility or retention in the wheat-DDGS for broilers.
Apparent- and standardised ileal amino acid digestibility of wheat-DDGS without- or with
supplemental protease for broilers
An important chemical property of wheat-DDGS is its similar CP and AA content with other
conventional protein feed ingredients such as canola meal. Compared with maize-DDGS,
there is limited data about the digestibility of AA in wheat-DDGS for broilers and no
information about the efficacy of exogenous protease to improve AA digestibility. Because
information about the profile, balance and utilisation of AA in feed ingredients are essential
prerequisites in diet formulations for broilers, the objective of the current study was to
determine the AIAAD and SIAAD of wheat-DDGS without- or with a protease. The AID of
CP was determined to be 49.3% in the current study indicating that only half of the total
protein in the wheat-DDGS was utilised by the birds. In a similar experiment, Bandegan et al.
(2009) found the average AID of CP for 5 samples of wheat-DDGS to be 67% for broilers. In
addition, the SID for wheat-DDGS in the current study was lower than those reported by
Bandegan et al. (2009) (69%) as well as that of Kluth and Rudehutscord (2010) (64%).
Cozannet et al. (2010b) also reported the mean SID of CP in 7 wheat-DDGS samples to be
80% in caecectomised roosters.
Apparent ileal amino acids digestibility of wheat-DDGS for broilers was generally low in the
current study. The least digestible AA in wheat-DDGS were Lys and Asp. In fact, the AID
and SID values recorded for Lys were zero. Similar zero digestibility for Lys in wheat-DDGS
have been reported by Cozannet et al. (2011) whereas Kluth and Rodehuscord (2010) have
also noted the AID of Lys and Asp to be the lowest in wheat-DDGS for broilers. The
observation in the current study that Lys is the least digestible AA in wheat-DDGS is also
consistent with those of Bandegan et al. (2009) and Cozannet et al. (2011) as well as in
studies using maize-DDGS for broilers (Lumpkins et al., 2004; Batal and Dale, 2006). Except
for His, Phe, Glu, Ser and Pro, AID was lower than 50% for all other AA with the mean
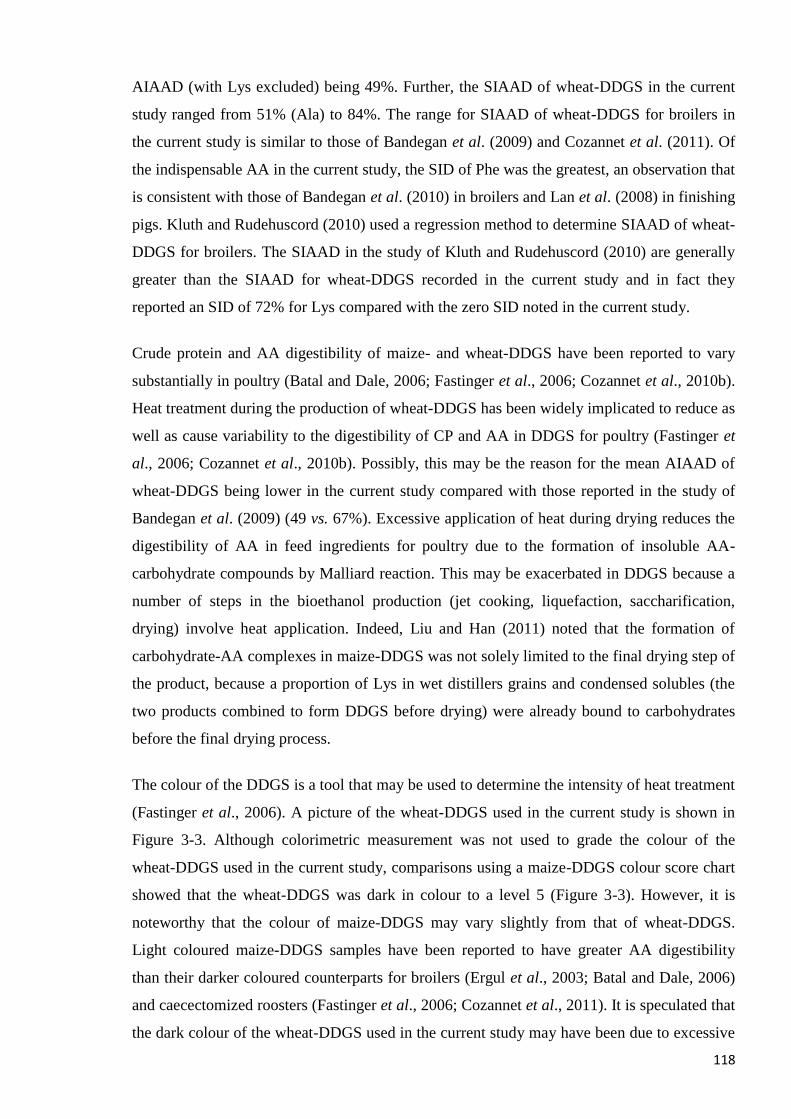
118
AIAAD (with Lys excluded) being 49%. Further, the SIAAD of wheat-DDGS in the current
study ranged from 51% (Ala) to 84%. The range for SIAAD of wheat-DDGS for broilers in
the current study is similar to those of Bandegan et al. (2009) and Cozannet et al. (2011). Of
the indispensable AA in the current study, the SID of Phe was the greatest, an observation that
is consistent with those of Bandegan et al. (2010) in broilers and Lan et al. (2008) in finishing
pigs. Kluth and Rudehuscord (2010) used a regression method to determine SIAAD of wheat-
DDGS for broilers. The SIAAD in the study of Kluth and Rudehuscord (2010) are generally
greater than the SIAAD for wheat-DDGS recorded in the current study and in fact they
reported an SID of 72% for Lys compared with the zero SID noted in the current study.
Crude protein and AA digestibility of maize- and wheat-DDGS have been reported to vary
substantially in poultry (Batal and Dale, 2006; Fastinger et al., 2006; Cozannet et al., 2010b).
Heat treatment during the production of wheat-DDGS has been widely implicated to reduce as
well as cause variability to the digestibility of CP and AA in DDGS for poultry (Fastinger et
al., 2006; Cozannet et al., 2010b). Possibly, this may be the reason for the mean AIAAD of
wheat-DDGS being lower in the current study compared with those reported in the study of
Bandegan et al. (2009) (49 vs. 67%). Excessive application of heat during drying reduces the
digestibility of AA in feed ingredients for poultry due to the formation of insoluble AA-
carbohydrate compounds by Malliard reaction. This may be exacerbated in DDGS because a
number of steps in the bioethanol production (jet cooking, liquefaction, saccharification,
drying) involve heat application. Indeed, Liu and Han (2011) noted that the formation of
carbohydrate-AA complexes in maize-DDGS was not solely limited to the final drying step of
the product, because a proportion of Lys in wet distillers grains and condensed solubles (the
two products combined to form DDGS before drying) were already bound to carbohydrates
before the final drying process.
The colour of the DDGS is a tool that may be used to determine the intensity of heat treatment
(Fastinger et al., 2006). A picture of the wheat-DDGS used in the current study is shown in
Figure 3-3. Although colorimetric measurement was not used to grade the colour of the
wheat-DDGS used in the current study, comparisons using a maize-DDGS colour score chart
showed that the wheat-DDGS was dark in colour to a level 5 (Figure 3-3). However, it is
noteworthy that the colour of maize-DDGS may vary slightly from that of wheat-DDGS.
Light coloured maize-DDGS samples have been reported to have greater AA digestibility
than their darker coloured counterparts for broilers (Ergul et al., 2003; Batal and Dale, 2006)
and caecectomized roosters (Fastinger et al., 2006; Cozannet et al., 2011). It is speculated that
the dark colour of the wheat-DDGS used in the current study may have been due to excessive
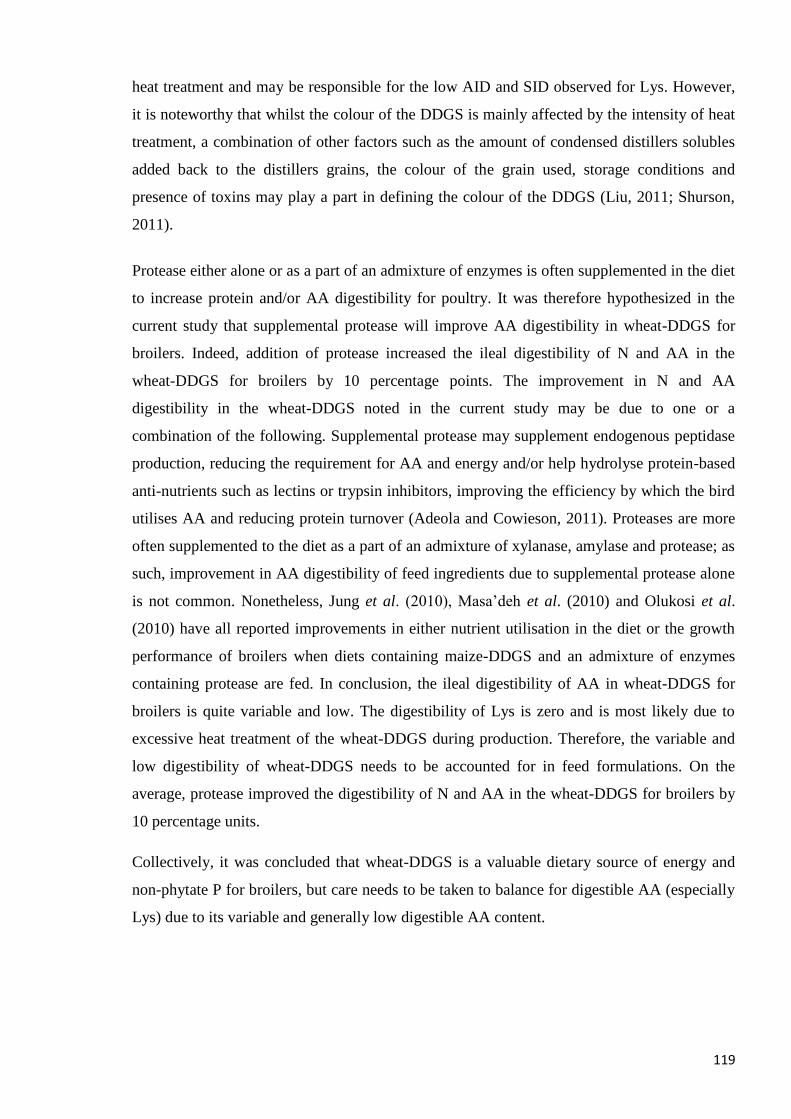
119
heat treatment and may be responsible for the low AID and SID observed for Lys. However,
it is noteworthy that whilst the colour of the DDGS is mainly affected by the intensity of heat
treatment, a combination of other factors such as the amount of condensed distillers solubles
added back to the distillers grains, the colour of the grain used, storage conditions and
presence of toxins may play a part in defining the colour of the DDGS (Liu, 2011; Shurson,
2011).
Protease either alone or as a part of an admixture of enzymes is often supplemented in the diet
to increase protein and/or AA digestibility for poultry. It was therefore hypothesized in the
current study that supplemental protease will improve AA digestibility in wheat-DDGS for
broilers. Indeed, addition of protease increased the ileal digestibility of N and AA in the
wheat-DDGS for broilers by 10 percentage points. The improvement in N and AA
digestibility in the wheat-DDGS noted in the current study may be due to one or a
combination of the following. Supplemental protease may supplement endogenous peptidase
production, reducing the requirement for AA and energy and/or help hydrolyse protein-based
anti-nutrients such as lectins or trypsin inhibitors, improving the efficiency by which the bird
utilises AA and reducing protein turnover (Adeola and Cowieson, 2011). Proteases are more
often supplemented to the diet as a part of an admixture of xylanase, amylase and protease; as
such, improvement in AA digestibility of feed ingredients due to supplemental protease alone
is not common. Nonetheless, Jung et al. (2010), Masa’deh et al. (2010) and Olukosi et al.
(2010) have all reported improvements in either nutrient utilisation in the diet or the growth
performance of broilers when diets containing maize-DDGS and an admixture of enzymes
containing protease are fed. In conclusion, the ileal digestibility of AA in wheat-DDGS for
broilers is quite variable and low. The digestibility of Lys is zero and is most likely due to
excessive heat treatment of the wheat-DDGS during production. Therefore, the variable and
low digestibility of wheat-DDGS needs to be accounted for in feed formulations. On the
average, protease improved the digestibility of N and AA in the wheat-DDGS for broilers by
10 percentage units.
Collectively, it was concluded that wheat-DDGS is a valuable dietary source of energy and
non-phytate P for broilers, but care needs to be taken to balance for digestible AA (especially
Lys) due to its variable and generally low digestible AA content.
120
Figure 3-3. An image of the wheat distillers’ dried grains with solubles used in the current
study (above) and a maize distillers’ dried grains with solubles colour score chart (below)
(Source: Shurson, 2011).
121
CHAPTER 4
METABOLISABLE ENERGY CONTENT, TRUE
PHOSPHORUS DIGESTIBILITY AND ILEAL
DIGESTIBILITY OF AMINO ACIDS IN WHEAT
DISTILLERS’ DRIED GRAINS WITH SOLUBLES WITHOUT
OR WITH EXOGENOUS ENZYMES FOR TURKEY
122
4.1 INTRODUCTION
The nutritional value of wheat Distillers Dried Grains with Solubles (wheat-DDGS) for
broilers was determined and reported in Chapter 3 of this thesis. Because wheat-DDGS can
also be used for turkey and the metabolisable energy and digestible nutrient values in
feedstuffs for turkey and broilers are different, it is also important to determine the nutritional
value of wheat-DDGS for turkey. Because the objectives in the current chapter are similar to
Chapter 3, the Materials and Methods section is similar to the previous chapter. However, the
discussion section in the current chapter detailed the differences between the nutritive value of
wheat-DDGS for turkey and broilers.
Bioethanol production from wheat is currently on the increase in the UK and this industry is
expected to expand rapidly. In fact, biofuels are expected to replace up to 20% of the total
gasoline used in the UK by 2020 and the vast majority of this are expected to be produced
from wheat and oilseeds. Bioethanol production from wheat will also result in an increase in
the quantity of wheat Distillers Dried Grains with Solubles (wheat-DDGS) available as a feed
ingredient for poultry. During bioethanol production, the conversion of starch in the wheat by
fermentation increases the concentrations of crude protein (CP), gross energy (GE) and total P
in wheat-DDGS approximately 3-fold (Nyachoti et al., 2005). It is possible to use wheat-
DDGS as a cheaper and alternative source of energy and amino acids (AA) (partially
replacing wheat and soybean meal) for poultry, especially where the use of wheat for ethanol
production may result in a reduction in the quantity available for use in poultry diets. In view
of the potential of using wheat-DDGS in turkey diets, it is essential that accurate nutrient
values be assigned to the product.
Exogenous enzymes are capable of ameliorating the anti-nutritive effects of non starch
polysaccharides (NSP) and phytate, and hence enhance the digestibility of feed ingredients
and reduce nutrient excretion to the environment by poultry (Adeola and Cowieson, 2011;
Woyengo and Nyachoti, 2011). Information about the value of exogenous enzymes on energy
utilisation, AA and P digestibility of wheat-DDGS for turkey is currently lacking in the
literature. Development of nutrient matrix values for exogenous enzymes in wheat-DDGS
will help in designing a more accurate diet formulation when using enzymes in diets
containing wheat-DDGS.
The overall objective of the current study was to provide data on energy and nutrient values of
wheat-DDGS for turkey. Specific objectives were to: 1) determine the apparent metabolisable
123
energy (AME) and nitrogen-corrected apparent metabolisable energy (AMEn) of wheat-
DDGS without or with an admixture of xylanase, amylase and protease (XAP) for turkey
using a multiple linear regression method, 2) evaluate the true P digestibility and retention of
wheat-DDGS with or without a phytase for turkey and 3) evaluate the ileal AA digestibility
(apparent and standardised) of wheat-DDGS supplemented without- or with a protease for
turkey. It was hypothesized that wheat-DDGS will be a valuable dietary source of energy, AA
and P for turkey.
4.2 MATERIALS AND METHODS
4.2.1 Animals and Management
The Scotland’s Rural College Animal Experimentation Committee approved all bird handling
and sample collection procedures.
A total of 336 male BUT 10 turkey poults were raised together and offered a pre-experimental
diet formulated to meet energy and nutrient requirements (Table 4-1). On d 14, birds were
weighed individually and divided into 3 groups of similar bodyweight consisting of 126, 126
or 84 birds for experiment 1, 2 or 3, respectively. In each experiment, birds were allocated to
one of the experimental diets in a randomized complete block design using d 14 bodyweight
as blocking criterion and transferred to metabolism cages on d 14. Each treatment had seven
replicate cages and three birds per replicate cage. Birds were weighed individually on d 14
and at the end of the experimental period (d21 or 28). In experiment 2 and 3, birds were
euthanized by cervical dislocation on d 28 to allow collection of ileal digesta samples. Birds
were provided ad libitum access to the experimental diets and water throughout the pre- and
experimental periods. The birds were reared in a house with facilities to control temperature,
light, and humidity. Room temperature was maintained at 35oC, 32
oC, 27
oC and 23
oC for day
1 to 7, 8 to 14, 15 to 21 and 22 to 28, respectively. Titanium dioxide (TiO2) was added to the
diets (3 g/kg of diet) as an indigestible marker to enable determination of ME content and P
and AA utilisation by the index method.
4.2.2 Diets and Sample Collection
Experiment 1
The chemical composition of the wheat-DDGS used in the current study is presented in Table
4-2.
124
In experiment 1, the metabolisable energy content of wheat-DDGS for turkey was determined
using a total of six diets. Wheat-DDGS was incorporated in a wheat-soybean meal diet at 3
levels (0, 300, or 600 g/kg) without- or with added XAP (0 or 0.25 g/kg). At a rate of 0.25
g/kg, the XAP (Danisco Animal Nutrition, Marlborough, UK) supplied 2000, 200 and 4000 U
of xylanase, amylase and protease, respectively per kg of diet. The xylanase was a Endo-1,4-
beta-xylanase produced by a Trichoderma longibrachiatum and expressed in the same
organism. The amylase was produced by Bacillus amyloliquifaciens and expressed in Bacillus
subtilis. The subtilisin (protease) was derived from Bacillus subtilis. These 3 enzymes were
produced separately and later blended to produce the xylanase-amylase-protease (XAP)
admixture. One unit (U) of xylanase was defined as the quantity of the enzyme that liberates
one mmol of xylose equivalent per minute. One unit of amylase was defined as the amount of
the enzyme catalysing the hydrolysis of one mmol glucosidic linkage per minute and one
protease unit was defined as the quantity of the enzyme that solubilised one mg of azo-casein
per minute. Energy-yielding ingredients such as wheat, soybean meal (SBM), gluten meal and
soy oil were substituted with wheat-DDGS in a way that their ratios were the same across all
the experimental diets to allow the use of the regression method. These ratios were 1.43, 6.06,
16.2, 11.3, 4.25, and 0.38 for wheat:SBM, wheat:gluten meal, wheat:soyoil, SBM:soyoil,
SBM:gluten meal, and soyoil:gluten meal, respectively. The ingredient and nutrient
composition for the experimental diets are presented in Table 4-3. Experimental diets were
fed from d 15 to 21. Excreta was collected daily from each cage for 3 days (d 18 to 20), dried
and pooled for each cage for the analysis of GE, dry matter (DM), N and Ti to determine
AME and AMEn.
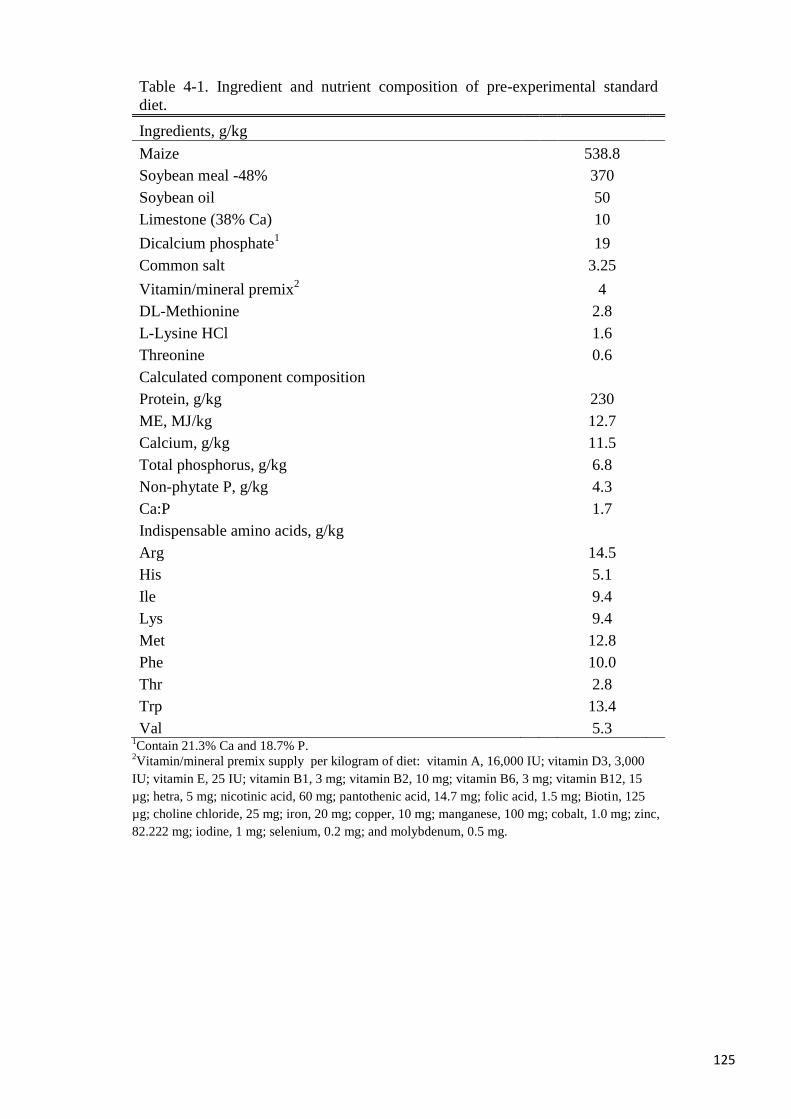
125
Table 4-1. Ingredient and nutrient composition of pre-experimental standard
diet.
Ingredients, g/kg
Maize
538.8
Soybean meal -48%
370
Soybean oil
50
Limestone (38% Ca)
10
Dicalcium phosphate1
19
Common salt
3.25
Vitamin/mineral premix2
4
DL-Methionine
2.8
L-Lysine HCl
1.6
Threonine
0.6
Calculated component composition
Protein, g/kg
230
ME, MJ/kg
12.7
Calcium, g/kg
11.5
Total phosphorus, g/kg
6.8
Non-phytate P, g/kg
4.3
Ca:P
1.7
Indispensable amino acids, g/kg
Arg
14.5
His
5.1
Ile
9.4
Lys
9.4
Met
12.8
Phe
10.0
Thr
2.8
Trp
13.4
Val 5.3 1Contain 21.3% Ca and 18.7% P.
2Vitamin/mineral premix supply per kilogram of diet: vitamin A, 16,000 IU; vitamin D3, 3,000
IU; vitamin E, 25 IU; vitamin B1, 3 mg; vitamin B2, 10 mg; vitamin B6, 3 mg; vitamin B12, 15
µg; hetra, 5 mg; nicotinic acid, 60 mg; pantothenic acid, 14.7 mg; folic acid, 1.5 mg; Biotin, 125
µg; choline chloride, 25 mg; iron, 20 mg; copper, 10 mg; manganese, 100 mg; cobalt, 1.0 mg; zinc,
82.222 mg; iodine, 1 mg; selenium, 0.2 mg; and molybdenum, 0.5 mg.
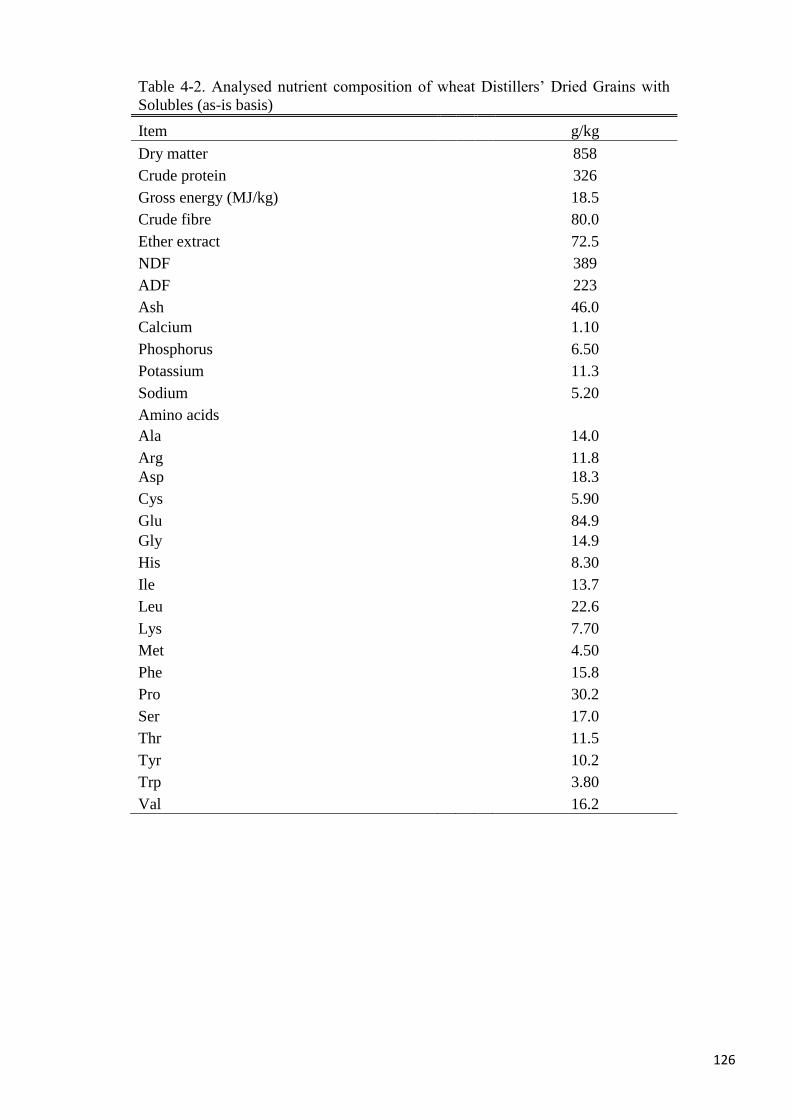
126
Table 4-2. Analysed nutrient composition of wheat Distillers’ Dried Grains with
Solubles (as-is basis)
Item g/kg
Dry matter
858
Crude protein
326
Gross energy (MJ/kg)
18.5
Crude fibre
80.0
Ether extract
72.5
NDF
389
ADF
223
Ash
46.0
Calcium
1.10
Phosphorus
6.50
Potassium
11.3
Sodium
5.20
Amino acids
Ala
14.0
Arg
11.8
Asp
18.3
Cys
5.90
Glu
84.9
Gly
14.9
His
8.30
Ile
13.7
Leu
22.6
Lys
7.70
Met
4.50
Phe
15.8
Pro
30.2
Ser
17.0
Thr
11.5
Tyr
10.2
Trp
3.80
Val 16.2
127
Experiment 2
A total of six dietary treatments were used to determine the true ileal digestibility and total
tract retention of P of wheat-DDGS for turkey in experiment 2. The dietary treatments
consisted of 3 levels of wheat-DDGS (200, 400 or 600 g/kg) without- or with added phytase
(0 or 1000 FTU/kg). Wheat-DDGS was the only source of P in these diets. The phytase
(Danisco Animal Nutrition, Marlborough, UK) was derived from Escherichia coli and
expressed in Schizosaccharomyces pombe. One phytase unit (FTU) was defined as the
quantity of enzyme required to liberate 1 µmol of inorganic P per minute, at pH 5.5 from an
excess of 15 µM sodium phytate at 37oC. The ingredient and analysed chemical compositions
of the experimental diets are shown in Table 4-4. Experimental diets were fed for 5 days (d 17
to 21). Excreta samples were collected daily for 3 days (d 18 to 20) for the determination of P
retention. On d 21, ileal digesta samples were collected from the Meckel’s diverticulum to
approximately 1 cm proximal to the ileo-cecal junction by flushing with distilled water. Ileal
digesta samples were pooled per cage and stored frozen (-20oC) pending chemical analysis.
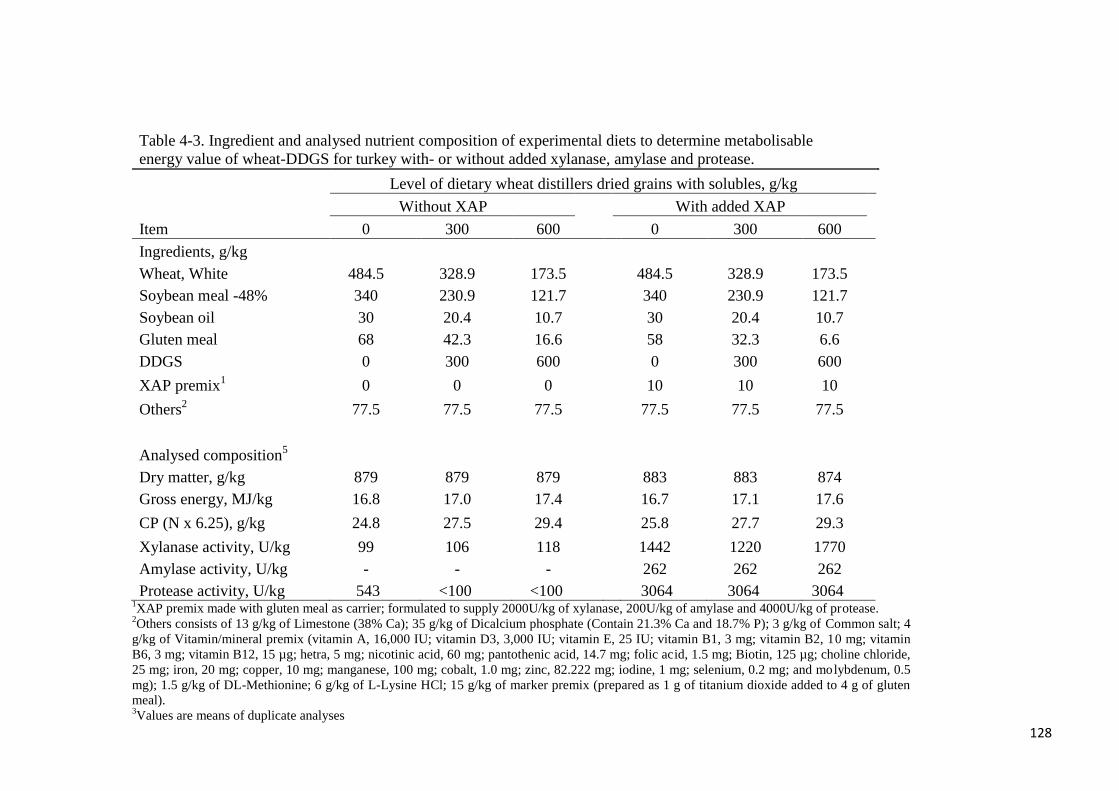
128
Table 4-3. Ingredient and analysed nutrient composition of experimental diets to determine metabolisable
energy value of wheat-DDGS for turkey with- or without added xylanase, amylase and protease.
Level of dietary wheat distillers dried grains with solubles, g/kg
Without XAP
With added XAP
Item 0 300 600
0 300 600
Ingredients, g/kg
Wheat, White 484.5 328.9 173.5
484.5 328.9 173.5
Soybean meal -48% 340 230.9 121.7
340 230.9 121.7
Soybean oil 30 20.4 10.7
30 20.4 10.7
Gluten meal 68 42.3 16.6
58 32.3 6.6
DDGS 0 300 600
0 300 600
XAP premix1 0 0 0
10 10 10
Others2 77.5 77.5 77.5
77.5 77.5 77.5
Analysed composition5
Dry matter, g/kg 879 879 879
883 883 874
Gross energy, MJ/kg 16.8 17.0 17.4
16.7 17.1 17.6
CP (N x 6.25), g/kg 24.8 27.5 29.4
25.8 27.7 29.3
Xylanase activity, U/kg 99 106 118
1442 1220 1770
Amylase activity, U/kg - - -
262 262 262
Protease activity, U/kg 543 <100 <100 3064 3064 3064 1XAP premix made with gluten meal as carrier; formulated to supply 2000U/kg of xylanase, 200U/kg of amylase and 4000U/kg of protease.
2Others consists of 13 g/kg of Limestone (38% Ca); 35 g/kg of Dicalcium phosphate (Contain 21.3% Ca and 18.7% P); 3 g/kg of Common salt; 4
g/kg of Vitamin/mineral premix (vitamin A, 16,000 IU; vitamin D3, 3,000 IU; vitamin E, 25 IU; vitamin B1, 3 mg; vitamin B2, 10 mg; vitamin
B6, 3 mg; vitamin B12, 15 µg; hetra, 5 mg; nicotinic acid, 60 mg; pantothenic acid, 14.7 mg; folic acid, 1.5 mg; Biotin, 125 µg; choline chloride,
25 mg; iron, 20 mg; copper, 10 mg; manganese, 100 mg; cobalt, 1.0 mg; zinc, 82.222 mg; iodine, 1 mg; selenium, 0.2 mg; and molybdenum, 0.5
mg); 1.5 g/kg of DL-Methionine; 6 g/kg of L-Lysine HCl; 15 g/kg of marker premix (prepared as 1 g of titanium dioxide added to 4 g of gluten
meal). 3Values are means of duplicate analyses
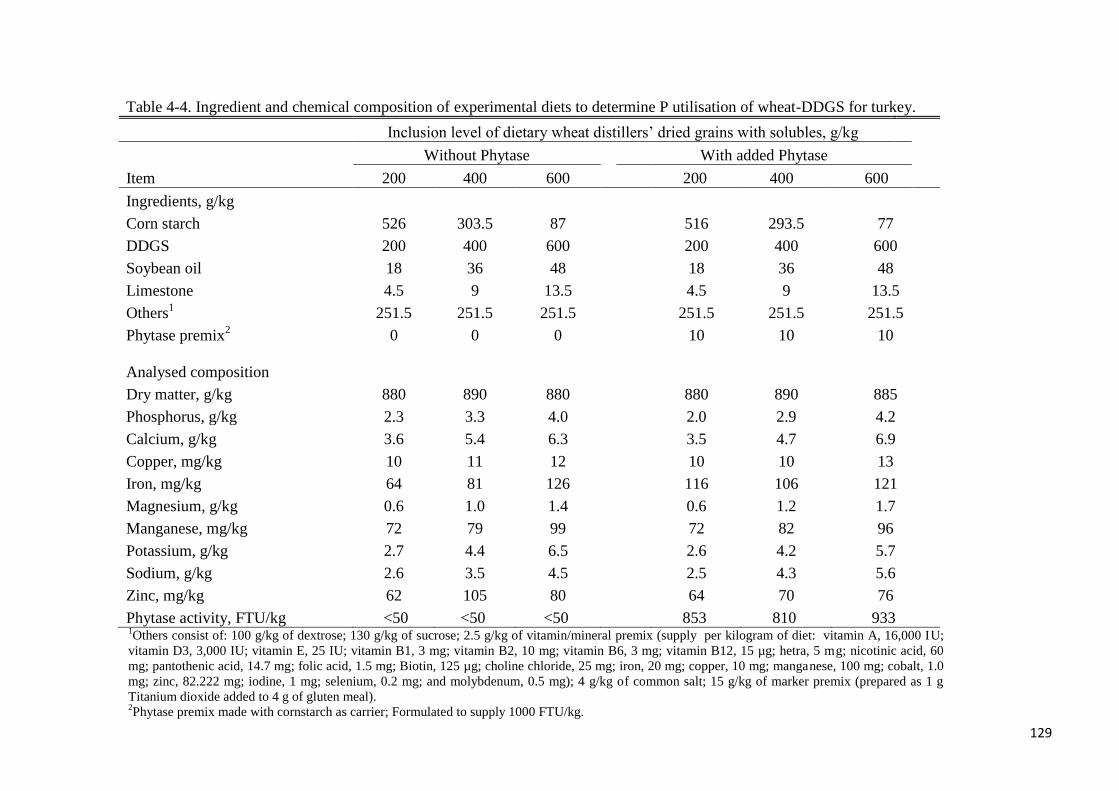
129
Table 4-4. Ingredient and chemical composition of experimental diets to determine P utilisation of wheat-DDGS for turkey.
Inclusion level of dietary wheat distillers’ dried grains with solubles, g/kg
Without Phytase
With added Phytase
Item 200 400 600
200 400 600
Ingredients, g/kg
Corn starch 526 303.5 87
516 293.5 77
DDGS 200 400 600
200 400 600
Soybean oil 18 36 48
18 36 48
Limestone 4.5 9 13.5
4.5 9 13.5
Others1 251.5 251.5 251.5
251.5 251.5 251.5
Phytase premix2 0 0 0
10 10 10
Analysed composition
Dry matter, g/kg 880 890 880
880 890 885
Phosphorus, g/kg 2.3 3.3 4.0
2.0 2.9 4.2
Calcium, g/kg 3.6 5.4 6.3
3.5 4.7 6.9
Copper, mg/kg 10 11 12 10 10 13
Iron, mg/kg 64 81 126 116 106 121
Magnesium, g/kg 0.6 1.0 1.4 0.6 1.2 1.7
Manganese, mg/kg 72 79 99 72 82 96
Potassium, g/kg 2.7 4.4 6.5 2.6 4.2 5.7
Sodium, g/kg 2.6 3.5 4.5 2.5 4.3 5.6
Zinc, mg/kg 62 105 80 64 70 76
Phytase activity, FTU/kg <50 <50 <50 853 810 933 1Others consist of: 100 g/kg of dextrose; 130 g/kg of sucrose; 2.5 g/kg of vitamin/mineral premix (supply per kilogram of diet: vitamin A, 16,000 IU;
vitamin D3, 3,000 IU; vitamin E, 25 IU; vitamin B1, 3 mg; vitamin B2, 10 mg; vitamin B6, 3 mg; vitamin B12, 15 µg; hetra, 5 mg; nicotinic acid, 60
mg; pantothenic acid, 14.7 mg; folic acid, 1.5 mg; Biotin, 125 µg; choline chloride, 25 mg; iron, 20 mg; copper, 10 mg; manganese, 100 mg; cobalt, 1.0
mg; zinc, 82.222 mg; iodine, 1 mg; selenium, 0.2 mg; and molybdenum, 0.5 mg); 4 g/kg of common salt; 15 g/kg of marker premix (prepared as 1 g
Titanium dioxide added to 4 g of gluten meal). 2Phytase premix made with cornstarch as carrier; Formulated to supply 1000 FTU/kg.
130
Experiment 3
Four dietary treatments were used in experiment 3. The diets were 2 nitrogen-free diets (without- or
with protease) and 2 semi-purified diets in which wheat-DDGS was the only source of AA
(without- or with protease). Protease was added at a rate of 4000 units per kg of diet. Standardised
ileal amino acid digestibility (SIAAD) were obtained by correction of apparent ileal amino acid
digestibility values (AIAAD) with basal ileal endogenous AA flow determined from birds fed a
nitrogen free diet (NFD) without- or with protease. The protease was supplied by Danisco Animal
Nutrition, Marlborough, UK. One protease unit was defined as the quantity of the enzyme that
solubilises one mg of azo-casein per minute. The assay diets contained at the least 24% CP and
were balanced for minerals and vitamins to meet breeder nutrient specifications (Table 4-5).
Because of health and welfare issues associated with feeding birds NFD, experimental diets were
fed for three days in experiment 3. A 3-d feeding period is optimal to fulfil the objectives of the
experiment (Kluth and Rudehurscord, 2010). Table 4-6 shows the analysed CP and AA
compositions of the experimental diets. On d 28, birds were euthanized by cervical dislocation and
ileal digesta samples were collected from the Meckel’s diverticulum to approximately 1 cm
proximal to the ileo-cecal junction by flushing with distilled water. Digesta samples were pooled for
each cage and stored frozen (-20 oC) prior to chemical analysis.
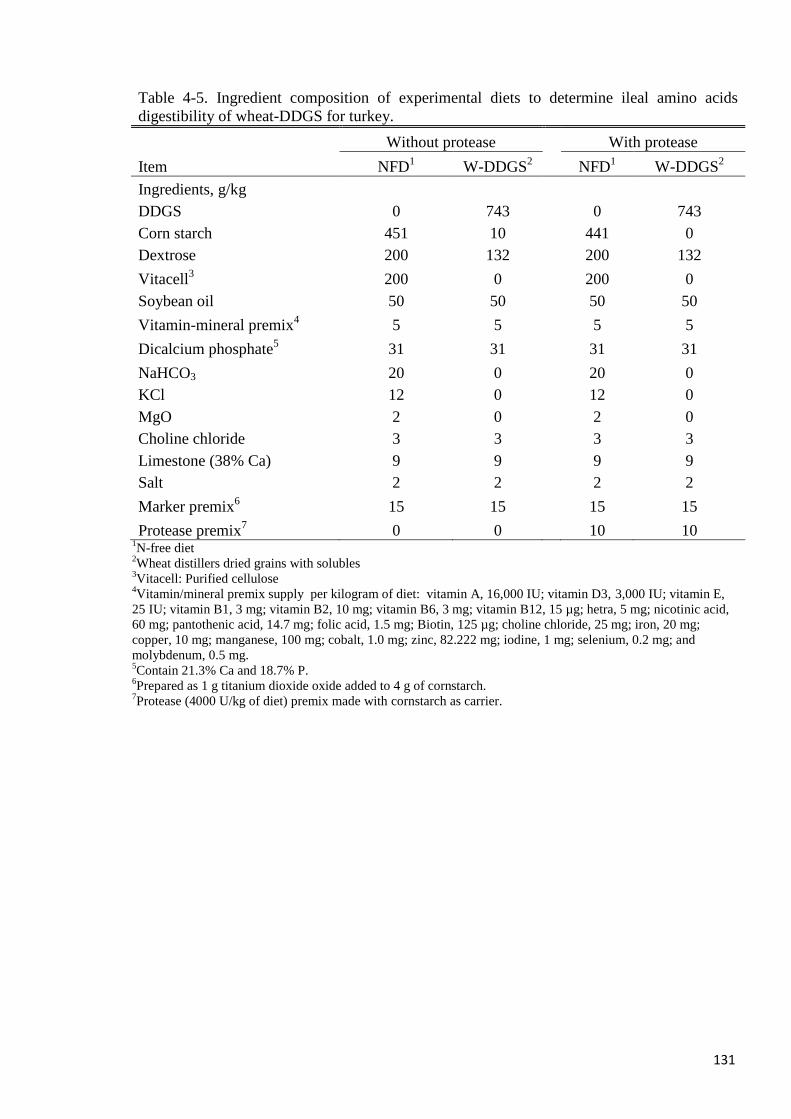
131
Table 4-5. Ingredient composition of experimental diets to determine ileal amino acids
digestibility of wheat-DDGS for turkey.
Without protease
With protease
Item NFD1 W-DDGS
2 NFD
1 W-DDGS
2
Ingredients, g/kg
DDGS 0 743
0 743
Corn starch 451 10
441 0
Dextrose 200 132
200 132
Vitacell3 200 0
200 0
Soybean oil 50 50
50 50
Vitamin-mineral premix4 5 5
5 5
Dicalcium phosphate5 31 31
31 31
NaHCO3 20 0
20 0
KCl 12 0
12 0
MgO 2 0
2 0
Choline chloride 3 3
3 3
Limestone (38% Ca) 9 9
9 9
Salt 2 2
2 2
Marker premix6 15 15
15 15
Protease premix7 0 0
10 10 1N-free diet
2Wheat distillers dried grains with solubles
3Vitacell: Purified cellulose
4Vitamin/mineral premix supply per kilogram of diet: vitamin A, 16,000 IU; vitamin D3, 3,000 IU; vitamin E,
25 IU; vitamin B1, 3 mg; vitamin B2, 10 mg; vitamin B6, 3 mg; vitamin B12, 15 µg; hetra, 5 mg; nicotinic acid,
60 mg; pantothenic acid, 14.7 mg; folic acid, 1.5 mg; Biotin, 125 µg; choline chloride, 25 mg; iron, 20 mg;
copper, 10 mg; manganese, 100 mg; cobalt, 1.0 mg; zinc, 82.222 mg; iodine, 1 mg; selenium, 0.2 mg; and
molybdenum, 0.5 mg. 5Contain 21.3% Ca and 18.7% P.
6Prepared as 1 g titanium dioxide oxide added to 4 g of cornstarch.
7Protease (4000 U/kg of diet) premix made with cornstarch as carrier.
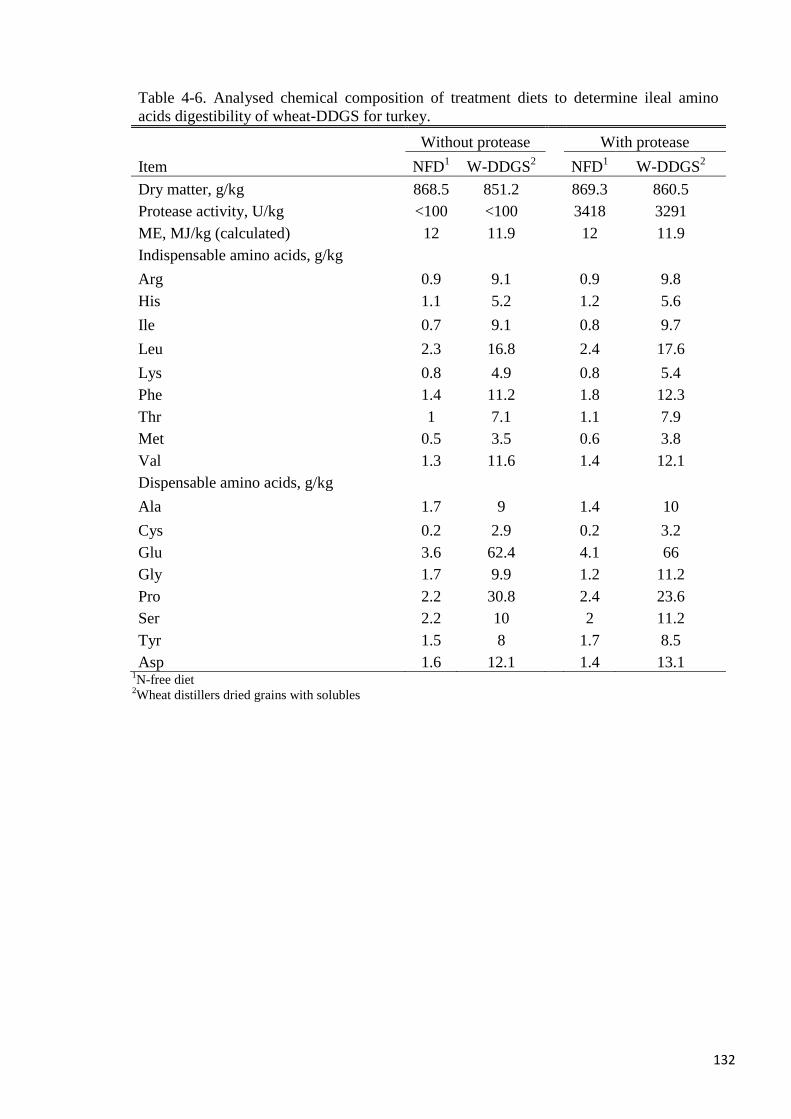
132
Table 4-6. Analysed chemical composition of treatment diets to determine ileal amino
acids digestibility of wheat-DDGS for turkey.
Without protease
With protease
Item NFD1 W-DDGS
2 NFD
1 W-DDGS
2
Dry matter, g/kg 868.5 851.2
869.3 860.5
Protease activity, U/kg <100 <100
3418 3291
ME, MJ/kg (calculated) 12 11.9 12 11.9
Indispensable amino acids, g/kg
Arg 0.9 9.1
0.9 9.8
His 1.1 5.2
1.2 5.6
Ile 0.7 9.1
0.8 9.7
Leu 2.3 16.8
2.4 17.6
Lys 0.8 4.9
0.8 5.4
Phe 1.4 11.2
1.8 12.3
Thr 1 7.1
1.1 7.9
Met 0.5 3.5
0.6 3.8
Val 1.3 11.6
1.4 12.1
Dispensable amino acids, g/kg
Ala 1.7 9
1.4 10
Cys 0.2 2.9
0.2 3.2
Glu 3.6 62.4
4.1 66
Gly 1.7 9.9
1.2 11.2
Pro 2.2 30.8
2.4 23.6
Ser 2.2 10
2 11.2
Tyr 1.5 8
1.7 8.5
Asp 1.6 12.1 1.4 13.1 1N-free diet
2Wheat distillers dried grains with solubles
133
4.2.3 Chemical Analysis
Where required, diets, wheat-DDGS, ileal digesta and excreta samples were analysed for GE,
DM, Ti, N, AA and P. Except for the ileal digesta samples used for AA analysis that were
lyophilized, all other samples were oven dried and ground to pass through a 0.5 mm screen
using a mill grinder (Retsch ZM 100, F. Kurt Retsch GmbH & Co.KG, Haan, Germany)
before chemical analysis. For DM determination, samples were dried at 105 oC for 24 hours in
a drying oven (Uniterm, Russel-Lindsey Engineering Ltd., Birmingham, England. UK)
(AOAC International 2006, method 934.01). Gross energy was determined in an adiabatic
oxygen bomb calorimeter using benzoic acid as an internal standard (Model 6200, Parr
Instruments, Moline, Illinois, USA). Nitrogen was determined by combustion method (AOAC
International 2006, method 968.06). For AA analysis, samples were hydrolysed for 24 hours
in 6 N hydrochloric acid at 110 oC under an atmosphere of N. For Met and Cys, performic
acid oxidation was carried out before acid hydrolysis. The AA in the hydrolysate were
determined by HPLC after post-column derivatization [(AOAC International 2000, method
982.30E (a, b, c)]. Analysis for Ti was performed as described by Short et al. (1996). Mineral
concentrations in the samples were determined using inductively coupled plasma
spectrophotometry according to the procedures of Olsen and Sommers (1982). Xylanase
activity in diets was measured using a kit (Megazyme International Ireland Ltd., Bray,
Ireland) based on the method by McCleary (1991). Amylase activity in feed was measured
using Phadebas (Megazyme International Ireland Ltd.) tablets according to the method
described by McCleary and Sheehan (1989). Protease activity was analysed using the
modified method of Lynn and Clevette-Radford (1984) with azocasein used as substrate.
Phytase activity in the diets was analysed using the AOAC official method (2000.12, AOAC,
2000).
4.2.4 Calculations and Statistical Analysis
All statistical analyses were performed using GenStat program (VSN International, 2011).
Statistical significance was set at P < 0.05 and tendency at 0.05 < P < 0.1 for all mean
comparisons.
Experiment 1
Energy utilisation coefficient was calculated using the following equation:
1. (
) (
)
134
where MEc is energy utilisation coefficient, Ti is the concentration of titanium in diet
(mg/kg), To is the concentration of titanium in excreta (mg/kg), Eo and Ei are the GE in
excreta and diet, respectively (MJ/kg).
Apparent metabolisable energy was calculated using the following equation:
2.
where AME is apparent metabolisable energy (MJ/kg), MEc is the energy utilisation
coefficient and GEdiet is the GE (MJ/kg) in the diet.
Nitrogen-corrected AME was calculated using the following equation:
3.
where AMEn is nitrogen-corrected apparent metabolisable energy (MJ/kg), N gain is nitrogen
retained (g/kg of DM intake) and 8.73 is the caloric correction factor for retained nitrogen
(Titus, 1956).
Nitrogen gain was calculated using the following equation:
4. (
)
where Ndiet and Nexcreta are the nitrogen in diet and excreta, respectively (g/kg of DM), Ti and
To are the concentration of titanium (mg/kg) in the diet and excreta, respectively.
Wheat-DDGS-associated AME intake was calculated as illustrated previously by Adeola et
al. (2010) using the following equations:
If the coefficients of AME for the assay diet, basal diet and test ingredient (wheat-DDGS) are
represented by Cad, Cbd and Cti, respectively. Assuming additivity in diet formulation, the
proportional contribution of energy by the basal (Pbd) and test ingredients (Pti) to the assay
diet will be equal to 1. Mathematically; Pbd + Pti = 1 or Pbd = 1 – Pti.
Therefore;
5.
By solving for Cti,
6.
Substituting 1 – Pti for Pbd;
135
7. [
]
The product of Cti at each level of wheat-DDGS substitution rate (300 or 600 g/kg), the GE of
wheat-DDGS, and wheat-DDGS intake in kg is the wheat-DDGS-associated AME intake in
MJ.
Energy utilisation data were analysed as a randomised complete block design of 3 levels of
wheat-DDGS (0, 300 and 600 g/kg) and 2 levels of enzyme supplementation (not added or
added). In the 7 blocks, each consisting of 3 cages containing one of 0, 300, or 600g of wheat-
DDGS per kg of diet without or with added XAP, AME or AMEn intake (MJ) was regressed
against wheat-DDGS intake (kg) for each block to generate intercepts and slopes for each of
the 7 blocks per XAP (not added or added). The intercept and slope data were analysed as a
one-way analysis of variance in a completely randomised design using intercept or slope as
the dependent variable and XAP (not added or added) as the independent variable. The
additional energy provided by the XAP was determined using ANOVA procedures as the
difference between the slopes of dietary treatments without and those with supplemental
XAP. Orthogonal contrast was used to determine the differences in metabolisable energy
between the dietary treatments with different inclusion levels of wheat-DDGS and those
without or with added XAP.
Experiment 2
Apparent ileal P digestibility or apparent P retention was calculated using the following
equation:
1. [ (
) (
)]
where APD/APR is apparent P digestibility (%) or apparent P retention (%); Ti and To are
the concentrations (mg/kg) of titanium in diet and ileal digesta or excreta, respectively. Po is
the phosphorus in the ileal digesta or excreta (g/kg of DM output) and Pi is the phosphorus in
the diet (g/kg of DM).
Mineral flow at the ileum or total tract was calculated using the following equation:
2.
where MO-dmi and MO-dmo are mineral output (ileal or total tract) on DM intake and DM
output basis, respectively (mg/kg); Ti and To are the concentrations of titanium (mg/kg) in the
diet and digesta or excreta, respectively.
136
True P digestibility or retention was determined from regressing P output (ileal or total tract)
against dietary P intake per block of 3 treatments within each block (one block without-, the
other with added phytase) using the following model;
3.
where PO-dmi is phosphorus output (mg/kg) on DM intake basis (dependent variable); TPI is
the slope of the model or true P indigestibility; Pi is the phosphorus in the diet (g/kg of DM
intake) (independent variable) and EPL is the intercept of the model or mean endogenous
phosphorus loss (DM intake basis).
True P digestibility or retention was calculated from the measure of P indigestibility using the
following equation:
4.
where TPD or TPR are true P digestibility or true P retention and TPI is true P indigestibility
(%), respectively.
Experiment 3
Basal endogenous ileal AA flow was calculated using the following equation:
8. (
)
where EAAF is endogenous ileal AA flow (mg/kg of DM intake); AAo is the AA in ileal
digesta (mg/kg of DM); Ti and To are the concentrations of titanium (mg/kg) in diet and ileal
digesta, respectively.
Apparent ileal AA digestibility was calculated using the following equation:
[ (
) (
)]
where AIAAD is apparent ileal amino acid digestibility (%); Ti and To are the concentrations
(mg/kg) of titanium in diet and ileal digesta, respectively; AAo is the amino acid in the digesta
(g/kg of DM) and AAi is the amino acid in the diet (g/kg of DM).
Standardised ileal AA digestibility was calculated using the following equation:
9. (
)
137
where SIAAD is standardized ileal AA digestibility (%); AIAAD is apparent ileal AA
digestibility (%); EAAF is the endogenous basal ileal AA flow (g/kg of DM intake) and AAi
is the amino acid content of the diet (g/kg of DM).
Data for the AIAAD and SIAAD without- or with supplemental protease were subjected to a
one-way analysis of variance to determine differences.
4.3 RESULTS
4.3.1 Metabolisable energy content of wheat Distillers Dried Grains with Solubles
without- or with an Admixture of Xylanase, Amylase and Protease for Turkey
The wheat-DDGS used in the current study contained by analysis 18.5 MJ/kg of GE, 326 g/kg
of CP, 6.5 g/kg of P, 80 g/kg of crude fibre and 858 g/kg of DM (Table 4-2). The ingredient
and analysed nutrient composition of the experimental diets are presented in Table 4-3. The
average xylanase activity in the diets containing 0, 300 or 600 g/kg of wheat-DDGS with
supplemental XAP was1477 U/kg and this value is lower than the formulated value of 2000
U/kg. On the average, amylase and protease activity in these diets were 262 and 3064 U/kg,
respectively compared to the formulated value of 200 and 4000 U/kg, respectively. Enzyme
activities in the experimental diets not supplemented with XAP were generally low.
Table 4-7 shows the growth performance responses for turkey fed graded levels of wheat-
DDGS without- or with supplemental XAP. There were quadratic decreases (P < 0.05) in
body weight gain (BWG) and gain:feed (G:F) and a linear decrease (P < 0.05) in final body
weight (FBW) as the level of wheat-DDGS increased from 0 to 600 g/kg in the diet.
Supplemental XAP did not improve the growth performance responses of the turkey. Dry
matter and energy utilisation for turkey fed graded levels of wheat-DDGS without- or with
XAP is presented in Table 4-8. Increasing the dietary inclusion of wheat-DDGS from 0 to 600
g/kg of the diet decreased linearly (P < 0.05) DM and energy retention, irrespective of XAP.
There were wheat-DDGS × XAP interactions (P < 0.05) for dietary AME and AMEn. For the
dietary treatments without supplemental XAP, increasing the level of wheat-DDGS in the
reference diet decreased linearly (P < 0.05) the AME and AMEn. On the other hand, there was
no effect of increasing wheat-DDGS level on dietary AME or AMEn in the treatments
supplemented with XAP. For the diets that were not supplemented with XAP, inclusion of
300 g/kg of wheat-DDGS in the reference diet decreased (P < 0.001) the AME by 0.49
MJ/kg. Corresponding decrease (P < 0.001) in AMEn was 0.60 MJ/kg. Further, the decrease
(P < 0.001) in dietary AME was 1.76 MJ/kg when the inclusion level of wheat-DDGS was
138
increased to 600 g/kg. Corresponding decrease (P < 0.001) in AMEn was 1.81 MJ/kg.
Supplemental XAP did not improve either the AME or AMEn of the diet for turkey.
The AME and AMEn values of wheat-DDGS without- or with added XAP determined from
the regression of wheat-DDGS-associated energy intake (MJ) against wheat-DDGS intake
(kg) is presented in Table 4-9. The line of the regression equations for AME and AMEn
content of wheat-DDGS are shown in Figure 4-1. From the slopes of the linear regression
equations, the AME values (MJ/kg DM) of wheat-DDGS without- and with supplemental
XAP were determined to be 14 and 14.9, respectively. Corresponding AMEn values (MJ/kg
DM) were 13 and 13.8, respectively. Numerical increases in AME and AMEn (MJ/kg DM)
values of wheat-DDGS with supplemental XAP were 0.85 and 0.77, respectively.
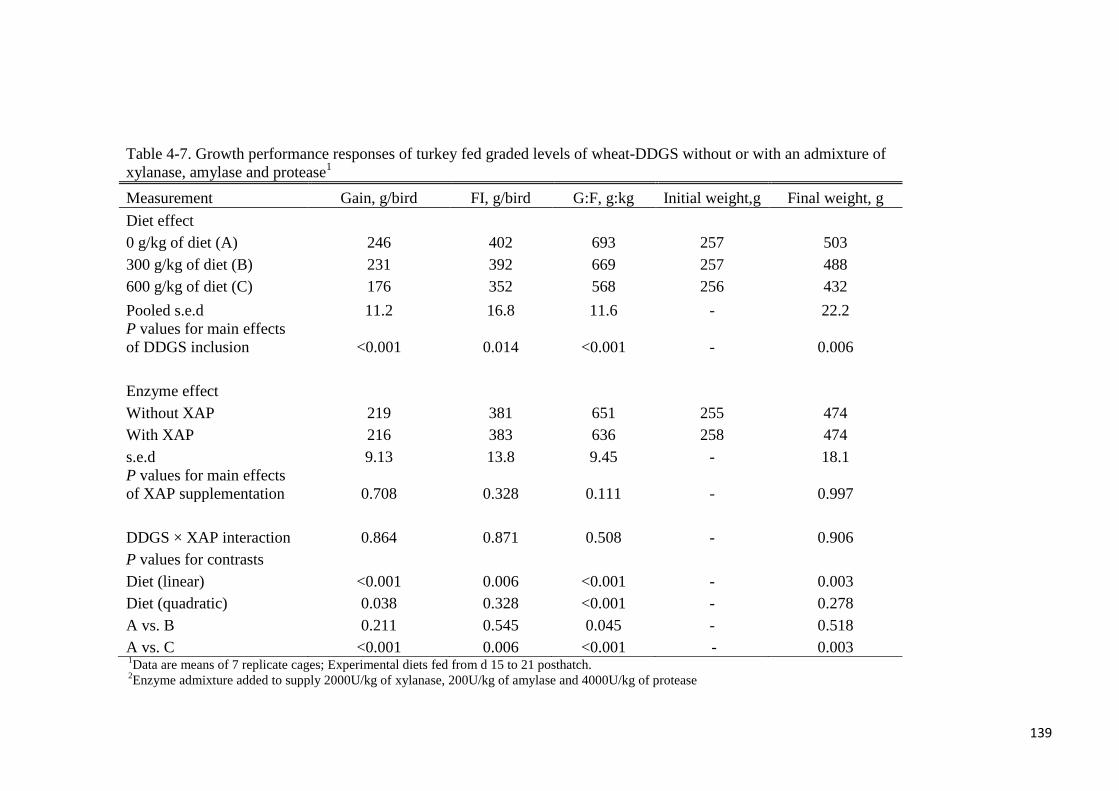
139
Table 4-7. Growth performance responses of turkey fed graded levels of wheat-DDGS without or with an admixture of
xylanase, amylase and protease1
Measurement Gain, g/bird FI, g/bird G:F, g:kg Initial weight,g Final weight, g
Diet effect
0 g/kg of diet (A) 246 402 693 257 503
300 g/kg of diet (B) 231 392 669 257 488
600 g/kg of diet (C) 176 352 568 256 432
Pooled s.e.d 11.2 16.8 11.6 - 22.2
P values for main effects
of DDGS inclusion <0.001 0.014 <0.001 - 0.006
Enzyme effect
Without XAP 219 381 651 255 474
With XAP 216 383 636 258 474
s.e.d 9.13 13.8 9.45 - 18.1
P values for main effects
of XAP supplementation 0.708 0.328 0.111 - 0.997
DDGS × XAP interaction 0.864 0.871 0.508 - 0.906
P values for contrasts
Diet (linear) <0.001 0.006 <0.001 - 0.003
Diet (quadratic) 0.038 0.328 <0.001 - 0.278
A vs. B 0.211 0.545 0.045 - 0.518
A vs. C <0.001 0.006 <0.001 - 0.003 1Data are means of 7 replicate cages; Experimental diets fed from d 15 to 21 posthatch.
2Enzyme admixture added to supply 2000U/kg of xylanase, 200U/kg of amylase and 4000U/kg of protease
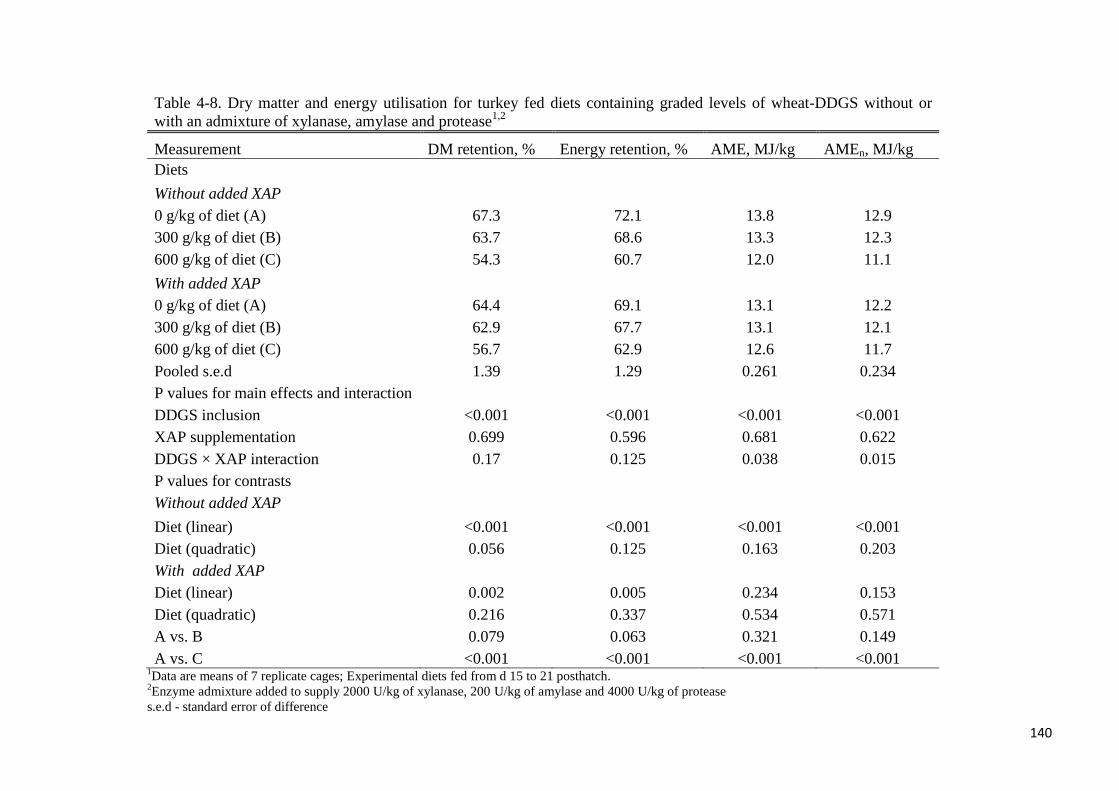
140
Table 4-8. Dry matter and energy utilisation for turkey fed diets containing graded levels of wheat-DDGS without or
with an admixture of xylanase, amylase and protease1,2
Measurement DM retention, % Energy retention, % AME, MJ/kg AMEn, MJ/kg
Diets
Without added XAP
0 g/kg of diet (A) 67.3 72.1 13.8 12.9
300 g/kg of diet (B) 63.7 68.6 13.3 12.3
600 g/kg of diet (C) 54.3 60.7 12.0 11.1
With added XAP
0 g/kg of diet (A) 64.4 69.1 13.1 12.2
300 g/kg of diet (B) 62.9 67.7 13.1 12.1
600 g/kg of diet (C) 56.7 62.9 12.6 11.7
Pooled s.e.d 1.39 1.29 0.261 0.234
P values for main effects and interaction
DDGS inclusion <0.001 <0.001 <0.001 <0.001
XAP supplementation 0.699 0.596 0.681 0.622
DDGS × XAP interaction 0.17 0.125 0.038 0.015
P values for contrasts
Without added XAP
Diet (linear) <0.001 <0.001 <0.001 <0.001
Diet (quadratic) 0.056 0.125 0.163 0.203
With added XAP
Diet (linear) 0.002 0.005 0.234 0.153
Diet (quadratic) 0.216 0.337 0.534 0.571
A vs. B 0.079 0.063 0.321 0.149
A vs. C <0.001 <0.001 <0.001 <0.001 1Data are means of 7 replicate cages; Experimental diets fed from d 15 to 21 posthatch.
2Enzyme admixture added to supply 2000 U/kg of xylanase, 200 U/kg of amylase and 4000 U/kg of protease
s.e.d - standard error of difference
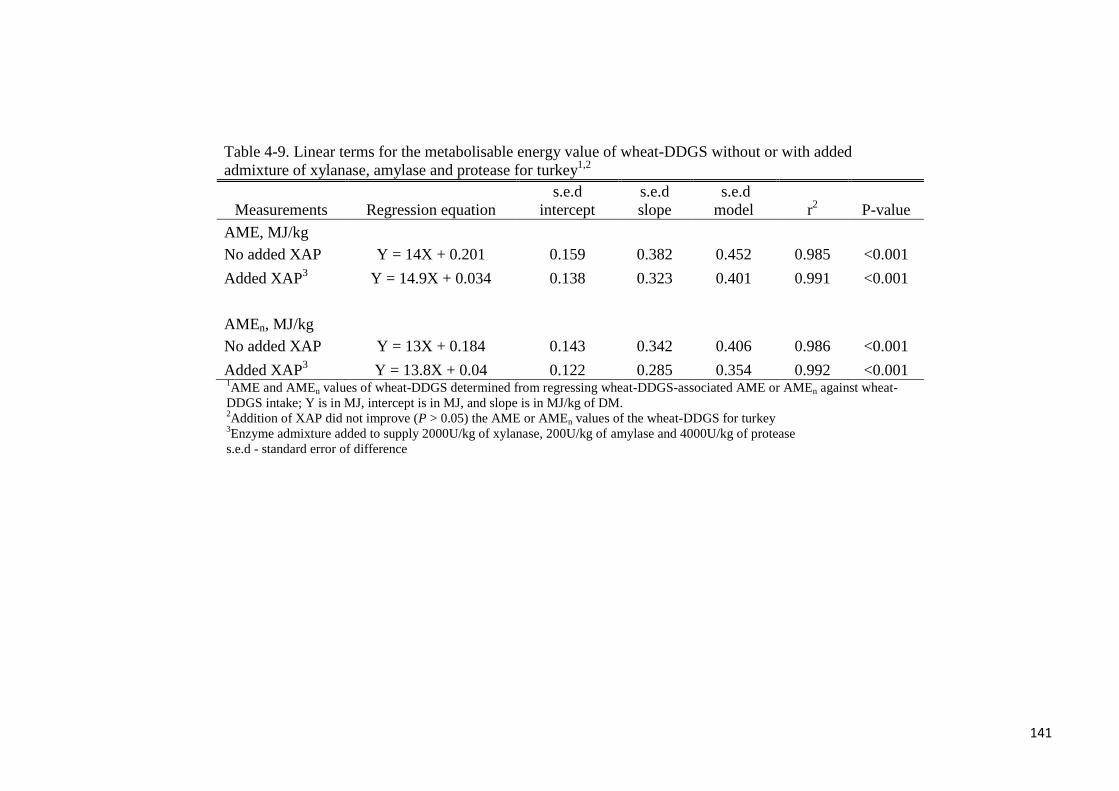
141
Table 4-9. Linear terms for the metabolisable energy value of wheat-DDGS without or with added
admixture of xylanase, amylase and protease for turkey1,2
Measurements Regression equation
s.e.d
intercept
s.e.d
slope
s.e.d
model r2 P-value
AME, MJ/kg
No added XAP Y = 14X + 0.201 0.159 0.382 0.452 0.985 <0.001
Added XAP3 Y = 14.9X + 0.034 0.138 0.323 0.401 0.991 <0.001
AMEn, MJ/kg
No added XAP Y = 13X + 0.184 0.143 0.342 0.406 0.986 <0.001
Added XAP3 Y = 13.8X + 0.04 0.122 0.285 0.354 0.992 <0.001
1AME and AMEn values of wheat-DDGS determined from regressing wheat-DDGS-associated AME or AMEn against wheat-
DDGS intake; Y is in MJ, intercept is in MJ, and slope is in MJ/kg of DM. 2Addition of XAP did not improve (P > 0.05) the AME or AMEn values of the wheat-DDGS for turkey
3Enzyme admixture added to supply 2000U/kg of xylanase, 200U/kg of amylase and 4000U/kg of protease
s.e.d - standard error of difference
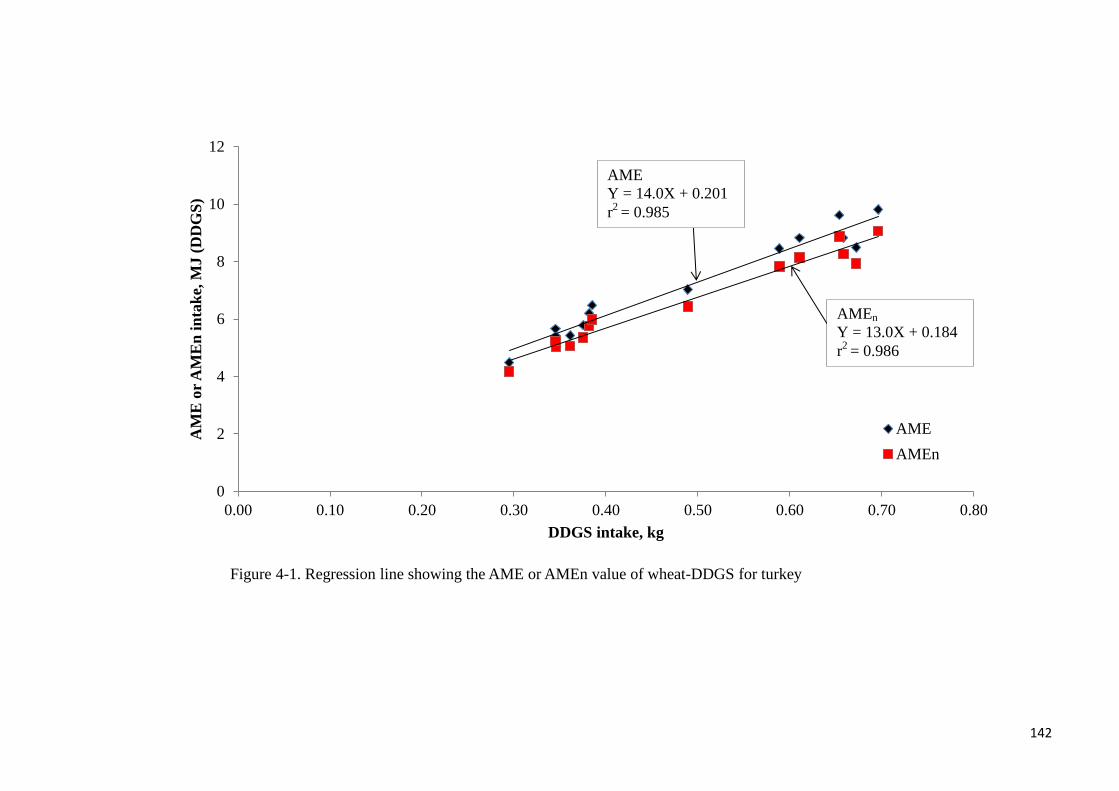
142
0
2
4
6
8
10
12
0.00 0.10 0.20 0.30 0.40 0.50 0.60 0.70 0.80
AM
E o
r A
ME
n i
nta
ke,
MJ (
DD
GS
)
DDGS intake, kg
Figure 4-1. Regression line showing the AME or AMEn value of wheat-DDGS for turkey
AME
AMEn
AMEn
Y = 13.0X + 0.184
r2
= 0.986
AME
Y = 14.0X + 0.201
r2
= 0.985
143
4.3.2 True Phosphorus Digestibility or Retention of Wheat Distillers Dried Grains with
Solubles without- or with Supplemental Phytase for Turkey
The analysed nutrient composition and phytase activity of the dietary treatments are presented
in Table 4-4. Analysed phytase activity in the dietary treatments supplemented with phytase
was 853, 810 or 933 FTU/kg for diets containing 200, 400 or 600 g/kg of wheat-DDGS,
respectively. The phytase activity noted in these diets is lower than the expected value of
1000 FTU/kg. Phytase activity was less than 50 FTU/kg in the dietary treatments without
supplemental phytase. Dry matter utilisation and P digestibility or retention for birds fed
graded levels of wheat-DDGS without- or with supplemental phytase are presented in Table
4-10. Increasing the dietary inclusion level of wheat-DDGS decreased linearly (P < 0.01) DM
intake, ileal DM digestibility and DM retention. Increasing the inclusion level of wheat-
DDGS from 200 to 600 g/kg of the diet did not affect apparent ileal P digestibility or apparent
P retention.
True P digestibility and retention (%) of wheat-DDGS for turkey without or with
supplemental phytase is presented in Table 4-11. From the regression of P output (mg/kg of
DMI) at the ileal level against dietary P intake (mg/kg of DM), the digestibility of wheat-
DDGS without- or with supplemental phytase was 75.8 and 82.1%, respectively. Respective
values at the total tract level were 70.7 and 81.6%. True P digestibility and retention was not
different between the treatments without- and those with phytase. The regression lines
showing the TPI of wheat-DDGS at the ileal and total tract level for turkey are shown in
Figure 4-2. The true digestible P and true retainable P contents of the wheat-DDGS were
calculated as the coefficient of TPD or TPR multiplied by the analysed P composition (%) of
the wheat-DDGS. The true digestible P (%) in the wheat-DDGS for turkey without- or with
added phytase was 0.49 or 0.53, respectively. Corresponding values for true retainable P (%)
were 0.46 or 0.53, respectively. Flow of minerals at the ileal level is presented in Table 4-12
and those at the total tract in Table 4-13. With the exception of Zn at the total tract level,
increasing the level of wheat-DDGS in the diet increased linearly (P < 0.05) the flow of all
minerals at either the ileal or total tract level regardless of phytase supplementation. Phytase
supplementation did not have an effect (P > 0.05) on mineral flow at either the ileal or total
tract.
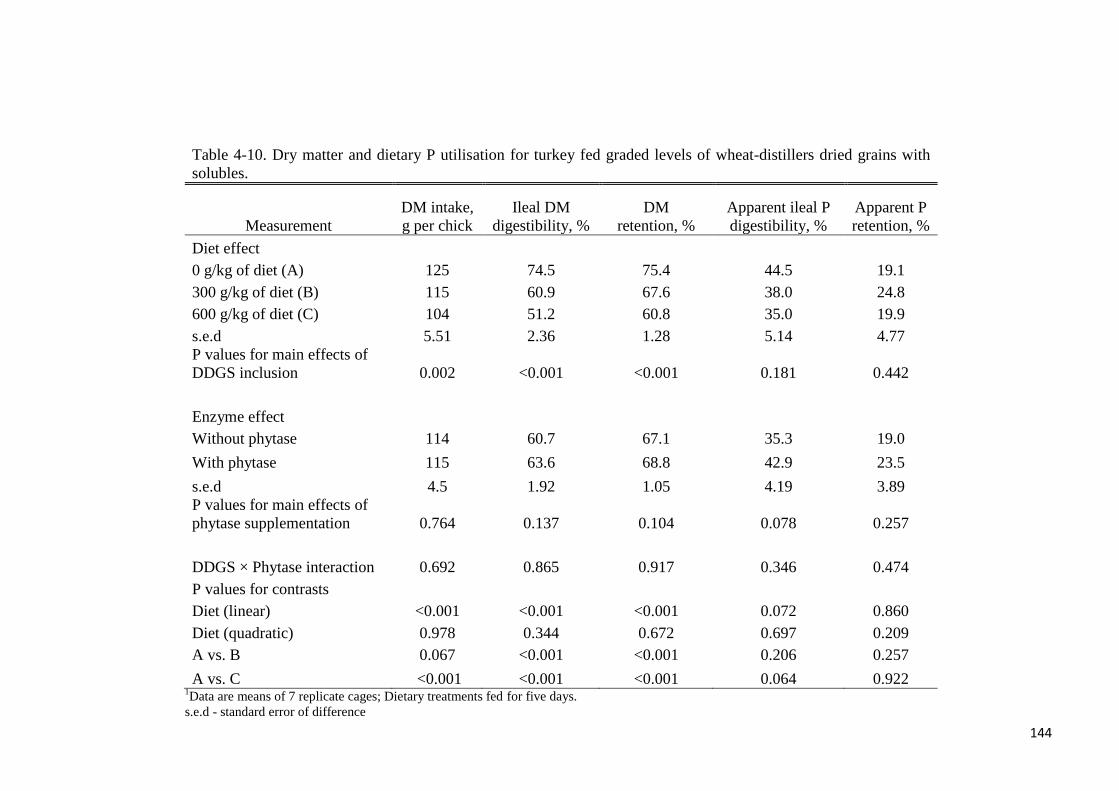
144
Table 4-10. Dry matter and dietary P utilisation for turkey fed graded levels of wheat-distillers dried grains with
solubles.
Measurement
DM intake,
g per chick
Ileal DM
digestibility, %
DM
retention, %
Apparent ileal P
digestibility, %
Apparent P
retention, %
Diet effect
0 g/kg of diet (A) 125 74.5 75.4 44.5 19.1
300 g/kg of diet (B) 115 60.9 67.6 38.0 24.8
600 g/kg of diet (C) 104 51.2 60.8 35.0 19.9
s.e.d 5.51 2.36 1.28 5.14 4.77
P values for main effects of
DDGS inclusion 0.002 <0.001 <0.001 0.181 0.442
Enzyme effect
Without phytase 114 60.7 67.1 35.3 19.0
With phytase 115 63.6 68.8 42.9 23.5
s.e.d 4.5 1.92 1.05 4.19 3.89
P values for main effects of
phytase supplementation
0.764 0.137 0.104 0.078 0.257
DDGS × Phytase interaction 0.692 0.865 0.917 0.346 0.474
P values for contrasts
Diet (linear) <0.001 <0.001 <0.001 0.072 0.860
Diet (quadratic) 0.978 0.344 0.672 0.697 0.209
A vs. B 0.067 <0.001 <0.001 0.206 0.257
A vs. C <0.001 <0.001 <0.001 0.064 0.922 1Data are means of 7 replicate cages; Dietary treatments fed for five days.
s.e.d - standard error of difference
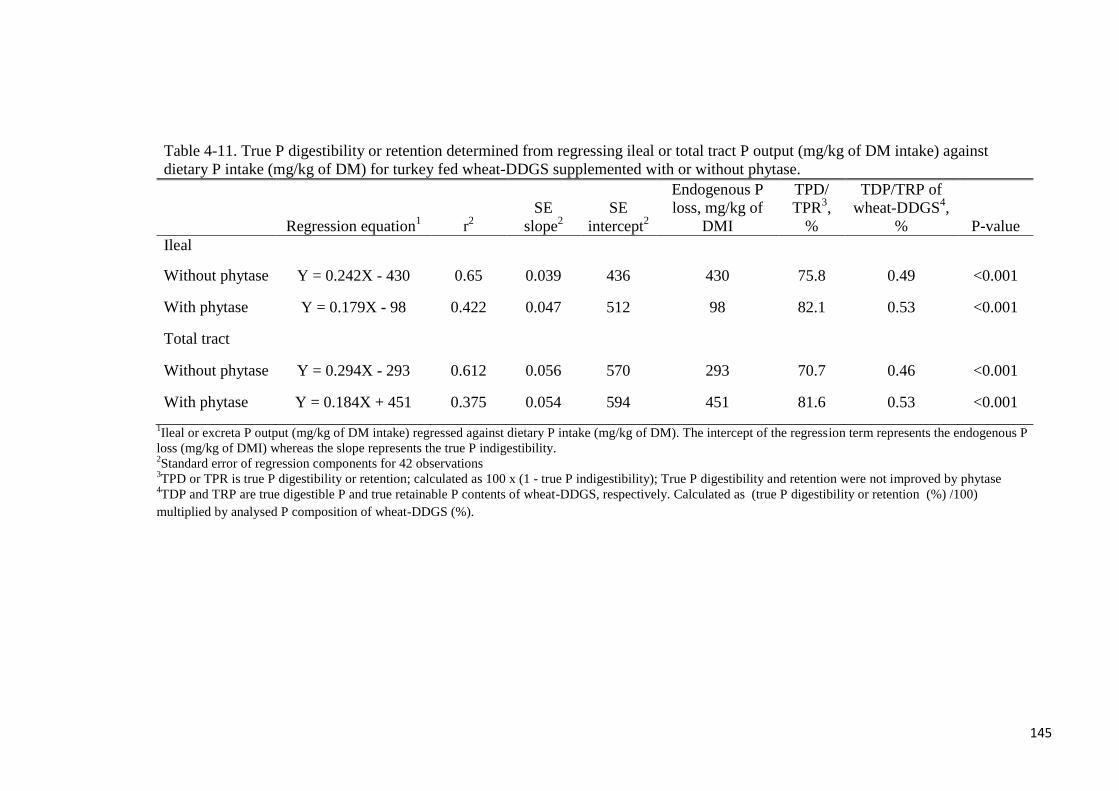
145
Table 4-11. True P digestibility or retention determined from regressing ileal or total tract P output (mg/kg of DM intake) against
dietary P intake (mg/kg of DM) for turkey fed wheat-DDGS supplemented with or without phytase.
Regression equation1 r
2
SE
slope2
SE
intercept2
Endogenous P
loss, mg/kg of
DMI
TPD/
TPR3,
%
TDP/TRP of
wheat-DDGS4,
% P-value
Ileal
Without phytase Y = 0.242X - 430 0.65 0.039 436 430 75.8 0.49 <0.001
With phytase Y = 0.179X - 98 0.422 0.047 512 98 82.1 0.53 <0.001
Total tract
Without phytase Y = 0.294X - 293 0.612 0.056 570 293 70.7 0.46 <0.001
With phytase Y = 0.184X + 451 0.375 0.054 594 451 81.6 0.53 <0.001
1Ileal or excreta P output (mg/kg of DM intake) regressed against dietary P intake (mg/kg of DM). The intercept of the regression term represents the endogenous P
loss (mg/kg of DMI) whereas the slope represents the true P indigestibility. 2Standard error of regression components for 42 observations
3TPD or TPR is true P digestibility or retention; calculated as 100 x (1 - true P indigestibility); True P digestibility and retention were not improved by phytase
4TDP and TRP are true digestible P and true retainable P contents of wheat-DDGS, respectively. Calculated as (true P digestibility or retention (%) /100)
multiplied by analysed P composition of wheat-DDGS (%).
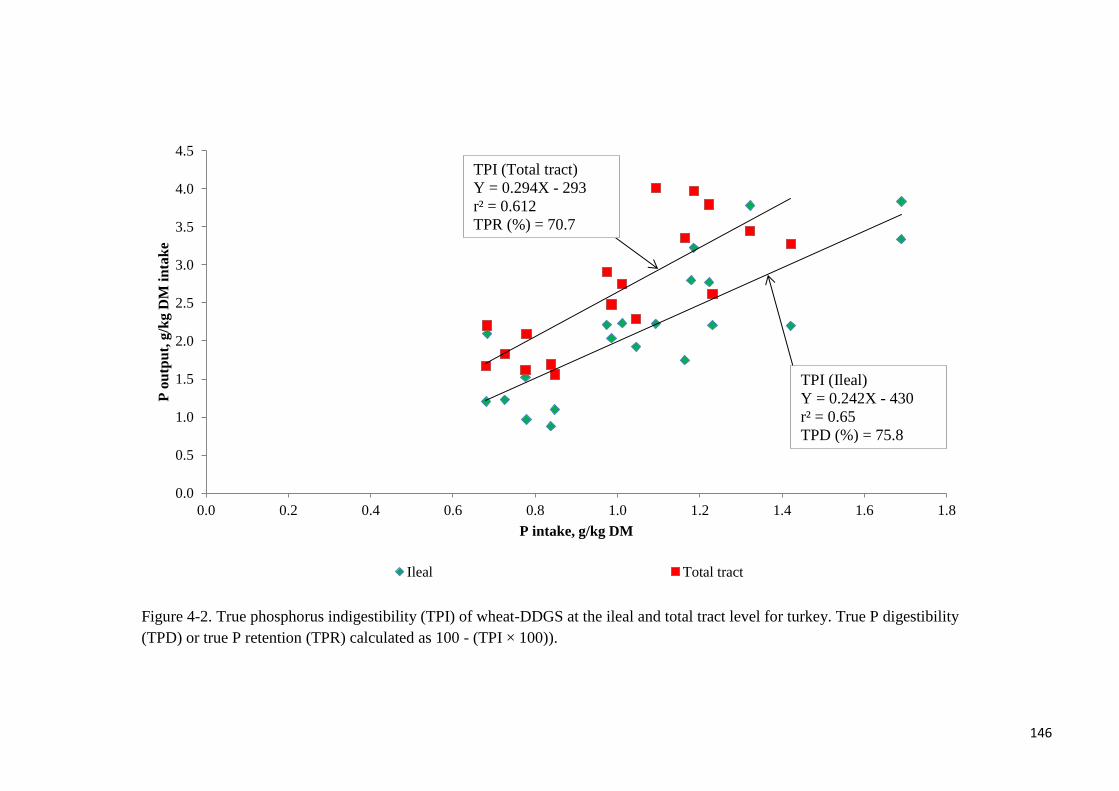
146
Figure 4-2. True phosphorus indigestibility (TPI) of wheat-DDGS at the ileal and total tract level for turkey. True P digestibility
(TPD) or true P retention (TPR) calculated as 100 - (TPI × 100)).
0.0
0.5
1.0
1.5
2.0
2.5
3.0
3.5
4.0
4.5
0.0 0.2 0.4 0.6 0.8 1.0 1.2 1.4 1.6 1.8
P o
utp
ut,
g/k
g D
M i
nta
ke
P intake, g/kg DM
Ileal Total tract
TPI (Total tract)
Y = 0.294X - 293
r² = 0.612
TPR (%) = 70.7
TPI (Ileal)
Y = 0.242X - 430
r² = 0.65
TPD (%) = 75.8
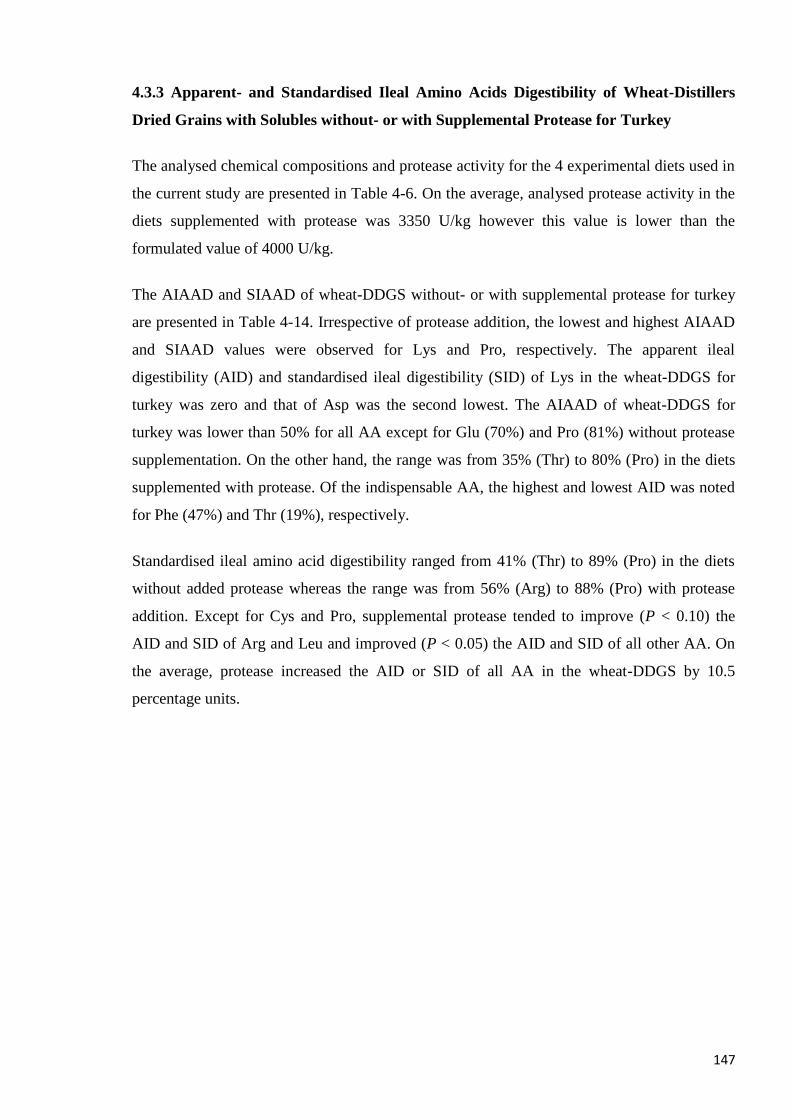
147
4.3.3 Apparent- and Standardised Ileal Amino Acids Digestibility of Wheat-Distillers
Dried Grains with Solubles without- or with Supplemental Protease for Turkey
The analysed chemical compositions and protease activity for the 4 experimental diets used in
the current study are presented in Table 4-6. On the average, analysed protease activity in the
diets supplemented with protease was 3350 U/kg however this value is lower than the
formulated value of 4000 U/kg.
The AIAAD and SIAAD of wheat-DDGS without- or with supplemental protease for turkey
are presented in Table 4-14. Irrespective of protease addition, the lowest and highest AIAAD
and SIAAD values were observed for Lys and Pro, respectively. The apparent ileal
digestibility (AID) and standardised ileal digestibility (SID) of Lys in the wheat-DDGS for
turkey was zero and that of Asp was the second lowest. The AIAAD of wheat-DDGS for
turkey was lower than 50% for all AA except for Glu (70%) and Pro (81%) without protease
supplementation. On the other hand, the range was from 35% (Thr) to 80% (Pro) in the diets
supplemented with protease. Of the indispensable AA, the highest and lowest AID was noted
for Phe (47%) and Thr (19%), respectively.
Standardised ileal amino acid digestibility ranged from 41% (Thr) to 89% (Pro) in the diets
without added protease whereas the range was from 56% (Arg) to 88% (Pro) with protease
addition. Except for Cys and Pro, supplemental protease tended to improve (P < 0.10) the
AID and SID of Arg and Leu and improved (P < 0.05) the AID and SID of all other AA. On
the average, protease increased the AID or SID of all AA in the wheat-DDGS by 10.5
percentage units.
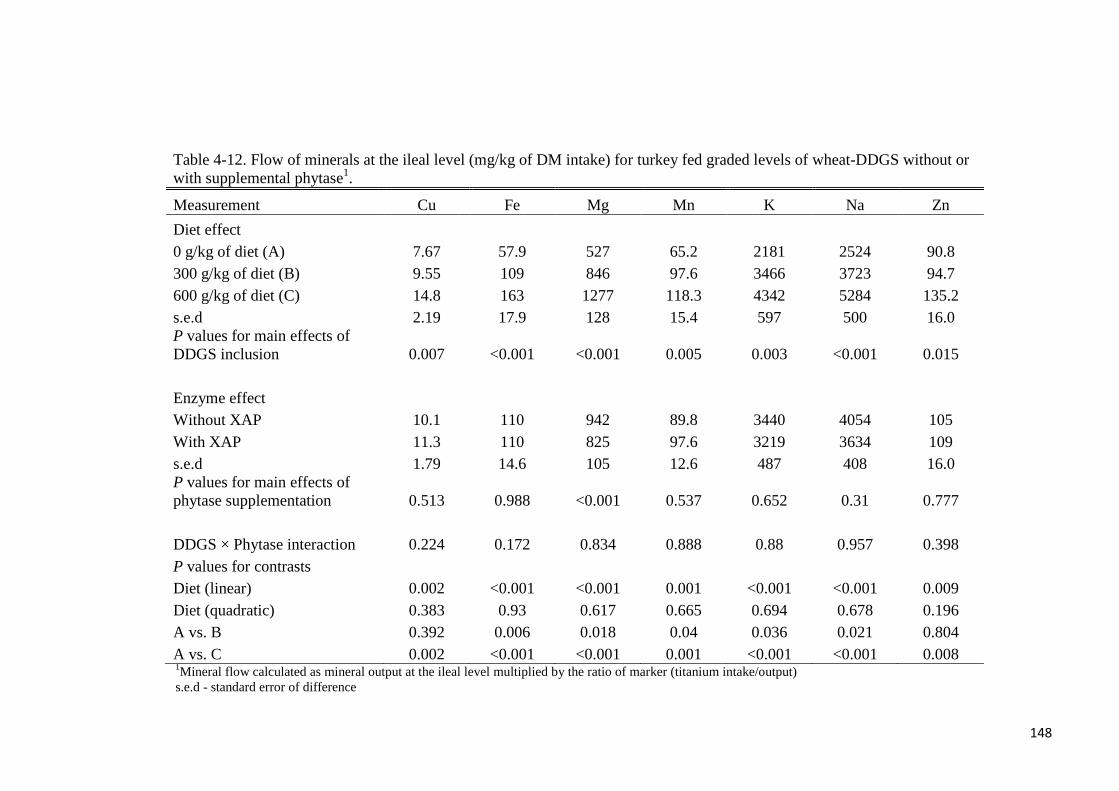
148
Table 4-12. Flow of minerals at the ileal level (mg/kg of DM intake) for turkey fed graded levels of wheat-DDGS without or
with supplemental phytase1.
Measurement Cu Fe Mg Mn K Na Zn
Diet effect
0 g/kg of diet (A) 7.67 57.9 527 65.2 2181 2524 90.8
300 g/kg of diet (B) 9.55 109 846 97.6 3466 3723 94.7
600 g/kg of diet (C) 14.8 163 1277 118.3 4342 5284 135.2
s.e.d 2.19 17.9 128 15.4 597 500 16.0
P values for main effects of
DDGS inclusion 0.007 <0.001 <0.001 0.005 0.003 <0.001 0.015
Enzyme effect
Without XAP 10.1 110 942 89.8 3440 4054 105
With XAP 11.3 110 825 97.6 3219 3634 109
s.e.d 1.79 14.6 105 12.6 487 408 16.0
P values for main effects of
phytase supplementation 0.513 0.988 <0.001 0.537 0.652 0.31 0.777
DDGS × Phytase interaction 0.224 0.172 0.834 0.888 0.88 0.957 0.398
P values for contrasts
Diet (linear) 0.002 <0.001 <0.001 0.001 <0.001 <0.001 0.009
Diet (quadratic) 0.383 0.93 0.617 0.665 0.694 0.678 0.196
A vs. B 0.392 0.006 0.018 0.04 0.036 0.021 0.804
A vs. C 0.002 <0.001 <0.001 0.001 <0.001 <0.001 0.008 1Mineral flow calculated as mineral output at the ileal level multiplied by the ratio of marker (titanium intake/output)
s.e.d - standard error of difference
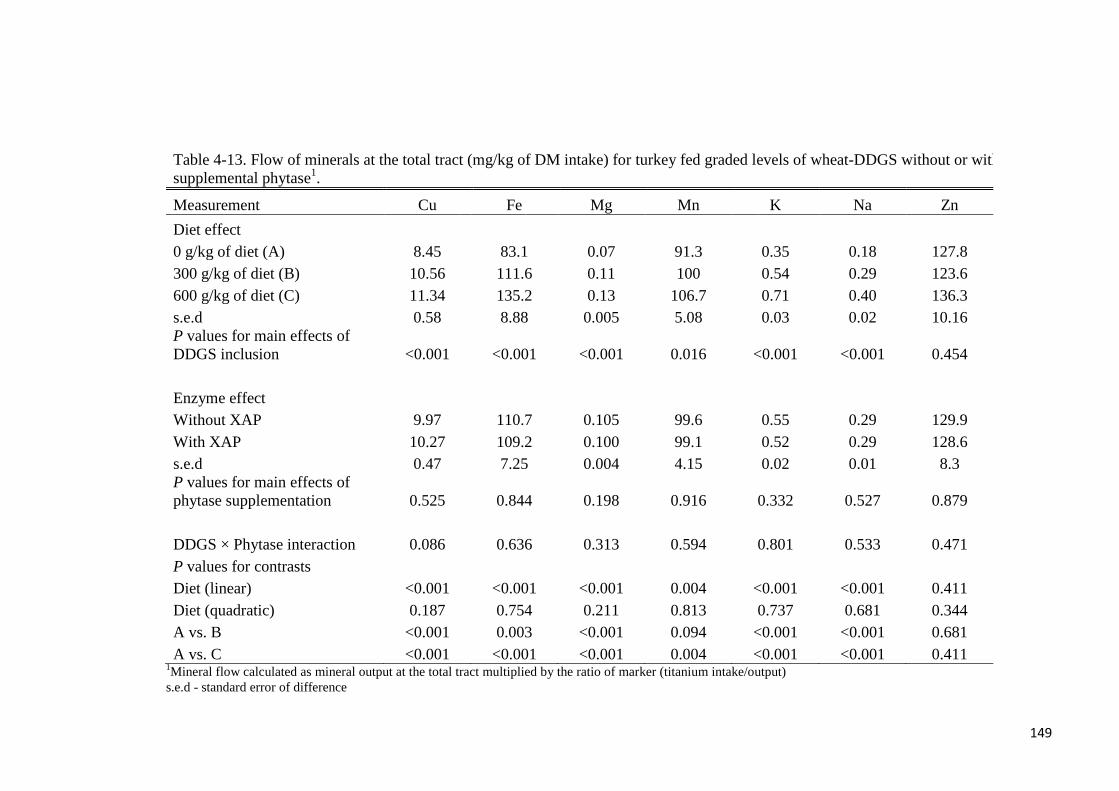
149
Table 4-13. Flow of minerals at the total tract (mg/kg of DM intake) for turkey fed graded levels of wheat-DDGS without or with
supplemental phytase1.
Measurement Cu Fe Mg Mn K Na Zn
Diet effect
0 g/kg of diet (A) 8.45 83.1 0.07 91.3 0.35 0.18 127.8
300 g/kg of diet (B) 10.56 111.6 0.11 100 0.54 0.29 123.6
600 g/kg of diet (C) 11.34 135.2 0.13 106.7 0.71 0.40 136.3
s.e.d 0.58 8.88 0.005 5.08 0.03 0.02 10.16
P values for main effects of
DDGS inclusion <0.001 <0.001 <0.001 0.016 <0.001 <0.001 0.454
Enzyme effect
Without XAP 9.97 110.7 0.105 99.6 0.55 0.29 129.9
With XAP 10.27 109.2 0.100 99.1 0.52 0.29 128.6
s.e.d 0.47 7.25 0.004 4.15 0.02 0.01 8.3
P values for main effects of
phytase supplementation 0.525 0.844 0.198 0.916 0.332 0.527 0.879
DDGS × Phytase interaction 0.086 0.636 0.313 0.594 0.801 0.533 0.471
P values for contrasts
Diet (linear) <0.001 <0.001 <0.001 0.004 <0.001 <0.001 0.411
Diet (quadratic) 0.187 0.754 0.211 0.813 0.737 0.681 0.344
A vs. B <0.001 0.003 <0.001 0.094 <0.001 <0.001 0.681
A vs. C <0.001 <0.001 <0.001 0.004 <0.001 <0.001 0.411 1Mineral flow calculated as mineral output at the total tract multiplied by the ratio of marker (titanium intake/output)
s.e.d - standard error of difference
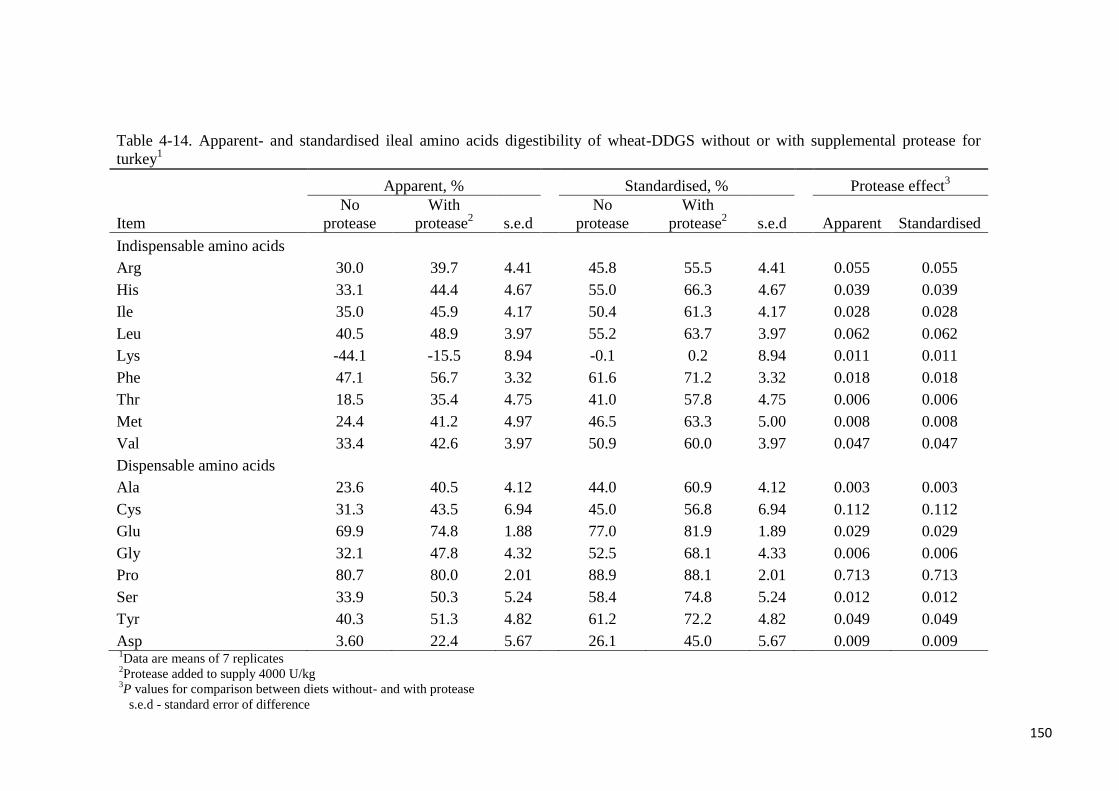
150
Table 4-14. Apparent- and standardised ileal amino acids digestibility of wheat-DDGS without or with supplemental protease for
turkey1
Apparent, %
Standardised, %
Protease effect3
Item
No
protease
With
protease2 s.e.d
No
protease
With
protease2 s.e.d Apparent Standardised
Indispensable amino acids
Arg 30.0 39.7 4.41
45.8 55.5 4.41
0.055 0.055
His 33.1 44.4 4.67
55.0 66.3 4.67
0.039 0.039
Ile 35.0 45.9 4.17
50.4 61.3 4.17
0.028 0.028
Leu 40.5 48.9 3.97
55.2 63.7 3.97
0.062 0.062
Lys -44.1 -15.5 8.94
-0.1 0.2 8.94
0.011 0.011
Phe 47.1 56.7 3.32
61.6 71.2 3.32
0.018 0.018
Thr 18.5 35.4 4.75
41.0 57.8 4.75
0.006 0.006
Met 24.4 41.2 4.97
46.5 63.3 5.00
0.008 0.008
Val 33.4 42.6 3.97
50.9 60.0 3.97
0.047 0.047
Dispensable amino acids
Ala 23.6 40.5 4.12
44.0 60.9 4.12
0.003 0.003
Cys 31.3 43.5 6.94
45.0 56.8 6.94
0.112 0.112
Glu 69.9 74.8 1.88
77.0 81.9 1.89
0.029 0.029
Gly 32.1 47.8 4.32
52.5 68.1 4.33
0.006 0.006
Pro 80.7 80.0 2.01
88.9 88.1 2.01
0.713 0.713
Ser 33.9 50.3 5.24
58.4 74.8 5.24
0.012 0.012
Tyr 40.3 51.3 4.82
61.2 72.2 4.82
0.049 0.049
Asp 3.60 22.4 5.67 26.1 45.0 5.67 0.009 0.009 1Data are means of 7 replicates
2Protease added to supply 4000 U/kg
3P values for comparison between diets without- and with protease
s.e.d - standard error of difference
151
4.4 DISCUSSION
Metabolisable energy content of wheat-DDGS without- or with an admixture of xylanase,
amylase and protease for turkey
Wheat and maize are the most popular sources of dietary energy for turkey; however it is
possible to replace some of these ingredients with readily available and low cost alternatives.
More often than not, the prospects of using alternative dietary energy sources are hampered
by a lack of information about their ME contents. One of such dietary energy sources is
wheat-DDGS. The current study therefore determined the AME and AMEn value of wheat-
DDGS for turkey as well as quantified the improvements to the energy value of wheat-DDGS
by supplementation of a combination of exogenous xylanase, amylase and protease enzymes.
The hypotheses were; 1) wheat-DDGS is a good source of dietary energy for turkey and 2)
XAP supplementation will increase the energy value for turkey.
The chemical characteristic of the wheat-DDGS used in the current study is close to those
reported in the study of Bolarinwa and Adeola (2012). There is wide variability in the
chemical characteristics of wheat-DDGS judging by the variability in the chemical
compositions of 10 wheat-DDGS samples reported in the study of Cozannet et al. (2010a) and
those for 11 sources of wheat-DDGS from bioethanol plants from the USA and Europe
reported in Chapter 2 in this thesis. For example, the neutral detergent fibre and acid detergent
fibre contents in the wheat-DDGS used in the current study are greater that those used in the
study of Nyachoti et al. (2005). Factors such as differences in the chemical composition of the
grain, processing method and efficiency, temperature and duration at drying, as well as the
amount of condensed solubles added back to distillers grains have been implicated to cause
variability to the chemical characteristics of wheat-DDGS among sources (Liu, 2011).
Furthermore, it is noteworthy that fibre degrading enzymes are often used during bioethanol
production to improve ethanol throughput, nonetheless, the concentrations of non starch
polysaccharides (NSP) in the wheat-DDGS have been reported to increase 3-fold compared
with wheat (Widyaratne and Zijlstra, 2007).
There was a 15 and 13% reduction in dietary DM and energy utilisation, respectively as the
level of wheat-DDGS increased from 0 to 60% in the reference diet. The reduction in dietary
energy utilisation as the level of wheat-DDGS increased to 60% in the current study is similar
to what was observed with broilers (Chapter 3). Water-soluble NSP, as may be in wheat-
DDGS, exert their anti-nutritive properties by their high affinity to water and formation of a
152
gel medium. The formation of the gel medium causes an increase in digesta viscosity, slower
rate of digesta transit in the gastrointestinal tract and also a reduction in nutrient absorption by
encapsulation of other nutrients and enzymes within (Choct et al., 2004; Adeola and
Cowieson, 2011). As mentioned earlier, dietary fibre reduces DM retention for poultry due to
its low digestibility (Adeola et al. 2010), and this may explain the linear decrease in dietary
DM retention and energy utilisation observed for birds in the current study.
The AME and AMEn value of wheat-DDGS was determined to be 14 and 13 MJ/kg DM,
respectively in the current study. Cozannet et al. (2010a) used the difference method in their
study and determined the AME value of 10 samples of wheat-DDGS to range from 7.7 to 11.5
MJ/kg DM, with a mean value of 9.9 MJ/kg DM. Further, they reported the AMEn values to
range from 7.4 to 10.7 MJ/kg with a mean of 9.3 MJ/kg DM. It is common knowledge that the
chemical properties of DDGS differ significantly among sources (Fastinger et al., 2006). The
GE content and the concentration and/or type of dietary fibre are important factors that may
define the metabolisable energy content of the feed ingredient. In particular, the AME value
of wheat-DDGS for turkey derived in the current study was 3.8 MJ/kg of DM greater
compared with the average AME value of 9.9 MJ/kg DM noted by Cozannet et al. (2010a).
Although the GE content of the wheat-DDGS used in the current study and those of Cozannet
et al. (2010a) were similar (21.6 vs. 20.8 MJ/kg DM, respectively), energy metabolisability in
the wheat-DDGS was greater in the current study (65 vs. 47%, respectively). It therefore
appears that factors other than the GE content of the wheat-DDGS confer differences in its
AME contents among sources. These factors include differences in the assay used,
environmental conditions and species and age of birds used.
It is also noted that the AME and AMEn values of wheat-DDGS was greater for broilers
compared with turkey. In Chapter 3 of this thesis, the AME and AMEn values of the wheat-
DDGS for broilers were determined to be 15 and 14 MJ/kg, respectively. These values are 1
MJ/kg greater than the AME or AMEn values for turkey determined in the current study.
Similarly, Cozannet et al. (2010a) observed that the average AME and AMEn for 10 samples
of wheat-DDGS were (0.53 and 0.87 MJ/kg DM, respectively) greater for broilers at 21 days
old compared with turkey at 13 weeks of age. It is speculated that the energy value of the
wheat-DDGS was greater for broilers at 21 days of age possibly because the broilers were
physiologically more mature than the turkey at 21 days old, hence broilers were able to utilise
dietary nutrients more efficiently. At 21 days in the current study, broilers were at the grower
phase whereas the turkey were at the starter phase. However, this speculation is hardly
supported by the similarity between the observations noted in the current study and the study
153
of Cozannet et al. (2010) where the AME of wheat-DDGS for turkey was determined at 13
wks of age. On the other hand, it is possible that the greater AME and AMEn for wheat-
DDGS noted in the current study for turkey compared with the study of Cozannet et al. (2010)
are due to differences in the chemical characteristics of wheat-DDGS used.
The differences in age of physiological age between the broiler and turkey may also be
explained by the differences in growth performance response during the 7-d experimental
period in the current study. For turkey, increasing the inclusion level of wheat-DDGS from 0
to 60% linearly decreased weight gain and feed efficiency whereas broilers performed best
when fed 300 g/kg of wheat-DDGS in their diet. The linear reduction in growth performance
observed for turkey was likely due to a lesser ability to cope with the increase in dietary fibre
compared with broilers as the inclusion level of wheat-DDGS increased in the diet.
The use of exogenous enzymes to improve nutrient utilisation in feedstuffs for poultry has
been widely investigated. In particular, XAP has been shown to be effective at improving
nutrient utilisation in the diet and growth performance for poultry (Adeola and Coweison,
2011). The mechanisms through which XAP may improve the nutritive value of a feedstuff or
the diet include 1) hydrolysis of arabinoxylans and β-glucans into oligosaccharides and
monosaccharides by xylanase and amylase, as a result reducing digesta viscosity, 2) release of
encapsulated nutrients in the cell wall or gel matrix thereby making the available for
absorption, 3) protease may supplement and at the same time reduce the energy required for
endogenous peptidase production, 4) protease may hydrolyse protein-based anti-nutrients
such as lectins or trypsin inhibitors therefore improving the efficiency of AA utilisation. In
the current study, XAP increased the AME and AMEn value of the wheat-DDGS for turkey by
0.85 and 0.77 MJ/kg DM, respectively but these increases were not statistically significant.
The reasons for the lack of improvement with the addition of XAP are not clear considering
that wheat-DDGS was expected to contain high levels of NSP that are substrates for the
carbohydrases in the enzyme admixture.
In Adeola et al. (2010) study, a cocktail of xylanase and amylase increased the AME and
AMEn of corn distillers grains by 5.7% and 6.2%, respectively. In the current study, the
increases noted in the energy value of the wheat-DDGS due to XAP supplementation were
marginal and were not statistically significant. The lack of XAP effect in the current study is
least expected because feed ingredients or diets that contain substantial concentrations of fiber
respond to a greater extent to carbohydrase supplementation (Bedford, 2000). Adeola and
Cowieson (2011) noted a trend that indicated that the effects of carbohydrase supplementation
154
are repressed when the energy value of the feed ingredient or diet being treated is high. The
AME value of wheat-DDGS noted in the current study for broilers or turkey were greater
compared with other reported values in the literature (Cozannet et al. 2010; Bolarinwa and
Adeola, 2012) and was also greater than the AME content of wheat grain. Perhaps, the greater
ME content in the wheat-DDGS used in the current study was partly responsible for the
marginal effect of XAP. Also, analyzed xylanase and protease activities were approximately
20% lower than was expected in the XAP-supplemented diets for broilers and turkey in the
current study, and may be partly responsible for the marginal increment in AME in the wheat-
DDGS noted. Nevertheless, considering that the wheat-DDGS contain substantial levels of
soluble fiber, it is unlikely that a combination of carbohydrases and proteases will not
significantly improve its utilizable energy for broilers and turkey. It is therefore recommended
that further studies be conducted to evaluate the efficacy of carbohydrases to improve the
energy value of wheat-DDGS for broilers and turkey.
In conclusion, the AME and AMEn values of wheat-DDGS for turkey were determined to be
14 and 14.9 MJ/kg of DM, respectively. Supplemental XAP marginally increased the
metabolisable energy content in wheat-DDGS for turkey. Increasing the inclusion level of
wheat-DDGS in the diet reduced dry matter and energy utilisation of the diet for turkey most
likely due to the increase in dietary fibre composition.
True phosphorus digestibility and retention of wheat-DDGS without- or with supplemental
phytase for turkey
The current study determined the digestible P content of wheat-DDGS without- or with a
phytase for 21 d old turkey using a linear regression method. We hypothesized that wheat-
DDGS is a good source of digestible P for turkey and that supplemental phytase will release
phytate bound P in the wheat-DDGS, thus increasing P utilisation in the feed ingredient. The
wheat-DDGS used in the current study contained by analysis, 7.6 g/kg DM of P. Thacker and
Widyaratne (2007) reported the total P content in wheat-DDGS to be 12.3 g/kg DM whilst
Nyachoti et al. (2005) reported a value of 9.4 g/kg DM. The differences in the total P content
of wheat-DDGS among sources further testifies to the variability that exist in its chemical
composition among sources.
Increasing the inclusion level of wheat-DDGS in the dietary treatments reduced the utilisation
of DM at the ileal and total tract level in the current study. The reduction in DM utilisation
noted may be due to the increased level of dietary fibre associated with increasing the level of
155
wheat-DDGS in the diets. High levels of dietary fibre have been reported to reduce DM and
nutrient utilisation in poultry (Choct et al., 2004). Also, supplementing the diets with phytase
did not improve P utilisation at either the ileal or total tract level. The lack of response to
phytase may have been due to the low level of phytate bound P in the wheat-DDGS because it
is known that some hydrolysis of phytate occurs during the fermentation and drying steps of
bioethanol production (Martinez-Amezcua et al. 2004; Liu and Han, 2011; Liu, 2011). For
example, Liu and Han (2011) observed that during the fermentation process, the ratio of
phytate P to non-phytate bound P decreased significantly; this is an indication that a large
proportion of phytate are degraded by yeast phytase during fermentation. Nevertheless,
Martinez-Amezcua et al. (2004) observed that the hydrolysis of phytate in the DDGS during
fermentation may be incomplete, and that heat treatment during the drying step is also
important in defining the non-phytate bound P content in the DDGS. Information about the
phytate P content or temperature used to dry the DDGS used in the current study was not
available, but because the DDGS was dark in colour it is speculated that the DDGS may have
been substantially heat-treated.
Using the regression method, it is possible to extrapolate true P digestibility or retention and
basal endogenous P loss from the linear relationship between undigested P and dietary P
intake. In the current study, we observed a strong relationship between undigested P and
dietary P intake, which is important pre-requisite for the use of the regression technique. The
linear regression method has been used to determine true P retention of feed ingredients for
broilers (Dilger and Adeola, 2006) and swine (Akinmusire and Adeola, 2008) as well as for
determination of true ileal AA digestibility of feed ingredients for broilers (Kong and Adeola,
2011). True ileal P digestibility of wheat-DDGS for turkey was determined to be 75%
whereas the true P retention was 71%. The TPD and TPR noted for wheat-DDGS indicates
that majority of the P in wheat-DDGS was present in the form that is readily utilisable for the
bird. The results in the current study are similar to those reported in Chapter 3 although
broilers were able to utilise more of the P in the wheat-DDGS compared with turkey (90 vs.
70%, respectively). The difference in P digestibility between broilers and turkey in the current
study is probably due to differences in physiological maturity between the two speciess at 21
d of age. The TPD and TPR of wheat-DDGS noted for broilers and turkey in the current study
indicated that the majority of P in wheat-DDGS was digestible. Supplemental phytase did not
affect P digestibility or retention for broilers and turkey in the current study. The high TPD
and TPR of wheat-DDGS in the current study is an indication that the level of phytate in the
wheat-DDGS could have been low and may possibly explain the lack of phytase effect.
156
Phytate may increase endogenous mineral losses by increasing secretion of mucin (Cowieson
et al., 2004), forming complexes with cations making them unavailable for absorption or
bonding with endogenous enzymes and as a result reducing their efficacy (Dilworth et al.,
2005), or causing a modification to the gastrointestinal electrolyte balance leading to less
efficient mineral utilisation (Ravindran et al., 2008). Phytase may improve the utilisation of
minerals by counteracting the anti-nutritional effects of phytate (Cowieson et al., 2004; Liu
and Ru, 2010). Except for Zn at the total tract level, increasing the inclusion level of wheat-
DDGS in the diets increased the flow of all minerals in a linear manner at both the ileal and
total tract. The current study was designed specifically to determine the true P digestibility
and retention of wheat-DDGS for turkey, and as such the dietary treatments were formulated
in such a way that P was the only mineral that was limiting. Because the dietary treatments
were formulated to be adequate in all minerals except P, increasing the inclusion level of
wheat-DDGS would have resulted in an increase in the dietary intake of other minerals
beyond the levels required by the birds. This may be the reason for the increase in the flow of
majority of the minerals at the ileal and total tract as the dietary inclusion level of wheat-
DDGS increased in the current study. Except for Mg at the ileal level, phytase did not affect
the flow of other minerals at either ileal or total tract level in the current study. The lack of
phytase effect may have been due to the oversupply of the minerals with increasing levels of
wheat-DDGS in the diet or low levels of phytate-bound cations in the gut.
In conclusion, the true ileal digestibility and retention of P in wheat-DDGS is about 70% for
turkey. Supplemental phytase did not improve the ileal digestibility or retention of P in the
wheat-DDGS for turkey.
Apparent- and standardised-ileal amino acid digestibility of wheat-DDGS without or with
supplemental protease for turkey
Wheat-DDGS is increasingly being used as an alternative protein source to SBM in broiler
and pig diets; however, there is currently no information in literature about the digestible AA
content of wheat-DDGS for turkey. Because information about the digestible AA profile of
feed ingredients is essential in diet formulations, the objective of the current study was to
determine the AIAAD and SIAAD of wheat-DDGS without- or with a protease for turkey.
The AIAAD of wheat-DDGS for turkey were generally low in the current study. In fact,
except for Glu and Pro, AIAAD was lower than 50% for all other AA and was zero for Lys. A
number of studies (Lumpkins et al., 2004; Bandegan et al., 2009; Cozannet et al., 2011) using
157
either maize- or wheat-DDGS for broilers have also noted the lowest AID and SID values for
Lys. The SIAAD of wheat-DDGS in the current study ranged from 41 to 81% with Thr being
the least digestible and Pro being the most digestible AA, respectively. Overall, it was noted
that Lys and Asp were the least digestible AA in wheat-DDGS for turkey. A possible
explanation for the generally low AIAAD and SIAAD for wheat-DDGS observed in the
current study may relate to changes caused to the nutritive value of the DDGS by heat
treatment. Excessive heat application during the drying step of bioethanol production has been
reported to reduce the digestibility of Lys in maize-DDGS (Fastinger et al., 2006). Heat
treatment causes the bonding of Lys to carbohydrate moieties by Maillard reaction to form
insoluble complexes that cannot be utilised by the bird. It is possible that the generally low
and in particular, the zero AID and SID for Lys recorded in the current study was due to
excessive heat treatment during the production of the DDGS, and this may also explain its
dark colour.
The colour of the DDGS is sometimes used as an indication of the intensity of heat treatment
during the drying process (Fastinger et al., 2006). Tools such as the Hunterlab colour grading
system are often used to measure the degree of lightness (L*); redness (a*), and yellowness
(b*) of a product. Although such tools were not used in the current study, a picture of the
wheat-DDGS used in the current study indicated that the colour was very dark and closest to a
level 5 on a maize-DDGS colour chart (Figure 3-3). There is an appreciation for the fact that
the colour of maize-DDGS may differ slightly from that of wheat-DDGS when making this
colour comparison. Light coloured maize-DDGS have been reported to have greater AA
digestibility than dark coloured counterparts for broilers (Ergul et al., 2003; Batal and Dale,
2006) and caecectomized roosters (Fastinger et al., 2006; Cozannet et al., 2011).
Apart from the low AIAAD for wheat-DDGS noted in the current study, there was also wide
variability in AA digestibility. Disregarding Lys and Asp whose digestibility were zero or
very low, there was greater than 60 percentage unit difference between the AID of Pro and
that of Thr. After the AIAAD values were corrected for endogenous AA losses, the variability
in AA digestibility reduced; notably due to the large increase in the digestibility of Thr.
Hence, it appears that the variability in the AID of wheat-DDGS may be partly explained by
the differences in AA of endogenous origin. It was observed that the largest contributors to
basal endogenous AA flow were Thr, Met, Asp, Ala and Ser and this is consistent with the
fact that mucin proteins are high in Thr and Ser (Adedokun et al., 2007). Moughan and
Schuttert (1991) observed that free AA and small peptides are more readily reabsorbed in pigs
compared to mucin proteins due to their resistance to enzymatic hydrolysis. If the same is true
158
for turkey, it is possible that the high proportion of Thr, Met, Asp, Ala and Ser of endogenous
origin is a result of slow rate of reabsorption of these AA as compared with other AA. This
may partly explain the variability in the AA digestibility of wheat-DDGS for turkey and may
be even more important because wheat-DDGS may increase mucin production in the gut due
to its high fibre content.
The AIAAD and SIAAD of wheat-DDGS for broilers are reported in chapter 3. In general, the
AIAAD and SIAAD of wheat-DDGS were greater for broilers compared with turkey. In both
studies (broilers vs. turkey), it was consistent that the ileal digestibility of Lys was zero and
that Pro was the most digestible AA in the wheat-DDGS. On the average, the AIAAD and
SIAAD of the wheat-DDGS were 13 and 10 percentage units, respectively greater for broilers
compared with turkey and the largest differences in AA digestibility were observed for His,
Thr, Cys, Ser, Gly and Asp. Uni et al. (1995; 1999) observed that the post hatch development
of the small intestine for turkey poults is slower compared with that of the broiler chick. It is
speculated that broilers were physiologically more mature and were able to utilise the AA in
the wheat-DDGS more efficiently compared with turkey.
The main benefits of using supplemental enzymes in poultry diets are to increase the
nutritional value of the diet or feed ingredients and also reduce the variation in the nutrient
quality of feed ingredients whilst at the same time reducing nutrient losses in manure
(Bedford 2000). The main idea for supplementing protease in the diet is to increase protein
and AA digestibility and so we hypothesized in the current study that protease will improve
the AIAAD and SIAAD of wheat-DDGS for turkey. There are a number of ways through
which exogenous protease may help improve AA digestibility in wheat-DDGS. Supplemental
proteases may supplement endogenous peptidase production, reducing the requirement for
AA and energy and/or help hydrolyse protein-based anti-nutrients such as lectins or trypsin
inhibitors, improving the efficiency by which the bird utilizes AA and reducing protein
turnover (Adeola and Cowieson, 2011). Indeed, except for Cys and Pro, protease increased
the ileal digestibility of all other AA in the wheat-DDGS for turkey from between 5 to 19
percentage points in the current study.
In conclusion, the AIAAD and SIAAD of wheat-DDGS for turkey are quite low and variable.
The digestibility of Lys and Thr in wheat-DDGS is very low and needs to be accounted for in
diet formulations. Proline and Glu are the most digestible AA in wheat-DDGS for turkey. The
digestibility of AA in wheat-DDGS for turkey is enhanced by addition of a protease from
between 5 to 19 percentage units.
159
Collectively, it is concluded that wheat-DDGS is a useful dietary source of energy and P for
turkey, however, the low Lys and Thr digestibility needs to be accounted when formulating
wheat-DDGS in the diet.
160
CHAPTER 5
GROWTH PERFORMANCE AND GASTROINTESTINAL
TRACT CHARACTERISTICS OF BROILERS RECEIVING A
DIET CONTAINING WHEAT DISTILLERS DRIED GRAINS
WITH SOLUBLES SUPPLEMENTED WITH AN ADMIXTURE
OF XYLANASE, AMYLASE AND PROTEASE OR PHYTASE
INDIVIDUALLY OR IN COMBINATION
161
5.1 INTRODUCTION
The energy value, amino acids digestibility and P utilisation in wheat distillers dried grains
with solubles (wheat-DDGS) were determined and reported in Chapter 3 of this thesis. The
results in Chapter 3 indicated that the metabolisable energy (ME) and digestible P content of
wheat-DDGS are comparable to those of wheat and soyabean meal (SBM) for broilers. The
comparable ME and digestible P contents of wheat-DDGS to wheat and SBM suggests that
wheat-DDGS may be used to substitute these feedstuffs in broiler diets. Therefore, the ME
and digestible nutrient values of wheat-DDGS determined in Chapter 3, and digestible
nutrient values for other major feedstuffs derived from the literature were used to formulate
diets for broilers to assess the performance of broilers fed enzyme-supplemented diets
containing wheat-DDGS.
The growth performance responses of broilers receiving diets containing maize-DDGS are
widely reported in the literature. Loar et al. (2010) and Shim et al. (2011) reported that
including up to 24% maize-DDGS in a maize-SBM based diet improved broiler performance
above feeding a maize-SBM based diet containing no DDGS. On the other hand, others have
reported that bird performance depreciates at inclusion levels of 9% (Lumpkins et al., 2004)
or 15% (Wang et al., 2007a) of maize-DDGS in a maize-SBM based diet. There are
comparatively no data available in the literature for wheat-DDGS, however, it is speculated
that the use of energy and digestible nutrient values to formulate a wheat-SBM based diet
containing wheat-DDGS for broilers will support growth performance.
Supplemental carbohydrases, protease or phytase or a combination of these enzymes are often
used in poultry diets. Carbohydrases may help promote growth, efficiency of nutrient
utilisation, and reduce nutrient excretion by degradation of non starch polysaccharides (NSP)
in the cell wall matrix causing a reduction in digesta viscosity thereby improving contact
between digesta, digestive enzymes and the absorptive surface (Bedford and Schulze, 1998).
Phytase may release P bound to phytate, whereas protease may help supplement endogenous
peptidase production, thus reducing the requirement for amino acids (AA) and energy (Adeola
and Cowieson, 2011). The efficacy of phytase and an enzyme mixture containing xylanase,
amylase and protease activities have been investigated in a maize-SBM based diet containing
maize-DDGS for broilers (Olukosi et al., 2010), but greater benefits can be derived from
using these enzymes in a diet containing wheat-DDGS because of the greater concentration of
dietary fibre in the latter (Vilarino et al., 2007).
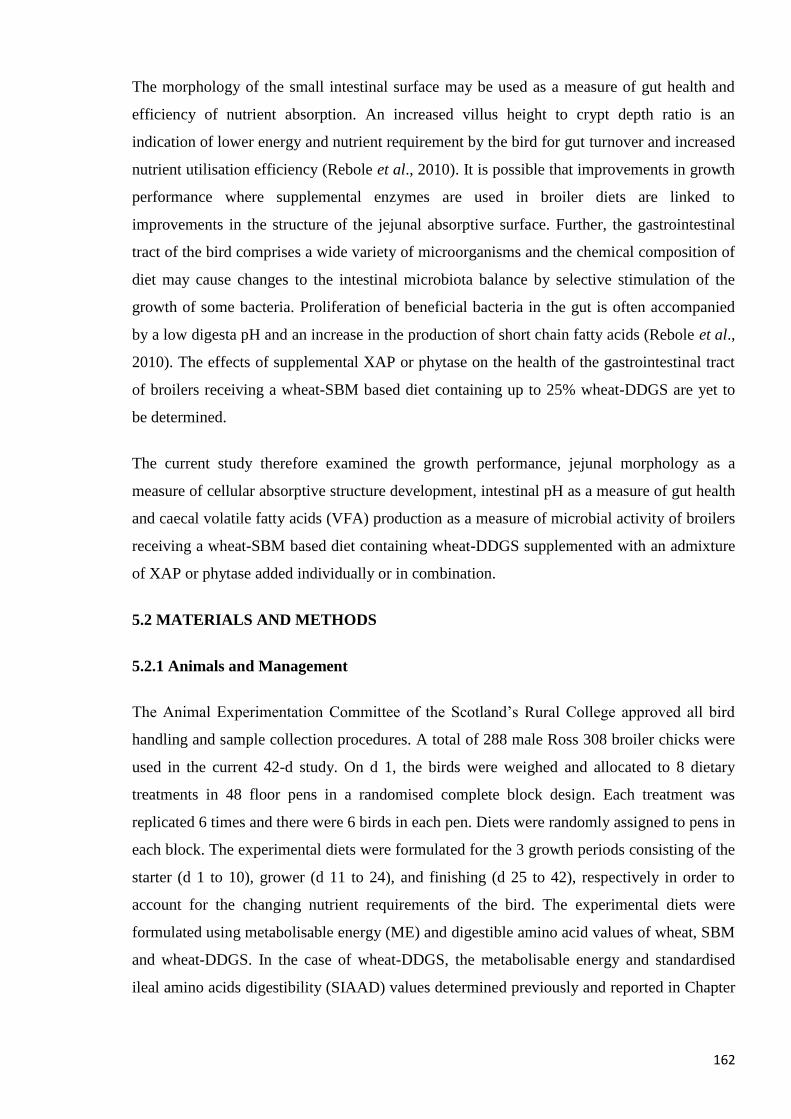
162
The morphology of the small intestinal surface may be used as a measure of gut health and
efficiency of nutrient absorption. An increased villus height to crypt depth ratio is an
indication of lower energy and nutrient requirement by the bird for gut turnover and increased
nutrient utilisation efficiency (Rebole et al., 2010). It is possible that improvements in growth
performance where supplemental enzymes are used in broiler diets are linked to
improvements in the structure of the jejunal absorptive surface. Further, the gastrointestinal
tract of the bird comprises a wide variety of microorganisms and the chemical composition of
diet may cause changes to the intestinal microbiota balance by selective stimulation of the
growth of some bacteria. Proliferation of beneficial bacteria in the gut is often accompanied
by a low digesta pH and an increase in the production of short chain fatty acids (Rebole et al.,
2010). The effects of supplemental XAP or phytase on the health of the gastrointestinal tract
of broilers receiving a wheat-SBM based diet containing up to 25% wheat-DDGS are yet to
be determined.
The current study therefore examined the growth performance, jejunal morphology as a
measure of cellular absorptive structure development, intestinal pH as a measure of gut health
and caecal volatile fatty acids (VFA) production as a measure of microbial activity of broilers
receiving a wheat-SBM based diet containing wheat-DDGS supplemented with an admixture
of XAP or phytase added individually or in combination.
5.2 MATERIALS AND METHODS
5.2.1 Animals and Management
The Animal Experimentation Committee of the Scotland’s Rural College approved all bird
handling and sample collection procedures. A total of 288 male Ross 308 broiler chicks were
used in the current 42-d study. On d 1, the birds were weighed and allocated to 8 dietary
treatments in 48 floor pens in a randomised complete block design. Each treatment was
replicated 6 times and there were 6 birds in each pen. Diets were randomly assigned to pens in
each block. The experimental diets were formulated for the 3 growth periods consisting of the
starter (d 1 to 10), grower (d 11 to 24), and finishing (d 25 to 42), respectively in order to
account for the changing nutrient requirements of the bird. The experimental diets were
formulated using metabolisable energy (ME) and digestible amino acid values of wheat, SBM
and wheat-DDGS. In the case of wheat-DDGS, the metabolisable energy and standardised
ileal amino acids digestibility (SIAAD) values determined previously and reported in Chapter
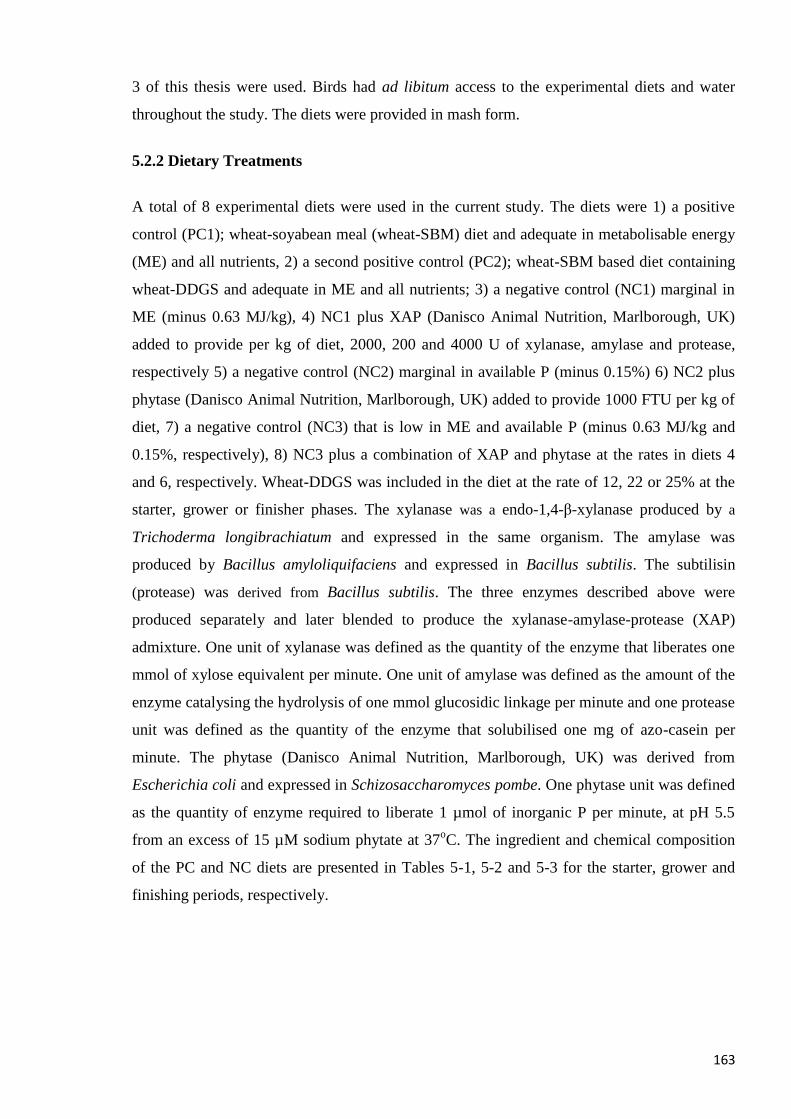
163
3 of this thesis were used. Birds had ad libitum access to the experimental diets and water
throughout the study. The diets were provided in mash form.
5.2.2 Dietary Treatments
A total of 8 experimental diets were used in the current study. The diets were 1) a positive
control (PC1); wheat-soyabean meal (wheat-SBM) diet and adequate in metabolisable energy
(ME) and all nutrients, 2) a second positive control (PC2); wheat-SBM based diet containing
wheat-DDGS and adequate in ME and all nutrients; 3) a negative control (NC1) marginal in
ME (minus 0.63 MJ/kg), 4) NC1 plus XAP (Danisco Animal Nutrition, Marlborough, UK)
added to provide per kg of diet, 2000, 200 and 4000 U of xylanase, amylase and protease,
respectively 5) a negative control (NC2) marginal in available P (minus 0.15%) 6) NC2 plus
phytase (Danisco Animal Nutrition, Marlborough, UK) added to provide 1000 FTU per kg of
diet, 7) a negative control (NC3) that is low in ME and available P (minus 0.63 MJ/kg and
0.15%, respectively), 8) NC3 plus a combination of XAP and phytase at the rates in diets 4
and 6, respectively. Wheat-DDGS was included in the diet at the rate of 12, 22 or 25% at the
starter, grower or finisher phases. The xylanase was a endo-1,4-β-xylanase produced by a
Trichoderma longibrachiatum and expressed in the same organism. The amylase was
produced by Bacillus amyloliquifaciens and expressed in Bacillus subtilis. The subtilisin
(protease) was derived from Bacillus subtilis. The three enzymes described above were
produced separately and later blended to produce the xylanase-amylase-protease (XAP)
admixture. One unit of xylanase was defined as the quantity of the enzyme that liberates one
mmol of xylose equivalent per minute. One unit of amylase was defined as the amount of the
enzyme catalysing the hydrolysis of one mmol glucosidic linkage per minute and one protease
unit was defined as the quantity of the enzyme that solubilised one mg of azo-casein per
minute. The phytase (Danisco Animal Nutrition, Marlborough, UK) was derived from
Escherichia coli and expressed in Schizosaccharomyces pombe. One phytase unit was defined
as the quantity of enzyme required to liberate 1 µmol of inorganic P per minute, at pH 5.5
from an excess of 15 µM sodium phytate at 37oC. The ingredient and chemical composition
of the PC and NC diets are presented in Tables 5-1, 5-2 and 5-3 for the starter, grower and
finishing periods, respectively.
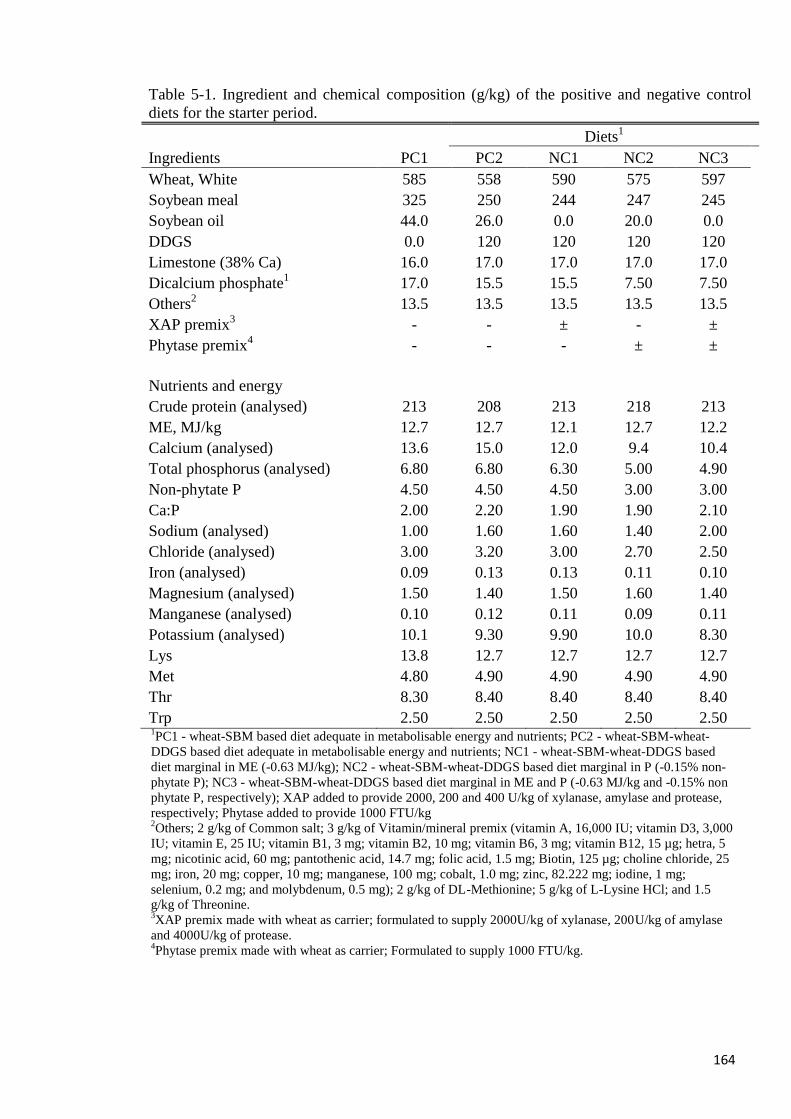
164
Table 5-1. Ingredient and chemical composition (g/kg) of the positive and negative control
diets for the starter period.
Diets1
Ingredients PC1 PC2 NC1 NC2 NC3
Wheat, White 585 558 590 575 597
Soybean meal 325 250 244 247 245
Soybean oil 44.0 26.0 0.0 20.0 0.0
DDGS 0.0 120 120 120 120
Limestone (38% Ca) 16.0 17.0 17.0 17.0 17.0
Dicalcium phosphate1 17.0 15.5 15.5 7.50 7.50
Others2 13.5 13.5 13.5 13.5 13.5
XAP premix3 - - ± - ±
Phytase premix4 - - - ± ±
Nutrients and energy
Crude protein (analysed) 213 208 213 218 213
ME, MJ/kg 12.7 12.7 12.1 12.7 12.2
Calcium (analysed) 13.6 15.0 12.0 9.4 10.4
Total phosphorus (analysed) 6.80 6.80 6.30 5.00 4.90
Non-phytate P 4.50 4.50 4.50 3.00 3.00
Ca:P 2.00 2.20 1.90 1.90 2.10
Sodium (analysed) 1.00 1.60 1.60 1.40 2.00
Chloride (analysed) 3.00 3.20 3.00 2.70 2.50
Iron (analysed) 0.09 0.13 0.13 0.11 0.10
Magnesium (analysed) 1.50 1.40 1.50 1.60 1.40
Manganese (analysed) 0.10 0.12 0.11 0.09 0.11
Potassium (analysed) 10.1 9.30 9.90 10.0 8.30
Lys 13.8 12.7 12.7 12.7 12.7
Met 4.80 4.90 4.90 4.90 4.90
Thr 8.30 8.40 8.40 8.40 8.40
Trp 2.50 2.50 2.50 2.50 2.50 1PC1 - wheat-SBM based diet adequate in metabolisable energy and nutrients; PC2 - wheat-SBM-wheat-
DDGS based diet adequate in metabolisable energy and nutrients; NC1 - wheat-SBM-wheat-DDGS based
diet marginal in ME (-0.63 MJ/kg); NC2 - wheat-SBM-wheat-DDGS based diet marginal in P (-0.15% non-
phytate P); NC3 - wheat-SBM-wheat-DDGS based diet marginal in ME and P (-0.63 MJ/kg and -0.15% non
phytate P, respectively); XAP added to provide 2000, 200 and 400 U/kg of xylanase, amylase and protease,
respectively; Phytase added to provide 1000 FTU/kg 2Others; 2 g/kg of Common salt; 3 g/kg of Vitamin/mineral premix (vitamin A, 16,000 IU; vitamin D3, 3,000
IU; vitamin E, 25 IU; vitamin B1, 3 mg; vitamin B2, 10 mg; vitamin B6, 3 mg; vitamin B12, 15 µg; hetra, 5
mg; nicotinic acid, 60 mg; pantothenic acid, 14.7 mg; folic acid, 1.5 mg; Biotin, 125 µg; choline chloride, 25
mg; iron, 20 mg; copper, 10 mg; manganese, 100 mg; cobalt, 1.0 mg; zinc, 82.222 mg; iodine, 1 mg;
selenium, 0.2 mg; and molybdenum, 0.5 mg); 2 g/kg of DL-Methionine; 5 g/kg of L-Lysine HCl; and 1.5
g/kg of Threonine. 3XAP premix made with wheat as carrier; formulated to supply 2000U/kg of xylanase, 200U/kg of amylase
and 4000U/kg of protease. 4Phytase premix made with wheat as carrier; Formulated to supply 1000 FTU/kg.
165
Table 5-2. Ingredient and chemical composition (g/kg) of the positive and negative control
diets for the grower phase.
Diets1
Ingredients PC1 PC2 NC1 NC2 NC3
Wheat, White 592 547 585 566 596
Soybean meal 308 165 155 160 152
Soybean oil 62.0 28.0 0.0 22.0 0.0
DDGS 0.0 220 220 220 220
Limestone (38% Ca) 12.0 14.0 14.0 14.0 14.0
Dicalcium phosphate 17.0 14.5 14.5 6.50 6.50
L-Lysine HCl 2.00 5.00 5.00 5.00 5.00
Others2 7.00 7.00 7.00 7.00 7.00
XAP premix3 - - ± - ±
Phytase premix4 - - - ± ±
Nutrients and energy
Crude protein (analysed) 217 195 216 203 201
ME, MJ/kg 13.2 13.2 12.6 13.2 12.7
Calcium (analysed) 8.60 10.5 8.50 7.60 9.80
Total phosphorus (analysed) 5.00 6.20 5.80 4.60 5.40
Non-phytate P 4.50 4.50 4.50 3.00 3.00
Ca:P 1.70 1.70 1.50 1.70 1.80
Sodium (analysed) 0.70 1.90 1.70 1.70 1.60
Chloride (analysed) 2.20 3.00 2.40 2.40 3.10
Iron (analysed) 0.07 0.11 0.10 0.10 0.11
Magnesium (analysed) 1.10 1.50 1.50 1.30 1.50
Manganese (analysed) 0.08 0.10 0.09 0.09 0.11
Potassium (analysed) 7.70 8.70 8.70 7.80 9.60
Arg 12.6 10.5 10.3 10.4 10.3
His 5.00 5.10 5.00 5.00 5.00
Lys 11.2 11.3 11.1 11.2 11.1
Met 4.30 4.30 4.40 4.30 4.40
Thr 7.00 7.20 7.10 7.20 7.10
Trp 2.40 2.40 2.40 2.40 2.40 1PC1 - wheat-SBM based diet adequate in metabolisable energy and nutrients; PC2 - wheat-SBM-wheat-DDGS
based diet adequate in metabolisable energy and nutrients; NC1 - wheat-SBM-wheat-DDGS based diet marginal
in ME (-0.63 MJ/kg); NC2 - wheat-SBM-wheat-DDGS based diet marginal in P (-0.15% non-phytate P); NC3 -
wheat-SBM-wheat-DDGS based diet marginal in ME and P (-0.63 MJ/kg and -0.15% non phytate P,
respectively); XAP added to provide 2000, 200 and 400 U/kg of xylanase, amylase and protease, respectively;
Phytase added to provide 1000 FTU/kg
2 Others; 2 g/kg of Common salt; 3 g/kg of Vitamin/mineral premix (vitamin A, 16,000 IU; vitamin D3, 3,000
IU; vitamin E, 25 IU; vitamin B1, 3 mg; vitamin B2, 10 mg; vitamin B6, 3 mg; vitamin B12, 15 µg; hetra, 5 mg;
nicotinic acid, 60 mg; pantothenic acid, 14.7 mg; folic acid, 1.5 mg; Biotin, 125 µg; choline chloride, 25 mg;
iron, 20 mg; copper, 10 mg; manganese, 100 mg; cobalt, 1.0 mg; zinc, 82.2 mg; iodine, 1 mg; selenium, 0.2 mg;
and molybdenum, 0.5 mg); 1.5 g/kg of DL-Methionine; and 0.5 g/kg of Threonine. 3XAP premix made with wheat as carrier; formulated to supply 2000U/kg of xylanase, 200U/kg of amylase and
4000U/kg of protease. 4Phytase premix made with wheat as carrier; Formulated to supply 1000 FTU/kg.
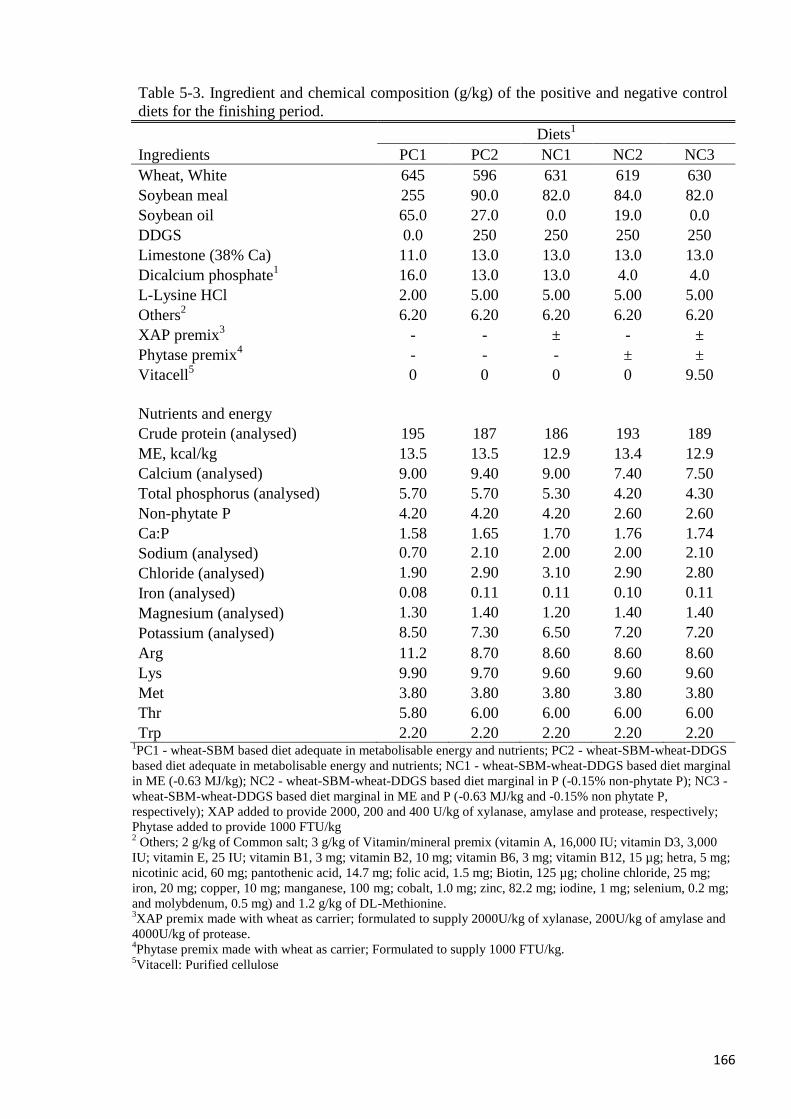
166
Table 5-3. Ingredient and chemical composition (g/kg) of the positive and negative control
diets for the finishing period.
Diets1
Ingredients PC1 PC2 NC1 NC2 NC3
Wheat, White 645 596 631 619 630
Soybean meal 255 90.0 82.0 84.0 82.0
Soybean oil 65.0 27.0 0.0 19.0 0.0
DDGS 0.0 250 250 250 250
Limestone (38% Ca) 11.0 13.0 13.0 13.0 13.0
Dicalcium phosphate1 16.0 13.0 13.0 4.0 4.0
L-Lysine HCl 2.00 5.00 5.00 5.00 5.00
Others2 6.20 6.20 6.20 6.20 6.20
XAP premix3 - - ± - ±
Phytase premix4 - - - ± ±
Vitacell5 0 0 0 0 9.50
Nutrients and energy
Crude protein (analysed) 195 187 186 193 189
ME, kcal/kg 13.5 13.5 12.9 13.4 12.9
Calcium (analysed) 9.00 9.40 9.00 7.40 7.50
Total phosphorus (analysed) 5.70 5.70 5.30 4.20 4.30
Non-phytate P 4.20 4.20 4.20 2.60 2.60
Ca:P 1.58 1.65 1.70 1.76 1.74
Sodium (analysed) 0.70 2.10 2.00 2.00 2.10
Chloride (analysed) 1.90 2.90 3.10 2.90 2.80
Iron (analysed) 0.08 0.11 0.11 0.10 0.11
Magnesium (analysed) 1.30 1.40 1.20 1.40 1.40
Potassium (analysed) 8.50 7.30 6.50 7.20 7.20
Arg 11.2 8.70 8.60 8.60 8.60
Lys 9.90 9.70 9.60 9.60 9.60
Met 3.80 3.80 3.80 3.80 3.80
Thr 5.80 6.00 6.00 6.00 6.00
Trp 2.20 2.20 2.20 2.20 2.20 1PC1 - wheat-SBM based diet adequate in metabolisable energy and nutrients; PC2 - wheat-SBM-wheat-DDGS
based diet adequate in metabolisable energy and nutrients; NC1 - wheat-SBM-wheat-DDGS based diet marginal
in ME (-0.63 MJ/kg); NC2 - wheat-SBM-wheat-DDGS based diet marginal in P (-0.15% non-phytate P); NC3 -
wheat-SBM-wheat-DDGS based diet marginal in ME and P (-0.63 MJ/kg and -0.15% non phytate P,
respectively); XAP added to provide 2000, 200 and 400 U/kg of xylanase, amylase and protease, respectively;
Phytase added to provide 1000 FTU/kg 2 Others; 2 g/kg of Common salt; 3 g/kg of Vitamin/mineral premix (vitamin A, 16,000 IU; vitamin D3, 3,000
IU; vitamin E, 25 IU; vitamin B1, 3 mg; vitamin B2, 10 mg; vitamin B6, 3 mg; vitamin B12, 15 µg; hetra, 5 mg;
nicotinic acid, 60 mg; pantothenic acid, 14.7 mg; folic acid, 1.5 mg; Biotin, 125 µg; choline chloride, 25 mg;
iron, 20 mg; copper, 10 mg; manganese, 100 mg; cobalt, 1.0 mg; zinc, 82.2 mg; iodine, 1 mg; selenium, 0.2 mg;
and molybdenum, 0.5 mg) and 1.2 g/kg of DL-Methionine. 3XAP premix made with wheat as carrier; formulated to supply 2000U/kg of xylanase, 200U/kg of amylase and
4000U/kg of protease. 4Phytase premix made with wheat as carrier; Formulated to supply 1000 FTU/kg.
5Vitacell: Purified cellulose
167
5.2.3 Growth Performance and Gut Profiling
Birds were weighed individually on d 1, 24, and 42, whereas feed intake was determined on
pen basis on d 1, 24 and 42. On day 42, two birds in each of the 48 pens with bodyweights
closest to the mean of the pen were euthanized by cervical dislocation. Duplicate readings of
digesta pH at the caeca and duodenum of the two birds were taken using a sterile glass pH
electrode (HI 99163, HANNA Instruments, Romania). Caecal contents were collected from
the two birds to analyse for VFA concentrations. The caecal digesta was snap frozen in liquid
N immediately after collection and stored at -20oC pending chemical analysis. Tissue from the
mid-section of the jejunum approximately 6 cm in length was collected from one bird. The
tissue sections were flushed clean of digesta with phosphate buffer saline (pH 7.2), mounted
and stapled on cardboards and stored fully immersed in 10% formalin solution. These sections
were later dehydrated in series of ethyl alcohols of increasing concentrations (70, 90, and
100%), cleared with xylene, and embedded in polyfin embedded wax in a Shandon Excelsior
Tissue Processor (Thermo Fisher Scientific, Cheshire, UK). They were cut into 2 µm by a
Finesse Rotary Microtome (Thermo Shandon Inc, Pittsburgh, PA), placed on glass slides, and
stained with haematoxylin (Gill no. 2, Sigma, St. Louis, MO) and eosin (Sigma). Images of
the villus and crypts were captured using a Leica DM4000 B Digital Microscope (Leica
Microsystems Imaging Solutions Ltd., Milton Keynes, UK) fitted with a Leica DC480 digital
camera. Measurements of the villus and crypt lengths were done using the Image J software.
Villus height was defined as the length from the villus-crypt junction to the tip of the villus.
Crypt depth was described as the depth of the invagination between adjacent villi.
5.2.4 Chemical Analysis
The experimental diets were analysed for gross energy, N, minerals and enzyme activity. For
DM determination, samples were dried at 105oC for 24 hours in a drying oven (Uniterm,
Russel-Lindsey Engineering Ltd., Birmingham, England. UK) (AOAC International 2006,
method 934.01). Gross energy was determined in an adiabatic oxygen bomb calorimeter using
benzoic acid as an internal standard (Model 6200, Parr Instruments, Moline, Illinois, USA).
Nitrogen was determined by combustion method (AOAC International 2006, method 968.06).
Mineral concentrations in the samples were determined using inductively coupled plasma
spectrophotometry (ICP) according to the procedures of Olsen and Sommers (1982).
Xylanase activity in diets was measured using a kit (Megazyme International Ireland Ltd.,
Bray, Ireland) using the method of McCleary (1991). Amylase activity in feed was measured
using Phadebas (Megazyme International Ireland Ltd.) tablets using the method described by
168
McCleary and Sheehan (1989). Protease activity was analysed using the modified method of
Lynn and Clevette-Radford (1984) with azocasein used as substrate. Phytase activity in the
diets was analysed using the AOAC official method (2000.12, AOAC, 2000).
The caecal digesta samples were analysed for VFA using gas chromatography. Briefly, about
1 g of thawed digesta was mixed with 0.2 mL of 24% metaphosphoric acid solution, diluted
with deionised water (4 ml), and centrifuged at 25,000 x g for 20 min at 4oC. The supernatant
was analysed for VFA using a gas chromatograph equipped with a column and flame
ionisation detector.
5.2.5 Statistical Analysis
Bodyweight, feed intake, feed efficiency, digesta pH and jejunal dimensions data in response
to the dietary treatments were analysed using the Genstat Statistical Package (11th edition,
VSN International, 2008). Additivity of the effects of XAP and phytase for a particular
response was determined as follows. Individual enzyme effect was determined as the
difference between the treatments supplemented with either XAP or phytase and their
corresponding NC diets. Combined enzyme effect was determined as the difference between
the treatment supplemented with both XAP and phytase and the corresponding NC diet. If
there was addititvity in the effect of XAP and phytase, the sum of their individual effects
would not be different from the effect noted for their combination. Orthogonal contrast was
used for mean comparisons and check for additivity in the effect of XAP and phytase.
Statistical significance was set at P ≤ 0.05 and tendency at 0.05 < P < 0.10.
5.3 RESULTS
5.3.1 Diets
The ingredient and chemical compositions of the experimental diets used in the current study
are presented in Tables 5-1, 5-2 and 5-3. Analysed xylanase activities were 1786, 1888 and
1528 U/kg in the NC1 diet with added XAP for the starter, grower and finishing diets,
respectively. Corresponding phytase activities were 987, 1263 and 1415 FTU/kg in the NC2
diet with added phytase. For NC3 diet with added XAP and phytase, the values were 1498,
1335 and 1787 for xylanase and 1267, 1232 and 1318 FTU/kg for phytase, respectively. The
analysed xylanase activities were generally lower than the expected value of 2000 U/kg.
Xylanase and phytase activities in the experimental diets without added XAP or phytase were
negligible. Analyses for amylase and protease activities were not done in the current study.
169
5.3.2 Growth Performance
Growth performance responses of broilers receiving wheat-DDGS, XAP and/or phytase from
d 1 to 24 are presented in Table 5-4. Body weight gain, FBW and feed intake were greater (P
< 0.001) for birds offered the PC diet containing wheat-DDGS compared with those offered
the PC diet without wheat-DDGS. On the other hand, the birds receiving the PC2 diet had
greater (P < 0.01) G:F compared with birds receiving the PC1 diet. An admixture of XAP
alone improved (P ≤ 0.05) BWG and FBW compared with birds offered the NC1 diet.
However, the XAP-induced improvement in BWG did not (P < 0.01) restore performance to
the level of birds receiving the PC2 diet. Phytase alone or combined with XAP did not
improve any of the growth performance responses from d 1 to 24. In addition, growth
performance was superior (P < 0.01) for the birds receiving the PC2 diet compared with those
receiving the NC2 plus phytase or NC3 plus XAP and phytase. There was no additivity in the
effect of XAP and phytase on any of the growth responses from d 1 to 24.
The performance of broilers in response to wheat-DDGS and XAP and/or phytase from d 25
to 42 is presented in Table 5-5. Bodyweight gain and FBW were similar for birds receiving
the PC1 and PC2 diets. On the other hand, G:F was superior for birds receiving the PC1 diet
(P < 0.001) whilst birds on the PC2 diet consumed more feed (P < 0.001). Growth responses
did not differ between birds receiving the NC1 plus XAP diet and the PC2 diet from d 25 to
42. Phytase alone or in combination with XAP did not improve any of the growth responses
from d 25 to 42. Birds receiving the PC2 diet were heavier and consumed more feed (P <
0.01) compared with those receiving the NC2 plus phytase or NC3 plus XAP and phytase
diets from d 25 to 42. The effects of XAP and phytase were not additive for any of the growth
responses from d 25 to 42.
The growth performance of broilers receiving wheat-DDGS and XAP and/or phytase from d 1
to 42 is presented in Table 5-6. Bodyweight gain and FBW were similar for birds receiving
the PC1 and PC2 diets, but G:F was superior for birds receiving the PC1 diet (P < 0.001)
whereas the birds receiving the PC2 diet consumed more (P < 0.001). An admixture of XAP
improved G:F (P < 0.05) and tended to improve BWG and FBW (P < 0.1) of birds above
those receiving the NC1 diet. Overall, growth performance was similar for birds receiving the
PC2 diet and those receiving the NC1 plus XAP diet. Phytase alone or a combination of
phytase and XAP did not improve growth performance of birds above those receiving the NC
diets. Birds receiving the PC2 diet were heavier and consumed more feed (P < 0.001)
compared with those receiving the NC2 plus phytase, but G:F was similar between the two
170
dietary treatments. In addition, BWG, FBW and G:F were superior (P < 0.01) and feed intake
was greater (P < 0.01) for the birds receiving the PC2 diet compared with those receiving
NC3 and a combination of XAP and phytase. There was no additivity in the effect of XAP
and phytase on any of the growth responses from d 1 to 42.
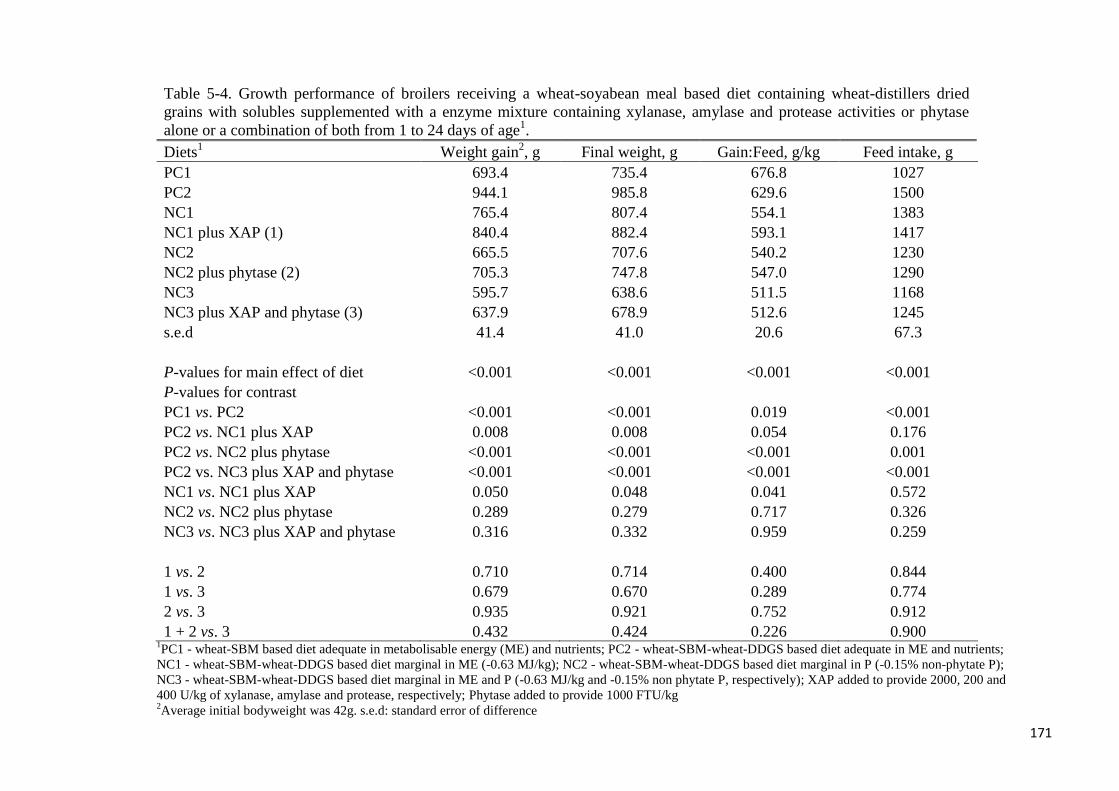
171
Table 5-4. Growth performance of broilers receiving a wheat-soyabean meal based diet containing wheat-distillers dried
grains with solubles supplemented with a enzyme mixture containing xylanase, amylase and protease activities or phytase
alone or a combination of both from 1 to 24 days of age1.
Diets1 Weight gain
2, g Final weight, g Gain:Feed, g/kg Feed intake, g
PC1 693.4 735.4 676.8 1027
PC2 944.1 985.8 629.6 1500
NC1 765.4 807.4 554.1 1383
NC1 plus XAP (1) 840.4 882.4 593.1 1417
NC2 665.5 707.6 540.2 1230
NC2 plus phytase (2) 705.3 747.8 547.0 1290
NC3 595.7 638.6 511.5 1168
NC3 plus XAP and phytase (3) 637.9 678.9 512.6 1245
s.e.d 41.4 41.0 20.6 67.3
P-values for main effect of diet <0.001 <0.001 <0.001 <0.001
P-values for contrast
PC1 vs. PC2 <0.001 <0.001 0.019 <0.001
PC2 vs. NC1 plus XAP 0.008 0.008 0.054 0.176
PC2 vs. NC2 plus phytase <0.001 <0.001 <0.001 0.001
PC2 vs. NC3 plus XAP and phytase <0.001 <0.001 <0.001 <0.001
NC1 vs. NC1 plus XAP 0.050 0.048 0.041 0.572
NC2 vs. NC2 plus phytase 0.289 0.279 0.717 0.326
NC3 vs. NC3 plus XAP and phytase 0.316 0.332 0.959 0.259
1 vs. 2 0.710 0.714 0.400 0.844
1 vs. 3 0.679 0.670 0.289 0.774
2 vs. 3 0.935 0.921 0.752 0.912
1 + 2 vs. 3 0.432 0.424 0.226 0.900 1PC1 - wheat-SBM based diet adequate in metabolisable energy (ME) and nutrients; PC2 - wheat-SBM-wheat-DDGS based diet adequate in ME and nutrients;
NC1 - wheat-SBM-wheat-DDGS based diet marginal in ME (-0.63 MJ/kg); NC2 - wheat-SBM-wheat-DDGS based diet marginal in P (-0.15% non-phytate P);
NC3 - wheat-SBM-wheat-DDGS based diet marginal in ME and P (-0.63 MJ/kg and -0.15% non phytate P, respectively); XAP added to provide 2000, 200 and
400 U/kg of xylanase, amylase and protease, respectively; Phytase added to provide 1000 FTU/kg 2Average initial bodyweight was 42g. s.e.d: standard error of difference
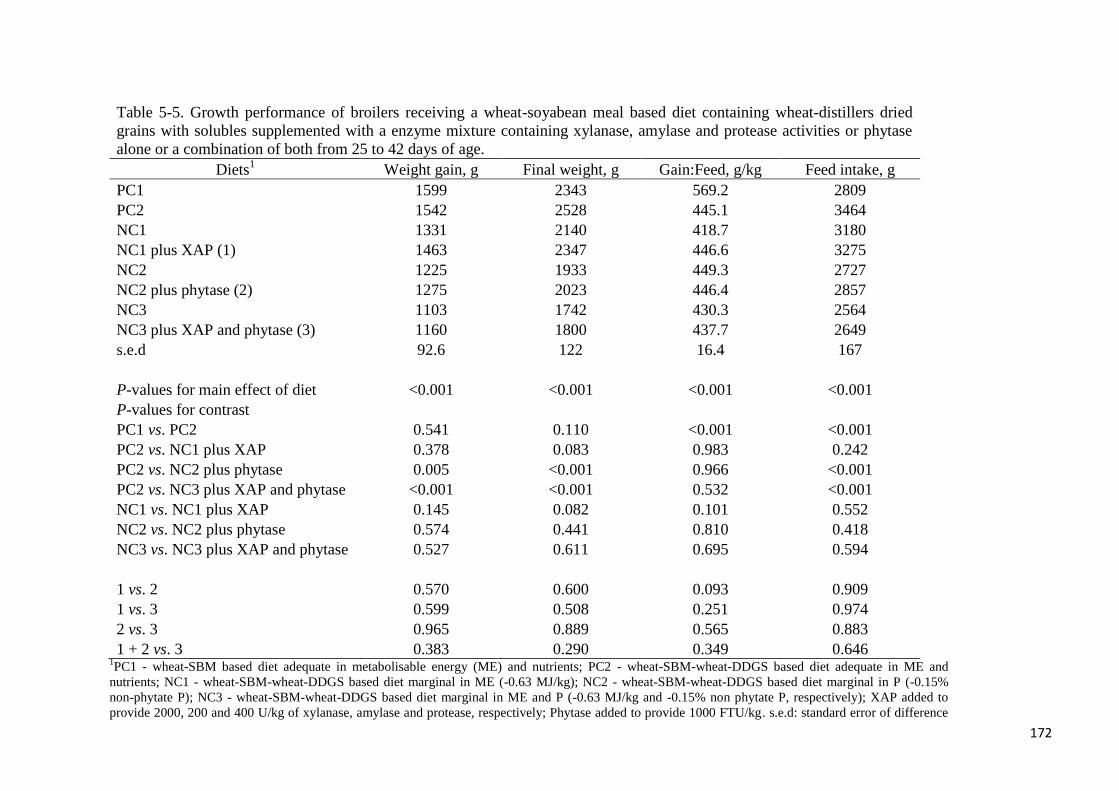
172
Table 5-5. Growth performance of broilers receiving a wheat-soyabean meal based diet containing wheat-distillers dried
grains with solubles supplemented with a enzyme mixture containing xylanase, amylase and protease activities or phytase
alone or a combination of both from 25 to 42 days of age.
Diets1 Weight gain, g Final weight, g Gain:Feed, g/kg Feed intake, g
PC1 1599 2343 569.2 2809
PC2 1542 2528 445.1 3464
NC1 1331 2140 418.7 3180
NC1 plus XAP (1) 1463 2347 446.6 3275
NC2 1225 1933 449.3 2727
NC2 plus phytase (2) 1275 2023 446.4 2857
NC3 1103 1742 430.3 2564
NC3 plus XAP and phytase (3) 1160 1800 437.7 2649
s.e.d 92.6 122 16.4 167
P-values for main effect of diet <0.001 <0.001 <0.001 <0.001
P-values for contrast
PC1 vs. PC2 0.541 0.110 <0.001 <0.001
PC2 vs. NC1 plus XAP 0.378 0.083 0.983 0.242
PC2 vs. NC2 plus phytase 0.005 <0.001 0.966 <0.001
PC2 vs. NC3 plus XAP and phytase <0.001 <0.001 0.532 <0.001
NC1 vs. NC1 plus XAP 0.145 0.082 0.101 0.552
NC2 vs. NC2 plus phytase 0.574 0.441 0.810 0.418
NC3 vs. NC3 plus XAP and phytase 0.527 0.611 0.695 0.594
1 vs. 2 0.570 0.600 0.093 0.909
1 vs. 3 0.599 0.508 0.251 0.974
2 vs. 3 0.965 0.889 0.565 0.883
1 + 2 vs. 3 0.383 0.290 0.349 0.646 1PC1 - wheat-SBM based diet adequate in metabolisable energy (ME) and nutrients; PC2 - wheat-SBM-wheat-DDGS based diet adequate in ME and
nutrients; NC1 - wheat-SBM-wheat-DDGS based diet marginal in ME (-0.63 MJ/kg); NC2 - wheat-SBM-wheat-DDGS based diet marginal in P (-0.15%
non-phytate P); NC3 - wheat-SBM-wheat-DDGS based diet marginal in ME and P (-0.63 MJ/kg and -0.15% non phytate P, respectively); XAP added to
provide 2000, 200 and 400 U/kg of xylanase, amylase and protease, respectively; Phytase added to provide 1000 FTU/kg. s.e.d: standard error of difference

173
Table 5-6. Growth performance of broilers receiving a wheat-soyabean meal based diet containing wheat-distillers dried
grains with solubles supplemented with a enzyme mixture containing xylanase, amylase and protease activities or
phytase alone or a combination of both from 1 to 42 days of age.
Diets1 Weight gain
2, g Final weight, g Gain:Feed, g/kg Feed intake, g
PC1 2301 2343 598.5 3845
PC2 2486 2528 500.8 4965
NC1 2098 2140 459.7 4564
NC1 plus XAP (1) 2305 2347 490.9 4694
NC2 1891 1933 477.8 3957
NC2 plus phytase (2) 1981 2023 477.6 4147
NC3 1699 1742 455.2 3732
NC3 plus XAP and phytase (3) 1759 1800 439.2 4004
s.e.d 118.0 117.9 15.3 210.2
P-values for main effect of diet <0.001 <0.001 <0.001 <0.001
P-values for contrast
PC1 vs. PC2 0.112 0.122 <0.001 <0.001
PC2 vs. NC1 plus XAP 0.142 0.144 0.539 0.185
PC2 vs. NC2 plus phytase <0.001 <0.001 0.146 <0.001
PC2 vs. NC3 plus XAP and phytase <0.001 <0.001 <0.001 <0.001
NC1 vs. NC1 plus XAP 0.075 0.075 0.049 0.520
NC2 vs. NC2 plus phytase 0.428 0.426 0.985 0.349
NC3 vs. NC3 plus XAP and phytase 0.604 0.607 0.247 0.183
1 vs. 2 0.599 0.602 0.163 0.884
1 vs. 3 0.506 0.506 0.032 0.729
2 vs. 3 0.887 0.884 0.401 0.841
1 + 2 vs. 3 0.288 0.288 0.031 0.907 1PC1 - wheat-SBM based diet adequate in metabolisable energy (ME) and nutrients; PC2 - wheat-SBM-wheat-DDGS based diet adequate ME and
nutrients; NC1 - wheat-SBM-wheat-DDGS based diet marginal in ME (-0.63 MJ/kg); NC2 - wheat-SBM-wheat-DDGS based diet marginal in P (-
0.15% non-phytate P); NC3 - wheat-SBM-wheat-DDGS based diet marginal in ME and P (-0.63 MJ/kg and -0.15% non phytate P, respectively); XAP
added to provide 2000, 200 and 400 U/kg of xylanase, amylase and protease, respectively; Phytase added to provide 1000 FTU/kg 2Average initial bodyweight was 42 g. s.e.d: standard error of difference
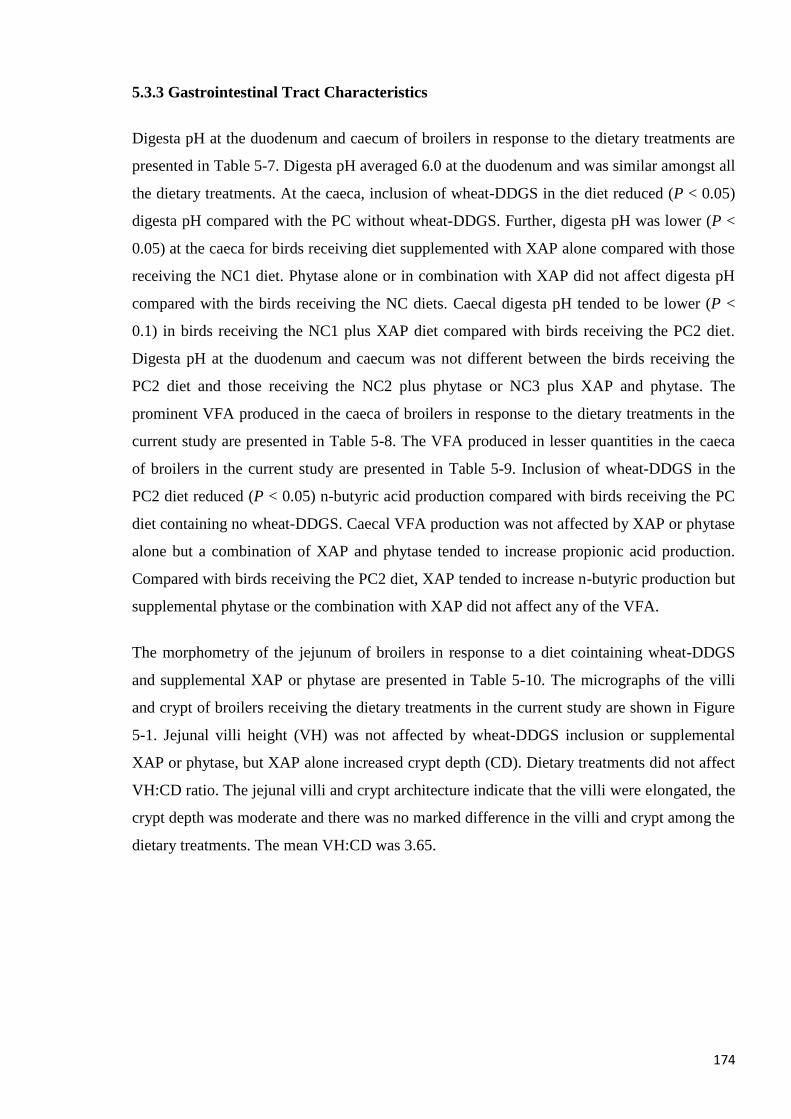
174
5.3.3 Gastrointestinal Tract Characteristics
Digesta pH at the duodenum and caecum of broilers in response to the dietary treatments are
presented in Table 5-7. Digesta pH averaged 6.0 at the duodenum and was similar amongst all
the dietary treatments. At the caeca, inclusion of wheat-DDGS in the diet reduced (P < 0.05)
digesta pH compared with the PC without wheat-DDGS. Further, digesta pH was lower (P <
0.05) at the caeca for birds receiving diet supplemented with XAP alone compared with those
receiving the NC1 diet. Phytase alone or in combination with XAP did not affect digesta pH
compared with the birds receiving the NC diets. Caecal digesta pH tended to be lower (P <
0.1) in birds receiving the NC1 plus XAP diet compared with birds receiving the PC2 diet.
Digesta pH at the duodenum and caecum was not different between the birds receiving the
PC2 diet and those receiving the NC2 plus phytase or NC3 plus XAP and phytase. The
prominent VFA produced in the caeca of broilers in response to the dietary treatments in the
current study are presented in Table 5-8. The VFA produced in lesser quantities in the caeca
of broilers in the current study are presented in Table 5-9. Inclusion of wheat-DDGS in the
PC2 diet reduced (P < 0.05) n-butyric acid production compared with birds receiving the PC
diet containing no wheat-DDGS. Caecal VFA production was not affected by XAP or phytase
alone but a combination of XAP and phytase tended to increase propionic acid production.
Compared with birds receiving the PC2 diet, XAP tended to increase n-butyric production but
supplemental phytase or the combination with XAP did not affect any of the VFA.
The morphometry of the jejunum of broilers in response to a diet cointaining wheat-DDGS
and supplemental XAP or phytase are presented in Table 5-10. The micrographs of the villi
and crypt of broilers receiving the dietary treatments in the current study are shown in Figure
5-1. Jejunal villi height (VH) was not affected by wheat-DDGS inclusion or supplemental
XAP or phytase, but XAP alone increased crypt depth (CD). Dietary treatments did not affect
VH:CD ratio. The jejunal villi and crypt architecture indicate that the villi were elongated, the
crypt depth was moderate and there was no marked difference in the villi and crypt among the
dietary treatments. The mean VH:CD was 3.65.
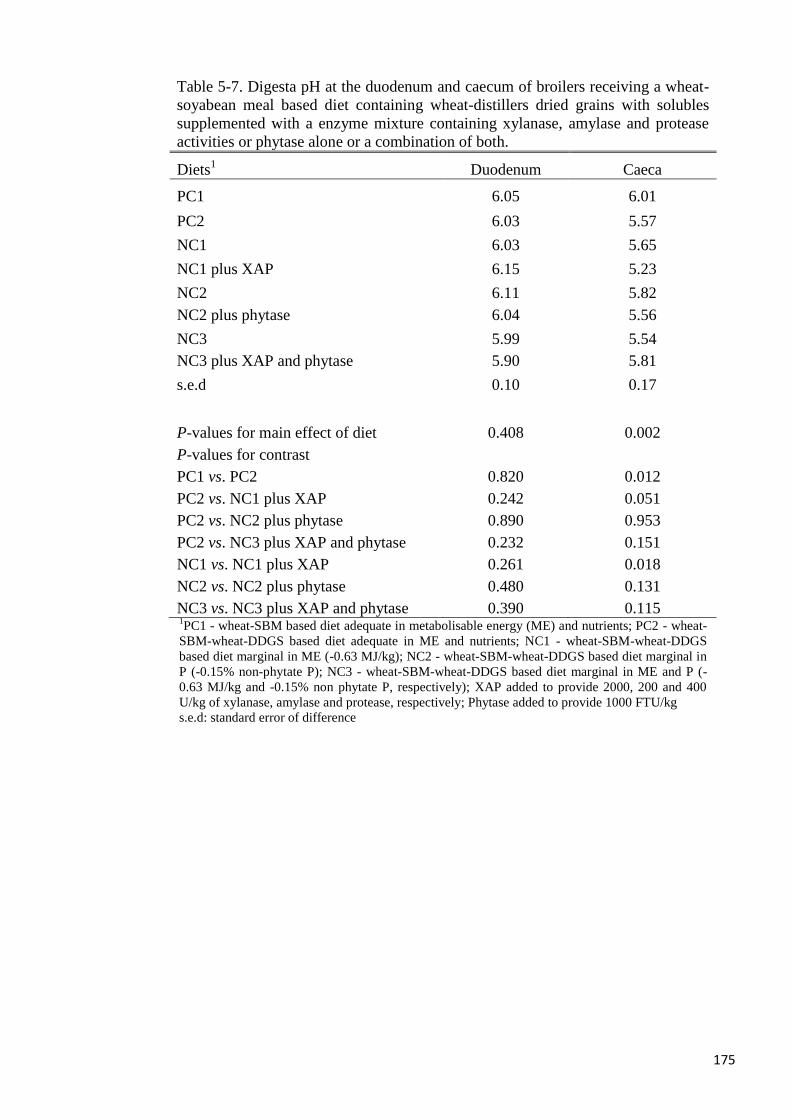
175
Table 5-7. Digesta pH at the duodenum and caecum of broilers receiving a wheat-
soyabean meal based diet containing wheat-distillers dried grains with solubles
supplemented with a enzyme mixture containing xylanase, amylase and protease
activities or phytase alone or a combination of both.
Diets1 Duodenum Caeca
PC1 6.05 6.01
PC2 6.03 5.57
NC1 6.03 5.65
NC1 plus XAP 6.15 5.23
NC2 6.11 5.82
NC2 plus phytase 6.04 5.56
NC3 5.99 5.54
NC3 plus XAP and phytase 5.90 5.81
s.e.d 0.10 0.17
P-values for main effect of diet 0.408 0.002
P-values for contrast
PC1 vs. PC2 0.820 0.012
PC2 vs. NC1 plus XAP 0.242 0.051
PC2 vs. NC2 plus phytase 0.890 0.953
PC2 vs. NC3 plus XAP and phytase 0.232 0.151
NC1 vs. NC1 plus XAP 0.261 0.018
NC2 vs. NC2 plus phytase 0.480 0.131
NC3 vs. NC3 plus XAP and phytase 0.390 0.115 1PC1 - wheat-SBM based diet adequate in metabolisable energy (ME) and nutrients; PC2 - wheat-
SBM-wheat-DDGS based diet adequate in ME and nutrients; NC1 - wheat-SBM-wheat-DDGS
based diet marginal in ME (-0.63 MJ/kg); NC2 - wheat-SBM-wheat-DDGS based diet marginal in
P (-0.15% non-phytate P); NC3 - wheat-SBM-wheat-DDGS based diet marginal in ME and P (-
0.63 MJ/kg and -0.15% non phytate P, respectively); XAP added to provide 2000, 200 and 400
U/kg of xylanase, amylase and protease, respectively; Phytase added to provide 1000 FTU/kg
s.e.d: standard error of difference
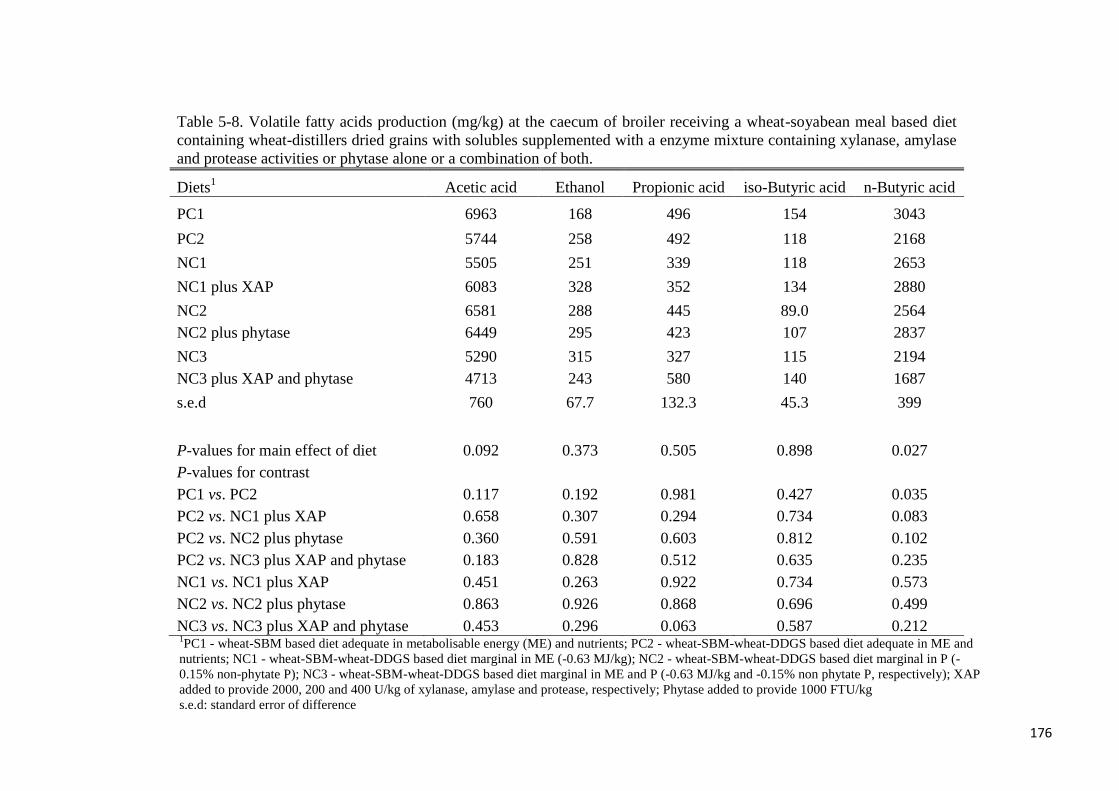
176
Table 5-8. Volatile fatty acids production (mg/kg) at the caecum of broiler receiving a wheat-soyabean meal based diet
containing wheat-distillers dried grains with solubles supplemented with a enzyme mixture containing xylanase, amylase
and protease activities or phytase alone or a combination of both.
Diets1 Acetic acid Ethanol Propionic acid iso-Butyric acid n-Butyric acid
PC1 6963 168 496 154 3043
PC2 5744 258 492 118 2168
NC1 5505 251 339 118 2653
NC1 plus XAP 6083 328 352 134 2880
NC2 6581 288 445 89.0 2564
NC2 plus phytase 6449 295 423 107 2837
NC3 5290 315 327 115 2194
NC3 plus XAP and phytase 4713 243 580 140 1687
s.e.d 760 67.7 132.3 45.3 399
P-values for main effect of diet 0.092 0.373 0.505 0.898 0.027
P-values for contrast
PC1 vs. PC2 0.117 0.192 0.981 0.427 0.035
PC2 vs. NC1 plus XAP 0.658 0.307 0.294 0.734 0.083
PC2 vs. NC2 plus phytase 0.360 0.591 0.603 0.812 0.102
PC2 vs. NC3 plus XAP and phytase 0.183 0.828 0.512 0.635 0.235
NC1 vs. NC1 plus XAP 0.451 0.263 0.922 0.734 0.573
NC2 vs. NC2 plus phytase 0.863 0.926 0.868 0.696 0.499
NC3 vs. NC3 plus XAP and phytase 0.453 0.296 0.063 0.587 0.212 1PC1 - wheat-SBM based diet adequate in metabolisable energy (ME) and nutrients; PC2 - wheat-SBM-wheat-DDGS based diet adequate in ME and
nutrients; NC1 - wheat-SBM-wheat-DDGS based diet marginal in ME (-0.63 MJ/kg); NC2 - wheat-SBM-wheat-DDGS based diet marginal in P (-
0.15% non-phytate P); NC3 - wheat-SBM-wheat-DDGS based diet marginal in ME and P (-0.63 MJ/kg and -0.15% non phytate P, respectively); XAP
added to provide 2000, 200 and 400 U/kg of xylanase, amylase and protease, respectively; Phytase added to provide 1000 FTU/kg
s.e.d: standard error of difference
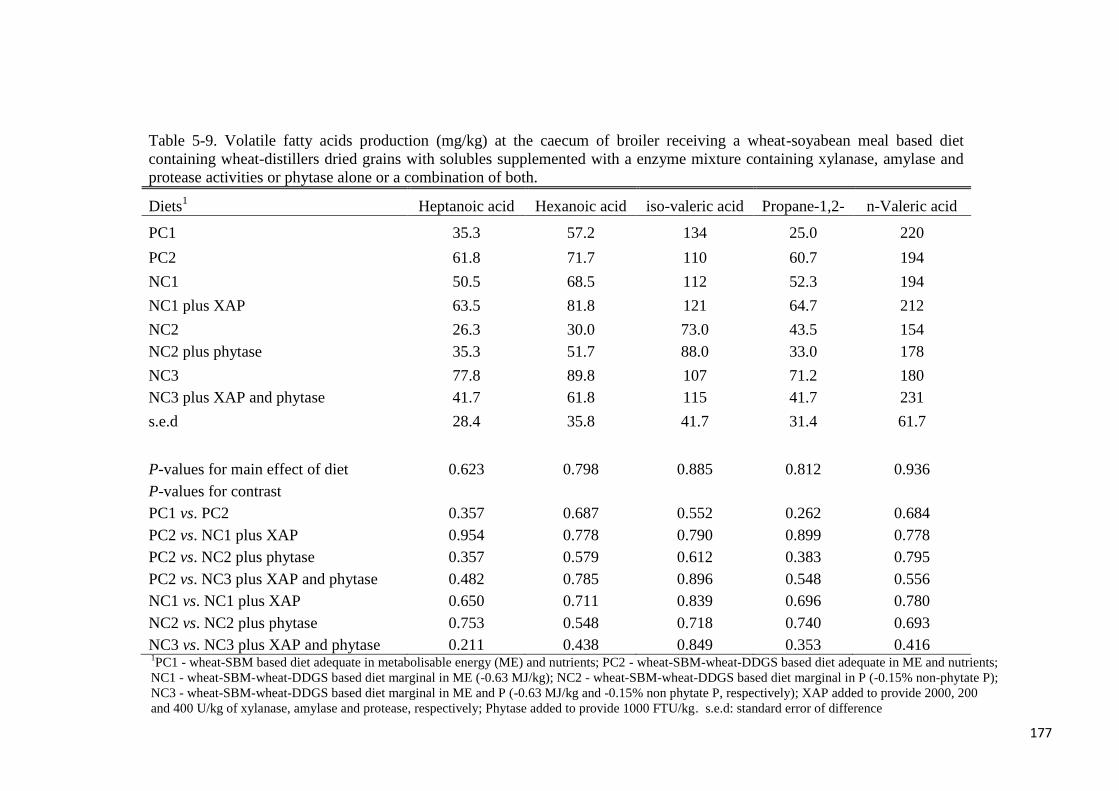
177
Table 5-9. Volatile fatty acids production (mg/kg) at the caecum of broiler receiving a wheat-soyabean meal based diet
containing wheat-distillers dried grains with solubles supplemented with a enzyme mixture containing xylanase, amylase and
protease activities or phytase alone or a combination of both.
Diets1 Heptanoic acid Hexanoic acid iso-valeric acid Propane-1,2- n-Valeric acid
PC1 35.3 57.2 134 25.0 220
PC2 61.8 71.7 110 60.7 194
NC1 50.5 68.5 112 52.3 194
NC1 plus XAP 63.5 81.8 121 64.7 212
NC2 26.3 30.0 73.0 43.5 154
NC2 plus phytase 35.3 51.7 88.0 33.0 178
NC3 77.8 89.8 107 71.2 180
NC3 plus XAP and phytase 41.7 61.8 115 41.7 231
s.e.d 28.4 35.8 41.7 31.4 61.7
P-values for main effect of diet 0.623 0.798 0.885 0.812 0.936
P-values for contrast
PC1 vs. PC2 0.357 0.687 0.552 0.262 0.684
PC2 vs. NC1 plus XAP 0.954 0.778 0.790 0.899 0.778
PC2 vs. NC2 plus phytase 0.357 0.579 0.612 0.383 0.795
PC2 vs. NC3 plus XAP and phytase 0.482 0.785 0.896 0.548 0.556
NC1 vs. NC1 plus XAP 0.650 0.711 0.839 0.696 0.780
NC2 vs. NC2 plus phytase 0.753 0.548 0.718 0.740 0.693
NC3 vs. NC3 plus XAP and phytase 0.211 0.438 0.849 0.353 0.416 1PC1 - wheat-SBM based diet adequate in metabolisable energy (ME) and nutrients; PC2 - wheat-SBM-wheat-DDGS based diet adequate in ME and nutrients;
NC1 - wheat-SBM-wheat-DDGS based diet marginal in ME (-0.63 MJ/kg); NC2 - wheat-SBM-wheat-DDGS based diet marginal in P (-0.15% non-phytate P);
NC3 - wheat-SBM-wheat-DDGS based diet marginal in ME and P (-0.63 MJ/kg and -0.15% non phytate P, respectively); XAP added to provide 2000, 200
and 400 U/kg of xylanase, amylase and protease, respectively; Phytase added to provide 1000 FTU/kg. s.e.d: standard error of difference
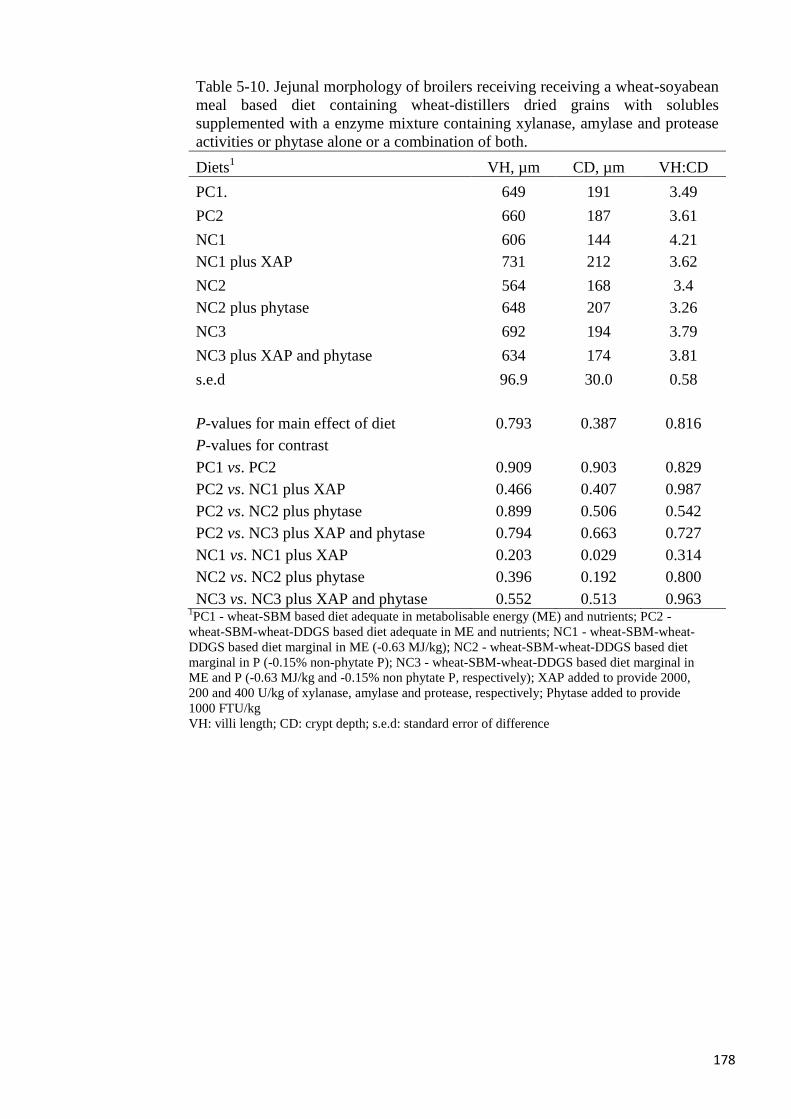
178
Table 5-10. Jejunal morphology of broilers receiving receiving a wheat-soyabean
meal based diet containing wheat-distillers dried grains with solubles
supplemented with a enzyme mixture containing xylanase, amylase and protease
activities or phytase alone or a combination of both.
Diets1 VH, µm CD, µm VH:CD
PC1. 649 191 3.49
PC2 660 187 3.61
NC1 606 144 4.21
NC1 plus XAP 731 212 3.62
NC2 564 168 3.4
NC2 plus phytase 648 207 3.26
NC3 692 194 3.79
NC3 plus XAP and phytase 634 174 3.81
s.e.d 96.9 30.0 0.58
P-values for main effect of diet 0.793 0.387 0.816
P-values for contrast
PC1 vs. PC2 0.909 0.903 0.829
PC2 vs. NC1 plus XAP 0.466 0.407 0.987
PC2 vs. NC2 plus phytase 0.899 0.506 0.542
PC2 vs. NC3 plus XAP and phytase 0.794 0.663 0.727
NC1 vs. NC1 plus XAP 0.203 0.029 0.314
NC2 vs. NC2 plus phytase 0.396 0.192 0.800
NC3 vs. NC3 plus XAP and phytase 0.552 0.513 0.963 1PC1 - wheat-SBM based diet adequate in metabolisable energy (ME) and nutrients; PC2 -
wheat-SBM-wheat-DDGS based diet adequate in ME and nutrients; NC1 - wheat-SBM-wheat-
DDGS based diet marginal in ME (-0.63 MJ/kg); NC2 - wheat-SBM-wheat-DDGS based diet
marginal in P (-0.15% non-phytate P); NC3 - wheat-SBM-wheat-DDGS based diet marginal in
ME and P (-0.63 MJ/kg and -0.15% non phytate P, respectively); XAP added to provide 2000,
200 and 400 U/kg of xylanase, amylase and protease, respectively; Phytase added to provide
1000 FTU/kg
VH: villi length; CD: crypt depth; s.e.d: standard error of difference
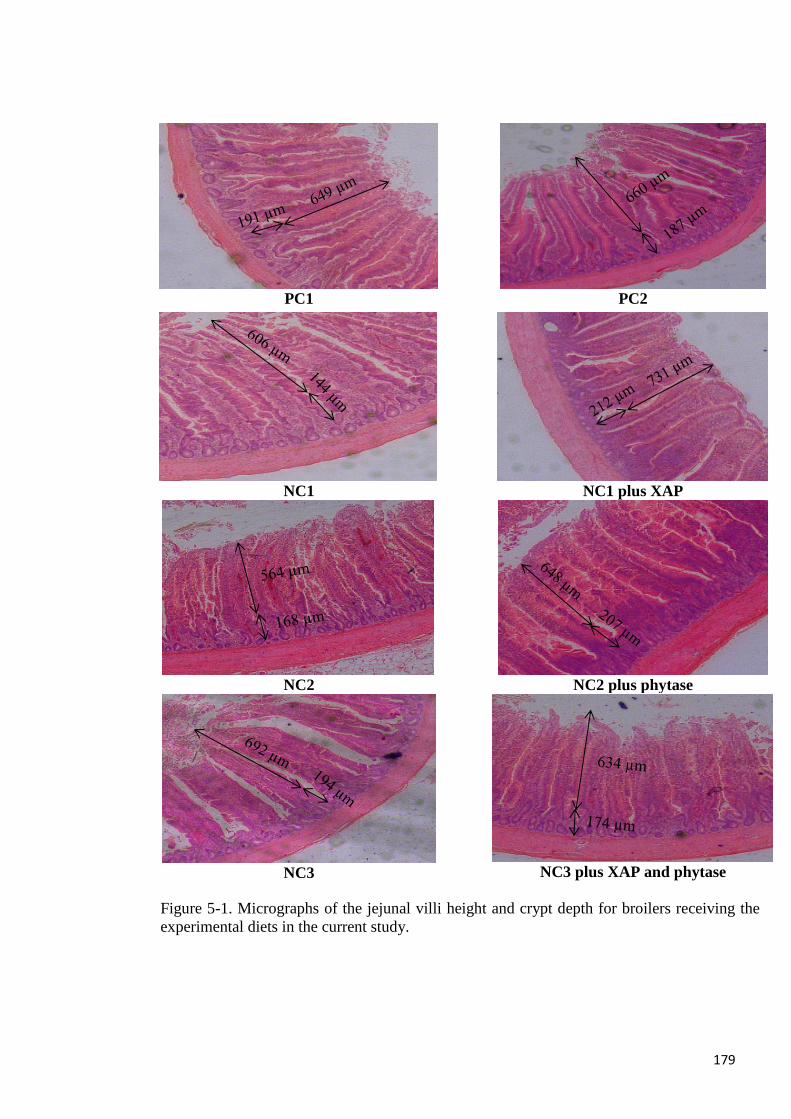
179
PC1
PC2
NC1
NC1 plus XAP
NC2
NC2 plus phytase
NC3
NC3 plus XAP and phytase
Figure 5-1. Micrographs of the jejunal villi height and crypt depth for broilers receiving the
experimental diets in the current study.
180
5.4 DISCUSSION
The objective of the current study was to determine the effect of supplementing a wheat-SBM
based diet containing wheat-DDGS with XAP and phytase individually and in combination on
growth performance and gastrointestinal characteristics of broilers. The diets were formulated
to be marginal in ME and/or available P to enable determination of the effects of XAP and
phytase. In the current study, wheat-DDGS was included in a wheat-SBM based diet at the
rate of 12, 22 or 25% at the starter, grower and finishing periods, respectively to ensure that
the effect of DDGS addition was marked. It is important to use wheat-DDGS with moderation
to avoid compromising growth performance due to increased dietary fibre content.
Thacker and Widyaratne (2007) observed that birds receiving a wheat-SBM based diet
containing up to 15% wheat-DDGS performed similar to birds receiving a wheat-SBM based
diet containing no wheat-DDGS. On the other hand, Richter et al. (2006), Vilarino et al.
(2007) and Lukasiewicz et al. (2009) reported a decrease in the FBW of broilers receiving
wheat-DDGS in their diets compared with those receiving a diet not containing wheat-DDGS.
In studies using maize-DDGS, Shim et al. (2011) noted that broilers receiving a maize-SBM
based diet containing 24% maize-DDGS were heavier compared with birds receiving no
maize-DDGS from d 1 to 18. Similarly, Olukosi et al. (2010) reported greater BWG and G:F
for broilers receiving a diet containing 10% maize-DDGS compared with birds receiving no
maize-DDGS at 21 days of age. In the current study, it was noted that birds receiving the PC
diet containing wheat-DDGS were heavier compared with birds receiving the PC diet without
wheat-DDGS from d 1 to 24, whereas BWG was similar between these treatments from d 25
to 42 and from d 1 to 42.
The PC diet containing wheat-DDGS and the other not containing wheat-DDGS were
formulated using the metabolisable energy and digestible nutrient values of all ingredients and
these diets contained similar levels of ME and nutrients. For this reason, it may be expected
that the growth performance of bird receiving the PC diet containing wheat-DDGS will be
similar to those of birds receiving the PC diet without wheat-DDGS. Taking together the
observation in the current study and those by Olukosi et al. (2010) and Shim et al. (2011), it
appears that birds may derive greater benefits from the inclusion of DDGS in their diets at a
younger age. The reasons why the inclusion of wheat-DDGS in a wheat-SBM based diet
would produce superior growth performance in birds above feeding a wheat-SBM diet are not
clear considering that DDGS inclusion would be expected to increase dietary fibre levels, but
it is speculated that the wheat-DDGS used may have contained some residual starch and
181
sugars which are more readily utilisable for the bird. It is noted that under normal processing
conditions, the fermentation process does not effectively convert all the starch in the maize or
wheat grain into ethanol, and as a result some level of residual starch and sugars are found in
the DDGS (Vilarino et al., 2007).
Wheat and SBM were the main feed ingredients in the experimental diets used in the current
study. Wheat is known to contain substantial quantities of water-soluble carbohydrates
(Bedford and Classen, 1992) which are substrates for carbohydrases. Depending on inclusion
rate, the addition of wheat-DDGS to a wheat-based diet may increase the levels of NSP
(Thacker and Widyaratne, 2007). Non starch polysaccharides increase the viscosity of digesta
in the gastrointestinal tract causing a decrease in nutrient utilisation which has negative
consequences on bird performance (Edward et al., 1988; Carre et al., 2002). The ability of
xylanase to improve nutrient utilisation of wheat-based diets by reducing digesta viscosity and
transformation of the improvement in nutrient utilisation to performance has been reported for
poultry (Adeola and Bedford, 2004). Phytase on the other hand dephosphorylates phytate,
releasing P and other nutrients that may have complexed with phytate in the process (Adeola
and Cowieson, 2011). A reduction in digesta viscosity by XAP may complement phytase
activity by increasing access to phytate molecules encapsulated in NSP. There are extensive
reports in the literature about improvements in the growth performance of broilers using
supplemental XAP or phytase or a combination of both (Cowieson and Adeola, 2005;
Ravindran et al., 2001; Olukosi et al., 2007; Amerah and Ravindran 2009).
Supplementing P-marginal diets with phytase have been reported to improve BWG and G:F
of broilers (Wu et al., 2004; Cowieson and Adeola, 2005) and phytase and an admixture of
XAP may act synergistically to improve growth performance of broilers receiving a maize-
SBM based diet (Cowieson and Adeola, 2005). A cocktail of XAP modestly improved the
overall BWG and feed efficiency of broilers above the NC1 diet in the current study. But in
the case of phytase, there was generally no effect on growth performance. Nitsan et al. (1991)
observed that digestive enzyme production increases with age in broiler chicks, thus nutrient
utilisation may be limiting in the first few days posthatch due to low levels of digestive
enzymes. In the current study, supplemental XAP may have complemented endogenous
amylase and protease activities which may have produced the modest improvement in BWG
from d 1 to 24. The overall modest improvement in BWG and G:F of the broilers from d 1 to
42 is a likely indication that supplemental XAP was able to, among other possible
mechanisms, release more dietary energy by breaking down structural carbohydrates or
supplement endogenous protease.
182
During the fermentation process of bioethanol production, a large proportion of the phytate in
the wheat is hydrolysed by yeast phytase, and as a result, wheat-DDGS may contain low
levels of phytate (Liu, 2011). In Chapter 3 of this thesis, it was noted that apart from
supplemental phytase not improving the digestible P content in wheat-DDGS, the true
digestible P and true retainable P levels in the wheat-DDGS were above 90%. This is a likely
indication that the wheat-DDGS contained low levels of phytate-bound P. Therefore, it
appears that the substitution of wheat and SBM with wheat-DDGS would have reduced the
level of phytate in the diet which may explain the lack of effect of phytase supplementation
on growth performance in the current study.
There was no additivity in the effects of phytase and an admixture of xylanase, amylase and
protease on the growth performance of broilers in the current study. The overall (d 1 to 42)
improvement in BWG and G:F above the NC1 diet were 9.2% and 6.3%, respectively when
XAP was used alone. Phytase alone on the other hand, increased BWG by 4.5% above the
NC2 diet but did not increase G:F. Whereas, a combination of XAP and phytase increased
BWG by 3.4% but did not increase G:F. These results indicate that a combination of XAP and
phytase produced lesser improvement in BWG compared with either of the enzymes
individually. It is possible that the improvement noted in growth performance when XAP was
used alone were not observed when XAP was used in combination with phytase because the
NC3 diet was also marginal in available P more so that phytase did not significantly improve
growth performance in the current study. In other words, the birds may have been limited in
their ability to benefit from the improvement produced by XAP because the diet was limiting
in available P.
The inclusion of moderate levels of fibre in the diet may improve digestive organ
development (Gonzalez-Alvarado et al., 2007) and stimulate digestive enzyme secretion
(Svihus, 2011), as a result, improve nutrient digestibility (Amerah et al., 2009), growth
performance (Gonzalez-Alvarado et al., 2010), gastrointestinal tract health (Perez et al., 2011)
or enhance the proliferation of beneficial bacteria in the gut (Mateos et al., 2012). Wheat-
DDGS contain substantial quantities of soluble fibre which may stimulate the aforementioned
effects. Indeed, Lukasiewicz et al. (2009) noted that the inclusion of wheat-DDGS in the diet
for broilers increased the population of beneficial micro-organisms of the Enterobacteriaceae
family in the caecum. In the current study, inclusion of wheat-DDGS in the PC diet decreased
digesta pH at the caecum but not at the duodenum. The decrease in caecal digesta pH with the
inclusion of wheat-DDGS in the diet could be due to changes in VFA concentrations due to
an increase in caecal fermentation as a result of increased dietary fibre intake.
183
The mechanisms through which XAP or phytase may reduce digesta pH in the small intestine
of broilers are not clear, but it is suggested that xylanase may indirectly decrease digesta pH
in the small intestine of broilers by reducing digesta viscosity and as a result increase digesta
transit time which then reduces the time available for unfavourable micro-organisms to
proliferate. On the other hand, supplemental phytase may accelerate the hydrolysis of phytate
bound P and as a consequence reduce the quantity of P that is available to intestinal
microorganisms. Also, supplemental xylanase may improve gut health by hydrolysis of NSP
thereby aiding the colonisation of the gut with Lactobacilli (Vahjen et al., 1998). Proliferation
of Lactobacilli is often associated with low digesta pH which may inhibit the growth of
coliforms such as E. coli and as a result improve gut health (Pluske et al., 2001). Engberg et
al. (2004) reported that supplemental xylanase reduced digesta pH in the gizzard and caecum
of broilers and stimulated the growth of lactic acid bacteria in the small intestine of broilers
receiving a wheat-based diet at 42 days of age. On the other hand, Rebole et al. (2010) and
Jozefiak et al. (2007) reported that carbohydrase supplementation of a wheat-based diet had
no effect on caecal digesta pH. In the current study, neither XAP nor phytase had an effect on
digesta pH. It is possible that the difference in the effects of exogenous enzymes on digesta
pH noted in the current study and that of Engberg et al. (2004) are due to differences in diet
composition, enzyme type or activities or animals used. Nonetheless, there is need for more
studies to understand more clearly the mechanisms by which exogenous enzymes may
improve gut health of poultry.
There was largely no effect of wheat-DDGS inclusion or XAP or phytase on VFA
concentrations in the current study except that, wheat-DDGS altered the fermentation pattern
by reducing the concentration of n-butyric acid. In addition, the reduction in caecal digesta pH
noted with the inclusion of wheat-DDGS was not complemented by a difference in caecal
VFA concentrations between the birds receiving the diet not containing- or containing wheat-
DDGS. The lack of a substantial effect of wheat-DDGS inclusion on VFA can hardly be
expected as wheat-DDGS would have significantly increased dietary fibre intake. However,
analysis for lactic acid concentration were not done in the current study; therefore, it is
possible that the reduction in digesta pH noted in the caecum of birds receiving wheat-DDGS
in their diet was due to an increase in the production of lactic acid. Wheat-DDGS was
included in the finishing diets at the rate of 25% in the current study. At this inclusion level,
there would have been an increase in the quantity of undigested soluble fibre reaching the
caecum and an inherent increase the proliferation of fibre degrading microbes. It is possible
that the lack of XAP effect on caecal VFA production in the current study was due to the high
levels of highly fermentable fibre in the wheat-DDGS.
184
The jejunum is the major site of nutrient absorption in the small intestine of broilers; therefore
the morphology of the jejunal absorptive surface may inform the efficiency of nutrient
absorption. An increase in the ratio of villi height to crypt depth is an indication of an increase
in jejunal absorptive surface or a reduction in cell turnover which corresponds with less
energy used for gastrointestinal tract maintenance (Rebole et al. 2010). Phytate and NSP may
cause atrophy of the villi or an increase in the size of the gastrointestinal tract (Jaroni et al.
1999) whereas phytase and XAP used individually or in combination may improve the jejunal
absorptive surface by counteracting the antinutritional effects of phytate and NSP. There were
no marked effects of wheat-DDGS or supplemental enzymes on the jejunal morphology of
broilers in the current study. This suggests that the epithelial cells on the villi surface did not
alter their capacity to assimilate nutrients to a change in diet composition or to the addition of
exogenous XAP or phytase. Although supplemental XAP increased crypt depth, this
observation is counter-intuitive because a decrease in crypt depth would have complemented
the improvements in growth performance noted with XAP supplementation. Therefore, the
trend for improvement in BWG and FBW and the improvement in G:F of the birds observed
for supplemented XAP were not related to an improvement in the jejunal villi and crypt
architecture.
The lack of significant effect of XAP or phytase supplementation on jejunal morphology in
the current study may be due to the diets not containing sufficient levels of phytate or NSP to
cause a significant negative effect to the jejunal absorptive structure. Previously, Mathlouthi
et al. (2002) reported improvements in the gut morphology of broilers with xylanase
supplementation of a rye-based diet. Unlike the current study where a wheat-based diet was
used, the rye-based diet used in the Mathlouthi et al. (2002) study contained greater levels of
soluble fibre which would have caused greater antinutritive effects. In other studies that used
a wheat-based diet, the effect of supplemental xylanase or phytase on the gut morphology of
broilers were variable. Yang et al. (2008) observed that supplemental xylanase did not affect
jejunal villi height but reduced crypt depth of broilers receiving a wheat-SBM based diet at
seven days of age whereas Wu et al. (2004) noted an increase in duodenal villi height but no
effect on crypt depth in broilers at 21 days of age using supplemental phytase. Supplemental
xylanase had no effect on gut morphology of broilers receiving a wheat-based diet in the
study of Iji et al. (2001).
It is concluded that the addition of an admixture of XAP to a wheat-SBM based diet
containing wheat-DDGS produced modest improvements in the growth performance of
broilers, but phytase had no effect possibly because the diet contained more soluble fibre and
185
less phytate. The inclusion of wheat-DDGS in a wheat-SBM based diet for broilers has no
negative effect on the jejunal absorptive structure but reduces digesta pH in the caecum.
186
CHAPTER 6
APPARENT- OR STANDARDISED ILEAL AMINO ACID
DIGESTIBILITY RESPONSE TO DIETARY FIBRE TYPE
AND CRUDE PROTEIN LEVEL FOR GROWING PIGS
187
6.1 INTRODUCTION
The nutritive value of wheat distillers dried grains with solubles (wheat-DDGS) for broilers
and turkey were determined in Chapters 3, 4 and 5 of this thesis. In the case of pigs, the
energy value and nutrient digestibility of maize- and wheat-DDGS has been described by
Widyaratne and Ziljistra (2007) and Stein and Shurson (2009). However, the effects on ileal
amino acids digestibility when common dietary protein sources such as soyabean meal (SBM)
or canola meal (CM) are replaced with biofuel co-products such as maize- or wheat-DDGS is
not known and is therefore addressed in the current chapter. Maize-DDGS was used in the
current study because the study was conducted in the USA where maize-DDGS is more
popular. A similar study using wheat-DDGS instead of maize-DDGS will be applicable to the
UK and such studies may need to be conducted in the future. Nevertheless, the effects
observed for maize-DDGS in the current study may be used as a possible indication of
opportunities and limitations of using wheat-DDGS.
Fibre is found in different forms and quantities in feed ingredients. The most important fibre
type is the non-cellulosic polysacharrides consisting of arabinoxylans and β-glucans that exert
their anti-nutritive properties by increasing digesta viscosity. Insoluble dietary fibre such as
lignin may act as a nutrient diluent, increase sloughing of intestinal surface or increase mucin
production (Schneeman et al., 1982). Although, the non starch polysaccharides (NSP) found
in cereals exert greater anti-nutritive effects compared with legumes and oil seeds, the
contributions of NSP by legumes cannot be underestimated because the pig’s diet may
contain up to 50% legumes. The choice of feed ingredients used in non-ruminant animal diet
is often driven by availability and cost. In cases where novel feed ingredients are being
considered, the greater emphasis is also often placed on the protein and energy values of these
ingredients and less on the impact that their associated fibre composition may have on
nutrient digestibility. In the current study, SBM, CM and maize-DDGS were selected to
determine the effect of protein-source-associated dietary fibre on ileal AA digestibility
because these feed ingredients are currently the most popular protein sources used in the pigs
diet and more importantly because their fibre characteristics are different.
Solvent extracted SBM may contain up to 48% crude protein (CP) and it is the most popular
feed ingredient used as a source of protein in pig’s diet. The average total dietary fibre content
in SBM is 16.7% whereas the neutral detergent fibre (NDF), acid detergent fibre (ADF) and
acid detergent lignin (ADL) contents are 8.2, 5.3 and 1.1%, respectively (NRC, 2012). It is
very common to use CM in variable quantities as substitute to SBM in pig’s diet. Canola meal
188
may contain up to 35% CP, but the average total dietary fibre (25.8%), NDF (23.8%), ADF
(17.6%) and ADL (7.3%) contents in CM are greater than are present in SBM (NRC, 2012).
Maize-DDGS is the co-product of bioethanol produced from maize grain and may contain up
to 27% CP (Chapter 2). The use of maize-DDGS in pig diet is becoming more popular due to
its increased availability and lower cost compared with SBM. The average total dietary fibre,
NDF and ADF contents in maize-DDGS are 31.4, 32.5 and 11.8%, respectively (NRC, 2012)
and these values are two to ten times greater than are present in SBM. Comparing the
chemical composition of the three protein sources selected in the current study, it is obvious
that SBM contain lower levels of both the soluble and insoluble fibre types, maize-DDGS
contain greater levels of soluble fibre whereas CM contain greater levels of insoluble fibre
compared with either SBM or maize-DDGS.
Excessive N excretion by pigs may be mitigated by reducing the protein content of the diet. A
2 to 4% reduction in dietary CP content reduced N excretion by 20% for finishing pigs (Lee et
al., 2001). On the other hand, it also appears that pigs are able to compensate for the reduction
in CP intake by increasing the efficiency of nutrient utilisation. Otto et al. (2003) reported an
increase in ileal AA digestibility for growing pigs by decreasing the CP content in a practical
maize-SBM diet from 15 to 6%. Reducing dietary CP is often done by wholly replacing or
partially substituting SBM with feed ingredients that contain lower CP content. In most cases,
the fibre content in such feed ingredients is greater and the types of the fibre they contain are
also different. Therefore, the objective of the current study was to determine the effect of
dietary fibre type and protein level on the apparent- or standardised ileal AA digestibility
(AIAAD or SIAAD) for growing pigs. Interactions between dietary fibre type and CP level to
affect AIAAD or SIAAD for growing pigs was also investigated.
6.2 MATERIALS AND METHODS
6.2.1 Animals and Management
All animal handling procedures were approved by the Purdue University Animal Care and
Use Committee and the Animal Experimentation Committee of the Scotland’s Rural College.
Twenty male pigs were obtained from the Animal Sciences Research and Education Centre of
Purdue University each weighing approximately 25 kg. Pigs were fasted for 12 hours prior to
the surgical procedure of fitting a T-cannula to the distal end of the ileum. The T-cannulas had
an internal diameter of 1.3 cm, the wings were 2.5 cm wide and were 5 cm in length. The
cannulation procedure was done under general anaesthesia. Comprehensive description of the
189
surgical procedure and post-operative care was as described by Dilger et al. (2004). All the
pigs were conscious within a short time after the surgery and were allowed a 14 d recovery
period.
6.2.2 Experimental Design, Dietary Treatments and Sample Collection
Twenty boars (Yorkshire × Landrace) with average initial bodyweight of 35 kg were used in
the current study. The dietary treatments were three fibre types (SBM, CM or maize-DDGS)
and two levels of protein (18 or 14%, respectively). In each period, two pigs having the
bodyweights closest to the mean bodyweight of the twenty pigs were offered a nitrogen free
diet to determine basal endogenous ileal amino acid flow. The remaining eighteen pigs were
allocated to the experimental diets using a replicated 6 × 2 Youden square design. Chromic
oxide was added to the diets at the rate of 5 g/kg to enable determination of AA digestibility
by the index method. Daily feed allowance was divided into two equal portions and offered in
the morning and evening (08:00 and 20:00, respectively). Pigs were given ad libitum access to
water throughout the study. Each experimental period lasted for seven days consisting of five
days of adaptation to the diets and two days of ileal digesta collection. Ileal digesta was
collected for 12 hours on both days (d 6 and 7). Ileal digesta were collected in whirlpak®
bags containing 10 ml of 10% formic acid and stored frozen (-20oC) prior to further analyses.
The pigs were housed individually in smooth-walled pens within a facility equipped with
temperature, light, and humidity control during the study.
6.2.3 Chemical Analysis
Samples of the diets and ileal digesta were analysed for dry matter (DM), N, amino acids
(AA) and chromium. Ileal digesta samples for AA analysis were freeze dried. Diet and ileal
digesta samples were ground to pass through a 0.5 mm screen using a mill grinder (Retsch
ZM 100, F. Kurt Retsch GmbH & Co.KG, Haan, Germany) before chemical analysis. Dry
matter content in the diets and ileal digesta was determined by drying samples at 100oC for 24
hours. Nitrogen was determined by combustion method (AOAC International 2006, method
968.06). For AA analyses, samples were hydrolysed for 24 hours in 6N hydrochloric acid at
110oC under an atmosphere of N. For Met and Cys, performic acid oxidation was carried out
before acid hydrolysis. The AA in the hydrolysate were determined by HPLC after post-
column derivatisation [(AOAC International 2000, method 982.30E (a, b, c)]. Chromium was
determined using the inductively coupled plasma atomic emission spectroscopy method
190
following nitric/perchloric acids wet ash digestion (AOAC International 2000, method
990.08).
6.2.4 Calculations
Basal ileal AA flow was calculated using the following equation:
1. (
)
where EAAF is endogenous ileal AA flow (mg/kg of DM intake); AAo is the concentration of
AA in ileal digesta; Cri is the concentration of chromium in diet (mg/kg); Cro is the
concentration of the chromium in ileal digesta (mg/kg).
Apparent ileal AA digestibility (AIAAD) was calculated using the following equation:
2. [ (
) (
)]
where AIAAD is apparent ileal amino acid digestibility (%); Cri is the concentration of
chromium in diet (mg/kg); Cro is the concentration of the chromium in digesta (mg/kg); AAo
is the concentration of nutrient in the digesta (g/kg of DM) and AAi is the concentration of
nutrient in the diet (g/kg of DM).
Standardised ileal AA digestibility (SIAAD) was calculated using the following equation:
3. [(
) ]
where SIAAD is standardised ileal AA digestibility (%); AIAAD is apparent ileal AA
digestibility (%); EAAF is the endogenous basal ileal AA flow (g/kg of DM intake) and AAi
is the AA concentration in the diet (g/kg of DM).
6.2.5 Statistical Analysis
Data was analysed using the Generalised Linear Models of Genstat 11 program as a 6 × 2
Youden square design and least squares means were separated using the Tukey test with P <
0.05 indicating statistical significance. Interactions between dietary fibre type and crude
protein level on AIAAD and SIAAD were also tested.
191
6.3 RESULTS
The ingredient and chemical compositions of the experimental diets used in the current study
are presented in Table 6-1. The diets were isocaloric and isonitrogenous for the treatments
containing adequate or reduced CP levels. Regardless of CP level, crude fibre, NDF, ADF and
ADL were lowest in the SBM diet. On the other hand, the CM diet contained the greatest
levels of ADF and ADL whereas NDF was greatest in the maize-DDGS diet.
Dry matter utilisation and the apparent ileal digestibility (AID) of N and indispensable AA for
growing pigs receiving diets that differed in fibre composition and crude protein level are
presented in Table 6-2. Corresponding AID for dispensable AA and total amino acids (TAA)
are presented in Table 6-3. With the exception of Met, Trp, Cys and Pro, AIAAD generally
decreased (P < 0.05) in the order SBM>maize-DDGS>CM diet in the current study. Ileal DM
utilisation was greater (P < 0.05) in the SBM diet compared with either the CM diet or the
maize-DDGS diet. With the exception of Met, Trp, Cys and Pro, AIAAD were greater (P <
0.05) for the SBM diet compared with the CM diet. Ileal DM utilisation and AID of Gly and
Asp were greater (P < 0.05) for the SBM diet compared with the maize-DDGS diet. The AID
of the following AA was greater in the maize-DDGS diet compared with the CM diet: Ile,
Leu, Phe, Val, Ala, Tyr and Asp. The AID of TAA was greater (P < 0.01) for the SBM diet
compared with the CM diet, but did not differ significantly from that of the maize-DDGS diet.
There was fibre type × protein level interaction (P < 0.05) for the AID of Lys. This was
because the AID of Lys was different (P < 0.05) amongst the CP-adequate dietary treatments,
whereas the AID of Lys was not different amongst the dietary treatments marginal in CP.
The standardised ileal digestibility (SID) of N and indispensable AA for growing pigs
receiving diets that differed in fibre composition and CP level are presented in Table 6-4.
Corresponding SID for dispensable AA and TAA are presented in Table 6-5. With the
exception of Trp and Pro, SIAAD was different amongst the dietary fibre sources with
SIAAD generally greater in the SBM diet, intermediate in the maize-DDGS diet and lowest in
the CM diet. Standardised ileal amino acid digestibility for the SBM diet were greater (P <
0.05) than those of the CM diet except for Trp and Pro, whereas Gly and Asp were more
digestible (P < 0.05) in the SBM diet compared with the maize-DDGS diet. The SID of the
following AA was greater for the maize-DDGS diet compared with the CM diet: Ile, Leu,
Val, Ala, Tyr and Asp. The SID of TAA was greater (P < 0.05) for the SBM diet compared
with the CM diet. On the other hand, SID of TAA was not different between the SBM and
192
maize-DDGS diet. Reducing the dietary protein level from 18 to 14 % did not affect ileal DM
utilisation, AIAAD or SIAAD in the current study.
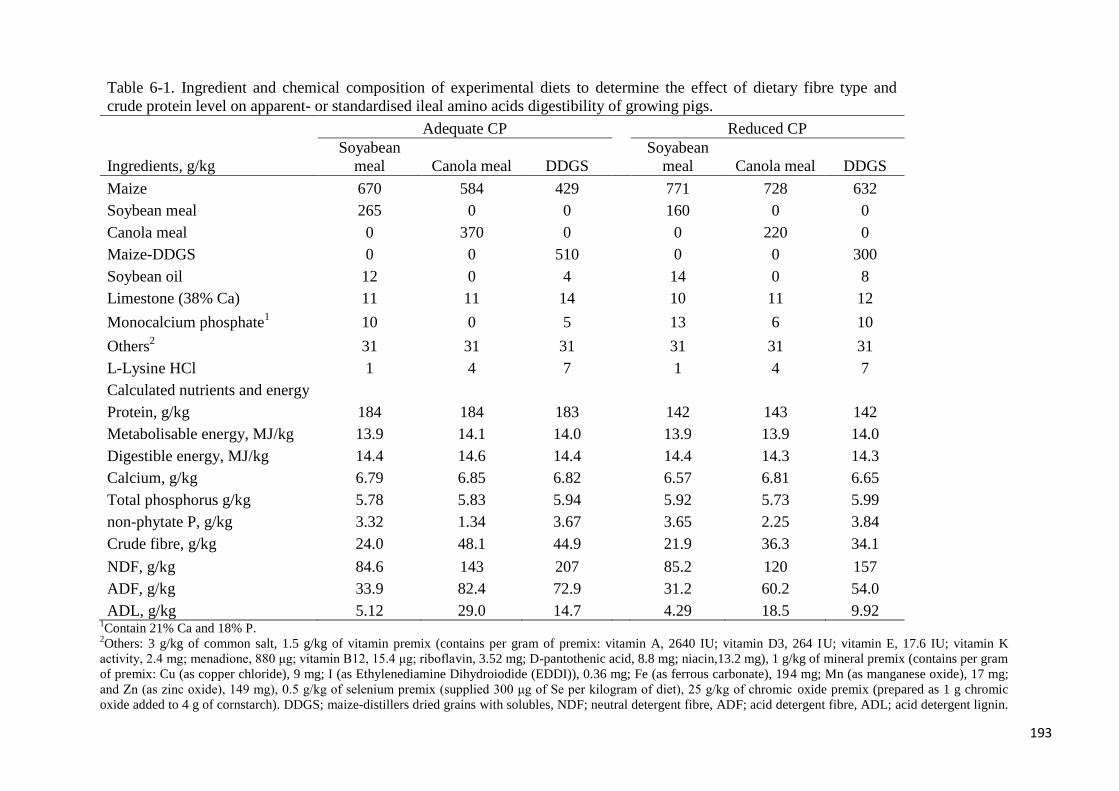
193
Table 6-1. Ingredient and chemical composition of experimental diets to determine the effect of dietary fibre type and
crude protein level on apparent- or standardised ileal amino acids digestibility of growing pigs.
Adequate CP
Reduced CP
Ingredients, g/kg
Soyabean
meal Canola meal DDGS
Soyabean
meal Canola meal DDGS
Maize 670 584 429
771 728 632
Soybean meal 265 0 0
160 0 0
Canola meal 0 370 0
0 220 0
Maize-DDGS 0 0 510
0 0 300
Soybean oil 12 0 4
14 0 8
Limestone (38% Ca) 11 11 14
10 11 12
Monocalcium phosphate1 10 0 5
13 6 10
Others2 31 31 31
31 31 31
L-Lysine HCl 1 4 7
1 4 7
Calculated nutrients and energy
Protein, g/kg 184 184 183
142 143 142
Metabolisable energy, MJ/kg 13.9 14.1 14.0
13.9 13.9 14.0
Digestible energy, MJ/kg 14.4 14.6 14.4
14.4 14.3 14.3
Calcium, g/kg 6.79 6.85 6.82
6.57 6.81 6.65
Total phosphorus g/kg 5.78 5.83 5.94
5.92 5.73 5.99
non-phytate P, g/kg 3.32 1.34 3.67
3.65 2.25 3.84
Crude fibre, g/kg 24.0 48.1 44.9
21.9 36.3 34.1
NDF, g/kg 84.6 143 207
85.2 120 157
ADF, g/kg 33.9 82.4 72.9
31.2 60.2 54.0
ADL, g/kg 5.12 29.0 14.7 4.29 18.5 9.92 1Contain 21% Ca and 18% P.
2Others: 3 g/kg of common salt, 1.5 g/kg of vitamin premix (contains per gram of premix: vitamin A, 2640 IU; vitamin D3, 264 IU; vitamin E, 17.6 IU; vitamin K
activity, 2.4 mg; menadione, 880 μg; vitamin B12, 15.4 μg; riboflavin, 3.52 mg; D-pantothenic acid, 8.8 mg; niacin,13.2 mg), 1 g/kg of mineral premix (contains per gram
of premix: Cu (as copper chloride), 9 mg; I (as Ethylenediamine Dihydroiodide (EDDI)), 0.36 mg; Fe (as ferrous carbonate), 194 mg; Mn (as manganese oxide), 17 mg;
and Zn (as zinc oxide), 149 mg), 0.5 g/kg of selenium premix (supplied 300 μg of Se per kilogram of diet), 25 g/kg of chromic oxide premix (prepared as 1 g chromic
oxide added to 4 g of cornstarch). DDGS; maize-distillers dried grains with solubles, NDF; neutral detergent fibre, ADF; acid detergent fibre, ADL; acid detergent lignin.
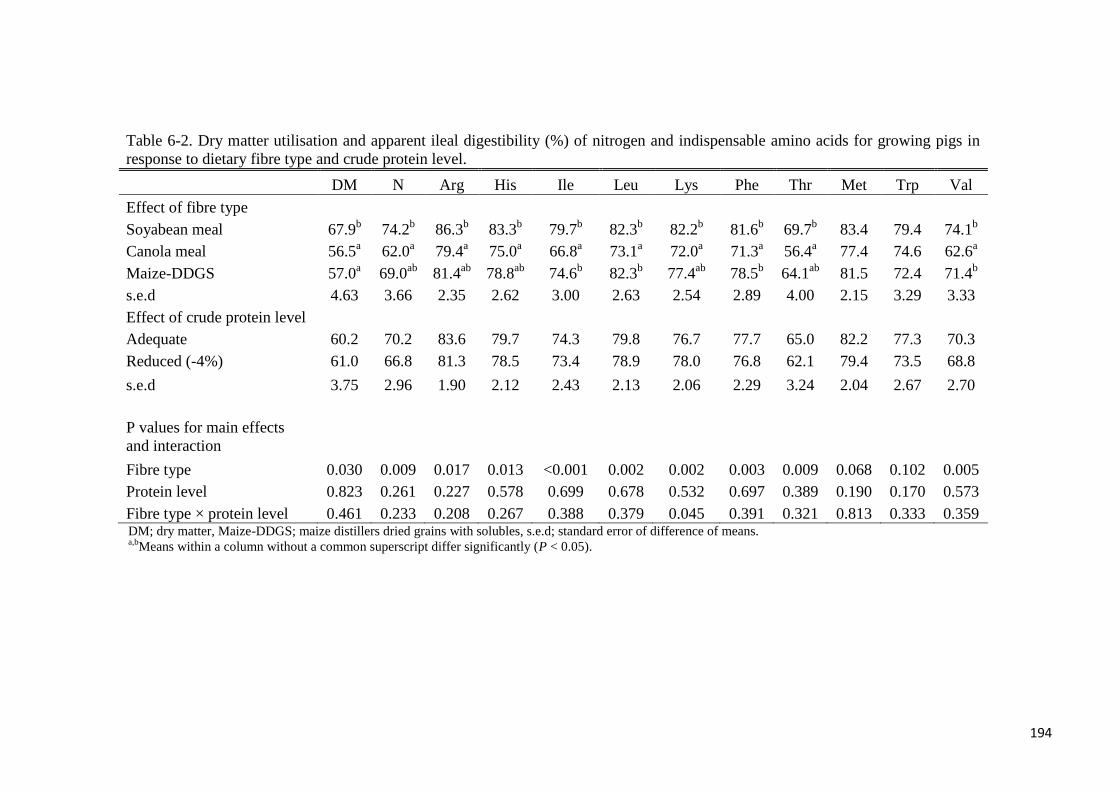
194
Table 6-2. Dry matter utilisation and apparent ileal digestibility (%) of nitrogen and indispensable amino acids for growing pigs in
response to dietary fibre type and crude protein level.
DM N Arg His Ile Leu Lys Phe Thr Met Trp Val
Effect of fibre type
Soyabean meal 67.9b 74.2
b 86.3
b 83.3
b 79.7
b 82.3
b 82.2
b 81.6
b 69.7
b 83.4 79.4 74.1
b
Canola meal 56.5a 62.0
a 79.4
a 75.0
a 66.8
a 73.1
a 72.0
a 71.3
a 56.4
a 77.4 74.6 62.6
a
Maize-DDGS 57.0a 69.0
ab 81.4
ab 78.8
ab 74.6
b 82.3
b 77.4
ab 78.5
b 64.1
ab 81.5 72.4 71.4
b
s.e.d 4.63 3.66 2.35 2.62 3.00 2.63 2.54 2.89 4.00 2.15 3.29 3.33
Effect of crude protein level
Adequate 60.2 70.2 83.6 79.7 74.3 79.8 76.7 77.7 65.0 82.2 77.3 70.3
Reduced (-4%) 61.0 66.8 81.3 78.5 73.4 78.9 78.0 76.8 62.1 79.4 73.5 68.8
s.e.d 3.75 2.96 1.90 2.12 2.43 2.13 2.06 2.29 3.24 2.04 2.67 2.70
P values for main effects
and interaction
Fibre type 0.030 0.009 0.017 0.013 <0.001 0.002 0.002 0.003 0.009 0.068 0.102 0.005
Protein level 0.823 0.261 0.227 0.578 0.699 0.678 0.532 0.697 0.389 0.190 0.170 0.573
Fibre type × protein level 0.461 0.233 0.208 0.267 0.388 0.379 0.045 0.391 0.321 0.813 0.333 0.359 DM; dry matter, Maize-DDGS; maize distillers dried grains with solubles, s.e.d; standard error of difference of means. a,b
Means within a column without a common superscript differ significantly (P < 0.05).
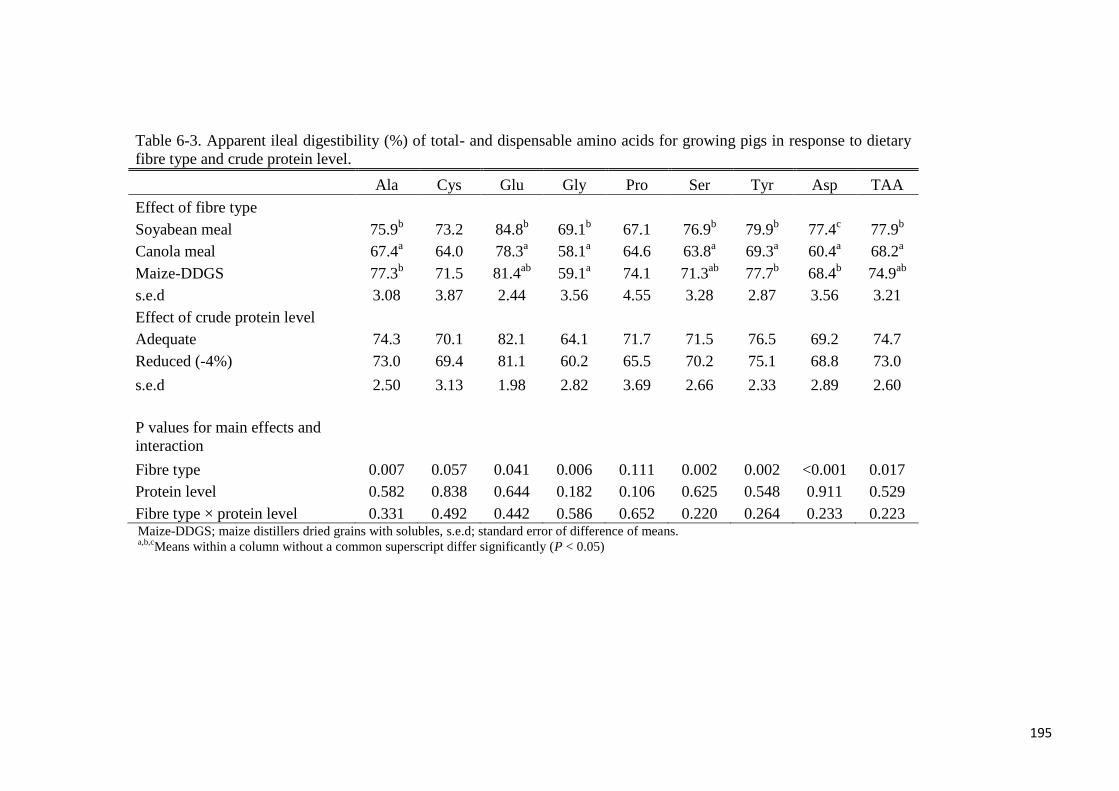
195
Table 6-3. Apparent ileal digestibility (%) of total- and dispensable amino acids for growing pigs in response to dietary
fibre type and crude protein level.
Ala Cys Glu Gly Pro Ser Tyr Asp TAA
Effect of fibre type
Soyabean meal 75.9b 73.2 84.8
b 69.1
b 67.1 76.9
b 79.9
b 77.4
c 77.9
b
Canola meal 67.4a 64.0 78.3
a 58.1
a 64.6 63.8
a 69.3
a 60.4
a 68.2
a
Maize-DDGS 77.3b 71.5 81.4
ab 59.1
a 74.1 71.3
ab 77.7
b 68.4
b 74.9
ab
s.e.d 3.08 3.87 2.44 3.56 4.55 3.28 2.87 3.56 3.21
Effect of crude protein level
Adequate 74.3 70.1 82.1 64.1 71.7 71.5 76.5 69.2 74.7
Reduced (-4%) 73.0 69.4 81.1 60.2 65.5 70.2 75.1 68.8 73.0
s.e.d 2.50 3.13 1.98 2.82 3.69 2.66 2.33 2.89 2.60
P values for main effects and
interaction
Fibre type 0.007 0.057 0.041 0.006 0.111 0.002 0.002 <0.001 0.017
Protein level 0.582 0.838 0.644 0.182 0.106 0.625 0.548 0.911 0.529
Fibre type × protein level 0.331 0.492 0.442 0.586 0.652 0.220 0.264 0.233 0.223 Maize-DDGS; maize distillers dried grains with solubles, s.e.d; standard error of difference of means. a,b,c
Means within a column without a common superscript differ significantly (P < 0.05)
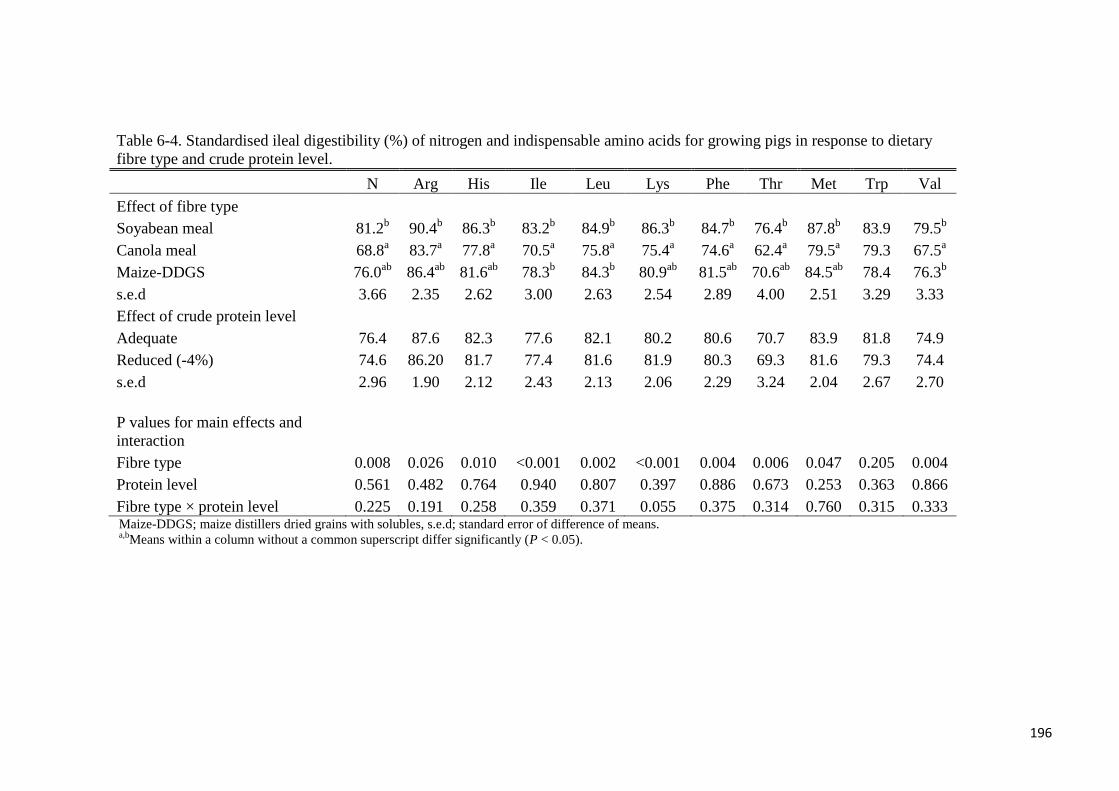
196
Table 6-4. Standardised ileal digestibility (%) of nitrogen and indispensable amino acids for growing pigs in response to dietary
fibre type and crude protein level.
N Arg His Ile Leu Lys Phe Thr Met Trp Val
Effect of fibre type
Soyabean meal 81.2b 90.4
b 86.3
b 83.2
b 84.9
b 86.3
b 84.7
b 76.4
b 87.8
b 83.9 79.5
b
Canola meal 68.8a 83.7
a 77.8
a 70.5
a 75.8
a 75.4
a 74.6
a 62.4
a 79.5
a 79.3 67.5
a
Maize-DDGS 76.0ab
86.4ab
81.6ab
78.3b 84.3
b 80.9
ab 81.5
ab 70.6
ab 84.5
ab 78.4 76.3
b
s.e.d 3.66 2.35 2.62 3.00 2.63 2.54 2.89 4.00 2.51 3.29 3.33
Effect of crude protein level
Adequate 76.4 87.6 82.3 77.6 82.1 80.2 80.6 70.7 83.9 81.8 74.9
Reduced (-4%) 74.6 86.20 81.7 77.4 81.6 81.9 80.3 69.3 81.6 79.3 74.4
s.e.d 2.96 1.90 2.12 2.43 2.13 2.06 2.29 3.24 2.04 2.67 2.70
P values for main effects and
interaction
Fibre type 0.008 0.026 0.010 <0.001 0.002 <0.001 0.004 0.006 0.047 0.205 0.004
Protein level 0.561 0.482 0.764 0.940 0.807 0.397 0.886 0.673 0.253 0.363 0.866
Fibre type × protein level 0.225 0.191 0.258 0.359 0.371 0.055 0.375 0.314 0.760 0.315 0.333 Maize-DDGS; maize distillers dried grains with solubles, s.e.d; standard error of difference of means. a,b
Means within a column without a common superscript differ significantly (P < 0.05).
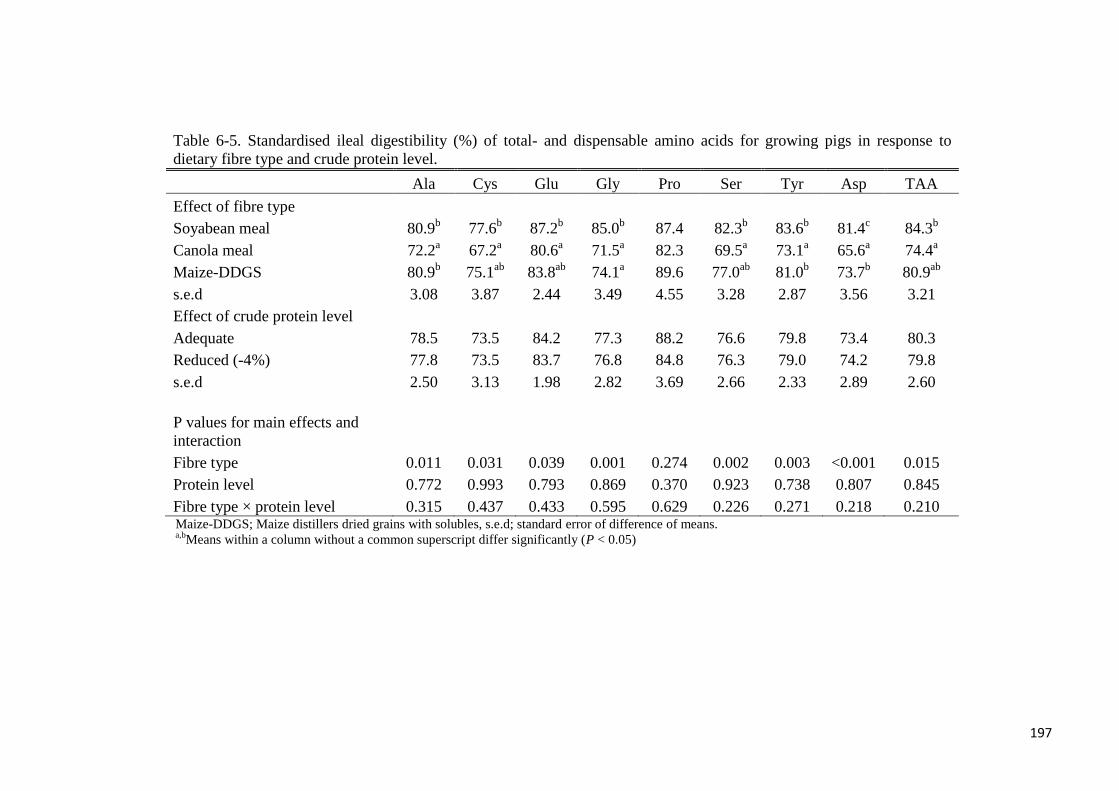
197
Table 6-5. Standardised ileal digestibility (%) of total- and dispensable amino acids for growing pigs in response to
dietary fibre type and crude protein level.
Ala Cys Glu Gly Pro Ser Tyr Asp TAA
Effect of fibre type
Soyabean meal 80.9b 77.6
b 87.2
b 85.0
b 87.4 82.3
b 83.6
b 81.4
c 84.3
b
Canola meal 72.2a 67.2
a 80.6
a 71.5
a 82.3 69.5
a 73.1
a 65.6
a 74.4
a
Maize-DDGS 80.9b 75.1
ab 83.8
ab 74.1
a 89.6 77.0
ab 81.0
b 73.7
b 80.9
ab
s.e.d 3.08 3.87 2.44 3.49 4.55 3.28 2.87 3.56 3.21
Effect of crude protein level
Adequate 78.5 73.5 84.2 77.3 88.2 76.6 79.8 73.4 80.3
Reduced (-4%) 77.8 73.5 83.7 76.8 84.8 76.3 79.0 74.2 79.8
s.e.d 2.50 3.13 1.98 2.82 3.69 2.66 2.33 2.89 2.60
P values for main effects and
interaction
Fibre type 0.011 0.031 0.039 0.001 0.274 0.002 0.003 <0.001 0.015
Protein level 0.772 0.993 0.793 0.869 0.370 0.923 0.738 0.807 0.845
Fibre type × protein level 0.315 0.437 0.433 0.595 0.629 0.226 0.271 0.218 0.210 Maize-DDGS; Maize distillers dried grains with solubles, s.e.d; standard error of difference of means. a,b
Means within a column without a common superscript differ significantly (P < 0.05)
198
6.4 DISCUSSION
The objective of the current study was to determine the effect of dietary fibre type and CP
level on ileal AA digestibility in growing pigs.
Dietary fibre consists of the structural (cellulose, hemicellulose, and pectin) and non-
structural (gums and mucilages) polysaccharides and lignin. These fibre types may also be
categorised based on their solubility in water into either soluble (hemicellulose) or insoluble
(cellulose and lignin). Cellulose, hemicellulose, pectin and lignin are the main dietary fibre
types in feed ingredients used in swine diet and the physical and chemical characteristics of
these fibres are different. For this reason, the digestibility of dietary fibre as well as the effects
of the different fibre types on the digestibility of other dietary components often varies.
Soyabean meal, CM and maize-DDGS were selected to determine the effect of dietary fibre
type on ileal AA digestibility in the current study because these feed ingredients are the most
commonly used as protein sources in pigs diet and more importantly, their fibre
characteristics are different.
Neutral detergent fibre consists of cellulose, hemicellulose and lignin. The hemicellulose
fraction in NDF are highly water soluble and when ingested they may cause an increase in
digesta viscosity in the gastrointestinal tract, reduce the rate of digesta transit or cause a
reduction in nutrient absorption by encapsulation of nutrients and digestive enzymes in a gel
matrix. Excessive levels of dietary soluble fibre may compromise protein and AA digestibility
in the gastrointestinal tract by increasing digesta viscosity which may lead to a reduction in
the mixing of digesta, a reduction in contact between proteases and dietary protein or a
reduction in contact between the absorptive surface and digesta (Choct et al., 2004). Acid
detergent fibre consists mainly of cellulose and lignin whereas ADL consist almost entirely of
lignin. Both ADF and ADL are insoluble in water and poorly digested by non-ruminant
animals. Dietary ADF and ADL may increase digesta transit in the gastrointestinal tract or
form insoluble bonds with dietary nutrients and in the process making them unavailable for
absorption or decrease DM utilisation (Wilfart et al., 2007).
It is common to use purified cellulose, pectin, straws, hulls or sugar beet pulp to modify the
fibre composition of the diet when determining the effect of fibre on nutrient digestibility
(Zervas and Zijlstra, 2002; Zhang et al., 2013). However it is often the case that there is a
disproportionate increase in the concentration of a type of fibre (soluble or insoluble) which is
not characteristic of changes that occur when conventional feed ingredients are being used.
199
Also, because supplemental fibre sources such as purified cellulose are not chemically
integrated with the feed ingredients in the diet, it is less likely that purified cellulose will
impair access of digestive enzymes to dietary nutrients compared with what may be expected
from dietary fibre that are chemically bound to other nutrients in feed ingredients.
Calculated hemicellulose content (NDF minus ADF) was 5.1, 6.1 and 13.4% in the CP-
adequate SBM, CM and maize-DDGS diets, respectively in the current study. Corresponding
values in the reduced-CP diets were 5.4, 6.0 and 10.3, respectively. On the other hand, ADF
contents in the SBM, CM and maize-DDGS diets were 3.4, 8.2, and 7.3% in the CP-adequate
diets or 3.1, 6.0 and 5.4% in the reduced-CP diets, respectively. These observations indicate
that the soluble fibre content in a diet formulated using maize-DDGS as protein source is
approximately two-three times greater compared with using SBM and there was
approximately a 100% increase in the level of insoluble fibre when CM or maize-DDGS are
used as protein sources compared with using SBM. The differences in the soluble and
insoluble fibre contents in the experimental diets used in the current study indicate that the
choice of protein source/s used in the pig diet influences its fibre characteristics which in turn,
may affect AA digestibility.
Because the SBM diet contained the lowest levels of both the soluble and insoluble fibre
types in the current study, it may be expected that the AIAAD and SIAAD will be greater
compared with either the maize-DDGS or CM diets. It was noted that about half of the AA in
the maize-DDGS were more digestible compared with the CM diet whereas, AIAAD and
SIAAD were generally similar between the maize-DDGS diet and the SBM diet. The
insoluble fibre content (ADL) was six times greater in the CM diet compared with the SBM
diet or two times greater compared with the maize-DDGS diet. Ileal DM utilisation was
greater in the SBM diet compared with either the maize-DDGS or CM diet. The lower ileal
DM utilisation observed for the diets containing greater levels of dietary fibre (CM and
maize-DDGS) in the current study is consistent with reports that increased fibre levels reduces
ileal DM utilisation in pigs (Lenis et al., 1996; Zhang et al., 2013).
As earlier mentioned, NSP may reduce AA digestibility by formation of a gel causing an
increase in digesta viscosity or a reduction in nutrient absorption by encapsulation of AA and
digestive enzymes within the gel medium (Choct et al., 2004). Increased levels of dietary
soluble fibre levels have been reported to reduce palatability and voluntary feed intake (Zhang
et al., 2013), increase endogenous N and AA flow (Lenis et al., 1996), decrease energy
utilisation (Sauer et al., 1991) and protein and AA digestibility (Dierick et al., 1983;
200
Mosenthin et al., 1994; Zervas and Zijlstra, 2002) for growing pigs. Because the calculated
hemicellulose levels in the SBM and CM diet were similar in the current study, then it is more
likely that the inferior AIAAD or SIAAD observed in the CM diet compared with the SBM
diet was due to the anti-nutritive properties associated with the greater levels of insoluble
fibre in the CM diet. On the other hand, it is surprising that there were minimal differences
between the AIAAD and SIAAD of the SBM and maize-DDGS diets considering that the
latter contained greater levels of soluble fibre.
In the review by Stein and Shurson (2009), it was noted that the inclusion of maize-DDGS in
pig’s diet may not necessarily compromise energy utilisation and nutrient digestibility in spite
of its high fibre content. This may be due to the fact that during bioethanol production, it is
common to treat the maize grain with fibre degrading enzymes to break down structural
carbohydrates into simple sugars in order to increase ethanol yield. Polizeli et al. (2005) noted
that because the structure of hemicelluloses is heterogeneous, a complete hydrolysis of
hemicellulose is hardly achievable and may require a multi-enzyme complex containing a
broad variety of enzyme activities. The molecular structure of a xylan for example, in terms of
the chain length and the degree of branching, may affect the efficacy of a hemicellulase
complex that may lead to the production of intermediate products such as β-D-xylopyranosyl
oligomers (Polizeli et al., 2005). It is therefore speculated that although the soluble fibre
levels in the maize-DDGS diet was greater compared with that of the SBM diet in the current
study, a significant proportion of the fibre in the maize-DDGS diet may have been present as
oligosaccharides that are less able to cause the anti-nutritive effects characteristic of
arabinoxylans or β-glucans.
Feed ingredients used in pig’s diet are heat treated for a number of reasons, two of which are
1) to reduce the moisture content which improves the palatability and shelf life of the feed
ingredient, 2) to reduce the concentration of anti-nutrients such as glucosinolates and protease
inhibitors in the feed ingredient. Excessive heat treatment causes a Malliard reaction that
reduces the digestibility of AA in feed ingredients. There was no information about the level
of heat treatment for the three protein sources used in the current study, however, because the
AID and SID of Lys and Cys (the most susceptible AA to heat damage) were not comparably
low in the dietary treatments in the current study, it is may be plausible to rule out the
differences in AIAAD or SIAAD to the effects of heat treatment.
The majority of cereal grains and oil seeds used in non-ruminant diets contain phytate at
levels that range between 1 to 5% (Cheryan, 1980). Phytate is poorly utilised by non-
201
ruminants and as a result, nutrients bound to phytate are not available to the animal (Selle et
al. 2000). Phytate may negatively affect the digestibility of AA by forming complexes with
AA, therefore making them unavailable for utilisation or it may increase mucin production
potentially increasing endogenous AA losses or compromise the intestinal absorption of AA
by binding de novo to AA (Selle and Ravindran, 2008). Selle et al. (2000) observed that
phytate may bind to the α-NH2 groups and side groups of basic AA (Arg, His, and Lys) and
as a result, may reduce the digestibility of these AA. The AID and SID of Arg, His and Lys
were amongst those that were significantly greater in the SBM and maize-DDGS diets
compared with the CM diet in the current study. This may suggest that the CM diet contained
greater levels of phytate compared with the SBM or maize-DDGS diets, which may be
responsible in part, for the lower AA digestibility noted for the CM diet. It could be expected
that the maize-DDGS diet would contain low levels of phytate because the fermentation
process involved in the production of maize-DDGS hydrolyses a large proportion of the
phytate in the maize grain by the actions of yeast phytase (Liu, 2011). However, there is an
understanding that processes such as heat and enzyme treatment may also affect the phytate
content in the SBM, CM and maize-DDGS and that these feed ingredients were incorporated
in a mixed diet containing maize in the current study.
The nutritional gain from AA degraded in the large intestine of pigs is not significant (Sauer
et al., 1991), for this reason; ileal measurements are more accurate to define the AA
digestibility of a diet. Because excessive loss of N in pig manure is detrimental to the
environment, interventions that do not affect ileal AA digestibility but may reduce undigested
protein flow to the large intestine with a view to reduce protein excretion are of particular
interest. In the current study, reducing the CP level of the diet by 4 percent did not affect ileal
AA digestibility. Therefore, it can be inferred that pigs are able to utilize AA to the same
efficiency even though the diet was marginal in CP. Otto et al. (2003) on the other hand,
reported an increase in ileal AA digestibility in growing pigs receiving a maize-SBM diet
containing 6% CP. The difference between the observation in the current study and that of
Otto et al. (2003) may be due to the fact that in the latter there was a much greater reduction
in dietary CP level which may have triggered a greater response from the pigs in the order to
meet nutrient requirement.
Except for the AID of Lys, there was no interaction between dietary fibre type and CP level to
affect ileal AA digestibility in the current study. The interaction observed for the AID of Lys
was due to a reduction in the AID of Lys from 85% in the CP-adequate SBM diet to 79% in
the reduced-CP SBM diet. Notably, reducing the CP level in the SBM diet by 4% reduced the
202
Lys content from 1.03 to 0.75% but caused minimal changes to dietary fibre levels in the
current study. It is possible therefore that the increase in dietary fibre content relative to Lys
composition in the reduced-CP SBM diet was responsible for the reduction in the AID of Lys.
However, in the study of Htoo et al. (2007), a reduction in dietary CP from 24 to 20%
decreased the AID of most AA except Lys, Met, Thr, Val and Pro. The difference between the
results noted in the current study and that of Htoo et al. (2007) may be due to differences in
diet composition and dietary CP levels used. Changes in the small intestinal absorptive
structure of pigs to receiving diets marginal in dietary protein may help to understand how
pigs respond to a reduction in dietary CP levels.
It was concluded that the level and type of fibre in protein feed ingredients affects AA
digestibility for growing pigs. The use of either SBM or maize-DDGS as protein source in the
growing pig diet produced similar ileal AA digestibility but CM was inferior to both SBM
and maize-DDGS. In addition, reducing dietary protein level from 18 to 14% does not affect
ileal AA digestibility for growing pigs.
203
CHAPTER 7
GENERAL DISCUSSION, CONCLUSIONS AND
RECOMMENDATIONS
204
7.1 GENERAL DISCUSSION
A review of the literature indicates that the chemical compositions of bioethanol co-products
such as maize- and wheat-DDGS vary among sources. Chapter 2 of this thesis evaluated the
possibility to use mathematical models to predict the amino acid (AA) composition of maize-
and wheat-DDGS from their chemical compositions. Chapter 3, 4 and 5 in this thesis
described in detail the nutritional value of wheat-DDGS as a feed ingredient for poultry. In
the UK in particular, greater quantities of wheat-DDGS are available as feed ingredients for
poultry but unlike maize-DDGS, there are comparatively no data available about the
metabolisable energy (ME) value and nutrient digestibility of wheat-DDGS for poultry. It is
common to use exogenous enzymes to improve the nutritional value of feed ingredients or the
entire diet for poultry. The studies reported in this thesis reported the importance of
exogenous enzymes on the nutrient digestibility, growth performance and gastrointestinal
tract characteristics of bird receiving diets containing wheat-DDGS. The use of DDGS in the
pig diet is becoming more common and majority of the studies in this area have described its
nutritional value and optimum inclusion rates for pigs. Because the physical and chemical
characteristics of dietary fibre may affect the digestibility of nutrients in the diet, Chapter 6 of
this thesis determined if the choice of protein source, including maize-DDGS has an effect on
AA digestibility in pigs.
One of the limitations of DDGS as a feed ingredient for poultry is the wide variability in its
chemical composition among sources. The variability in DDGS composition is due to a wide
variety of factors with the most important factor being the differences in processing
techniques among sources. It is however impracticable and expensive to determine the
chemical composition of every single DDGS before it is used in the diet. The result from
Chapter 2 in this dissertation showed that prediction models are a useful tool in predicting the
AA contents of maize- and wheat-DDGS. A compilation of data from a wide range of sources
in the aforementioned study also helped to describe in full the wide variability and the
relationship between the chemical components in maize- and wheat-DDGS. Even though the
variability in the chemical composition of DDGS among sources has been widely reported in
the literature, this study was the first to develop prediction models that are useful to determine
their AA contents. It is expected that this mathematical models will be useful to feed
nutritionists when formulating diets containing maize- or wheat-DDGS for both non-
ruminants and ruminants.
205
When formulating diets for poultry, it is essential to ensure that dietary nutrients are provided
at optimum levels because either a deficiency or excessive supply of nutrients may
compromise bird performance. For this reason, the energy value, AA digestibility and P
utilisation of feed ingredients are needed when formulating diets for broilers and turkey. The
energy value and nutrient digestibility of maize-DDGS for poultry has been studied and is
well defined mainly because maize grains are more readily available in the USA and because
bioethanol production in the USA is older than in the UK. Wheat is used for bioethanol
production in the UK and the nutritive value of wheat-DDGS is not known in spite of the
possibility to use this co-product as a feed ingredient for poultry.
The result in Chapter 3 and 4 in this dissertation indicated that the ME in wheat-DDGS is
comparable to that of wheat grain and that wheat-DDGS is a good source of digestible P for
broilers and turkey. These observations are important because wheat-DDGS may be used as
an alternative to wheat grain as source of energy for poultry especially in cases where the
demand for wheat as a feedstock for bioethanol production reduces the quantity available for
poultry. In addition, the inclusion of wheat-DDGS in poultry diets may reduce the level of
inorganic P sources needed to be used in the diet which in turn will reduce feed cost.
One of the factors that make DDGS an attractive feed ingredient for poultry is its greater
protein and AA content compared with maize/wheat grain. On the downside, the crude protein
(CP) and AA content and digestibility of DDGS for poultry may vary among sources due to
the negative effects of some production processes including heat treatment. Nonetheless, little
is known about the apparent- or standardised ileal AA digestibility (AIAAD or SIAAD,
respectively) of wheat-DDGS for broilers and turkey. The results in Chapter 3 and 4 in this
dissertation showed that the AIAAD and SIAAD of wheat-DDGS for broilers and turkey are
variable and nil for Lys. These are important data that show the need for supplemental AA
when formulating diets containing wheat-DDGS for broilers and turkey.
The growth performance of poultry in response to a particular diet attracts the greatest
commercial and industry interest. Efforts to determine the optimal inclusion rates of wheat-
DDGS for broilers and turkey can be found in the literature. However, the majority of studies
in the literature have used total nutrient values, although it is accepted that diet formulation
that is based on digestible nutrient values best supports growth performance and minimises
nutrient losses in manure. The results reported in Chapter 5 of this dissertation showed that
the inclusion of up to 25% wheat-DDGS in broiler diet produced similar growth performance
compared with birds receiving no wheat-DDGS in their diet when the diets are formulated
206
using metabolisable energy and digestible nutrient values of all feed ingredients. The studies
in this dissertation helped to show that wheat-DDGS can be used in the diet of broilers at up
to 25% inclusion rate.
The use of exogenous enzymes to improve the nutritional value of a feed ingredient or the
entire diet for poultry is commonplace and has been well studied. Carbohydrases in particular,
may be effective at improving the nutritional value of DDGS for poultry due to its high
soluble fibre content relative to the cereal grain. The studies in Chapter 3 and 4 of this
dissertation were the first in the literature to evaluate the improvements in metabolisable
energy value, AA digestibility and P utilisation of wheat-DDGS using exogenous enzymes for
broilers and turkey. The results from the aforementioned studies indicated that a mixture of
carbohydrases and protease will improve the metabolisable energy in wheat-DDGS whereas
protease will improve the AIAAD and SIAAD of wheat-DDGS for broilers and turkey. This
connotes that broilers receiving wheat-DDGS in their diets will derive greater benefits from
supplementation of carbohydrases and proteases.
The study in Chapter 5 in this dissertation evaluated the improvement in growth performance
and gastrointestinal tract characteristics of broilers in response to supplemental carbohydrases,
protease and phytase. A mixture of carbohydrases and protease improved the growth
performance of broilers in this study and this result corroborated the improvement reported
for the energy value and AA digestibility of wheat-DDGS using the same enzymes in this
dissertation. These have important production and environmental significance because
improvements in nutrient utilisation or growth performance using exogenous enzymes are
often associated with a reduction in feed cost or a reduction in nutrient losses in manure.
The effect of exogenous enzymes on gastrointestinal tract health of poultry is not well
understood. It is realistic to expect that ameliorating the anti-nutritive properties of a feed
ingredient/diet may lead to improvements in the absorptive structure of the gastrointestinal
tract, but the mechanisms involved may not be as straight forward. More work is needed to
ascertain the relationship between anti-nutrients and intestinal morphology in broilers and
equate the improvements in nutrient digestibility due to exogenous enzymes to changes in
small intestinal morphology.
The effect of dietary fibre on nutrient digestibility for pigs has been well studied, reported in
the literature and reasonably understood. In spite of the progress in this area, the effect of
dietary fibre associated with protein source has been completely overlooked whereas the main
207
focus has been on the fibre associated with cereal grains. The possible effect of protein-source
dietary fibre type cannot be over-emphasized because the fibre characteristics of protein feed
ingredients used in pig diets are different and because these feed ingredients often make up
approximately 50% of the diet. Evaluation of the effect of dietary fibre associated with protein
feedstuffs on AA digestibility may help to clarify some of the differences in growth
performance when different protein sources are used in the pig’s diet.
Due to the increase in the availability of maize-DDGS, this co-product is increasingly being
used to partially replace soyabean meal (SBM) or used in the place of canola meal (CM) in
the pig diet. The results from Chapter 6 in this dissertation indicated that ileal AA digestibility
was similar when using either SBM or maize-DDGS in growing pig’s diet. This observation
adds value to the fact that maize-DDGS is a viable feed ingredient for pigs. However, it is
necessary to determine the effect on ileal AA digestibility when wheat-DDGS is used to
substitute SBM in the pig’s diet, considering that wheat-DDGS may contain greater levels of
fibre compared with maize-DDGS. In addition, a similar study that evaluates the effect on
ileal AA digestibility when maize- or wheat-DDGS are included in poultry diet is required.
It is desirable to reduce the quantity of nutrients lost in pig manure due to its negative
implications on the environment. A good strategy will be one that does not compromise pig
performance but at the same time reduces nutrient loss in manure. The results in Chapter 6 in
this dissertation showed that reducing the level of dietary CP by 4% does not affect ileal AA
digestibility. Whilst, it might be necessary to conduct a more robust study that determines the
effect of reducing dietary CP level on energy utilisation, nutrient retention and excretion to
reach a firm conclusion, the results in Chapter 6 takes a step forward in understanding the
strategies that may be used to mitigate nutrient loss by pigs.
7.2 CONCLUSIONS AND RECOMMENDATIONS
From the results of studies reported in this dissertation it is collectively concluded or
recommended that:
1. Prediction models can be used to determine the AA content of maize- and wheat-
DDGS from their chemical composition with reasonable accuracy.
2. Maize- or wheat-DDGS can be used as feed ingredients for poultry and pigs because
of their comparatively similar energy value or nutrient digestibility compared with
conventional feed ingredients such as wheat and SBM.
3. Wheat-DDGS is an exceptionally good source of digestible P for broilers and turkey.
208
4. The effect of exogenous enzymes on nutrient digestibility, the morphology of the
small intestinal absorptive structure and gastrointestinal tract characteristics of poultry
is not consistent and requires further investigation.
5. The effects of reducing dietary CP level on the morphology of the small intestinal
absorptive structure of pigs may improve understanding about how pigs respond to a
CP-marginal diet.
6. The use of wheat-DDGS as a low cost alternative for wheat, maize and inorganic P
sources for poultry may reduce feed cost and may also reduce competition between
poutltry and bioethanol for wheat.
7. The use of exogenous enzymes in diets containing DDGS will increase the nutritive
value and limit nutrient loss in manure.
8. The use of wheat-DDGS as a source of protein for poultry will reduce dependency on
SBM import and consequentially improve sustainability.
209
REFERENCES
Adedokun, S. A., C. M. Parsons, M. S. Lilburn, O. Adeola, and T. J. Applegate. 2007.
Comparison of ileal endogenous amino acid flows in broiler chicks and turkey poults.
Poultry Science 86:1682-1689.
Adedokun, S. A., O. Adeola, C. M. Parsons, M. S. Lilburn, and T. J. Applegate. 2008.
Standardized ileal amino acid digestibility of plant feedstuffs in broiler chickens and
turkey poults using a nitrogen-free or casein diet. Poultry Science 87:2535.
Adeola, O. and A. J. Cowieson. 2011. Opportunities and challenges in using exogenous
enzymes to improve non ruminant animal production: BOARD-INVITED REVIEW.
Journal of Animal Science 89:3189-3218.
Adeola, O. and K. E. Ileleji. 2009. Comparison of two diet types in the determination of
metabolizable energy content of corn distillers dried grains with solubles for broiler
chickens by the regression method. Poultry Science 88:579-585.
Adeola, O., and M. R. Bedford. 2004. Exogenous dietary xylanase ameliorates viscosity-
induced antinutritional effects in wheat-based diets for White Pekin ducks (Anas
platyrinchos domesticus). British Journal of Nutrition 92:87-94.
Adeola, O., J. A. Jendza, L. L. Southern, S. Powell, and A. Owusu-Asiedu. 2010.
Contribution of exogenous dietary carbohydrases to the metabolisable energy value of
corn distillers grains for broiler chickens. Poultry Science 89: 1947-1954.
Akinmusire, A. S. and O. Adeola. 2009. True digestibility of phosphorus in canola and
soybean meals for growing pigs: Influence of microbial phytase. Journal of Animal
Science 87: 977-983.
Amerah, A. M. and V. Ravindran. 2009. Influence of particle size and microbial phytase
supplementation on the performance, nutrient utilisation and digestive tract parameters
of broiler starters. Animal Production Science 49:704-710.
Amerah, A. M., V. Ravindran, and R. G. Lentle. 2009. Influence of insoluble fibre and whole
wheat inclusion on the performance, digestive tract development and ileal microbiota
profile of broiler chickens. British Poultry Science 50:366-375.
210
AOAC International. 2000. Official methods of analysis. Vol. 83.
AOAC International. 2006. Official methods of analysis. Vol. 89.
Applegate, T. J., C. Troche, Z. Jiang, and T. Johnson. 2009. The nutritional value of high-
protein corn distillers dried grains for broiler chickens and its effect on nutrient
excretion. Poultry Science 88:354-359.
Archer Daniels Midland Company. 2011. Feed ingredient catalog. http://www.adm.com/en-
US/products/Documents/ADM-Feed-Ingredients-Catalog.pdf.
ARVALIS. 2006. The newsletter of the nutritional values of ARVALIS Pole-Institute of
vegetal. Article 16. www.arvalisinstitutduvegetal.fr.
Augspurger, N.R., and D.H. Baker. 2004. High dietary phytase levels maximize phosphorus
utilisation but do not improve protein utilisation in chicks fed phosphorus or amino
acid deficient diets. Journal of Animal Science 82:1100-1107.
Avelar, E., R. Jha, E. Beltranena, M. Cervantes, A. Morales and R. T. Zilistra. 2010. The
effect of feeding wheat distillers dried grain with soluble on growth performance and
nutrient digestibility in weaned pigs. Animal Feed Science and Technology 160: 73-
77.
Bandegan, A., W. Guenter, D. Hoehler, G. H. Crow, and C. M. Nyachoti. 2009. Standardized
ileal amino acid digestibility in wheat distillers dried grains with solubles for broilers.
Poultry Science 88:2592.
Batal, A. and N. Dale. 2003. Mineral composition of distillers dried grains with solubles.
Journal of Applied Poultry Research 12:400-403.
Batal, A. B, and C. M. Parsons. 2002. Effects of Age on Nutrient Digestibility in Chicks fed
Different Diets. Poultry Science 81:400-407.
Batal, A. B. and N. M. Dale. 2006. True metabolizable energy and amino acid digestibility of
distillers dried grains with solubles. The Journal of Applied Poultry Research 15:89.
Bedford, M. R. 2000. Exogenous enzymes in monogastric nutrition--their current value and
future benefits 1. Animal Feed Science and Technology 86:1-13.
211
Bedford, M. R. and H. L. Classen. 1992. Reduction of intestinal viscosity through
manipulation of dietary rye and pentosanase concentration is affected through changes
in carbohydrate composition of the intestinal aqueous phase and results in improved
growth rate and feed conversion efficiency of broiler chicks. Journal of Nutrition
122:560–569.
Bedford, M. R. and H. Schulze. 1998. Exogenous enzymes for pigs and poultry. Nutrition
Research Reviews 11:91-114.
Belyea R. L., K. D. Rausch, and M. E. Tumbleson. 2004. Composition of corn and distillers
dried grains with solubles in grind ethanol processing. Bioresource Technology
94:293-298.
Belyea, R. L., K. D. Rausch, T. E. Clevenger, V. Singh, D. B. Johnston, and M. E.
Tumbleson. 2010. Sources of variation in composition of DDGS. Animal Feed Science
and Technology 159: 122-130.
Belyea, R., S. Eckhoff, M. Wallig, and M. Tumbleson. 1998. Variability in the nutritional
quality of distillers soluble. Bioresource Technology 66: 207-212.
Biehl, R.R. and D.H. Baker. 1997. Microbial phytase improves amino acid utilisation in
young chicks fed diets based on soybean meal but not diets based on peanut meal.
Poultry Science 76: 355-360.
Bolarinwa, O. A. and O. Adeola. 2012. Energy value of wheat, barley and wheat distillers
dried grains with solubles for broiler chickens using the regression method. Poultry
Science 91:1928-1935.
Boros, D., R. R. Marquardt, W. Guenter, and J Brufau. 2002. Chick adaptation to diets
based on milling fractions of rye varying in arabinoxylans content. Animal Feed
Science Technology 101: 135-149
Brenes, A., W. Guenter, R.R. Marquardt, B.A. Rotter. 1993. Effect of glucanase/pentosanase
enzyme supplementation on the performance of chickens and laying hens fed wheat,
barley, naked oats and rye diets. Canadian Journal Animal Science 73: 941-951.
Carre, B., A. Idi, S. Maisonnier, J. P. Melcion, F. X. Oury, J. Gomez, and Pluchard P. 2002.
Relationship between digestibilities of food components and characteristics of wheats
212
(Triticum aestivum) introduced as the only cereal source in broiler chicken diet. British
Poultry Science 43: 404-415.
Cheryan, M. 1980. Phytic acid interactions in food systems. Critical Reviews in Food Science
and Nutrition 13:297–335.
Choct, M., A. Kocher, D. L. E. Waters, D. Pettersson, and G. Ross. 2004. A comparison of
three xylanases on the nutritive value of two wheats for broiler chickens. British
Journal of Nutrition 92:53-61.
Chrenkova, M., Z. Ceresnokova, M. Polacikova, Z. Formelova, A. Tomikova, and K. Zaujec.
2010. Effect of bioethanol co-product type on ruminal degradation and amino acid
intestinal digestibility. Slovakia Journal of Animal Science 43: 72-77
Christensen, H. N. 1984. The regulation of amino acid and sugar absorption by diet. Nutrition
Review 42: 237–242.
Classen, H.L., T.A. Scott, G. Irish, P. Hucl, M. Swift and M. R Bedford. 1995. The
relationship of chemical and physical measurements to the apparent metabolisable
energy (AME) of wheat when fed to broiler chickens with and without a wheat
enzyme source. Proceedings of the 2nd European Symposium on Feed Enzymes,
Netherlands, pp. 169-175.
Collins, T., C. Gerday, and G. Feller. 2005. Xylanases, xylanase families and extremophilic
xylanases. Microbiology Reviews 29: 3–23
Corzo, A., M. W. Schilling, R. E. Loar II, V. Jackson, S. Kin, and V. Radhakrishnan. 2009.
The effects of feeding distillers dried grains with solubles on broiler meat quality.
Poultry Science 88:432-439
Cowieson, A. J. and O. Adeola. 2005. Carbohydrases, protease, and phytase have an additive
beneficial effect in nutritionally marginal diets for broiler chicks. Poultry Science
84:1860-1867.
Cowieson, A. J., M. Hruby, and E. E. Pierson. 2006. Evolving enzyme technology: impact on
commercial poultry nutrition. Nutrition Research Reviews 19:90-103.
213
Cowieson, A.J., T. Acamovic, and M.R. Bedford. 2004. The effects of phytase and phytic
acid on the loss of endogenous amino acids and minerals from broiler chickens. British
Poultry Science 45: 101–108.
Cozannet, P., M. Lessire, C. Gady, J. P. Metayer, Y. Primot, F. Skiba, and J. Noblet. 2010a.
Energy value of wheat dried distillers grains with solubles in roosters, broilers, layers,
and turkey. Poultry Science 89:2230-2241.
Cozannet, P., M. Lessire, J. P. Metayer, C. Gady, Y. Primot, P. A. Geraert, L. Le Tutour, F.
Skiba, and J. Noblet. 2010b. Nutritive value of wheat and maize distillers dried grains
with solubles in poultry. Animal Production 23:405-414.
Cozannet, P., Y. Primot, C. Gady, J. P. Metayer, M. Lessire, F. Skiba, and J. Noblet. 2011.
Standardised amino acid digestibility of wheat distillers' dried grains with solubles in
force-fed cockerels. British Poultry Science 52:72-81.
Cromwell, G. L., K. L. Herkelman, and T. S. Stahly. 1993. Physical, Chemical, and
Nutritional characteristics of distillers dried grains with solubles for chicks and pigs.
Journal of Animal Science 71:679-686.
Cromwell, G. L., M. J. Azain, O. Adeola, S. K. Baidoo, S. D. Carter, T. D. Crenshaw, S. W.
Kim, D. C. Mahan, P. S. Miller, and M. C. Shannon. 2011. Corn-DDGS in diets of
growing-finishing pigs: A cooperative study. Journal of Animal Science 89:2801-
2811.
Dierick, N., I. Vervaeke, J. Decuypere and Henderickx, H. 1983. Influence of the nature and
level of crude fibers on the apparent ileal and fecal digestibility of dry-matter, proteins
and amino-acids and on the nitrogen-retention in swine. Revue de L‘Agriculture 36:
1691-1712.
Dilger, R. N. and O. Adeola. 2006. Estimation of true phosphorus and endogenous
phosphorus loss in growing chicks fed conventional and low phytate soybean meals.
Poultry Science 85: 661-668.
Dilger, R. N., J. S. Sands, D. Ragland, and O. Adeola. 2004. Digestibility of nitrogen and
amino acids in soybean meal with added soyhulls. Journal of Animal Science 82: 715-
724.
214
Dilworth, L.L., F.O. Omoruyi, and Asemota, H.N. 2005. Digestive and absorptive enzymes in
rats fed phytic acid extract from sweet potato (Ipomoea batatas). Diabetologia
Croatica 34: 59-65.
Edwards, C. A., I. T. Johnson, and N. W. Read. 1988. Do viscous polysaccharides slow
absorption by inhibiting diffusion or convection? European Journal of Clinical
Nutrition 42:307-312.
Emiola, I. A., F. O. Opapeju, B. A. Slominski, and C. M. Nyachoti. 2009. Growth
performance and nutrient digestibility in pigs fed wheat distillers dried grains with
solubles-based diets supplemented with a multicarbohydrase enzyme. Journal of
Animal Science 87:2315.
Engberg, R. M., M. S. Hedermann, S. Steenfeldt, and B. B. Jensen. 2004. Influence of whole
wheat and xylanase on broiler performance and microbial composition and activity in
the digestive tract. Poultry Science 83: 925-983.
Ergul, T., C. M. Amezcua, C. Parsons, B. Walters, J. Brannon, and S. L. Noll. 2003. Amino
acid digestibility in corn distillers dried grains with solubles. Poultry Science 82:70.
Fastinger, N. D., J. D. Latshaw, and D. C. Mahan. 2006. Amino acid availability and true
metabolizable energy content of corn distillers dried grains with solubles in adult
cecectomized roosters. Poultry Science 85:1212.
Fiene, S. P., T. W. York, and C. Shasteen. 2006. Correlation of DDGS IDEATM
digestibility
assay for poultry with cockrel true amino acid digestibility. Pages 82-89 in Proc. 4th
Mid-Atlantic Nutrition Conference. University of Maryland, College Park. MD.
Francesch, M. and P. A. Geraert. 2009. Enzyme complex containing carbohydrases and
phytase improves growth performance and bone mineralization of broilers fed reduced
nutrient corn-soybean-based diets. Poultry Science 88:1915-1924.
Ganesan, V., Muthukumarappan, and K. A. Rosentrater. 2008. Effect of moisture content and
soluble level on physical, chemical and flow properties of distillers dried grains with
solubles (DDGS). Cereal Chemistry 85:464-470.
González-Alvarado, J. M., E. Jiménez-Moreno, D. González-Sánchez, R. Lázaro, and G. G.
Mateos. 2010. Effect of inclusion of oat hulls and sugar beet pulp in the diet on
215
productive performance and digestive traits of broilers from 1 to 42 days of age. Animal
Feed Science Technology 162:37-46.
González-Alvarado, J. M., E. Jiménez-Moreno, R. Lázaro and G. G. Mateos. 2007. Effects of
type of cereal, heat processing of the cereal, and inclusion of fiber in the diet on
productive performance and digestive traits of broilers. Poultry Science 86:1705-1715.
Green, J., D. U. Ahn, and M. E. Persia. 2010. Effects of high concentration of distillers grains
with soluble on long-term laying hen performance. Journal of Animal Science 88
(Suppl. 1): 552. (Abstract)
Han, J. C., and K. S. Liu. 2010. Changes in proximate composition and amino acid profile
during dry grind ethanol processing from corn and estimation of yeast contribution
toward DDGS protein. Journal of Agricultural Food Chemistry 102: 3110-3118.
Hoskova, S., A. Vasatkova, P. Kratochvilova, M. Balabanova, M. Lichovnikova, and L.
Zerman. 2010. The influence of distillers dried grains with solubles in broilers feed
mixtures on their growth parameters. Acta Universitatis Agriculturae et Silviculturae
Mendelianae Brunensis 58:179-184
Htoo, J. K., B. A. Araiza, W. C. Sauer, M. Rademacher, Y. Zhang, M. Cervantes and R. T.
Ziljistra. 2007. Effect of dietary protein content on ileal amino acid digestibility, growth
performance, and formation of microbial metabolites in ileal and cecal digesta of early-
weaned pigs. Journal of Animal Science 85: 3303-3312.
Huang, J. F., M. Y. Chen, H. F. Lee, S. H. Wang, Y. H. Hu, and Y.K. Chen. 2006. Effects of
Corn Distiller’s Dried Grains with Soluble on the Productive Performance and Egg
Quality of Brown Tsaiya Duck Layers. Ilan Branch, Livestock Research Institute,
Council of Agriculture. Taiwan.
http://www.ddgs.umn.edu/internationalresearch/2011Taiwan%20laying%20duck%20
DDGS%20feeding%20trial%20final%20report%20_English.pdf Assessed July 15,
2011.
Iji, P. A., R. J. Hughes, M. Choct, and D. R. Tivey. 2001. Intestinal structure and function of
broiler chickens on wheat-based diets supplemented with a microbial enzyme. Asian-
Australian Journal of Animal Science 14:54-60.
216
Ingledew, W. M. 1999. Yeast- could you base a business on this bug? In Biotechnology in the
Feed Industry; Proceedings of Alltechs 15th
Annual Symposium. Nottingham
University Press: Nottingham, U.K. pp 27-47.
Janicek, B. N., P. J. Kononoff , A. M. Gehman, and P. H. Doane. 2008. The effect of feeding
dried distillers grains plus solubles on milk production and excretion of urinary purine
derivaves. Journal of Dairy Science 91:3544-355
Jaroni, D., S. E. Scheideler, M. M. Beck, and C. Wyatt. 1999. The effect of dietary wheat
middlings and enzyme supplementation II: apparent nutrient digestibility, digestive
tract size, gut viscosity and gut morphology in two starins of leghorn hens. Poultry
Science 78: 1664-1674.
Jozefiak, D., A. Rutkowski, B. Jensen, and R. M. Engberg. 2007. Effects of dietary inclusion
of triticale, rye and wheat and xylanase supplementation on growth performance of
broiler chickens and fermentation in the gastrointestinal tract. Animal Feed Science
Technology 132:79–93.
Jung, B. and A. Batal. 2009. The nutrient digestibility of high-protein corn distillers dried
grains and the effect of feeding various levels on the performance of laying hens.
Journal of Applied Poultry Research 18:741-751.
Jung, B., A. Batal, and R. Mitchell. 2010. Effects of exogenous enzyme supplementation on
performance and carcass characteristics of broilers fed distillers died grains with
soluble. Journal of Animal Science 88 (Suppl. 1):551-552 (Abstract)
Kim, E. J., C. M. Amezcua, P. L. Utterback, and C. M. Parsons. 2008. Phosphorus
bioavailability, true metabolizable energy, and amino acid digestibilities of high
protein corn distillers dried grains and dehydrated corn germ. Poultry Science 87:700-
705.
Kim, E. J., C. M. Parsons, R. Srinivasan, and V. Singh. 2010. Nutritional composition,
nitrogen-corrected true metabolizable energy, and amino acid digestibilities of new
corn distillers dried grains with solubles produced by new fractionation processes.
Poultry Science 89:44-51.
Kingsly, A. R. P., K. E. Ileleji, C. L. Clementson, A. Garcia, D. E. Maier, R. L. Stroshine, and
S. Radcliff. 2010. The effect of process variables during drying on the physical and
217
chemical characteristics of corn dried distiller’s grains with solubles (DDGS) - Plant
scale experiments. Bioresource Technology 101:193-199.
Kleinschmit, D. H., D. J. Schingoethe, K. F. Kalscheur, and A. R. Hippen. 2006. Evaluation
of various sources of corn dried distillers grains plus solubles for lactating dairy cattle.
Journal of Dairy Science 89:4784-94.
Kluth, H. and M. Rodehutscord. 2010. Effect of the duration of prefeeding on amino acid
digestibility of wheat distillers dried grains with solubles in broiler chicken. Poultry
Science 89:681-687.
Kong, C and O. Adeola. 2011. Protein utilisation and amino acid digestibility of canola meal
in response to phytase in broiler chickens. Poultry Science 90:1508-1515.
Lan, Y., F. O. Opapeju, and C. M. Nyachoti. 2008. True ileal protein and amino acid
digestibilities in wheat dried distillers' grains with solubles fed to finishing pigs.
Animal Feed Science and Technology 140:155-163.
Lee, B., K. Price, M. Utt, and J. Escobar. 2010. Increased AME and growth performance in
broiler chicks fed a high DDGS diet supplemented with a mixture of NSPase. Journal
Animal Science 88 (Suppl. 1):551 (Abstract).
Lee, J. H., J. H. Kim, J. D. Kim, S. W. Kim and In K. Han. 2001. Effects of low crude protein
diets supplemented with synthetic amino acids on performance, nutrient utilisation and
carcass characteristics in finishing pigs reared using a phase feeding regimen. Asian-
Australian Journal of Animal Science 14: 655-667.
Lenis, N. P., P. Bikker, J. van der Meulen, J. T. van Diepen, J. G. Bakker and A. W.
Jongbloed. 1996. Effect of dietary neutral detergent fibre on ileal digestibility and portal
flux of nitrogen and amino acids and on nitrogen utilisation in growing pigs. Journal of
Animal Science 74: 2687-2699.
Letourneau-Montminy, M. P., A. Narcy, M. Magnin, D. Sauvant, J. F. Bernier, C. Pomar, and
C. Jondreville. 2010. Effect of reduced dietary calcium concentration and phytase
supplementation on calcium and phosphorus utilisation in weanling pigs with
modified mineral status. Journal of Animal Science 88:1706-1717.
218
Leytem, A. B., P. Kwanyuen, and P. Thacker. 2008. Nutrient excretion, phosphorus
characterization, and phosphorus solubility in excreta from broiler chicks fed diets
containing graded levels of wheat distillers grains with solubles. Poultry Science
87:2505-2511.
Leytem, A. B., P.W. Plumstead, R. O., Maguire, P. Kwanyuen, and J. Brake. 2007. What
aspect of dietary modification in broilers controls litter water soluble P: dietary P,
phytase, or calcium? Journal of Environmental Quality 36:453-463.
Liu, K. 2011. Chemical composition of distillers grains, a review. Journal Agricultural Food
Chemistry 59:1508-1526.
Liu, K. and J. Han. 2011. Changes in mineral concentrations and phosphorus profile during
dry-grind processing of corn into ethanol. Bioresource Technology 102: 3110–3118.
Liu, N. and Ru, Y. J. 2010. Effect of phytate and phytase on the ileal flows of endogenous
minerals and amino acids for growing broilers fed purified diets. Animal Feed Science
and Technology 156: 126-130.
Liu, N., Y. J. Ru, D. F. Tang, T. S. Xu, and G. G. Partridge. 2011. Effects of corn distillers
dried grains with solubles and xylanase on growth performance and digestibility of
diet components in broilers. Animal Feed Science and Technology 163:260-266.
Loar, R. E., J. S. Moritz, J. R. Donaldson, and A. Corzo. 2010. Effects of feeding distillers
dried grains with solubles to broilers from 0 to 28 days posthatch on broiler
performance, feed manufacturing efficiency, and selected intestinal characteristics.
Poultry Science 89:2242-2250.
Lukasiewicz, M., M. Michalczuk, J. Gajewska, K. Wilczynska-czyz, and J. Niemiec. 2009.
Wheat distilled dried grains with solubles (DDGS) as a replacer of extraction soil meal
in nutrition of broiler. Annals of Warsaw University of Life Sciences: Animal Science
46: 315-321.
Lumpkins, B. S. and A. B. Batal. 2005. The bioavailability of lysine and phosphorus in
distillers dried grains with solubles. Poultry Science 84:581-586
219
Lumpkins, B. S., A. B. Batal, and N. M. Dale. 2003. The use of distillers dried grains plus
soluble (DDGS) for laying hens. Nutrient Requirements of Poultry. 9th
revised edition
National Academy Press, Washington, DC.
Lumpkins, B. S., A. B. Batal, and N. M. Dale. 2004. Evaluation of distillers dried grains with
solubles as a feed ingredient for broilers. Poultry Science 83:1891.
Lynn, K. R., and N. A. Clevette-Radford, 1984. Purification and characterization of hevin, a
serin protease from Hevea braziliensis. Biochemistry 23:963-964
Martinez Amezcua, C. 2005. Nutritional evaluation of corn distillers dried grains with
solubles (DDGS) for poultry. PhD Dissertation. University of Illinois-Urbana
Champaign, Urbana, IL.
Martinez Amezcua, C., C. M. Parsons, and S. L. Noll. 2004. Content and relative
bioavailability of phosphorus in distillers dried grains with solubles in chicks. Poultry
Science 83:971.
Martinez-Amezcua, C. and C. M. Parsons. 2007. Effect of increased heat processing and
particle size on phosphorus bioavailability in corn distillers dried grains with solubles.
Poultry Science 86: 331-337
Martinez-Amezcua, C., C. M. Parsons, and D. H. Baker. 2006. Effect of microbial phytase
and citric acid on phosphorus bioavailability, apparent metabolizable energy, and
amino acid digestibility in distillers dried grains with solubles in chicks. Poultry
Science 85:470-475.
Martinez-Amezcua, C., C. M. Parsons, V. Singh, R. Srinivasan, and G. S. Murthy. 2007.
Nutritional characteristics of corn distillers dried grains with solubles as affected by
the amounts of grains versus solubles and different processing techniques. Poultry
Science 86:2624.
Masa’deh, M. K., C. A. Fasbinder-Orth, and S. E. Scheideler. 2010. High dietary inclusion of
dried distillers grains with soluble in broiler chick rations in combination with
AllzymeSSF enzyme: effects on yield and endogenous enzyme levels. Journal of
Animal Science 88 (Suppl. 1):551 (Abstract)
220
Mateos, G. G., E. Jimenez-Moreno, M. P. Serano, and R. P. Lazaro. 2012. Poultry response to
high levels of dietary fiber sources varying in physical and chemical characteristics.
Journal of Applied Poultry Research 21:156-174.
Mathlouthi, N. M. A. Mohamed, and Larbier, M. 2003. Effect of enzyme preparations
containing xylanase and beta-glucanase on performance of laying hens fed
wheat/barley- or maize/soybean meal-based diets. British Poultry Science 44:60-66.
Mathlouthi, N., J. P. Lalle, P. Lepercq, C. Juste, and M. Larbier. 2002. Xylanase and α-
glucanase supplementation improve conjugated bile acid fraction in intestinal contents
and increase villus size of small intestine wall in broiler chickens fed a rye-based diet.
Journal of Animal Science 80:2773–2779.
Matterson, L.D., J. Tlustohowicz, and E.P. Singsen. 1966. Corn Distillers Dried Grains with
Solubles in Rations for High-Producing Hens. Poultry Science 45:147–151.
McCleary, B. V. 1991. Measurement of endo-1,4-β-xylanase. Biotechnology Progress 7:161-
169.
McCleary, B. V., and H. Sheehan. 1989. Measurement of cereal amylase: A new assay
procedure. Journal of Cereal Science 6:237-251.
McKinnon, J. J. and A. M. Walker. 2008. Comparison of wheat-based dried distillers grain
with soluble to barley as an energy source for backgrounding cattle. Canadian Journal
Animal Science 88: 721-724.
Mirzaie, S., M. Zaghari, S. Aminzadeh, M. Shivazad, and G. G. Mateos. 2012. Effects of
wheat inclusion and xylanase supplementation of the diet on productive performance,
nutrient retention, and endogenous intestinal enzyme activity of laying hens. Poultry
Science 91: 413-425.
Mjoun, K., K. F. Kalscheur, A. R. Hippen, D. J. Schingoethe. 2010. Performance and amino
acid utilisation of early lactation dairy cows fed regular or reduced-fat dried distillers
grains with solubles. Journal of Dairy Science 93: 3176-3191.
Morrison, F.B. 1954. Feeds and Feeding: A Handbook for the Student and Stockman. 21st
edition. The Morrison Publishing Company. Ithaca, NY.
221
Mosenthin, R., W.C. Sauer and F. Ahrens 1994. Dietary pectin effect on ileal and fecal amino
acid digestibility and exocrine pancreatic secretions in growing pigs. Journal of
Nutrition 124: 1222-1229.
Moughan, P. J., and G. Schuttert. 1991. Composition of nitrogen containing fractions in
digesta from the distal ileum of pigs fed a protein-free diet. Journal of Nutrition
121:1570–1574.
National Research Council. 2012. Nutrient Requirements of Swine. 11th
edition. The National
Academies Press. Washington, DC
Nian, F., Y. M. Guo, Y. J. Ru, F. D. Li, and A. Peron. 2011. Effect of Exogenous Xylanase
Supplementation on the Performance, Net Energy and Gut Microflora of Broiler
Chickens Fed Wheat-based Diets. Asian-Australian Journal of Animal Sciences
24:400-406.
Nitsan, Z. G., Z. Ben-Avraham, Z. Zoref, and I. Nir. 1991. Growth and development of the
digestive organs and some enzymes in broiler chicks after hatching. British Poultry
Science 32: 515-523.
Noll, S. 2009. Maximising alternative protein ingredient use in market turkey diets.
Department of Animal Science, University of Minnesota.
www.ddgs.umn.edu/.../2006-Noll-%20Maximizing%20alternative%20protein--.pdf.
Assessed July 14 2011.
Noll, S. L., C. Abe, and J. Brannon. 2003a. Nutrient composition of corn distiller dried grains
with solubles. Poultry Science 82:71.
Noll, S. L., C. Parsons, and W. Dozier III. 2007b. Formulating Poultry Diets with DDGS –
How Far Can We Go? Page 91–99 in proceedings of the 5th Mid-Atlantic Nutrition
Conference, N.G. Zimmerman, ed. College Park, MD: Maryland Feed Industry
Council and Dept. of Animal and Avian Sciences, University of Maryland.
Noll, S. L., J. Brannon, and C. Parsons. 2007a. Nutritional value of corn distiller dried grains
with solubles (DDGS): influence of solubles addition. Poultry Science 86:68.
Noll, S. L., J. Brannon, and V. Stangeland. 2004. Market tom turkey performance and
inclusion level of corn distillers dried grains with solubles. Poultry Science 83:321.
222
Noll, S. L., J. Brannon, J. L. Kalbfleisch, and K. D. Roberson. 2005. Metabolizable energy
value for corn distillers dried grains with solubles in turkey diets. Poultry Science
84:12.
Noll, S. L., V. Stangeland, G. Speers, C. M. Parsons, and J. Brannon. 2003b. Market tom
turkey response to protein and threonine. Poultry Science 82:73.
Noll, S. L., V. Stangeland, G. Speers, C. Parsons, and J. Brannon. 2002. Utilisation of Canola
Meal and Distillers Grains with Solubles in Market Turkey Diets. Poultry Science
81:92.
Nuez-Ortin, W. G. and P. Yu. 2009. Nutrient variation and availability of wheat DDGS, corn
DDGS and blend DDGS from bioethanol plants. Journal of Science Food Agriculture
89:1754-1761.
Nurit, E., A. Tiessen, K. V. Pixley, and N. Palacioos-Rojas. 2009. Reliable and inexpensive
colometric method for determining protein-bound tryptophan in maize kernels.
Journal of Agricultural and Food Chemistry 57:7233-7238
Nyachoti, C. M., J. D. House, B. A. Slominski, and I. R. Seddon. 2005. Energy and nutrient
digestibilities in wheat dried distillers' grains with solubles fed to growing pigs.
Journal of Science Food Agriculture 85:2581-2586.
Odetallah, N. H., J. J. Wang, J. D. Garlich, and J. C. H. Shih. 2003. Keratinase in starter diets
improves growth of broiler chicks. Poultry Science 82:664-670.
Olsen, S. R. and L. E. Sommers, 1982: Phosphorus. In: Page, A. L., R. H. Miller and D. R.
Keeney (eds.): Methods of soil analysis. No. 9 Part II in the series Agronomy.
American Society of Agronomy and Soil Science Society of America Journal,
Madison Wisconsin USA, pp. 403-430.
Olukosi, O. A., A. J. Cowieson, and O. Adeola. 2007. Age-related influence of a cocktail of
xylanase, amylase, and protease or phytase individually or in combination in broilers.
Poultry Science 86:77-86.
Olukosi, O. A., A. J. Cowieson, and O. Adeola. 2008a. Influence of enzyme supplementation
of maize-soyabean meal diets on carcase composition, whole-body nutrient accretion
and total tract nutrient retention of broilers. British Poultry Science 49:436-445.
223
Olukosi, O. A., A. J. Cowieson, and O. Adeola. 2010. Broiler responses to supplementation of
phytase and admixture of carbohydrases and protease in maize-soyabean meal diets
with or without maize Distillers' Dried Grain with Solubles. British Poultry Science
51:434-443.
Olukosi, O. A., A. J. Cowleson, and O. Adeola. 2008b. Energy utilisation and growth
performance of broilers receiving diets supplemented with enzymes containing
carbohydrase or phytase activity individually or in combination. British Journal of
Nutrition 99:682-690.
Oryschak, M., D. Korver, M. Zuidhof, X. Meng, and E. Beltranena. 2010. Comparative
feeding value of extruded and nonextruded wheat and corn distillers dried grains with
solubles for broilers. Poultry Science 89:2183-2196.
Otto, E. R., M. Yokoyama, P. K. Ku, N. K. Ames and N. L. Trottier. 2003. Nitrogen balance
and ileal amino acid digestibility in growing pigs fed diets reduced in protein
concentration. Journal of Animal Science 81: 1743-1753.
Parsons, C. M. and D.H. Baker. 1983. Distillers dried grains with solubles as a protein source
for the chick. Poultry Science 62:2445-2451.
Parsons, C. M., C. Martinez, V. Singh, S. Radhakrishnan, and S. Noll. 2006. Nutritional value
of conventional and modified DDGS for poultry. Proceedings of Multi-State Poultry
Feeding and Nutrition Conference Indianapolis, IN.
Perez, V. G., C. M. Jacobs, J. Barnes, M. C. Jenkins, M. S. Kuhlenschmidt, G. C. Fahey, C.
M. Parsons, and J. E. Pettigrew. 2011. Effect of corn distillers dried grains with
solubles and Eimeria acervulina infection on growth performance and the intestinal
microbiota of young chicks. Poultry Science 90:958-964.
Pineda, L., S. Roberts, B. Kerr, R. Kwakkel, M. Verstegen, and K, Bregendahl. 2008.
Maximum dietary content of corn dried distiller’s grains with solubles in diets for
laying hens: effects on nitrogen balance, manure excretion, egg production, and egg
quality. A.S. Leaflet R2334. Iowa State University Animal Industry Report 2008.
Ames, IA. http://www.ans.iastate.edu/report/air/. Accessed July 14 2008
Pluske, J. R., J. C. Kim, D. E. McDonald, D. W. Pethick, and D. J. Hampson. 2001. Non-
starch polysaccharides in the diets of young weaned piglets. Pages 81-112 in The
224
Weaner Pig: Nutrition and Management. M. A. Varley and J. Wiseman, edition. CABI
Publishing, Wallingford, UK.
Polizeli, M. L., A. C. Rizzatti, R. Monti, H. F. Terenzi, J. A. Jorge, and D. S. Amorin. 2005.
Xylanases from fungi: properties and industrial applications. Applied Microbiology and
Biotechnology 67: 577-591
Potter, L.M. 1966. Studies with distillers feed in turkey rations. Proceedings of Distillers
Research Feed Conference 21:47-51.
Qian, H., E. T. Kornegay, and D. M. Denbow. 1997. Utilisation of phytate phosphorus and
calcium as influenced by microbial phytase, cholecalciferol and the calcium:total
phosphorus ratio in broiler diets. Poultry Science 76:37-46.
Randall, K. M. and M. D. Drew. 2010. Fractionation of wheat distillers dried grains and
soluble using sieving increases digestible nutrient content in rainbow trout. Animal
Feed Science Technology 159: 138-142
Ravindran, V., A.J. Cowieson, and P.H. Selle. 2008. Influence of dietary electrolyte balance
and microbial phytase on growth performance, nutrient utilisation, and excreta quality
of broiler chickens. Poultry Science 87: 677–688.
Ravindran, V., P. C. H. Morel, G. G. Partridge, M. Hruby, and J. S. Sands. 2006. Influence of
an Escherichia coli-derived phytase on nutrient utilisation in broiler starters fed diets
containing varying concentrations of phytic acid. Poultry Science 85:82-89.
Ravindran, V., P. H. Selle, G. Ravindran, P. C. H. Morel, A. K. Kies, and W. L. Bryden.
2001. Microbial phytase improves performance, apparent metabolizable energy, and
ileal amino acid digestibility of broilers fed a lysine-deficient diet. Poultry Science
80:338-344.
Ravindran, V., S. Cabahug, G. Ravindran, and W. L. Bryden. 1999. Influence of microbial
phytase on apparent ileal amino acid digestibility of feedstuffs for broilers. Poultry
Science 78:699-706.
Rebole, A., L. T. Ortiz, M. L. Rodriguez, C. Alzueta, J. Trevino, and S. Velasco. 2010.
Effects of inulin and enzyme complex, individually or in combination, on growth
performance, intestinal microflora, caecal fermentation characteristics, and jejunal
225
histomorphology in broiler chickens fed a wheat- and barley-based diet. Poultry Science
89: 276-286
Richter, G., H. Hartung, E. Herzog, and F. Otto. 2006. Use of dried wheat-based distillers
grain from bioethanol production in poultry. Page 265-267 in 9 Tagung Schweine-und
Geflugelernahrung, Martin-Luther-Universitat Halle-Wittenberg, Halle, Germany.
Roberson, K. D. 2003. Use of dried distillers' grains with solubles in growing-finishing diets
of turkey hens. International Journal of Poultry Science 2:389-393.
Roberson, K. D., J. L. Kalbfleisch, W. Pan, and R. A. Charbeneau. 2005. Effect of corn
distillers dried grains with solubles at various levels on performance of laying hens
and egg yolk color. International Journal of Poultry Science 4:44-51.
Roberts, S. A., H. Xin, B. J. Kerr, J. R. Russell, and K. Bregendahl. 2007b. Effects of dietary
fibre and reduced crude protein on ammonia emission from laying-hen manure.
Poultry Science 86:1625-1632.
Roberts, S. A., H. Xin, B. J. Kerr, J. R. Russell, and K. Bregendahl. 2007a. Effects of dietary
fiber and reduced crude protein on nitrogen balance and egg production in laying hens.
Poultry Science 86:1716-1725.
Rochell, S. J., B. J. Kerr, and W. A. Dozier III. 2011. Energy determination of corn co-
products fed to broiler chicks from 15 to 24 days of age, and use of composition
analysis to predict nitrogen-corrected apparent metabolisable energy. Poultry Science
90: 1999-2007.
Rodrigues, I. 2008. Crucial to monitor mycotoxins in DDGS. Feed Business Asia 2: 36-39.
Roush, W. B. and T. L. Cravener. 1997. Artificial Neural Network prediction of amino acid
levels in feed ingredients. Poultry Science 76:721-727.
Rutherford, S. M., T. K. Chung, and P. J. Moughan. 2002. The effect of microbial phytase on
ileal phosphorus and amino acid digestibility in the broiler chicken. British Poultry
Science 44: 598-606.
226
Sauer, W. C., R. Mosenthin, F. Ahrens and L. A. Hartog. 1991. The effect of source of fibre
on ileal and fecal amino acid digestibility and bacterial nitrogen excretion in growing
pigs. Journal of Animal Science 69: 4070-4077.
Schaafsma, A. W., V. Limay-Rios, D. E. Paul, and J. D. Miller. 2009. Mycotoxins in fuel
ethanol co-products derived from maize: a mass balance for deoxynivalenol. Journal
of Science Food Agriculture 89:1574-1580.
Scheideler, S.E., M. Masa’dah, and K. Roberson. 2008. Dried Distillers Grains with Solubles
in Laying Hens Ration and Notes about Mycotoxins in DDGS. Pre-Show Nutrition
Symposium, Midwest Poultry Federation Convention, St. Paul, MN.
Schilling, M. W., V. Battula, R. E. Loar, V. Jackson, S. Kin, and A. Corzo. 2010. Dietary
inclusion level effects of distillers dried grains with solubles on broiler meat quality.
Poultry Science 89:752-760.
Schneemann, B. O., B. D. Richter and Jacobs, L. R. 1982. Response to dietary wheat bran in
the exocrine pancreas and intestine of rats. Journal of Nutrition 112: 238.
Sebastian, S., S. P. Touchburn, E. R. Chavez, P. C. Lague. 1996. Efficacy of supplemental
microbial phytase at different dietary calcium levels on growth performance and
mineral utilisation of broiler chickens. Poultry Science 75:1516-1523.
Selle, P. H. and V. Ravindran. 2007. Microbial phytase in poultry nutrition. Animal Feed
Science and Technology 135:1-41.
Selle, P. H., and V. Ravindran. 2008. Phytate-degrading enzymes in pig nutrition. Livestock
Science 113:99-122.
Selle, P. H., V. Ravindran, and G. G. Partridge. 2009. Beneficial effects of xylanase and/or
phytase inclusions on ileal amino acid digestibility, energy utilisation, mineral
retention and growth performance in wheat-based broiler diets. Animal Feed Science
and Technology 153:303-313.
Selle, P. H., V. Ravindran, G. Ravindran, and W. L. Bryden. 2007. Effects of dietary lysine
and microbial phytase on growth performance and nutrient utilisation of broiler
chickens. Asian-Australian Journal of Animal Science 20:1100-1107.
227
Selle, P. H., V. Ravindran, R. A. Caldwell, and W. L. Bryden. 2000. Phytate and phytase:
Consequences for protein utilisation. Nutrition Research Reviews 13:255–278.
Selle, P. H., V. Ravindran, W. L. Bryden, and T. A. Scott. 2006. Influence of dietary phytate
and exogenous phytase on amino acid digestibility in Poultry: A review. Journal of
Poultry Science 43: 89.
Shim, M. Y., G. M. Pesti, R. I. Bakalli, P. B. Tillman, and R. L. Payne. 2011. Evaluation of
corn distillers dried grains with solubles as an alternative ingredient for broilers.
Poultry Science 90:369-376.
Short, F. J., P. Gorton, J. Wiseman, and K. N. Boorman. 1996. Determination of titanium
dioxide added as an inert marker in chicken digestibility studies. Journal of Animal
Science Technology 59:215-221.
Shurson, G.C. 2003. Effects of feeding Babcock B300 laying hens conventional Sanfandila
layer diets compared to diets containing 10% Norgold DDGS on performance and egg
quality.http://www.ddgs.umn.edu/articlespoultry/sanfandila%20layer%20revised%20f
inal%20report.pdf. Assessed July 15 2011.
Shurson, J. 2011. Is Color the Only or Best Indicator of DDGS Quality?. Ethanol producer
magazine. http://www.ethanolproducer.com/articles/7840/is-color-the-only-or-best-
indicator-of-ddgs-quality. Assessed April 2012.
Shurson, J. and S. Noll. 2005. Feed and alternative uses for DDGS.
http://www.farmfoundation.org/news/articlefiles/949-shurson-nollpaper11-28-05.pdf.
Assessed July 2011.
Shurson, J., J. Speihs, M. Wilson, and M. Whitney. 2003. Value and use of new generation
distillers dried grains with soluble in swine diets. 19th
International Alltech
Conference, Minnesota. pp 65.
Slominski, B. A. 2010. Recent advances in enzymes for poultry diets. The Poultry Federation
annual Nutrition Conference 7-9 September 2010. Rogers, Arkansas.
USA.www.thepoultryfederation.com/.../2-
6%20Wed%20%20Bogdan%20Slominski%20-%20Enzymes%20for%20Poultry.pdf.
Assessed April 2012.
228
Slominski, B.A, A. Rogiewicz, M. Nyachoti and K. Wittenberg. 2010. Husky wheat and
wheat/corn DDGS for poultry nutrition. University of Manitoba.
http://umanitoba.ca.afs/animal_science. Assessed 14 July 2011.
Smits, C. H. M. and G. Annison. 1996. Non-starch plant polysaccharides in broiler nutrition
towards a physiologically valid approach to their determination. World Poultry
Science Journal 52: 203-221.
Soares, J. A., H. H. Stein, V. Singh, G. S Shurson, and J. E. Pettigrew. 2011. Amino acid
digestibility of corn distillers dried grains with soluble, liquid condensed solubles,
pulse dried thin sillage, and syrup balls fed to growing pigs. Journal of Animal Science
90: 1255- 1261
Spiehs, M. J., M. H. Whitney, and G. C. Shurson. 2002. Nutrient database for distillers dried
grains with solubles produced from new ethanol plants in Minnesota and South
Dakota. Journal of Animal Science 80:2639.
Steenfeldt, S., A. Mullertz, and J. F. Jensen. 1998. Enzyme supplementation of wheat-based
diets for broilers 1. Effect on growth performance and intestinal viscosity. Animal
Feed Science and Technology 75: 27-43.
Stein, H. H. and G. C. Shurson. 2009. The use and application of distillers dried grains with
solubles in swine diets. Journal of Animal Science 87: 1292-1303
Stein, H. H., B. Sève, M. F. Fuller, P. J. Moughan, and C. F. M. de Lange. 2007. Amino acid
bioavailability and digestibility in pig feed ingredients: Terminology and application.
Journal of Animal Science 85: 172-180.
Stein, H. H., S. P. Connot, and C. Pedersen. 2009. Energy and nutrient digestibility in four
sources of distillers dried grains with soluble produced from corn grown within a
narrow geographical area and fed to growing pigs. Asian-Australian Journal of Animal
Science 22: 1016-1025
Steiner, T., R. Mosenthin, B. Zimmermann, R. Greiner, and S. Roth. 2007. Distribution of
phytase activity, total phosphorus and phytate phosphorus in legume seeds, cereals and
cereal by-products as influenced by harvest year and cultivar. Journal of Animal Feed
Science and Technology 113:320-334.
229
Svihus, B. 2011. The gizzard: Function, influence of diet structure and effects on nutrient
availability. World’s Poultry Science Journal 67:207-224.
Swiatkiewicz S. and J. Koreleski 2006. Effect of maize distillers dried grains with solubles
and dietary enzyme supplementation on the performance of laying hens. Journal of
Animal Feed Science and Technology 15: 253-260.
Szczurek, W. 2009. Standardized ileal digestibility of amino acids from several cereal grains
and protein-rich feedstuffs in broiler chickens at the age of 30 days. Journal of Animal
Feed Science and Technology 18:662-676.
Szczurek, W. 2010. Standardized ileal digestibility of amino acids in some cereals, rapeseed
products and maize DDGS for broiler chickens at the age of 14 days. Journal of
Animal Feed Science 19:72-80.
Thacker, P. A. 2005. Fed wheat or corn based diets supplemented with xylanase or protease
alone or in combination. Journal of Animal and Veterinary Advances 4:276-281.
Thacker, P. A. 2006. Nutrient digestibility, performance and carcass traits of growing-
finishing pigs fed diets containing dried wheat distillers grains with solubles.
Canadian Journal of Animal Science 86:527-529.
Thacker, P. A. and G. P. Widyaratne. 2007. Nutritional value of diets containing graded levels
of wheat distillers grains with solubles fed to broiler chicks. Journal of Science Food
Agriculture 87:1386-1390.
Titus, H. W. 1956. Energy values of feedstuffs for poultry. Pages 10-14 in Procedures of
Semi-Annual Meeting, Nutrition Council of American Feed Manufacturers St. Louis,
MO.
University of Minessota. Distillers grains by-products in livestock and poultry feeds. Nutrient
profiles. Current U.S data.
http://www.ddgs.umn.edu/GenInfo/NutrientProfiles/index.htm Assessed December
2011.
Uni, Z., Y. Noy, and D. Sklan. 1995. Post hatch changes in morphology and function of the
small intestines in heavy and light strain chicks. Poultry Science 74: 1622-1629.
230
Uni, Z., Y. Noy, and D. Sklan. 1999. Posthatch development of small intestinal function in
the poult. Poultry Science 78: 215-222.
Vahjen, W., K. Gläser, K. Schäfer, and O. Simon (1998). Influence of xylanase-supplemented
feed on the development of selected bacterial groups in the intestinal tract of broiler
chicks. Journal of Agricultural Science 130:489-500.
Veldman, A. and H. A. Vahl. 1994. Xylanase in broiler diets with differences in
characteristics and content of wheat. British Poultry Science 35:537.
Vilarino, M., J. M. Gauzere, J. P. Metayer, and F. Skiba. 2007. Energy value of wheat-DDGS
in adult cockerels and growth performances of broiler chickens. Pages 83-86 in 16th
European Symposium on Poultry Nutrition, Strasbourg, France. World Poultry
Science Association, French Branch, Tours, France.
Waldroup, P.W., J.A. Owen, B.E. Ramsey, and D.L. Whelchel. 1981. The use of high levels
of distillers dried grains plus solubles in broiler diets. Poultry Science 60: 1479-1484.
Wang, J. F., Wang, M., Lin, D. G., Jensen, B. B. and Zhu, Y. H. 2006. The effect of source of
dietary fiber and starch on ileal and fecal amino acid digestibility in growing pigs
Asian-Australian Journal of Animal Science 19: 1040-1046.
Wang, Z., S. Cerrate, C. Coto, F. Yan, and P. W. Waldroup. 2007a. Use of constant or
increasing levels of distillers dried grains with solubles (DDGS) in broiler diets.
International Journal of Poultry Science 6:501-507.
Wang, Z., S. Cerrate, C. Coto, F. Yan, and P. W. Waldroup. 2007b. Utilisation of distillers
dried grains with solubles (DDGS) in broiler diets using a standardized nutrient
matrix. International Journal of Poultry Science 6:470-477.
Wang, Z., S. Cerrate, C. Coto, F. Yan, and P.W. Waldroup. 2008. Evaluation of high levels of
distillers dried grains with solubles (DDGS) in broiler diets. International Journal of
Poultry Science 7: 990-996.
Widyaratne, G. P. and R. T. Zijlstra. 2007. Nutritional value of wheat and corn distiller's dried
grain with solubles: Digestibility and digestible contents of energy, amino acids and
phosphorus, nutrient excretion and growth performance of grower-finisher pigs.
Canadian Journal of Animal Science 87:103-114.
231
Wilfart, A., L. Montagne, P. H. Simmins, J. van Milgen, and J. Noblet. 2007. Sites of nutrient
digestion in growing pigs: Effect of dietary fiber. Journal of Animal Science 85:976–
983.
Woyengo, T. A. and C. M. Nyachoti. 2011. Review: Supplementation of phytase and
carbohydrases to diets for poultry. Canadian Journal of Animal Science 91:177-192.
Wu, Y. B., V. Ravindran, D. G. Thomas, M. J. Birtles, and W. H. Hendriks. 2004. Influence
of phytase and xylanase, individually or in combination, on performance, apparent
metabolizable energy, digestive tract measurements and gut morphology in broilers
fed wheat-based diets containing adequate level of phosphorus. British Poultry
Science 45: 76-84.
Wu-Haan, W., W. Powers, R. Angel, and T. J. Applegate. 2010. The use of distillers dried
grains plus solubles as a feed ingredient on air emissions and performance from laying
hens. Poultry Science 89:1355-1359.
Yang, Y., P. A. Iji, A. Kocher, L. L. Mikkelsen, and M. Choct. 2008. Effects of xylanase on
growth and gut development of broiler chickens given a wheat-based diet. Asian-
Australian Journal of Animal Science 21:1659-1664.
Yi, Z., E. T. Kornegay, V. Ravindran, and D. M. Denbow. 1996. Improving phytate
phosphorus availability in corn and soybean meal for broilers using microbial phytase
and calculation of phosphorus equivalency values for phytase. Poultry Science 75:
240-249.
Youssef, A. M., M. M. El-Moniary and A. H. Abd El-Gawad. 2009. Evaluation of distillers
dried grains with soluble as a feedstuff in poultry diets. American-Eurasian Journal of
Agriculture and Environmental Science 5:540-544
Zervas, S. and R. T. Zijlstra. 2002. Effects of dietary protein and fermentable fibre on
nitrogen excretion patterns and plasma urea in grower pigs. Journal of Animal Science
80: 3247-3256.
Zhang, W., D. Li, L. Liu, J. Zang, Q. Duan, W. Yang and L. Zhang. 2013. The effects of
dietary fibre on nutrient digestibility in growing pigs. Journal of Animal Science and
Biotechnology 4:17.
232
Zhang, Y., J. Caupert, P. M. Imerman, J. L. Richard, and G. C. Shurson. 2009. The
occurrence and concentration of mycotoxins in U.S. distillers dried grains with
solubles. Journal of Agriculture Food Chemistry 57:9828-9837.
Zhao, F., H. F. Zhang, S. S. Hou, and Z. Y. Zhang. 2008. Predicting metabolizable energy of
normal corn from its chemical composition in adult pekin ducks. Poultry Science
87:1603-16083
Zijlstra, R. T., G. Widyaratne, and E. Beltranena. 2007. Characterization of wheat DDGS and
feeding to swine. Proceedings of the 2007 Western Nutrition Conference. Saskatoon.
SK. 211-214.
Zijlstra, R.T., C.F.M. de Lange, J. F. Patience. 1999. Nutritional value for wheat for growing
pigs: chemical composition and digestible energy content. Canadian Journal Animal
Science 79:187-194.


![Prudent and efficient use of antimicrobials in pigs and poultry...Prudent and ef cient use of antimicrobials in pigs and poultry FAO ANIMAL PRODUCTION AND HEALTH / MANUAL 23 ISSN [print]](https://static.cupdf.com/doc/110x72/6002d0545171c9059a42cb2d/prudent-and-efficient-use-of-antimicrobials-in-pigs-and-poultry-prudent-and.jpg)