Munich Personal RePEc Archive
The legacy of Confucianism in gender
inequality in Vietnam
Vu, Tien Manh and Yamada, Hiroyuki
Asian Growth Research Institute, Osaka University, Kyushu
University, Keio University
2 July 2020
Online at https://mpra.ub.uni-muenchen.de/101487/
MPRA Paper No. 101487, posted 05 Jul 2020 16:14 UTC

1
The legacy of Confucianism in gender inequality in Vietnam
Tien Manh Vu† and Hiroyuki Yamada††
Abstract
We quantified influences of Confucianism on gender inequality in present-day Vietnam. We
used the number (or density) of the most successful test takers in the Vietnamese imperial
examinations (1075–1919) in a given district as a proxy for mastering the subject of
Confucianism. Using an instrumental variable approach, we considered possible impacts on
sex ratio and educational attainment of women relative to men, based on test score and
population census data. We found that Confucianism has a long lasting impact on gender
inequality. However, the results also suggested that women tended to try harder, perhaps as a
countermeasure against discrimination.
Keywords: Confucianism; Gender inequality; Sex ratio; Education; Vietnam
JEL classification: J16, N35, Z1, I14, I24
Acknowledgements
This work was supported by JSPS (Japan Society for the Promotion of Science) KAKENHI Grant Numbers 18K12784, 18K01580, 19H00619, and 20H01506, project grants from the Asian Growth Research Institute, Kyushu University, and Keio Gijuku Academic Development Funds.
† Corresponding author. Asian Growth Research Institute, Osaka University, and Kyushu University. 11–4 Otemachi, Kokura-kita, Kitakyushu, Fukuoka 803–0814, Japan. E-mail: [email protected].
†† Faculty of Economics, Keio University. 2–15–45 Mita, Minato–ku, Tokyo 108–8345, Japan.

2
1. Introduction
Confucianism has played an important role, stretching back millennia, in the history of
many Asian states, particularly in ancient China and its sphere of influence, which included
Korea and Vietnam. For centuries, questions about Confucian ideology were included on
examinations for selecting public officials to serve in the imperial courts of China and Vietnam.
The doctrines of Confucianism had the effect of relegating women to an inferior social
status, making them dependent on male family members throughout their life1. Women were
prohibited from taking the imperial examinations (Rosenlee, 2006, page 129) in China and
Vietnam, and thus literary learning (“文” in Chinese) became an aspect of male privilege. In
addition, Confucianism established a norm of gendered division of labor: men worked outside
the home (“外” in Chinese, meaning “exterior”) and women worked inside the home (“内” in
Chinese, meaning “interior”) (Rosenlee, 2006, page 82 and 127). It has been suggested that the
oppression of women may have resulted from a combination of filiality, patrilineality, and
ancestor worship (Rosenlee, 2006, page 123)2 because filial devotion is to one’s father’s
lineage. In this context, women and girls would be less favored compared with their male
counterparts, especially in education, thereby resulting in lower female literacy rates.
The formal institutions in these states influenced by Confucianism have followed
fluctuating trends regarding gender equality. First, Confucianism did not remain central to the
institutions of these states. For example, both China and Vietnam had terminated their imperial
examinations by 1919 and would later become Communist nations, in which the role of women
was elevated, at least figuratively, when Mao Zedong proclaimed that “women hold up half of
the sky.” Laws enacted by communist institutions helped raise the status of women in society.
1 The Four Books and Five Classics comprise the main canonical text of Confucianism, which
prescribes three obediences and four virtues for women as filial piety. The three obediences, which
originated from one of the Five Classics, instruct women to obey their father during childhood, their
husband when married, and their sons when widowed, in order to maintain the social order. The four
virtues impose rigid standards on women, namely, diligent work, modest manner, proper speech, and
moral behavior. 2 According to Rosenlee (2006, page 122), the practice of female infanticide dates back to at least the
late Qin and early Han Dynasties (when Vietnam was dominated by Chinese Dynasties). Similarly,
concubinage with the aim of producing a male heir was a common, legally recognized practice during
the Han Dynasty (page 123).

3
For example, the Marriage and Family Law of 1959 in Vietnam protected women from
concubinage and forced (i.e., child) marriage (Goodkind, 1995). Second, the impact of
communism is also pronounced (Alesina and Fuchs-Schundeln, 2007). The literature shows
evidence of the positive impact of communism on gender equality, including a higher labor
force participation rate, a lower gender wage gap (Meng and Kidd, 1997), and almost no gender
gap in literacy rate (Goodkind, 1995). Women growing up during the communist era would
have had a greater incentive to compete (Booth et al., 2018).
Whereas the formal institutions in former Confucian states have changed considerably,
many informal institutions remain today in the form of cultural norms (Alesina and Giuliano,
2015). Various studies (including Das Gupta et al., 2003) have suggested the influence of
Confucianism as one of the causes of son preference, which has resulted in skewed sex ratios
in present-day China, Korea, and Vietnam; however, these studies did not conduct direct
quantitative estimations of the causal effect of Confucianism on sex ratio. Consequently, the
impact of Confucianism on educational attainment remains to be elucidated.
In this paper, the relationship between Confucianism and gender inequality in Vietnam
is examined. Vietnam is of interest for several reasons. First, Confucianism experienced more
disruptions in Vietnam than anywhere else. For example, Chinese characters are no longer used
in Vietnam and this could have impacted the written transmission of Confucianism. In addition,
periods of Vietnamese history, such as French colonial rule and the division of the country into
North and South Vietnam, likely fueled the shift away from Confucianism. The Vietnam War
and other military conflicts led to excess mortality in the male population (Goodkind, 1995),
which might have increased women’s social bargaining power. Later, when the Sino-
Vietnamese diplomatic relationship deteriorated in 1979, many ethnic Chinese fled Vietnam
(Nguyen and Imai, 2017), which may have further distanced the country from Confucian
influences.
Second, recent studies have shown mixed evidence of improvements in gender equality
during the economic transition in Vietnam. On the positive side, rather than a continuous rise
in inequality after the transition, Vu and Yamada (2018) showed that the gender wage gap
declined from 2002 to 2014 because of increases in educational attainment and specific paid
work participation by women. Similarly, the Global Gender Gap Report 2020 by the World

4
Economic Forum3 ranked Vietnam 31st in economic participation and opportunity and 93rd in
educational attainment4 out of 153 selected countries. Vu (2014a) suggested that Vietnamese
parents would be as concerned about their daughters’ education as much as their sons’ when
assigning housework. The entry of various religions that were not well known to Vietnamese
before the 17th century might also have had an impact on the sex ratio in Vietnam (Vu and
Yamada, 2020b). On the negative side, the abovementioned report by the World Economic
Forum ranked Vietnam 110th in political empowerment and 151st in health and survival, both
of which are in the bottom one-third of the list. Son preference continues to be prevalent in
Vietnam (Vu, 2014b) and the skewness of the sex ratio has been accelerating since 2005
(Guilmoto, 2012). Vietnamese men continue to neglect housework even when they have lower
educational attainment and lower income compared with their wives (Vu, 2019b).
Third, Vu and Yamada (2020a) showed a persistent effect of Vietnamese imperial
examinations on the contemporary quantity and quality of education in Vietnam. However,
that study did not examine the relative educational attainment between men and women.
Whether improvements in overall educational attainment are due to advancement among men
or come at the expense of women remains to be clarified.
Therefore, the present study investigates the impact of the legacy of Confucianism on
gender inequality in present-day Vietnam in terms of the core values of Confucianism toward
women and girls. Specifically, we consider two main factors, namely, female survival (sex
ratio between females and males under 5 years of age) and relative educational attainment of
women compared with men.
To construct a proxy for the influence of Confucianism in Vietnam, we use the number
(or density) of successful test takers who passed the imperial examinations at the national level
during 1075–1919 (hereinafter, Confucian elites) per district (or the district’s area in square
kilometers when density is used). This proxy is appropriate for several reasons. First, the
content of the examinations was mainly about Confucianism. Therefore, successful examinees
were very likely the most knowledgeable people about Confucianism in the country at the time.
Second, Confucianism is considered to have informed many cultural norms, and cultural norms
are known to be transferred via kinship, schooling, and social interaction (Becker et al., 2016).
3 http://www3.weforum.org/docs/WEF_GGGR_2020.pdf. The lower the number, the larger the gender
gap. 4 The difference in rank between Vietnam and nearby advanced economies was not large. Singapore was ranked 84th and Japan was 91st, while China and South Korea were 100th and 101st, respectively.

5
Passing the national-level examinations required years of study, which in turn required proper
investment in education from one’s village of residence. Nguyen (2005) found old regulations
that prescribed how village institutions were to facilitate Confucian education as well as the
existence of common rice fields that were dedicated to sponsoring local (village) Confucian
schools in ancient Vietnam.
We conducted analyses at the district and individual levels, using an instrumental
variable (IV) approach. We examined whether the number (or density) of Confucian elites was
associated with relative outcomes between men and women. We used the average distance
from each district to the test venues (taking into account both changes in test venue location
and territorial expansion to the South over time) as an IV because the distance would reflect
the cost of learning. If the legacy of Confucianism is minimal, we expect the estimated
coefficients of interest to be statistically insignificant in explaining the outcomes.
We constructed two corresponding data sets by combining the list of Confucian elites
with either the 2009 Population and Housing Census or the 2009 National Entrance
Examinations to University (NEEU), matching data by district. We selected different outcomes
at the district and individual levels. In the district-level data set, we calculated the following:
sex ratio (boys/girls) among the population aged 0–4 years; literacy rate among the population
aged 11–33; years of schooling among the population aged 22 years or older; school
attendance, dropout rate, and non-enrollment among 11–14 and 15–17 age cohorts; and the
participation rate in the NEEU among those born in 1991. Educational attainment ratios were
specified for each gender and a corresponding relative ratio (i.e., that of men divided by that of
women) was also included. Similarly, at the individual level, we used standardized test scores
for the three academic subjects used in each of four NEEU classifications according to age and
gender. We found a persistent legacy of Confucianism in gender inequality in Vietnam for all
the above outcomes despite substantial changes in Vietnamese society and formal institutions.
However, the results also suggest diminishing impacts with successive generations and
responses by women to discrimination.
Our study contributes to the literature in several ways. First, it quantifies the influence
of Confucianism on various outcomes in terms of the core norms of Confucianism regarding
gender. Second, it provides a novel proxy for the influence of Confucianism in quantitative
analysis. Specifically, this proxy captures the quality of mastering knowledge about
Confucianism. Third, the results of the study demonstrate that the legacy of Confucianism

6
survives via informal institutions, specifically kinship and social interaction, despite the lack
of formal training (schools) and written language in the form of Chinese characters.
The remainder of the paper is organized as follows. Section 2 describes the data and
Section 3 outlines our methods and econometric specifications. Section 4 reports the main
results. Section 5 presents the conclusion and discusses some remaining issues.
2. Data
We combined a list of Confucian elites with either the 2009 Population and Housing
Census or the 2009 NEEU, matching data by district to create one data set at the district level
and another at the individual level (see Online Appendices 3–5 for descriptive statistics of each
data set). Each data set is described in more detail below.
First, we used the list of Confucian elites compiled by Ngo (2006), which includes
names, exam years, and hometowns that were recorded on stelae stored in Temples of
Confucius in Hanoi and Hue, as well as in imperial documents stored in village common-
houses in other regions. Ngo (2006) recorded the present-day districts of the Confucian elite’s
hometowns based on the old geographical locations. We counted the total number of Confucian
elites between 1075 and 1919 in each district from the list.
Second, we used the 2009 Population and Housing Census conducted on April 1, 2009
by the General Statistics Office of Vietnam. The census captured 100% of the Vietnamese
population (86.89 million) and focused on population structure and educational attainment. We
aggregated various outcomes at the district level, which are specified in Section 4.2. We
combined the list of Confucian elites with these aggregated outcomes using the same district
identity to create a district-level data set. We additionally used a 3% sample from the 1999
Population and Housing Census (conducted on April 1, 1999) for additional outcomes and
robustness checks.
Third, we constructed the standardized test scores (z-score) of test takers born in 1991
for each of four test classifications (A, B, C, and D) from the 2009 NEEU and matched them
with the list of Confucian elites according to the family-registration district of the NEEU test
takers to create an individual-level data set. Also, we calculated the total number of NEEU test

7
takers per district and added this information to the district-level data set5. This cohort of NEEU
test takers was expected to have graduated high school in May 2009. Furthermore, in 2009,
test takers born in 1991 would have no repeated grade levels within 12 years of education. This
cohort comprised about 87% of all registered test takers.
The NEEU is administered by the Vietnamese Ministry of Education and Training
(MoET). MoET chose the test exams dates, academic subjects, and classifications in March
2009. All test takers had to register with MoET by May 2009 to take the NEEU, which
determines university placement. During the registration process, applicants had to fill in the
hometown district listed in their family register6.
The 2009 NEEU had 11 classifications, identified by letters of the alphabet; 98% of test
takers sat for classifications A, B, C, and D (for a detailed description of the 2009 NEEU, see
Vu, 2019a and/or Vu and Yamada, 2020a). Each classification comprised three subjects. For
example, classification A had physics, mathematics, and chemistry tests. The exams for
classifications A and V were held on July 4–5, 2009 and the rest were held on July 9–10, 2009.
University placement was based on the total score of the three subjects in each
classification. A university can use several classifications for placement. However, the
classifications and their respective quotas were determined and announced in March–April
2009, before test takers registered with MoET. The test problems for the subjects in each
classification were the same nationwide, as was the test time. The cut-off score for university
placement was decided only after all answer sheets had been scored (probably in August 2009).
Once all the scores were recorded, universities ranked the test scores from highest to lowest
and counted from the top until the pre-determined quota of students was filled. Therefore, the
goal of each test taker was to achieve the highest score they could in order to receive the
placement of their choice. The distribution of test scores did not have a passing hurdle (see Vu,
2019a) as is sometimes the case to get a high school diploma.
In addition, we used geographical information from each district as control variables.
We integrated this information into both the individual- and district-level data sets according
to district. More specifically, we obtained information on 2009 nighttime light data from the
US National Oceanic and Atmospheric Administration (Version 4 DMSP-OLS Nighttime
Lights Time Series), the 1992 Global Land Cover Characterization, and the 1996 Landsat
5 About 44% of 2009 high school graduates took the 2009 NEEU. 6 According to examination regulations, university preferences cannot be changed.

8
Imagery from the United States Geological Survey Earth Resources Observation and Science
Center. We calculated the mean nighttime light intensity, elevation, cropland ratio, and urban
land ratio for each district. We also measured the distance from each district to the coastline
using shape files (Version 3.6) obtained from the Database of Global Administrative Areas
(www.gadm.org).
3. Methods and specifications
3.1 Methods
We used a reduced form equation to regress the outcomes of each district ! on the
number of Confucian elites ("#$!%&!) (and separately, their density, '#$!%&!) located in the
district in an ordinary least squares estimation followed by an instrumental approach. The
outcomes cover sex ratio and educational attainment by gender. We used the same methods for
both sets of data (district- and individual-level). Here, we describe the methods for the district-
level data set only.
Our target is to estimate (
(1) )*%+,-&. = (. "#$1%&2! + 4. 5! + 6! ,
where 5! is a vector of the natural conditions and characteristics of the district. However, Vu
and Yamada (2020a) showed several reasons why the number of Confucian elites would not
be random. One such reason is that some districts would have had relative advantages in terms
of educational facilities in the past. Therefore, we need to conduct an instrumental approach in
which (1) is the second stage.
Before estimating (1), we implemented the first stage
(2) "#$!%&! = 8. 9:! + ;. 5! + <! ,
where 9:! is an IV. The fitted value from (2) is used in the second stage of equation (1).
Specifically, we implemented a two-step feasible general method of moment with robust
standard errors, with the ratio of district populations to country populations as weights.
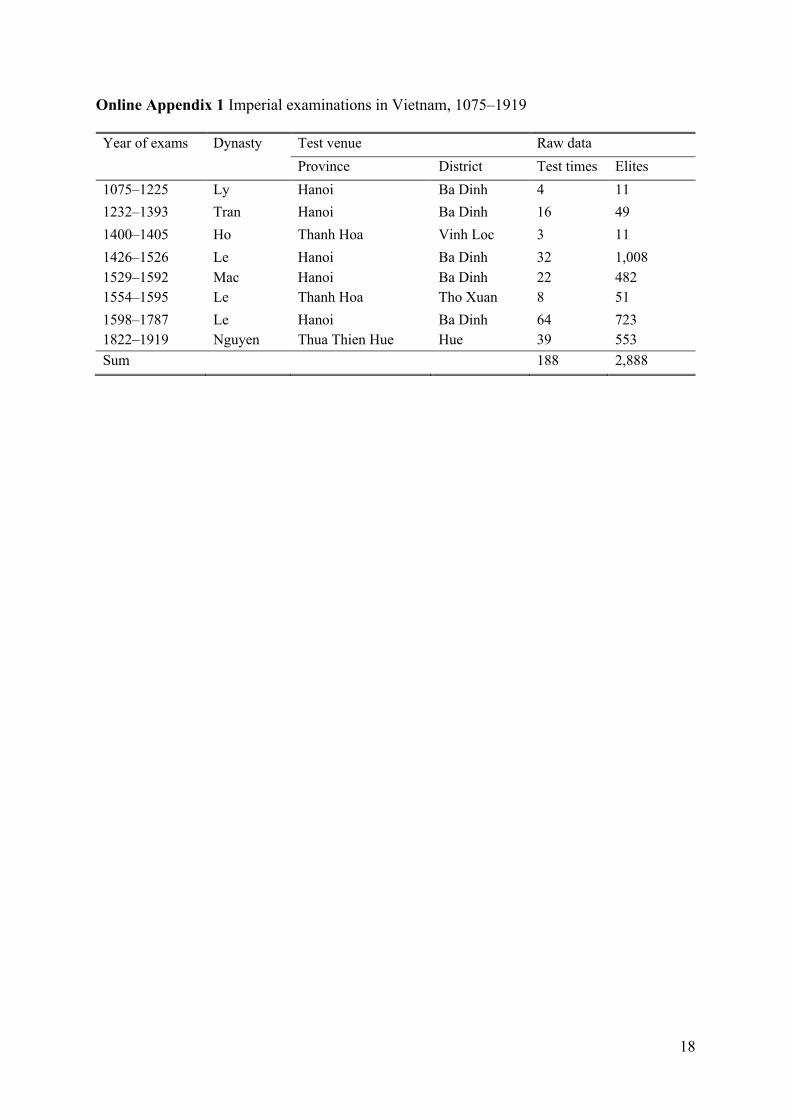
Following Vu and Yamada (2020a), we took advantage of variations in the test venues
and the expansion of Vietnamese territory (see Online Appendix 1 and 2) to construct the IV
for the number of Confucian elites. More specifically, we constructed an average distance from
9
each district to the corresponding test venues for each examination from 1075–1919. The
distance serves as a proxy for educational costs. Because Vietnam is long, narrow, and crossed
by mountains, the cost of traveling to the test venue would have accounted for a large
proportion of the total educational expenditure for each test taker. We applied Vu and
Yamada’s (2020a) suggestion to use the maximum distance (i.e., 2272 km) for those districts
that were not yet part of Vietnam during the test year. We also substituted this number with
other values (3000 km and 4000 km) for robustness checks.
We have some evidence and arguments for the validity of our IV choice. First, the
average distance was an important part of the total educational expenditure for the test takers.
The average distance explains well the number of elites (density of elites), as shown in Online
Appendix 6. Its coefficients were statistically significant regardless of whether the province
fixed effect was in place. Second, the IV is not related to the present-day density of schools
and health facilities. Following Vu and Yamada (2020a), we estimated these correlations as
per Online Appendix 7. When the province fixed effect was in place, the coefficient of this
distance became statistically insignificant. Therefore, if the IV can influence the education,
health, and relative gender outcomes, the channel should be through the variable of interest
("#$!%&/'#$!%&).
3.2 Specifications
From the two corresponding data sets, we constructed 11 categories of outcomes for
the district-level analysis and 16 types of test score outcomes for the individual-level analysis.
Wherever possible, we generally had three outcomes for each category. We constructed one
outcome for each gender and a relative one by dividing that of female by that of male. The
relative outcomes show differences among districts in terms of gender inequality.
For the general district indicator, we counted the number of boys aged 0–4 years and
divided by the number of girls in the same age group to determine the .&>?@%!, for each
district. Next, we selected a cohort of 11–33-year-olds to count the $!%&?@+A?@%& for each
district. This age range was chosen because primary school education is compulsory in
Vietnam for those aged 6–10 years, so individuals over the age of 11 years can be expected to
have attended school in the past, and because those born in or after 1976 (the year after Vietnam
reunited) would be 33 years old or younger in 2009 and would have been subject to the same
educational policies. In addition, we counted the average years of schooling for each district

10
based on its population aged 22 years and older, the majority of whom completed their
education in 2009.
For age cohort-specific district indicators on education, we added three outcomes for
two age cohorts (11–14 and 15–17) corresponding to middle school and high school. For each
age cohort, we considered the school attendance rate for each district by dividing the number
of people confirmed as “attending school” as of April 1, 2009 by the corresponding total
population of the same age cohort. We performed the same calculation for those who had
dropped out of school as of April 1, 20097. We also calculated the non-enrollment rate in each
district for both age cohorts. In addition, we added the school attendance rate and NEEU test-
taking rate for the population of those born in 1991 for each district. Therefore, the denominator
of the formula used to determine the NEEU test-taking rate included the population of those
born in 1991 and those attending school.
Finally, we used seven district characteristics as controls in every estimation, including
the ratio of the Kinh ethnic group in 2009, population density, nighttime light intensity, 1996
elevation, 1992 cropland and urban land ratio, and the distance to the coastline. The
information was taken from the 2009 population census and the abovementioned satellite data.
We also added a specific variable for individual characteristics, ",B?!C!$&D&, to the controls
in individual-level estimations. The opposite status, privilege, was associated with an
educational policy that granted a fixed number of extra points to individuals whose parents or
who themselves were veterans and/or national (labor) heroes.
4. Results
4.1 Sex ratio and general educational attainment
We found a persistent legacy of Confucianism in the 2009 sex ratio among children
under 5 years of age in the district. More specifically, the presence of an additional Confucian
elite had a nexus with 18 “missing” girls (i.e., 18 additional boys) among 10,000 girls in the
0–4 age cohort in the district, as shown in Column (8) of Table 1. This equals 227 missing girls
(45 annually) for a typical Vietnamese district in Vietnam with a population of about 126,000
people. We considered sex selection as a black box and counted only the outcome (the sex
7 Wednesday, April 1, 2009 was in the school calendar.

11
ratio). The black box contained both prenatal selection (sex-selective abortion) and postnatal
selection (neglect of daughters). Previous demographic studies have blamed Confucianism
(son preference) for sex-selective abortions without statistical evidence. Our continuous
variable for the number of Confucian elites would be the best statistical evidence for this
argument. However, our results do not imply that districts lacking Confucian elites have not
been influenced by Confucianism as manifested by son preference.
[Insert Table 1 here]
In addition, the number missing girls is very likely due to prenatal sex selection. This
is because a lower child mortality rate was associated with a higher number of elites in the
district, as shown in Online Appendix 15. We performed a similar exercise with a 3% sample
of the 1999 Population and Housing Census and used the average child mortality rate per
district as the outcome. The rate was calculated from the respondents’ total number of children
and how many of these children had died8.
Similarly, we found a persistent legacy of Confucianism in gender inequality in two
other important outcomes related to educational attainment, namely, literacy and years of
schooling, as shown in columns (11) and (14) of Table 1. The presence of an additional elite
was associated with a 0.0004 times higher male literacy in the district. Similarly, if both
genders went to school, an additional elite in the district’s history was associated with 0.0012
additional years of male schooling.
However, the presence of Confucian elites in a district does not always translate into
negative outcomes for women and girls. We found that the presence of Confucian elites was
associated with a 0.002 times lower probability of female illiteracy compared with districts
lacking Confucian elites, as well as an additional 0.1 years of schooling regardless of gender.
4.2 Educational attainment for specific age cohorts
We further investigated the timing when girls’ educational attainment diverged from
boys’ in association with Confucian elites. We chose the 11–14 and 15–17 age cohorts because
the 6–10 cohort was subject to compulsory education. Higher age was associated with higher
risk of budget constraints and gender inequality.
8 No gender was specified in the questionnaires.

12
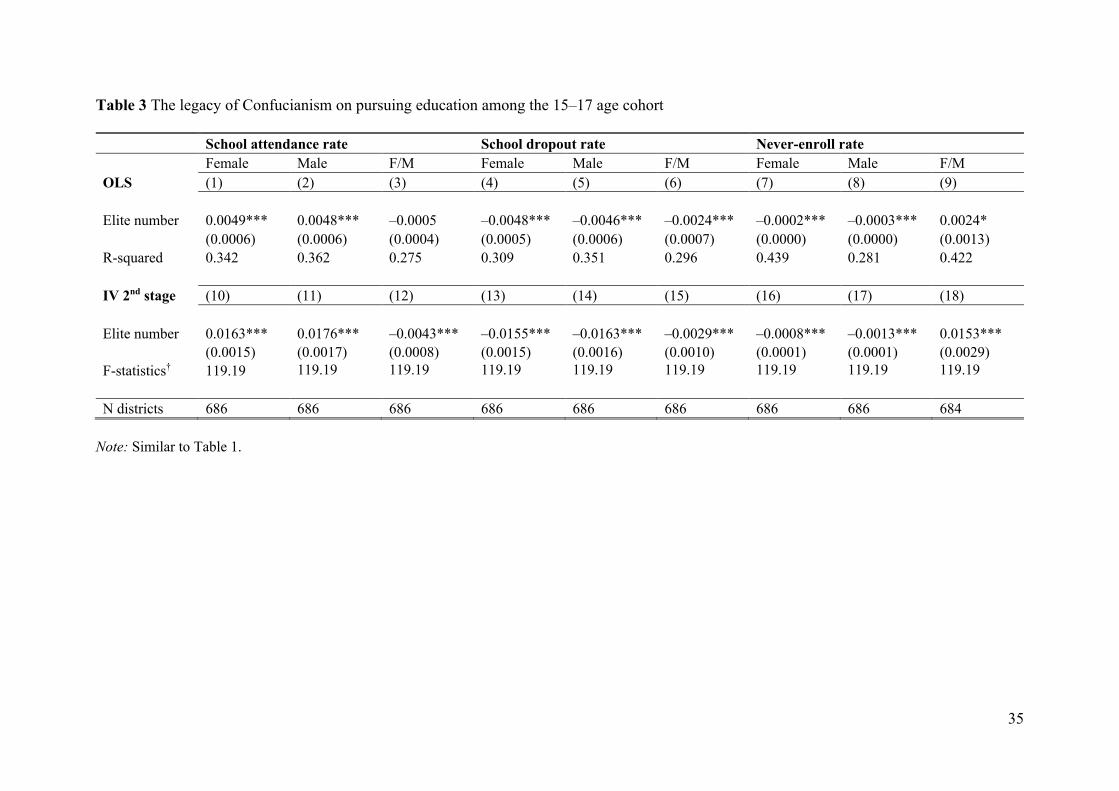
We found that gender inequality is persistently associated with the number of
Confucian elites in outcomes, including school attendance and non-enrollment rates. In relative
terms, an additional elite had a nexus with a 0.002 (0.004) times lower school attendance rate
and a 0.011 (0.015) times higher probability of non-enrollment for age cohort 11–14 (15–17),
as per Table 3 (Table 4). However, we also noted that gender inequality associated with the
presence of Confucian elites tended to be lower in the younger age cohort (11–14).
[Insert Tables 2 and 3 here]
However, we also found the opposite effect in the outcome of school dropout rate, as
shown in column (15) of Tables 2 and 3. The presence of an elite was associated with a 0.003–
0.004 times lower relative school dropout rate for girls compared with boys.
In addition, we noted that in comparison with their counterparts’ outcomes in other
districts, both genders in a district that was home to Confucian elites had higher educational
attainment in association with the number of elites (see columns (9), (10), (12), and (13) of
Table 1). Thus, the presence of Confucian elites does not always translate into negative
outcomes for present-day generations, only in the relative comparisons between genders
residing in the same area.
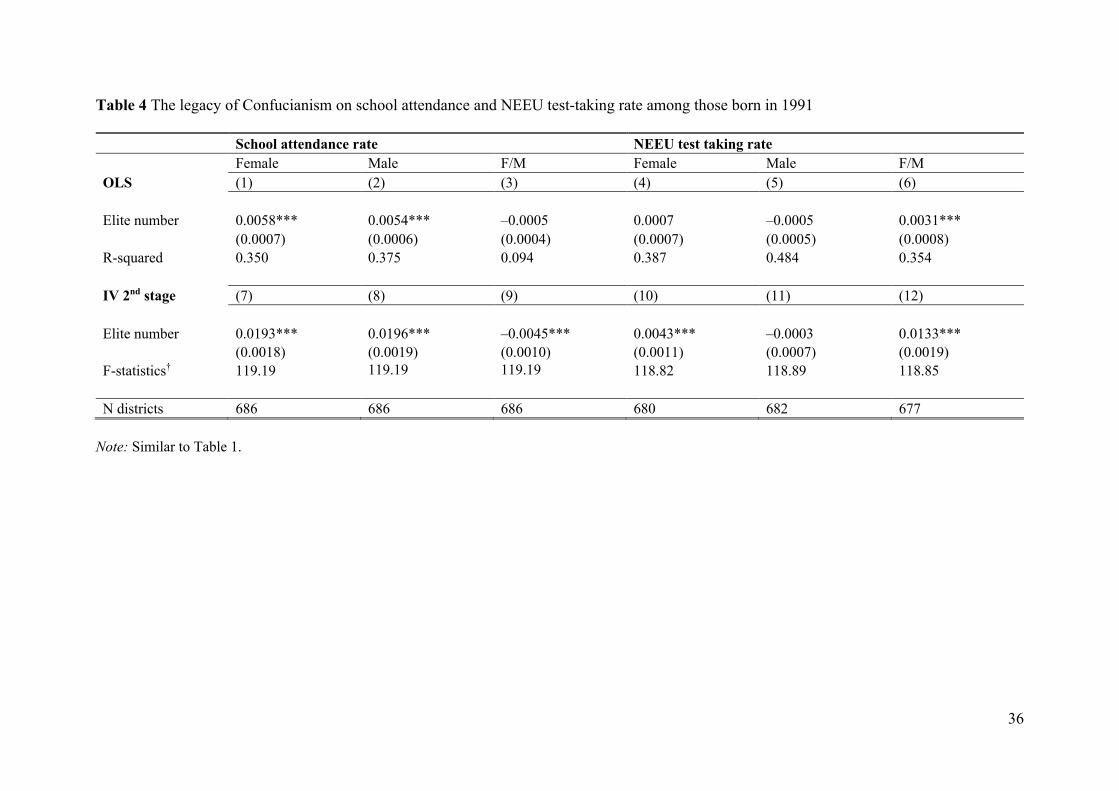
We specifically selected individuals born in 1991 to investigate arguably the most
important test in their life, the 2009 NEEU, which would determine their university placement
(Table 4). The test divides individuals into two different groups with significant differences in
years of schooling (4– 5 years or more, with a tertiary degree). For the outcome of school
attendance rate, the results were similar to those of the 15–17 age cohort. Boys in districts that
had been home to Confucian elites had the same probability of taking the 2009 NEEU as did
boys in non-elite districts. In contrast, girls had a 0.004 times higher probability of taking the
2009 NEEU in association with the presence of an additional elite (columns (10) and (11) in
Table 4). As a result, the relative female-to-male ratio favors girls by as much as 0.013 times.
The 2009 NEEU test fee was about USD 2 per test classification and the majority of
Vietnamese universities in 2009 were public institutions. To understand why girls in elite
district were more likely to take the NEEU in association with the number of Confucian elites
in their district, we investigated the 2009 NEEU test scores.
[Insert Table 4 here]

13
We found that coefficients of the number of Confucian elites tended to be higher in
samples of girls compared with those in samples of boys for classifications A, C, and D, as
shown in Table 5. In particular, differences in coefficients were magnified when female test
takers were the majority in the classification. The majority of NEEU test takers sat for
classifications A, C, and D. Therefore, we speculated that the higher probability of taking the
NEEU among girls in districts that were home to Confucian elites was likely due to self-
selection. Despite some gender discrimination resulting from district-based norms, girls in
these districts had better learning outcomes (educational quality) on average than their
counterparts in non-elite districts. This speculation may also apply to the results on relatively
lower school dropout rate, as shown in column (15) of Tables 2 and 3.
[Insert Table 5 here]
4.4 Robustness checks
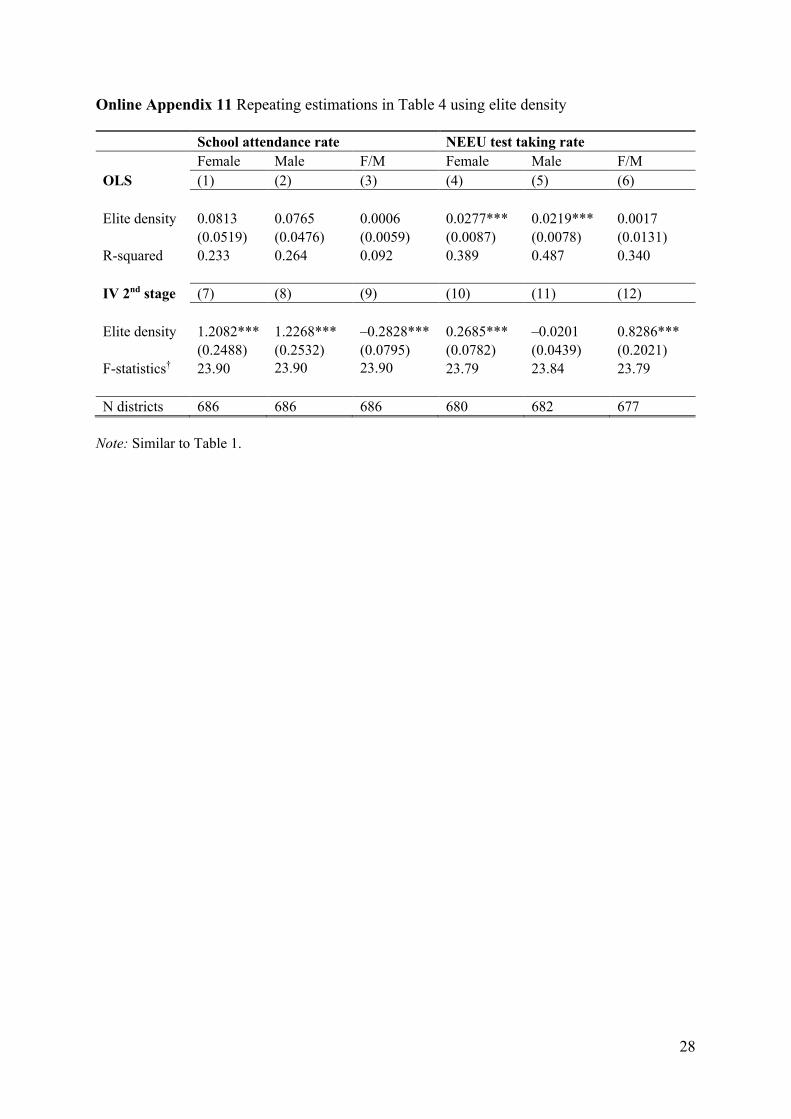
First, we replaced the number of elites per district with the density of elites per district
in square kilometers and repeated all the main estimations. In general, the results of the new
estimations were consistent with those of the original estimations, as shown in Online
Appendices 8–12. There were two exceptions corresponding to male educational outcomes,
namely, the subjects Geography and Foreign Language, as shown in Online Appendix 12. The
corresponding coefficients were statistically insignificant. In addition, we noted that boys in
elite districts performed worse in History compared with their counterparts in non-elite
districts, in association with elites according to either specification ("&$!%& or '&$!%& ).
Unfortunately, we did not have sufficient data about the families of the 2009 NEEU test takers
to adequately explain this specific statistical result. However, our interpretation of the sum of
scores should be valid regardless of these specific subject-related differences.
Second, we repeated the main estimations in Tables 1–5 using different assumptions
about the maximum distance. Specifically, we replaced 2272 km with 3000 and 4000 km as
alternatives. The corresponding coefficients of these alternatives were exactly the same as
those from the main estimations (Online Appendix 13).
Third, we were aware of spatial correlations (Kelly, 2019) and used a corresponding
method suggested by Colella et al. (2019). We repeated the estimations for several assumptions
about distance where spatial correlations may be most pronounced (namely 25, 50, and 100
km). A typical district with an area of 435 km2 is approximately equal to a circle with a radius

14
of 12 km. Therefore, a special correlation setting with 25 km would be a reasonable assumption
because this is the approximate distance between directly adjacent districts. The results with
the 25-km assumption (Online Appendix 14) were similar to our main results.
5. Conclusions and discussion
We examined whether there is a persistent effect of Confucianism, proxied by the
number (or density) of Confucian elites in a district, in gender inequality in present-day
Vietnam despite enormous changes in formal institutions over many years. We applied the
average distance from each district to the test venues as an instrumental variable. We found
that the legacy of Confucianism is still persistent in terms of sex ratio, literacy rate, school non-
enrollment rate, and years of schooling. Among the three channels of transmission suggested
by Becker et al. (2016), kinship and social interaction are the most likely explanations for the
observed outcomes. Meanwhile, we found an upside for girls, who are likely more determined
to attain more years of schooling, as evidenced by relatively lower school dropout rates, higher
likelihood of taking the NEEU, and higher NEEU test scores in association with the number of
Confucian elites in their district. This is perhaps the result of compensating for gender
discrimination. In addition, the results suggest that the legacy of Confucianism tends to be
weaker for younger age cohorts.
We acknowledge several limitations of our study. First, non-elite districts might have
applied Confucian practices at different levels; however, we considered all non-elite districts
to be of the same level. Second, the list of Confucian elites used in this study is the largest such
list presently available, but it is incomplete. Fourth, we could not adequately explain why boys
underperformed in Geography in association with the number (or density) of elites. These
limitations will be addressed in a future research scheme when more data and information are
available for analysis.
References
Alesina, A., & Fuchs-Schundeln, N. (2007). Good-bye Lenin (or not?): the effect of
communism on people’s preferences. American Economic Review, 97(4), 1507–1528.
https://doi.org/ 10.1257/aer.97.4.1507
15
Alesina, A., & Giuliano, P. (2015). Culture and institutions. Journal of Economic Literature,
53(4), 898–944. https://doi.org/10.1257/jel.53.4.898
Becker, S. O., Boeckh, K., Hainz, C., & Woessmann, L. (2016). The empire is dead, Long
live the empire! Long‐run persistence of trust and corruption in the bureaucracy. The
Economic Journal, 126(590), 40–74. https://doi.org/10.1111/ecoj.12220
Booth, A., Fan, E., Meng, X., & Zhang, D. (2018). Gender differences in willingness to
compete: the role of culture and institutions. Economic Journal.
https://doi.org/10.1111/ecoj.12583
Colella, F., Lalive, R., Sakalli, S. O., & Thoenig, M. (2019). Inference with arbitrary
clustering. IZA Discussion Paper Series, (12584), 1–15.
Das Gupta, M., Jiang, Z. H., Li, B. H., Xie, Z. M., Chung, W., & Hwa-Ok, B. (2003). Why is
son preference so persistent in East and South Asia? A cross-country study of China,
India and the Republic of Korea. Journal of Development Studies, 40(2), 153–187.
https://doi.org/10.1080/00220380412331293807
Goodkind, D. (1995). Rising inequality in Vietnam since reunification. Pacific Affairs, 68(3),
342–359. http://www.jstor.org/stable/2761129
Guilmoto, C. Z. (2012). Son preference, sex selection, and kinship in Vietnam. Population
and Development Review, 38(1), 31–54. https://www.jstor.org/stable/41857356
Kelly, M. (2019). The standard errors of persistence. UCD Centre for Economic Research
Working Paper Series, No. WP 19/13.
Meng, X., & Kidd, M. (1997). Labour market reform and the changing structure of wage
determination in China’s state sector during the 1980s. Journal of Comparative
Economics, 25(3), 403–21.
Ngo (2006). List of Vietnamese imperial elites 1075-1919 (“Các nhà khoa bảng Việt Nam”,
in Vietnamese). Edited by Ngo Duc Tho, Literature Publishing House: Hanoi.
Nguyen, H. M. (2005). Several documented imperial education at village and commune level
from recorded stelae (“Vài tư liệu về tình hình giáo dục Nho học ở cấp làng xã qua tư
16
liệu văn bia” in Vietnamese). Shino-Nom proceedings (“Tạp chí Hán Nôm” in
Vietnamese), 4(71).
Nguyen-Viet, T. A., & Imai, M. (2017). The effects of ethnic Chinese minority on Vietnam’s
regional economic development in the Post-Vietnam war period. Journal of
Development Studies, 59(9), 1680–1697.
https://doi.org/10.1080/00220388.2017.1393523
Rosenlee, LH. L. (2006). Confucianism and women - A philosophical interpretation (SUNY
series in Chinese philosophy and culture). Albany, New York: State University of New
York Press.
Tran, T. K. (1920). A brief history of Vietnam (Việt-Nam Sử-Lược, in Vietnamese), Edited
by Tran Trong Kim. Literature Publish, 2008: Hanoi, Vietnam.
Vu, T. M. (2014a). Are daughters always the losers in the chore war? Evidence using
household data from Vietnam. Journal of Development Studies, 50(4): 520–529.
https://doi.org/10.1080/00220388.2013.875535
Vu, T. M. (2014b). One male offspring preference: Evidence from Vietnam using a split-
population model. Review of Economics of the Household, 12(4), 689–715.
https://doi.org/10.1007/s11150-013-9183-z
Vu, T. M. (2019a). Effect of weather on human capital in Vietnam. AGI Working Paper
Series, 2019-01. Link: http://id.nii.ac.jp/1270/00000150/ (Last accessed April 1, 2020).
Vu, T. M. (2019b). Home appliances and gender gap of time spent on unpaid housework:
Evidence using household data from Vietnam. Singapore Economic Review, 64(1), 97–
114. https://doi.org/10.1142/S0217590817430019
Vu, T. M., & Yamada, H. (2018). Decomposing Vietnamese gender equality in terms of
wage distribution. Pacific Economic Review, 23(5), 705–731.
https://doi.org/10.1111/1468-0106.12269

17
Vu, T. M., & Yamada, H. (2020a). Persistent legacy of the 1075–1919 Vietnamese imperial
examinations in contemporary quantity and quality of education. AGI Working Paper
Series, 2020-12. Link: http://id.nii.ac.jp/1270/00000176/ (Last accessed June 10, 2020).
Vu, T. M., & Yamada, H. (2020b). Sex ratio and religion in Vietnam. AGI Working Paper
Series, 2020-03. Link: http://id.nii.ac.jp/1270/00000167/ (Last accessed June 10, 2020).
18
Online Appendix 1 Imperial examinations in Vietnam, 1075–1919
Year of exams
Dynasty Test venue Raw data
Province District Test times Elites
1075–1225 Ly Hanoi Ba Dinh 4 11
1232–1393 Tran Hanoi Ba Dinh 16 49
1400–1405 Ho Thanh Hoa Vinh Loc 3 11
1426–1526 Le Hanoi Ba Dinh 32 1,008
1529–1592 Mac Hanoi Ba Dinh 22 482
1554–1595 Le Thanh Hoa Tho Xuan 8 51
1598–1787 Le Hanoi Ba Dinh 64 723
1822–1919 Nguyen Thua Thien Hue Hue 39 553
Sum 188 2,888

19
Online Appendix 2 Number of elites and approximate territory expansion timelines
Notes:
The map is from Vu and Yamada (2020). The timeline for territory expansion is based on Tran (1920), used for constructing the instrumental variable only.

20
Online Appendix 3 Descriptive statistics of general indicators
Variable Mean Std. Dev. Min Max
Number of elites (Elite number) 4.1325 11.2106 0 98
Density of elites (Elite density) 0.0547 0.3444 0 7.7807
Instrumental variable (km) 999.96 845.57 23 2127
District population 126,227 87,751 83 701,194
District area (km2) 435 403 1.54 2679
Urban land rate 0.0228 0.1147 0 1
Cropland rate 0.4697 0.3165 0 1
Elevation mean (m) 216 310 1 1545
Distance to coastal line (km) 86 85 0.23 435
Nighttime light intensity 8.39 14.19 0 63
Sex ratio (< 5 years old) 1.0812 0.0432 0.7143 1.2583
Literate (11-33 years old)
Female (F) 0.9391 0.1026 0.3361 1
Male (M) 0.9606 0.0454 0.6382 1
Relative (F/M) 0.9748 0.0773 0.4594 1.0345
Years of schooling (22+)
Female (F) 7.1009 2.2856 2.8169 54.5
Male (M) 7.4859 1.6114 2.9309 13.7852
Relative (F/M) 0.9503 0.1402 0.7703 4.3077
Notes:
N = 687 districts

21
Online Appendix 4 Descriptive statistics of district data on educational outcomes
Variable N district Mean Std. Dev. Min Max
Panel A: 11-14 years old population
School attendance rate
Female (F) 687 0.8863 0.1018 0.3761 1
Male (M) 686 0.8775 0.0871 0.5235 0.9876
Relative (F/M) 686 1.0098 0.0655 0.5702 1.3626
School dropout rate
Female (F) 687 0.0903 0.0718 0 0.3175
Male (M) 686 0.1041 0.0723 0.0090 0.3171
Relative (F/M) 686 0.8302 0.2270 0.1972 1.9668
Never-enroll rate
Female (F) 687 0.0233 0.0496 0 0.4909
Male (M) 686 0.0183 0.0240 0 0.2430
Relative (F/M) 685 1.0026 0.6009 0 4.9914
Panel B: 15-17 years old population
School attendance rate
Female (F) 686 0.6593 0.1687 0.1643 0.9516
Male (M) 686 0.6100 0.1532 0.0909 0.9431
Relative (F/M) 686 1.0882 0.1754 0.3962 3.8824
School dropout rate
Female (F) 686 0.3105 0.1410 0.0460 0.7452
Male (M) 686 0.3692 0.1399 0.0542 0.9091
Relative (F/M) 686 0.8315 0.1502 0.4054 1.4544
Never-enroll rate
Female (F) 686 0.0301 0.0667 0 0.6025
Male (M) 686 0.0207 0.0278 0 0.3088
Relative (F/M) 684 1.1059 0.8043 0 7.1286
Panel C: 1991-born population
School attendance rate
Female (F) 686 0.5815 0.1881 0.1270 0.9299
Male (M) 686 0.5189 0.1714 0.1000 0.9220
Relative (F/M) 686 1.0660 0.1767 0.3016 2.1948
NEEU taken rate
Female (F) 680 0.5182 0.1552 0 0.9498
Male (M) 682 0.3739 0.1379 0 0.9485
Relative (F/M) 677 1.4805 0.4403 0 6

22
Online Appendix 5 Descriptive statistics of 2009 NEEU test scores by gender and test classification
Female Male
Variable Mean Std. Dev. Mean Std. Dev.
A classification
Z-score
Sum –0.0647 0.9617 0.0719 1.0362
Physics –0.0261 0.9721 0.0293 1.0294
Mathematics –0.0836 0.9721 0.0926 1.0221
Chemistry –0.0605 0.9577 0.0673 1.0408
No privilege 0.9063 0.2915 0.8926 0.3096
N 178,796 162,059
B classification
Z–score
Sum –0.0936 0.9759 0.1098 1.0167
Biology –0.0791 1.0055 0.0921 0.9857
Mathematics –0.0880 0.9659 0.1033 1.0291
Chemistry –0.0675 0.9559 0.0794 1.0438
No privilege 0.8988 0.3015 0.9069 0.2906
N 96,083 82,621
C classification
Z-score
Sum 0.0296 1.0098 –0.1319 0.9431
Literature 0.0940 0.9891 –0.4141 0.9388
History –0.0118 1.0023 0.0489 0.9870
Geography 0.0039 1.0082 –0.0170 0.9617
No privilege 0.8524 0.3547 0.8566 0.3505
N 41,420 9,301
D classification
Z–score
Sum –0.0003 1.0036 0.0032 0.9848
Literature 0.1081 0.9796 –0.4539 0.9569
Mathematics –0.0477 0.9793 0.2030 1.0594
Foreign language –0.0266 0.9849 0.1134 1.0544
No privilege 0.9424 0.2330 0.9546 0.2081
N 89,741 21,288

23
Online Appendix 6 Correlations between number of elites and the instrumental variable
Elite Number Number Number Number Density Density Density Density
(1) (2) (3) (4) (5) (6) (7) (8)
The instrumental variable –0.0073*** –0.0591** –0.0074*** –0.0525** –0.0001*** –0.0030*** –0.0001*** –0.0021*** (0.0008) (0.0255) (0.0007) (0.0230) (0.0000) (0.0010) (0.0000) (0.0006)
Other controls No No Yes Yes No No Yes Yes
Province FE Yes Yes Yes Yes
R-squared 0.239 0.584 0.371 0.620 0.056 0.242 0.204 0.365
Notes:
Other controls included the Kinh ethnic rate, nighttime light intensity, population density in 2009, urban land ratio and cropland ratio in 1992, mean elevation
in 1996, and distance to the coastline. Robust standard errors in parentheses (*** p < 0.01, ** p < 0.05, * p < 0.1). P-weight was in all estimations. N = 687.

24
Online Appendix 7 Correlations between density of present-day facilities and the instrumental variable
Education Health
Variables Secondary school High school University Hospital Clinic Communal health
station
(1) (2) (3) (4) (5) (6)
Without province FE
Instrumental variable –0.0000*** –0.0000*** –0.0000** –0.0000*** –0.0000** –0.0000*** (0.0000) (0.0000) (0.0000) (0.0000) (0.0000) (0.0000)
R-squared 0.617 0.178 0.368 0.137 0.047 0.615
With province FE
Instrumental variable –0.0000 0.0000 –0.0000 0.0000 0.0000 0.0000 (0.0000) (0.0000) (0.0000) (0.0000) (0.0000) (0.0000)
R-squared 0.685 0.312 0.491 0.266 0.289 0.756
Notes:
N = 687 districts. All estimations included the Kinh ethnic rate, nighttime light intensity, population density in 2009, urban land ratio and cropland ratio in
1992, mean elevation in 1996, and distance to the coastline. Outcomes were measured in density (per capita in 2009). Robust standard errors in parentheses (*** p < 0.01, ** p < 0.05, * p < 0.1). P-weight was in all estimations.

25
Online Appendix 8 Repeating estimations in Table 1 using elite density
Age cohort 0-4 11-33 22+
Variables Sex ratio Literate rate Years of schooling
M/F Female Male F/M Female Male F/M
OLS (1) (2) (3) (4) (5) (6) (7)
Elite density 0.0113 0.0043 0.0045 0.0001 0.8373* 0.7229* 0.0155** (0.0074) (0.0027) (0.0028) (0.0009) (0.4480) (0.4074) (0.0071)
R-squared 0.240 0.566 0.410 0.557 0.532 0.589 0.289
IV 2nd stage (8) (9) (10) (11) (12) (13) (14)
Elite density 0.1155*** 0.1084*** 0.1303*** –0.0246** 7.1748*** 8.1947*** –0.0778*** (0.0273) (0.0258) (0.0286) (0.0103) (1.3841) (1.6326) (0.0282)
F-statistics† 23.90 23.90 23.90 23.90 23.90 23.90 23.90
Notes:
Similar to Table 1. N = 687 districts

26
Online Appendix 9 Repeating estimations in Table 2 using elite density
School attendance rate School dropout rate Never-enroll rate
Female Male F/M Female Male F/M Female Male F/M
OLS (1) (2) (3) (4) (5) (6) (7) (8) (9)
Elite density 0.0294* 0.0291 0.0002 –0.0270* –0.0271 –0.0373* –0.0024* –0.0021 0.0148 (0.0175) (0.0178) (0.0013) (0.0162) (0.0166) (0.0224) (0.0014) (0.0013) (0.0258)
R-squared 0.233 0.165 0.301 0.153 0.144 0.196 0.428 0.286 0.428
IV 2nd stage (10) (11) (12) (13) (14) (15) (16) (17) (18)
Elite density 0.5375*** 0.6347*** –0.1292*** –0.5027*** –0.5711*** –0.2435*** –0.0356*** –0.0645*** 0.6892*** (0.1134) (0.1340) (0.0308) (0.1059) (0.1204) (0.0853) (0.0094) (0.0142) (0.1906)
F-statistics† 23.90 23.90 23.90 23.90 23.90 23.90 23.90 23.90 23.90
N districts 687 686 686 687 686 686 687 686 685
Note: Similar to Table 1.

27
Online Appendix 10 Repeating estimations in Table 3 using elite density
School attendance rate School dropout rate Never-enroll rate
Female Male F/M Female Male F/M Female Male F/M
OLS (1) (2) (3) (4) (5) (6) (7) (8) (9)
Elite density 0.0656 0.0628 0.0029 –0.0624 –0.0601 0.0100 –0.0032* –0.0027 –0.02659 (0.0419) (0.0395) (0.0058) (0.0403) (0.0378) (0.0202) (0.0018) (0.0018) (0.0217)
R-squared 0.233 0.246 0.272 0.181 0.232 0.264 0.438 0.258 0.420
IV 2nd stage (10) (11) (12) (13) (14) (15) (16) (17) (18)
Elite density 1.0177*** 1.0988*** –0.2697*** –0.9710*** –1.0178*** –0.1802** –0.0474*** –0.0817*** 0.9571*** (0.2116) (0.2288) (0.0710) (0.2019) (0.2116) (0.0770) (0.0126) (0.0180) (0.2606)
F-statistics† 23.90 23.90 23.90 23.90 23.90 23.90 23.90 23.90 23.90
N districts 686 686 686 686 686 686 686 686 684
Note: Similar to Table 1.
28
Online Appendix 11 Repeating estimations in Table 4 using elite density
School attendance rate NEEU test taking rate
Female Male F/M Female Male F/M
OLS (1) (2) (3) (4) (5) (6)
Elite density 0.0813 0.0765 0.0006 0.0277*** 0.0219*** 0.0017 (0.0519) (0.0476) (0.0059) (0.0087) (0.0078) (0.0131)
R-squared 0.233 0.264 0.092 0.389 0.487 0.340
IV 2nd stage (7) (8) (9) (10) (11) (12)
Elite density 1.2082*** 1.2268*** –0.2828*** 0.2685*** –0.0201 0.8286*** (0.2488) (0.2532) (0.0795) (0.0782) (0.0439) (0.2021)
F-statistics† 23.90 23.90 23.90 23.79 23.84 23.79
N districts 686 686 686 680 682 677
Note: Similar to Table 1.

29
Online Appendix 12 Repeating estimations in Table 5 using elite density
Classification A B
Variables Sum Physics Mathematics Chemistry Sum Biology Mathematics Chemistry
Female sample (1) (2) (3) (4) (5) (6) (7) (8)
Elite density 1.2107*** 1.4623*** 0.6556*** 1.0561*** 1.8797*** 0.0670 2.5268*** 1.4805*** (0.3550) (0.4239) (0.2025) (0.3105) (0.3766) (0.1048) (0.4997) (0.3033)
F–statistics† 12.23 12.23 12.23 12.23 26.79 26.79 26.79 26.79
N test takers 178,796 178,796 178,796 178,796 96,083 96,083 96,083 96,083
Male sample (9) (10) (11) (12) (13) (14) (15) (16)
Elite density 0.8553*** 0.8748*** 0.5116*** 0.8779*** 1.7958*** –0.2493** 2.3224*** 1.7951*** (0.2687) (0.2731) (0.1676) (0.2754) (0.4273) (0.0970) (0.5479) (0.4247)
F–statistics† 10.55 10.55 10.55 10.55 18.72 18.72 18.72 18.72
N test takers 162,059 162,059 162,059 162,059 82,621 82,621 82,621 82,621
Classification C D
Variables Sum Literature History Geography Sum Literature Mathematics Foreign language
Female sample (17) (18) (19) (20) (21) (22) (23) (24)
Elite density 2.8123*** 4.7486*** 0.8923*** 1.6106*** 1.0279*** 1.5325*** 0.7247*** 0.1955** (0.4477) (0.7047) (0.2518) (0.3206) (0.3601) (0.5345) (0.2573) (0.0818)
F–statistics† 48.84 48.84 48.84 48.84 8.10 8.10 8.10 8.10
N test takers 41,420 41,420 41,420 41,420 89,741 89,741 89,741 89,741
Male sample (25) (26) (27) (28) (29) (30) (31) (32)
Elite density 0.3823* 2.4610*** –0.7489*** –0.3248 0.4747** 0.6305** 0.5152** –0.1057 (0.1985) (0.5813) (0.2696) (0.1983) (0.1843) (0.2485) (0.2067) (0.0651)
F–statistics† 20.91 20.91 20.91 20.91 6.23 6.23 6.23 6.23
N test takers 9,301 9,301 9,301 9,301 21,288 21,288 21,288 21,288
Note:
Similar to Table 5.

30
Online Appendix 13 Effects on present-day relative ratio accounting for different maximum distance when constructing the IV
Age 0-4 11-33 11-14 15-17 1991-born 22+
Variables Sex ratio Literate rate
Attendance Dropout Never-enroll
Attendance Dropout Never-enroll
Attendance NEEU test taking
Years of schooling
(1) (2) (3) (4) (5) (6) (7) (8) (9) (10) (11)
Max = 3000km Elite
number 0.0018***
–
0.0004***
–
0.0021*** –0.0039*** 0.0110***
–
0.0043***
–
0.0029*** 0.0153***
–
0.0045*** 0.0133***
–
0.0012***
(0.0002) (0.0001) (0.0003) (0.0011) (0.0022) (0.0008) (0.0010) (0.0029) (0.0010) (0.0019) (0.0003) Max = 4000km
Elite
number 0.0018***
–
0.0004***
–
0.0021***
–
0.0039*** 0.0110***
–
0.0043***
–
0.0029*** 0.0153***
–
0.0045*** 0.0133***
–
0.0012*** (0.0002) (0.0001) (0.0003) (0.0011) (0.0022) (0.0008) (0.0010) (0.0029) (0.0010) (0.0019) (0.0003)
N districts 687 687 686 686 685 686 686 684 686 677 687

31
Online Appendix 14 Effects on present-day relative ratio accounting for spatial correlations
Age 0-4 11-33 11-14 15-17 1991-born 22+
Variables Sex ratio Literate
rate Attendance Dropout
Never-
enroll Attendance Dropout
Never-
enroll Attendance
NEEU test
taking
Years of
schooling
(1) (2) (3) (4) (5) (6) (7) (8) (9) (10) (11)
Cutoff = 25km
Elite
number 0.0018*** –0.0004**
–
0.0021***
–
0.0039*** 0.0110***
–
0.0043*** –0.0029** 0.0153***
–
0.0045*** 0.0133*** –0.0012**
(0.0003) (0.0002) (0.0005) (0.0013) (0.0031) (0.0012) (0.0012) (0.0043) (0.0013) (0.0032) (0.0006)
Cutoff = 50km
Elite number
0.0018*** –0.0004 –0.0021***
–0.0039** 0.0110*** –0.0043** –0.0029** 0.0153*** –0.0045** 0.0133*** –0.0012
(0.0003) (0.0003) (0.0007) (0.0016) (0.0042) (0.0017) (0.0015) (0.0056) (0.0019) (0.0042) (0.0008)
Cutoff = 100km
Elite
number 0.0018*** –0.0004
–
0.0021*** –0.0039* 0.0110** –0.0043** –0.0029** 0.0153** –0.0045* 0.0133*** –0.0012*
(0.0003) (0.0004) (0.0008) (0.0021) (0.0052) (0.0020) (0.0017) (0.0067) (0.0024) (0.0048) (0.0007)
N districts 687 687 686 686 685 686 686 684 686 677 687

32
Online Appendix 15 The legacy of Confucianism on child mortality using the IV approach
and a 3% sample of the 1999 Population and Housing Census
(1) (2)
Elite number –0.0002** –0.0004*** (0.0001) (0.0001)
F-statistics† 69.05 90.75
Other controls No Yes
Notes:
Similar to Table 1. N = 535 districts. We used only consistent districts matched between administration divisions in 1999 and 2009.

33
Table 1 The legacy of Confucianism on sex ratio, literacy rate, and years of schooling
Age cohort 0-4 11-33 22+
Sex ratio Literate rate Years of schooling
M/F Female Male F/M Female Male F/M
OLS (1) (2) (3) (4) (5) (6) (7)
Elite number 0.0011*** 0.0003*** 0.0005*** –0.0002*** 0.0306*** 0.0339*** –0.0002 (0.0001) (0.0001) (0.0001) (0.0001) (0.0050) (0.0048) (0.0002)
R-squared 0.351 0.568 0.433 0.558 0.550 0.623 0.279
IV 2nd stage (8) (9) (10) (11) (12) (13) (14)
Elite number 0.0018*** 0.0017*** 0.0021*** –0.0004*** 0.1147*** 0.1310*** –0.0012*** (0.0002) (0.0003) (0.0002) (0.0001) (0.0114) (0.0128) (0.0003)
F-statistics† 119.19 119.19 119.19 119.19 119.19 119.19 119.19
Notes: † Kleibergen-Paap Wald rk F statistic for testing H0: Weak identification test.
Robust standard errors in parentheses (*** p < 0.01, ** p < 0.05, * p < 0.1). P-weight was in all estimations.
Other controls were the Kinh ethnic rate, nighttime light intensity, population density in 2009, urban land ratio and cropland ratio in 1992, mean elevation in
1996, and distance to the coastline in every estimation. N = 687.

34
Table 2 The legacy of Confucianism on pursuing education among the 11–14 age cohort
School attendance rate School dropout rate Never-enroll rate
Female Male F/M Female Male F/M Female Male F/M
OLS (1) (2) (3) (4) (5) (6) (7) (8) (9)
Elite number 0.0024*** 0.0026*** –0.0003*** –0.0023*** –0.0024*** –0.0028*** –0.0001*** –0.0002*** 0.0019* (0.0003) (0.0003) (0.0001) (0.0003) (0.0003) (0.0006) (0.0000) (0.0000) (0.0011)
R-squared 0.320 0.289 0.308 0.278 0.285 0.220 0.430 0.304 0.431
IV 2nd stage (10) (11) (12) (13) (14) (15) (16) (17) (18)
Elite number 0.0086*** 0.0101*** –0.0021*** –0.0080*** –0.0091*** –0.0039*** –0.0006*** –0.0010*** 0.0110*** (0.0008) (0.0010) (0.0003) (0.0008) (0.0009) (0.0011) (0.0001) (0.0001) (0.0022)
F-statistics† 119.19 119.19 119.19 119.19 119.19 119.19 119.19 119.19 119.19
N districts 687 686 686 687 686 686 687 686 685
Note: Similar to Table 1.
35
Table 3 The legacy of Confucianism on pursuing education among the 15–17 age cohort
School attendance rate School dropout rate Never-enroll rate
Female Male F/M Female Male F/M Female Male F/M
OLS (1) (2) (3) (4) (5) (6) (7) (8) (9)
Elite number 0.0049*** 0.0048*** –0.0005 –0.0048*** –0.0046*** –0.0024*** –0.0002*** –0.0003*** 0.0024* (0.0006) (0.0006) (0.0004) (0.0005) (0.0006) (0.0007) (0.0000) (0.0000) (0.0013)
R-squared 0.342 0.362 0.275 0.309 0.351 0.296 0.439 0.281 0.422
IV 2nd stage (10) (11) (12) (13) (14) (15) (16) (17) (18)
Elite number 0.0163*** 0.0176*** –0.0043*** –0.0155*** –0.0163*** –0.0029*** –0.0008*** –0.0013*** 0.0153*** (0.0015) (0.0017) (0.0008) (0.0015) (0.0016) (0.0010) (0.0001) (0.0001) (0.0029)
F-statistics† 119.19 119.19 119.19 119.19 119.19 119.19 119.19 119.19 119.19
N districts 686 686 686 686 686 686 686 686 684
Note: Similar to Table 1.
36
Table 4 The legacy of Confucianism on school attendance and NEEU test-taking rate among those born in 1991
School attendance rate NEEU test taking rate
Female Male F/M Female Male F/M
OLS (1) (2) (3) (4) (5) (6)
Elite number 0.0058*** 0.0054*** –0.0005 0.0007 –0.0005 0.0031*** (0.0007) (0.0006) (0.0004) (0.0007) (0.0005) (0.0008)
R-squared 0.350 0.375 0.094 0.387 0.484 0.354
IV 2nd stage (7) (8) (9) (10) (11) (12)
Elite number 0.0193*** 0.0196*** –0.0045*** 0.0043*** –0.0003 0.0133*** (0.0018) (0.0019) (0.0010) (0.0011) (0.0007) (0.0019)
F-statistics† 119.19 119.19 119.19 118.82 118.89 118.85
N districts 686 686 686 680 682 677
Note: Similar to Table 1.

37
Table 5 The legacy of Confucianism on 2009 NEEU z-scores by gender using the IV approach
Classification A B
Variables Sum Physics Mathematics Chemistry Sum Biology Mathematics Chemistry
Female sample (1) (2) (3) (4) (5) (6) (7) (8)
Elite number 0.0241*** 0.0291*** 0.0130*** 0.0210*** 0.0224*** 0.0008 0.0301*** 0.0176*** (0.0023) (0.0027) (0.0016) (0.0021) (0.0024) (0.0012) (0.0030) (0.0020)
F–statistics† 134.09 134.09 134.09 134.09 127.24 127.24 127.24 127.24
N test takers 178,796 178,796 178,796 178,796 96,083 96,083 96,083 96,083
Male sample (9) (10) (11) (12) (13) (14) (15) (16)
Elite number 0.0190*** 0.0194*** 0.0114*** 0.0195*** 0.0256*** –0.0036*** 0.0332*** 0.0256*** (0.0020) (0.0020) (0.0015) (0.0020) (0.0025) (0.0012) (0.0031) (0.0025)
F–statistics† 134.08 134.08 134.08 134.08 135.27 135.27 135.27 135.27
N test takers 162,059 162,059 162,059 162,059 82,621 82,621 82,621 82,621
Classification C D
Variables Sum Literature History Geography Sum Literature Mathematics Foreign language
Female sample (17) (18) (19) (20) (21) (22) (23) (24)
Elite number 0.0260*** 0.0439*** 0.0083*** 0.0149*** 0.0319*** 0.0476*** 0.0225*** 0.0061*** (0.0030) (0.0043) (0.0022) (0.0025) (0.0036) (0.0050) (0.0027) (0.0017)
F–statistics† 123.44 123.44 123.44 123.44 115.41 115.41 115.41 115.41
N test takers 41,420 41,420 41,420 41,420 89,741 89,741 89,741 89,741
Male sample (25) (26) (27) (28) (29) (30) (31) (32)
Elite number 0.0049** 0.0313*** –0.0095*** –0.0041* 0.0243*** 0.0322*** 0.0263*** –0.0054** (0.0023) (0.0035) (0.0027) (0.0024) (0.0032) (0.0044) (0.0035) (0.0022)
F-statistics† 146.11 146.11 146.11 146.11 79.16 79.16 79.16 79.16
N test takers 9,301 9,301 9,301 9,301 21,288 21,288 21,288 21,288
Notes:
† Kleibergen-Paap Wald rk F statistic for testing H0: Weak identification test. Robust district clustered standard errors in parentheses (*** p < 0.01, ** p <
0.05, * p < 0.1). Other controls were !"$%&'&()*), the Kinh ethnic ratio, 2009 nighttime light intensity, 2009 population density, 1992 urban land ratio and
1992 cropland ratio, 1996 mean elevation, and distance to the coastline in every estimation.