ORIGINAL RESEARCH
The immediate effects of a single bout of aerobic exerciseon oral glucose tolerance across the glucose tolerancecontinuumSine H. Knudsen1, Kristian Karstoft1, Bente K. Pedersen1, Gerrit van Hall2,3 &Thomas P. J. Solomon1,3
1 Department of Infectious Diseases, The Centre of Inflammation and Metabolism and the Centre for Physical Activity Research, Rigshospitalet,
University of Copenhagen, Copenhagen, Denmark
2 Clinical Metabolomics Core Facility, Rigshospitalet, University of Copenhagen, Copenhagen, Denmark
3 Department of Biomedical Sciences, Panum Institute, University of Copenhagen, Copenhagen, Denmark
Keywords
Glucose kinetics, oral glucose tolerance test,
physical activity, type 2 diabetes.
Correspondence
Thomas P. J. Solomon, Department of
Biomedical Sciences, University of
Copenhagen, Blegdamsvej 3B, Panum
Institute 4.5.13, Copenhagen 2200, Denmark.
Tel: (+45) 23 64 89 10
E-mail: [email protected]
Funding Information
This study was funded by a Paul Langerhans
Program Grant from the European Foundation
for the Study of Diabetes (T. P. J. S.). The
Centre of Inflammation and Metabolism (CIM)
is supported by a grant from the Danish
National Research Foundation (DNRF55). The
Centre for Physical Activity Research (CFAS) is
supported by a grant from Trygfonden. CIM is
part of the UNIK Project: Food, Fitness &
Pharma for Health and Disease, supported by
the Danish Ministry of Science, Technology,
and Innovation. CIM is a member of DD2 – the
Danish Center for Strategic Research in type 2
diabetes (the Danish Council for Strategic
Research, grant no. 09-067009 and
09-075724).
Received: 9 May 2014; Revised: 18 July
2014; Accepted: 21 July 2014
doi: 10.14814/phy2.12114
Physiol Rep, 2 (8), 2014, e12114,
doi: 10.14814/phy2.12114
Abstract
We investigated glucose tolerance and postprandial glucose fluxes immediately
after a single bout of aerobic exercise in subjects representing the entire glu-
cose tolerance continuum. Twenty-four men with normal glucose tolerance
(NGT), impaired glucose tolerance (IGT), or type 2 diabetes (T2D; age:
56 � 1 years; body mass index: 27.8 � 0.7 kg/m2, P > 0.05) underwent a
180-min oral glucose tolerance test (OGTT) combined with constant intrave-
nous infusion of [6,6-2H2]glucose and ingestion of [U-13C]glucose, following
1 h of exercise (50% of peak aerobic power) or rest. In both trials, plasma
glucose concentrations and kinetics, insulin, C-peptide, and glucagon were
measured. Rates (mg kg�1 min�1) of glucose appearance from endogenous
(RaEndo) and exogenous (oral glucose; RaOGTT) sources, and glucose disappear-
ance (Rd) were determined. We found that exercise increased RaEndo, RaOGTT,
and Rd (all P < 0.0001) in all groups with a tendency for a greater (~20%)
peak RaOGTT value in NGT subjects when compared to IGT and T2D subjects.
Accordingly, following exercise, the plasma glucose concentration during the
OGTT was increased in NGT subjects (P < 0.05), while unchanged in subjects
with IGT and T2D. In conclusion, while a single bout of moderate-intensity
exercise increased the postprandial glucose response in NGT subjects, glucose
tolerance following exercise was preserved in the two hyperglycemic groups.
Thus, postprandial plasma glucose responses immediately following exercise
are dependent on the underlying degree of glycemic control.
ª 2014 The Authors. Physiological Reports published by Wiley Periodicals, Inc. on behalf of
the American Physiological Society and The Physiological Society.
This is an open access article under the terms of the Creative Commons Attribution License,
which permits use, distribution and reproduction in any medium, provided the original work is properly cited.
2014 | Vol. 2 | Iss. 8 | e12114Page 1
Physiological Reports ISSN 2051-817X
Introduction
Glycemic control is key in the management of type 2 dia-
betes (T2D), with postprandial glucose proposed as a
better predictor of diabetes-related complications than
fasting blood glucose or HbA1c (Cavalot et al. 2011).
Therefore, studying postprandial glucose fluctuations has
high physiological and clinical relevance. Aerobic exercise
is prescribed clinically to prevent and treat T2D because
it improves glycemic control (Church et al. 2010) and
insulin sensitivity (Coker et al. 2009; Slentz et al. 2011) in
obese and hyperglycemic individuals. However, exercise
training is commonly accompanied by improvements in
aerobic fitness and weight loss which independently influ-
ence glucose metabolism (Ivy 1997; Coker et al. 2009). A
single bout of aerobic exercise, that does not alter fitness
or body composition, is sufficient to increase insulin sen-
sitivity both in healthy (Richter et al. 1989), prediabetic
(Devlin and Horton 1985), and T2D subjects (Burstein
et al. 1990; Bordenave et al. 2008). Nonetheless, the spe-
cific effect of a single exercise bout on postprandial glyce-
mic control is far less consistent (Nazar et al. 1987;
Rogers et al. 1988; Pestell et al. 1993; King et al. 1995;
Larsen et al. 1997; Bonen et al. 1998; Baynard et al. 2005;
Venables et al. 2007; van Dijk et al. 2013; Gonzalez et al.
2013; Roberts et al. 2013; Oberlin et al. 2014; Rynders
et al. 2014) likely due to between-study differences in the
subject populations studied, the pre-exercise nutritional
state, the exercise modality, and/or the method and tim-
ing of the postprandial measure following exercise.
In healthy individuals, postprandial glucose tolerance
has been shown to be increased, unchanged, or decreased
in the hours after a single bout of aerobic exercise (Nazar
et al. 1987; Pestell et al. 1993; King et al. 1995; Bonen
et al. 1998; Rose et al. 2001; Roberts et al. 2013). In con-
trast, in prediabetic and T2D subjects postprandial glu-
cose tolerance after a single bout of exercise has been
found to be improved in some studies (Nazar et al. 1987;
Oberlin et al. 2014; Rynders et al. 2014), while unchanged
in others (Rogers et al. 1988; Larsen et al. 1997; Baynard
et al. 2005; Venables et al. 2007), but a deterioration of
oral glucose tolerance immediately following exercise has
never been found. As such, it appears that the immediate
effect of a single bout of exercise on postprandial plasma
glucose levels differ between healthy and diabetic subpop-
ulations suggesting that it may be dependent on the sub-
ject’s underlying glycemic state. However, this has never
been systematically investigated.
Determining exogenous and endogenous glucose flux
in the postprandial period will add a mechanistic under-
standing of the above-described observations. Therefore,
in the current study we investigated the immediate effects
of a single bout of moderate-intensity aerobic exercise on
glucose kinetics during an oral glucose tolerance test, in
age- and body mass index (BMI)-matched groups repre-
senting the entire glucose tolerance continuum: normal
glucose tolerance (NGT), impaired glucose tolerance
(IGT), and T2D. We hypothesized that the effect of a sin-
gle bout of exercise on plasma glucose kinetics following
oral glucose ingestion would be influenced by the sub-
ject’s underlying level of oral glucose tolerance.
Methods
Subjects
Twenty-four male subjects were recruited from the local
area and were screened with a medical history and physi-
cal examination, blood chemistry analyses, and an oral
glucose tolerance test (OGTT). Subjects were stratified as
having NGT (n = 8), IGT (n = 8), or T2D (n = 8), based
on WHO definitions (WHO & IDF Consultation 2006).
Subjects were recruited with the intention to match the
three groups for age and BMI. Data from NGT and T2D
subjects – that are unrelated to the primary aim of this
study – have been published previously (Knudsen et al.
2013). Individuals were included for participation if they
were between 45 and 65 years old and had BMI between
25 and 35 kg/m2, and excluded from participation if
they (1) were treated with insulin; (2) had unstable
weight (>5 kg in previous 6 months); (3) had an illness
that contraindicated physical activity; or (4) demon-
strated any evidence of current or previous hematological,
renal, hepatic, cardiovascular, or pulmonary disease. All
enrolled subjects underwent a dual-energy x-ray absorpti-
ometry (DXA) scan to determine whole-body adiposity
and fat-free mass. All DXA images were analyzed by the
same investigator using Encore 2004 software (GE Medi-
cal Systems Lunar Prodigy, Fairfield, CT). Subjects also
performed an exercise test on a bicycle ergometer (Mon-
ark 839E; Monark, Varberg, Sweden) to determine maxi-
mal aerobic capacity (VO2max) with indirect calorimetry
(Cosmed Quark b2, Rome, Italy) reflecting fitness level,
as well as maximal power output (Watt [W]max) and
heart rate (HRmax) to calculate individual exercise work-
loads. Furthermore, subjects filled out a questionnaire
reflecting habitual activity level modified from The
Minnesota Leisure Time Physical Activity Questionnaire
(Taylor et al. 1978). The study was approved by the
Scientific Ethics Committee of the capital Region of
Denmark (file no. H-3-2010-127) in accordance with the
Helsinki Declaration, and subjects gave oral and written
consent to participate. Also, the study was registered on
www.clinicaltrials.gov (NCT01607931).
2014 | Vol. 2 | Iss. 8 | e12114Page 2
ª 2014 The Authors. Physiological Reports published by Wiley Periodicals, Inc. on behalf of
the American Physiological Society and The Physiological Society.
Aerobic Exercise and Glucose Tolerance S. H. Knudsen et al.

Design
On two occasions, separated by a minimum of 14 days,
each subject underwent a 180-min OGTT immediately
following an hour of exercise (exercise trial) or rest (rest
trial) in a randomized order. Exogenous and endogenous
glucose kinetics were measured during the OGTT. Exer-
cise was performed as 1 h of cycle ergometry at 50% of
Wmax and 60–90 rounds per minute (rpm). Power output
was fixed during the entire trial. Heart rate was measured
continuously and all trials were supervised by the same
study investigator. For 3 days, prior to each trial, subjects
were instructed by the same study investigator to com-
plete diet records to ensure that daily energy intake (mea-
sured as the mean number of calories consumed per day
during the 3 days prior to each trial) and daily macronu-
trient composition (measured as the mean percentage of
energy derived from carbohydrate, fat or protein ingestion
during the 3 days) were not different between trials. Diet
records were analyzed by the same investigator using
DanKost Sport 2000 software (Danish Catering Centre,
Herlev, Denmark). During the three pretrial days, subjects
were also instructed to refrain from physical activity and
to pause any antidiabetic (metformin [n = 7], DPP4
inhibitors [n = 1], and sulfonylureas [n = 1]), antihyper-
tensive (n = 3), or statin drugs (n = 7).
Experimental protocol
Each trial was performed after an overnight fast
(~10 h). When arriving in the laboratory, catheters were
placed in an antecubital vein in each arm – one for
blood sampling and one for tracer infusion. Baseline
blood samples were drawn at T = �90 min and a
primed (30 lmol/kg multiplied by fasting plasma glu-
cose/5), continuous (0.3 lmol kg�1 min�1) infusion of
[6,6-2H2]glucose began. During the exercise trial, exer-
cise was commenced at T = �60 min. Immediately after
rest/exercise at T = 0 min, a 180-min OGTT was started
by ingestion of a 300-mL solution containing 73 g of
anhydrous glucose and 2 g of [U-13C]glucose. Sterility
and pyrogen-tested tracers were purchased from Cam-
bridge Isotope Laboratories (Cambridge, MA) and pre-
pared on the day of the test under aseptic conditions.
Blood samples were collected at T = �90, �60, �30,
0 min and every 10 min during OGTT for determina-
tion of plasma glucose and tracer enrichment, and every
30 min for the measurement of serum insulin, C-pep-
tide, and plasma glucagon. Venous blood was collected
into the following tubes: heparin syringes for glucose
analyses; Vacuettes (Becton-Dickinson, Franklin Lakes,
NJ) containing sodium fluoride for glucose enrichment
analyses, Vacuettes containing EDTA and 10,000 kiU/mL
aprotinin for glucagon analyses; and serum-separation
Vacuettes for insulin and C-peptide analyses. Blood
samples for plasma collection were immediately placed
on ice and subsequently centrifuged (3500g, 15 min,
4°C), and the plasma was separated and stored at
�80°C until analyses. Samples for serum collection were
allowed to clot at room temperature for 30 min before
centrifugation and subsequently sent for insulin and
C-peptide analysis at the Department of Clinical
Biochemistry at Rigshospitalet.
Measurements
Plasma glucose was measured by the glucose-oxidase
method (ABL 700; Radiometer, Brønshøj, Denmark).
Serum insulin and C-peptide were determined by electro-
chemiluminescence immunoassay (E-Modular; Roche,
Basel, Switzerland). Plasma glucagon concentrations were
determined by radioimmunoassay (RIA; Millipore, MI).
Plasma adrenaline and noradrenaline concentrations were
determined by RIA (LND, Nordhorn, Germany). Plasma
[6,6-2H2]glucose and [U-13C]glucose enrichments were
quantified using liquid chromatography tandem mass
spectrometry (API 3000 LC/MS/MS System; Applied Bio-
systems, Foster City, CA) using a hexobenzoyl derivatiza-
tion method, as described previously (Oehlke et al. 1994).
Calculations
Glucose, insulin, C-peptide, and glucagon responses were
calculated as area under the curve (AUC) during rest/
exercise (T = �90 to 0 min) and during OGTT (T = 0 to
180 min). The initial insulin and C-peptide responses
during the OGTT were determined as the incremental
response during the first 15 min (Gerich 2002), calculated
as delta of T = 0 and T = 15 (D0–15 min). Glucose
kinetics were calculated using a nonsteady state single-
pool model as described previously (Steele 1959; Wolfe
and Chinkes 2005). Total rate of glucose appearance
(RaTotal) and disappearance (Rd) were determined from
plasma [6,6-2H2]glucose enrichment. Rate of exogenous
oral glucose appearance (RaOGTT) was determined from
plasma [U-13C]glucose enrichment (Proietto 1990). Rate
of endogenous glucose appearance (RaEndo) was calculated
as the difference between total Ra and RaOGTT. The post-
prandial suppression of RaEndo was determined as the
incremental response during the first 20 min, calculated
as delta of T = 0 and T = 20 (D0–20 min). Glucose clear-
ance during rest/exercise (T = �90 to 0 min) and during
OGTT (T = 0–180 min) was determined as Rd divided by
plasma glucose.
ª 2014 The Authors. Physiological Reports published by Wiley Periodicals, Inc. on behalf ofthe American Physiological Society and The Physiological Society.
2014 | Vol. 2 | Iss. 8 | e12114Page 3
S. H. Knudsen et al. Aerobic Exercise and Glucose Tolerance
Statistics
One-way analysis of variance (ANOVA) was used to com-
pare between-group baseline characteristics and AUC
measures. Bonferroni post hoc tests were used to examine
differences between group means. Two-way repeated
measures ANOVA was used to compare time and trial
differences in total responses of plasma metabolites and
glucose kinetics as well as pre-/post-exercise catechol-
amine levels within and between groups. Bonferroni post
hoc tests were used to examine differences between trial
means. Paired t-tests were used to compare D and AUC
values from control and exercise trial within groups. All
data are presented as mean � SEM. All analyses were
conducted using Prism v4 (GraphPad Software, San
Diego, CA) and statistical significance was accepted when
P < 0.05.
Results
Subjects
Subject characteristics are presented in Table 1. Subjects
with NGT, IGT, and T2D were not significantly different
with respect to age and BMI; however, fat-free mass was
higher in NGT subjects compared to IGT (P = 0.05).
Fasting glucose levels were highest in subjects with T2D
(P < 0.05), and 2-h OGTT glucose values were progres-
sively higher across the groups (NGT < IGT < T2D,
P < 0.05, �P < 0.0001). Furthermore, groups did not dif-
fer in habitual activity levels or VO2max corrected for
fat-free mass.
Diet
Daily energy intake and dietary macronutrient composi-
tion is shown in Table 2. No significant differences were
detected by ANOVA or t-tests between any of the groups
or between trials.
Exercise
All subjects finished the 1 h of cycle ergometry exercise
and exercise data are presented in Table 3. Exercise was
performed at 49.7 � 0.5% of Wmax at 60–90 rpm with a
mean heart rate of 116.5 � 3.7 beats per minute (bpm)
for all groups. Exercise intensity (% of Wmax) was not dif-
ferent between groups.
Plasma glucose
Fasting glucose values were not different between trials in
any of the groups (Fig. 1A, P > 0.05). During exercise,
plasma glucose (absolute values and AUC) was increased
in the NGT group (Fig. 1A, P < 0.05 for both) while
decreased in IGT subjects (Fig. 1A, P < 0.01 and
P < 0.001, respectively). Furthermore, in subjects with
T2D glucose levels tended to be lower immediately after
exercise compared to baseline (T = �90: 8.9 � 1.1 vs.
T = 0: 7.6 � 0.9 mmol/L, P = 0.08). Two-way repeated
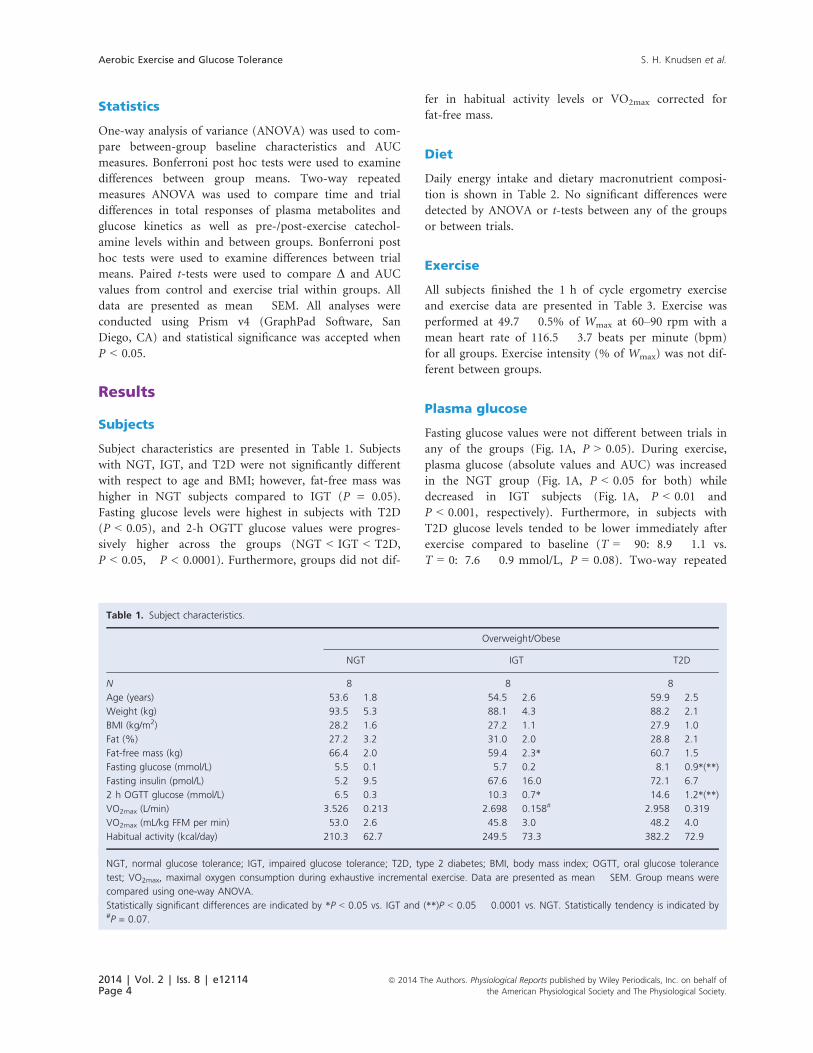
Table 1. Subject characteristics.
Overweight/Obese
NGT IGT T2D
N 8 8 8
Age (years) 53.6 � 1.8 54.5 � 2.6 59.9 � 2.5
Weight (kg) 93.5 � 5.3 88.1 � 4.3 88.2 � 2.1
BMI (kg/m2) 28.2 � 1.6 27.2 � 1.1 27.9 � 1.0
Fat (%) 27.2 � 3.2 31.0 � 2.0 28.8 � 2.1
Fat-free mass (kg) 66.4 � 2.0 59.4 � 2.3* 60.7 � 1.5
Fasting glucose (mmol/L) 5.5 � 0.1 5.7 � 0.2 8.1 � 0.9*(**)
Fasting insulin (pmol/L) 5.2 � 9.5 67.6 � 16.0 72.1 � 6.7
2 h OGTT glucose (mmol/L) 6.5 � 0.3 10.3 � 0.7* 14.6 � 1.2*(**)
VO2max (L/min) 3.526 � 0.213 2.698 � 0.158# 2.958 � 0.319
VO2max (mL/kg FFM per min) 53.0 � 2.6 45.8 � 3.0 48.2 � 4.0
Habitual activity (kcal/day) 210.3 � 62.7 249.5 � 73.3 382.2 � 72.9
NGT, normal glucose tolerance; IGT, impaired glucose tolerance; T2D, type 2 diabetes; BMI, body mass index; OGTT, oral glucose tolerance
test; VO2max, maximal oxygen consumption during exhaustive incremental exercise. Data are presented as mean � SEM. Group means were
compared using one-way ANOVA.
Statistically significant differences are indicated by *P < 0.05 vs. IGT and (**)P < 0.05 � 0.0001 vs. NGT. Statistically tendency is indicated by#P = 0.07.
2014 | Vol. 2 | Iss. 8 | e12114Page 4
ª 2014 The Authors. Physiological Reports published by Wiley Periodicals, Inc. on behalf of
the American Physiological Society and The Physiological Society.
Aerobic Exercise and Glucose Tolerance S. H. Knudsen et al.

measures ANOVA revealed a main effect of time in all
groups (P < 0.0001) and a main effect of trial in subjects
with NGT (Fig. 1A, P < 0.0001). Post hoc analyses
revealed that in NGT subjects, plasma glucose during
OGTT was significantly higher in the exercise trial com-
pared to the rest trial (Fig. 1A: T = 30 and T = 40 min,
P < 0.01 and P < 0.05, respectively). Also, exercise
increased the glucose response (AUC) to the OGTT in
NGT subjects (Fig. 1A, P < 0.05); however, it was still
lower than AUC glucose in subjects with T2D
(P < 0.001). In contrast, the glucose response (AUC) to
the OGTT in subjects with IGT and T2D was unaltered
by exercise (Fig. 1A).
Rate of glucose appearance (RaTotal)
No group differences in RaTotal were found in the rest
trial. Two-way repeated measures ANOVA revealed an
overall main effect of time and trial in subjects with
NGT, IGT, and T2D (P < 0.0001, all), and a
time 9 trial interaction in NGT and IGT groups
(P < 0.001 and P < 0.0001, respectively). Post hoc analy-
ses showed that RaTotal was increased by exercise in all
groups (Fig. 1B: NGT, T = �10 to 50, 70 to 90 min;
IGT, T = �10 to 60, 90 min; T2D, T = 0 to 10, 30 to
60 min). Compared to the rest trial, RaTotal (AUC) was
increased during exercise in subjects with NGT, IGT,
and T2D (P < 0.01, P < 0.0001, P < 0.01, respectively)
as well as immediately after exercise (T = �90 to 0 min,
P < 0.01, all). Furthermore, RaTotal (AUC) during OGTT
was increased by exercise in subjects with NGT, IGT,
and T2D (Fig. 1B, P < 0.01, P < 0.05 and P < 0.01,
respectively).
Rate of glucose disappearance (Rd)
No group differences were found in the rest trial. Two-
way repeated measures ANOVA revealed an overall main
effect of time and trial in subjects with NGT, IGT, and
T2D (P < 0.0001, all), and a time 9 trial interaction in
NGT and IGT groups (P < 0.0001, both). Post hoc
analyses showed that Rd was increased by exercise in all
groups (Fig. 1C: NGT, T = 10, 20, 40, 50, 70 to 90 min;
IGT, T = �10 to 60, 90 min; T2D, T = 10, 30, 50 min).
Compared to the rest trial, Rd (AUC) was increased dur-
ing exercise in subjects with NGT, IGT, and T2D
(P < 0.05, P < 0.0001, P < 0.05, respectively) as well as
immediately after exercise (T = �90 to 0 min, P < 0.01,
all). Furthermore, Rd (AUC) during OGTT was
increased by exercise in subjects with NGT, IGT, and
T2D (Fig. 1C, P < 0.01, P < 0.001, and P < 0.05, respec-
tively).
Table 3. Exercise data.
Overweight/Obese
MeanNGT IGT T2D
Mean work load (W) 128.9 � 8.1 97.7 � 12.2 107.1 � 11.3 116.8 � 7.7
Percentage of maximum work load (% Wmax) 50.1 � 1.0 47.7 � 1.2 49.4 � 0.5 49.7 � 0.5
Mean heart rate (bpm) 114.8 � 5.2 114.5 � 6.8 117.9 � 5.0 116.5 � 3.7
NGT, normal glucose tolerance; IGT, impaired glucose tolerance; T2D, type 2 diabetes; W, watt; bpm, beats per minute. Data are presented
as mean � SEM. Group means were compared using one-way ANOVA.
Table 2. Meal composition during three pretrial days.
Overweight/Obese
NGT IGT T2D
Rest Exercise Rest Exercise Rest Exercise
Energy intake (kcal/day) 2735 � 422 2695 � 270 2004 � 236 1947 � 241 2241 � 200 2114 � 262
CHO (%) 49.2 � 3.0 49.0 � 3.6 48.5 � 5.1 48.6 � 3.0 48.7 � 3.1 45.1 � 3.1
FAT (%) 28.1 � 3.0 28.7 � 2.8 35.6 � 4.5 32.8 � 2.5 32.8 � 2.3 31.7 � 2.2
PRO (%) 18.8 � 1.5 18.8 � 1.3 15.9 � 1.0 20.0 � 2.6 17.2 � 1.3 18.4 � 2.2
NGT, normal glucose tolerance; IGT, impaired glucose tolerance; T2D, type 2 diabetes; CHO, FAT, and PRO, calories of carbohydrate, fat, and
protein ingested expressed as a percentage of the total energy intake. Data are presented as mean � SEM of the 3 days prior to rest and
exercise trials.
ª 2014 The Authors. Physiological Reports published by Wiley Periodicals, Inc. on behalf ofthe American Physiological Society and The Physiological Society.
2014 | Vol. 2 | Iss. 8 | e12114Page 5
S. H. Knudsen et al. Aerobic Exercise and Glucose Tolerance
A
B
C
D
E
2014 | Vol. 2 | Iss. 8 | e12114Page 6
ª 2014 The Authors. Physiological Reports published by Wiley Periodicals, Inc. on behalf of
the American Physiological Society and The Physiological Society.
Aerobic Exercise and Glucose Tolerance S. H. Knudsen et al.
Rate of endogenous glucose appearance(RaEndo)
No baseline group differences were found in the rest trial;
however, postprandial suppression (value below baseline)
occurred at T = 40 min in NGT, T = 50 min in IGT,
and T = 60 min in subjects with T2D. Moreover, post-
prandial suppression during the first 20 min (D0–20 min) was lower in subjects with T2D than NGT
(P < 0.01). Two-way repeated measures ANOVA revealed
a main effect of time (P < 0.0001, all), trial (P < 0.0001,
P < 0.01, and P < 0.0001, respectively), and a
time 9 trial interaction in subjects with NGT, IGT, and
T2D (P < 0.0001, all). Post hoc analyses revealed that
RaEndo was significantly higher in the exercise trial in all
groups (Fig. 1D: NGT, T = �20 to 20 min; IGT,
T = �10 to 10 min; T2D, T = �10 to 10, 30 min).
Compared to the rest trial, RaEndo (AUC) was increased
during exercise in subjects with NGT, IGT, and
T2D (P < 0.01, P < 0.0001, P < 0.01, respectively). Also,
RaEndo (AUC) during OGTT was increased by exercise in
subjects with NGT and T2D (Fig. 1D, P < 0.05, both).
Rate of oral glucose appearance (RaOGTT)
No group differences were found in the rest trial. Two-
way repeated measures ANOVA revealed a main effect of
time, trial (P < 0.0001, all) and time 9 trial interaction
in all groups (P < 0.0001, P < 0.05, and P = 0.09, respec-
tively). Post hoc analyses showed that RaOGTT was signifi-
cantly greater in the exercise trial in all groups (Fig. 1E:
NGT, T = 50–100 min; IGT, T = 40–60, 90 min; T2D,
T = 50, 60, 120, 130 min). Compared to the rest trial,
RaOGTT (AUC) during the OGTT was greater following
exercise in all groups (Fig. 1E: NGT, P < 0.05; IGT,
P < 0.05; T2D, P < 0.01), and although not statistically
significant (P = 0.17), the peak RaOGTT value following
exercise was ~20% higher in NGT subjects compared to
subjects with IGT or T2D.
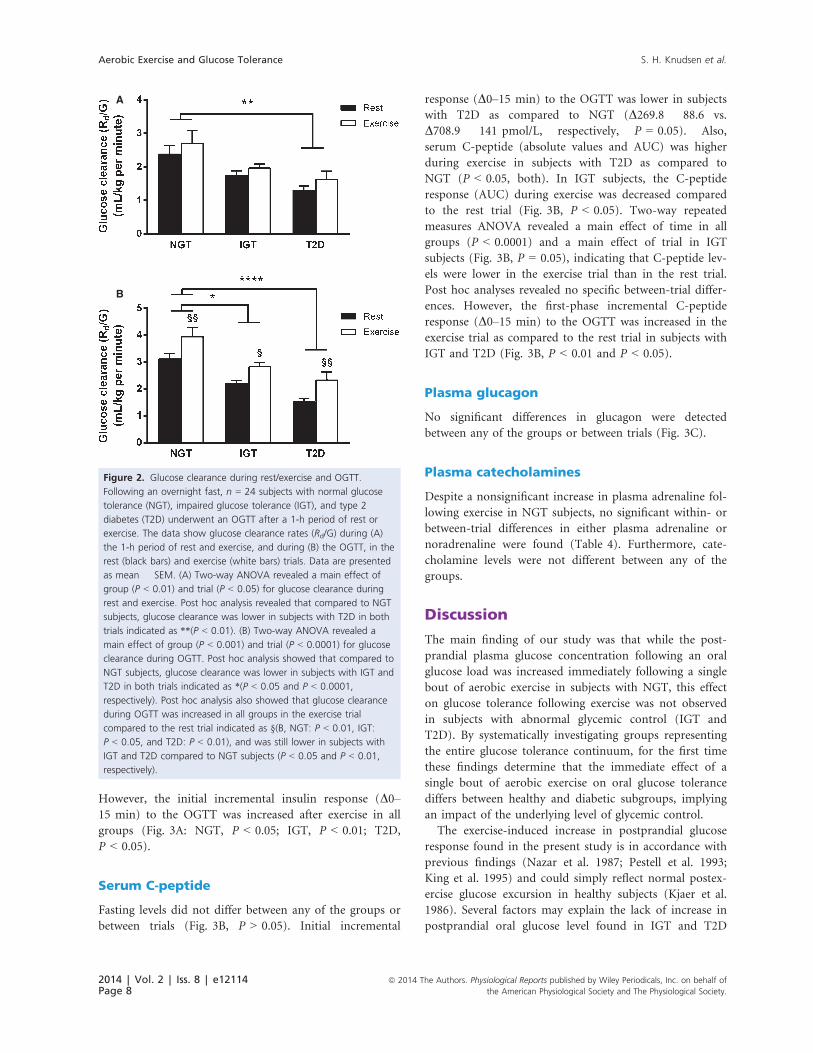
Rate of glucose clearance (Rd/G)
Two-way ANOVA revealed a main effect of group
(P < 0.01) and trial (P < 0.05) for glucose clearance
during rest and exercise (Fig. 2A) indicating an
increased clearance in all groups. Post hoc analysis
revealed that during both rest and exercise glucose clear-
ance was lower in subjects with T2D compared to NGT
(Fig. 2A, both P < 0.01). Also, two-way ANOVA
revealed a main effect of group (P < 0.001) and trial
(P < 0.0001) for glucose clearance during OGTT. Post
hoc analysis showed that glucose clearance was lower in
subjects with IGT and T2D in both trials when com-
pared to NGT subjects (Fig. 2B, P < 0.05 and
P < 0.0001, respectively). Also, post hoc analysis showed
that glucose clearance during OGTT was increased in all
groups in the exercise trial compared to the rest trial
(Fig. 2B, NGT: P < 0.01, IGT: P < 0.05, and T2D:
P < 0.01), and was still lower in subjects with IGT and
T2D compared to NGT subjects (P < 0.05 and P < 0.01,
respectively).
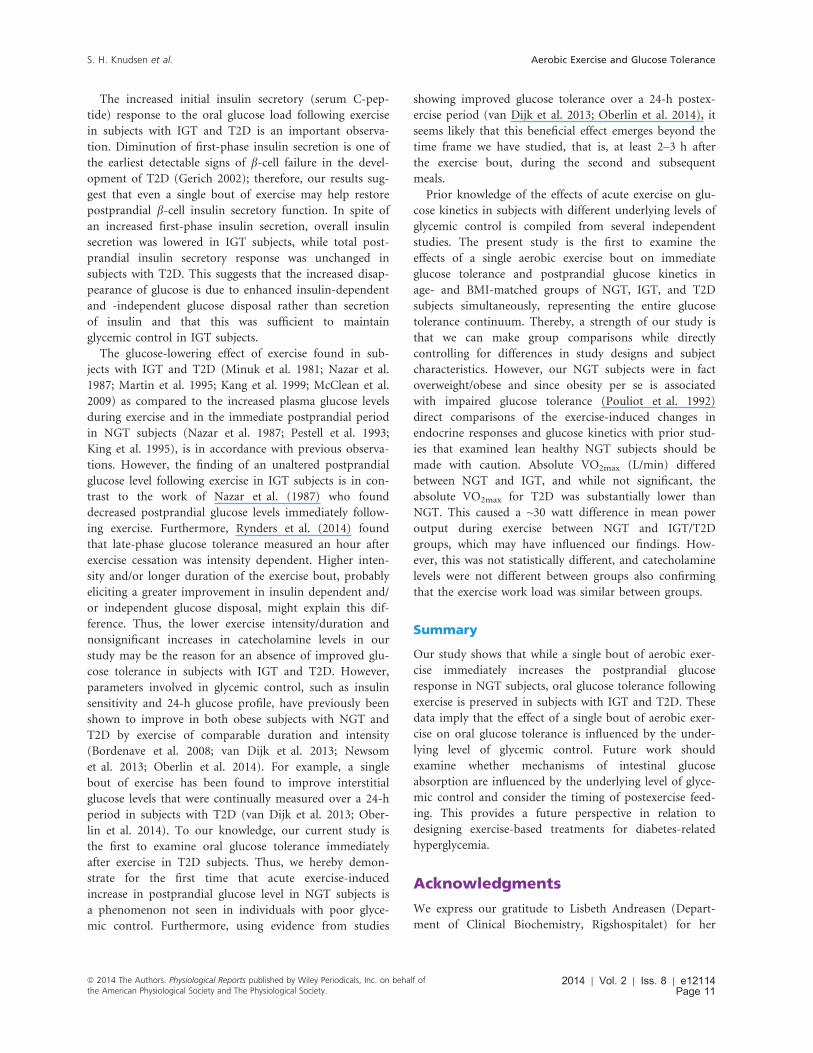
Serum insulin
Fasting levels did not differ between any of the groups
or between trials (Table 1, Fig. 3A, P > 0.05). Serum
insulin (absolute values and AUC) was higher during
exercise in subjects with T2D as compared to NGT
(P < 0.05, both). In IGT subjects, the insulin response
(AUC) to exercise showed a trend to be decreased as
compared to rest (P = 0.058) with levels being lower
immediately after exercise compared to baseline
(85.8 � 6.6 vs. 53.1 � 5.9 pmol/L, P < 0.01). Two-way
repeated measures ANOVA revealed a main effect of
time in all groups (P < 0.0001), but no main effect of
trial (P > 0.05). No between-group differences were
found in the overall insulin response to the OGTT in
the rest trial. Exercise did not affect the total insulin
response (AUC) to the OGTT in any of the groups.
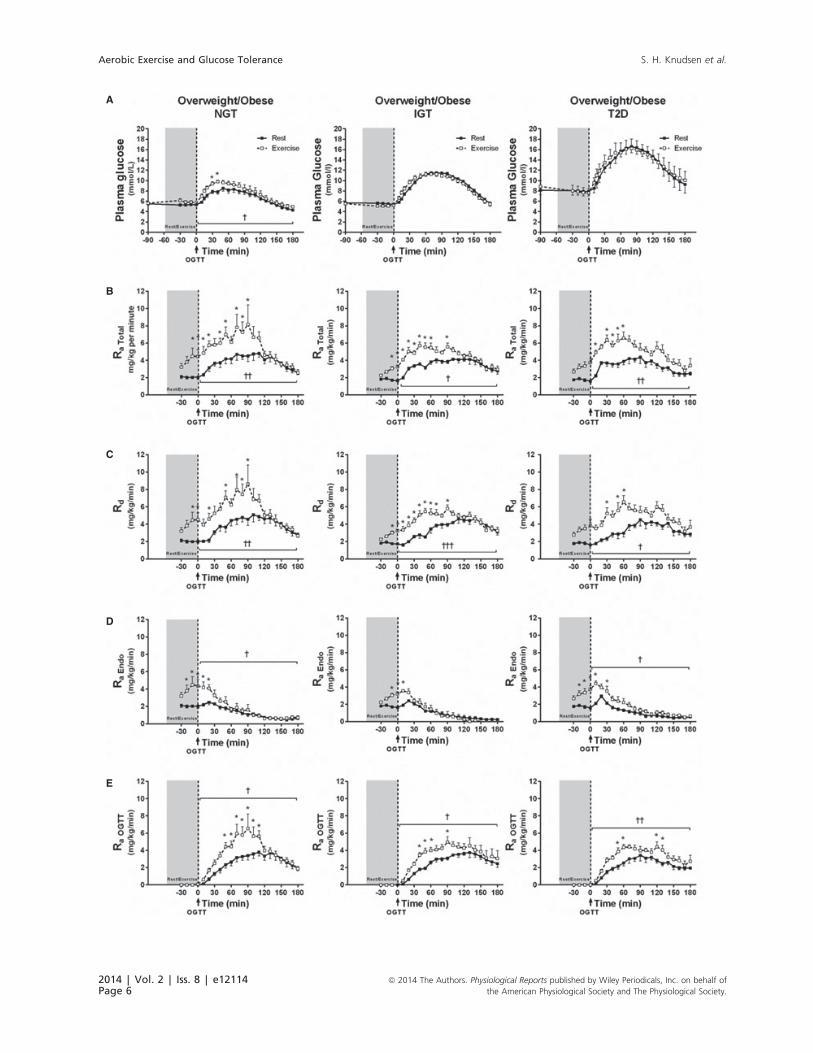
Figure 1. Glucose kinetics during rest/exercise and OGTT. Following an overnight fast, n = 24 subjects with normal glucose tolerance (NGT),
impaired glucose tolerance (IGT), and type 2 diabetes (T2D) underwent an OGTT after a 1-h period of rest or exercise. The data show rates of
(A) plasma glucose, (B) total glucose appearance [RaTotal], glucose disappearance [Rd], (C) endogenous glucose appearance [RaEndo], and (D) oral
glucose appearance [RaOGTT] during the rest (black squares; ■) and exercise (white squares; □) trials. Data are presented as mean � SEM. Two-
way repeated measures ANOVA showed a significant effect of time and trial in NGT subjects for plasma glucose ([A]: P < 0.0001) and in all of
the three groups for RaTotal ([B]: P < 0.0001, all), Rd ([C]: P < 0.0001, all), RaEndo ([D]: NGT, P < 0.0001; IGT, P < 0.01; and T2D, P < 0.0001),
and RaOGTT ([E]: P < 0.0001, all). Bonferroni post hoc test revealed between-trial differences (rest vs. exercise) indicated by *(P < 0.05–
P < 0.001). Two-way repeated measures ANOVA showed a significant time 9 trial interaction for RaTotal ([B]: NGT, P < 0.001; IGT, P < 0.0001),
Rd ([C]: NGT, P < 0.0001; IGT, P < 0.0001), RaEndo ([D]: NGT; IGT; T2DM, P < 0.0001), and RaOGTT ([E]: NGT, P < 0.0001; IGT, P < 0.05; T2D,
P = 0.09). Paired t-tests showed that in the exercise trial during the OGTT (AUC) there was a significantly greater plasma glucose in NGT
subjects ([A]: P < 0.05) and in all groups in RaTotal ([B]: NGT, P < 0.01; IGT, P < 0.05; T2D, P < 0.01), Rd ([C]: NGT, P < 0.01; IGT, P < 0.001;
T2D, P < 0.05), RaEndo ([D]: NGT and T2D, both P < 0.05), and RaOGTT ([E]: NGT, P < 0.05; IGT, P < 0.05; T2D, P < 0.01), as indicated by†(P < 0.05), ††(P < 0.01), and †††(P < 0.001).
ª 2014 The Authors. Physiological Reports published by Wiley Periodicals, Inc. on behalf ofthe American Physiological Society and The Physiological Society.
2014 | Vol. 2 | Iss. 8 | e12114Page 7
S. H. Knudsen et al. Aerobic Exercise and Glucose Tolerance
However, the initial incremental insulin response (D0–15 min) to the OGTT was increased after exercise in all
groups (Fig. 3A: NGT, P < 0.05; IGT, P < 0.01; T2D,
P < 0.05).
Serum C-peptide
Fasting levels did not differ between any of the groups or
between trials (Fig. 3B, P > 0.05). Initial incremental
response (D0–15 min) to the OGTT was lower in subjects
with T2D as compared to NGT (D269.8 � 88.6 vs.
D708.9 � 141 pmol/L, respectively, P = 0.05). Also,
serum C-peptide (absolute values and AUC) was higher
during exercise in subjects with T2D as compared to
NGT (P < 0.05, both). In IGT subjects, the C-peptide
response (AUC) during exercise was decreased compared
to the rest trial (Fig. 3B, P < 0.05). Two-way repeated
measures ANOVA revealed a main effect of time in all
groups (P < 0.0001) and a main effect of trial in IGT
subjects (Fig. 3B, P = 0.05), indicating that C-peptide lev-
els were lower in the exercise trial than in the rest trial.
Post hoc analyses revealed no specific between-trial differ-
ences. However, the first-phase incremental C-peptide
response (D0–15 min) to the OGTT was increased in the
exercise trial as compared to the rest trial in subjects with
IGT and T2D (Fig. 3B, P < 0.01 and P < 0.05).
Plasma glucagon
No significant differences in glucagon were detected
between any of the groups or between trials (Fig. 3C).
Plasma catecholamines
Despite a nonsignificant increase in plasma adrenaline fol-
lowing exercise in NGT subjects, no significant within- or
between-trial differences in either plasma adrenaline or
noradrenaline were found (Table 4). Furthermore, cate-
cholamine levels were not different between any of the
groups.
Discussion
The main finding of our study was that while the post-
prandial plasma glucose concentration following an oral
glucose load was increased immediately following a single
bout of aerobic exercise in subjects with NGT, this effect
on glucose tolerance following exercise was not observed
in subjects with abnormal glycemic control (IGT and
T2D). By systematically investigating groups representing
the entire glucose tolerance continuum, for the first time
these findings determine that the immediate effect of a
single bout of aerobic exercise on oral glucose tolerance
differs between healthy and diabetic subgroups, implying
an impact of the underlying level of glycemic control.
The exercise-induced increase in postprandial glucose
response found in the present study is in accordance with
previous findings (Nazar et al. 1987; Pestell et al. 1993;
King et al. 1995) and could simply reflect normal postex-
ercise glucose excursion in healthy subjects (Kjaer et al.
1986). Several factors may explain the lack of increase in
postprandial oral glucose level found in IGT and T2D
B
A
Figure 2. Glucose clearance during rest/exercise and OGTT.
Following an overnight fast, n = 24 subjects with normal glucose
tolerance (NGT), impaired glucose tolerance (IGT), and type 2
diabetes (T2D) underwent an OGTT after a 1-h period of rest or
exercise. The data show glucose clearance rates (Rd/G) during (A)
the 1-h period of rest and exercise, and during (B) the OGTT, in the
rest (black bars) and exercise (white bars) trials. Data are presented
as mean � SEM. (A) Two-way ANOVA revealed a main effect of
group (P < 0.01) and trial (P < 0.05) for glucose clearance during
rest and exercise. Post hoc analysis revealed that compared to NGT
subjects, glucose clearance was lower in subjects with T2D in both
trials indicated as **(P < 0.01). (B) Two-way ANOVA revealed a
main effect of group (P < 0.001) and trial (P < 0.0001) for glucose
clearance during OGTT. Post hoc analysis showed that compared to
NGT subjects, glucose clearance was lower in subjects with IGT and
T2D in both trials indicated as *(P < 0.05 and P < 0.0001,
respectively). Post hoc analysis also showed that glucose clearance
during OGTT was increased in all groups in the exercise trial
compared to the rest trial indicated as §(B, NGT: P < 0.01, IGT:
P < 0.05, and T2D: P < 0.01), and was still lower in subjects with
IGT and T2D compared to NGT subjects (P < 0.05 and P < 0.01,
respectively).
2014 | Vol. 2 | Iss. 8 | e12114Page 8
ª 2014 The Authors. Physiological Reports published by Wiley Periodicals, Inc. on behalf of
the American Physiological Society and The Physiological Society.
Aerobic Exercise and Glucose Tolerance S. H. Knudsen et al.

subjects in the present study. First, exercise-induced
elevation of plasma catecholamine levels (Kjaer et al.
1986, 1990) is known to increase hepatic glucose output
in healthy subjects (Deibert and DeFronzo 1980; Sherwin
and Sacca 1984), increasing glucose availability in the cir-
culation. Even though we did not find significant
increases in catecholamine levels, postprandial RaEndo was
increased by exercise in the present study. However, in
contrast to Minuk et al. (1981) who showed that exercise
failed to increase endogenous glucose production in T2D
subjects, and in spite of a lower resting postprandial sup-
pression of RaEndo in our diabetic subjects, RaEndo during
OGTT was similar between groups following exercise. As
such, differences in endogenous glucose production
(which is predominantly hepatic) cannot explain the
present group differences in exercise-induced changes in
oral glucose tolerance. Second, exercise increases muscle-
contraction-induced glucose disposal via insulin-indepen-
dent GLUT-4 translocation (Goodyear et al. 1990; Lund
et al. 1995). Our results support previous findings that
this exercise-related mechanism is not impaired in sub-
jects with poor glycemic control (Minuk et al. 1981; Mar-
tin et al. 1995; Dela et al. 1999) by showing that Rd
during OGTT is not different between groups following
exercise. That said, with our study design, Rd indeed
reflects both insulin-independent and insulin-dependent
glucose disposal. However, glucose clearance (a better
indicator of the efficiency of glucose extraction from
A
B
C
Figure 3. Metabolic responses during rest/exercise and OGTT. Following an overnight fast, n = 24 subjects with normal glucose tolerance
(NGT), impaired glucose tolerance (IGT), and type 2 diabetes (T2D) underwent an OGTT after a 1-h period of rest or exercise. The data show
(A) serum insulin, (B) serum C-peptide, and (C) plasma glucagon responses during the rest (black squares; ■) and exercise (white squares; □)trials. Data are presented as mean � SEM. (A) The first-phase incremental insulin response during OGTT (D0–15 min) was increased in all
groups, indicated by §(NGT, P < 0.05; IGT, P < 0.01; T2D, P < 0.05). (B) Two-way repeated measures ANOVA showed a significant main effect
of trial for serum C-peptide in the IGT group, indicated by *(P = 0.05). Also, paired t-tests showed that first-phase incremental C-peptide
response (D0–15 min) was increased in all groups, as shown by §(IGT, P < 0.01; T2D, P < 0.05). (C) No significant differences in glucagon were
detected by ANOVA or t-tests between any of the groups or between trials.
ª 2014 The Authors. Physiological Reports published by Wiley Periodicals, Inc. on behalf ofthe American Physiological Society and The Physiological Society.
2014 | Vol. 2 | Iss. 8 | e12114Page 9
S. H. Knudsen et al. Aerobic Exercise and Glucose Tolerance

plasma than Rd) was increased to the same extent by
exercise in all three groups. This was seen when glucose
clearance was normalized to either body mass (Fig. 2) or
fat-free mass (Data not shown but available from authors
on request). This argues that group differences in
exercise-induced changes in postprandial plasma glucose
levels are not dependent on group differences in muscle-
contraction-induced glucose disposal. Third, prior work
has shown that in healthy subjects a single bout of exer-
cise can increase the appearance of orally ingested
exogenous glucose in the circulation (Rose et al. 2001).
In animal models, this phenomenon has been found to
be related to the stimulatory effect of catecholamines (Is-
hikawa et al. 1997; Aschenbach et al. 2002). In our study,
RaOGTT following oral glucose ingestion was increased by
exercise in all groups; however, this increase appeared to
be greatest in NGT subjects. Following exercise RaOGTT
was increased more so during the earlier stage
(0–120 min) of the OGTT in NGT subjects (DAUC209.8 � 52.0 mg kg�1 min�1) than in IGT (DAUC139.8 � 31.6 mg kg�1 min�1, P = 0.17) and T2D (DAUC126.8 � 25.2 mg kg�1 min�1, P = 0.29) subjects. These
group differences were found along with a nonsignificant
but ~20% greater peak value of RaOGTT following exercise in
NGT subjects (6.6 � 1.7 mg kg�1 min�1) compared to
IGT (5.0 � 0.6 mg kg�1 min�1) and T2D (4.4 � 0.3
mg kg�1 min�1) subjects. Despite being underpowered to
detect these differences, in support of the findings of Rose
et al. (2001), our data indicate that larger postexercise eleva-
tions in RaOGTT in overweight/obese NGT subjects poten-
tially explain the increment in the plasma glucose response
during OGTT following exercise in that group, and the lack
of response in IGT and T2D.
b-adrenergic stimulation of the intestine by adrenaline
increases glucose absorption in sheep and rats (Ishikawa
et al. 1997; Aschenbach et al. 2002), potentially increasing
orally ingested exogenous glucose appearance. Therefore,
a diminished intestinal adrenaline effect following exercise
in IGT and T2D subjects (Giacca et al. 1998) may lessen
increments in RaOGTT. In our study, although plasma
adrenaline levels increased following exercise in NGT but
not IGT or T2D subjects, these observations were not sta-
tistically significant. From the present data, even though
gastric emptying is most likely not affected at the exercise
intensity used (van Nieuwenhoven et al. 1999), we also
cannot rule out that differential gastric emptying between
groups may also have influenced exogenous glucose
appearance. Furthermore, it is important to note that the
nonsignificant group differences in RaOGTT may also be
due to a caveat of our method in that exogenous glucose
appearance estimated by tracer dilution of ingested
[U-13C]glucose does not account for possible group dif-
ferences in the loss of glucose to splanchnic or hepatic
uptake.
Interestingly, exercise increased the initial postprandial
(Δ0–15 min) responses of both serum C-peptide and
insulin in IGT and T2D subjects, indicating that exercise
increases early-phase glucose-stimulated insulin secretion
in hyperglycemic subjects. In contrast, in NGT subjects
only initial postprandial insulin levels were increased, but
not C-peptide. In healthy subjects, it is known that exer-
cise-induced increases in adrenaline suppresses insulin
secretion (Galbo et al. 1979; Minuk et al. 1981; Kjaer
et al. 1986, 1990; Pestell et al. 1993); therefore, exercise-
induced increases in insulin secretion in IGT and T2D
subjects could be due to lower sympathetic suppression of
insulin secretion by adrenergic stimulation (Minuk et al.
1981; Krotkiewski and Gorski 1986). However, as men-
tioned above we did not find a significant difference in
the adrenaline response to exercise between groups. As
such, exercise-induced changes in clearance of either insu-
lin or C-peptide may alternatively explain the differential
changes in these variables between groups (Krotkiewski
and Gorski 1986).
Table 4. Catecholamines pre- and post exercise.
Overweight/Obese
NGT IGT T2D
Pre Post Pre Post Pre Post
Adrenaline (nmol/L)
Rest 1.8 � 0.4 1.7 � 0.5 1.8 � 0.4 1.8 � 0.4 2.4 � 0.6 2.5 � 0.5
Exercise 2.2 � 0.5 3.2 � 1.2 2.2 � 0.5 2.1 � 0.3 1.7 � 0.2 1.7 � 0.3
Noradrenaline (nmol/L)
Rest 18.8 � 2.7 19.5 � 2.0 10.3 � 2.6 14.2 � 3.6 15.8 � 6.3 13.9 � 3.7
Exercise 19.9 � 2.9 21.5 � 3.4 15.4 � 3.6 17.9 � 4.1 17.5 � 4.4 18.9 � 3.5
NGT, normal glucose tolerance; IGT, impaired glucose tolerance; T2D, type 2 diabetes. Data are presented as mean � SEM. Two-way
repeated measures ANOVA was used to compare pre- and post differences in and between each group.
2014 | Vol. 2 | Iss. 8 | e12114Page 10
ª 2014 The Authors. Physiological Reports published by Wiley Periodicals, Inc. on behalf of
the American Physiological Society and The Physiological Society.
Aerobic Exercise and Glucose Tolerance S. H. Knudsen et al.
The increased initial insulin secretory (serum C-pep-
tide) response to the oral glucose load following exercise
in subjects with IGT and T2D is an important observa-
tion. Diminution of first-phase insulin secretion is one of
the earliest detectable signs of b-cell failure in the devel-
opment of T2D (Gerich 2002); therefore, our results sug-
gest that even a single bout of exercise may help restore
postprandial b-cell insulin secretory function. In spite of
an increased first-phase insulin secretion, overall insulin
secretion was lowered in IGT subjects, while total post-
prandial insulin secretory response was unchanged in
subjects with T2D. This suggests that the increased disap-
pearance of glucose is due to enhanced insulin-dependent
and -independent glucose disposal rather than secretion
of insulin and that this was sufficient to maintain
glycemic control in IGT subjects.
The glucose-lowering effect of exercise found in sub-
jects with IGT and T2D (Minuk et al. 1981; Nazar et al.
1987; Martin et al. 1995; Kang et al. 1999; McClean et al.
2009) as compared to the increased plasma glucose levels
during exercise and in the immediate postprandial period
in NGT subjects (Nazar et al. 1987; Pestell et al. 1993;
King et al. 1995), is in accordance with previous observa-
tions. However, the finding of an unaltered postprandial
glucose level following exercise in IGT subjects is in con-
trast to the work of Nazar et al. (1987) who found
decreased postprandial glucose levels immediately follow-
ing exercise. Furthermore, Rynders et al. (2014) found
that late-phase glucose tolerance measured an hour after
exercise cessation was intensity dependent. Higher inten-
sity and/or longer duration of the exercise bout, probably
eliciting a greater improvement in insulin dependent and/
or independent glucose disposal, might explain this dif-
ference. Thus, the lower exercise intensity/duration and
nonsignificant increases in catecholamine levels in our
study may be the reason for an absence of improved glu-
cose tolerance in subjects with IGT and T2D. However,
parameters involved in glycemic control, such as insulin
sensitivity and 24-h glucose profile, have previously been
shown to improve in both obese subjects with NGT and
T2D by exercise of comparable duration and intensity
(Bordenave et al. 2008; van Dijk et al. 2013; Newsom
et al. 2013; Oberlin et al. 2014). For example, a single
bout of exercise has been found to improve interstitial
glucose levels that were continually measured over a 24-h
period in subjects with T2D (van Dijk et al. 2013; Ober-
lin et al. 2014). To our knowledge, our current study is
the first to examine oral glucose tolerance immediately
after exercise in T2D subjects. Thus, we hereby demon-
strate for the first time that acute exercise-induced
increase in postprandial glucose level in NGT subjects is
a phenomenon not seen in individuals with poor glyce-
mic control. Furthermore, using evidence from studies
showing improved glucose tolerance over a 24-h postex-
ercise period (van Dijk et al. 2013; Oberlin et al. 2014), it
seems likely that this beneficial effect emerges beyond the
time frame we have studied, that is, at least 2–3 h after
the exercise bout, during the second and subsequent
meals.
Prior knowledge of the effects of acute exercise on glu-
cose kinetics in subjects with different underlying levels of
glycemic control is compiled from several independent
studies. The present study is the first to examine the
effects of a single aerobic exercise bout on immediate
glucose tolerance and postprandial glucose kinetics in
age- and BMI-matched groups of NGT, IGT, and T2D
subjects simultaneously, representing the entire glucose
tolerance continuum. Thereby, a strength of our study is
that we can make group comparisons while directly
controlling for differences in study designs and subject
characteristics. However, our NGT subjects were in fact
overweight/obese and since obesity per se is associated
with impaired glucose tolerance (Pouliot et al. 1992)
direct comparisons of the exercise-induced changes in
endocrine responses and glucose kinetics with prior stud-
ies that examined lean healthy NGT subjects should be
made with caution. Absolute VO2max (L/min) differed
between NGT and IGT, and while not significant, the
absolute VO2max for T2D was substantially lower than
NGT. This caused a ~30 watt difference in mean power
output during exercise between NGT and IGT/T2D
groups, which may have influenced our findings. How-
ever, this was not statistically different, and catecholamine
levels were not different between groups also confirming
that the exercise work load was similar between groups.
Summary
Our study shows that while a single bout of aerobic exer-
cise immediately increases the postprandial glucose
response in NGT subjects, oral glucose tolerance following
exercise is preserved in subjects with IGT and T2D. These
data imply that the effect of a single bout of aerobic exer-
cise on oral glucose tolerance is influenced by the under-
lying level of glycemic control. Future work should
examine whether mechanisms of intestinal glucose
absorption are influenced by the underlying level of glyce-
mic control and consider the timing of postexercise feed-
ing. This provides a future perspective in relation to
designing exercise-based treatments for diabetes-related
hyperglycemia.
Acknowledgments
We express our gratitude to Lisbeth Andreasen (Depart-
ment of Clinical Biochemistry, Rigshospitalet) for her
ª 2014 The Authors. Physiological Reports published by Wiley Periodicals, Inc. on behalf ofthe American Physiological Society and The Physiological Society.
2014 | Vol. 2 | Iss. 8 | e12114Page 11
S. H. Knudsen et al. Aerobic Exercise and Glucose Tolerance

technical assistance with clinical biochemistry assays.
We also thank G. A. Wallis (University of Birmingham,
UK) for providing intellectual critique on our manu-
script.
Conflict of Interest
None declared.
References
Aschenbach, J. R., T. Borau, and G. Gabel. 2002. Glucose
uptake via SGLT-1 is stimulated by beta(2)-adrenoceptors in
the ruminal epithelium of sheep. J. Nutr. 132:1254–1257.
Baynard, T., R. M. Franklin, S. Goulopoulou, R. Carhart, Jr.,
and J. A. Kanaley. 2005. Effect of a single vs multiple bouts
of exercise on glucose control in women with type 2
diabetes. Metabolism 54:989–994.
Bonen, A., M. Ball-Burnett, and C. Russel. 1998. Glucose
tolerance is improved after low- and high-intensity exercise
in middle-age men and women. Can. J. Appl. Physiol.
23:583–593.
Bordenave, S., F. Brandou, J. Manetta, C. Fedou, J. Mercier,
and J. F. Brun. 2008. Effects of acute exercise on insulin
sensitivity, glucose effectiveness and disposition index in
type 2 diabetic patients. Diabetes Metab. 34:250–257.
Burstein, R., Y. Epstein, Y. Shapiro, I. Charuzi, and
E. Karnieli. 1990. Effect of an acute bout of exercise on glucose
disposal in human obesity. J. Appl. Physiol. 69:299–304.
Cavalot, F., A. Pagliarino, M. Valle, M. L. Di, K. Bonomo,
P. Massucco, et al. 2011. Postprandial blood glucose
predicts cardiovascular events and all-cause mortality in
type 2 diabetes in a 14-year follow-up: lessons from the
San Luigi Gonzaga Diabetes Study. Diabetes Care
34:2237–2243.
Church, T. S., S. N. Blair, S. Cocreham, N. Johannsen,
W. Johnson, K. Kramer, et al. 2010. Effects of aerobic and
resistance training on hemoglobin A1c levels in patients
with type 2 diabetes: a randomized controlled trial. JAMA
304:2253–2262.
Coker, R. H., R. H. Williams, S. E. Yeo, P. M. Kortebein,
D. L. Bodenner, P. A. Kern, et al. 2009. The impact of
exercise training compared to caloric restriction on hepatic
and peripheral insulin resistance in obesity. J. Clin.
Endocrinol. Metab. 94:4258–4266.
Deibert, D. C., and R. A. DeFronzo. 1980. Epinephrine-induced
insulin resistance in man. J. Clin. Invest. 65:717–721.
Dela, F., K. J. Mikines, J. J. Larsen, and H. Galbo. 1999.
Glucose clearance in aged trained skeletal muscle during
maximal insulin with superimposed exercise. J. Appl.
Physiol. 87:2059–2067.
Devlin, J. T., and E. S. Horton. 1985. Effects of prior
high-intensity exercise on glucose metabolism in normal
and insulin-resistant men. Diabetes 34:973–979.
van Dijk, J. W., R. J. Manders, E. E. Canfora, W. van
Mechelen, F. Hartgens, C. D. Stehouwer, et al. 2013.
Exercise and 24-h glycemic control: equal effects for all Type
2 diabetic patients? Med. Sci. Sports Exerc. 45:628–635.
Galbo, H., J. J. Holst, and N. J. Christensen. 1979. The effect
of different diets and of insulin on the hormonal response
to prolonged exercise. Acta Physiol. Scand. 107:19–32.
Gerich, J. E. 2002. Is reduced first-phase insulin release the
earliest detectable abnormality in individuals destined to
develop type 2 diabetes? Diabetes 51(Suppl 1):S117–S121.
Giacca, A., Y. Groenewoud, E. Tsui, P. McClean, and
B. Zinman. 1998. Glucose production, utilization, and
cycling in response to moderate exercise in obese subjects
with type 2 diabetes and mild hyperglycemia. Diabetes
47:1763–1770.
Gonzalez, J. T., R. C. Veasey, P. L. Rumbold, and
E. J. Stevenson. 2013. Breakfast and exercise contingently
affect postprandial metabolism and energy balance in
physically active males. Br. J. Nutr. 110:721–732.
Goodyear, L. J., P. A. King, M. F. Hirshman, C. M. Thompson,
E. D. Horton, and E. S. Horton. 1990. Contractile activity
increases plasma membrane glucose transporters in absence
of insulin. Am. J. Physiol. 258:E667–E672.
Ishikawa, Y., T. Eguchi, and H. Ishida. 1997. Mechanism of
beta-adrenergic agonist-induced transmural transport of
glucose in rat small intestine. Regulation of phosphorylation
of SGLT1 controls the function. Biochim. Biophys. Acta
1357:306–318.
Ivy, J. L. 1997. Role of exercise training in the prevention and
treatment of insulin resistance and non-insulin-dependent
diabetes mellitus. Sports Med. 24:321–336.
Kang, J., D. E. Kelley, R. J. Robertson, F. L. Goss, R. R. Suminski,
A. C. Utter, et al. 1999. Substrate utilization and glucose
turnover during exercise of varying intensities in individuals
with NIDDM. Med. Sci. Sports Exerc. 31:82–89.
King, D. S., P. J. Baldus, R. L. Sharp, L. D. Kesl, T. L. Feltmeyer,
and M. S. Riddle. 1995. Time course for exercise-induced
alterations in insulin action and glucose tolerance in
middle-aged people. J. Appl. Physiol. 78:17–22.
Kjaer, M., P. A. Farrell, N. J. Christensen, and H. Galbo. 1986.
Increased epinephrine response and inaccurate
glucoregulation in exercising athletes. J. Appl. Physiol.
61:1693–1700.
Kjaer, M., C. B. Hollenbeck, B. Frey-Hewitt, H. Galbo,
W. Haskell, and G. M. Reaven. 1990. Glucoregulation and
hormonal responses to maximal exercise in
non-insulin-dependent diabetes. J. Appl. Physiol. 68:2067–
2074.
Knudsen, S. H., K. Karstoft, and T. P. Solomon. 2013.
Impaired postprandial fullness in Type 2 diabetic subjects is
rescued by acute exercise independently of total and
acylated ghrelin. J. Appl. Physiol. 115:618–625.
Krotkiewski, M., and J. Gorski. 1986. Effect of muscular
exercise on plasma C-peptide and insulin in obese
2014 | Vol. 2 | Iss. 8 | e12114Page 12
ª 2014 The Authors. Physiological Reports published by Wiley Periodicals, Inc. on behalf of
the American Physiological Society and The Physiological Society.
Aerobic Exercise and Glucose Tolerance S. H. Knudsen et al.

non-diabetics and diabetics, type II. Clin. Physiol. 6:499–
506.
Larsen, J. J., F. Dela, M. Kjaer, and H. Galbo. 1997. The effect
of moderate exercise on postprandial glucose homeostasis in
NIDDM patients. Diabetologia 40:447–453.
Lund, S., G. D. Holman, O. Schmitz, and O. Pedersen. 1995.
Contraction stimulates translocation of glucose transporter
GLUT4 in skeletal muscle through a mechanism distinct
from that of insulin. Proc. Natl. Acad. Sci. USA 92:5817–
5821.
Martin, I. K., A. Katz, and J. Wahren. 1995. Splanchnic and
muscle metabolism during exercise in NIDDM patients. Am.
J. Physiol. 269:E583–E590.
McClean, C. M., A. M. McNeilly, T. R. Trinick, M. H. Murphy,
E. Duly, J. McLaughlin, et al. 2009. Acute exercise and
impaired glucose tolerance in obese humans. J. Clin. Lipidol.
3:262–268.
Minuk, H. L., M. Vranic, E. B. Marliss, A. K. Hanna,
A. M. Albisser, and B. Zinman. 1981. Glucoregulatory and
metabolic response to exercise in obese noninsulin-dependent
diabetes. Am. J. Physiol. 240:E458–E464.
Nazar, K., H. Kaciuba-Uscilko, J. Chwalbinska-Moneta,
M. Krotkiewski, and B. Bicz. 1987. Plasma insulin and
C-peptide responses to oral glucose load after physical
exercise in men with normal and impaired glucose
tolerance. Acta Physiol. Pol. 38:458–466.
Newsom, S. A., A. C. Everett, A. Hinko, and J. F. Horowitz.
2013. A single session of low-intensity exercise is sufficient
to enhance insulin sensitivity into the next day in obese
adults. Diabetes Care 36:2516–2522.
van Nieuwenhoven, M. A., F. Brouns, and R. J. Brummer. 1999.
The effect of physical exercise on parameters of gastrointestinal
function. Neurogastroenterol. Motil. 11:431–439.
Oberlin, D. J., C. R. Mikus, M. L. Kearney, P. S. Hinton,
C. Manrique, H. J. Leidy, et al. 2014. One bout of exercise
alters free-living postprandial glycemia in Type 2 diabetes.
Med. Sci. Sports Exerc. 46:232–238.
Oehlke, J., M. Brudel, and I. E. Blasig. 1994. Benzoylation of
sugars, polyols and amino acids in biological fluids for
high-performance liquid chromatographic analysis.
J. Chromatogr. B Biomed. Appl. 655:105–111.
Pestell, R. G., G. M. Ward, P. Galvin, J. D. Best, and F. P.
Alford. 1993. Impaired glucose tolerance after
endurance exercise is associated with reduced insulin
secretion rather than altered insulin sensitivity. Metabolism
42:277–282.
Pouliot, M. C., J. P. Despres, A. Nadeau, S. Moorjani,
D. Prud’Homme, P. J. Lupien, et al. 1992. Visceral obesity
in men. Associations with glucose tolerance, plasma insulin,
and lipoprotein levels. Diabetes 41:826–834.
Proietto, J. 1990. Estimation of glucose kinetics following an
oral glucose load. Methods and applications. Horm. Metab.
Res. Suppl. 24:25–30.
Richter, E. A., K. J. Mikines, H. Galbo, and B. Kiens. 1989.
Effect of exercise on insulin action in human skeletal
muscle. J. Appl. Physiol. 66:876–885.
Roberts, S., B. Desbrow, G. Grant, S. Anoopkumar-Dukie, and
M. Leveritt. 2013. Glycemic response to carbohydrate and
the effects of exercise and protein. Nutrition 29:881–885.
Rogers, M. A., C. Yamamoto, D. S. King, J. M. Hagberg,
A. A. Ehsani, and J. O. Holloszy. 1988. Improvement in
glucose tolerance after 1 wk of exercise in patients with mild
NIDDM. Diabetes Care 11:613–618.
Rose, A. J., K. Howlett, D. S. King, and M. Hargreaves.
2001. Effect of prior exercise on glucose metabolism in
trained men. Am. J. Physiol. Endocrinol. Metab. 281:
E766–E771.
Rynders, C. A., J. Y. Weltman, B. Jiang, M. Breton, J. Patrie,
E. J. Barrett, et al. 2014. Effects of exercise intensity on
postprandial improvement in glucose disposal and insulin
sensitivity in prediabetic adults. J. Clin. Endocrinol. Metab.
99:220–228.
Sherwin, R. S., and L. Sacca. 1984. Effect of epinephrine on
glucose metabolism in humans: contribution of the liver.
Am. J. Physiol. 247:E157–E165.
Slentz, C. A., L. A. Bateman, L. H. Willis, A. T. Shields,
C. J. Tanner, L. W. Piner, et al. 2011. Effects of aerobic vs.
resistance training on visceral and liver fat stores, liver
enzymes, and insulin resistance by HOMA in overweight
adults from STRRIDE AT/RT. Am. J. Physiol. Endocrinol.
Metab. 301:E1033–E1039.
Steele, R. 1959. Influences of glucose loading and of injected
insulin on hepatic glucose output. Ann. N. Y. Acad. Sci.
82:420–430.
Taylor, H. L., D. R. Jacobs, Jr., B. Schucker, J. Knudsen,
A. S. Leon, and G. Debacker. 1978. A questionnaire for the
assessment of leisure time physical activities. J. Chronic Dis.
31:741–755.
Venables, M. C., C. S. Shaw, A. E. Jeukendrup, and
A. J. Wagenmakers. 2007. Effect of acute exercise on glucose
tolerance following post-exercise feeding. Eur. J. Appl.
Physiol. 100:711–717.
WHO & IDF Consultation. 2006. Definition and diagnosis of
diabetes mellitus and intermediate hyperglycemia. Pp. 1–52
World Health Organization & International Diabetes
Federation.
Wolfe, R., and D. Chinkes. 2005. Isotope tracers in metabolic
reseach. Wiley, Hoboken, NJ.
ª 2014 The Authors. Physiological Reports published by Wiley Periodicals, Inc. on behalf ofthe American Physiological Society and The Physiological Society.
2014 | Vol. 2 | Iss. 8 | e12114Page 13
S. H. Knudsen et al. Aerobic Exercise and Glucose Tolerance


![Glucose Tolerance Test in Mice - Bio-protocol · Glucose Tolerance Test in Mice . ... [Abstract] Glucose tolerance test is a standard procedure that addresses how quickly exogenous](https://static.cupdf.com/doc/110x72/5b8a408e7f8b9a50388bbc88/glucose-tolerance-test-in-mice-bio-protocol-glucose-tolerance-test-in-mice.jpg)