© International Baccalaureate Organization 2019 International Baccalaureate® | Baccalauréat International® | Bachillerato Internacional®
The IB Diploma Programme Provisional Statistical Bulletin May 2019 Examination Session
09/07/2019 Cover
1/1
The IB Diploma Programme Provisional Statistical Bulletin, May 2019 Examination Session.
International Baccalaureate IB Global Centre, Cardiff
Peterson House, Malthouse AvenueCardiff Gate, Cardiff, Wales
CF23 8GLUnited Kingdom
Website: www.ibo.org
© International Baccalaureate Organization 2019
09/07/2019 P1
1/1
Key to abbreviations Categories of registrationDiploma Programme (DP) candidates must register in one of four categories: Diploma: Candidates intending to complete the requirements for the award of an IB Diploma.Retake*: Previous IB Diploma candidates who are seeking to improve their results by retaking one or more subjects. The highest grade obtained for a subject will contribute towards the IB.Course: Candidates taking one or more subjects who are not seeking the award of the IB Diploma.Anticipated: Candidates intending to complete the requirements for one or two standard level subjects (excluding languages ab initio and pilot subjects) at the end of their first year of the Diploma Programme. They must complete all remaining IB Diploma requirements in the corresponding examination session the following year. *Unless otherwise stated, retake candidates are included in the dataset. IB RegionsSchools authorized to offer the IB Diploma Programme are grouped by geographical regions. The abbreviationsused in the tables are the codes describing the following geographical regions: IBA: IB AmericasIBAEM: IB Africa, Europe, Middle EastIBAP: IB Asia-Pacific Other Abbreviations HL: Higher LevelSL: Standard LevelTOK/TK: Theory of KnowledgeEE: Extended Essay
These data tables are provisional. They are a snapshot of outcomes taken shortly before results are released to candidate and do not reflect changes due to Enquiry upon Results or IB investigations were schools have not responded to inquiries by issue of results. A confirmed version of this statistical release we be made available at the end of September. Whilst provisional, we do not anticipate significant changes to outcomes or entries to occur when the final bulletin is released. If you have feedback on this statistical bulletin please email [email protected].
Provisional statistical bulletin Page 1
Provisional data
09/07/2019 P2
1/1
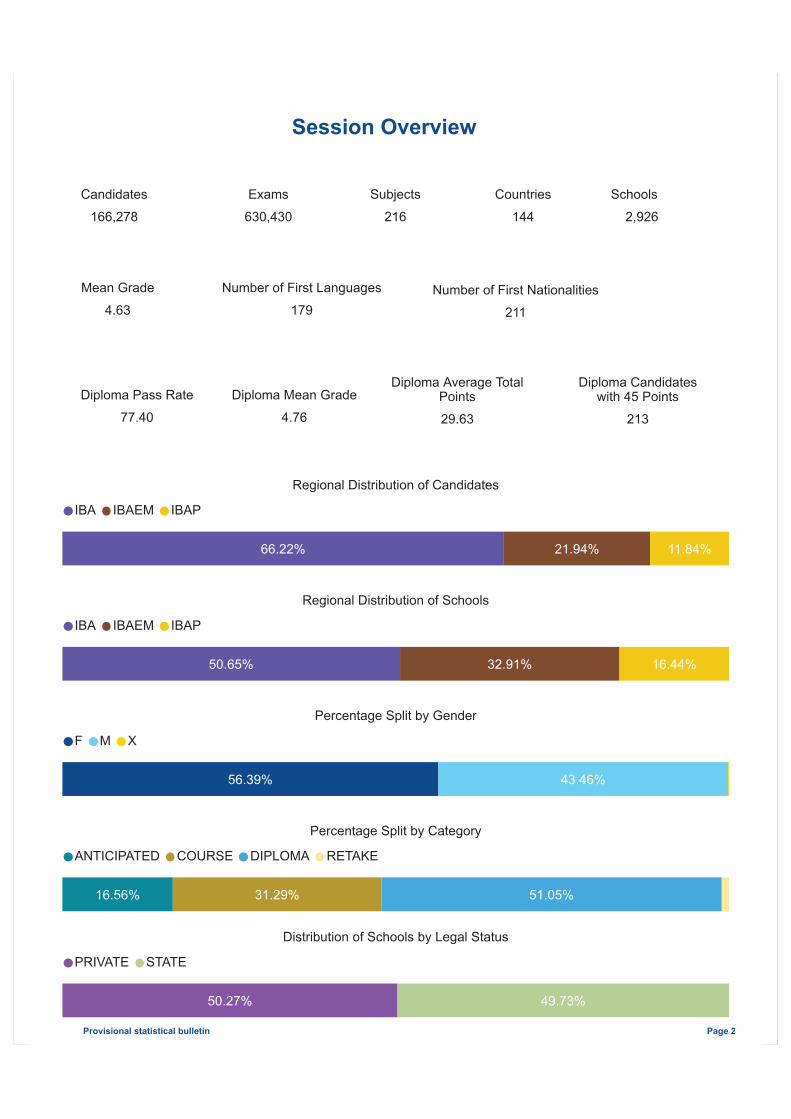
Candidates166,278
Diploma Pass Rate77.40
Schools2,926
Countries144
Number of First Nationalities211
Regional Distribution of Candidates
66.22% 21.94% 11.84%
IBA IBAEM IBAP
Regional Distribution of Schools
50.65% 32.91% 16.44%
IBA IBAEM IBAP
Percentage Split by Gender
56.39% 43.46%
F M X
Percentage Split by Category
16.56% 31.29% 51.05%
ANTICIPATED COURSE DIPLOMA RETAKE
Distribution of Schools by Legal Status
50.27% 49.73%
PRIVATE STATE
Session Overview
Subjects216
Exams630,430
Mean Grade4.63
Provisional statistical bulletin Page 2
Number of First Languages179
Diploma Mean Grade4.76
Diploma Average TotalPoints29.63
Diploma Candidateswith 45 Points
213
09/07/2019 P3
1/1
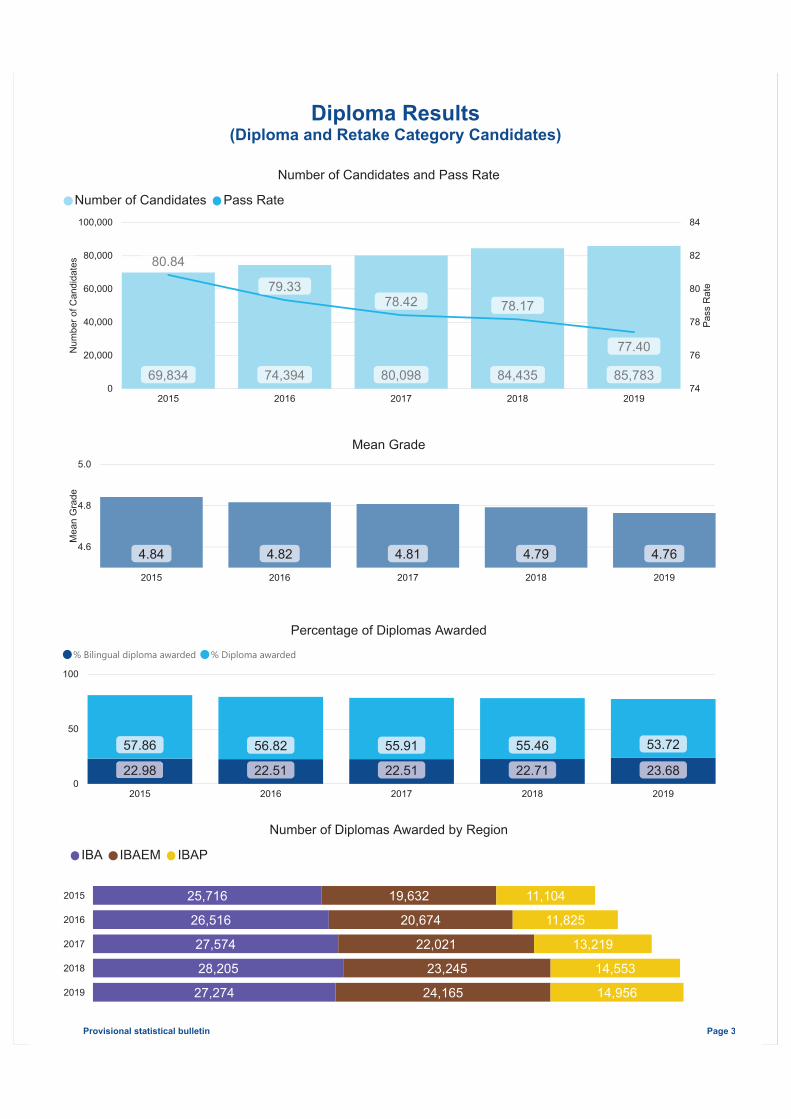
Number of Candidates and Pass Rate
0
20,000
40,000
60,000
80,000
100,000
74
76
78
80
82
84
Num
ber o
f Can
dida
tes
Pass
Rat
e
2015 2016 2017 2018 2019
69,834 85,78380,09874,394 84,435
80.84
77.40
78.4279.33
78.17
Number of Candidates Pass Rate
Number of Diplomas Awarded by Region
2015
2016
2017
2018
2019
25,716
26,516
27,574
28,205
27,274
19,632
20,674
22,021
23,245
24,165
11,104
11,825
13,219
14,553
14,956
IBA IBAEM IBAP
Percentage of Diplomas Awarded
0
50
100
2015 2016 2017 2018 2019
22.98 23.6822.51 22.7122.51
57.86 53.7255.9156.82 55.46
% Bilingual diploma awarded % Diploma awarded
Diploma Results(Diploma and Retake Category Candidates)
Provisional statistical bulletin Page 3
Mean Grade
4.6
4.8
5.0
Mea
n G
rade
2015 2016 2017 2018 2019
4.84 4.764.814.82 4.79

09/07/2019 P4
1/1
Number of Candidates Scoring 45 Points and Mean Total Points
0
100
200
300
28.00
30.00
32.00
Can
dida
tes
Scor
ing
45 p
oint
s
Mea
n To
tal P
oint
s
2015 2016 2017 2018 2019
214 213278201 259
30.24
29.63
29.8829.95 29.76
Candidates Scoring 45 Points Mean Total Points
Percentage of Candidates Awarded Core Points
0%
20%
40%
60%
80%
100%
2015 2016 2017 2018 2019
23.00% 29.90%28.29%26.98% 29.79%
26.41%26.21%25.05%25.80% 25.86%
40.45% 36.04%37.15%38.11% 36.62%
10.14% 9.52%9.11%
0 1 2 3
Total Points Distribution
0
1,000
2,000
3,000
4,000
5,000
Total Points
Num
ber o
f Can
dida
tes
0 5 10 15 20 25 30 35 40 45
2015 2016 2017 2018 2019
Total Points and Core Points(Diploma and Retake Category Candidates)
Provisional statistical bulletin Page 4
09/07/2019 P5
1/1
Gradeawarded
No gradeawarded
Total
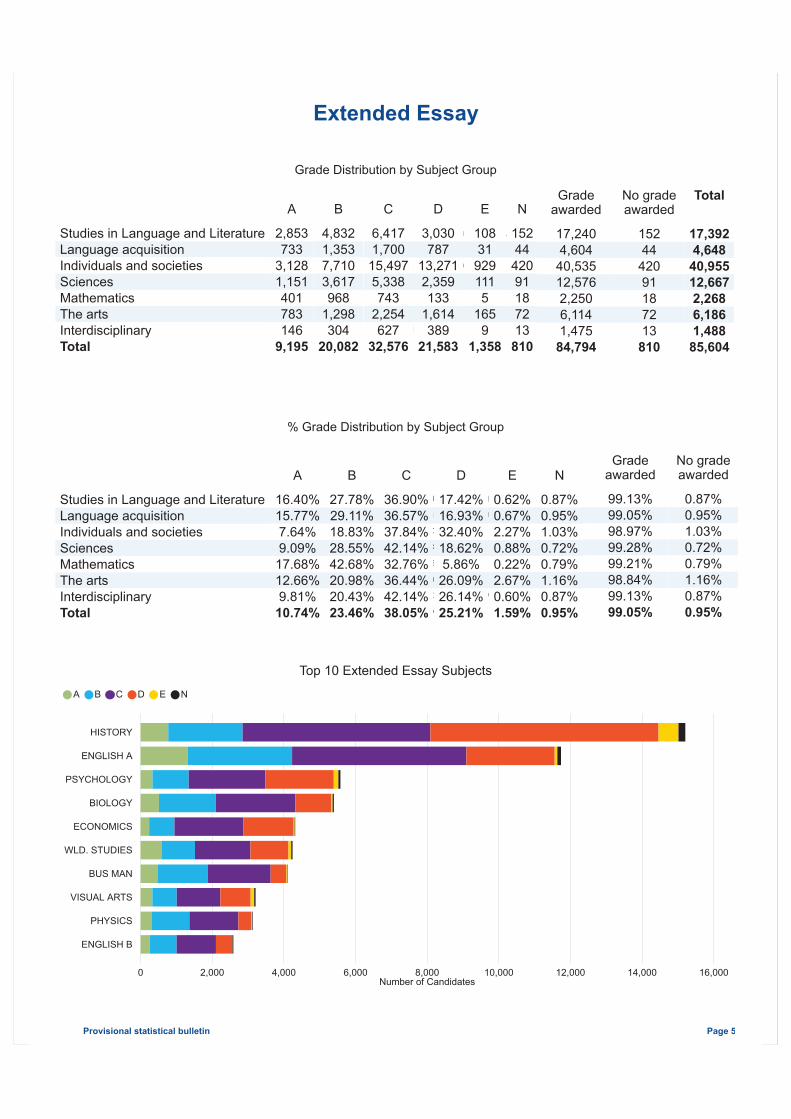
Studies in Language and LiteratureLanguage acquisitionIndividuals and societiesSciencesMathematicsThe artsInterdisciplinary
17,2404,604
40,53512,5762,2506,1141,475
15244
42091187213
17,3924,648
40,95512,6672,2686,1861,488
Total 84,794 810 85,604
Grade Distribution by Subject Group
Gradeawarded
No gradeawarded
Studies in Language and LiteratureLanguage acquisitionIndividuals and societiesSciencesMathematicsThe artsInterdisciplinary
99.13%99.05%98.97%99.28%99.21%98.84%99.13%
0.87%0.95%1.03%0.72%0.79%1.16%0.87%
Total 99.05% 0.95%
A
B
C
D
E
N
Studies in Language and LiteratureLanguage acquisitionIndividuals and societiesSciencesMathematicsThe artsInterdisciplinary
2,853733
3,1281,151401783146
4,8321,3537,7103,617968
1,298304
6,4171,700
15,4975,338743
2,254627
3,030787
13,2712,359133
1,614389
10831
9291115
1659
15244
42091187213
Total 9,195 20,082 32,576 21,583 1,358 810
A
B
C
D
E
N
Studies in Language and LiteratureLanguage acquisitionIndividuals and societiesSciencesMathematicsThe artsInterdisciplinary
16.40%15.77%7.64%9.09%
17.68%12.66%9.81%
27.78%29.11%18.83%28.55%42.68%20.98%20.43%
36.90%36.57%37.84%42.14%32.76%36.44%42.14%
17.42%16.93%32.40%18.62%5.86%
26.09%26.14%
0.62%0.67%2.27%0.88%0.22%2.67%0.60%
0.87%0.95%1.03%0.72%0.79%1.16%0.87%
Total 10.74% 23.46% 38.05% 25.21% 1.59% 0.95%
Extended Essay
Top 10 Extended Essay Subjects
0 2,000 4,000 6,000 8,000 10,000 12,000 14,000 16,000Number of Candidates
HISTORY
ENGLISH A
PSYCHOLOGY
BIOLOGY
ECONOMICS
WLD. STUDIES
BUS MAN
VISUAL ARTS
PHYSICS
ENGLISH B
A B C D E N
Provisional statistical bulletin Page 5
% Grade Distribution by Subject Group

09/07/2019 P6
1/1
Gradeawarded
No gradeawarded
99.16% 0.84%
Gradeawarded
No gradeawarded
Total
85445 721 86166
A
B
C
D
E
N
4,689 21,824 41,776 16,554 602 721
Theory of Knowledge
A
B
C
D
E
N
5.44% 25.33% 48.48% 19.21% 0.70% 0.84%
Grade Distribution
0
10,000
20,000
30,000
40,000
50,000
Num
ber o
f Can
dida
tes
E D C B A
602
16,554
41,776
21,824
4,689
Number of Candidates by Language
0 10,000 20,000 30,000 40,000 50,000 60,000 70,000 80,000Number of Candidates
ENGLISH
SPANISH
CHINESE
FRENCH
GERMAN
76,064
7,586
952
711
132
Provisional statistical bulletin Page 6
Grade Distribution
% Grade Distribution by Subject Group
09/07/2019 P7
1/1
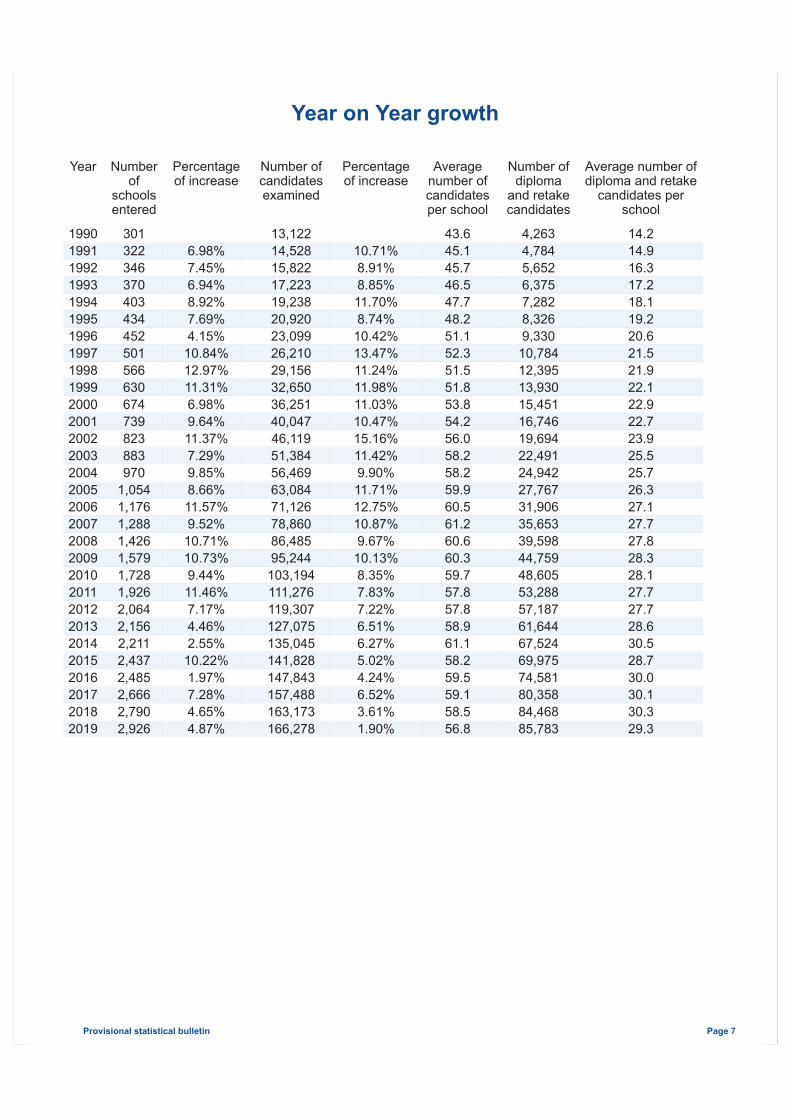
Year on Year growth
Year Numberof
schoolsentered
Percentageof increase
Number ofcandidatesexamined
Percentageof increase
Averagenumber ofcandidatesper school
Number ofdiploma
and retakecandidates
Average number ofdiploma and retake
candidates perschool
19901991199219931994199519961997199819992000200120022003200420052006200720082009
301322346370403434452501566630674739823883970
1,0541,1761,2881,4261,579
6.98%7.45%6.94%8.92%7.69%4.15%
10.84%12.97%11.31%6.98%9.64%11.37%7.29%9.85%8.66%11.57%9.52%
10.71%10.73%
13,12214,52815,82217,22319,23820,92023,09926,21029,15632,65036,25140,04746,11951,38456,46963,08471,12678,86086,48595,244
10.71%8.91%8.85%11.70%8.74%
10.42%13.47%11.24%11.98%11.03%10.47%15.16%11.42%9.90%11.71%12.75%10.87%9.67%
10.13%
43.645.145.746.547.748.251.152.351.551.853.854.256.058.258.259.960.561.260.660.3
4,2634,7845,6526,3757,2828,3269,330
10,78412,39513,93015,45116,74619,69422,49124,94227,76731,90635,65339,59844,759
14.214.916.317.218.119.220.621.521.922.122.922.723.925.525.726.327.127.727.828.3
2010201120122013201420152016201720182019
1,7281,9262,0642,1562,2112,4372,4852,6662,7902,926
9.44%11.46%7.17%4.46%2.55%
10.22%1.97%7.28%4.65%4.87%
103,194111,276119,307127,075135,045141,828147,843157,488163,173166,278
8.35%7.83%7.22%6.51%6.27%5.02%4.24%6.52%3.61%1.90%
59.757.857.858.961.158.259.559.158.556.8
48,60553,28857,18761,64467,52469,97574,58180,35884,46885,783
28.127.727.728.630.528.730.030.130.329.3
Provisional statistical bulletin Page 7

09/07/2019 P8
1/1
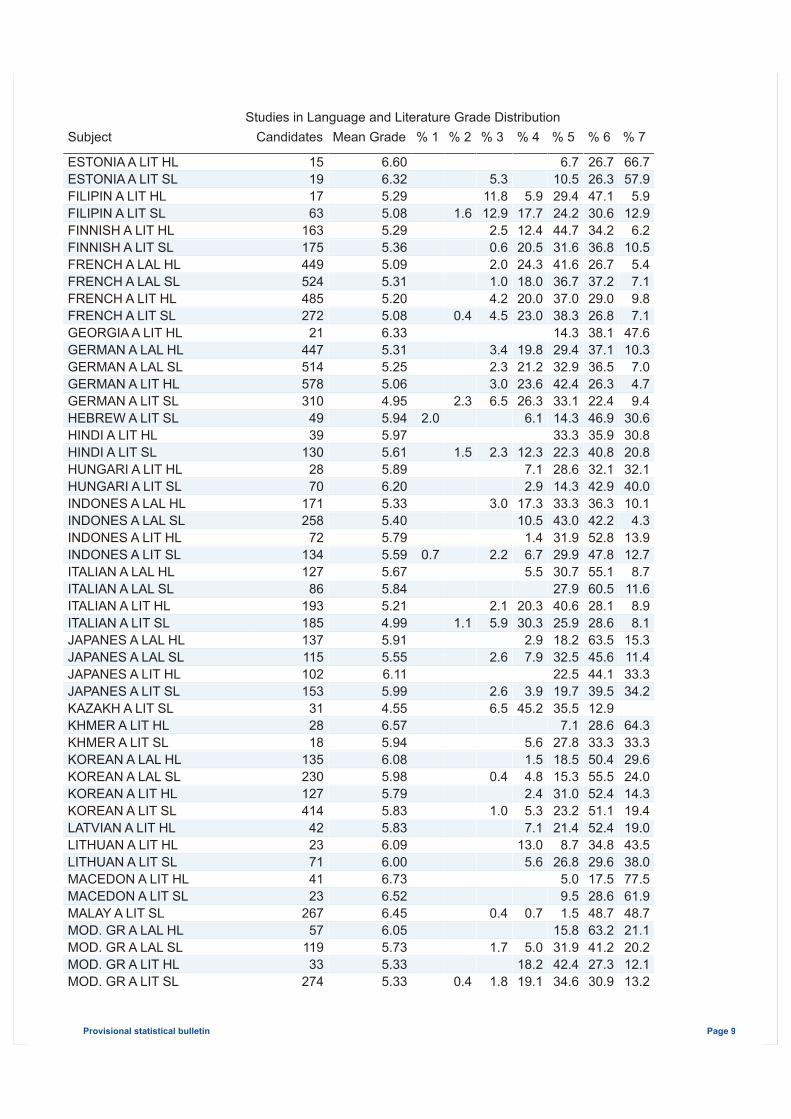
SubjectsSubjects with fewer than 10 candidates are excluded from these lists
Studies in Language and Literature Grade DistributionSubject Candidates Mean Grade % 1 % 2 % 3 % 4 % 5 % 6 % 7
ALBANIA A LIT HLALBANIA A LIT SLAMHARIC A LIT HLAMHARIC A LIT SLARABIC A LAL HLARABIC A LAL SLARABIC A LIT HLARABIC A LIT SLARMENIA A LIT SLAZERBAI A LIT HLBENGALI A LIT HLBENGALI A LIT SLBOSNIAN A LIT HLBULGARI A LIT HLBULGARI A LIT SLBURMESE A LIT SLCATALAN A LIT HLCATALAN A LIT SLCHINESE A LAL HLCHINESE A LAL SL
33431933
129357
54340
2919102353322314
14143
6781,459
6.526.336.266.095.365.345.135.076.146.635.905.966.066.316.236.006.145.465.675.77
0.3
1.8
0.1
3.60.83.76.6
0.40.6
3.02.3
6.19.0
12.425.923.4
6.9
10.04.3
7.11.4
15.46.14.1
7.0
21.115.238.745.133.325.813.8
10.017.417.3
6.39.1
28.615.233.331.627.0
39.446.531.642.445.035.527.833.637.936.860.056.559.656.359.121.450.741.050.153.9
57.644.247.436.4
3.66.29.38.4
41.463.220.021.723.137.531.842.932.610.311.914.3
CHINESE A LIT HLCHINESE A LIT SLCROATIA A LIT HLCROATIA A LIT SLCZECH A LIT HLCZECH A LIT SLDANISH A LIT HLDANISH A LIT SLDUTCH A LAL HLDUTCH A LAL SLDUTCH A LIT SLENGLISH A LAL HLENGLISH A LAL SLENGLISH A LIT HLENGLISH A LIT SL
5381,469
58256564
170133106204151
27,81717,15239,244
6,504
5.445.385.345.645.675.645.575.735.255.255.114.965.094.674.99
0.70.00.00.00.0
0.70.50.31.50.8
0.20.9
1.61.6
3.81.03.44.05.94.08.95.9
10.78.6
25.94.09.4
12.514.411.519.219.215.225.621.231.723.2
42.745.031.036.026.634.429.922.338.534.546.437.739.539.338.8
37.842.325.952.045.323.440.132.336.534.527.825.231.216.125.8
8.63.2
17.28.0
17.228.115.630.0
4.88.45.35.13.82.45.5
Grade Distribution by Subject GroupGroup Candidates Mean Grade % 1 % 2 % 3 % 4 % 5 % 6 % 7
Studies in Language and LiteratureLanguage acquisitionIndividuals and societiesSciencesMathematicsThe artsInterdisciplinary
121,41396,506
144,876121,634103,005
28,04314,953
4.955.264.624.284.264.294.17
0.00.10.31.32.30.21.7
0.91.44.0
10.311.35.77.8
6.57.1
12.620.717.922.424.0
25.117.128.824.023.628.925.7
37.325.930.221.123.325.223.9
24.935.318.315.515.013.812.0
5.313.1
5.66.96.73.74.8
Total 630,430 4.63 0.8 5.6 13.7 24.5 27.7 20.8 7.0
Provisional statistical bulletin Page 8
09/07/2019 P9
1/1
Studies in Language and Literature Grade DistributionSubject Candidates Mean Grade % 1 % 2 % 3 % 4 % 5 % 6 % 7
ESTONIA A LIT HLESTONIA A LIT SLFILIPIN A LIT HLFILIPIN A LIT SLFINNISH A LIT HLFINNISH A LIT SLFRENCH A LAL HLFRENCH A LAL SLFRENCH A LIT HLFRENCH A LIT SLGEORGIA A LIT HLGERMAN A LAL HLGERMAN A LAL SLGERMAN A LIT HLGERMAN A LIT SLHEBREW A LIT SLHINDI A LIT HLHINDI A LIT SLHUNGARI A LIT HLHUNGARI A LIT SL
15191763
163175449524485272
21447514578310
4939
1302870
6.606.325.295.085.295.365.095.315.205.086.335.315.255.064.955.945.975.615.896.20
2.0
1.6
0.4
2.3
1.5
5.3
11.812.9
2.50.62.01.04.24.5
3.42.33.06.5
2.3
5.917.712.420.524.318.020.023.0
19.821.223.626.3
6.1
12.37.12.9
6.710.529.424.244.731.641.636.737.038.314.329.432.942.433.114.333.322.328.614.3
26.726.347.130.634.236.826.737.229.026.838.137.136.526.322.446.935.940.832.142.9
66.757.9
5.912.9
6.210.5
5.47.19.87.1
47.610.3
7.04.79.4
30.630.820.832.140.0
INDONES A LAL HLINDONES A LAL SLINDONES A LIT HLINDONES A LIT SLITALIAN A LAL HLITALIAN A LAL SLITALIAN A LIT HLITALIAN A LIT SLJAPANES A LAL HLJAPANES A LAL SLJAPANES A LIT HLJAPANES A LIT SLKAZAKH A LIT SLKHMER A LIT HLKHMER A LIT SLKOREAN A LAL HLKOREAN A LAL SLKOREAN A LIT HLKOREAN A LIT SLLATVIAN A LIT HL
171258
72134127
86193185137115102153
312818
135230127414
42
5.335.405.795.595.675.845.214.995.915.556.115.994.556.575.946.085.985.795.835.83
0.7
1.1
3.0
2.2
2.15.9
2.6
2.66.5
0.4
1.0
17.310.5
1.46.75.5
20.330.3
2.97.9
3.9
45.2
5.61.54.82.45.37.1
33.343.031.929.930.727.940.625.918.232.522.519.735.5
7.127.818.515.331.023.221.4
36.342.252.847.855.160.528.128.663.545.644.139.512.928.633.350.455.552.451.152.4
10.14.3
13.912.7
8.711.68.98.1
15.311.433.334.2
64.333.329.624.014.319.419.0
LITHUAN A LIT HLLITHUAN A LIT SLMACEDON A LIT HLMACEDON A LIT SLMALAY A LIT SLMOD. GR A LAL HLMOD. GR A LAL SLMOD. GR A LIT HLMOD. GR A LIT SL
23714123
26757
11933
274
6.096.006.736.526.456.055.735.335.33
0.4
0.4
1.7
1.8
13.05.6
0.7
5.018.219.1
8.726.8
5.09.51.5
15.831.942.434.6
34.829.617.528.648.763.241.227.330.9
43.538.077.561.948.721.120.212.113.2
Provisional statistical bulletin Page 9

09/07/2019 P10
1/1
Studies in Language and Literature Grade DistributionSubject Candidates Mean Grade % 1 % 2 % 3 % 4 % 5 % 6 % 7
NEPALI A LIT HLNEPALI A LIT SLNORWEGI A LAL HLNORWEGI A LAL SLNORWEGI A LIT HLNORWEGI A LIT SLPERSIAN A LIT HLPERSIAN A LIT SLPOLISH A LIT HLPOLISH A LIT SLPORTUGU A LAL HLPORTUGU A LAL SLPORTUGU A LIT HLPORTUGU A LIT SLROMANIA A LIT HLROMANIA A LIT SLRUSSIAN A LAL HLRUSSIAN A LAL SLRUSSIAN A LIT HLRUSSIAN A LIT SL
11463323
1481152151
160928368160
7086282948
136129268
6.646.505.855.575.525.103.433.845.475.405.425.425.415.356.466.545.905.745.354.90
2.0
1.84.8
12.0
1.9
1.44.5
61.928.0
1.31.70.8
2.4
7.811.0
3.017.413.720.719.030.013.816.121.214.411.823.5
2.14.4
16.422.8
2.2
18.217.429.536.914.316.036.933.925.540.045.625.9
10.731.329.427.333.5
36.445.769.756.542.527.0
10.033.136.840.535.032.432.953.625.041.754.429.720.5
63.652.2
9.18.7
13.09.0
2.0
15.011.412.010.610.315.346.464.325.011.818.810.3
SERBIAN A LIT HLSERBIAN A LIT SLSESOTHO A LIT HLSLOVAK A LIT HLSLOVAK A LIT SLSLOVENE A LIT HLSPANISH A LAL HLSPANISH A LAL SLSPANISH A LIT HLSPANISH A LIT SLSWAHILI A LIT HLSWAHILI A LIT SLSWEDISH A LAL HLSWEDISH A LAL SLSWEDISH A LIT HLSWEDISH A LIT SLTHAI A LAL HLTHAI A LAL SLTHAI A LIT SLTURKISH A LIT HL
494320145671
2,7511,2456,307
676114968
192148205
53159
39387
5.716.026.155.795.756.244.864.754.524.935.905.635.315.365.425.415.795.844.955.45
0.0
1.02.82.11.3
0.5
0.5
2.60.3
3.6
7.512.914.4
8.1
4.11.52.12.83.0
10.31.3
6.12.3
7.17.14.2
24.324.533.226.3
14.320.917.014.615.1
7.56.3
30.810.6
24.514.0
5.035.723.2
7.043.030.832.432.520.018.434.329.831.932.730.223.923.137.0
61.262.875.028.642.949.319.823.815.124.570.040.831.342.638.934.237.749.112.842.2
8.220.920.028.623.239.4
4.45.22.87.3
10.022.411.98.0
11.814.624.520.820.5
8.5TURKISH A LIT SLUKRAINI A LIT SLURDU A LIT SLVIETNAM A LIT HLVIETNAM A LIT SL
378114553
133
5.556.676.005.665.27
0.5
0.8
2.4
1.6
12.7
2.33.8
19.7
27.0
20.535.837.8
40.733.352.350.928.3
16.766.725.0
9.411.8
Provisional statistical bulletin Page 10

09/07/2019 P11
1/1
Language Acquisition Grade DistributionSubject Candidates Mean Grade % 1 % 2 % 3 % 4 % 5 % 6 % 7
ARABIC AB. SLARABIC B HLARABIC B SLBEG. HINDI SLCHINESE B HLCHINESE B SLCLASS.GREEK SLDANISH B HLDANISH B SLDUTCH B HLDUTCH B SLENGLISH AB. SLENGLISH B HLENGLISH B SLFINNISH B HLFINNISH B SLFRENCH AB. SLFRENCH B HLFRENCH B SLGERMAN AB. SL
3891,130
53516
9622,514
15236
40127144
1,93416,406
2,6752057
3,8833,752
12,1891,253
4.535.775.655.256.306.006.135.494.795.945.494.485.725.765.705.814.895.145.035.00
0.4
0.20.10.1
8.6
0.2
0.10.6
0.4
5.90.00.2
3.32.31.81.0
17.71.31.1
0.43.1
6.8
18.4
2.120.9
0.61.9
1.8
11.410.7
8.211.1
23.49.3
10.337.5
1.86.5
20.013.223.7
5.513.222.3
5.87.65.0
12.323.317.823.023.2
19.721.024.318.8
8.516.9
6.721.426.317.333.326.225.821.835.017.526.223.727.525.8
23.647.649.825.045.931.313.339.323.755.136.117.456.349.045.040.424.529.530.529.4
7.020.814.218.843.441.660.018.8
7.922.015.3
7.011.619.515.028.111.015.7
8.99.4
GERMAN B HLGERMAN B SLHEBREW B SLHINDI B HLHINDI B SLINDONESIAN B HLINDONESIAN B SLITALIAN AB. SLITALIAN B HLITALIAN B SLJAPANESE AB. SLJAPANESE B HLJAPANESE B SLKOREAN B HLKOREAN B SLLATIN HLLATIN SLMALAY AB. SLMANDARIN AB. SLNORWEGIAN B HL
1,6171,970
55454925223179592186407435102372
4064
329917
491,412
154
5.685.105.875.435.786.166.014.875.934.805.046.125.086.345.354.203.916.185.415.59
0.5
1.50.3
0.2
0.9
1.21.12.73.31.00.6
1.7
15.411.3
1.91.3
2.29.4
0.90.30.50.6
10.48.6
20.413.2
1.07.5
5.0
24.032.3
7.84.6
10.121.4
7.411.33.71.83.4
28.34.3
23.917.4
9.926.1
18.315.126.7
2.015.111.2
24.827.425.938.924.710.416.928.411.818.722.610.927.810.528.319.415.316.321.021.1
43.828.938.942.059.856.353.424.030.616.226.827.725.044.725.013.810.342.929.540.8
19.212.027.8
6.911.531.125.8
7.743.518.216.249.513.144.721.710.8
3.738.824.421.1
NORWEGIAN B SLPORTUGUESE B HLPORTUGUESE B SLRUSSIAN AB. SLRUSSIAN B HLRUSSIAN B SLSPANISH AB. SLSPANISH B HLSPANISH B SLSWAHILI AB. SL
746263
10899
1127,7568,342
20,61147
5.326.195.925.266.546.114.965.325.035.53
0.10.00.0
0.9
2.81.30.7
8.2
13.1
0.99.56.39.22.1
16.43.26.3
24.3
6.424.215.023.610.6
28.816.128.612.1
6.110.025.829.128.529.8
28.838.731.719.633.746.427.333.128.946.8
17.841.933.329.960.236.410.315.1
9.110.6
Provisional statistical bulletin Page 11
09/07/2019 P12
1/1
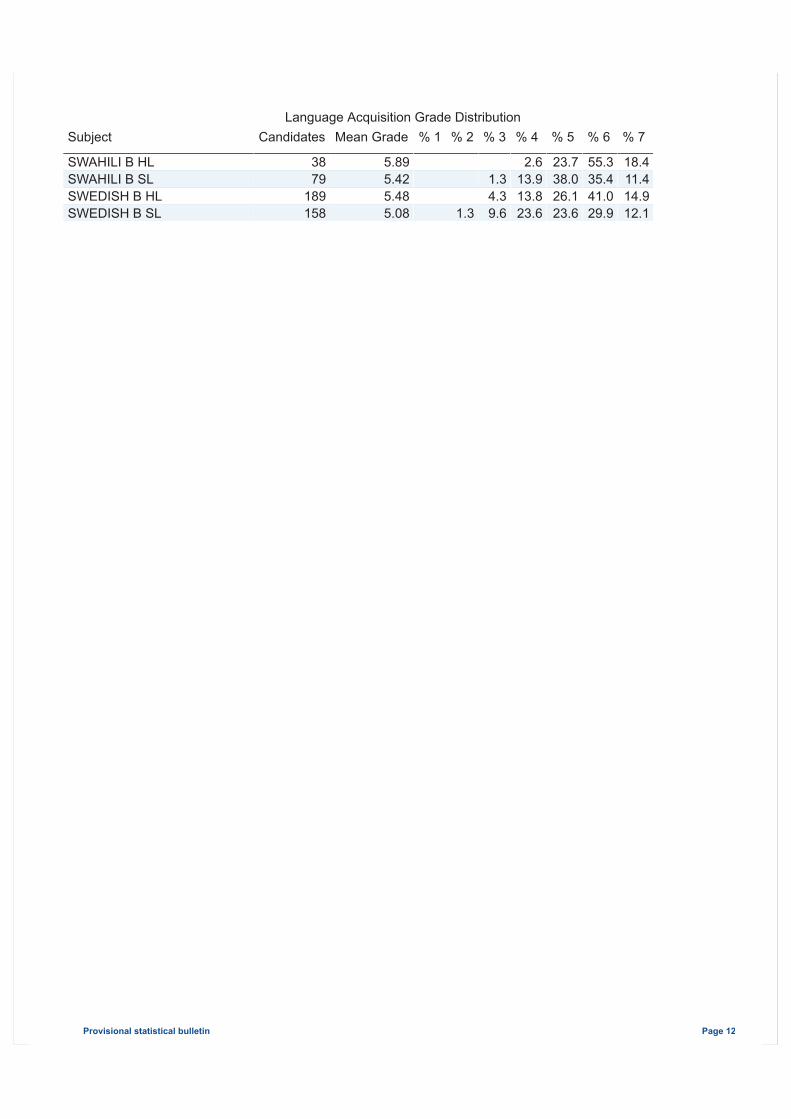
Language Acquisition Grade DistributionSubject Candidates Mean Grade % 1 % 2 % 3 % 4 % 5 % 6 % 7
SWAHILI B HLSWAHILI B SLSWEDISH B HLSWEDISH B SL
3879
189158
5.895.425.485.08
1.3
1.34.39.6
2.613.913.823.6
23.738.026.123.6
55.335.441.029.9
18.411.414.912.1
Provisional statistical bulletin Page 12

09/07/2019 P13
1/1
Individuals and Societies Grade DistributionSubject Candidates Mean Grade % 1 % 2 % 3 % 4 % 5 % 6 % 7
ART HISTORY SLBRAZ.SOC.STUD SLBUS MAN HLBUS MAN SLCHILE & PAC. SLCL.GK.ROM.ST. SLECONOMICS HLECONOMICS SLGEOGRAPHY HLGEOGRAPHY SLGLOB. POL HLGLOB. POL SLHISTORY HLHISTORY SLITGS HLITGS SLPHILOSOPHY HLPHILOSOPHY SLPOLITICAL TH. SLPSYCHOLOGY HL
137164
14,2957,392
3844
16,4019,1685,4893,8762,2541,296
43,4727,9101,4201,4571,7492,392
2311,027
4.954.924.794.795.435.405.094.665.174.795.074.764.294.454.344.334.924.775.484.69
0.8
0.10.5
0.40.90.00.20.10.10.20.10.40.20.2
0.2
5.53.03.34.7
2.52.55.50.63.01.03.04.64.04.06.11.01.7
3.2
10.911.010.410.1
10.0
8.216.3
6.713.9
5.510.815.611.115.617.8
9.213.2
8.712.4
15.624.426.823.8
5.415.018.121.017.922.220.925.038.636.135.130.325.125.9
8.725.8
29.725.028.730.951.420.030.925.236.731.037.735.929.235.032.230.032.731.626.131.3
23.425.623.921.337.822.527.721.925.320.927.318.4
9.911.711.913.724.621.039.123.4
14.111.06.88.85.4
30.012.3
9.212.7
8.87.56.81.82.00.81.97.26.6
17.43.6
PSYCHOLOGY SLSOC.CUL.ANTH. HLSOC.CUL.ANTH. SLTURK 20TH CEN SLWLD ART CULT SLWORLD RELIG. SL
10,441750
1,886487
561,243
4.394.824.515.425.734.60
0.80.10.2
0.3
8.52.83.11.0
2.1
14.313.315.9
3.1
14.4
27.725.831.812.6
9.131.5
28.126.328.432.025.529.0
17.320.316.738.849.118.3
3.211.43.9
12.616.4
4.5
Sciences Grade DistributionSubject Candidates Mean Grade % 1 % 2 % 3 % 4 % 5 % 6 % 7
ASTRONOMY SLBIOLOGY HLBIOLOGY SLCHEMISTRY HLCHEMISTRY SLCOMPUTER SC. HLCOMPUTER SC. SLDESIGN TECH. HLDESIGN TECH. SLFOOD SCI.TECH SLMARINE SCI. SLNOS SLPHYSICS HLPHYSICS SLSPORTS EX SCI HLSPORTS EX SCI SL
2530,88121,26816,76115,927
2,2342,1921,2801,084
19193193
13,84812,511
6212,597
4.684.344.184.504.014.203.844.453.965.844.304.364.654.034.873.95
1.20.91.12.82.02.30.3
0.71.7
0.9
8.3
10.98.8
15.611.617.2
4.98.5
11.711.46.4
13.13.9
13.7
12.018.621.918.022.618.024.916.128.2
5.321.115.018.626.813.027.1
36.027.026.720.121.424.524.031.132.6
25.025.420.923.221.123.3
32.023.120.623.317.025.416.727.422.021.120.627.522.317.227.521.1
12.016.314.320.215.113.111.416.5
7.052.611.115.517.410.022.910.1
8.05.64.88.55.45.33.63.71.7
21.110.6
5.213.7
8.011.53.7
Provisional statistical bulletin Page 13

09/07/2019 P14
1/1
Mathematics Grade DistributionSubject Candidates Mean Grade % 1 % 2 % 3 % 4 % 5 % 6 % 7
FURTH. MATHS HLMATH.STUDIES SLMATHEMATICS HLMATHEMATICS SL
27936,78916,05949,878
4.704.174.694.19
3.83.11.22.0
10.611.67.2
12.4
14.417.013.620.0
16.324.622.023.4
14.425.524.921.3
18.613.518.514.8
22.04.8
12.66.1
The Arts Grade DistributionSubject Candidates Mean Grade % 1 % 2 % 3 % 4 % 5 % 6 % 7
DANCE HLDANCE SLFILM HLFILM SLMUSIC HLMUSIC SLTHEATRE HLTHEATRE SLVISUAL ARTS HLVISUAL ARTS SL
364282
2,6031,3531,4032,3082,6581,319
10,1965,557
4.804.224.384.094.714.654.874.484.263.76
0.30.20.10.30.40.80.10.3
2.54.56.48.62.81.63.06.94.7
10.4
11.333.215.521.817.614.210.614.523.835.3
25.222.831.436.622.330.524.529.529.628.3
32.918.729.019.728.827.527.626.026.319.2
20.716.813.810.620.121.924.814.612.8
5.5
7.44.13.62.68.44.19.17.82.61.0
Interdisciplinary Subjects Grade DistributionSubject Subject Groups Candidates Mean Grade % 1 % 2 % 3 % 4 % 5 % 6 % 7
ENV. AND SOC.SLLIT AND PERFSL
Individuals andsocieties/SciencesStudies inLanguage andLiterature/The Arts
14,423
530
4.16
4.56
1.8
8.0
2.0
24.3
16.7
25.5
30.2
23.7
29.8
11.8
16.9
4.8
4.4
Provisional statistical bulletin Page 14
09/07/2019 P15
1/1
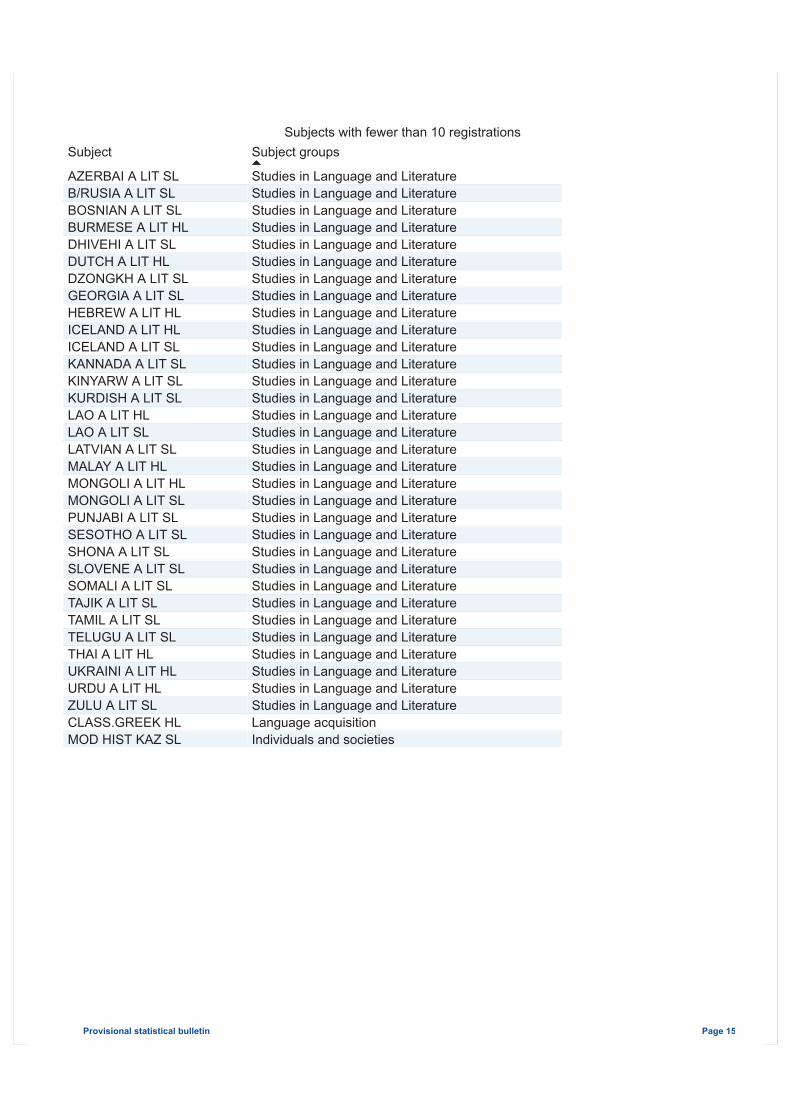
Subjects with fewer than 10 registrationsSubject Subject groups
AZERBAI A LIT SLB/RUSIA A LIT SLBOSNIAN A LIT SLBURMESE A LIT HLDHIVEHI A LIT SLDUTCH A LIT HLDZONGKH A LIT SLGEORGIA A LIT SLHEBREW A LIT HLICELAND A LIT HLICELAND A LIT SLKANNADA A LIT SLKINYARW A LIT SLKURDISH A LIT SLLAO A LIT HLLAO A LIT SLLATVIAN A LIT SLMALAY A LIT HLMONGOLI A LIT HLMONGOLI A LIT SL
Studies in Language and LiteratureStudies in Language and LiteratureStudies in Language and LiteratureStudies in Language and LiteratureStudies in Language and LiteratureStudies in Language and LiteratureStudies in Language and LiteratureStudies in Language and LiteratureStudies in Language and LiteratureStudies in Language and LiteratureStudies in Language and LiteratureStudies in Language and LiteratureStudies in Language and LiteratureStudies in Language and LiteratureStudies in Language and LiteratureStudies in Language and LiteratureStudies in Language and LiteratureStudies in Language and LiteratureStudies in Language and LiteratureStudies in Language and Literature
PUNJABI A LIT SLSESOTHO A LIT SLSHONA A LIT SLSLOVENE A LIT SLSOMALI A LIT SLTAJIK A LIT SLTAMIL A LIT SLTELUGU A LIT SLTHAI A LIT HLUKRAINI A LIT HLURDU A LIT HLZULU A LIT SLCLASS.GREEK HLMOD HIST KAZ SL
Studies in Language and LiteratureStudies in Language and LiteratureStudies in Language and LiteratureStudies in Language and LiteratureStudies in Language and LiteratureStudies in Language and LiteratureStudies in Language and LiteratureStudies in Language and LiteratureStudies in Language and LiteratureStudies in Language and LiteratureStudies in Language and LiteratureStudies in Language and LiteratureLanguage acquisitionIndividuals and societies
Provisional statistical bulletin Page 15

09/07/2019 P16
1/1
Growth of Schools by Region
0
1,000
2,000
3,000
Num
ber o
f Sch
ools
2015 2016 2017 2018 2019
1,185 1,281 1,391 1,423 1,482
776 832 862 916 963349
374 413 451 481
IBA IBAEM IBAP
Number of Schools by Cohort Size 2015
2016
2017
2018
2019
<=10 Candidates11-20 Candidates21-40 Candidates41-60 Candidates61-80 Candidates81-100 Candidates101-200 Candidates>200 Candidates
269357545358230149302100
304417606361219164309107
349433626407227185334105
404458640397250186339116
444467688428254170371104
Total 2,310 2,487 2,666 2,790 2,926
Growth of Schools by Working Language
1,800
2,000
2,200
2,400
2,600
2,800
Num
ber o
f Sch
ools
2015 2016 2017 2018 2019
2,0702,177
2,2862,385
2,481210
276
343
364399
ENGLISH FRENCH SPANISH
Schools
Provisional statistical bulletin Page 16

09/07/2019 P17
1/1
Growth of Candidates by Region
0
50,000
100,000
150,000
200,000
Num
ber o
f Can
dida
tes
2015 2016 2017 2018 2019
96,657 110,108107,260101,529 109,717
28,99636,47632,70430,574
34,84915,139
19,69417,40915,831
18,730
IBA IBAEM IBAP
Growth of Candidates by Category
0
50,000
100,000
150,000
200,000
Num
ber o
f Can
dida
tes
2015 2016 2017 2018 2019
21,093 27,54021,31921,96621,415
49,850 52,03157,50955,25152,086
68,35284,88178,68573,215
82,810
ANTICIPATED COURSE DIPLOMA RETAKE
Growth of Candidates by Gender
0
20,000
40,000
60,000
80,000
100,000
Num
ber o
f Can
dida
tes
2015 2016 2017 2018 2019
F M X
Growth of Candidates
2015
2016
2017
2018
2019
140,792 147,934 157,373 163,296 166,278
Candidates
Provisional statistical bulletin Page 17
09/07/2019 P18
1/1
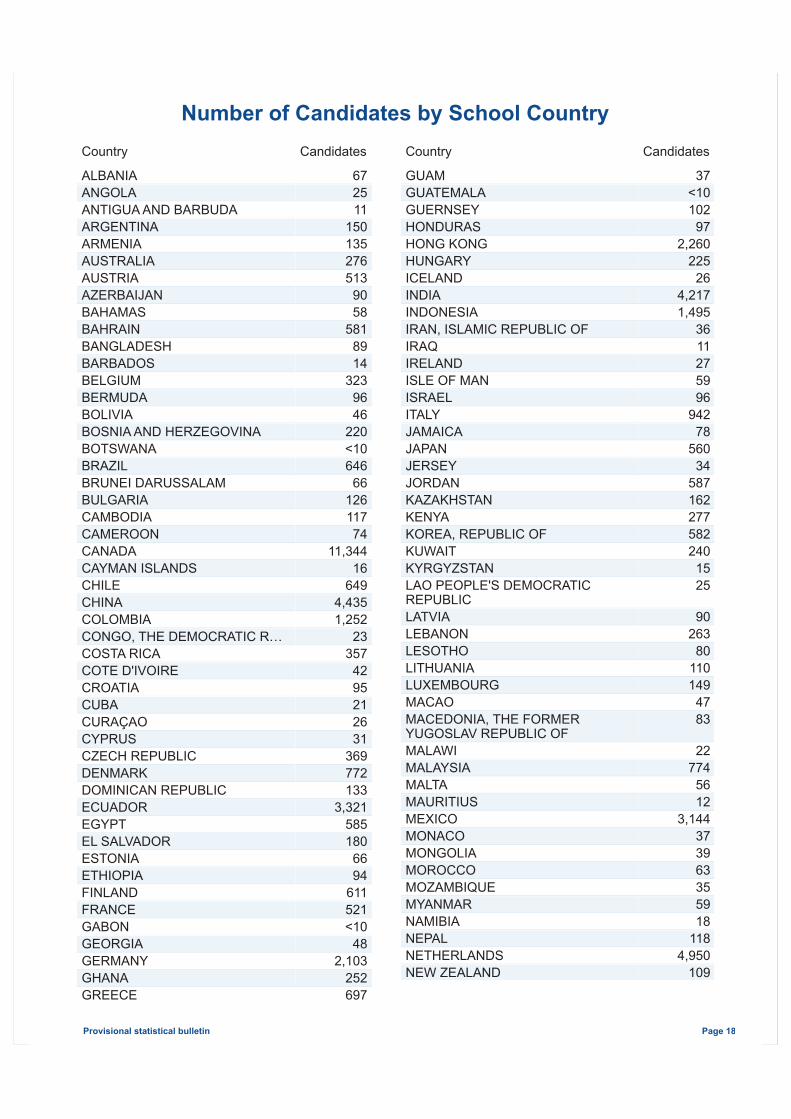
Number of Candidates by School CountryCountry Candidates
ALBANIAANGOLAANTIGUA AND BARBUDAARGENTINAARMENIAAUSTRALIAAUSTRIAAZERBAIJANBAHAMASBAHRAINBANGLADESHBARBADOSBELGIUMBERMUDABOLIVIABOSNIA AND HERZEGOVINABOTSWANABRAZILBRUNEI DARUSSALAMBULGARIA
672511
150135276513
9058
5818914
3239646
220<10646
66126
CAMBODIACAMEROONCANADACAYMAN ISLANDSCHILECHINACOLOMBIACONGO, THE DEMOCRATIC R…COSTA RICACOTE D'IVOIRECROATIACUBACURAÇAOCYPRUSCZECH REPUBLICDENMARKDOMINICAN REPUBLICECUADOREGYPTEL SALVADOR
11774
11,34416
6494,4351,252
23357
4295212631
369772133
3,321585180
ESTONIAETHIOPIAFINLANDFRANCEGABONGEORGIAGERMANYGHANAGREECE
6694
611521<10
482,103
252697
Country Candidates
GUAMGUATEMALAGUERNSEYHONDURASHONG KONGHUNGARYICELANDINDIAINDONESIAIRAN, ISLAMIC REPUBLIC OFIRAQIRELANDISLE OF MANISRAELITALYJAMAICAJAPANJERSEYJORDANKAZAKHSTAN
37<10102
972,260
22526
4,2171,495
3611275996
94278
56034
587162
KENYAKOREA, REPUBLIC OFKUWAITKYRGYZSTANLAO PEOPLE'S DEMOCRATICREPUBLICLATVIALEBANONLESOTHOLITHUANIALUXEMBOURGMACAOMACEDONIA, THE FORMERYUGOSLAV REPUBLIC OFMALAWIMALAYSIAMALTAMAURITIUSMEXICOMONACOMONGOLIAMOROCCO
277582240
1525
90263
80110149
4783
22774
5612
3,144373963
MOZAMBIQUEMYANMARNAMIBIANEPALNETHERLANDSNEW ZEALAND
355918
1184,950
109
Provisional statistical bulletin Page 18

09/07/2019 P19
1/1
Excludes withdrawn candidates.Countries with fewer than ten candidates shows only <10
Country Candidates
NICARAGUANIGERIANORWAYOMANPAKISTANPALESTINE, STATE OFPANAMAPERUPHILIPPINESPOLANDPORTUGALPUERTO RICOQATARROMANIARUSSIAN FEDERATIONRWANDASAUDI ARABIASENEGALSERBIASINGAPORE
<1048
732134171
97123165753
1,405344
37490187182
72463
5270
1,544SINT MAARTEN (DUTCH)SLOVAKIASLOVENIASOUTH AFRICASPAINSRI LANKASUDANSWAZILANDSWEDENSWITZERLANDTAIWANTANZANIA, UNITED REPUBLIC OFTHAILANDTOGOTUNISIATURKEYUGANDAUKRAINEUNITED ARAB EMIRATESUNITED KINGDOM
15124
9671
3,289192827
1,3301,870
369160
1,0433523
1,0648945
1,9204,589
UNITED STATESURUGUAYUZBEKISTANVENEZUELAVIETNAMVIRGIN ISLANDS, BRITISHVIRGIN ISLANDS, U.S.ZAMBIAZIMBABWE
87,8956943
144490
14126729
Provisional statistical bulletin Page 19