ORIGINAL ARTICLE
The frontal aslant tract underlies speech fluency in persistentdevelopmental stuttering
Vered Kronfeld-Duenias • Ofer Amir •
Ruth Ezrati-Vinacour • Oren Civier •
Michal Ben-Shachar
Received: 16 June 2014 / Accepted: 6 October 2014
� Springer-Verlag Berlin Heidelberg 2014
Abstract The frontal aslant tract (FAT) is a pathway that
connects the inferior frontal gyrus with the supplementary
motor area (SMA) and pre-SMA. The FAT was recently
identified and introduced as part of a ‘‘motor stream’’ that
plays an important role in speech production. In this study,
we use diffusion imaging to examine the hypothesis that
the FAT underlies speech fluency, by studying its proper-
ties in individuals with persistent developmental stuttering,
a speech disorder that disrupts the production of fluent
speech. We use tractography to quantify the volume and
diffusion properties of the FAT in a group of adults who
stutter (AWS) and fluent controls. Additionally, we use
tractography to extract these measures from the cortico-
spinal tract (CST), a well-known component of the motor
system. We compute diffusion measures in multiple points
along the tracts, and examine the correlation between these
diffusion measures and behavioral measures of speech
fluency. Our data show increased mean diffusivity in
bilateral FAT of AWS compared with controls. In addition,
the results show regions within the left FAT and the left
CST where diffusivity values are increased in AWS com-
pared with controls. Last, we report that in AWS, diffu-
sivity values measured within sub-regions of the left FAT
negatively correlate with speech fluency. Our findings are
the first to relate the FAT with fluent speech production in
stuttering, thus adding to the current knowledge of the
functional role that this tract plays in speech production
and to the literature of the etiology of persistent develop-
mental stuttering.
Keywords White matter � Diffusion imaging � Fiber
tracking � Fluency � Frontal aslant tract � Corticospinal tract
Introduction
The frontal aslant tract (FAT) is a newly identified tract
(Catani et al. 2012) that connects the inferior frontal gyrus
(IFG) with supplementary and pre- supplementary motor
areas (SMA and pre-SMA, respectively). Recently, FAT
was introduced as part of a ‘‘motor stream’’ that plays an
important role in speech production (Dick et al. 2013),
complementing the accepted dorsal and ventral language
streams (Hickok and Poeppel 2007). Several recent studies
suggest that FAT plays a role in speech production. First,
the volume of the FAT is left lateralized in right handed
individuals (Catani et al. 2012), similar to other language-
related pathways such as the long segment of the superior
longitudinal fasciculus (Thiebaut de Schotten et al. 2011).
Second, intraoperative electrical stimulation of the left
FAT results in speech arrest (Vassal et al. 2014). In addi-
tion, in primary progressive aphasia, microstructural mea-
sures of the left FAT correlate with speech fluency
Electronic supplementary material The online version of thisarticle (doi:10.1007/s00429-014-0912-8) contains supplementarymaterial, which is available to authorized users.
V. Kronfeld-Duenias (&) � O. Civier � M. Ben-Shachar
The Gonda Multidisciplinary Brain Research Center, Bar-Ilan
University, 5290002 Ramat-Gan, Israel
e-mail: [email protected]
M. Ben-Shachar
e-mail: [email protected]
O. Amir � R. Ezrati-Vinacour
Department of Communication Disorders, Sackler Faculty of
Medicine, Tel-Aviv University, Tel-Aviv, Israel
M. Ben-Shachar
Department of English Literature and Linguistics, Bar-Ilan
University, 5290002 Ramat-Gan, Israel
123
Brain Struct Funct
DOI 10.1007/s00429-014-0912-8
measured using a story telling task (Catani et al. 2013). In
this study, we specifically target the FAT and examine its
contribution to persistent developmental stuttering, a
speech disorder that affects a person’s ability to fluently
produce speech.
Persistent developmental stuttering is a speech disorder
primarily characterized by prolongations, blocks and rep-
etitions of sounds or syllables that occur while a person
attempts to produce speech. These breakdowns in the
production of fluent speech (stuttering events) are some-
times associated with other symptoms such as eye blinking,
jaw jerking and other involuntary movements termed sec-
ondary or associated behaviors (Bloodstein and Ratner
2008). While this description of stuttering events clearly
depends on motor aspects of speech production, it has
previously been postulated that multiple factors interact in
producing these disfluencies (Smith 1999; Smith et al.
2012). Specifically, one theoretical approach suggests that
the motor difficulties observed during stuttering events are
in fact the result of a core deficit in linguistic processing
(Perkins et al. 1991; Postma and Kolk 1993). Persistent
developmental stuttering therefore lies at the border
between several systems including the motor and language
networks, thus providing a unique opportunity to study the
interface between these domains.
Producing fluent speech requires precise temporal
coordination between distant brain regions. Indeed, func-
tional imaging studies of persistent developmental stutter-
ing, in which the fluent production is disturbed, indicate
atypical patterns of activation in a wide network of cortical
and sub-cortical regions including the right frontal oper-
culum, bilateral auditory cortices, cerebellum and basal
ganglia (for reviews, see Alm 2004; Brown et al. 2005).
The distributed nature of these functional differences sug-
gests that persistent developmental stuttering may be
associated with atypical properties of white matter path-
ways, not only with specific localized cortical damage.
Indeed, in the last decade, several studies have examined
structural white matter differences between people who
stutter and neurotypical controls.
The most replicable finding in studies of white matter in
persistent developmental stuttering concerns fractional
anisotropy (FA) reductions in the left Rolandic operculum
(Chang et al. 2008; Connally et al. 2013; Cykowski et al.
2010; Sommer et al. 2002; Watkins et al. 2008), located
caudally to Brodmann area 44 (BA44) and close to the
primary motor representation of tongue, larynx and phar-
ynx. Typically, differences in the left Rolandic operculum
were ascribed to the superior longitudinal fasciculus/arcu-
ate fasciculus (Chang et al. 2008; Connally et al. 2013;
Cykowski et al. 2010; Watkins et al. 2008), a well-known
pathway that is considered part of the language network
(Hickok and Poeppel 2007). A second replicable finding is
FA reduction in the corticospinal tracts (CSTs) of the
motor network. Bilateral FA reductions in the CST were
previously reported in children who stutter (Chang et al.
2008) as well as in adults who stutter (Cai et al. 2014). One
study in adolescents and young individuals who stutter,
reported that these FA differences are restricted to the right
CST (Watkins et al. 2008), while another study showed a
significant difference between the FA values measured in
the left CST and those measured in the right CST of people
who stutter compared with the same measurements calcu-
lated in controls (Connally et al. 2013). Differences in the
left Rolandic operculum as well as in the CST suggest that
both language pathways and motor connections are sus-
pected contributors to persistent developmental stuttering.
To the best of our knowledge, ours is the first attempt
to examine the role of the FAT in persistent develop-
mental stuttering. However, the potential involvement of
this tract in persistent developmental stuttering is implied
by previous reports of structural and functional stuttering-
related anomalies in the cortical endpoints of this tract:
the IFG and the pre-SMA/SMA. Studies in people who
stutter show gray matter volume differences in IFG (Beal
et al. 2007, 2013; Cai et al. 2014; Chang et al. 2008; Kell
et al. 2009) as well as white matter volume differences
(Jancke et al. 2004) and anisotropy reductions (Connally
et al. 2013; Watkins et al. 2008) underneath this region.
Comparing spontaneous recovery from persistent devel-
opmental stuttering with therapy-induced recovery, one
study suggested the IFG as the only neural marker of
optimal repair (Kell et al. 2009). Structural and functional
differences related to persistent developmental stuttering
were also reported in the SMA (Brown et al. 2005; Chang
et al. 2008, 2011; Lu et al. 2010b). One recent study used
graph theory and reported a lower degree of centrality in
left SMA of adults who stutter (AWS) compared with
fluent controls, indicating that the left SMA may serve as
a hub in the speech network of the typical population but
not in persistent developmental stuttering (Cai et al.
2014). The functionality of the IFG and SMA in typical
populations, along with previous reports of their
involvement in persistent developmental stuttering, sug-
gests that the tract that connects these regions, the FAT,
may play a role in this disorder.
In this study, we use diffusion magnetic resonance
imaging and tractography to study the FAT in persistent
developmental stuttering. We identify the FAT bilaterally
in a group of AWS as well as in neurotypical adults. In
addition, we identify the CST, a well-known motor tract
which has previously been related to persistent develop-
mental stuttering. We compare the volume estimations and
average diffusion properties of these tracts in AWS vs.
controls and complement this analysis with a more sensi-
tive comparison of diffusion properties along the entire
Brain Struct Funct
123

extent of the tract. Last, we correlate the diffusivity mea-
sures extracted from the tract profiles with a behavioral
measure of speech fluency. By studying the functionality of
the FAT in persistent developmental stuttering we aim to
extend the current knowledge about the involvement of this
tract in speech production and contribute to the under-
standing of the newly described ‘‘motor stream’’ in
language.
Methods
Participants
A total of 34 individuals participated in this study. Par-
ticipants were physically healthy and reported no history of
neurological disease or psychiatric disorder. They were all
native Hebrew speakers who signed a written
informed consent to participate in the study. The research
protocol was approved by the Helsinki committee of the
Tel-Aviv Sourasky Medical Center and by the ethics
committee of the faculty of humanities in Bar-Ilan
University.
Participants were assigned to the group of AWS based
on the following criteria: (a) a reported history of stuttering
since childhood, (b) exhibited a minimum of three stut-
tering-like disfluencies (SLD; Ambrose and Yairi 1999) per
100 syllables during an unstructured interview (described
below) and (c) scored a total of at least 10 on the Stuttering
Severity Instrument (SSI-III; Riley 1994). Assignment of
participants to the control group was based on their self-
report of having no history of stuttering.
To ensure that all participants assigned to the group of
AWS were indeed individuals who stutter, two experienced
speech pathologists (O.A. and R.E.-V.) were asked to
blindly confirm the original classification based on their
impression from the audio-visual recording of an unstruc-
tured interview (see ‘‘Speaking tasks’’ below). Classifica-
tion was performed separately by each speech pathologist,
and only those participants who were classified by both
speech pathologists as individuals who stutter were
assigned to the group of AWS. Based on these criteria, 15
participants were assigned to the group of AWS (3 females,
mean age 32 years, age range 19–52 years), and 19 were
assigned to the control group (3 females, mean age
33 years, age range 19–53 years). Table 1 presents the
average demographic characteristics of the AWS and the
control participants.
Speaking tasks
To assess the frequency of stuttering, participants were
evaluated during two speaking tasks: an unstructured
interview and a reading task (Riley 1994).
Unstructured interview
Each participant was seated in a quiet room together with
the experimenter (V.K.-D.), and was asked to talk for
10 min about a neutral topic, such as a recent travel
experience, a movie or a book. The experimenter was
instructed to refrain from interrupting the speaker, and to
ask questions only when the participant was having diffi-
culties finding a topic to talk about. The session was
recorded simultaneously with a digital video camera (Sony
DCR-DVD 106E, Sony Corporation of America, New
York, NY, USA) and with a noise canceling microphone
(Sennheiser PC21, Sennheiser Electronic Corporation,
Berlin, Germany). Audio signals from the microphone
were digitally recorded using audio processing software
(Goldwave, Inc., St. John’s, Canada), on a mono channel,
with a sampling rate of 48 kHz (16 bit).
Reading task
Each participant was seated in a quiet room together with the
experimenter and was asked to read aloud one of three
paragraphs from the standardized and phonetically balanced
Thousand Islands reading passage (Amir and Levine-Yun-
dof 2013). The three paragraphs were of similar size (on
average: 200 syllables) and the different paragraphs were
assigned to the participants in a random order. This task was
recorded using a video camera (see above).
Table 1 Subject demographics and fluency measures
AWS
(N = 15)
Controls
(N = 19)
Significance
level
Age (years) 31.733 (9.93) 33.26 (9.91) n.s
Gender 12M/3F 16M/3F n.s
Handednessa 96 (8.28) 89.63 (17.84) n.s
Educationb
(years)
14.7 (2.86) 15.31 (2.8) n.s
Speech rate
(#SPS)
4.7 (1.18) 5.96 (0.78) p \ 10-3
SLD (%) 12.36 (16.73) 2.17 (1.03) p \ 0.05
St. Syll. (%) 7.86 (3.95) 2.1 (0.99) p \ 10-6
Mean values and standard deviations (in parentheses) are shown for
the AWS and the control participants
AWS adults who stutter, SPS syllables per second, SLD stuttering-like-
disfluencies, St. Syll. stuttered syllables, n.s not significant, M male,
F femalea Handedness scores are based on the Edinburgh handedness inven-
tory (Oldfield 1971). 100 indicate full right handedness, -100 indi-
cate full left handednessb Education data is missing in two AWS, therefore in this parameter,
N = 13 in this group
Brain Struct Funct
123
Evaluation of speech fluency
We obtained three measures of speech fluency: (a) Average
speech rate, (b) Stuttering-like disfluencies (SLD) and
(c) Percent of stuttered syllables. These measures were
calculated based on the digital audio recordings of the
unstructured interview. The audio recordings were used
because of their superior auditory signal-to-noise ratio
(SNR) compared to the video recordings, and based on
reports that visual information does not improve the reli-
ability of measuring stuttering frequency (MacDonald and
Mallard 1979; Williams et al. 1963). To calculate the flu-
ency measures, each interview was transcribed, until a
minimum of 600 consecutive syllables was obtained (exact
number of syllables slightly differed between participants
as only complete sentences were analyzed). Disfluencies
were first annotated by two independent trained research
assistants and then re-evaluated by a speech pathologist
(O.A.). There was a high level of agreement between the
raters on the classification of disfluencies, but any cases of
disagreement were discussed until full agreement between
all raters was reached. To reduce potential bias, both the
research assistants and the speech pathologist were blind to
the participant’s group assignment (stuttering/control).
The three measures of speech fluency (average speech
rate, SLD, percent of stuttered syllables) were calculated as
follows: (a) average speech rate was measured in units of
syllables per second (SPS). It was calculated as the ratio
between the total number of analyzed syllables and the
time it took the participant to produce them. This measure
was obtained from a visual and audio inspection of the
spectrographic display of the speech signal (as discussed in
Finkelstein and Amir 2013; Rochman and Amir 2013);
(b) SLD was calculated as the number of part-word repe-
titions, monosyllabic-word repetitions and disrhythmic
phonations, per 100 syllables. Other disfluencies like
interjections, revisions or phrase repetitions were excluded
from this measure (Ambrose and Yairi 1999); (c) the per-
cent of stuttered syllables was calculated based on the
syllables that included any type of SLD (Yairi and
Ambrose 2005).
Stuttering severity evaluation
We evaluated stuttering severity of each individual of the
group of AWS by administering the stuttering severity
evaluation instrument (Riley 1994). Following the
administration protocol for adults, we evaluated the per-
cent of stuttered syllables based on the transcription of the
two speaking tasks (the unstructured interview and the
reading task). Stuttering duration scores and physical
concomitants were evaluated by two speech pathologists
(O.A and R.E.-V.), based on the video recording of the
speaking tasks. Taken together, the percent of stuttered
syllables, stuttering duration scores and physical con-
comitants were used to obtain a total score of stuttering
severity rate (SSI score).
Image acquisition
Magnetic resonance imaging (MRI) was performed on a 3T
General Electric MRI scanner at the Tel-Aviv Sourasky
Medical Center. The MRI protocol included standard
anatomical and diffusion imaging sequences, acquired with
an eight channel head-coil. Participants were asked to lie
still during the scan, and their head motion was minimized
by placing cushions around their heads. Functional MRI
experiments were also included in the scan protocol but
those data are not reported here.
T1 image acquisition
High resolution T1 weighted anatomical images were
acquired using a 3D fast spoiled gradient echo (FSPGR)
sequence. We collected about 150 axial slices (±12 slices),
covering the entire cerebrum, with a spatial resolution of
1 9 1 9 1 mm voxel size.
Diffusion weighted image acquisition
A standard DTI protocol was applied by means of a single-
shot spin-echo diffusion-weighted echo-planar imaging
(DW-EPI) sequence. We collected *68 axial slices,
adjusting the number of slices to cover the entire cerebrum
in each participant (FOV = 240 mm; 128 9 128 matrix;
2 mm thick axial slices; voxel size: *2 9 2 9 2 mm). 19
diffusion-weighted volumes (b = 1,000 s/mm2) and one
reference volume (b = 0 s/mm2) were acquired using a
standard direction matrix (e.g., Sasson et al. 2010, 2012,
2013). This protocol was repeated twice for an improved
signal-to-noise ratio. Scan repetitions were not averaged so
that tensors were fit to the entire dataset from both scans
(see ‘‘Data preprocessing’’). Scanning 19 directions twice
was motivated by the fact that short scan time (5:50 min
per scan) reduces the chances of within-scan motion while
maintaining robust anisotropy measurements (Jones 2004).
Software
All data analysis and statistics were performed using Matlab
2012b (The Mathworks, Nattick, MA, USA). For data pre-
processing, we used the ‘mrDiffusion’ package (http://white.
stanford.edu/newlm/index.php/Software). Tract identifica-
tion and quantification were executed using ‘AFQ’, an
automated segmentation tool (Yeatman et al. 2012).Visual
inspection of the tracts and manual cleaning was performed
Brain Struct Funct
123
via ‘Quench’, an interactive 3D visualization tool (Akers
2006; http://white.stanford.edu/newlm/index.php/
Software#QUENCH).
Data preprocessing
As a first step, T1 images were aligned to the AC–PC
orientation. Diffusion weighted images were corrected for
Eddy-current distortions and subject motion (Rhode et al.
2004). Each diffusion weighted image was registered to the
mean of the two non-diffusion weighted (b0) images and
the mean b0 image was registered automatically to the T1
image, using a rigid body mutual information maximiza-
tion algorithm (implemented in SPM5; Friston and Ash-
burner 2004). Then, the combined transform resulting from
motion correction, eddy current correction and anatomical
alignment was applied to the raw diffusion data once, and
the data was resampled at exactly 2 9 2 9 2 mm isotropic
voxels. By applying the combined transform, we achieved
AC–PC aligned T1 registered images while only resam-
pling the raw data once. Next, the table of gradient direc-
tions was appropriately adjusted to fit the resampled
diffusion data (Leemans and Jones 2009).
We fitted the raw diffusion data with the tensor model
using a standard least-squares algorithm. Then, we
extracted the eigenvectors and eigenvalues of the tensor
and calculated FA as the normalized standard deviation of
the eigenvalues (Basser and Pierpaoli 1996). Using the
eigenvalues, we also calculated mean diffusivity (MD) as
the average of all three eigenvalues. Axial diffusivity (AD)
and radial diffusivity (RD) were calculated as comple-
mentary measures and were respectively defined as the
diffusivity along the principal axis (AD) and as the average
diffusivity along the two remaining minor axes (RD).
Tract identification protocol
We identified the FAT and the CST in each participant’s
left and right hemispheres. To identify these tracts we used
a procedure composed of three steps: (1) whole brain fiber
tractography (2) region-of-interest (ROI) based fiber tract
segmentation and (3) fiber tract cleaning.
Step 1: whole brain fiber tractography
Whole brain fibers were tracked in the native space of each
participant using a deterministic streamlines tracking
algorithm (Basser et al. 2000; Mori et al. 1999) with a
fourth-order Runge–Kutta path integration method (1 mm
fixed step size, 8 seed points per voxel). The tracking
algorithm was seeded with a white matter mask of all
voxels with FA greater than 0.2 and tracking was halted
when FA dropped below 0.15 or if the angle between the
last and the next step direction was greater than 30�(Dougherty et al. 2007). Minimum streamline length was
set to 20 mm.
Step 2: fiber tract segmentation
We used a multiple ROI approach to delineate the tracts in
each participant. To segment the fibers, the whole brain
fiber group (obtained in step 1) was intersected with these
ROIs using logical operations (AND, NOT). Below we
describe the protocol used to identify the ROIs of the FAT
and the CST.
FAT
We propose a protocol for identifying the FAT that is based
on several previous studies (Catani et al. 2012; Ford et al.
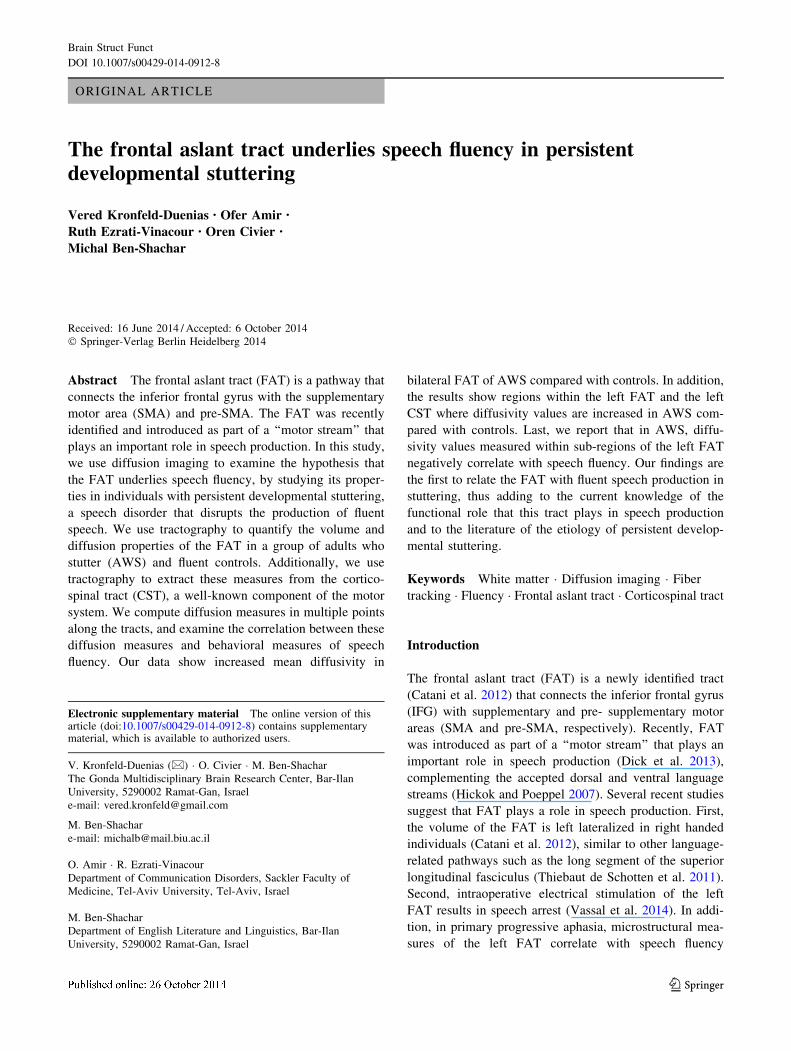
2010; Lawes et al. 2008). Figure 1 illustrates this protocol
in an attempt to promote common practices in future
studies of this tract.
Two ROIs were defined on the Montreal Neurological
Institute (MNI) template (ICBM 2009a Nonlinear Asym-
metric template; Fonov et al. 2011). The first ROI was
defined on a sagittal slice at the level of x = 45 (for the
right tract) or x = -45 (for the left tract; see Fig. 1b, right
image). This ROI (IFG) included all voxels above the
Sylvian fissure and below the inferior frontal sulcus.
Anteriorly, it was bounded by a coronal slice at the anterior
end of the pars triangularis as it is seen on sagittal slices
x = ±45. Posteriorly, it was bordered by a coronal slice at
the most ventral end of the precentral sulcus as it is seen on
the same sagittal slices (x = ±45). The second ROI was
defined on axial slice z = 45 (see Fig. 1b, left image). This
ROI (SMA/pre-SMA), encompassed a rectangle that was
medially bordered by the mid-sagittal plane; laterally, it
was bordered by a sagittal plane at the most medial point
where the precentral sulcus is still seen on z = 45. Ante-
riorly, this ROI was bordered by a coronal slice at the level
of the anterior portion of the genu of the corpus callosum
and posteriorly, it was bordered by a coronal slice at the
level of the precentral sulcus defined on the mid-sagittal
plane.
These four ROIs (left and right IFG, left and right SMA/
pre-SMA) were back transformed into an individual’s
native space based on a non-linear transformation calcu-
lated between each individual’s volume anatomy and the
MNI template (as implemented in Yeatman et al. 2012).
The whole brain fiber group was intersected with the
transformed left ROIs (left IFG, left SMA/pre-SMA) to
obtain the left tract and with the right transformed ROIs
(right IFG, right SMA/pre-SMA) to obtain the right tract.
Brain Struct Funct
123

CST
The identification of the CST was based on a standard
protocol by Wakana and colleagues (2007). All ROIs
necessary for the tract identification were anatomically
defined in every participant (by V.K.-D.). The first ROI
encompassed the cerebral peduncle, marked on an axial
plane at the level of the decussation of the superior cere-
bellar peduncle (see Figure 4 of Wakana et al. 2007). To
define the second ROI, we visually inspected the tract that
resulted from the intersection of the whole brain fiber
group (step 1) with the first ROI. The second ROI was then
drawn around the fibers that project to the primary motor
cortex, as identified on the most ventral axial slice where
the branching of the central sulcus is seen (see Figure 4 of
Wakana et al. 2007). The whole brain fiber group was
intersected with the left ROIs to obtain the left tract and
with the right ROIs to obtain the right tract. As a final step,
a logical NOT operation was applied on the resulting tracts
with an ROI that covers the whole mid-sagittal plane. This
last step was aimed to exclude all tracts that cross the
midline via the pontine crossing fibers (Wakana et al.
2007).
Step 3: fiber tract cleaning
To remove outlier tracts, we used an automated cleaning
procedure that removed fibers extending over 4 standard
deviations from the mean fiber length or spatially deviating
more than 5 standard deviations from the core of the tract
(see Yeatman et al. 2012 for further details). Next, we
manually inspected all the tracts in each individual using a
gesture-based interface (‘Quench’, see ‘‘Software’’) and
excluded single fibers that clearly did not fit the tract def-
inition. For example, in the FAT we removed tracts that did
not reach the IFG and in the CST we removed tracts that
reached primary sensory (rather than motor) cortex.
To make sure that this manual cleaning phase was not
biased, we calculated the ratio between the number of
streamlines that were manually excluded from the fibers and
the number of streamlines that were found in the original
tract (i.e. before cleaning). These exclusion ratios were then
compared between AWS and controls using two-tailed
t tests with unequal variance (see ‘‘Results’’ and Figure S1).
b Fig. 1 FAT identification protocol. a Whole brain fiber tractography
is overlaid on a sagittal T1 image of a representative participant.
b ROIs (in red) are defined on the MNI template (ICBM 2009a
Nonlinear Asymmetric; Fonov et al. 2011). The left IFG ROI is
overlaid on a sagittal image and the left SMA/pre-SMA ROI is
overlaid on an axial image. c The left hemisphere ROIs are shown
after they were back transformed from the MNI space to the native
space of an individual participant. d The left FAT resulting from the
intersection of the whole brain fiber group (illustrated in a) with the
back transformed ROIs (shown in c). The tract is displayed in a 3D
view, with coronal and axial images added for orientation. FAT
frontal aslant tract, IFG inferior frontal gyrus, SMA supplementary
motor area, MNI Montreal neurological institute
Brain Struct Funct
123
Evaluation of FAT endpoints
To calculate the MNI coordinates of the FAT endpoints for
each participant, we first calculated a nonlinear transfor-
mation between the T1 volume anatomy of the participant
and the MNI T1-template, using the mutual information
maximization algorithm implemented in SPM5 (Friston
and Ashburner 2004). We then applied the inverse trans-
formation to assign an MNI coordinate to each voxel in the
participants’ native space. The centers of mass of the
medial and lateral FAT endpoints were calculated for each
participant, and their MNI coordinates were averaged
across participants. We then used the automated anatomi-
cal labeling (AAL) atlas (Tzourio-Mazoyer et al. 2002) to
assign anatomical labels to the average MNI coordinates of
the medial and lateral FAT endpoints.
Fiber tract quantification and group comparisons
Tract diffusivity measures
For each participant and each tract, tract-FA and tract-MD
measures were calculated as the average FA and MD across all
voxels covered by the tract, respectively. These diffusion
measures were compared between the groups using two-tailed
t tests with unequal variance. Following up on these analyses,
tract-AD and tract-RD were computed and compared between
the groups in a similar fashion. Significance was corrected for
16 comparisons (4 tracts 9 4 diffusion measures) using the
false discovery rate (FDR) correction (Benjamini and
Hochberg 1995), with alpha set at 0.05. To partial out the
effect of age, all four diffusion measures were entered into
ANCOVAs (analysis of covariance), with Age as a covariate.
Volume estimation
The volume of each tract was estimated as the number of
voxels covered by one streamline or more. This volume
estimation was divided by the volume estimation of the
whole brain fiber group (that was obtained by applying the
same procedure to the whole brain fiber group). This nor-
malization process was aimed to assure that differences in
tract volume do not reflect a general difference in white
matter volume between the groups.
Normalized volume estimates were compared between
the groups using two-tailed t tests with unequal variance.
The FDR was controlled based on the number of tracts with
alpha set at 0.05.
Lateralization indices
Three lateralization indices (LI) were computed for the
FAT and CST, comparing volume estimates, FA and MD
measures of the left and right tracts. For example, the
volume lateralization index (VOL_LI) of the FAT was
calculated based on the volume estimates of the left FAT
(VOLL_FAT) and the volume estimate of the right FAT
(VOLR_FAT) using the following equation:
VOL LIFAT ¼ ðVOLL FAT � VOLR FATÞ=ðVOLL FAT
þ VOLR FATÞ
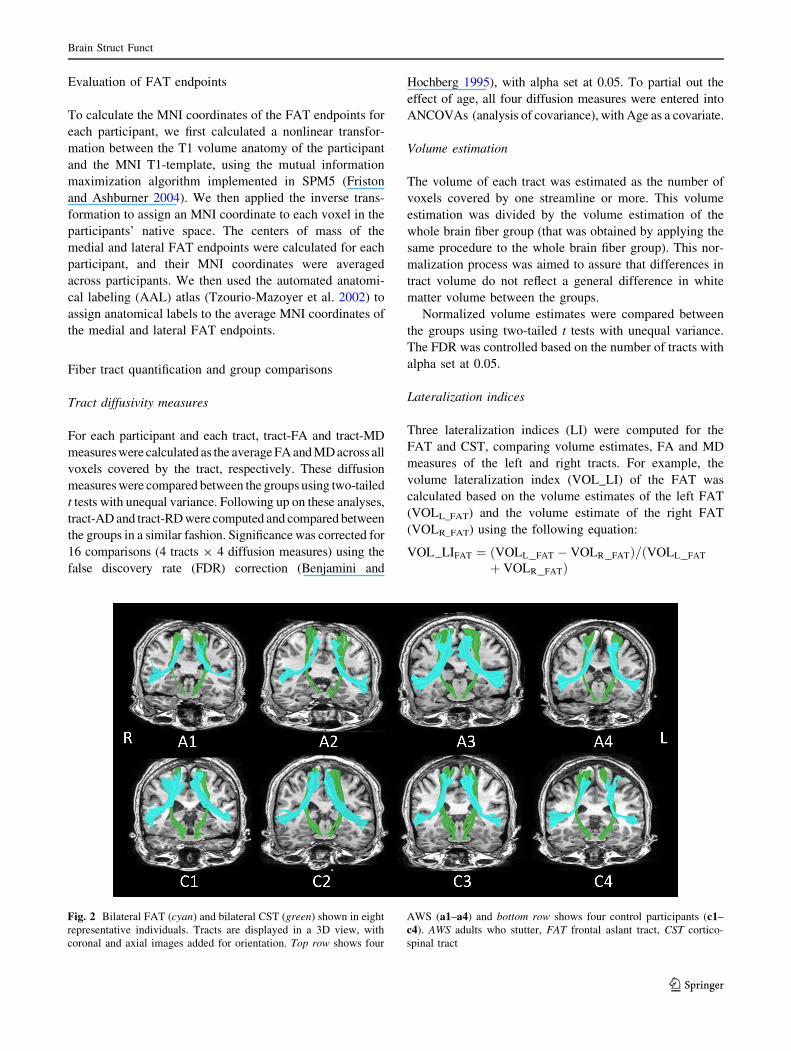
Fig. 2 Bilateral FAT (cyan) and bilateral CST (green) shown in eight
representative individuals. Tracts are displayed in a 3D view, with
coronal and axial images added for orientation. Top row shows four
AWS (a1–a4) and bottom row shows four control participants (c1–
c4). AWS adults who stutter, FAT frontal aslant tract, CST cortico-
spinal tract
Brain Struct Funct
123
The lateralization indices were compared between the
groups using two-tailed t tests with unequal variance while
controlling the FDR based on the number of tracts with
alpha set at 0.05.
FA profiles along the tract
FA and MD profiles of each tract were obtained by sam-
pling the full length of the tract at 100 equi-spaced nodes
and calculating FA and MD in each node as a weighted
average across the streamlines of that tract (Yeatman et al.
2012). Profiles were calculated along the entire length of
the tracts, i.e. between the cortical endpoints of the tracts.
FA and MD profiles were compared between the groups
using multiple two-tailed t tests. A permutation-based mul-
tiple comparisons correction (Nichols and Holmes 2002)
was used to calculate the critical cluster of adjacent signifi-
cant t tests. Significance was corrected for 400 comparisons
(4 tracts 9 100 nodes in each tract) setting the corrected alpha
to 0.05. We report clusters of nodes in which (1) all neigh-
boring nodes significantly differed between the groups at the
level of 0.05 (uncorrected) and (2) the cluster of significant
values was larger than the critical cluster size (Nichols and
Holmes 2002; Yeatman et al. 2012).
Brain–behavior correlations
In clusters showing a significant group difference, we
further aimed to examine how individual variability in tract
properties predicts behavioral properties. To this end, we
extracted diffusivity measures from the clusters of nodes
that significantly differed between the groups, and then
analyzed the correlation between diffusivity measure and
speech fluency within the group of AWS and the group of
controls separately.
To calculate a correlation measure, we had to reduce the
dimensionality of the tract profile into a single diffusivity
measure. This was done by extracting MD measures from a
fixed sized window within the cluster of nodes where
significant differences were found and averaging the MD
values measured within this window. The size of the
window was arbitrarily set to 11 nodes that include the
middle-most node and 5 additional nodes on each side. We
further validated that the results were not specific to a
window size of 11 nodes by replicating the correlation
analyses with different window sizes (see Figure S4).
Speech fluency was assessed using the speech rate
(measured in SPS). This specific measure was chosen for its
proximity to the fluency measure used by Catani et al. (2013)
in their study of the FAT in primary progressive aphasia.
We calculated Spearman’s rank-order correlations to
assess the link between an individual’s diffusion data and
their speech rate. Spearman correlations were used due to
evidence for non-normal distribution of both MD and speech
rate as indicated by the Kolmogorov–Smirnoff test (Corder
and Foreman 2009). Importantly, the correlations were cal-
culated separately for AWS and controls, to avoid spurious
correlations caused by the significant group differences
found in both MD and in SPS. Fisher’s Z transformations
were used to assess the significance of the difference between
the correlation coefficients measured in AWS and control
participants (Sheskin 2003). Finally, partial Spearman cor-
relations were calculated between MD and SPS within each
group, controlling for the effect of Age. This latter analysis
served to confirm that the correlation effects are not driven by
the large age range in our sample.
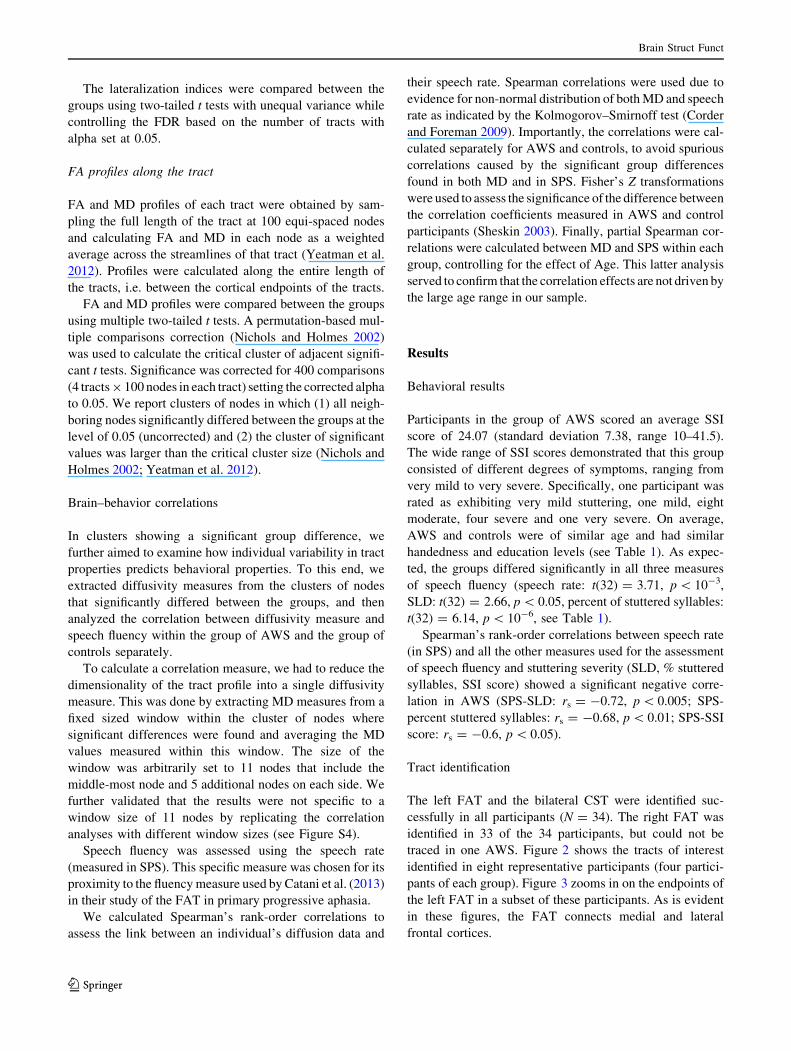
Results
Behavioral results
Participants in the group of AWS scored an average SSI
score of 24.07 (standard deviation 7.38, range 10–41.5).
The wide range of SSI scores demonstrated that this group
consisted of different degrees of symptoms, ranging from
very mild to very severe. Specifically, one participant was
rated as exhibiting very mild stuttering, one mild, eight
moderate, four severe and one very severe. On average,
AWS and controls were of similar age and had similar
handedness and education levels (see Table 1). As expec-
ted, the groups differed significantly in all three measures
of speech fluency (speech rate: t(32) = 3.71, p \ 10-3,
SLD: t(32) = 2.66, p \ 0.05, percent of stuttered syllables:
t(32) = 6.14, p \ 10-6, see Table 1).
Spearman’s rank-order correlations between speech rate
(in SPS) and all the other measures used for the assessment
of speech fluency and stuttering severity (SLD, % stuttered
syllables, SSI score) showed a significant negative corre-
lation in AWS (SPS-SLD: rs = -0.72, p \ 0.005; SPS-
percent stuttered syllables: rs = -0.68, p \ 0.01; SPS-SSI
score: rs = -0.6, p \ 0.05).
Tract identification
The left FAT and the bilateral CST were identified suc-
cessfully in all participants (N = 34). The right FAT was
identified in 33 of the 34 participants, but could not be
traced in one AWS. Figure 2 shows the tracts of interest
identified in eight representative participants (four partici-
pants of each group). Figure 3 zooms in on the endpoints of
the left FAT in a subset of these participants. As is evident
in these figures, the FAT connects medial and lateral
frontal cortices.
Brain Struct Funct
123
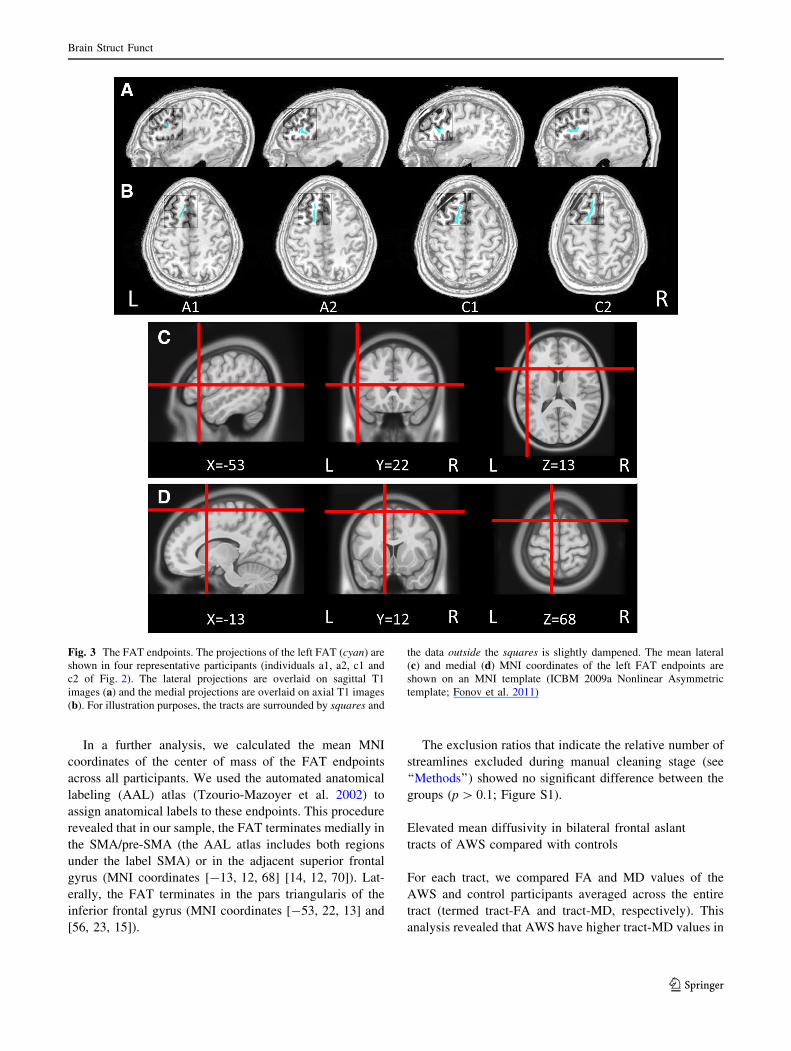
In a further analysis, we calculated the mean MNI
coordinates of the center of mass of the FAT endpoints
across all participants. We used the automated anatomical
labeling (AAL) atlas (Tzourio-Mazoyer et al. 2002) to
assign anatomical labels to these endpoints. This procedure
revealed that in our sample, the FAT terminates medially in
the SMA/pre-SMA (the AAL atlas includes both regions
under the label SMA) or in the adjacent superior frontal
gyrus (MNI coordinates [-13, 12, 68] [14, 12, 70]). Lat-
erally, the FAT terminates in the pars triangularis of the
inferior frontal gyrus (MNI coordinates [-53, 22, 13] and
[56, 23, 15]).
The exclusion ratios that indicate the relative number of
streamlines excluded during manual cleaning stage (see
‘‘Methods’’) showed no significant difference between the
groups (p [ 0.1; Figure S1).
Elevated mean diffusivity in bilateral frontal aslant
tracts of AWS compared with controls
For each tract, we compared FA and MD values of the
AWS and control participants averaged across the entire
tract (termed tract-FA and tract-MD, respectively). This
analysis revealed that AWS have higher tract-MD values in
Fig. 3 The FAT endpoints. The projections of the left FAT (cyan) are
shown in four representative participants (individuals a1, a2, c1 and
c2 of Fig. 2). The lateral projections are overlaid on sagittal T1
images (a) and the medial projections are overlaid on axial T1 images
(b). For illustration purposes, the tracts are surrounded by squares and
the data outside the squares is slightly dampened. The mean lateral
(c) and medial (d) MNI coordinates of the left FAT endpoints are
shown on an MNI template (ICBM 2009a Nonlinear Asymmetric
template; Fonov et al. 2011)
Brain Struct Funct
123

bilateral FAT compared with fluent controls (Fig. 4b, left
FAT: t(32) = 3.24, p \ 0.005; right FAT: t(31) = 3.55,
p \ 0.005; both effects were significant when controlling
the FDR with alpha set at 0.05). No significant group dif-
ferences were found in average tract-MD of the bilateral
CST (p [ 0.1) and similarly, no significant differences
were observed in average tract-FA values of either tract
(p [ 0.09, Fig. 4a).
To further identify the source of the group differences in
tract-MD, we followed up on these results with a com-
parison of tract-AD and tract-RD values (Fig. 5). We found
that both AD and RD extracted from bilateral FAT are
increased in AWS compared with controls (AD in left
FAT: t(32) = 2.68, p \ 0.05; AD in right FAT:
t(31) = 3.38, p \ 0.005; RD in left FAT: t(32) = 3,
p \ 0.01, RD in right FAT: t(31) = 3.26, p \ 0.005; both
effects were significant when controlling the FDR with
alpha set at 0.05).
Altogether, 16 group comparisons were conducted in
this analysis (4 tracts 9 4 diffusion measures). All the
reported group differences in tract-MD, tract-AD and tract-
RD of bilateral FAT were significant when controlling the
FDR for 16 comparisons with alpha set at 0.05.
To partial out the effect of age on the results, we
entered each diffusion measure into an ANCOVA, with
Age as a covariate. The results show that in MD, AD and
RD, the effects of Group remain significant after con-
trolling for Age and that there is no significant Group by
Age interaction. In FA, no significant Group effect and
no significant Group by Age interaction is found (see
Table 2).
Table 2 ANCOVA test results
Group effect Group 9 age interaction
F P F P
Left FATa
FA 0.59 [0.4 0.87 [0.4
MD 11.48 \0.05* 1.56 [0.2
AD 7.54 \0.05* 3.06 [0.05
RD 10.24 \0.01* 0.26 [0.6
Right FATb
FA 3.17 [0.05 1.6 [0.2
MD 12.6 \0.01* 0.78 [0.5
AD 11.91 \0.01* 3.72 [0.05
RD 10.8 \0.01* 0.05 [0.8
ANCOVA analysis of covariance, FAT frontal aslant tract
* Significant differences after controlling the FDR for 16 compari-
sons with alpha set at 0.05a In left FAT, Degrees of freedom = 30b In right FAT, Degrees of freedom = 29
A
B
Fig. 4 Group comparison of tract-FA and tract-MD values. Average
FA (a) and MD (b) values measured in bilateral FAT and bilateral
CST are shown in AWS (red) and in controls (blue), with error bars
denoting ±1 standard error of the mean. Asterisks denote significant
group differences after controlling for the FDR with alpha set at 0.05
(see the main text for further details). Significant increase in MD is
observed in bilateral FAT of AWS compared with controls. Note that
FA and MD values are measured in different units, hence the
difference in the y axis range of a and b. AWS adults who stutter, FAT
frontal aslant tract, CST corticospinal tract, L left, R right, FA
fractional anisotropy, MD mean diffusivity, FDR false discovery rate,
a.u. arbitrary units, ms millisecond
A
B
Fig. 5 Group comparison of tract-AD and tract-RD values. Average
AD (a) and RD (b) values measured in bilateral FAT and bilateral
CST are shown in AWS (red) and in controls (blue), with error bars
denoting ±1 standard error of the mean. Asterisks denote significant
group differences after controlling for the FDR at alpha level = 0.05
(see the main text for further details). Significant increase in both AD
and RD are observed in bilateral FAT of AWS compared with
controls. AWS adults who stutter, FAT frontal aslant tract, CST
corticospinal tract, L left, R right, AD axial diffusivity, RD radial
diffusivity, FDR false discovery rate, ms millisecond
Brain Struct Funct
123
Similar tract volumes and lateralization indices in AWS
and in fluent controls
Comparing the normalized volumes of the tracts did not
reveal any significant group differences (p [ 0.1). Simi-
larly, no significant group differences were found in the LIs
calculated over volume estimations, FA and MD measures
(p [ 0.09). The mean LIs measured in the CST and in the
FAT were close to zero in both groups, with absolute mean
LI values below 0.1, indicating bilaterality.
Increased mean diffusivity observed along the left tract
profiles
Differences in diffusion measures between the groups may
be masked in the averaged tract-diffusivity estimates, due
to large variability along the length of the tract (Yeatman
et al. 2011). We therefore, generated profiles describing FA
and MD along the tracts and then compared the profiles
between the groups using multiple t tests and a permutation
based multiple comparison correction (Nichols and Holmes
2002; Yeatman et al. 2012 and see ‘‘Methods’’ of this
paper).
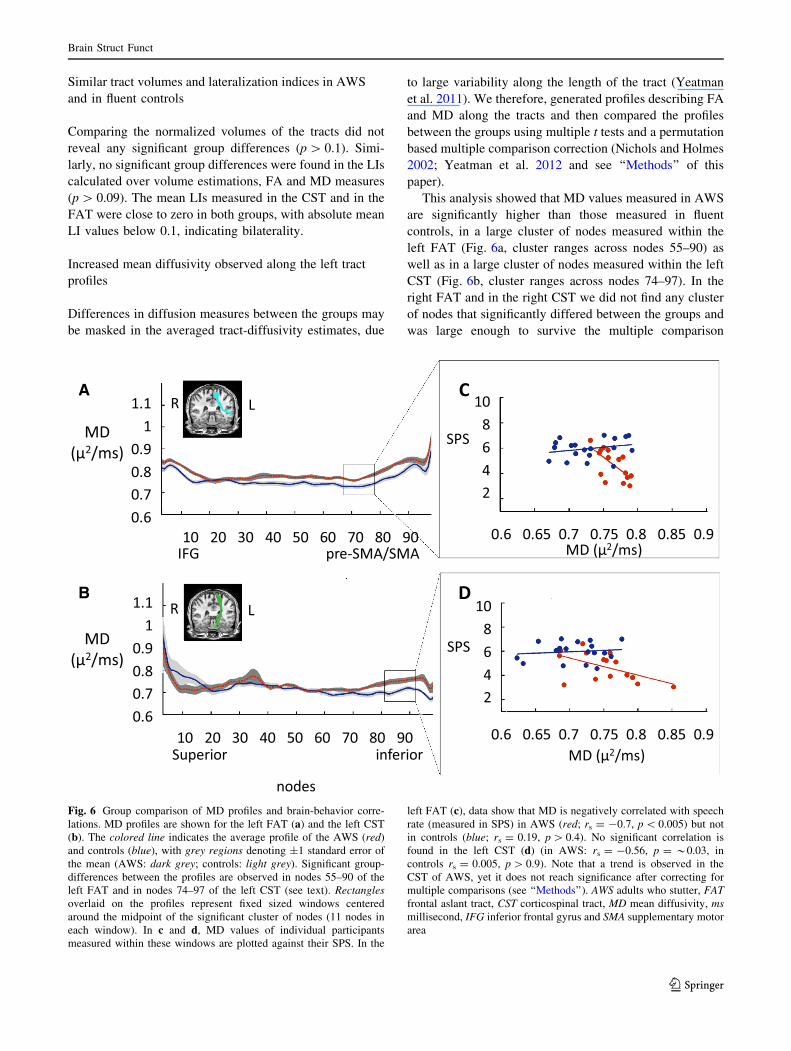
This analysis showed that MD values measured in AWS
are significantly higher than those measured in fluent
controls, in a large cluster of nodes measured within the
left FAT (Fig. 6a, cluster ranges across nodes 55–90) as
well as in a large cluster of nodes measured within the left
CST (Fig. 6b, cluster ranges across nodes 74–97). In the
right FAT and in the right CST we did not find any cluster
of nodes that significantly differed between the groups and
was large enough to survive the multiple comparison
A
B
Fig. 6 Group comparison of MD profiles and brain-behavior corre-
lations. MD profiles are shown for the left FAT (a) and the left CST
(b). The colored line indicates the average profile of the AWS (red)
and controls (blue), with grey regions denoting ±1 standard error of
the mean (AWS: dark grey; controls: light grey). Significant group-
differences between the profiles are observed in nodes 55–90 of the
left FAT and in nodes 74–97 of the left CST (see text). Rectangles
overlaid on the profiles represent fixed sized windows centered
around the midpoint of the significant cluster of nodes (11 nodes in
each window). In c and d, MD values of individual participants
measured within these windows are plotted against their SPS. In the
left FAT (c), data show that MD is negatively correlated with speech
rate (measured in SPS) in AWS (red; rs = -0.7, p \ 0.005) but not
in controls (blue; rs = 0.19, p [ 0.4). No significant correlation is
found in the left CST (d) (in AWS: rs = -0.56, p = *0.03, in
controls rs = 0.005, p [ 0.9). Note that a trend is observed in the
CST of AWS, yet it does not reach significance after correcting for
multiple comparisons (see ‘‘Methods’’). AWS adults who stutter, FAT
frontal aslant tract, CST corticospinal tract, MD mean diffusivity, ms
millisecond, IFG inferior frontal gyrus and SMA supplementary motor
area
Brain Struct Funct
123

cluster-based threshold that was used (Figure S2). In
addition, no significant difference was found between the
FA profiles of AWS and controls along any of the tracts
(Figure S3).
Mean diffusivity within the left FAT negatively
correlates with speech fluency in AWS
To establish the functional contribution of the left FAT and
the left CST in AWS, we measured brain-behavior corre-
lations between the MD values measured within these
tracts and the speech rates. For each participant, we
extracted a single measure of MD from a fixed size window
located within the cluster of nodes where the groups sig-
nificantly differed (see ‘‘Methods’’). We correlated the
resulting MD value of each participant with their speech
rate (estimated using SPS). To avoid spurious correlations
caused by the significant group differences found in both
MD and SPS separately, Spearman correlations were cal-
culated separately for AWS and controls (altogether, four
correlations were computed: 2 groups 9 2 tracts).
Results show that in the left FAT, higher MD values
predict lower SPS in AWS (rs = -0.7, p \ 0.005; FDR
corrected for four comparisons with alpha set to 0.05) but
not in controls (rs = 0.19, p [ 0.4). Importantly, the cor-
relation coefficients calculated in the two groups differ
significantly (Fisher’s Z = 2.77, p \ 0.01), and a partial
correlation analysis revealed that the negative correlation
observed in the left FAT of AWS remains significant after
controlling for Age (p \ 0.001, FDR corrected for four
comparisons with alpha set to 0.05). No significant corre-
lation is found in the left CST of both groups (in AWS:
rs = -0.56, p = *0.03, in controls: rs = 0.005, p [ 0.9).
Notably, in the CST of AWS, a trend is observed, however
it does not reach significance following the control for FDR.
To evaluate the stability of these correlations, we
modified the size of the window used for MD extraction
and we measured the Spearman correlation coefficients
obtained using different window sizes (Figure S4). This
analysis showed a stable pattern of results, verifying that
the pattern of correlations between MD and speech rate
does not depend on the particular window size used in the
main analysis. Specifically, the results did not change when
we used the entire cluster of nodes that significantly dif-
fered between the groups in the tract profile analysis (nodes
55–90 of the left FAT, nodes 74–97 of the left CST).
Within these clusters, MD-SPS correlations were signifi-
cant in AWS (rs = -0.65, p \ 0.05; FDR corrected for
four comparisons with alpha set to 0.05) but not in controls
(rs = 0.01, p [ 0.97). The correlation coefficients differed
significantly between the groups (Fisher’s Z = 2.04,
p \ 0.05), and the negative correlation observed in the left
FAT of AWS remained significant after controlling for Age
using a partial correlation analysis (p \ 0.05). In addition,
no significant correlation was found in the left CST of both
groups (in AWS: rs = -0.53, p = *0.04, in controls:
rs = -0.14, p [ 0.5). Similar to the main analysis (of 11
nodes), a trend was observed in the left CST of AWS, yet it
did not reach significance following the control for FDR.
Discussion
Our results show that the bilateral FAT is involved in
speech production in a clinical population of individuals
with persistent developmental stuttering. Specifically, we
show that the microstructural properties of this tract,
assessed using mean diffusivity, significantly differ
between individuals who stutter and fluent controls. Beyond
group comparisons, our data further show that the mean
diffusivity calculated within the left FAT predicts individ-
ual speech rate in individuals who stutter. By demonstrating
the involvement of the FAT in a developmental disorder
that disrupts speech fluency, our results strengthen the view
that the FAT plays a role in speech production, possibly via
a ‘‘language motor stream’’ (Dick et al. 2013).
Our data show that AWS have higher MD values in
the left FAT compared with controls. Further, the MD
values calculated within this tract negatively correlate
with the speech rate measured in individuals who stutter:
the lower the MD, the higher the speech rate (and the
closer it is to the average speech rate measured in
controls). While these results demonstrate brain-behavior
correlations with MD in the left FAT, the previous
analysis of functional correlations within the left FAT in
primary progressive aphasia (Catani et al. 2013) showed
a negative correlation between speech fluency and RD
values (along with a positive correlation between speech
fluency and FA values). MD and RD values typically
correlate in a positive fashion (see Figure 6 of De Santis
et al. 2014). Thus, it appears that despite the different
diffusion measures and the different assessment tools
used for measuring fluency, both studies imply that less
restriction on water diffusion within the left FAT is
associated with a lower degree of fluency. By showing
that this brain-behavior correlation is unique to AWS
and does not hold in controls, our findings suggest that
the left FAT may be an important predictor of fluency in
clinical populations, but not necessarily in the neuro-
typical population.
In the right FAT, our data show a significant group
difference in the average MD of the entire tract with no
significant difference in the profile analysis. Specifically,
the profile analysis of the right FAT shows several clusters
of nodes that differ between the groups, yet none of these
clusters is large enough to survive the cluster-based
Brain Struct Funct
123
multiple comparison correction that we apply (see
‘‘Methods’’). This suggests that differences in MD values
of the right FAT are equally spread in multiple (not nec-
essarily neighboring) points along the right FAT.
In light of the persistent developmental stuttering liter-
ature, our findings in bilateral FAT are not surprising. The
involvement of both hemispheres in the etiology of stut-
tering has long been proposed (Kushner 2012; Travis 1931)
and many functional imaging studies continue to indicate
the contribution of both hemispheres to developmental
stuttering (Biermann-Ruben et al. 2005; Brown et al. 2005;
Chang et al. 2009; Kell et al. 2009; Lu et al. 2010a;
Watkins et al. 2008; Xuan et al. 2012). Structural imaging
studies of white matter in developmental stuttering have,
for the most part, highlighted left frontal white matter
abnormalities as the core deficit in the disorder (Chang
et al. 2008; Cykowski et al. 2010; Sommer et al. 2002;
Watkins et al. 2008). However, some of these studies also
point to stuttering-related white matter differences in the
right hemisphere (Chang et al. 2008, 2010; Connally et al.
2013; Watkins et al. 2008). Our findings are consistent with
the view that both hemispheres contribute to fluent speech
production in individuals who stutter, as well as with the
general proposal that the underlying mechanisms required
for speech production (like sensory-motor transformation)
occur bilaterally (Cogan et al. 2014).
One view of persistent developmental stuttering main-
tains that the core deficit is left hemispheric (Chang et al.
2008; Kell et al. 2009), while the right hemisphere is
recruited to compensate for the left hemisphere impairment
(Preibisch et al. 2003). However, while some authors
suggest that the right hemisphere involvement is beneficial,
i.e., enhances fluency (Braun et al. 1997; Kell et al. 2009;
Preibisch et al. 2003) others suggest that it is not (Brown
et al. 2005; Chang et al. 2010; Foundas et al. 2004; Fox
et al. 2000; Moore 1984). Our data show the same pattern
of results (MD elevation in AWS compared with controls)
in both the left and right FAT, which is difficult to rec-
oncile with the idea that the right tract is compensating for
the left impairment. However, because all participants of
this study were adults, we cannot be conclusive about the
functional interpretation of the differences that we find. All
the observed differences can equally constitute the cause
for stuttering or reflect compensation processes following
years of stuttering.
We originally examined the FAT in the context of
persistent developmental stuttering based on its recent
depiction as a language production pathway (Dick et al.
2013). However, in fMRI, functional connectivity between
medial-dorsal and ventral-lateral frontal regions has been
related to domain general error monitoring (Dosenbach
et al. 2006; Eckert et al. 2009; Vaden et al. 2013). This
‘‘cingulo-opercular network’’ has been proposed to relay
information between the dorsal paracingulate/anterior cin-
gulate cortex and the lateral anterior insula. While these
regions do not overlap precisely with the endpoints of the
FAT (Fig. 3, see also Catani et al. 2012), it is still possible
that the FAT takes part in relaying information related to
error monitoring in speech production. We offer this pos-
sibility here because, first, it is well-known that fiber
tracking algorithms are prone to errors near the gray mat-
ter, where FA drops, and can very well skip a sulcus on
their way to cortex (Ben-Shachar et al. 2007). Second, error
monitoring deficits in speech production have often been
proposed as part of the core deficit in stuttering, and this
finding has been supported by recent electrophysiological
evidence (Arnstein et al. 2011; but see Postma and Kolk
1992 for an alternative view). Future studies will be nec-
essary to determine whether the FAT is related to error
monitoring, and whether this relation generalizes to other
domains beyond speech.
Within the CST, our data show an increase in MD of
AWS compared with controls, in the inferior portion of the
left tract. The pattern of this result is in agreement with a
recent study that shows a significant reduction in FA values
measured in the cerebellar peduncles of people who stutter
compared with controls (Figure 4 of Connally et al. 2013).
Both studies are compatible with less restricted diffusivity
in the CST at the level of the cerebellar peduncles in people
who stutter. Moreover, each of these studies extends this
information in complementary ways: Our results indicate
that the difference is limited to the left tract, while the
study by Connally et al. (2013) shows that the differences
extend over the inferior, middle and superior cerebellar
peduncles (each averaged across the two hemispheres). In
our sample of participants, FA values of the CST did not
differ significantly between the groups. Previous studies of
developmental stuttering that report FA differences in the
CST used whole brain voxel-based methods (Cai et al.
2014; Chang et al. 2008; Watkins et al. 2008). Interest-
ingly, the one study that used both tractography and Tract-
Based-Spatial-Statistics (TBSS) reported FA differences in
the CST only when using TBSS (Connally et al. 2013).
Therefore, the discrepancy between our results and the
previous reports of stuttering-related FA differences in the
CST may be caused by the different methodologies that
were employed.
In this study, we report differences in MD that are not
accompanied by parallel differences in FA. Although it is
common to find MD and FA effects that go in opposite
directions, the two metrics are not necessarily correlated
(Figure 6 of De Santis et al. 2014). MD and FA provide
complementary information about the eigenvalues obtained
during tensor fit: While MD measures the average of the
three eigenvalues of the tensor, FA quantifies their nor-
malized standard deviation. An MD difference without an
Brain Struct Funct
123
FA difference suggests an overall difference in eigenvalues
which is not specific to one direction of diffusivity, and
thus does not translate into a difference in anisotropy.
Indeed, we show that the increase in MD is derived from an
increase in both AD and RD (Figs. 4, 5). Such a pattern of
joint increase in AD and RD implies that within these tracts
there are fewer constraints to diffusion (reduced tissue
density) in a manner not specific to a certain direction.
MD values rely on water diffusion that is sensitive to the
microstructure of the underlying brain tissue, yet the
interpretation of these values in terms of tissue properties
should be attempted cautiously (Jones et al. 2013). In white
matter, MD values are affected by many factors including
water content, membrane density, myelin and axonal count
(Alexander et al. 2007; Burzynska et al. 2010; Schmierer
et al. 2007). Any combination of these factors may have
conspired to generate the effects reported here, but most
would affect FA in an opposite manner. We hypothesize
that increased MD values in AWS could stem from a
combination of factors: For example, noisy communication
(reduced synchrony) between the IFG and SMA could have
led to excessive pruning of axons through the FAT,
increasing MD and reducing FA, as well as to a more
coherent fiber organization within the FAT, which would
elevate FA back to its typical range. Elevated membrane
permeability has similarly been proposed as a mechanism
to explain developmental differences in MD that covary
with slowed information transfer, without affecting FA
(Scantlebury et al. 2014). Admittedly, such hypotheses are
impossible to test directly with DTI alone, and would be
more directly testable using imaging methods geared for
quantifying more specific tissue properties (e.g., Assaf
et al. 2008; Mezer et al. 2013; Stikov et al. 2011).
MD values may be affected by other factors that stem
from the methodology, like partial volume averaging
across different tissue types and crossing fibers (Vos et al.
2011, 2012). We consider partial volume effects an unli-
kely explanation for the effects reported here because the
anisotropy values in regions that showed a significant
group difference were greater than 0.35 (values typical to
white matter), and because the FAT is not directly adjacent
to the ventricles, as verified by individual inspection of the
tracts. Thus, FAT voxels are unlikely to partially sample
gray matter or CSF in addition to white matter.
Functionally, our results show that lower MD values are
associated with a person’s ability to produce more syllables
during a fixed time period. This implies that in this sample
of AWS, lower MD values predict faster transmission
between inferior frontal language regions and the pre-
SMA/SMA involved in speech planning and production.
This interpretation of the results is in agreement with
previous reports in either older adults, younger adults or
children, linking lower MD values with enhanced
processing speed, and therefore with faster transmission
between cortical regions (Bakhtiari et al. 2014; Sasson
et al. 2010; Scantlebury et al. 2014). Future studies are
expected to shed more light on this idea using methods that
tap into more specific tissue properties, combined with
direct estimates of transmission speed (Horowitz et al.
2014).
Limitations
Several limitations of the current study should be
acknowledged. First, the sample size is limited (N = 15
and 19 for AWS and controls, respectively), which reduces
the statistical power of our analyses. However, even with
this limited power, we were able to detect significant dif-
ferences in diffusion properties between AWS and con-
trols, as well as within group correlations with behavior.
This limitation is still relevant to null effects reported here,
particularly the absence of significant group differences in
FA. A recent analysis has shown that MD requires a rela-
tively smaller sample size compared with FA, for the
detection of equivalent effect sizes (De Santis et al. 2014).
It is therefore possible that future studies with larger
samples will detect FA differences that have not been
detected here. Second, our sample spans a relatively large
age range (19–52 years old participants in both groups).
While the groups were well-matched in mean-age and age
range (see Table 1), this age range still raises the concern
that age could somehow drive the effects we find, espe-
cially given the known variation in white matter properties
during adulthood (Lebel et al. 2012b). To address this
concern, we conducted ANCOVA analyses with Age as a
covariate to examine the contribution of age to the group
differences that were found, and we calculated partial
correlations to control for the effect of Age on the brain-
behavior correlations that showed a significant effect. None
of these analyses indicated a significant contribution of
Age to the reported effects. Third, in this study we used a
scan protocol with limited angular resolution (19 diffusion
directions). We chose this number of directions to ensure a
short duration scan (5:50 min) that will reduce the chance
of within scan head motion, and we improved the signal-to-
noise ratio by repeating the acquisition twice. While sim-
ulation studies recommend the use of at least 30 diffusion
gradient-encoding directions for the purpose of tractogra-
phy (Jones 2004), a study of human subjects demonstrated
that similarly robust measurements are achieved using 6
and 30 directions in many white matter tracts delineated
using deterministic tractography (Lebel et al. 2012a). The
authors of the latter study conclude that using repeated
scans (as used here) along with at least six directions (we
use 19) should be considered appropriate for the purposes
of deterministic tractography.
Brain Struct Funct
123
Conclusions
Our study shows differences in diffusion measures of the
bilateral frontal aslant tract and the left CST in persistent
developmental stuttering. Further, the data show an
association between diffusion measures of the left frontal
aslant tract and behavioral measures of speech fluency in
adults who stutter. This association is anatomically
selective in that it does not hold in the other tracts tar-
geted here, or in controls. By demonstrating the
involvement of the bilateral frontal aslant tracts in per-
sistent developmental stuttering, our findings strengthen
the view that this tract plays a role in the production of
fluent speech and should be considered in future studies
of language and its disorders.
Acknowledgments This work was supported by the Israel Science
Foundation (ISF grant 513/11 awarded to M.B.-S and O.A) and by the
Israeli Center of Research Excellence in Cognition (I-CORE Program
51/11 of the Planning and Budgeting Committee). O.C. was supported
by the Israeli Ministry of Immigrant Absorption. We thank the Israeli
Stuttering Association (AMBI) for their help with participant
recruitment. We thank the team at the Wohl institute for advanced
imaging in Tel Aviv Sourasky Medical Center, for their assistance
with protocol setup and MRI scanning. We thank Jason Yeatman for
his assistance with adjustments in the AFQ code. Finally, we are
grateful to Prof. Yaniv Assaf and to Maya Yablonski for their helpful
comments.
Conflict of interest The authors declare that there are no conflicts
of interest.
References
Akers D (2006) CINCH: a cooperatively designed marking interface
for 3D pathway selection. Paper presented at the User Interface
Software and Technology meeting, Montreux
Alexander AL, Lee JE, Lazar M, Field AS (2007) Diffusion tensor
imaging of the brain. Neurotherapeutics 4:316–329
Alm PA (2004) Stuttering and the basal ganglia circuits: a critical
review of possible relations. J Commun Disord 37:325–369
Ambrose NG, Yairi E (1999) Normative disfluency data for early
childhood stuttering. J Speech Lang Hear Res 42:895–909
Amir O, Levine-Yundof R (2013) Listeners’ attitude toward people
with dysphonia. J Voice 27:524.e1–524.e10
Arnstein D, Lakey B, Compton RJ, Kleinow J (2011) Preverbal error-
monitoring in stutterers and fluent speakers. Brain Lang
116:105–115
Assaf Y, Blumenfeld-Katzir T, Yovel Y, Basser PJ (2008) AxCaliber:
a method for measuring axon diameter distribution from
diffusion MRI. Magn Reson Med 59:1347–1354
Bakhtiari R, Boliek C, Cummine J (2014) Investigating the contri-
bution of ventral-lexical and dorsal-sublexical pathways during
reading in bilinguals. Front Hum Neurosci 8:507
Basser PJ, Pierpaoli S (1996) Microstructural and physiological
features of tissues elucidated by quantitative diffusion tensor
MRI. J Magn Reson 111:209–219
Basser PJ, Pajevic S, Pierpaoli S, Duda J, Aldroubi A (2000) In vivo
fiber tractography using DT-MRI data. Magn Reson Med
44:625–632
Beal DS, Gracco VL, Lafaille SJ, De Nil LF (2007) Voxel-based
morphometry of auditory and speech-related cortex in stutterers.
NeuroReport 18:1257–1260
Beal DS, Gracco VL, Brettschneider J, Kroll RM, De Nil LF (2013) A
voxel-based morphometry (VBM) analysis of regional grey and
white matter volume abnormalities within the speech production
network of children who stutter. Cortex 49:2151–2216
Benjamini Y, Hochberg Y (1995) Controlling the false discovery rate:
a practical and powerful approach to multiple testing. J R Stat
Soc Ser B (Methodol) 57:289–300
Ben-Shachar M, Dougherty RF, Wandell BA (2007) White matter
pathways in reading. Curr Opin Neurobiol 17:258–270
Biermann-Ruben K, Salmelin R, Schnitzler A (2005) Right rolandic
activation during speech perception in stutterers: a MEG study.
Neuroimage 25:793–801
Bloodstein O, Ratner NB (2008) A handbook on stuttering, 6th edn.
Delmar, Stamford
Braun A et al (1997) Altered patterns of cerebral activity during
speech and language production in developmental stuttering. An
H2(15)O positron emission tomography study. Brain
120:761–784
Brown S, Ingham RJ, Ingham JC, Laird AR, Fox PT (2005) Stuttered
and fluent speech production: an ALE meta-analysis of func-
tional neuroimaging studies. Hum Brain Mapp 25:105–117
Burzynska AZ, Preuschhof C, Backman L, Nyberg L, Li S-C,
Lindenberger U, Heekeren HR (2010) Age-related differences in
white matter microstructure: region-specific patterns of diffu-
sivity. Neuroimage 49:2104–2112
Cai S, Tourville JA, Beal DS, Perkell JS, Guenther FH, Ghosh SS
(2014) Diffusion imaging of cerebral white matter in persons
who stutter: evidence for network-level anomalies. Front Hum
Neurosci 8:54
Catani M et al (2012) Short frontal lobe connections of the human
brain. Cortex 48:273–291
Catani M et al (2013) A novel frontal pathway underlies verbal
fluency in primary progressive aphasia. Brain 136:2619–2628
Chang S-E, Erickson KI, Ambrose NG, Hasegawa-Johnson MA,
Ludlow CL (2008) Brain anatomy differences in childhood
stuttering. Neuroimage 39:1333–1344
Chang S-E, Kenney MK, Loucks TMJ, Ludlow CL (2009) Brain
activation abnormalities during speech and non-speech in
stuttering speakers. Neuroimage 46:201–212
Chang S-E, Synnestvedt A, Ostuni J, Ludlow CL (2010) Similarities
in speech and white matter characteristics in idiopathic devel-
opmental stuttering and adult-onset stuttering. J Neurolinguist
23:455–469
Chang S-E, Horwitz B, Ostuni J, Reynolds R, Ludlow CL (2011)
Evidence of left inferior frontal premotor structural and
functional connectivity deficits in adults who stutter. Cereb
Cortex 21:2507–2518
Cogan GB, Thesen T, Carlson C, Doyle W, Devinsky O, Pesaran B
(2014) Sensory-motor transformations for speech occur bilater-
ally. Nature 507:94–98
Connally EL, Ward D, Howell P, Watkins KE (2013) Disrupted white
matter in language and motor tracts in developmental stuttering.
Brain Lang 6:256–266
Corder GW, Foreman DI (2009) Nonparametric statistics for non-
statisticians: a step-by-step approach. Wiley, Hoboken
Cykowski MD, Fox PT, Ingham RJ, Ingham JC, Robin DA (2010) A
study of the reproducibility and etiology of diffusion anisotropy
differences in developmental stuttering: a potential role for
impaired myelination. Neuroimage 52:1495–1504
De Santis S, Drakesmith M, Bells S, Assaf Y, Jones DK (2014) Why
diffusion tensor MRI does well only some of the time: variance
and covariance of white matter tissue microstructure attributes in
the living human brain. Neuroimage 89:35–44
Brain Struct Funct
123
Dick AS, Bernal B, Tremblay P (2013) The language connectome
new pathways, new concepts. Neuroscientist 20(5):453–467
Dosenbach NU et al (2006) A core system for the implementation of
task sets. Neuron 50:799–812
Dougherty RF, Ben-Shachar M, Deutsch GK, Hernandez A, Fox GR,
Wandell BA (2007) Temporal-callosal pathway diffusivity
predicts phonological skills in children. PNAS 104:8556–8561
Eckert MA, Menon V, Walczak A, Ahlstrom J, Denslow S, Horwitz
A, Dubno JR (2009) At the heart of the ventral attention system:
the right anterior insula. Hum Brain Mapp 30:2530–2541
Finkelstein M, Amir O (2013) Speaking rate among professional
radio newscasters: Hebrew speakers. Stud Media Commun
1:131–139
Fonov V, Evans AC, Botteron K, Almli CR, McKinstry RC, Collins
DL (2011) Unbiased average age-appropriate atlases for pedi-
atric studies. Neuroimage 54:313–327
Ford A, McGregor KM, Case K, Crosson B, White KD (2010)
Structural connectivity of Broca’s area and medial frontal cortex.
Neuroimage 52:1230–1237
Foundas AL, Bollich AM, Feldman J, Corey DM, Hurley M, Lemen
LC, Heilman KM (2004) Aberrant auditory processing and
atypical planum temporale in developmental stuttering. Neurol-
ogy 63:1640–1646
Fox PT, Ingham RJ, Ingham JC, Zamarripa F, Xiong JH, Lancaster JL
(2000) Brain correlates of stuttering and syllable production.
A PET performance-correlation analysis. Brain 123:1985–2004
Friston KJ, Ashburner J (2004) Generative and recognition models for
neuroanatomy. Neuroimage 23:21–24
Hickok G, Poeppel D (2007) The cortical organization of speech
processing. Nat Rev Neurosci 8:393–402
Horowitz A, Barazany D, Tavor I, Bernstein M, Yovel G, Assaf Y
(2014) In vivo correlation between axon diameter and conduc-
tion velocity in the human brain. Brain Struct Funct, 1–12
Jancke L, Jurgen H, Helmuth S (2004) Morphological brain
differences between adult stutterers and non-stutterers. BMC
Neurol 4:23
Jones DK (2004) The effect of gradient sampling schemes on
measures derived from diffusion tensor MRI: a Monte Carlo
study. Magn Reson Med 51:807–815
Jones DK, Knosche TR, Turner R (2013) White matter integrity, fiber
count, and other fallacies: the do’s and don’ts of diffusion MRI.
Neuroimage 73:239–254
Kell CA, Neumann K, Kriegstein KV, Posenenske C, Gudenberg
AWV, Euler H, Giraud A-L (2009) How the brain repairs
stuttering. Brain 132:2747–2760
Kushner HI (2012) Retraining left-handers and the aetiology of
stuttering: the rise and fall of an intriguing theory. Laterality:
asymmetries of body. Brain Cogn 17:673–693
Lawes INC, Barrick TR, Murugam V, Spierings N, Evans DR, Song
M, Clark CA (2008) Atlas-based segmentation of white matter
tracts of the human brain using diffusion tensor tractography and
comparison with classical dissection. Neuroimage 39:62–79
Lebel C, Benner T, Beaulieu C (2012a) Six is enough? Comparison of
diffusion parameters measured using six or more diffusion-
encoding gradient directions with deterministic tractography.
Magn Reson Med 68:474–483
Lebel C, Gee M, Camicioli R, Wieler M, Martin W, Beaulieu C
(2012b) Diffusion tensor imaging of white matter tract evolution
over the lifespan. Neuroimage 60:340–352
Leemans A, Jones DK (2009) The B-matrix must be rotated when
correcting for subject motion in DTI data. Magn Reson Med
61:1336–1349
Lu C et al (2010a) The neural substrates for atypical planning and execution
of word production in stuttering. Exp Neurol 221(1):146–156
Lu C et al (2010b) Altered effective connectivity and anomalous
anatomy in the basal ganglia-thalamocortical circuit of stuttering
speakers. Cortex 46:49–67
MacDonald CM, Mallard A (1979) Word-by-word analysis of
observer agreement utilizing audio and audiovisual techniques.
J Fluency Disord 4:23–28
Mezer A et al (2013) Quantifying the local tissue volume and
composition in individual brains with MRI. Nat Med
19:1667–1672
Moore WH Jr (1984) Central nervous system characteristics of
stutterers. In: Curlee R, Perkins WH (eds) Nature and treatment
of stuttering: new directions. College-Hill Press, San Diego
Mori S, Crain BJ, Chacko V, Van Zijl P (1999) Three-dimensional
tracking of axonal projections in the brain by magnetic
resonance imaging. Ann Neurol 45:265–269
Nichols TE, Holmes AP (2002) Nonparametric permutation tests for
functional neuroimaging: a primer with examples. Hum Brain
Mapp 15:1–25
Oldfield RC (1971) The assessment and analysis of handedness: the
Edingburgh inventory. Neuropsychologia 9:97–113
Perkins WH, Kent RD, Curlee RF (1991) A theory of neuropsych-
olinguistic function in stuttering. J Speech Hear Res 34:734–752
Postma A, Kolk H (1992) Error monitoring in people who stutter:
evidence against auditory feedback defect theories. J Speech
Lang Hear Res 35:1024–1032
Postma A, Kolk H (1993) The covert repair hypothesis: prearticula-
tory repair process in normal and sttuttered disfluencies.
J Speech Hear Res 36:49–59
Preibisch C, Neumann K, Raab P, Euler H, von Gudenberg A,
Lanfermann H, Giraud A (2003) Evidence for compensation for
stuttering by the right frontal operculum. Neuroimage
20:1356–1364
Rhode GK, Barnett AS, Basser PJ, Marenco S, Pierpaoli S (2004)
Comprehensive approach for correction of motion and disortion
in diffusion-weighted MRI. Magn Reson Med 51:103–114
Riley G (1994) Stuttering severity instrument for children and adults,
3rd edn. Pro-Ed, Austin
Rochman D, Amir O (2013) Examining in-session expressions of
emotions with speech/vocal acoustic measures: an introductory
guide. Psychother Res 23:381–393
Sasson E, Doniger G, Pasternak O, Assaf Y (2010) Structural
correlates of memory performance with diffusion tensor imag-
ing. Neuroimage 50:1231–1242
Sasson E, Doniger GM, Pasternak O, Tarrasch R, Assaf Y (2012)
Structural correlates of cognitive domains in normal aging with
diffusion tensor imaging. Brain Struct Funct 217:503–515
Sasson E, Doniger GM, Pasternak O, Tarrasch R, Assaf Y (2013)
White matter correlates of cognitive domains in normal aging
with diffusion tensor imaging. Front Neurosci 7:32
Scantlebury N et al (2014) Relations between white matter maturation
and reaction time in childhood. J Int Neuropsychol Soc
20:99–112
Schmierer K et al (2007) Diffusion tensor imaging of post mortem
multiple sclerosis brain. Neuroimage 35:467–477
Sheskin DJ (2003) Handbook of parametric and nonparametric
statistical procedures, 3rd edn. CRC Press, Boca Raton
Smith A (1999) Stuttering: a unified approach to a multifactorial,
dynamic disorder. In: Ratner NB, Healey EC (eds) Stuttering
reaserch and practice: bridging the gap. Lawrence Erlbaum
Associates Inc, NJ
Smith A, Goffman L, Sasisekaran J, Weber-Fox C (2012) Language
and motor abilities of preschool children who stutter: evidence
from behavioral and kinematic indices of nonword repetition
performance. J Fluency Disord 37:344–358
Brain Struct Funct
123
Sommer M, Koch MA, Paulus W, Weiller C, Buchel C (2002)
Disconnection of speech-relevant brain areas in persistent
developmental stuttering. Lancet 360:380–383
Stikov N, Perry LM, Mezer A, Rykhlevskaia E, Wandell BA, Pauly
JM, Dougherty RF (2011) Bound pool fractions complement
diffusion measures to describe white matter micro and macro-
structure. Neuroimage 54:1112–1121
Thiebaut de Schotten M et al (2011) Atlasing location, asymmetry
and inter-subject variability of white matter tracts in the human
brain with MR diffusion tractography. Neuroimage 54:49–59
Travis L (1931) Speech pathology. Appelton-Century, New York
Tzourio-Mazoyer N et al (2002) Automated anatomical labeling of
activations in SPM using a macroscopic anatomical parcellation
of the MNI MRI single-subject brain. Neuroimage 15:273–289
Vaden KI, Kuchinsky SE, Cute SL, Ahlstrom JB, Dubno JR, Eckert
MA (2013) The cingulo-opercular network provides word-
recognition benefit. J Neurosci 33:18979–18986
Vassal F, Boutet C, Lemaire J-J, Nuti C (2014) New insights into the
functional significance of the frontal aslant tract-An anatomo-
functional study using intraoperative electrical stimulations
combined with diffusion tensor imaging-based fiber tracking.
Br J Neurosurg 28:685–687
Vos SB, Jones DK, Viergever MA, Leemans A (2011) Partial volume
effect as a hidden covariate in DTI analyses. Neuroimage
55:1566–1576
Vos SB, Jones DK, Jeurissen B, Viergever MA, Leemans A (2012)
The influence of complex white matter architecture on the mean
diffusivity in diffusion tensor MRI of the human brain.
Neuroimage 59:2208–2216
Wakana S et al (2007) Reproducibility of quantitative tractography
methods applied to cerebral white matter. Neuroimage
36:630–644
Watkins KE, Smith SM, Davis S, Howell P (2008) Structural and
functional abnormalities of the motor system in developmental
stuttering. Brain 131:50–59
Williams DE, Wark M, Minifie FD (1963) Ratings of stuttering by
audio, visual, and audiovisual cues. J Speech Lang Hear Res
6:91
Xuan Y et al (2012) Resting-state brain activity in adult males who
stutter. PLoS ONE 7:e30570
Yairi E, Ambrose NG (2005) Early childhood stuttering for clinicians
by clinicians. PRO-ED, Austin
Yeatman JD, Dougherty RF, Rykhlevskaia E, Sherbondy AJ, Deutsch
GK, Wandell BA, Ben-Shachar M (2011) Anatomical properties
of the arcuate fasciculus predict phonological and reading skills
in children. J Cogn Neurosci 23:3304–3317
Yeatman JD, Dougherty RF, Myall NJ, Wandell BA, Feldman HM
(2012) Tract profiles of white matter properties: automating
fiber-tract quantification. PLoS ONE 7:e49790
Brain Struct Funct
123