UNIVERSITY OF TORONTO Faculty of Law
LAW AND ECONOMICS RESEARCH PAPER NO. 01-04
A Cross-Country Comparison of
This paper can be downloaded without charge at:
The Social Science Research Network Electronic Paper Collection: http://papers.ssrn.com/abstract=268557
Full and Partial Venture Capital Exit Strategies
Douglas J. Cumming
Jeffrey G. MacIntosh

A Cross-Country Comparison of
Full and Partial Venture Capital Exits ∗∗∗∗
Douglas J. Cumming School of Business
University of Alberta Edmonton, Alberta Canada T6G 2R6
Tel: (780) 492-0678 Fax: (780) 492-3325
E-mail: [email protected] Http://www.bus.ualberta.ca/dcumming
Jeffrey G. MacIntosh
Toronto Stock Exchange Professor of Capital Markets Faculty of Law
University of Toronto 78 Queen's Park Toronto, Ontario Canada M5S 2C5
Tel: (416) 978-5785 Fax: (416) 978-6020
E-mail: [email protected]
First Draft: October 1999
This Draft: May 21 2002
∗ We owe special thanks to Stefanie Franzke, Aditya Kaul, Paul Halpern, Gary Lazarus, Ted Liu, Mary
Macdonald, Frank Mathewson, Vikas Mehrotra, Corrine Sellars, Kashi Nath Tiwari and Ralph A. Winter and an anonymous referee for helpful comments and discussions. We are also grateful for comments from seminar participants at the University of Alberta Institute for Financial Research Workshop (October, 1999), the ABN AMRO International Conference on Initial Public Offerings, Amsterdam (July, 2000), the Canadian Law and Economics Association Annual Conference, Toronto (September, 2000), the Eastern Finance Association, Charleston (April, 2001), the University of Western Ontario, ASAC (May 2001), the Multinational Finance Society, Lake Di Garda (June, 2001), the University of Frankfurt Center for Financial Studies (CFS) (July, 2001), the University of Hamburg Institute for Law and Economics Workshop (July, 2001), and the Australasian Banking and Finance Conference (December, 2001). Parts of this paper appear in an earlier and different version entitled “The Extent of Venture Capital Exits: Evidence from Canada and the United States,” in J. McCahery and L.D.R. Renneboog, eds., Venture Capital Contracting and the Valuation of High-Tech Firms (Oxford University Press, 2002, forthcoming).

A Cross-Country Comparison of
Full and Partial Venture Capital Exits
Abstract
This paper considers the issue of when venture capitalists (VCs) make a partial, as opposed to a
full exit, for the full range of exit vehicles. A full exit for an IPO involves a sale of all of the venture
capitalist's holdings within one year of the IPO; a partial exit involves sale of only part of the venture
capitalist's holdings within that period. A full acquisition exit involves the sale of the entire firm for cash; in
a partial acquisition exit, the venture capitalist receives (often illiquid) shares in the acquiror firm instead of
cash. In the case of a buyback exit (in which the entrepreneur buys out the venture capitalist) or a secondary
sale, a partial exit entails a sale of only part of the venture capitalist's holdings. A partial write-off involves
a write down of the investment. We consider the determinants of full and partial venture capital exits for all
five exit vehicles. We also perform a number of comparative empirical tests on samples of full and
partial exits derived from a survey of Canadian and U.S. venture capital firms. The data offer support to
the central hypothesis of the paper: that the greater the degree of information asymmetry between the
selling VC and the buyer, the greater the likelihood of a partial exit to signal quality. The data also
indicate differences between the U.S. and Canadian venture capital industries, and highlight the impact
of legal and institutional factors on exits across countries.
Key words: venture capital; partial exits; regulation
JEL classification: G24, G28, G32, G38, K22

1 1. Introduction
Much theoretical research has focused on the role of venture capital financial contracts in mitigating
agency costs and informational asymmetries between venture capitalists and entrepreneurial firms (e.g.,
Sahlman, 1990; Cornelli and Yosha, 1997; Trester, 1998; Marx, 1998; Hellmann, 1998; Bergmann and
Hege, 1998; Trester, 1998; Amit et al., 1998; and Kirilenko, 2001). Empirical research along these lines
may be classified into one of two categories: studies that use industry data with many observations (e.g.,
Gompers and Lerner, 1999a), and studies that use more detailed hand-collected data with up to 200
observations (e.g., Gompers, 1997; Trester, 1998; Kaplan and Strömberg, 2000; Hellmann and Puri, 2002).
A second type of research in venture capital focuses on mitigating agency problems between
entrepreneurial firms and their new owners upon venture capital exit. The ability to make a profitable exit
lies at the heart of venture capital [“VC”] investing (Sahlman, 1990; Gompers and Lerner, 1999a). There
are 5 principle types of VC exits (MacIntosh, 1997): an initial public offerings [“IPO”], in which a
significant portion of the firm is sold into the public market; an acquisition exit, in which the entire firm
is bought by a third party; a secondary sale, in which only the VC’s shares are sold to a third party (again,
typically a strategic acquiror); a buyback, in which the VC’s shares are repurchased by the
entrepreneurial firm; and a write-off, in which the VC walks away from the investment.
Barry et al. (1990), Megginson and Weiss (1991), Ljungqvist (1999), Gompers and Lerner (1999a),
Franzke (2001), Lee and Wahal (2002) and others have considered the role of venture capitalists in the
going public process. MacIntosh (1997) analyzed factors that affect the choice of the complete class of
venture capital exits (IPOs, acquisitions, secondary sales, buybacks, and write-offs); this work has been
extended and the factors that affect the selection of different exits have been empirically tested by Cumming
and MacIntosh (2000, 2002) using a hand-collected data set from venture capital exits in Canada and the
United States. Recent papers by and Schweinbacher (2002) and Cumming (2002) analyze exits in Europe;
Fleming (2002) considers Australian data. Petty et al. (1999) provide U.S. case studies on harvesting
venture capital investments for different types of exits. Smith and Smith (2000) discuss aspects of IPOs,
acquisitions and buybacks. Black and Gilson (1998) introduced the notion of implicit contracting over
exit. Hellmann (2000) and Smith (2000) analyze control over exit. Cochrane (2001) significantly adds to
this research by considering a large sample of U.S. industry data.
2 This paper extends previous research on the complete class of venture capital exit vehicles and
the associated selection effects for measuring the risk and return to venture capital investing. We
distinguish between full and partial exits for the complete class of venture capital exits. We provide
empirical tests of the factors that the choice of a full or partial venture capital exits over the complete
class of exits, and provide evidence that the risk and return to venture investing differs by the extent of
exit for each exit vehicle. Partial exits are typically associated with a higher risk and return, which is
consistent with the proposition that partial dispositions are more common among exits whereby
informational asymmetries are more pronounced.
We use hand-collected data on 248 VC exits from Canada and the United States. This data was
collected using our own surveys and distributed with the assistance of the Canadian Venture Capital
Association, and Venture Economics in the U.S. The trade-off in collection more detailed private VC exits
information is in the comparatively smaller data set; nevertheless, our descriptive statistics are comparable
to the available U.S. industry data described by Cochrane (2001) and the Venture Economics Annual
Reports, and the available Canadian industry data from the Canadian Venture Capital Association Annual
Reports (see section 6). Our hand-collected data involves a number of distinguishing features from
available U.S. industry data employed by Cochrane (2001). For example, the U.S. industry data does not
distinguish between selection among the full class of private exits (acquisitions, secondary sales, and
buybacks), and it does not distinguish between selection of full and partial exits over the five distinct
different types of exits, among other things (see section 6 below).
In the spirit of Black and Gilson (1998), Jeng and Wells (2000), and Mayer et al. (2002), we also
provide an analysis of international differences in venture capital. We find significant differences in exit
behaviour and the risk and return to venture capital as between Canada and the United States. We find a
lower risk and return to venture capital investing in Canada. These differences are likely attributable to a
combination of market and regulatory factors that differ between the two countries.
This paper is organized as follows. Section 2 of this paper recaps the types of exits used by venture
capitalists. Section 3 distinguishes between full and partial exits for each exit vehicle. Section 4 considers
the determinants of full versus partial exits. Section 5 documents institutional and legal differences between
Canada and the United States that may affect exit. The data is described in section 6. Comparison tests
across the data from Canada and the United States are provided in section 7. Empirical tests on factors that

3 affect the extent of exit are presented in section 8. The last section concludes.
2. Types of Exit Vehicles Employed by Venture Capitalists
In general, VCs will exit their investments by one of the following five methods. In an initial public
offering (IPO) the firm sells shares to members of the public for the first time. The VC will typically retain
its shares at the date of the public offering, selling shares into the market in the months or years following
the IPO. Alternatively, following the IPO the VC may dispose of its investment by making a dividend of
investee firm shares to the fund's owners. Despite the fact that the VC will not usually sell more than a
small fraction of its shares at the time of the IPO (if any at all), exits effected by sales subsequent to the IPO
are (following common usage) classified as IPO exits.
The VC may also sell the entire firm to a third party, which we refer to below as an acquisition exit.
Typically, the buyer is a strategic acquiror – a larger entity in the same or similar business to the acquired
firm that wishes to meld the firm’s product or technology with its own (either vertically or horizontally).
Strategic acquisitions often involve the merger of two corporations with some prior contractual relationship,
such as in the supply of inputs or the licensing of a particular technology (MacIntosh, 1994).
This form of exit may be effected in a number of different ways. For example, the transaction may
be structured as a sale of all the shares in return for cash, shares of the acquiror, or other assets.
Alternatively, the transaction may be structured as a sale of the firm's assets or as a merger between the
investee firm and purchasing firm (or a subsidiary thereof).
In an exit effected by way of secondary sale, the VC will sell its shares to a third party – typically a
strategic acquiror, and in some cases another VC. A secondary sale differs from an acquisition exit in that
only the shares of the VC are sold to the third party; the entrepreneur and other investors will retain their
investments. Where the purchaser is a strategic acquiror, it will usually be seeking a window on the firm’s
technology, with a view to possibly effecting out a complete acquisition of the firm sometime in the future.
In a buyback exit, the VC will sell its shares to the entrepreneur and/or the company.
A write-off typically involves the failure of the entrepreneurial firm. The VC may continue to hold

4 shares in a non-viable or barely profitable enterprise in the case of a write-down, as discussed below.
3. Full and Partial Venture Capital Exits
An exit may be full or partial. A full exit for an IPO involves a sale of all of the venture
capitalist's holdings within one year of the IPO; a partial exit involves sale of only part of the venture
capitalist's holdings within that period. A full acquisition exit involves the sale of the entire firm for
cash; in a partial acquisition exit, the venture capitalist receives (often illiquid) shares in the acquiror
firm instead of cash. In the case of a secondary sale or a buyback exit (in which the entrepreneur buys
out the venture capitalist), a partial exit entails a sale of only part of the venture capitalist's holdings. A
partial write-off involves a write down of the investment.
In the case of IPOs, the VC will rarely sell its holdings at the date of the IPO, for reasons explored
further below. By convention (and recording of industry data by the Canadian Venture Capital Association
and Venture Economics in the U.S.; see section 6 below), a full exit is defined as one in which the VC fully
disposes of its holdings within one year of the date of the IPO. A partial exit involves a sale of at least
some of the VC’s holdings within one year of the IPO, with retention of some of its holdings beyond the
one-year period.
In a write-off exit, the VC makes a decision to spend no further time or effort bringing the
investment to fruition, and essentially walks away from it. Indeed, many write-offs involve the bankruptcy
and consequent disappearance of the firm. Given that a partial exit is one in respect of which the VC
disposes of some of its holdings, by common usage there are no partial write-offs. Nonetheless, the
Canadian Venture Capital Association and Venture Economics define a partial write-off as a situation in
which the VC takes a write-down of the investment on its books. When this occurs, it is virtually certain
that the investment is a “living dead” investment – i.e., one involving a viable but marginally profitable
enterprise which lacks sufficient upside potential for the VC to continue to devote time and attention to
it. While distinguishing between full write-offs and partial write-offs thus provides useful information,
partial write-offs are distinct from partial exits in the case of IPOs, secondary sales and buybacks. We
thus segregate the sample of write-offs from the other exit types in our empirical analysis.
The case of partial acquisition exits is also unique. An acquisition exit is, definitionally, an event

5 in which the entire firm is sold, typically to a strategic acquiror that intends to merge the target firm into
its own operations. Such sales frequently involve the payment of cash consideration to the outgoing
shareholders of the purchased firm. Thus, on its face, it seems impossible to imagine that an acquisition
could be a partial acquisition. Nonetheless, in certain situations, the acquisition exit may resemble a
partial exit. At a broad level of generality, there are four types of acquisition exits: a) acquisitions by
public companies with deep public markets; b) acquisitions by public companies that are thinly traded; c)
acquisitions by private companies; d) acquisitions by the investee firm of another firm.
In any of these cases, the consideration received by the VC for selling its shares may be (and often
is) shares. In the first case, shares received by the VC are tantamount to cash, since the shares may freely be
sold into the public market. Such exits are thus properly classified as full exits. In the second case, the
shares can also be converted into cash by a sale into the public market. However, depending on the degree
of illiquidity of the acquiror’s stock, the VC may be able to convert to cash only over a lengthy period of
time, or perhaps (if the market is very illiquid) not at all. Thus, the VC remains invested in the combined
operations of its original investee firm and those of the acquiror. This type of transaction resembles a
partial exit in that the VC’s ability to influence and control the operations of the investee firm are
reduced commensurately with the VC’s reduction in equity ownership (although not linearly1). It also
resembles a partial exit in that, following the transaction, the VC retains an indirect interest in the
investee firm’s assets that is less substantial than the direct interest it formerly held.
In the third case, shares of a private company are necessarily very illiquid. In addition to the
absence of a ready market in which to sell the shares, private companies typically have constitutional or
contractual restrictions on the ability of any shareholder to resell its shares (such as requirements for board
and/or shareholder approval of a share transfer). This type of exit again resembles a partial exit. In the
fourth case, the investee firm acquires, and subsequently merges with, another firm. If the acquired firm is
small relative to the acquiring firm, then there is no exit at all. If the acquired firm is large to the acquiror
(as is typically the case in a transaction structured as a reverse takeover2) then the transaction is either a full
1 Key control thresholds in equity ownership are 33% (conferring the ability to block 2/3 resolution), 50% (conferring de jure control), and 66.67% (conferring the power to pass supermajority resolutions, but this threshold is subject to jurisdictional variation, and variation arising from supermajority requirements in the corporation’s constitution). Also, the VC may no longer possess a seat or seats on the board, and may also sacrifice previously held rights arising from shareholder agreements. 2 A reverse takeover is one in which shareholders of the nominal target corporation are paid in shares in the acquiror corporation. Following the takeover, the two corporations are merged, with shareholders of each corporation receiving shares in the merged entity. The end result is that the shareholders of the former target will hold the majority of shares in the merged

6 or partial exit, depending on the liquidity of the shares received as consideration for the transaction.
While our data sample indicates those situations in which share consideration is received, it does
not indicate the identity or nature of the purchaser, nor whether that purchaser is a public or a private
company. Thus, we are unable to make the fine distinctions between different types of acquisition exits that
we would have preferred to make. As a saw-off, we have classified all acquisition exits in which share
consideration is received as “partial acquisitions”, which assumes that there is at least some degree of share
illiquidity in the average acquisition exit.
Because partial exits for each type of exit are somewhat unique, we have empirically tested the
data both for all exits together, and for each exit vehicle separately. The next section develops a theory of
full versus partial venture capital exits for each type of exit vehicle.
4. A Theory of Partial Exits
In previous work (MacIntosh, 1997; Cumming and MacIntosh, 2000, 2002), we provide a general
theory of venture capital exits. This work, primarily based on Black and Gilson (1998) and Gompers and
Lerner (1999), is briefly summarized as follows. VC investors are active, value-added investors. They
bring not merely capital to the table, but knowledge, skill, and a network of legal, accounting, investment
banking, marketing, and other contacts that are useful to a fledgling enterprise. We hypothesize that a VC
will exit from an investment when the projected marginal value added as a result of the VC's efforts, at any
given measurement interval, is less than the projected cost of these efforts. By "effort" we mean all of those
things that VCs can do to add value to an enterprise. By "cost" we mean all the direct and overhead costs
associated with creating value, the costs of monitoring and periodically re-evaluating the investment, as well
as the opportunity cost associated with alternative deployments of capital. By "projected" we mean to
suggest that the VC will take into account not merely present cost and effort, but a summation of all future
costs and efforts. By "measurement interval", we mean those points in time (whether quarterly, yearly, or
otherwise) at which the VC formally or informally reassesses its continued commitment to an investment.
Below, we refer to the projected costs of maintaining the investment as the “maintenance costs”.
We predict that the exit condition will tend to be satisfied, and the VC will effect an exit, when its entity, giving them control.

7 skill set is exhausted, when the maintenance costs of the investment increase unexpectedly, or when the
VC’s potential value added diminishes sharply (owing, e.g., to an internal event such as a failure of the
firm’s technology, or an external event like a competitor’s invention of a superior product. This will be
subject to considerations relating to the VC’s opportunity cost of investment, however. We hypothesize that
the VC will exit its investment even when the potential value added exceeds the investment’s maintenance
cost, if the VC can sell the investment to a party with a greater ability to add value (such as a strategic
acquiror). Regardless of ability to add value, there may also be windows of opportunity for the VC to sell
into the public market when valuations for technology firms are particularly high.
Engrafted on this general theory are a number of special cases in which the VC will have an
incentive to exit (Cumming and MacIntosh, 2000, 2002). For example, for a variety of reasons (such as the
approach of the fund termination date, at which time all investments must be distributed to fund investors)
the VC may desire to convert its investment into a liquid form. It may thus desire to exit even in a case in
which it remains a value-added (indeed, even the highest value-added) investor. Alternatively, at any given
point in time, a particular buyer, or the public market, may overvalue the firm, giving the VC an incentive to
exit (again, without regard to whether the VC is the highest value-added investor).
When would we expect to observe partial exits? Initially, a partial exit appears to be an odd
phenomenon. A partial exit, involving the disposition of some, but not all of the VC's investment, will
lower the VC's potential upside profit commensurately with the lessening of the VC’s equity stake. It will
also dilute the VC’s ability to exercise powers of control over the enterprise – powers that can be useful in
bringing discipline to management and to maximizing the value of the investment. It will not, however,
substantially decrease the VC’s maintenance costs. Such costs are relatively fixed; i.e., the cost of
maintaining an investment, per dollar of investment, will increase less than proportionately with the size of
the investment. Turning this on its head, as the size of the VC’s investment decreases, it sacrifices
economies of scale in investing. We thus expect that partial exits will be made only in a small number of
special situations, which we summarize here and elaborate below. As will be seen, in most of these
situations, the purpose of the partial exit is to mitigate information asymmetries arising as between the VC
as seller, and the outside buyer(s).

8 4.1. Partial Exit as a Signal of Quality
There is abundant evidence in the finance literature that partial ownership retention is a signal of
quality (e.g., Leland and Pyle, 1977; Lin and Smith, 1997; Gompers and Lerner, 1999a). Partial retention is
a credible signal of quality because it is less expensive for the VC to maintain an ownership interest in a
high quality firm than in a low quality firm. We thus hypothesize that a VC may choose a partial exit in
preference to a full exit in order to signal the quality of the firm and sell shares at a value closer to the firm’s
true worth. Clearly the value of the signal will vary with the degree of information asymmetry between
(selling) insiders and (purchasing) outsiders. Below, we formulate hypotheses about the degree to which
information asymmetry will vary with the investee firm’s book and market values, its stage of development,
and degree of asset intangibility. We also generate hypotheses concerning the degree of information
asymmetry and whether the investment is staged or syndicated, the duration of the VC’s investment, and the
different types of exit vehicles used.
4.1.1. Signalling and Increases in Capital Available to the Venture Capital Industry
When the pool of capital available to the VC industry expands, this will create opportunities for VC
managers to expand the pool of capital under administration, increasing VC returns. In the short run,
however, this will stretch managerial resources, resulting in re-deployment of managers from some old
investments to new investments. We hypothesize that the net effect of an increase in capital in the industry
will be to spark a sale of some of the VC’s existing investments, resulting in a shorter duration of
investment that would otherwise have been the case for those investments. Because younger firms will
exhibit enhanced information asymmetry, this will increase the value of a partial exit as a signal of quality.
We thus hypothesize that an increase in capital available to the VC industry will be associated with a shorter
duration of investment.
4.1.2. Bringing on Board a New Active Investor with Specialized Skills
We hypothesize that, in connection with investments that are of less than “home run” quality, a VC
may wish to bring in another active investor to facilitate in monitoring and strategic decision-making. This
will involve a sale of part of the VC’s shares to the new investor, and hence a partial exit. In this situation,
the use of a partial (rather than a full) exit may also be used to signal quality to the incoming strategic

9 acquiror or other purchaser.
4.1.3. Signalling and Grandstanding
Grandstanding may be an additional reason why earlier stage investments are more likely to be
exited partially. Gompers (1996) finds that younger VC firms will prematurely exit portfolio investments in
order to build a track record that will facilitate further fundraising efforts. The theory of grandstanding may
be extended into more than a theory of why investments are prematurely exited; we hypothesize that it
might also explain why some investments are partially exited.
Grandstanding necessarily involves exit of some investments at an earlier stage than might
otherwise be the case. Ceteris paribus, exiting an investment earlier in the life of the firm will be associated
with heightened information asymmetry, since younger firms are associated with greater information
asymmetry. For this reason, we hypothesize that when a VC fund engages in grandstanding, there is an
elevated probability that a partial will be employed.
There may be another way in which grandstanding leads to a heightened probability of a partial
exit. The best of all worlds for a young VC firm would be to be able to retain all promising investments
while simultaneously establishing a track record. However, establishing a track record necessarily requires
that at least some investments be exited. Via a partial exit, the VC can simultaneously establish a track
record and retain a continuing interest in promising investments. On this view, partial exit is a compromise
between establishing a track record sufficient for purposes of raising capital and remaining involved in those
investments that still have significant upside potential.
4.1.4. Investors’ Divergent Distribution Preferences
There may be rare cases in which some some, but not all, investors in a particular fund are
bullish on continuing to hold a given stock in the VC’s portfolio following the termination date of the
investment fund (or, more likely the termination date of the fund itself, at which point all investments are
distributed). In the analysis that follows, we refer to investors who choose to remain invested in a
particular portfolio firm as “retainers”, and those who choose to receive cash instead as “divesters”.
Because investors will tend to agree that shares in non-public companies should be sold by the VC, and
10 not distributed, we assume that the portfolio company in question is a public company.
The simultaneous existence of retainers and divesters can create an incentive for the VC to
engage in a partial exit. With respect to the retainers, it makes little sense for the VC to sell the shares in
the market. This will simply force retainers to expend brokerage costs in order to repurchase the shares.
With respect to taxable retainers, it will also result in an immediate (and avoidable) tax liability. To
accommodate the divesters, however, the VC will need to sell sufficient stock to generate cash for
distribution. Accommodating both investor preferences necessarily involves a partial exit by the VC.
The existence of an illiquid public market for the shares of the portfolio company will exacerbate
differences in investor preferences. For some investors (and particularly those that are non-taxable, like
pension funds), the prospect of disposing of the shares in an illiquid market will give rise to a cash
preference - at least to the extent that the VC has a comparative advantage in liquidating the shares. For
those with a preference to hold, however, the cost of re-assembling the desired holding post-distribution
will be comparatively great. Not only are brokerage costs higher for illiquid stocks, but in addition there
is a greater likelihood of a temporary adverse price impact resulting from the acquisition activity.
The phenomenon of divergent preferences is unlikely to occur for private companies. As a
general matter, because of their extreme illiquidity, investors are not interested in holding shares in such
companies. Investors will therefore tend to have a universal preference for a cash distribution.
Is it plausible that some investors might be retainers, and others divesters? Investors in different
tax positions could easily have divergent preferences. For example, a taxable individual investor will
tend to be a retainer, in order to postpone tax liabilities. Where the shares are in a relatively illiquid
company, however, a tax exempt investor like a pension fund may prefer that the VC dispose of portfolio
company shares if the VC is perceived to have a comparative advantage in doing so. Our discussions
with VCs suggest to us that differential distributions are a relatively rare, but not unheard of
phenomenon.
Unfortunately, this theory is not directly testable with our exits data. Further research would be
fruitful.
11 4.2. Type of Exit Vehicle and the Benefits of a Partial Exit
Different exit vehicles are associated with different degrees of information asymmetry as between
insiders and outsiders. We expect to see partial exits used more frequently in connection with exit vehicles
for which the new owners face greater hurdles in resolving informational asymmetry. In this subsection, we
summarize our previous research on the extent of information asymmetry associated with different forms of
exit (Cumming and MacIntosh, 2000a).
In the empirical analysis (section 8) we consider the extent of exits for the full sample of all exit
types together, as well as the extent of exit for the subsamples of each exit type individually. The tests
based on all exit types together (Table 4 in subsection 8.1 below) is based on the premise that full and
partial exits for each exit vehicle involve partial ownership retention, so the dependent variable (the extent
of exit) may be used for all exits together. The tests with 5 separate subsamples for each exit type
separately (Tables 5a – 5e in subsection 8.2 below) is consistent with the view that the dependent variable is
different (i.e., the meaning of a partial and full exit is different) for each exit vehicle. We present both
perspectives to illustrate the robustness of the results to the underlying assumptions.
4.2.1. Initial Public Offerings
Initial public offerings (IPOs) involve the sale of shares of a company to public investors, typically
(but not always) accompanied by a listing on a stock exchange. We hypothesize that this form of exit will
be accompanied by the greatest information asymmetry between the firm and its new owners. This is partly
a product of the relatively unsophisticated nature of public buyers. While all but the smallest IPOs are sold
mainly to institutional investors, institutional money managers will not possess the same degree of expertise
in any particular technology as strategic acquirors, which are typically the purchasers in both acquisition
exits and secondary sales. Nor will they be as knowledgeable as the entrepreneur herself, in the case of a
buyback. Thus, public buyers will be the least sophisticated purchasers.
Public buyers will also suffer from free rider problems. The incentive of each is to rely on other
buyers to set an accurate IPO price. It is well known that this free rider problem carries over into post-IPO
monitoring of the firm’s activities. By contrast, exits via acquisitions, secondary sales, and buybacks all
result in considerable concentration in post-exit shareholdings.
12
These problems will be all the more acute with respect to technology issues, in which information
asymmetry between insiders and outsiders is high, and for which the skill and knowledge deficit is most
pronounced. About three-quarters of all VC investments are made in technology investments (Macdonald,
1992, Venture Economics, 1993-1996, Gompers and Lerner, 1999a).
The skill and knowledge deficit and the free rider problem will be abridged by the investment
bankers (and other professionals associated with the offering, such as lawyers and accountants) who will use
their knowledge and expertise to price IPOs, and hence to protect public investors. The very fact that an
investment banker is willing to bring an issue to market is a signal of the issue’s quality; indeed, the more
reputable the investment banker, the more potent the signal of quality (Megginson and Weiss, 1991).
Investment bankers, however, like institutional money managers, tend to be generalists,3 who will in turn
rely heavily on their technology analysts in determining whether to underwrite a particular offering. Despite
their specialized skills, however, these analysts are unlikely to be able to replicate the knowledge and
experience of a strategic acquiror, or the firm’s insiders. Thus, even the presence of expert market
intermediaries will leave more information asymmetry in the case of IPOs than with respect to acquisition
exits, secondary sales, and buybacks. Because a partial exit mitigates information asymmetry, we
hypothesize that partial exits will be used more often in association with IPOs than with other forms of exit
in the tests using the full sample of all exits in the empirics (see Table 4 in section 8).
In the empirics we also consider the subsample of IPO exits separately (see Table 5a in section 8),
and consider factors that affect the extent of IPO exits. These factors are discussed further in subsections
4.3 – 4.8 below.
4.2.2. Acquisition Exits
As noted earlier, an acquisition exit involves the sale of the entire firm to a third party, typically a
strategic acquiror. We classify any acquisition exit where share consideration is paid to the VC as a partial
exit. Given it is somewhat unique, in the empirical analysis (section 8) of the extent of exit for all exits 3 This is more frequently the case in Canada than in the United States. Almost all underwriters in Canada are generalists. Even Yorkton securities, the investment banker with perhaps the best claim to be a technology boutique, still does approximately 30% of its business in traditional industries. Moreover, it does not specialize in any one segment of the technology market. By contrast, in the United States, boutique underwriters more frequently concentrate on technology offerings, or even on particular

13 together (Table 4), we therefore suppress the acquisition exits variable to avoid problems of collinearity
across different exit types.
We perform tests in section 8 on the subsample of acquisition exits to determine when share as
opposed to cash consideration is likely to be paid (see Table 5b below). Because of collinearity problems,
we were able to run regressions on the set of acquisition exits in our sample only with a limited number of
variables, namely technology versus non-technology investments, market/book ratio, investment duration,
and a variable for market conditions (discussed further in subsection 4.8 below). We hypothesize that we
will observe more partial exits (i.e., those in which share cash consideration is received) with technology
investments. Technology investments are riskier than non-technology investments, and therefore more
difficult to value. This creates a valuation risk that will be borne by those who continue to hold shares in
the investee firm, whether directly or indirectly (i.e., through share ownership of the purchaser). Giving
share consideration is a way of splitting this risk between purchaser and seller. This in turn avoids at least
two moral hazard problems. First, the vendor will be tempted to misrepresent the value of the firm to the
acquiror. Remaining indirectly invested in the investee firm through holding the acquiror’s shares
attenuates this risk. Second, the seller(s) possess skill and knowledge that has continuing value to the
purchasers. Remaining invested provides an incentive to communicate this information and, more
generally, to continue to work so far as possible to make the investee firm work.
In addition, technology firms dominate our sample. Most acquirors of technology firms will also be
technology firms, and such firms are notoriously strapped for cash. This also makes the use of share
consideration preferable to cash consideration.
We also hypothesize that a high market/book ratio is consistent with a fast growth firm, and such
firms are more likely to be characterized by uncertainty as to future earnings and profitability than firms
with slow but steady growth. We thus hypothesize that high market/book ratios will be associated with
more partial acquisition exits, to signal quality.
Finally, longer duration of investment will tend to be associated with a more mature firm with less
information asymmetry, and the lower the degree of valuation risk. We thus hypothesize that the longer the
duration, the less frequently we will observe partial acquisition exits. types of technology offerings.
14
4.2.3. Secondary Sales
Instead of selling the entire firm, the VC may sell all or part of its investment to another venture
capitalist or a strategic acquiror in a secondary sale. As we have suggested elsewhere (Cumming and
MacIntosh, 2000a), a secondary sale is likely to be an inferior form of exit to an acquisition exit (Cumming
and MacIntosh, 2000a). Generally speaking, a strategic acquiror will prefer to purchase 100% of the firm,
since it then has much greater freedom to use the firm’s assets and technology unhindered by legal
obligations to other owners. While this will not always be the case (the acquiror may desire nothing more
than gaining a window on the firm’s technology), we believe that it will be the case more often than not.
Moreover, because in a secondary sale the buyer will purchase less than 100% of the firm, the
incentive and ability to monitor post-exit will be less than in connection with a strategic acquisition
(lowering the value of the purchase to the acquiror). In addition, a bilateral agency problem arises as
between two previously unrelated owners of the firm - the entrepreneur and the new owner. There is no
guarantee that this relationship will work well.
A secondary sale will also typically involve sale of the VC’s shares but not the entrepreneur’s. This
may be indicative of a breakdown in the relationship between the entrepreneur and VC (i.e., the parties are
not “working on the same team”) (MacIntosh, 1997). This is frequently associated with a lack of clear
direction and purpose – and hence an investment that is floundering.
In some (relatively infrequent) cases, secondary sales will be made to other VCs. This will
probably occur most often when a venture capital fund nears the end of its life cycle (typically ten years)
and investments must be liquidated in an orderly fashion. This is clearly a scenario that the VC would
prefer to avoid, since a forced sale may be a fire sale. Nonetheless, there may be firms that, as the end of the
fund’s existence approaches, are ready neither for an IPO nor a strategic sale. In this situation, a secondary
sale may be the best that can be achieved.
We nonetheless hypothesize that a partial secondary sale may be value enhancing. A partial
secondary sale to a strategic acquiror or other VC is similar to a syndication of the investment, given that it
will bring on board an additional skilled monitor. A VC may be willing to entertain a partial secondary sale

15 when it would not be willing to entertain any other form of exit, where the investee firm has a promising
future, but where the skill set of management and of the current team of active investors is inadequate to
fully develop the firm’s potential.
While our data sample does not disclose the identity of the purchasers in secondary sales, anecdotal
evidence suggests that purchasers in secondary sales are usually strategic purchasers – in many cases with a
view to making a future acquisition if the technology proves successful. In such cases, the buyer will be a
skilled monitor. If we can assume that maintenance costs are spread equally among all active investors (and
that free rider problems do not corrupt this equal allocation of monitoring responsibility), then the
maintenance costs of each active investor will be proportionately reduced by the partial sale of the VC’s
shares and the arrival of the new active investor. Thus, while a secondary sale will necessarily reduce the
seller’s upside, it may also reduce the seller’s maintenance cost by a commensurate amount. Even if it does
not, the new active investor may sufficiently enhance the upside to justify the VC’s sale of part of its shares.
We nevertheless suggest that this type of value-enhancing secondary sale will tend to be confined to
investments without significant home run potential. If the VC views the investee firm as a suitable
candidate for an IPO, it is unlikely that it will accede to a secondary sale of part its interest. Such a sale will
reduce the upside potential commensurate with the proportion of shares sold. Since IPOs typically yield the
greatest return on investment, this reduction in upside will likely dominate any advantages secured from
obtaining a new active monitor.
Another way of putting this is that the act of bringing a new specialized monitor on board
suggests that the VC is not entirely confident about the firm’s future under current stewardship, and/or
the potential of its technology – and hence its ability to take the firm to an IPO. Very likely, the strategic
acquiror will harbor thoughts of ultimately purchasing the entire firm, should its product prove
successful. Thus, any further attempts to take the firm public are likely to lead to material conflicts
between the firm’s investors, diverting management’s focus and damaging the business.
In summary, we suggest that a partial secondary sale is a superior form of exit vehicle to a full
secondary sale. We have argued that full secondary sales will tend to occur in situations where the
investment is floundering. By contrast, the investment is likely to be relatively healthy in situations in
which we observe a partial secondary sale, although probably not of home run potential.

16
We also considered that partial secondary sales may be effected in situations of high information
asymmetry, in order to induce the strategic acquiror to purchase. This explanation for partial secondary
exits does not suggest that partial exits will be of higher quality than full secondary exits. However, we
note that strategic acquirors are likely to be able to resolve information asymmetries quite effectively on
their own, mitigating the efficacy of a partial VC exit to signal quality. Thus, we suggest that partial
secondary sales will more often be designed to bring on board a new specialized monitor than to
overcome information asymmetries.
For the reasons expressed above, we hypothesize that, taking a secondary sale is (taking into
account other factors influencing the extent of exit) more likely to be effected as a partial than as a full exit.
This hypothesis is tested in our full sample estimates (see Table 4 in subsection 8.1).
In the empirical analysis in section 8, we also consider the subsample of secondary sale exits to
consider the factors that affect the extent of exit for only secondary sale exits (see Table 5c in subsection
8.2). The factors that affect the extent of exit for the subsample are discussed in subsections 4.3 – 4.8.
4.2.4. Buybacks
In a buyback exit, the entrepreneur is the new owner of the VC’s shares. In other associated work
(Cumming and MacIntosh, 2000a), we hypothesize that buybacks are an inferior form of exit reserved for
cases in which the investment is a “living dead” or “lifestyle” company that satisfies the entrepreneur’s
desire for profit but has virtually no home run potential. Because informational asymmetry is eliminated (by
definition), the need for a partial exit is mitigated. Although buybacks do not suffer from problems of
informational asymmetry, they put a large strain on the firm’s and/or entrepreneur’s cash resources, and thus
almost by definition will not involve companies with high valuations.
In such cases, the VC will have a clear preference for a full exit. However, consistent with the
theory that these are living dead investments and the firm is only modestly successful and with limited
ability to generate cash flow, the entrepreneur (with or without external borrowing) may not have the
resources to effect a full buyout. For this reason, our null hypothesis is that buybacks will be associated
with an elevated probability of a partial exit. This hypothesis is tested in the full sample estimates (see

17 Table 4 in subsection 8.1).
In the empirical analysis in section 8, we also segregate the subsample of buyback exits to
determine the factors that affect the extent of a buybacks separately (see Table 5d in subsection 8.2). These
factors are discussed further below in subsections 4.3 – 4.8.
4.2.5. Write-offs
An investment will be fully written off when the VC determines that there is little or no prospect of
ever recovering its initial investment. A “partial write-off”, in our data set, is a write-down on the books of
the company. In this situation, the VC recognizes that the investment still has value, but lacks the
significant upside potential that motivates venture capital investing. When a write-down occurs, the VC
will likely spend very little or no further effort in bringing the investment to fruition. In the parlance of the
VC, it is a “living dead” or “walking wounded” investment. As partial write-offs signal the VC has poor
quality firms remaining in their portfolio, we hypothesize that write-offs will more often be full write-offs.
This hypothesis is tested in the full sample estimates (see Table 4 in subsection 8.1 below).
A partial write-off is somewhat unique in that it entails nothing more than a write down of the
book value of the investment. In the empirical analysis in section 8 we therefore also segregate the
sample of write-offs to separately consider the factors that lead VCs to write down an investment rather
than completely writing it off (see subsection 8.2). Unfortunately, because of collinearity problems, we
were unable to regress the extent of write-off against any variables save duration and market conditions
(see subsection 4.8 below), and thus report only our hypothesis in relation to those variables (Table 5e).
We hypothesize that the longer the investment duration, the less likely an investment will be written-off,
as opposed to being written-down. This is because an investment of longer duration has survived more
periodic profitability evaluations than an investment of shorter duration. Periodic re-evaluations act as a
screen to cull the least desirable investments from the VC’s portfolio. The worst investments are likely
to be culled in one of these periodic re-evaluations, while investments of at least living dead quality (i.e.,
those that are written down rather than written off) will survive but ultimately be written-down.
4.2.6. The Direction of Causality in the Relationship Between Exit Vehicle and Extent of Exit
18 Above, we assumed that the choice of exit vehicle affects the extent of exit. However, it may
also be the case the extent of exit affects the choice of exit vehicle. This potential for endogeneity is
considered in the empirical analysis (and see also Cumming and MacIntosh, 2000a,b).
4.3. Development Stage and the Benefits of a Partial Exit
Information asymmetry between firm insiders and outsiders varies substantially with the stage of
the firm’s development at the time when the investment is made (e.g., Gompers and Lerner, 1999a).
However, it is the degree of information asymmetry at the time of exit that will be a factor in determining
whether to make a full or partial exit. It may be, however, that there is some correlation between the stage at
which the investment is made and the degree of information asymmetry at the time of exit. When
investments are made at an early stage (particularly at the seed or start-up stages, and perhaps the expansion
stage; for definitions of the stages of development, see e.g., MacDonald, 1992, MacIntosh, 1994, or Venture
Economics, 1993-1996), informational asymmetries are high. Further, the rate at which informational
asymmetry is resolved will be high in the first few years following the investment. For later stage
investments (buyout, turnaround), however, the information asymmetry will be comparatively low – and the
rate at which informational asymmetry is resolved will also be low. Thus, for any duration of investment,
early stage investments will be characterized by a higher degree of unresolved informational asymmetry
than later stage investments. This puts a premium on partial exits as a signal of quality.
Put somewhat differently, there is good evidence that VC involvement in an investee firm is a
signal of the investment’s quality (Gompers and Lerner, 1999a; Megginson and Weiss, 1991; Sahlman,
1990). However, we hypothesize that VC involvement in early stage investments sends a more
ambiguous signal regarding quality than VC involvement in later stage investments. When a VC makes
an initial investment, the VC will use a filter to separate those investments that are worthy of investing in
from those that are not. This may be called the “threshold criterion for investment” (“TCI”); only those
firms that meet the threshold criterion will receive funding. Once the investment is made, it will
periodically be re-evaluated to determine if the investment will be continued (i.e., not exited). We call
the continuance criterion the “threshold criterion for continuance” (“TCC”). We hypothesize that the
TCC at any given stage in the firm’s existence will be lower than the TCI. This is plausible because once
the investment has been made, the VC’s managers will acquire expertise with respect to the investee firm
that is necessarily to some degree firm-specific – such as the cost involved in achieving familiarity with
19 management, the firm’s technology, etc. By themselves, these sunk costs are economically irrelevant and
will not figure in any decision to continue or exit. Nonetheless, these early investments in the
acquisition of firm-specific information create knowledge assets that will lower the continued cost of
monitoring the firm and maintaining the investment. Thus, the TCC will be less than the TCI, and a
VC’s decision to continue an investment will be a less potent certification of quality, at any given stage,
than a decision to embark upon a fresh investment. This enhances the need to signal quality via a partial
exit. Our null hypothesis is thus that the earlier the stage at which the investment is made, the more
likely it is that a partial exit will be used.
4.4. Venture Capital Investment Duration and the Benefits of a Partial Exit
Venture capital investment duration signals the degree to which the venture capitalist has
mitigated informational asymmetries and agency problems faced by the new owner(s) upon purchase of
the entrepreneurial firm (Cumming and MacIntosh, 2000b). Megginson and Weiss (1991), for example,
show IPO underpricing is less pronounced when VC investment duration is longer. Longer venture
capital investment duration thus mitigates the need for a partial exit. For this reason, we hypothesize
that the longer the investment duration, the lower will be the proportion of partial exits.
4.5. Increases in Available Capital and the Benefits of a Partial Exit
In other work, we hypothesize (and present evidence) that increases in the total amount of capital
available in the venture capital industry lowers the average duration of venture capital investments
(Cumming and MacIntosh, 2000b). A vital component of venture capital is the expertise of the venture
capital managers; indeed, this expertise is at the very heart of venture capital investing, since venture capital
investors are value-added investors (Gompers and Lerner, 1999a; Sahlman, 1990). However, managerial
expertise necessarily takes time to develop, and this means that in the short run, the supply of skilled venture
capital managers is restricted. Since VCs are commonly compensated by the receipt of some percentage
(usually 20%; see Sahlman, 1990) of the increase in the value of assets under management, there is a strong
incentive to expand the pool of capital, even if this entails a premature exit from previous investments
(Gompers, 1996). Thus, when the pool of available capital expands, VCs have an incentive to re-deploy
managers from old to new investments.

20 We hypothesize that increases in available capital will increase the proportion of partial exits.
Anything that results in unanticipated divestment will shorten the average duration of VC investments; i.e.,
some proportion of the VC’s portfolio will be exited at an earlier stage than would otherwise be the case.4
Firms at an earlier stage in their development will be characterized by heightened information asymmetry
(between the firm and the prospective buyers). Thus, the proportion of firms in which a partial exit will
serve as a valuable signal of quality will increase. We therefore hypothesize that expansion in the pool of
available capital will result in an increase in the proportion of exits taken as partial exits.
4.6. Firm Growth Rate and the Benefits of a Partial Exit
For each investment in our sample, we have the investment or “book” value, and the exit or
“market” value. We can thus compute the ratio of market to book value. A high market to book value
has an ambiguous effect on the extent of exit. Investments with a high market to book value are likely to
be the highest quality investments in the VC’s investment portfolio. If so, such investments should have
relatively little informational asymmetry and the need for a partial exit to signal quality is mitigated. On
the other hand, investments with a high market to book value are likely to be high growth firms, and high
growth firms are typically characterized by much uncertainty as to future value – i.e., abundant
information asymmetry. This suggests that a partial exit will be useful in mitigating this asymmetry. We
believe that the second effect will be stronger, and thus our null hypothesis is that firms with a high market
to book ratio will be more likely to be partially than fully exited.
The very basis for partially exiting, however, is to achieve a higher exit value. Thus, there is
potential for endogeneity with this variable; in the empirical analysis we test for endogeneity.5
4.7. Technology Firms and the Benefits of a Partial Exit
4 The empirical results in section 8 are not materially affected by the inclusion of both the variables for investment duration and capital available for investment. 5 In the empirical analysis quality is proxied by the value the VC receives for the investment (market value) divided by book value). There is potential for endogeneity with this variable if a partial exit leads to a different full exit value (tests for endogeneity in the empirical analysis in section 8 suggested this was insignificant). Generally, however, causation is expected to run from quality to the extent of exit, as quality is associated with lower informational asymmetry, which in turn diminishes the need for a partial exit. Further, note that in partial exits for IPOs, secondary sales and buybacks, the data only indicate the proceeds received from the shares sold; thus, the proceeds will be lower than that for the sale of the whole company. This will bias the results in favour of finding an association between low proceeds and partial exits. We have therefore adjusted the market values upward by the typical fraction received in the case of partial exits for IPOs, secondary sales and buybacks in the empirical analysis in section 8. See also note 9, infra.

21
Approximately 70% of all venture capital investments are made in technology companies (see, e.g.,
Canadian Venture Capital Association, 1993-1996; Venture Economics, 1993-1996) and 30% in traditional
sectors. Compared to these traditional sectors, technology companies are characterized by greater asset
intangibility, and heightened informational asymmetry and agency costs (Helwege and Liang, 1994; Hart
and Moore, 1994; Noe and Rebello, 1996; Gompers and Lerner, 1999a). As such, we hypothesize that we
are more likely to observe partial exits for high-technology firms.
4.8. Other Factors Affecting the Extent of Exit
In the survey data (described in section 6), we observe some exits that are preplanned, and others
associated with unsolicited offers, market conditions, or “other reasons”. Due to problems of collinearity,
these variables are not included in the full sample estimates (see Table 4 in subsection 8.1). Nevertheless,
where possible, we include some of these variables in the econometric models using the data for the
separate subsamples in Tables 5a – 5e as control variables (see subsection 8.2).
5. Legal and Institutional Differences Across Canada and the United States
Previous research has documented regulatory differences across Canada and the United States, and
stressed the impact of such differences on small and medium sized enterprises (MacIntosh, 1994; see also
Gillen, 1992, and Halpern, 1997, on Canadian regulation; see Levin, 1995, and Gompers and Lerner, 1999a,
on U.S. regulation). This subsection only briefly highlights some of the more important differences –
securities regulation and government sponsorship of venture capital6 – as they pertain to full versus partial
exits without going into an in depth analysis of regulatory differences across the two countries discussed in
other sources (e.g., MacIntosh, 1994).
In related work (MacIntosh, 1994, 1997; Cumming and MacIntosh, 2000, 2002) we present
evidence that there are significant institutional and legal differences between Canadian and U.S. venture
6 VCs will pay capital gains tax regardless of the exit vehicle selected (MacIntosh, 1994). Nevertheless, there may be tax incentives for partial exits if VCs want to defer tax until their next taxation year (Levin, 1995). Such a strategy, however, would mitigate the venture capitalist’s certification effect of a partial exit. Mixing of taxation factors and certification strategies send mixed signals to all new owners regarding the rationales underlying the partial exit. It is more likely that the VC will delay the entire exit until the next taxation year, rather than pursue a partial exit, if there is an underlying taxation motive so that the benefits of signalling through partial exits are not mitigated.

22 capital markets. The effect of these differences can be summarized as follows: (1) more onerous hold
period and escrow requirements applicable to Canadian VCs, and lower liquidity in Canadian secondary
markets, suggest that partial exits will be more common in Canada than in the U.S., particularly for IPOs;
(2) government sponsorship of venture capital through the vehicle of the “Labour Sponsored Venture
Capital Corporation” distorts investment and exit behaviour, introducing noise into exit behaviour and
making it less likely that the theoretical model of investment duration will hold; (3) VC managers in Canada
are less skilled than their U.S. counterparts, again introducing noise into the Canadian exits data and making
it less likely that the theoretical model will hold in Canada. Taken together, these factors suggest that it is
better to treat the Canadian and U.S. data as distinct sub-samples than to pool the data. Nonetheless, in our
empirical tests below, we both segregate and pool the data to provide comparative evidence.
It is also noteworthy that different restrictive covenants and other constraints imposed on venture
capitalists may exist across countries. For example, in the United States, venture capital partnership
agreements specify a number of restrictive covenants on the actions of general partners (venture capital
managers) (Gompers and Lerner, 1996); these restrictions include covenants relating to the management
of the fund (e.g., the size of investment in any one firm, the use of debt, coinvestment, reinvestment of
capital gains), covenants relating to the activities of general partners (e.g., coinvestment by general
partners, sale of partnership interests, fundraising, the addition of other general partners), and covenants
relating to the types of investment (e.g., investments in other venture funds, public securities, leveraged
buyouts, foreign securities and other asset classes). The frequency of use of these restrictions changes
over time subject to changes in economic conditions. These restrictions may impact upon the selection
effects associated with venture capital exits and measuring the risk and return to venture capital.
Because these restrictions may differ across countries, we provide comparative evidence from Canada
and U.S. in the spirit of Black and Gilson (1998) and Jeng and Wells (2000). Further research across
other countries is warranted.
In sum, reduced market liquidity in Canada should lead to a greater number of partial exits to signal
quality. A lesser degree of underwriter specialization should also lead to greater use of partial exits, as
should the relative inexperience of Canadian venture capital managers. One mitigating factor is the noise
introduced by LSVCC investments in Canada. Nonetheless, overall, we expect a greater use of partial exits
in Canada to signal the quality of VC investments. Enhanced escrow and hold period requirements will also
result in more partial IPO exits in Canada; not to signal quality, but merely to comply with the regulatory
23 requirements.
The testable hypotheses described above are summarized in Tables 1a and 1b. The data used to test
these propositions and the comparative effects of regulation in the two countries is described in section 6.
Empirical tests follow in sections 7 and 8.
[Tables 1a and 1b About Here]
6. Data
Survey data over the period 1992-1995 from 112 venture capital exits in the U.S. and 134 venture
capital exits in Canada are used to test the hypotheses developed herein. The IPO exits data are publicly
available. With respect to acquisitions, secondary sales, buybacks and write-offs, private data were
collected through the facilities of Venture Economics in United States, and the Canadian Venture Capital
Association (CVCA) in Canada. Participation by surveyed venture capitalists was completely voluntary.7
The confidentiality of the data imposes some limitations on our empirical tests. For example,
although we know that an IPO exit was partial or full, we do not know the exact date of the sales of
securities that led to the partial or full exit. The data nevertheless provide a first look at full and partial exits
across all exit vehicles, and a first look at the factors that affect the extent of exit for the complete class of
venture capital exits. U.S. industry data (see Cochrane, 2001) shows histograms of returns that are quite
similar to our survey data (see Figures 1 and 2). However, the U.S. industry data does not make distinctions
between types of exits over the complete class of private exits (acquisitions, secondary sales and buybacks),
and does not make distinctions between full and partial exits over the complete class of exits. Given the
institutional differences in venture capital across countries (see section 5) and economic differences in full
versus partial exits (see sections 2, 3 and 4), the figures make distinct the U.S. and Canadian data for full
and partial exits. The data suggest the extent of exit and legal and institutional factors discussed above are
7 Factors that may induce self-selection reporting bias of private data (acquisitions, secondary sales, buybacks and write-offs) across Canada and the U.S. are likely to be the same in the two countries; therefore self-selection bias, if it exists, should not affect the comparative cross-country results. The Canadian Venture Capital Association (1993-1996) reports the total dollar values of the exits in Canada for each exit vehicle; Venture Economics (1993-1996) only reports the total dollar values of IPO and acquisition exits. Additional industry data (such as the extent of each exit) is not available in the Venture Economics (1993-1996) and Canadian Venture Capital Association (1993-1996) annual reports; nevertheless, the available industry data do not suggest significant discrepancies between the Canadian and U.S. samples and industry data. See also notes 8 and 9, infra.

24 important considerations in measuring the risk and return to venture capital. Sections 7 and 8 below provide
statistical tests for such differences across Canada and the United States for the complete class of exits and
for full and partial exits.
Table 2a summarizes the United States data by the choice of exit vehicle. The U.S. sample
comprises approximately 10% of the U.S. exits in the Venture Economics database over this period (see
Venture Economics, 1993-1996, and notes 7 and 9).8 Eighty-seven of the 112 U.S. exits were full exits.
Partial exits are observed across all the exit types, although (as indicated above) a partial exit in the case of
an acquisition or a write-off has a different meaning than in other exit contexts. Full exits in the U.S. were
most common among write-offs, and least common among buybacks. Twenty-seven percent of the U.S.
IPOs are partial exits.9 Table 2b summarizes the Canadian data, which comprise 32% of the exits in the
CVCA database over the 1992-1995 period (see Canadian Venture Capital Association, 1993-1996, and
note 7). Buybacks are more frequent in Canada than in the U.S. In contrast to the U.S. data, full exits are
also relatively more common for buybacks in Canada (perhaps because Canadian VC investments are, on
average smaller than their U.S. counterparts, suggesting smaller investee firms and greater ease with which
the entrepreneur can buy out the VC). The data on the average investment values, exit values, gross and real
returns, variation in real returns, duration, and whether the firm was in a high-technology industry are also
summarized in Tables 2a and 2b.10
Table 3a summarizes additional information in the data by the extent of exit. The data indicate the
stage of investment at the time of initial investment (seed, start-up, expansion, buyout, turnaround, and
8 While the total number of secondary sale, buyback, write-off and other exits are unknown in the U.S., we base our estimate on the total number of IPO and acquisition transactions reported by Venture Economics over the test period. “Other” exits comprise a mixed exit (e.g., part buyback and part secondary sale). The exact details of the few other exits in Canada and the U.S. are unknown; dummies for “other” exits are not included in the empirical analysis. The market values for partial exits have been adjusted to reflect the full market values, assuming an average 68.9% distribution of shares for partial exits (see also notes 6 and 13). The empirical results in section 8 are robust to a wide variety of adjustments to the full market values for partial exits. 9 The statistics may suggest a bias towards self-reporting of full exits, but there is similar evidence. Gompers and Lerner’s (1999a: Table 13.1) U.S. sample of IPOs (1978-1993) indicates that the median percentage of VC holdings distributed was 100% in the first distribution, and the first VC distribution occurred within a median of 0.9 years from the time of the IPO. For all IPO distributions, VCs distributed a median of 68.9% of their holdings within a median time of 1.02 years. 10 How is it that average annualized returns are negative in some cases (such as secondary sales in the U.S.) when gross exit returns are positive? Consider the following example: Investment A: exit value = $75, book value = $50. Investment B: exit value = $45, book value = $50. Suppose the duration of Investment A = 7 years; duration of Investment B = 1 year. The average exit value = (75+45)/2 = $60, and the average book value = (50+50)/2 = $50. The gross return on Investment A = (75-50)/50 = 50%. The gross return on Investment B = (45-50)/50 = -10%. The average gross return = (50% - 10%)/2 = 20%. The annualized return on Investment A = (75/50)(1/7) –1 = 5.96%. The annualized return on investment B = (45/50)(1/1) –1 = -10%. The average annualized real return = (5.96%-10%)/2 = -2.02%.

25 secondary purchases; these investment stages are commonly used in venture capital investing in Canada and
the U.S. and defined in the annual reports of the Canadian Venture Capital Association and Venture
Economics in the U.S.).
Table 3b provides correlation coefficients between the extent of exit (a dummy variable indicating
the value 1 for a full exit and zero otherwise) and the average annualised real returns in Canada and the
United States. The only statistically significant coefficients are for Canadian acquisition and secondary sale
exits: full exits are correlated with lower real returns. These statistics in Table 3b provide an incomplete
picture; therefore, additional comparison of means and other tests are provided below. In the following
sections we consider differences in the risk and return to venture capital for full and partial exits and factors
that affect the extent of exit in the two countries.
[Figures 1 – 2 and Tables 2 – 3 About Here]
7. Comparison Tests of Full and Partial Exits in the U.S. and Canada
Are there differences in the returns to venture capital investing, and the variance of the returns, for
the five different exit vehicles and for full and partial venture capital exits? Are these differences similar
across countries, or do legal and institutional factors affect the risk and return to venture capital investing?
We address these questions by performing a number of simple direct comparison tests: tests for differences
in proportions, variances, and means. Below, we describe some of the significant differences observed in
the data. Section 8 considers in more detail explanations for the observed differences in the extent of exits
in a multivariate setting.
There are differences in the proportion of exits taken as full versus partial exits within both Canada
and the United States across the different exit vehicles.11 In both the U.S. and Canadian data, more than
50% of all exits are full exits (the two-sided p-values for the test statistics are equal to zero in both the
Canadian and U.S. data). The U.S. data indicate that more than 50% of exits are full exits among the sub-
samples of IPOs (p-value equal to 0.011), acquisitions (p-value equal to 0.001) and write-offs (p-value equal
to 0.000). In the Canadian data, more than 50% of exits are full exits for acquisitions (p-value equal to 11 The test statistic for testing whether the proportion (P) is greater than some base proportion (P0) is given by: (P-P0) / (P0(1-P0)/n)0.5 where n is the number of survey responses. See, e.g., Newbold (1988), ch.9. The test statistic is normally

26 0.003), buybacks (p-value equal to 0.000) and write-offs (p-value equal to 0.000).
There are also differences in the proportion of full and partial venture capital exits across Canada
and the United States.12 Statistically significant differences between the Canadian and U.S. samples are
found in the proportion of full exits for IPOs (two-sided p-value equal to 0.018) and buybacks (p-value
equal to 0.003). A greater proportion of IPOs in the U.S. are full exits than in Canada (p-value equal to
0.018). This difference is in accord with the legal and institutional differences described in section 5. For
buybacks, a greater proportion of exits are full exits in Canada than in the U.S. (p-value equal to 0.003).
Possible explanations for the difference in the extent of buybacks are considered below in section 8.
There is evidence of significant differences in the variance of average annual real returns across exit
types for full and partial exits.13 There are significant differences across each exit vehicle, and across full
and partial exits, within each country. In particular, the variance of returns for IPOs is significantly greater
(at the 1% level of significance) than that for each of the other four exit vehicles in both the U.S. and
Canada. The variance of returns for full IPO exits is significantly greater than that for partial exits, but this
result is only significant in the U.S. (p-value equal to 0.004 in the U.S., and 0.664 in Canada). The variance
of all full exits in the U.S. is significantly greater than that for partial exits (p-value equal to 0.001);
however, the opposite is true in Canada (p-value equal to 0.087). This difference is attributable to the
variance in the returns to full acquisition exits in the U.S. (see Table 2).
The data also indicate that the variance of average annual real returns is significantly greater in the
U.S. than in Canada at the 1% level of significance for each exit vehicle (the only exceptions are for the
subsamples of IPO and buyback exits where the differences were insignificant). These results are consistent
with the more extensive regulations in the Canadian industry lowering risk taking among venture capitalists
in Canada (section 5; see also MacIntosh, 1994).
There are differences in the means of the average annual real returns for full and partial exits for the distributed for n>30; the t-distribution is used for n<30. 12 The test statistic for the equality of proportions (P) is given by: (PUS – PCan) / (P0(1 – P0) (nUS + nCan) / nUS nCan)0.5 where P0 = (nUSPUS + nCanPCan) / (nUS + nCan), PUS is the proportion of responses from the US data, PCan is the proportion of responses from the Canadian data, nUS is the number of US responses, nCan is the number of responses Canadian responses. See, e.g., Newbold (1988), ch.9. The test statistic is normally distributed for n>30; the t-distribution is used for n<30. 13 The test statistic for the equality of variances of returns (X) is given by: Var(XIPO)/Var(XOther), where Var(XIPO) and Var(XOther) are the variances of the annual real returns for IPOs and other exits, respectively. See, e.g., Newbold (1988), ch.9; see

27 complete class of venture capital exits within each country.14 Consistent with MacIntosh (1997), Cumming
and MacIntosh (2000) and Cochrane (2001), the highest quality entrepreneurial firms are either taken public
or are acquired. Consistent with research on each type of private exit (including acquisitions, secondary
sales, buybacks and write-offs; see MacIntosh, 1997, and Cumming and MacIntosh, 2000, 2002), secondary
sale and buyback exit strategies are used for lower quality firms, and the lowest quality firms are written off.
The returns to partial exits are on average significantly greater than the returns to full exits in Canada (p-
value equal to 0.000), but not in the U.S. (p-value equal to 0.160). This difference across Canada and the
U.S. may in part reflect the large number of buyback exits in Canada taken as full exits (Table 2b), and the
variability of returns associated with acquisition exits in the U.S. (see Table 2a).
Finally, there exist differences in the average annual real returns across the U.S. and Canada.
Average annual real returns for all exits are greater on average in the U.S. sample; however, the high
variability in returns in the U.S. sample (particularly for acquisition exits) gives rise to a test statistic that is
statistically insignificant (p-value equal to 0.579). Average annual real returns are significantly greater in
the U.S. than in Canada among the subsamples of IPOs (p-value equal to 0.054) and buybacks (p-value
equal to 0.009). This is consistent with the institutional differences across the two countries previously
discussed in section 5 and the greater variability of returns in the U.S.15
In sum, selection of full or partial exits among the full class of exit vehicles (IPOs, acquisitions,
secondary sales, buybacks and write-offs) is associated with different average annual real returns, and
differences in the variance of average annual real returns. These differences are in part attributable to
economic factors affecting informational asymmetries between the entrepreneurial firm and the new
owner(s) upon venture capital exit (see section 4). But the significance of the differences across Canada and
the U.S. also suggests that legal and institutional factors across countries are also important in assessing the
risk and return to venture capital. These differences may arise from securities regulation, market liquidity,
among other things (see section 5). These differences may also arise from restrictive covenants governing
venture capital firms, imposed in some cases by statute (Canadian LSVCCs; see section 5), and in other
also Zar (1984). 14 The test statistic for the equality of means (X) is given by: (XIPO – XOther) / (Var(XIPO)/nIPO + Var(XOther)/nOther)0.5 where XIPO and XOther are the mean real returns for IPO and other exits, respectively, and Var() is the variance of the returns. See, e.g., Newbold (1988), ch.9. The test statistic is normally distributed for n>30; the t-distribution is used for n<30. 15 The differences are partly attributable to the longer investment duration in Canada relative to the U.S. (see Cumming and MacIntosh, 2001). Note that duration also affects the selection of particular exit vehicles (Cumming and MacIntosh, 2000) and extent of exit (see section 8).

28 cases by limited partners (Gompers and Lerner, 1996). Further research on the relative importance of these
factors in measuring the risk and return to venture capital is warranted. In the following section we consider
factors that affect the selection of full and partial exits among the full class of exit types.
8. Empirical Evidence on the Factors that Affect the Extent of Exit in the U.S. and Canada
As discussed above in subsection 4.2, partial exits may be considered for all exits taken together, or
for the subsamples of each exit vehicle separately. In Table 4 we present the econometric regressions for all
exits taken together.16 In Tables 5a – 5e we present the results for the subsamples of IPOs, acquisitions,
secondary sales, buybacks, and write-offs, respectively. In all cases, the binary left-hand-side variable, the
extent of exit, was recorded as follows: full exits received the value “1”, and a partial exits were noted with
a “0”. As such, significant positive coefficients indicate a greater likelihood of a full exit, while significant
negative coefficients indicate a greater likelihood of a partial exit.17 Akaike and Shwartz information
criteria were used to infer the appropriateness of the included right-hand-side variables in each of the
regressions. We present only the logit estimates; probit regressions, among others, were not materially
different. In subsection 8.1 we discuss the full sample estimates. The results for each exit separately are
considered in subsection 8.2.
[Tables 4 and 5a – 5e About Here]
8.1. Full Sample Estimates (Table 4)
The U.S. logit estimates (Table 4) suggest that partial exits are neither more nor less likely for IPOs
and secondary sales, although they have the expected negative sign. As noted earlier, this may be a product
of our definition of partial exit, which records as a full exit any exit in which all the VC’s shares are sold
within a year of the IPO. It is likely that many VC’s sell their shares after the expiry of the six-month
escrow period. 16 We suppress a dummy variable for the ‘other’ exits (see note 8) to avoid perfect collinearity problems. But the inclusion of all five other exit vehicles still generates collinearity problems in estimation, given the fact that there are only a couple of ‘other’ exits, and even fewer ‘other’ partial exits. Because acquisition exits are somewhat unique (see subsection 4.2.2), we also suppress the acquisition exits dummy variable to avoid problems of collinearity across variables for different exit types. We nevertheless assess the factors that affect the extent of acquisition exits in Table 5b in subsection 8.2. 17 Durbin-Wu-Hausman tests (see Davidson and MacKinnon, 1993: 235-242) were used to test for the effect of possible endogeneity with some of the explanatory variables. Instruments used included the geographic location (U.S. states and

29
By contrast, the Canadian data as well as the full sample estimates indicate (at the 5% level of
significance) that IPO exits tend to be partial exits. Unfortunately, as we indicated earlier, this reflects the
more onerous escrow and hold periods in Canada, and cannot uniquely be attributed to a desire to signal the
quality of the investee firm.
In respect of secondary sales, we earlier hypothesized that partial secondary sales are likely to be a
more efficient form of exit, and that we would thus expect more partial exits. The U.S. data do not support
this hypothesis. However, the Canadian coefficient has the expected sign and is significant at the 5% level
(and the full sample coefficient is significant at the 10% level). This is consistent with the lower average
skill level of Canadian VCs noted earlier. Lower skill levels make it more likely that a Canadian VC will
make a partial secondary sale in order to effect a mini-syndication, bringing on board a new specialized
monitor, whether it be another VC or a strategic acquiror. It is also consistent with other factors noted in
section 5 that make a partial exit a more potent signal of quality in the Canadian context.
With respect to buybacks, we earlier noted that information asymmetries are minimal or non-
existent, leaving little role for a partial exit as a signalling device. We also noted, however, that buyback
exits are likely to be made in the case of living dead investments. The buyback may thus overstretch the
resources of the entrepreneur and/or investee firm, leading to a heightened probability that a partial exit will
be made. In Table 4, all three data samples indicate a negatively signed coefficient, in accord with this
hypothesis. However, only the U.S. sample estimates are statistically significant (two-sided p-value equal to
0.0140). This is consistent with the relative size of U.S. and Canadian investments; Tables 2a and 2b show
that the average VC investment in the U.S. is nearly twice as large as the average VC investment in Canada.
A buyback will thus put more strain on the entrepreneur in the U.S. than in Canada, leading to a greater
likelihood of a partial exit.
We also note that buybacks appear to be used with much greater frequency in Canada than in the
U.S. (i.e., 41 versus 6 buyback exits in samples of relatively equal size; see Tables 2a and 2b). This is
consistent with the hypothesis that Canadian VCs possess, on average, a lower degree of skill than their U.S.
counterparts, and consequently breed a higher proportion of living dead investments (although it is also
worth noting that there are somewhat fewer write-offs in Canada than in the U.S.). Canadian provinces) of the investee firms. There was no significant evidence of endogeneity.

30
In the U.S. data, the logit estimates indicate (p-value equal to 0.0332) that technology firms are
more likely to be partially exited, as predicted. The Canadian evidence, however, is not supportive.18 This
is puzzling, since we had predicted that a partial exit would have greater value in the Canadian context. The
result may be explicable if Canadian securities markets are more likely than the U.S. to be characterized by
technology fads, in which investors herd to buy technology offerings in a manner only loosely tied to
underlying fundamentals. While we are unaware of any direct evidence on point, there is evidence that
Canadian markets exhibit more inefficiencies than the relatively mature U.S. markets (Jog and Riding,
1990).
In respect of investment duration, we hypothesized that the longer the duration of the investment,
the less the degree of information asymmetry between insiders and outsiders, and the lesser the need for a
partial exit. Thus, we expected a positive coefficient on duration. The estimates, however, do support the
existence of any relationship. Similarly, the data did not confirm our hypothesis of a relationship between
the stage at which the initial investment was made and the extent of exit (the one significant coefficient (at
the 10% level) is the start-up coefficient in the full sample, but it does not have the expected sign).
We had predicted that the greater the availability of capital for investment, the greater the likelihood
that some investments will be prematurely liquidated, enhancing the value of a partial exit as a signal of
quality. We find differential results in Canada and the U.S., but these differences are insignificant.
We also hypothesized that the higher the market/book ratio, the higher the firm’s growth rate, and
the greater the uncertainty about future profitability. We thus expected a partial exit to be a useful signal of
quality (i.e., we expected a negative coefficient). Only the Canadian coefficient is statistically significant
(at the 10% level).19 This is consistent with our hypothesis that a partial exit has more signalling value in
the Canadian context.
8.2. Subsample Estimates With Each Exit Vehicle Segregated (Tables 5a – 5e)
As discussed above, some right-hand-side variables were necessarily excluded in the estimates
18 The particular type of technology industry did not affect the results. 19 DWH tests did not indicate endogeneity problems; see note 12, supra.

31 using the smaller subsamples of the different exit types separately in order to avoid estimation problems
arising from perfect collinearity. We were nevertheless able to include some of the variables associated
with the reasons for exit in the survey data (see subsection 4.8 and section 6) that were excluded in the full
sample estimates to avoid collinearity problems.
Table 5a considers the extent of exit for the sub-sample of IPOs. The U.S. evidence indicates
that market conditions are the only significant determinant of the extent of IPO exits. Consistent with
related research, the data indicate full exits are more likely associated with exits for reasons of market
conditions.20 The Canadian evidence, by contrast, indicates full IPO exits are more common among seed
investments. This is not in accord with our weak hypothesis respecting the stage of development and the
extent of exit (subsection 4.3). Partial IPO exits in Canada are more likely the greater the market/book
value. We also hypothesized that the higher the market/book ratio, the higher the firm’s growth rate, and
the greater the uncertainty about future profitability. We thus expected a partial exit to be a useful signal of
quality (i.e., we expected a negative coefficient; see subsection 4.6). The coefficient in the Canadian IPO
data is supportive. The greater need to signal quality in Canada is attributable to institutional factors
discussed in section 5 above.
Table 5b provides the logit estimates for the separate sample of acquisition exits in Canada and the
United States. Some of the included variables for Table 4 were necessarily excluded in Tables 5b to avoid
perfect collinearity problems, and in the end we were able to regress the extent of exit only on the variables
technology, market/book ratio and investment duration. We were also able to include a dummy variable for
survey respondents indicating exit was associated with reasons of market conditions, but this variable is
insignificant. Earlier, we hypothesized that we would observe more partial exits in connection with
technology firms, high market/book firms, and investments of lesser duration. In the U.S. sample, we find
evidence that technology investments and higher market/book investments are indeed associated with a
greater likelihood of a partial exit. However, contrary to expectation, we find that a partial exit is more
likely the longer the investment duration. We do not have a good explanation for this puzzling result. In
addition, none of the independent variables was significant in respect of the Canadian data in Table 5b.
Once again, we are not able to provide a good explanation for this result. Further research on the extent of
acquisition exits is warranted.

32 We also considered the sub-sample of secondary sale exits alone in Table 5c, where we were able to
regress the extent of exit on the duration, market/book, fundraising and market conditions variables. While
the evidence is generally insignificant, it does indicate in the combined sample that partial secondary sales
are more likely the greater the market/book ratio, as expected (see subsections 4.2.3 and 4.6).
The subsample of buybacks (Table 5d) shows some differences between Canada and the U.S. The
longer duration of investment the greater the likelihood of a partial buyback, but this result is only
significant in Canada. A buyback of creates a strain on the entrepreneur’s resources (see subsection 4.2.4);
that investment duration is longer may be related to cash flow shortages and inability to complete a full
buyback within one year. We had also predicted (subsection 4.5) that the greater the amount of venture
capital fundraising, the greater the likelihood that some investments will be prematurely liquidated. We find
differential results in Canada and the U.S., but the differences are generally not statistically significant. The
only evidence in support of the hypothesis is from the combined Canada – U.S. sample in Table 5d for
buyback exits.
As noted earlier, the write-off data was also segregated for purposes of the regressions (Table 5e).
Unfortunately, all of the right-hand-side variables except investment duration and market conditions had to
be suppressed to avoid problems of colinearity. The combined Canada and U.S. data indicate at the 10%
level of significance that the longer the investment duration, the more likely the investment will be written
down than written off. This is in accord with our hypothesis about the relationship between the extent of
write-off exits and investment duration (see subsection 4.2.5).
9. Conclusion
The comparative evidence in the Canadian and U.S. survey data indicates the importance of
selection effects across the full class of exits (IPOs, acquisitions, secondary sales, buybacks, and write-offs)
for both full and partial exits. Significant differences exist in the proportions of full and partial exits across
different exit vehicles, and across the two countries. The significant differences we observe in the risk and
return to venture capital within each country are in part attributable to selection effects in the choice of exit
vehicle and in the extent of exit. The significant differences we observe in the returns to venture capital
across the countries are consistent with the legal and institutional differences in the U.S. and Canadian 20 Gompers and Lerner (1999a) consider the extent of IPO exits in much more detail.

33 venture capital industries. Both the extent of exit for different exit vehicles and legal and institutional
factors appear relevant in assessing the risk and return to venture capital across countries.
International differences between Canada and the United States provide some insight into the
factors that affect the selection of full versus partial exits. The extent of exit may be predicted by the degree
of information asymmetry between firm insiders and outsiders. Overall, we find evidence in support of
some, but not all of the expected relationships. Curiously, however, in no case do we find support for our
hypothesized relationships in both the United States and Canada. We believe that some of these differences
are explicable. For example, that a buyback is more likely to result in a partial exit in the U.S. and not in
Canada can be explained by the higher average investment made by U.S. venture capitalists in their invested
firms, which diminishes the entrepreneur’s ability to use her own resources to buy out the VC. Similarly,
that IPOs tend to be associated with partial exits in Canada can be explained as a product of Canada’s
regulatory environment, with longer escrow and hold period requirements. The statistical insignificance of
IPO exits as a predictor of a partial exit in the U.S. is probably due to the six-month escrow period that binds
VCs after the IPO. If many VCs sell immediately following the elapse of the escrow period, these exits will
show up as “full” exits on our data sample, even though anecdotal evidence provides strong support for the
proposition that U.S. venture capitalists typically agree to an escrow so as to signal the investment quality to
outside investors.
Other differences in our empirical results between the two countries are less easily explained. We
posited a number of factors (such as a less efficient capital market, lower average VC skill, and a variety of
intuitional factors) that would lead us to believe that a partial exit would have more value in Canada than in
the United States. Our result in relation to the significance of the market/book ratio is in keeping with this
hypothesis, as is the result pertaining to secondary sales. However, the hypothesis also suggests that the
technology investment variable should be more significant in Canada than in the U.S. In fact, it is
significant in the U.S. but not in Canada, as is the capital for investment variable. Thus, our theoretical
predictions about differences between the two countries are not supported by the data. It may be that our
Canadian results are contaminated by noise resulting from the lower average skill level of Canadian VCs,
given that this will tend to introduce some randomness into exit decisions.
That there are demonstrable differences in the results between Canada and the United States is in
itself significant, as it suggests that even if our theory is incomplete, the selection of full versus partial exits
34 and the risk and return to venture investing in the two countries does indeed differ in light of different
institutional, regulatory, and market contexts. Further research across other countries is warranted.
References
Amit, R., Brander, J., and Zott, C. 1998. Why do venture capital firms exist? Theory and Canadian
evidence. Journal of Business Venturing 13, 441-466. Barry, C.B., Muscarella, C.J., Peavy III, J.W., and Vetsuypens, M.R., 1990. The role of venture capital firms
in the creation of public companies: evidence from the going public process. Journal of Financial Economics 27, 447-471.
Berglöf, E., 1994. A control theory of venture capital finance. Journal of Law, Economics, and Organization
10, 247-267. Bergmann, D., and Hege, U., 1998. Venture capital financing, moral hazard, and learning. Journal of
Banking & Finance 22, 703-35. Black, B.S., and Gilson, R.J., 1998. Venture capital and the structure of capital markets: banks versus stock
markets. Journal of Financial Economics 47, 243-277. Canadian Venture Capital Association, 1993-1996. Venture Capital in Canada: Annual Statistical Review
and Directory. Toronto. Cornelli, F. and Yosha, O., 1997. Stage financing and the role of convertible debt. London Business School
Working Paper No. 253-1997. Cochrane, J., 2001. The risk and return of venture capital. Mimeo, University of Chicago Graduate School
of Business. Cumming, D.J., 2002. Contracts and exits in venture capital finance. Mimeo, University of Alberta. Cumming, D.J., and MacIntosh, J.G., 2000, 2002. Venture capital exits in Canada and the United States.
Mimeo, University of Alberta and University of Toronto. Cumming, D.J., and MacIntosh, J.G., 2001. Venture capital investment duration in Canada and the United
States. Journal of Multinational Financial Management 11, 445-463. Davidson, R., and MacKinnon, J.G., 1993. Estimation and Inference in Econometrics. New York: Oxford
University Press. Fleming, G., 2002. Exit strategies in Australian venture capital: how important are IPOs? Mimeo.
Australian National University. Franzke, S.A., 2001. Underpricing of venture-backed and non-venture-backed IPOs: Germany’s Neuer
Market, Mimeo, Center for Financial Studies, University of Frankfurt.

35 Gillen, M.R, 1992. Securities Regulation in Canada. Scarborough, Ontario: Carswell. Gompers, P.A., 1995. Optimal investment, monitoring, and the staging of venture capital. Journal of
Finance 50, 1461-1489. Gompers, P.A., 1996. Grandstanding in the venture capital industry. Journal of Financial Economics 42,
133-156. Gompers, P.A., 1998. Ownership and control in entrepreneurial firms: an examination of convertible
securities in venture capital investments. Mimeo. Harvard University, Cambridge, MA. Gompers, P.A., and Lerner, J., 1999a. The Venture Capital Cycle. Cambridge: MIT Press. Gompers, P.A., and Lerner, J., 1999b. Conflict of interest in the issuance of public securities: evidence from
venture capital. Journal of Law and Economics 42, 1-28. Gompers, P.A., and Lerner, J., 1999c. What drives venture capital fundraising? NBER Working Paper 6906. Gompers, P.A., and Lerner, J., 2000. Money chasing deals? The impact of fund inflows on private equity
valuation. Journal of Financial Economics, 55: 281-325. Hart, O., and Moore, J., 1994. A theory of debt based on the alienability of human capital. Quarterly Journal
of Economics 109, 841-879. Halpern, P., 1997. Financing Growth in Canada, (editor) University of Calgary Press. Hellmann, T., 1998. The allocation of control rights in venture capital contracts. Rand Journal of
Economics, 29: 57-76. Hellmann, T., 2000. IPOs, acquisitions and the use of convertible securities in venture capital. Mimeo,
Stanford University. Hellmann, T., and Puri, M., 2002. Venture capital and the professionalization of start-up firms: empirical
evidence. Journal of Finance, forthcoming. Helwege, J., and Liang, N., 1994. Is there a pecking order? Evidence from a panel of IPO firms. Finance and
Economic Discussion Series 94-22, Board of Governors, Federal Reserve System. Jeng, L.A., and Wells, P.C., 2000. The determinants of venture capital fundraising: evidence across
countries, Journal of Corporate Finance, 6, 241-289. Jog, V.M., and Riding, A.L., 1990. A note on insider trading and issuances of restricted-voting common
shares. Journal of Business Finance and Accounting 17, 460-469. Kaplan, S.N., and Strömberg, P., 2000. Financial contracting theory meets the real world: an empirical
analysis of venture capital contracts. Mimeo, University of Chicago.

36 Kirilenko, A.A., 2001. Valuation and control in venture finance. Journal of Finance 56, 565-587. Lee, P., and Wahal, S., 2002. VC, Certification and IPOs. Mimeo, Emory University. Leland, H., and Pyle, D., 1977. Informational asymmetries, financial structure and financial intermediation.
Journal of Finance 32, 371-387. Lerner, J., 1994. The syndication of venture capital investments. Financial Management 23, 16-27. Levin, J.S., 1995. Structuring Venture Capital, Private Equity, and Entrepreneurial Transactions. Boston:
Little, Brown. Lin, T.H., and Smith, R.L., 1997. Insider reputation and selling decisions: the unwinding of venture capital
investments during equity IPOs. Journal of Corporate Finance 4, 241-263. Ljungqvist, A.P., 1999. IPO Underpricing, wealth loss and the curious role of venture capitalists in the
creation of public companies. Mimeo, New York University. MacDonald, M. 1992. Venture Capital in Canada: A Guide and Sources. Canadian Venture Capital
Association. MacIntosh, J.G., 1994. Legal and Institutional Barriers to Financing Innovative Enterprise in Canada.
monograph prepared for the Government and Competitiveness Project, School of Policy Studies, Queen's University, Kingston, Discussion paper 94-10.
MacIntosh, J.G., 1997. Venture capital exits in Canada and the United States, in P.J. Halpern, ed.,
Financing Growth in Canada (University of Calgary Press), 279-356. Mayer, C., Schoors, K., and Yafeh, Y., 2002. Sources of funds and investment activities of venture
capital funds: evidence from Germany, Isreal, Japan and the U.S. Mimeo, Oxford University, University of Ghent, and Hebrew University of Jerusalem.
Megginson, W., and Weiss, K., 1991. Venture capitalist certification in initial public offerings. Journal of
Finance 46, 879-903. Newbold, P., 1988. Statistics for Business and Economics. Prentice Hall, New York. Noe, T.H., and Rebello, M.J., 1996. Asymmetric information, managerial opportunism, financing and
payout policies. Journal of Finance 51, 637-660. Petty, J.W., Martin, J.D., and Kensinger, J.W., 1999. Harvesting Investments in Private Companies.
Morristown, NJ: Financial Services Research Foundation, Inc. Rajan, R.G., 1992. Insiders and Outsiders: The choice between informed and arm's length debt. Journal of
Finance 46, 1367-1400. Sahlman, W.A., 1990. The structure and governance of venture capital organizations. Journal of Financial
Economics 27, 473-521.
37 Schweinbacher, A. 2002. An empirical analysis of venture capital exits in Europe and the United States.
Mimeo, University of Namur. Smith, D.G., 2001. Control over exit in venture capitalist relationships. Mimeo, Lewis and Clark Law
School. Smith, J.K., and Smith, R.L., 2000. Entrepreneurial Finance, New York: Wiley. Trester, J.J., 1998. Venture capital contracting under asymmetric information. Journal of Banking &
Finance 22: 675-99. Tucker, D., 1999, Proposed national escrow regime. Enterprise (Canadian Venture Capital Association,
June), 2-3. Venture Economics Investor Services, 1993-1996. Venture Economics Annual Review. Securities Data Co. Zar, J.H., 1984. Biostatistical Analysis. (Prentice Hall, Inc. Englewood Cliffs, New Jersey). Zingales, L., 1995. Insider ownership and the decision to go public. Review of Economic Studies 62, 425-
448.

38
-1-.8
-0.4 0
0.4
0.8
1.2
1.6 2
2.4
2.8
3+
0
5
10
15
20
25
30
35
40
45
50
Num ber of Exits
Average Annual Real Return (%)
Figure 2. His togram of Venture Capital Exits in Canada
Write-of f
Buyback
Secondary Sale
Acquisition
IPO
All Exits
-1-.8 -
0.4 0 0.4 0.8 1.2 1.6 2 2.4 2.8 3+
0
5
10
15
20
25
30
Number of Exits
Average Annual Real Return (%)
Figure 1. Histogram of Venture Capital Exits in the United States
Write-off
Buyback
Secondary Sale
Acquisition
IPO All Exits

39
Information Partial Exit Partial Exit Facilitates Partial Exits Arise FromAsymmetry Rank* Signals Quality Entrepreneur Ownership Canada United States Canadian LSVCCs
IPO 1 Yes No Very Likely Possibly Possibly
Secondary Sale 2 Yes No No No Possibly
Acquisition 3 No No No No No
Buyback 4** No Yes No No No
Write-off N/A No*** No No No No
Information Partial Exits for Partial Exits for Partial Exits for Partial Exits for Partial Exits forAsymmetry IPOs Secondary Sales Acquisitions Buybacks Write-offs
Technology Firms Greater Yes N/A Yes Yes N/A
Longer Investm ent Duration Lower No No No Uncertain Yes
Higher Market/Book Value Greater Yes Yes Yes Uncertain N/A
Early Development Stages Greater Yes N/A N/A N/A N/A
Greater Fundraising Greater Yes Yes N/A Yes N/A
N/A: not applicable.*** Partial write-offs m ay in fact be a signal that the VC firm has a portfolio of 'living-dead' investments.** Inform ation asym metry is elim inated with a buyback as the entrepreneur is the new owner.
N/A: Not applicable. Some hypotheses were not testable with the data.
* A Rank of 1 indicates the most significant.
Partial Exits Arise From Hold-Periods?
Table 1b. Sum m ary of Testable Hypotheses by Entrepreneurial Firm Characteristics
Table 1a. Sum m ary of Testable Hypotheses by Exit Vehicle

40 Table 2a. United States Venture Capital Full and Partial Exits Data Summarized by Exit Vehicle*
Number of Average TechnologyPortfolio Duration Industry Average Average Average Gross Average Annual Variance in Average Annual Variance in Average Annual Variance in
Exit Vehicle Companies (Years) No Yes Partial Full Investment** Exit Value** Real Return(%) Real Return(%) Real Return(%) Real Return(%) Real Return(%) Real Return(%) Real Return(%)
IPO 30 4.7000 12 18 8 22 2,035,036 12,565,880 464.6397 54.9152 51.1517 83.5759 154.3296 44.4932 14.9276Acquisition 30 5.1667 9 21 6 24 1,720,349 3,859,077 143.0386 57.8286 754.7467 20.1013 18.0705 67.2604 943.0674
Secondary Sale 9 6.3333 2 7 3 6 519,931 1,005,871 54.8768 -7.5650 6.6850 -3.1798 15.3582 -9.7570 4.3797Buyback 6 4.0000 5 1 5 1 784,397 2,687,449 145.0423 24.7910 3.2665 21.6493 3.3428 40.4996 0.0000Write-off 33 4.3636 15 18 2 31 1,984,068 92,500 -97.8450 -90.0070 4.8772 -100.0000*** 0.0000 -89.3620*** 5.1315
Other 4 2.7500 2 2 1 3 1,112,445 1,539,990 35.2761 34.0191 83.9444 165.6761 0.0000 -9.8670 10.3594Total 112 4.7500 45 67 25 87 1,714,030 4,706,597 147.3815 5.6146 256.6047 34.1439 83.5232 -2.5835 304.8443
Table 2b. Canadian Venture Capital Full and Partial Exits Data Summarized by Exit Vehicle*
Number of Average TechnologyPortfolio Duration Industry Average Average Average Gross Average Annual Variance in Average Annual Variance in Average Annual Variance in
Exit Method Companies (Years) No Yes Partial Full Investment** Exit Value** Real Return(%) Real Return(%) Real Return(%) Real Return(%) Real Return(%) Real Return(%) Real Return(%)
IPO 36 5.8611 3 33 20 16 1,464,087 5,170,185 1385.8530 27.8282 9.8247 32.8825 10.6479 21.5102 8.6706Acquisition 16 6.9375 9 7 1 15 1,945,386 3,271,514 84.5848 13.3089 2.9498 5.9532 0.0000 13.7993 3.1193
Secondary Sale 12 3.0833 0 12 5 7 402,144 968,181 165.6950 54.8972 90.2764 106.4305 179.2162 18.0877 8.0910Buyback 41 6.3415 30 11 7 34 668,245 808,686 66.9712 3.8207 1.5041 9.9051 1.1401 2.5680 1.5212Write-off 27 4.0741 18 9 1 26 332,038 3,821 -97.1010 -92.0440 4.3792 -100*** 0.0000 -91.7380*** 4.5280
Other 2 6.0000 2 0 1 1 2,412,731 3,687,627 60.1537 9.5346 0.1692 6.6257 0.0000 12.4435 0.0000Total 134 5.5299 62 72 35 99 969,012 2,169,579 399.0807 -3.2530 33.8738 33.4777 41.8835 -16.2390 24.9186
Partial Exits Only
Partial Exits Only
Partial exit market values are adjusted to reflect full values. Real returns are calculated assuming investment at the beginning of the year, and exit at the end of the year, reflecting the lowest possible estimate.
Partial exit market values are adjusted to reflect full values. Real returns are calculated assuming investment at the beginning of the year, and exit at the end of the year, reflecting the lowest possible estimate.
CANSIM, label B3400. Values expressed in U.S. dollars for comparative purposes only. Returns were computed in Canadian dollars and do not reflect exchange rate changes.
Extent Full Sample Including Partial Exits Full Exits Only
*** Partial write-offs (write-downs) were recorded without indicating the full cost of the amount not written off. Full write-offs yielded a small return upon liquidation.
of Exit
* Source: Canadian Venture Capital Association.** Real Canadian Dollars (base year=1990) converted to U.S. Dollars. CPI data source: CANSIM, Label P700000; available at www.chass.utoronto.ca. Foreign exchange rates from
Full Sample Including Partial Exits
*** Partial write-offs (write-downs) were recorded without indicating the full cost of the amount not written off. Full write-offs yielded a small return upon liquidation.
** Real U.S. Dollars (base year=1990). CPI data source: International Financial Statistics, Label 11/64; available at www.chass.utoronto.ca.* Source: Venture Economics
Extentof Exit
Full Exits Only

41
Seed Start-up Early Stage Expansion Buyout Turnaround / SP** Technology Avg. Duration Avg. Market/Book Market Conditions Unsolicited Offer Preplanned Other
United StatesFull Exits 20 18 23 22 1 3 51 4.6552 2.2637 33 9 21 23
Partial Exits 7 2 2 12 1 1 16 5.0800 3.2050 5 1 13 6
CanadaFull Exits 4 34 7 48 2 4 47 5.1818 1.4364 18 26 21 34
Partial Exits 2 9 8 13 1 2 26 6.5143 15.0448 15 3 14 3
Table 3a. Relations Across Investment Variables and the Extent of Venture Capital Exit in the United States and Canada*
** SP stands for secondary purchases. There were no secondary purchases in the Canadian data. There were no turnaround investments in the U.S. data.* See Tables 1 and 2 for relations across choice of exit vehicle and extent of exit.
Investee Firm Characteristics Investment Characteristics Reason for Exit
All Exits IPO Acquisition Secondary Sale Buyback Write-off
United StatesNumber of Exits** 112 30 30 9 6 33
Correlation Coefficient with Full Exit Dummy Variable -0.0959 -0.2458 0.0698 -0.1272 0.4258 0.1167t-statistic -1.0243 -1.4327 0.3844 -0.3879 1.2740 0.6798
two-sided p-value 0.3079 0.1630 0.7036 0.7096 0.2717 0.5017
CanadaNumber of Exits** 134 36 16 12 41 27
Correlation Coefficient with Full Exit Dummy Variable -0.3767 0.1142 -0.4788 -0.4788 -0.2279 0.0580t-statistic -5.0810 0.6943 -2.4846 -2.1517 -1.5392 0.3023
two-sided p-value 0.0000 0.4922 0.0262 0.0569 0.1318 0.7649
Table 3b. Correlation Coefficients between the Extent of Exit and the Average Annualized Real Returns in Canada and the United States*
* Positive (negative) correlation coefficients indicate full exits are correlated with higher (lower) returns.** Does not sum across columns because the few 'other' exits reported in Tables 2a and 2b are excluded here.
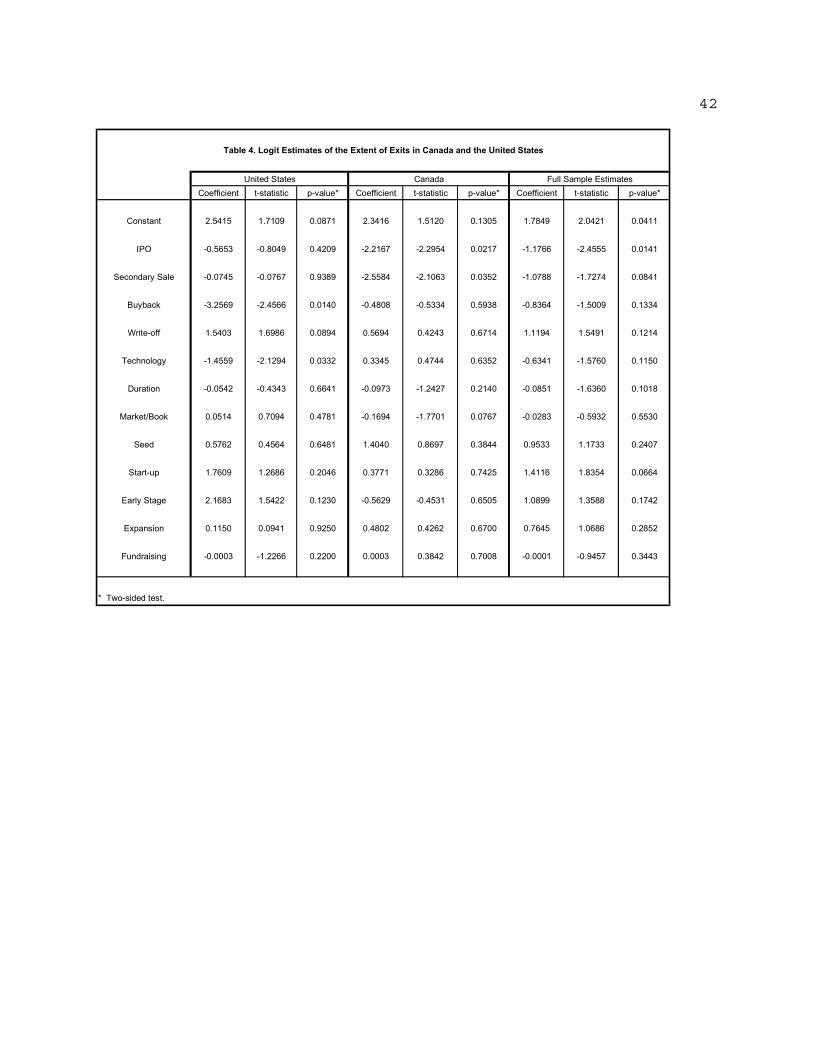
42
Coefficient t-statistic p-value* Coefficient t-statistic p-value* Coefficient t-statistic p-value*
Constant 2.5415 1.7109 0.0871 2.3416 1.5120 0.1305 1.7849 2.0421 0.0411
IPO -0.5653 -0.8049 0.4209 -2.2167 -2.2954 0.0217 -1.1766 -2.4555 0.0141
Secondary Sale -0.0745 -0.0767 0.9389 -2.5584 -2.1063 0.0352 -1.0788 -1.7274 0.0841
Buyback -3.2569 -2.4566 0.0140 -0.4808 -0.5334 0.5938 -0.8364 -1.5009 0.1334
Write-off 1.5403 1.6986 0.0894 0.5694 0.4243 0.6714 1.1194 1.5491 0.1214
Technology -1.4559 -2.1294 0.0332 0.3345 0.4744 0.6352 -0.6341 -1.5760 0.1150
Duration -0.0542 -0.4343 0.6641 -0.0973 -1.2427 0.2140 -0.0851 -1.6360 0.1018
Market/Book 0.0514 0.7094 0.4781 -0.1694 -1.7701 0.0767 -0.0283 -0.5932 0.5530
Seed 0.5762 0.4564 0.6481 1.4040 0.8697 0.3844 0.9533 1.1733 0.2407
Start-up 1.7609 1.2686 0.2046 0.3771 0.3286 0.7425 1.4116 1.8354 0.0664
Early Stage 2.1683 1.5422 0.1230 -0.5629 -0.4531 0.6505 1.0899 1.3588 0.1742
Expansion 0.1150 0.0941 0.9250 0.4802 0.4262 0.6700 0.7645 1.0686 0.2852
Fundraising -0.0003 -1.2266 0.2200 0.0003 0.3842 0.7008 -0.0001 -0.9457 0.3443
* Two-sided test.
Table 4. Logit Estimates of the Extent of Exits in Canada and the United States
United States Canada Full Sample Estimates

43
Coefficient t-statistic p-value* Coefficient t-statistic p-value* Coefficient t-statistic p-value*
Constant -1.7464 -0.6011 0.5478 3.8845 1.4746 0.1403 -0.9414 -0.6502 0.5155
Technology -1.3741 -0.7716 0.4404 -1.0835 -0.6401 0.5221 -0.2668 -0.3236 0.7463
Duration 0.0232 0.1079 0.9141 0.0507 0.2950 0.7680 -0.0646 -0.6511 0.5150
Market/Book 0.1686 1.1524 0.2492 -0.5356 -2.3978 0.0165 -0.0269 -0.4409 0.6593
Seed -1.0031 -0.6911 0.4895 8.4458 1.8914 0.0586 0.2351 0.2283 0.8194
Start-up 0.9551 0.5821 0.5605 0.1227 0.1052 0.9162 0.7264 0.9571 0.3385
Early Stage 2.8746 1.4570 0.1451 -1.9273 -1.4485 0.1475 0.2104 0.2799 0.7795
Fundraising 0.00002 0.0255 0.9796 -0.0003 -0.1914 0.8482 0.0004 1.4318 0.1522
Market Conditions 4.3553 1.9961 0.0459 -1.3877 -0.8020 0.4225 1.1070 1.0651 0.2868
Preplanned Exit 1.9696 1.2263 0.2201 -0.6243 -0.3426 0.7319 1.1470 1.2025 0.2292
Coefficient t-statistic p-value* Coefficient t-statistic p-value* Coefficient t-statistic p-value*
Constant 16.3158 2.0161 0.0438 3.9083 1.3993 0.1617 3.9789 2.9397 0.0033
Technology -5.7817 -1.7299 0.0836 N/A** N/A** N/A** -0.4488 -0.4577 0.6471
Duration -1.7639 -1.9076 0.0564 -0.1461 -0.6908 0.4897 -0.2197 -1.6636 0.0962
Market/Book -0.6524 -1.8228 0.0683 -0.0783 -0.1057 0.9158 -0.2134 -1.5004 0.1335
Market Conditions -1.8654 -0.9307 0.3520 N/A** N/A** N/A** -1.1553 -1.0449 0.2961
* Two-sided test.** Not Applicable. Variable excluded to avoid collinearity problems. Similarly, variables not shown were excluded to avoid collinearity problems.
Table 5b. Logit Estimates of the Likelihood of Cash Consideration in Venture Capital Acquisition Exits in Canada and the United States
United States Canada Full Sample Estimates
Table 5a. Logit Estimates of the Extent of Venture Capital IPO Exits in Canada and the United States
United States Canada Full Sample Estimates

44
Coefficient t-statistic p-value* Coefficient t-statistic p-value* Coefficient t-statistic p-value*
Constant 8.7239 0.8487 0.3960 -0.2319 -0.2139 0.8306 3.4863 1.4486 0.1474
Duration 0.1528 0.4005 0.6888 0.5147 1.0835 0.2786 0.2716 0.9795 0.3273
Market/Book -4.5011 -0.7136 0.4755 -0.1801 -0.6207 0.5348 -0.4544 -1.7349 0.0828
Fundraising -0.0014 -0.8524 0.3940 N/A** N/A** N/A** -0.0010 -1.2967 0.1947
Market Conditions -3.2965 -0.6533 0.5136 N/A** N/A** N/A** -1.7177 -1.0815 0.2795
Coefficient t-statistic p-value* Coefficient t-statistic p-value* Coefficient t-statistic p-value*
Constant -4.1615 -0.8387 0.4017 3.3246 1.8021 0.0715 4.9667 2.9692 0.0030
Technology N/A** N/A** N/A** -0.4461 -0.4109 0.6812 -0.0239 -0.0241 0.9808
Duration -1.0598 -0.4219 0.6731 -0.2537 -1.9289 0.0537 -0.2151 -1.8143 0.0696
Market/Book 1.7273 0.5900 0.5552 -0.0703 -0.3117 0.7552 -0.0309 -0.1558 0.8762
Fundraising N/A** N/A** N/A** 0.0017 1.2522 0.2105 -0.0014 -2.1257 0.0335
Preplanned N/A** N/A** N/A** -2.3292 -1.4464 0.1481 -1.9042 -1.3994 0.1617
Unsolicited Offer N/A** N/A** N/A** -1.0873 -0.7297 0.4656 -0.4738 -0.3403 0.7336
Coefficient t-statistic p-value* Coefficient t-statistic p-value* Coefficient t-statistic p-value*
Constant 3.7177 2.0021 0.0453 5.9173 2.1892 0.0286 4.5620 3.3746 0.0007
Duration -0.2676 -0.7603 0.4471 -0.5285 -1.5436 0.1227 -0.4225 -1.7465 0.0807
Market Conditions 0.1290 0.0875 0.9303 N/A** N/A** N/A** 0.5814 0.4075 0.6836
* Two-sided test.** Not Applicable. Variable excluded to avoid collinearity problems. Similarly, variables not shown were excluded to avoid collinearity problems.
Table 5c. Logit Estimates of the Extent of Venture Capital Secondary Sale Exits in Canada and the United States
United States Canada Full Sample Estimates
Table 5d. Logit Estimates of the Extent of Venture Capital Buyback Exits in Canada and the United States
United States Canada Full Sample Estimates
Table 5e. Logit Estimates of the Likelihood of Venture Capital Write-offs versus Write-downs in Canada and the United States
United States Canada Full Sample Estimates