The CUPID (Cultural and Psychosocial Influences onDisability) Study: Methods of Data Collection andCharacteristics of Study SampleDavid Coggon1*, Georgia Ntani1, Keith T. Palmer1, Vanda E. Felli2, Raul Harari3, Lope H. Barrero4,
Sarah A. Felknor5,6, David Gimeno5, Anna Cattrell7, Consol Serra8,9,10, Matteo Bonzini11, Eleni Solidaki12,
Eda Merisalu13, Rima R. Habib14, Farideh Sadeghian15, Masood Kadir16, Sudath S. P. Warnakulasuriya17,
Ko Matsudaira18, Busisiwe Nyantumbu19,20, Malcolm R Sim21, Helen Harcombe22, Ken Cox1,
Maria H. Marziale23, Leila M. Sarquis24, Florencia Harari3, Rocio Freire3, Natalia Harari3,
Magda V. Monroy4, Leonardo A. Quintana4, Marianela Rojas25, Eduardo J. Salazar Vega5, E. Clare Harris1,
Sergio Vargas-Prada8, J. Miguel Martinez8,9, George Delclos5,8,9, Fernando G. Benavides8,9,
Michele Carugno26, Marco M. Ferrario11, Angela C. Pesatori26,27, Leda Chatzi12, Panos Bitsios28,
Manolis Kogevinas29,30,31,32, Kristel Oha33, Tuuli Sirk34, Ali Sadeghian35, Roshini J. Peiris-John36,37,
Nalini Sathiakumar38, A. Rajitha Wickremasinghe39, Noriko Yoshimura40, Danuta Kielkowski19,20,
Helen L. Kelsall21, Victor C. W. Hoe21,41, Donna M. Urquhart21, Sarah Derett42, David McBride22,
Andrew Gray22
1 Medical Research Council Lifecourse Epidemiology Unit, University of Southampton, Southampton, UK, 2 School of Nursing, University of Sao Paulo, Sao Paulo, Brazil,
3 Corporacion para el Desarrollo de la Produccion y el Medio Ambiente Laboral – IFA (Institute for the Development of Production and the Work Environment), Quito,
Ecuador, 4 School of Engineering, Pontificia Universidad Javeriana, Bogota, Colombia, 5 Southwest Center for Occupational and Environmental Health, The University of
Texas Health Science Center at Houston School of Public Health, Houston, Texas, United States of America, 6 Center for Disease Control and Prevention/National Institute
for Occupational Safety and Health, Atlanta, Georgia, United States of America, 7 Medical Research Council Social, Genetic and Developmental Psychiatry Centre, Institute
of Psychiatry, Kings College, London, UK, 8 Center for Research in Occupational Health (CiSAL), Pompeu Fabra University, Barcelona, Spain, 9 Carlos III Health Institute:
Biomedical Research Networking Center of Epidemiology and Public Health, Granada, Spain, 10 Occupational Health Department, Parc de Salut MAR, Barcelona, Spain,
11 Epidemiology and Preventive Medicine Research Center, University of Insubria, Varese, Italy, 12 Department of Social Medicine, Medical School, University of Crete,
Heraklion, Greece, 13 Department of Public health, University of Tartu, Tartu, Estonia, 14 Department of Environmental Health, Faculty of Health Sciences, American
University of Beirut, Beirut, Lebanon, 15 Department of Occupational Health, Faculty of Health, Shahroud University of Medical Sciences, Shahroud, Iran, 16 Department of
Community Health Sciences, Aga Khan University, Karachi, Pakistan, 17 Department of Medical Education and Health Sciences, Faculty of Medical Sciences, University of
Sri Jayewardenepura, Gangodawila, Nugegoda, Sri Lanka, 18 Clinical Research Centre for Occupational Musculoskeletal Disorders, Kanto Rosai Hospital, Kawasaki, Japan,
19 National Institute for Occupational Health, National Health Laboratory Service, Johannesburg, South Africa, 20 Faculty of Health Sciences, University of Witwatersrand,
Johannesburg, South Africa, 21 Department of Epidemiology and Preventive Medicine, School of Public Health and Preventive Medicine, Monash University, Melbourne,
Victoria, Australia, 22 Department of Preventive and Social Medicine, University of Otago, Dunedin, New Zealand, 23 School of Nursing of Ribeirao Preto, University of Sao
Paulo, Sao Paulo, Brazil, 24 Federal University of Parana, Curitiba-PR, Brazil, 25 Institute for Studies on Toxic Substances (IRET), National University of Costa Rica, Heredia,
Costa Rica, 26 Department of Occupational and Environmental Health, Universita degli Studi di Milano, Milan, Italy, 27 Fondazione Ca’ Granda Ospedale Maggiore
Policlinico, Milan, Italy, 28 Department of Psychiatry, Medical School, University of Crete, Heraklion, Greece, 29 Centre for Research in Environmental Epidemiology
(CREAL), Barcelona, Spain, 30 IMIM (Hospital del Mar Research Institute), Barcelona, Spain, 31 Consorcio de Investigacion Biomedica de Epidemiologıa y Salud Publica
(CIBERESP), Barcelona, Spain, 32 National School of Public Health, Athens, Greece, 33 North Estonia Medical Centre, Tallinn, Estonia, 34 Polva Hospital, Polva, Estonia,
35 Klinikum Leverkusen, Leverkusen, Germany, 36 Department of Physiology, Faculty of Medical Sciences, University of Sri Jayewardenepura, Gangodawila, Nugegoda, Sri
Lanka, 37 Section of Epidemiology and Biostatistics, School of Population Health, Faculty of Medical and Health Sciences, University of Auckland, Auckland, New Zealand,
38 Department of Epidemiology, School of Public Health, University of Alabama at Birmingham, Birmingham, Alabama, United States of America, 39 Faculty of Medicine,
University of Kalaniya, Kelaniya, Sri Lanka, 40 Department of Joint Disease Research, University of Tokyo, Tokyo, Japan, 41 Centre for Occupational and Environmental
Health, Department of Social and Preventive Medicine, Faculty of Medicine, University of Malaya, Kuala Lumpur, Malaysia, 42 Injury Prevention Research Unit, Department
of Preventive and Social Medicine, University of Otago, Dunedin, New Zealand
PLoS ONE | www.plosone.org 1 July 2012 | Volume 7 | Issue 7 | e39820
Abstract
Background: The CUPID (Cultural and Psychosocial Influences on Disability) study was established to explore the hypothesisthat common musculoskeletal disorders (MSDs) and associated disability are importantly influenced by culturallydetermined health beliefs and expectations. This paper describes the methods of data collection and various characteristicsof the study sample.
Methods/Principal Findings: A standardised questionnaire covering musculoskeletal symptoms, disability and potential riskfactors, was used to collect information from 47 samples of nurses, office workers, and other (mostly manual) workers in 18countries from six continents. In addition, local investigators provided data on economic aspects of employment for eachoccupational group. Participation exceeded 80% in 33 of the 47 occupational groups, and after pre-specified exclusions,analysis was based on 12,426 subjects (92 to 1018 per occupational group). As expected, there was high usage of computerkeyboards by office workers, while nurses had the highest prevalence of heavy manual lifting in all but one country. Therewas substantial heterogeneity between occupational groups in economic and psychosocial aspects of work; three- to five-fold variation in awareness of someone outside work with musculoskeletal pain; and more than ten-fold variation in theprevalence of adverse health beliefs about back and arm pain, and in awareness of terms such as ‘‘repetitive strain injury’’(RSI).
Conclusions/Significance: The large differences in psychosocial risk factors (including knowledge and beliefs about MSDs)between occupational groups should allow the study hypothesis to be addressed effectively.
Citation: Coggon D, Ntani G, Palmer KT, Felli VE, Harari R, et al. (2012) The CUPID (Cultural and Psychosocial Influences on Disability) Study: Methods of DataCollection and Characteristics of Study Sample. PLoS ONE 7(7): e39820. doi:10.1371/journal.pone.0039820
Editor: Antony Bayer, Cardiff University, United Kingdom
Received April 10, 2012; Accepted May 28, 2012; Published July 6, 2012
Copyright: � 2012 Coggon et al. This is an open-access article distributed under the terms of the Creative Commons Attribution License, which permitsunrestricted use, distribution, and reproduction in any medium, provided the original author and source are credited.
Funding: Funding for the central coordination of the CUPID study was provided by the UK Medical Research Council (www.mrc.ac.uk). In addition, support fordata collection in individual countries was obtained from the following sources: Brazil: Colt Foundation (www.coltfoundation.org.uk) (CF/03/05). Ecuador: ColtFoundation (www.coltfoundation.org.uk) (CF/03/05). Colombia: United States National Institutes of Health (NIH) (www.grants.nih.gov) Grant 5D43 TW00 0644-13,sub-award 0005919H; NIH Grant 5D43 TW00 0644-15, sub-award 0005919J; and Pontificia Universidad Javeriana (www.javeriana.edu.co). Costa Rica: ColtFoundation (www.coltfoundation.org.uk) (CF/03/05). Nicaragua: Colt Foundation (www.coltfoundation.org.uk) (CF/03/05). UK: Colt Foundation (www.coltfoundation.org.uk) (CF/03/05). Spain: Spanish Health Research Fund (www.imia.medinfo.org) (FIS 070422), and Epidemiology and Public Health CIBER.Carlos III Institute of Health. Ministry of Science and Innovation. Italy: Department of Experimental Medicine, University of Insubria (www.unisubria.eu), Varese,Italy. Greece: Colt Foundation (www.coltfoundation.org.uk) (CF/03/05). Estonia: Colt Foundation (www.coltfoundation.org.uk) (CF/03/05). Lebanon: ColtFoundation (www.coltfoundation.org.uk) (CF/03/05). Iran: Deputy for Training and Research, Shahroud University of Medical Sciences (www.shmu.ac.ir). Pakistan:Colt Foundation (www.coltfoundation.org.uk) (CF/03/05). Sri Lanka: International Training and Research in Environmental and Occupational Health (ITREOH)Program of the University of Alabama at Birmingham (Grant number 5 D43 TWO5750 from the National Institutes of Health and the Fogarty International Center(NIH-FIC)) (www.fic.nih.gov/Programs/Pages/environmental-occupational-health.aspx). Japan: University of Tokyo (www.u-tokyo.ac.up/en/. South Africa: ColtFoundation (www.coltfoundation.org.uk) (CF/03/05). Australia: Monash University Strategic Grant Scheme and Monash University Near Miss Grant for NHMRCprojects in 2008 (www.monash.edu.au). HLK and DMU were supported by Fellowships from NHMRC, and VCWH by the Ministry of Higher Education in Malaysia.New Zealand: Health Research Council of New Zealand (International Investment Opportunity Fund Grant) (www.hrc.govt.nz). The funders had no role in studydesign, data collection and analysis, decision to publish, or preparation of the manuscript.
Competing Interests: The authors have declared that no competing interests exist.
* E-mail: [email protected]
Introduction
Musculoskeletal disorders of the back, neck and upper limb are
a major cause of morbidity and disability with substantial
economic impact, especially in western countries. In some cases
symptoms arise from identifiable pathology in the spine or arm
(e.g. a herniated inter-vertebral disc or peripheral nerve compres-
sion in the carpal tunnel). Most often, however, the underlying
pathology is unclear, and the symptoms are classed as ‘‘non-
specific’’.
Epidemiological research has linked the occurrence of back,
neck and upper limb disorders with various physical activities in
the workplace [1–4], and also with psycho-social risk factors such
as low mood and job dissatisfaction [5–8]. More recently, evidence
has accumulated for a causal role also of ‘‘somatising tendency’’
(i.e. a general tendency to report and worry about common
somatic symptoms) [6,9]. Together, however, these established risk
factors do not adequately explain striking temporal changes that
have been observed in disability attributed to common musculo-
skeletal complaints. For example, in Britain rates of incapacity for
work because of back problems increased more than sevenfold
between 1953 and 1992 at a time when the physical demands of
work were generally reducing [10]; and in Australia there was a
major epidemic of disability from arm pain during the early 1980s
which was not paralleled in other countries where similar
technologies and working methods were employed [11].
This gap in understanding has prompted the hypothesis that the
development and persistence of non-specific musculoskeletal
complaints and resultant disability are importantly influenced by
culturally-determined health beliefs as well as by physical activities
and mental health [12]. Several observations provide support for a
role of health beliefs. For example, among 178 workers carrying
out repetitive tasks on an assembly line in Mumbai, India, only
one of whom had ever heard of ‘‘RSI’’ (repetitive strain injury), the
12 month prevalence of disabling arm pain (5%) was less than one
fifth of that found using the same questions among manual
workers in the UK (including those who were of Indian sub-
continental origin) [13]. In longitudinal studies of individuals with
back and arm pain, negative beliefs about prognosis have proved
predictive of their persistence [7,14]. And in Victoria, Australia, a
CUPID Study: Methods & Description of Study Sample
PLoS ONE | www.plosone.org 2 July 2012 | Volume 7 | Issue 7 | e39820
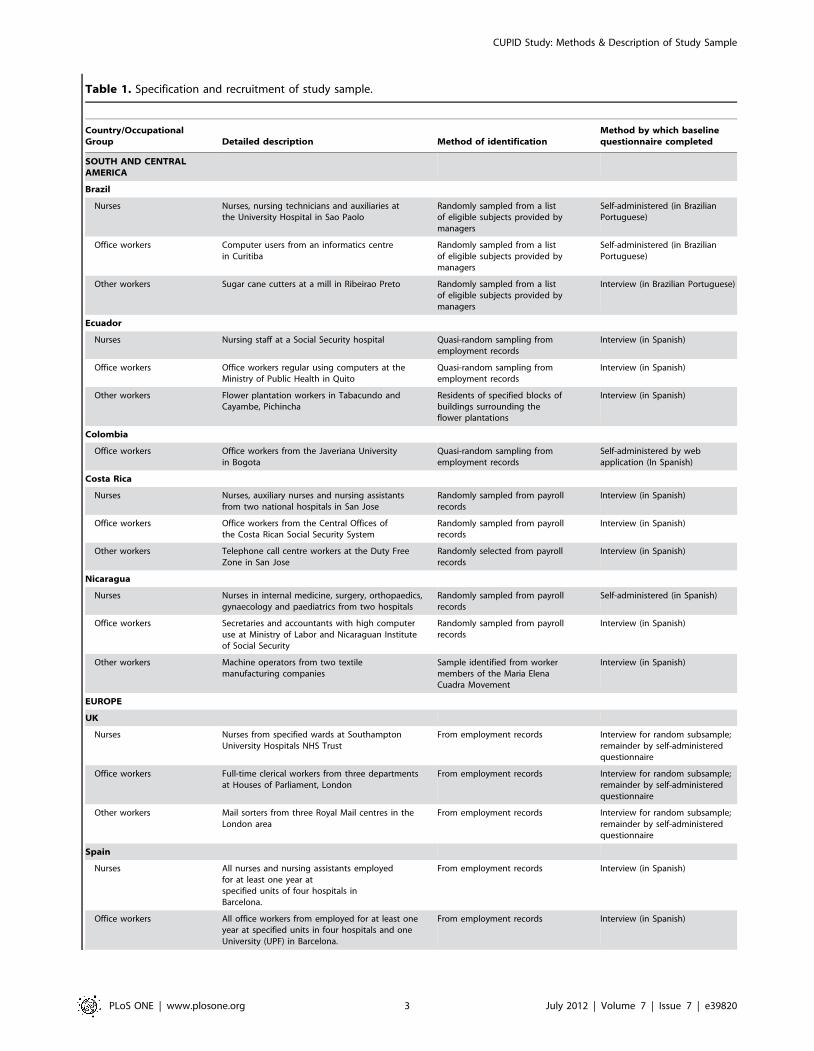
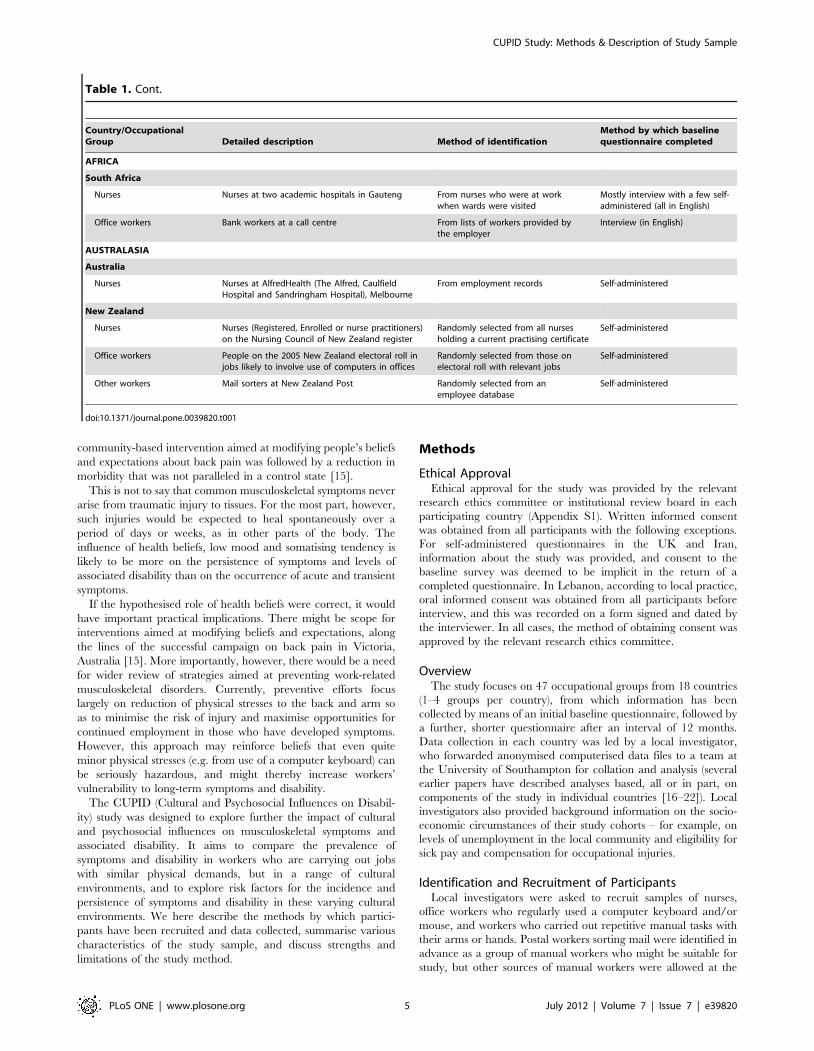
Table 1. Specification and recruitment of study sample.
Country/OccupationalGroup Detailed description Method of identification
Method by which baselinequestionnaire completed
SOUTH AND CENTRALAMERICA
Brazil
Nurses Nurses, nursing technicians and auxiliaries atthe University Hospital in Sao Paolo
Randomly sampled from a listof eligible subjects provided bymanagers
Self-administered (in BrazilianPortuguese)
Office workers Computer users from an informatics centrein Curitiba
Randomly sampled from a listof eligible subjects provided bymanagers
Self-administered (in BrazilianPortuguese)
Other workers Sugar cane cutters at a mill in Ribeirao Preto Randomly sampled from a listof eligible subjects provided bymanagers
Interview (in Brazilian Portuguese)
Ecuador
Nurses Nursing staff at a Social Security hospital Quasi-random sampling fromemployment records
Interview (in Spanish)
Office workers Office workers regular using computers at theMinistry of Public Health in Quito
Quasi-random sampling fromemployment records
Interview (in Spanish)
Other workers Flower plantation workers in Tabacundo andCayambe, Pichincha
Residents of specified blocks ofbuildings surrounding theflower plantations
Interview (in Spanish)
Colombia
Office workers Office workers from the Javeriana Universityin Bogota
Quasi-random sampling fromemployment records
Self-administered by webapplication (In Spanish)
Costa Rica
Nurses Nurses, auxiliary nurses and nursing assistantsfrom two national hospitals in San Jose
Randomly sampled from payrollrecords
Interview (in Spanish)
Office workers Office workers from the Central Offices ofthe Costa Rican Social Security System
Randomly sampled from payrollrecords
Interview (in Spanish)
Other workers Telephone call centre workers at the Duty FreeZone in San Jose
Randomly selected from payrollrecords
Interview (in Spanish)
Nicaragua
Nurses Nurses in internal medicine, surgery, orthopaedics,gynaecology and paediatrics from two hospitals
Randomly sampled from payrollrecords
Self-administered (in Spanish)
Office workers Secretaries and accountants with high computeruse at Ministry of Labor and Nicaraguan Instituteof Social Security
Randomly sampled from payrollrecords
Interview (in Spanish)
Other workers Machine operators from two textilemanufacturing companies
Sample identified from workermembers of the Maria ElenaCuadra Movement
Interview (in Spanish)
EUROPE
UK
Nurses Nurses from specified wards at SouthamptonUniversity Hospitals NHS Trust
From employment records Interview for random subsample;remainder by self-administeredquestionnaire
Office workers Full-time clerical workers from three departmentsat Houses of Parliament, London
From employment records Interview for random subsample;remainder by self-administeredquestionnaire
Other workers Mail sorters from three Royal Mail centres in theLondon area
From employment records Interview for random subsample;remainder by self-administeredquestionnaire
Spain
Nurses All nurses and nursing assistants employedfor at least one year atspecified units of four hospitals inBarcelona.
From employment records Interview (in Spanish)
Office workers All office workers from employed for at least oneyear at specified units in four hospitals and oneUniversity (UPF) in Barcelona.
From employment records Interview (in Spanish)
CUPID Study: Methods & Description of Study Sample
PLoS ONE | www.plosone.org 3 July 2012 | Volume 7 | Issue 7 | e39820
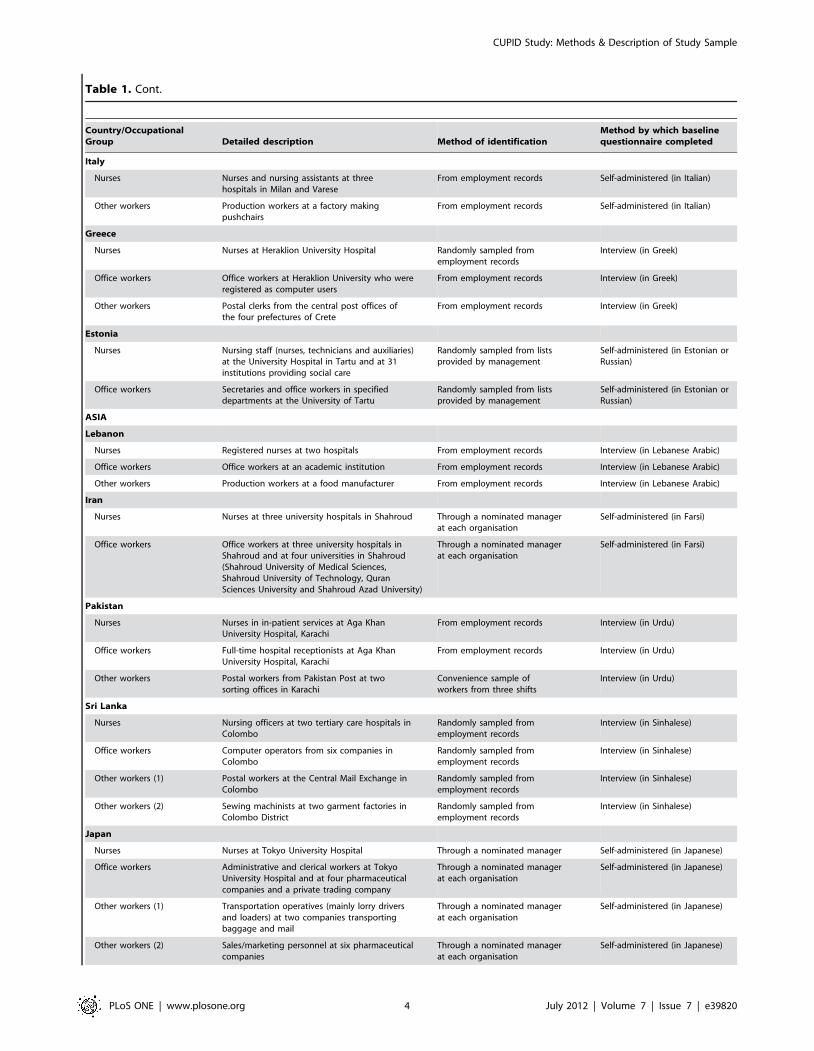
Table 1. Cont.
Country/OccupationalGroup Detailed description Method of identification
Method by which baselinequestionnaire completed
Italy
Nurses Nurses and nursing assistants at threehospitals in Milan and Varese
From employment records Self-administered (in Italian)
Other workers Production workers at a factory makingpushchairs
From employment records Self-administered (in Italian)
Greece
Nurses Nurses at Heraklion University Hospital Randomly sampled fromemployment records
Interview (in Greek)
Office workers Office workers at Heraklion University who wereregistered as computer users
From employment records Interview (in Greek)
Other workers Postal clerks from the central post offices ofthe four prefectures of Crete
From employment records Interview (in Greek)
Estonia
Nurses Nursing staff (nurses, technicians and auxiliaries)at the University Hospital in Tartu and at 31institutions providing social care
Randomly sampled from listsprovided by management
Self-administered (in Estonian orRussian)
Office workers Secretaries and office workers in specifieddepartments at the University of Tartu
Randomly sampled from listsprovided by management
Self-administered (in Estonian orRussian)
ASIA
Lebanon
Nurses Registered nurses at two hospitals From employment records Interview (in Lebanese Arabic)
Office workers Office workers at an academic institution From employment records Interview (in Lebanese Arabic)
Other workers Production workers at a food manufacturer From employment records Interview (in Lebanese Arabic)
Iran
Nurses Nurses at three university hospitals in Shahroud Through a nominated managerat each organisation
Self-administered (in Farsi)
Office workers Office workers at three university hospitals inShahroud and at four universities in Shahroud(Shahroud University of Medical Sciences,Shahroud University of Technology, QuranSciences University and Shahroud Azad University)
Through a nominated managerat each organisation
Self-administered (in Farsi)
Pakistan
Nurses Nurses in in-patient services at Aga KhanUniversity Hospital, Karachi
From employment records Interview (in Urdu)
Office workers Full-time hospital receptionists at Aga KhanUniversity Hospital, Karachi
From employment records Interview (in Urdu)
Other workers Postal workers from Pakistan Post at twosorting offices in Karachi
Convenience sample ofworkers from three shifts
Interview (in Urdu)
Sri Lanka
Nurses Nursing officers at two tertiary care hospitals inColombo
Randomly sampled fromemployment records
Interview (in Sinhalese)
Office workers Computer operators from six companies inColombo
Randomly sampled fromemployment records
Interview (in Sinhalese)
Other workers (1) Postal workers at the Central Mail Exchange inColombo
Randomly sampled fromemployment records
Interview (in Sinhalese)
Other workers (2) Sewing machinists at two garment factories inColombo District
Randomly sampled fromemployment records
Interview (in Sinhalese)
Japan
Nurses Nurses at Tokyo University Hospital Through a nominated manager Self-administered (in Japanese)
Office workers Administrative and clerical workers at TokyoUniversity Hospital and at four pharmaceuticalcompanies and a private trading company
Through a nominated managerat each organisation
Self-administered (in Japanese)
Other workers (1) Transportation operatives (mainly lorry driversand loaders) at two companies transportingbaggage and mail
Through a nominated managerat each organisation
Self-administered (in Japanese)
Other workers (2) Sales/marketing personnel at six pharmaceuticalcompanies
Through a nominated managerat each organisation
Self-administered (in Japanese)
CUPID Study: Methods & Description of Study Sample
PLoS ONE | www.plosone.org 4 July 2012 | Volume 7 | Issue 7 | e39820
community-based intervention aimed at modifying people’s beliefs
and expectations about back pain was followed by a reduction in
morbidity that was not paralleled in a control state [15].
This is not to say that common musculoskeletal symptoms never
arise from traumatic injury to tissues. For the most part, however,
such injuries would be expected to heal spontaneously over a
period of days or weeks, as in other parts of the body. The
influence of health beliefs, low mood and somatising tendency is
likely to be more on the persistence of symptoms and levels of
associated disability than on the occurrence of acute and transient
symptoms.
If the hypothesised role of health beliefs were correct, it would
have important practical implications. There might be scope for
interventions aimed at modifying beliefs and expectations, along
the lines of the successful campaign on back pain in Victoria,
Australia [15]. More importantly, however, there would be a need
for wider review of strategies aimed at preventing work-related
musculoskeletal disorders. Currently, preventive efforts focus
largely on reduction of physical stresses to the back and arm so
as to minimise the risk of injury and maximise opportunities for
continued employment in those who have developed symptoms.
However, this approach may reinforce beliefs that even quite
minor physical stresses (e.g. from use of a computer keyboard) can
be seriously hazardous, and might thereby increase workers’
vulnerability to long-term symptoms and disability.
The CUPID (Cultural and Psychosocial Influences on Disabil-
ity) study was designed to explore further the impact of cultural
and psychosocial influences on musculoskeletal symptoms and
associated disability. It aims to compare the prevalence of
symptoms and disability in workers who are carrying out jobs
with similar physical demands, but in a range of cultural
environments, and to explore risk factors for the incidence and
persistence of symptoms and disability in these varying cultural
environments. We here describe the methods by which partici-
pants have been recruited and data collected, summarise various
characteristics of the study sample, and discuss strengths and
limitations of the study method.
Methods
Ethical ApprovalEthical approval for the study was provided by the relevant
research ethics committee or institutional review board in each
participating country (Appendix S1). Written informed consent
was obtained from all participants with the following exceptions.
For self-administered questionnaires in the UK and Iran,
information about the study was provided, and consent to the
baseline survey was deemed to be implicit in the return of a
completed questionnaire. In Lebanon, according to local practice,
oral informed consent was obtained from all participants before
interview, and this was recorded on a form signed and dated by
the interviewer. In all cases, the method of obtaining consent was
approved by the relevant research ethics committee.
OverviewThe study focuses on 47 occupational groups from 18 countries
(1–4 groups per country), from which information has been
collected by means of an initial baseline questionnaire, followed by
a further, shorter questionnaire after an interval of 12 months.
Data collection in each country was led by a local investigator,
who forwarded anonymised computerised data files to a team at
the University of Southampton for collation and analysis (several
earlier papers have described analyses based, all or in part, on
components of the study in individual countries [16–22]). Local
investigators also provided background information on the socio-
economic circumstances of their study cohorts – for example, on
levels of unemployment in the local community and eligibility for
sick pay and compensation for occupational injuries.
Identification and Recruitment of ParticipantsLocal investigators were asked to recruit samples of nurses,
office workers who regularly used a computer keyboard and/or
mouse, and workers who carried out repetitive manual tasks with
their arms or hands. Postal workers sorting mail were identified in
advance as a group of manual workers who might be suitable for
study, but other sources of manual workers were allowed at the
Table 1. Cont.
Country/OccupationalGroup Detailed description Method of identification
Method by which baselinequestionnaire completed
AFRICA
South Africa
Nurses Nurses at two academic hospitals in Gauteng From nurses who were at workwhen wards were visited
Mostly interview with a few self-administered (all in English)
Office workers Bank workers at a call centre From lists of workers provided bythe employer
Interview (in English)
AUSTRALASIA
Australia
Nurses Nurses at AlfredHealth (The Alfred, CaulfieldHospital and Sandringham Hospital), Melbourne
From employment records Self-administered
New Zealand
Nurses Nurses (Registered, Enrolled or nurse practitioners)on the Nursing Council of New Zealand register
Randomly selected from all nursesholding a current practising certificate
Self-administered
Office workers People on the 2005 New Zealand electoral roll injobs likely to involve use of computers in offices
Randomly selected from those onelectoral roll with relevant jobs
Self-administered
Other workers Mail sorters at New Zealand Post Randomly selected from anemployee database
Self-administered
doi:10.1371/journal.pone.0039820.t001
CUPID Study: Methods & Description of Study Sample
PLoS ONE | www.plosone.org 5 July 2012 | Volume 7 | Issue 7 | e39820

Table 2. Response to baseline questionnaire.
Country/OccupationalGroup
Number of subjectsapproached
Number (%)participated
Number of respondersexcluded
Number ofsubjects analysed
Brazil
Nurses 200 192 (96%) 7 185
Office workers 300 292 (97%) 11 281
Other workers 300 182 (61%) 89 93
Ecuador
Nurses 252 250 (99%) 31 219
Office workers 250 250 (100%) 7 243
Other workers 282 279 (99%) 52 227
Colombia
Office workers 114 102 (89%) 10 92
Costa Rica
Nurses 275 249 (91%) 29 220
Office workers 275 249 (91%) 26 223
Other workers 252 237 (94%) 32 205
Nicaragua
Nurses 300 300 (100%) 18 282
Office workers 300 300 (100%) 15 285
Other workers 300 300 (100%) 103 197
UK
Nurses 690 290 (42%) 33 257
Office workers 1051 476 (45%) 96 380
Other workers 1569 442 (28%) 56 386
Spain
Nurses 716 687 (96%) 20 667
Office workers 483 471 (98%) 33 438
Italy
Nurses 766 585 (76%) 49 536
Other workers 290 151 (52%) 12 139
Greece
Nurses 240 224 (93%) 0 224
Office workers 202 200 (99%) 1 199
Other workers 154 140 (91%) 0 140
Estonia
Nurses 876 423 (48%) 52 371
Office workers 415 220 (53%) 18 202
Lebanon
Nurses 193 186 (96%) 2 184
Office workers 220 190 (86%) 18 172
Other workers 172 168 (98%) 31 137
Iran
Nurses 263 248 (94%) 2 246
Office workers 213 187 (88%) 5 182
Pakistan
Nurses 250 235 (94%) 48 187
Office workers 216 216 (100%) 36 180
Other workers 235 225 (96%) 3 222
Sri Lanka
Nurses 250 237 (95%) 1 236
Office workers 250 157 (63%) 5 152
CUPID Study: Methods & Description of Study Sample
PLoS ONE | www.plosone.org 6 July 2012 | Volume 7 | Issue 7 | e39820
discretion of the local investigator. In one country (Japan), a group
of sales and marketing workers was also recruited, and in the
presentation and discussion of results, three main categories of
occupation are distinguished – nurses, office workers, and ‘‘other
workers’’, the last including the sales and marketing group as well
as various manual occupations.
The aim was to restrict the international analysis to workers
aged 20–59 years, who had been in their current job for at least 12
months. However, local investigators were free to recruit and carry
out local analyses without these restrictions. Initial power
calculations indicated that a sample size of 200 workers per
occupational group would be more than adequate to detect
differences between countries in the prevalence of symptoms and
disability of the magnitude that was anticipated, and also for
analysis of important risk factors for the incidence and persistence
of pain at different anatomical sites in the longitudinal follow-up.
Table 1 describes the occupational groups that were selected for
study, and the methods by which participants were identified and
the baseline questionnaire administered. In most cases, potentially
eligible subjects were identified from employers’ records, some-
times with random sampling to achieve the desired sample size.
Some occupational groups provided information at interview, and
others by self-completion of questionnaires. In one country (UK),
most questionnaires were self-completed, but random sub-samples
of each occupational group were instead interviewed.
At the time of answering the baseline questionnaire, participants
were asked whether they were willing to be re-contacted in the
future, and those who agreed were asked (or will be asked) to
complete a follow-up questionnaire after an interval of 12 months.
In most cases, subjects have been followed up through their place
of work, but where this was not possible (e.g. because they had left
their original employer), they have been contacted at their home
address. In each occupational group, follow-up questionnaires
have been completed by the same method (interview or self-
administration) as the baseline questionnaire.
QuestionnairesThe baseline questionnaire (Appendix S2) asked about demo-
graphic characteristics; education; height; smoking habits; current
occupation; pain in different anatomical regions and associated
disability for tasks of daily living; awareness of others with
musculoskeletal pain; fear-avoidance beliefs concerning upper
limb and low back pain; awareness of repetitive strain injury (RSI)
or similar terms; distress from common somatic symptoms; mental
health; and sickness absence in the past 12 months because of
musculoskeletal problems and other types of illness.
The questions about current occupation covered working hours,
whether the job involved each of a specified list of physical tasks,
and psychosocial aspects of employment such as time pressures
and targets, control over work organisation, support, satisfaction
and job security. The questions about pain and disability focused
on six anatomical regions (low back, neck, shoulder, elbow, wrist/
hand and knee) delineated in diagrams, and were similar in
wording to questions that had been used successfully in earlier
studies, both by self-administration [9,23,24] and at interview
[13]. The questions on fear-avoidance beliefs were adapted from
the Fear Avoidance Beliefs Questionnaire [25]. Questions about
distress from somatic symptoms were taken from the Brief
Symptom Inventory (BSI) [26], and were chosen to provide a
measure of the subject’s tendency to somatise. Questions on
mental health were taken from the Short Form-36 (SF-36)
questionnaire [27].
The follow-up questionnaire (Appendix S3) asked about: any
change of job since baseline and the reasons; recent pain in
different anatomical regions and associated disability for tasks of
daily living; distress from common somatic symptoms; mental
health; and sickness absence in the past 12 months for
musculoskeletal and other reasons. Where possible, the wording
of questions was identical to that used in the baseline question-
naire.
Table 2. Cont.
Country/OccupationalGroup
Number of subjectsapproached
Number (%)participated
Number of respondersexcluded
Number ofsubjects analysed
Other workers (1) 250 250 (100%) 0 250
Other workers (2) 250 214 (86%) 63 151
Japan
Nurses 1074 814 (76%) 222 592
Office workers 425 346 (81%) 36 310
Other workers (1) 1308 1119 (86%) 101 1018
Other workers (2) 380 372 (98%) 17 355
South Africa
Nurses 280 252 (90%) 5 247
Office workers 285 236 (83%) 7 229
Australia
Nurses 2878 1119 (39%) 869 (excluded because only arandom subset of participantswas analysed)
250
New Zealand
Nurses 260 181 (70%) 4 177
Office workers 280 146 (52%) 1 145
Other workers 230 116 (50%) 3 113
doi:10.1371/journal.pone.0039820.t002
CUPID Study: Methods & Description of Study Sample
PLoS ONE | www.plosone.org 7 July 2012 | Volume 7 | Issue 7 | e39820
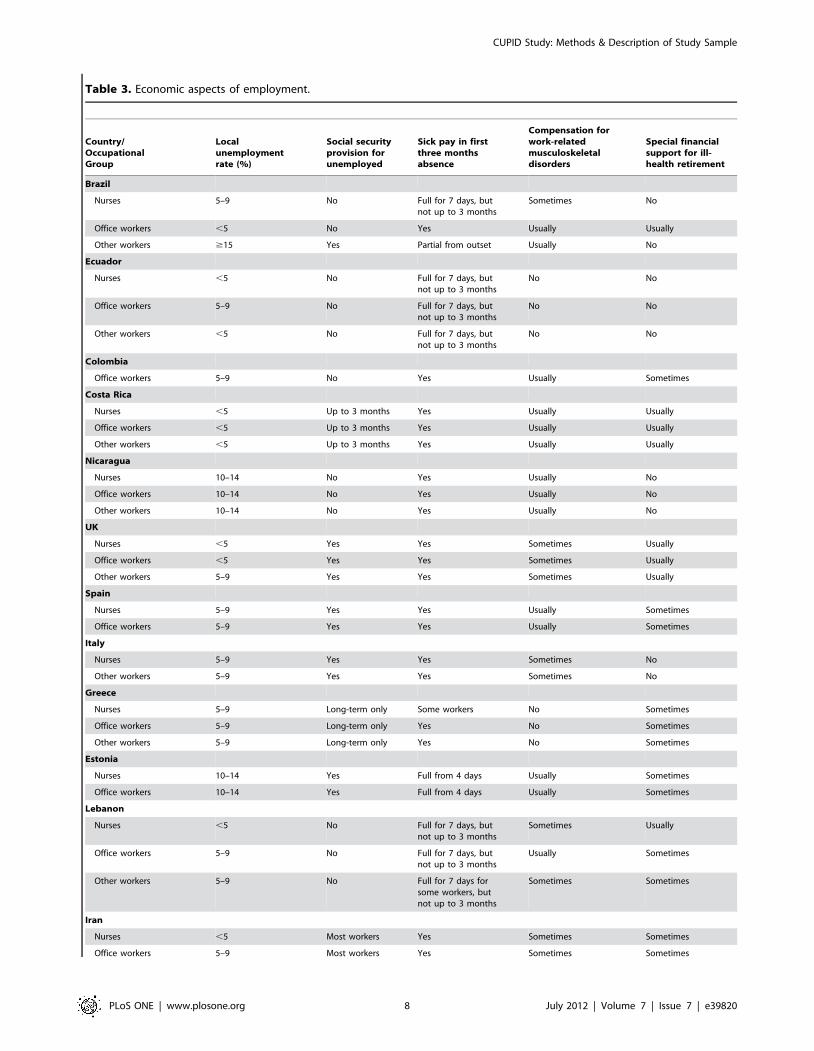
Table 3. Economic aspects of employment.
Country/OccupationalGroup
Localunemploymentrate (%)
Social securityprovision forunemployed
Sick pay in firstthree monthsabsence
Compensation forwork-relatedmusculoskeletaldisorders
Special financialsupport for ill-health retirement
Brazil
Nurses 5–9 No Full for 7 days, butnot up to 3 months
Sometimes No
Office workers ,5 No Yes Usually Usually
Other workers $15 Yes Partial from outset Usually No
Ecuador
Nurses ,5 No Full for 7 days, butnot up to 3 months
No No
Office workers 5–9 No Full for 7 days, butnot up to 3 months
No No
Other workers ,5 No Full for 7 days, butnot up to 3 months
No No
Colombia
Office workers 5–9 No Yes Usually Sometimes
Costa Rica
Nurses ,5 Up to 3 months Yes Usually Usually
Office workers ,5 Up to 3 months Yes Usually Usually
Other workers ,5 Up to 3 months Yes Usually Usually
Nicaragua
Nurses 10–14 No Yes Usually No
Office workers 10–14 No Yes Usually No
Other workers 10–14 No Yes Usually No
UK
Nurses ,5 Yes Yes Sometimes Usually
Office workers ,5 Yes Yes Sometimes Usually
Other workers 5–9 Yes Yes Sometimes Usually
Spain
Nurses 5–9 Yes Yes Usually Sometimes
Office workers 5–9 Yes Yes Usually Sometimes
Italy
Nurses 5–9 Yes Yes Sometimes No
Other workers 5–9 Yes Yes Sometimes No
Greece
Nurses 5–9 Long-term only Some workers No Sometimes
Office workers 5–9 Long-term only Yes No Sometimes
Other workers 5–9 Long-term only Yes No Sometimes
Estonia
Nurses 10–14 Yes Full from 4 days Usually Sometimes
Office workers 10–14 Yes Full from 4 days Usually Sometimes
Lebanon
Nurses ,5 No Full for 7 days, butnot up to 3 months
Sometimes Usually
Office workers 5–9 No Full for 7 days, butnot up to 3 months
Usually Sometimes
Other workers 5–9 No Full for 7 days forsome workers, butnot up to 3 months
Sometimes Sometimes
Iran
Nurses ,5 Most workers Yes Sometimes Sometimes
Office workers 5–9 Most workers Yes Sometimes Sometimes
CUPID Study: Methods & Description of Study Sample
PLoS ONE | www.plosone.org 8 July 2012 | Volume 7 | Issue 7 | e39820
Both the baseline and follow-up questionnaires were compiled
first in English. If necessary, they were then translated into local
languages, and the accuracy of the translation was checked by
independent back-translation to English. Where this revealed
errors, appropriate corrections were made. In addition, in some
countries, translated questionnaires were piloted in samples of
workers who were not included in the main study, and where this
revealed difficulties in understanding, further amendments were
made.
Local investigators were at liberty to add to the ‘‘core’’ questions
of the international study, and a few (e.g. in Italy, Greece, Iran,
Japan, South Africa, Australia and New Zealand) took up this
option. However, in doing so, they were asked where possible to
place the supplementary questions after the core questions, so as to
minimise the chance that they would alter the ways in which
participants answered the core questions.
Group-level Socio-economic InformationAs well as individual data on study participants, local
investigators also provided standardised information about the
socio-economic circumstances of the occupational groups which
they had recruited. This included the local unemployment rate at
the time of the survey, availability of social security support for the
unemployed, entitlement to sick pay in the first three months of
absence, entitlement to compensation for work-related musculo-
skeletal disorders, special financial support for ill-health retire-
ment, fees paid for healthcare, and access to an occupational
health service.
Results
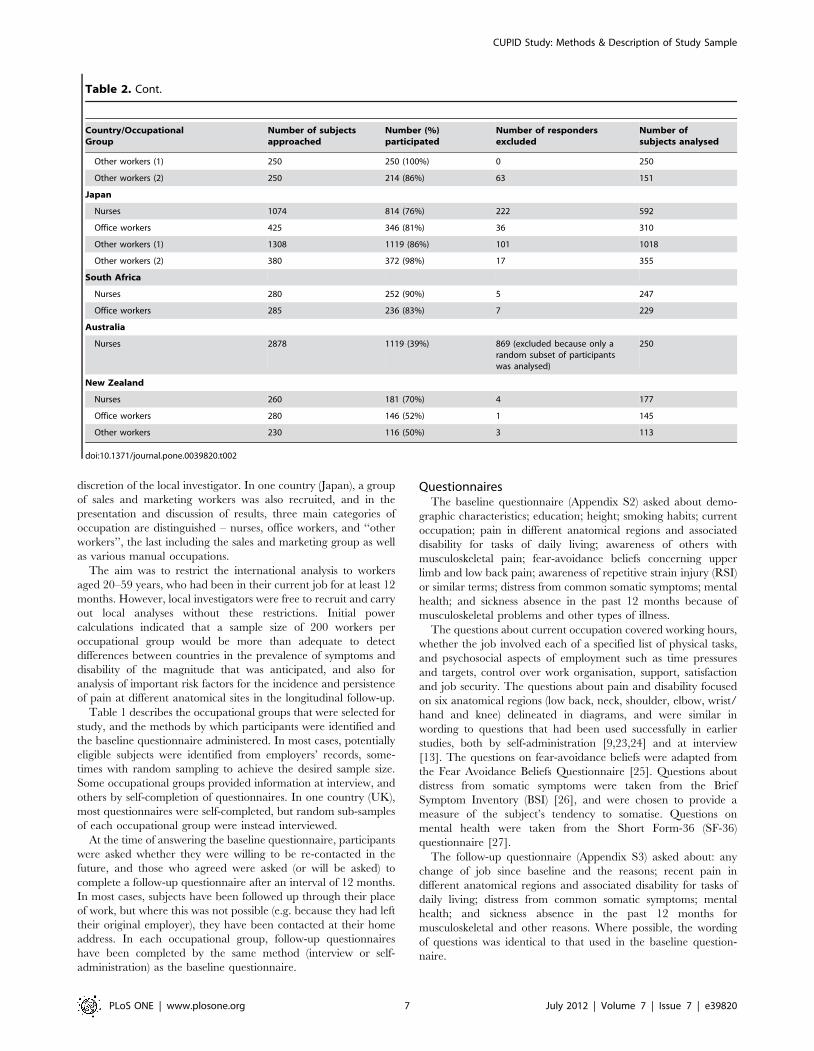
Response to Baseline QuestionnaireThe response to the baseline questionnaire is summarised in
Table 2. Participation rates among those invited to take part in the
study were greater than 80% in 33 of the 47 occupational groups,
ranging from 28% in UK other workers and 39% in Australian
nurses to 100% in six occupational groups from Ecuador,
Nicaragua, Pakistan and Sri Lanka. However, 2,279 participants
were excluded from the international analysis because they fell
outside the specified age range (310), had missing data (317), had
not worked in their current job for as long as 12 months (783), or
(in the case of Australian nurses) were excluded by random
sampling (869). After these exclusions, a total of 12,426 workers
were available for analysis, with between 92 and 1018 in each
occupational group.
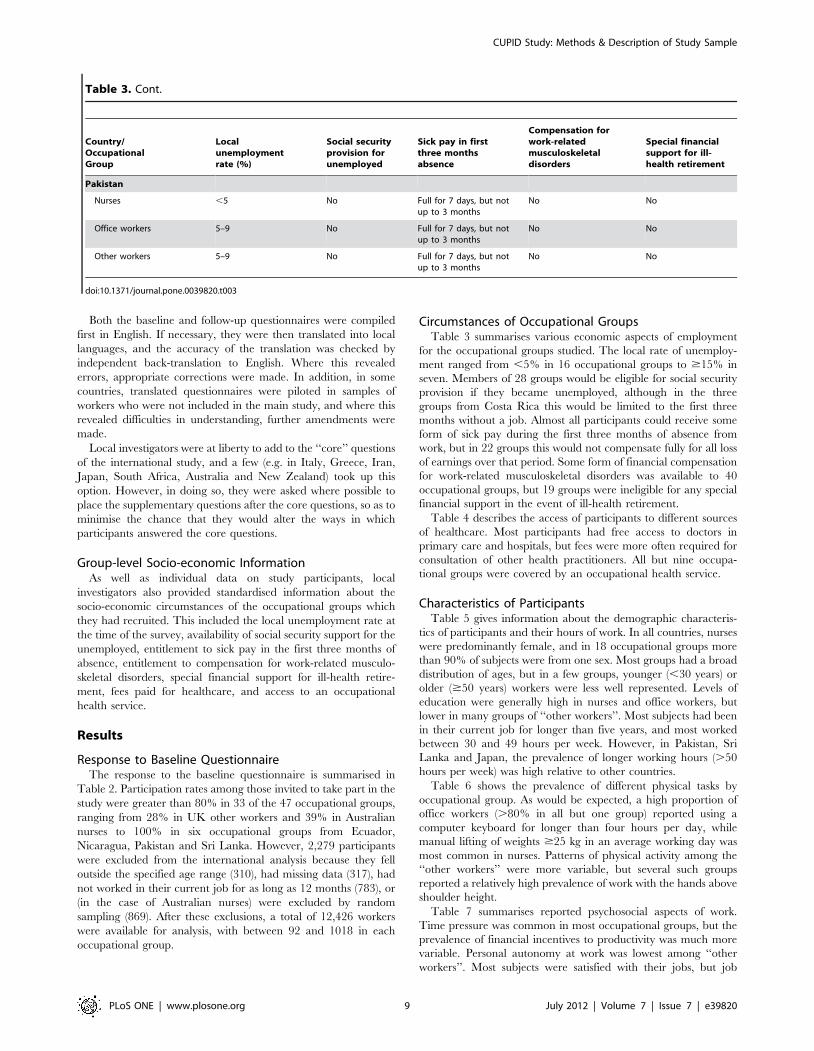
Circumstances of Occupational GroupsTable 3 summarises various economic aspects of employment
for the occupational groups studied. The local rate of unemploy-
ment ranged from ,5% in 16 occupational groups to $15% in
seven. Members of 28 groups would be eligible for social security
provision if they became unemployed, although in the three
groups from Costa Rica this would be limited to the first three
months without a job. Almost all participants could receive some
form of sick pay during the first three months of absence from
work, but in 22 groups this would not compensate fully for all loss
of earnings over that period. Some form of financial compensation
for work-related musculoskeletal disorders was available to 40
occupational groups, but 19 groups were ineligible for any special
financial support in the event of ill-health retirement.
Table 4 describes the access of participants to different sources
of healthcare. Most participants had free access to doctors in
primary care and hospitals, but fees were more often required for
consultation of other health practitioners. All but nine occupa-
tional groups were covered by an occupational health service.
Characteristics of ParticipantsTable 5 gives information about the demographic characteris-
tics of participants and their hours of work. In all countries, nurses
were predominantly female, and in 18 occupational groups more
than 90% of subjects were from one sex. Most groups had a broad
distribution of ages, but in a few groups, younger (,30 years) or
older ($50 years) workers were less well represented. Levels of
education were generally high in nurses and office workers, but
lower in many groups of ‘‘other workers’’. Most subjects had been
in their current job for longer than five years, and most worked
between 30 and 49 hours per week. However, in Pakistan, Sri
Lanka and Japan, the prevalence of longer working hours (.50
hours per week) was high relative to other countries.
Table 6 shows the prevalence of different physical tasks by
occupational group. As would be expected, a high proportion of
office workers (.80% in all but one group) reported using a
computer keyboard for longer than four hours per day, while
manual lifting of weights $25 kg in an average working day was
most common in nurses. Patterns of physical activity among the
‘‘other workers’’ were more variable, but several such groups
reported a relatively high prevalence of work with the hands above
shoulder height.
Table 7 summarises reported psychosocial aspects of work.
Time pressure was common in most occupational groups, but the
prevalence of financial incentives to productivity was much more
variable. Personal autonomy at work was lowest among ‘‘other
workers’’. Most subjects were satisfied with their jobs, but job
Table 3. Cont.
Country/OccupationalGroup
Localunemploymentrate (%)
Social securityprovision forunemployed
Sick pay in firstthree monthsabsence
Compensation forwork-relatedmusculoskeletaldisorders
Special financialsupport for ill-health retirement
Pakistan
Nurses ,5 No Full for 7 days, but notup to 3 months
No No
Office workers 5–9 No Full for 7 days, but notup to 3 months
No No
Other workers 5–9 No Full for 7 days, but notup to 3 months
No No
doi:10.1371/journal.pone.0039820.t003
CUPID Study: Methods & Description of Study Sample
PLoS ONE | www.plosone.org 9 July 2012 | Volume 7 | Issue 7 | e39820
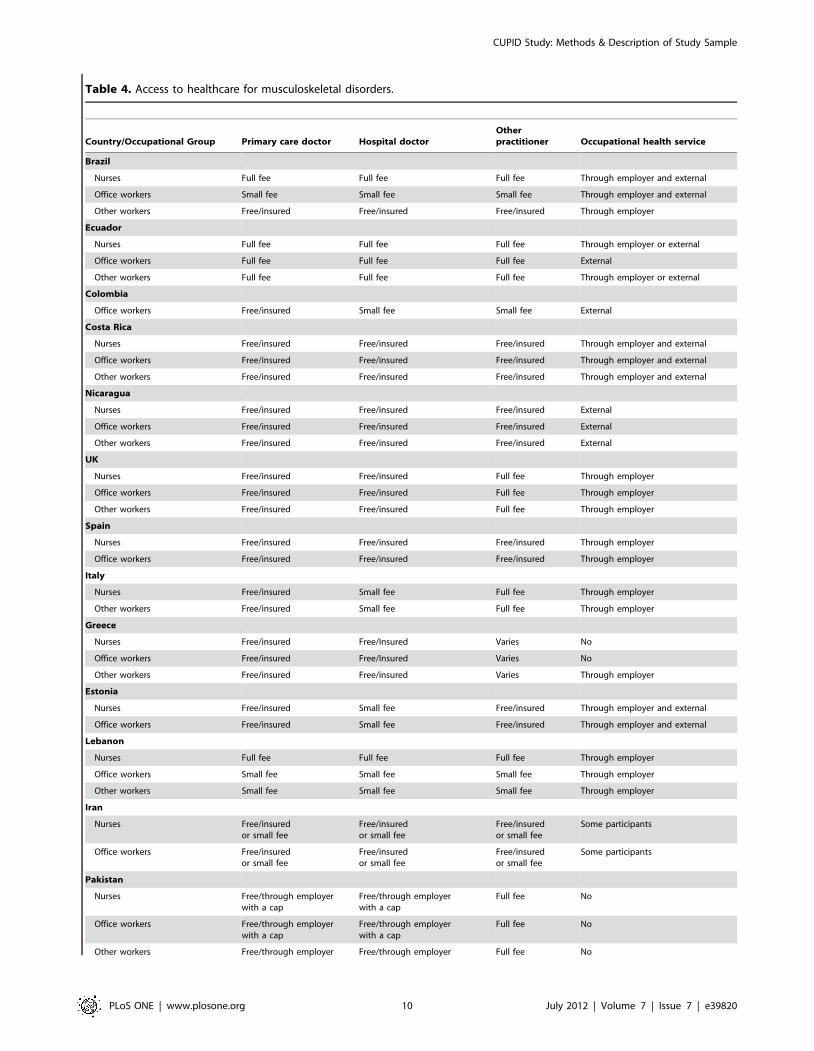
Table 4. Access to healthcare for musculoskeletal disorders.
Country/Occupational Group Primary care doctor Hospital doctorOtherpractitioner Occupational health service
Brazil
Nurses Full fee Full fee Full fee Through employer and external
Office workers Small fee Small fee Small fee Through employer and external
Other workers Free/insured Free/insured Free/insured Through employer
Ecuador
Nurses Full fee Full fee Full fee Through employer or external
Office workers Full fee Full fee Full fee External
Other workers Full fee Full fee Full fee Through employer or external
Colombia
Office workers Free/insured Small fee Small fee External
Costa Rica
Nurses Free/insured Free/insured Free/insured Through employer and external
Office workers Free/insured Free/insured Free/insured Through employer and external
Other workers Free/insured Free/insured Free/insured Through employer and external
Nicaragua
Nurses Free/insured Free/insured Free/insured External
Office workers Free/insured Free/insured Free/insured External
Other workers Free/insured Free/insured Free/insured External
UK
Nurses Free/insured Free/insured Full fee Through employer
Office workers Free/insured Free/insured Full fee Through employer
Other workers Free/insured Free/insured Full fee Through employer
Spain
Nurses Free/insured Free/insured Free/insured Through employer
Office workers Free/insured Free/insured Free/insured Through employer
Italy
Nurses Free/insured Small fee Full fee Through employer
Other workers Free/insured Small fee Full fee Through employer
Greece
Nurses Free/insured Free/Insured Varies No
Office workers Free/insured Free/Insured Varies No
Other workers Free/insured Free/insured Varies Through employer
Estonia
Nurses Free/insured Small fee Free/insured Through employer and external
Office workers Free/insured Small fee Free/insured Through employer and external
Lebanon
Nurses Full fee Full fee Full fee Through employer
Office workers Small fee Small fee Small fee Through employer
Other workers Small fee Small fee Small fee Through employer
Iran
Nurses Free/insuredor small fee
Free/insuredor small fee
Free/insuredor small fee
Some participants
Office workers Free/insuredor small fee
Free/insuredor small fee
Free/insuredor small fee
Some participants
Pakistan
Nurses Free/through employerwith a cap
Free/through employerwith a cap
Full fee No
Office workers Free/through employerwith a cap
Free/through employerwith a cap
Full fee No
Other workers Free/through employer Free/through employer Full fee No
CUPID Study: Methods & Description of Study Sample
PLoS ONE | www.plosone.org 10 July 2012 | Volume 7 | Issue 7 | e39820

dissatisfaction was notably high in Italy, Japan and South Africa.
The prevalence of perceived job insecurity ranged from 1.6% in
Sri Lankan postal workers to 90.3% in Brazilian sugar cane
cutters.
Table 8 shows the proportions of participants who were aware
of a term such as ‘‘repetitive strain injury’’ (‘‘RSI’’), ‘‘work-related
upper limb disorder’’ (‘‘WRULD’’) or ‘‘cumulative trauma
syndrome’’ (‘‘CTS’’), and also the proportions who knew someone
else outside work, who had experienced musculoskeletal pain in
the past 12 months. Awareness of RSI and similar terms varied
widely – from 0.0% in Brazilian sugar cane cutters and 7.0% in
South African office workers to 94.6% in Brazilian nurses and
95.9% in New Zealand office workers. There were also marked
differences in knowledge of others with musculoskeletal com-
plaints. For example, among food production workers in Lebanon,
only 16.1% knew someone outside work with upper limb pain,
whereas in telephone call centre workers in Costa Rica, the
proportion was 65.9%.
Table 9 presents the prevalence of potentially adverse health
beliefs about back and arm pain by occupational group. These
again varied substantially (more than tenfold) between occupa-
tional groups. For example, 78.6% of Greek postal workers and
77.7% of Lebanese nurses believed that low back pain is
commonly caused by people’s work, as compared with only
4.0% of Sri Lankan postal workers and no Brazilian sugar cane
cutters; and 31.4% of Brazilian nurses and 31.0% of Brazilian
office workers had pessimistic views about the prognosis of arm
pain, as compared with 1.6% of nurses and office workers in Iran
and 0.0% of Brazilian sugar cane cutters.
Table 10 compares the characteristics of participants in the UK
who answered the questionnaire at interview and by self-
administration. Among the nurses and especially the ‘‘other
workers’’, participation rates were higher among those invited to
interview, whereas in the office workers they were slightly lower.
However, there were no consistent differences in the prevalence of
reported occupational activities and musculoskeletal pain accord-
ing to the method of data collection.
Discussion
The CUPID study has generated substantial information which
will be the subject of multiple reports. A particular strength is its
use of standardised questions to collect information from
participants in many different countries and cultural settings. This
should provide valuable insights into the determinants of common
musculoskeletal illness and associated disability, and particularly
the extent of differences between countries.
The occupational groups were chosen for study with the aim
that the prevalence of relevant physical tasks should differ between
the three broad categories (nurses, office workers and ‘‘other
workers’’), but that within each of these categories, it should be
broadly similar across countries. For nurses and office workers this
objective was fairly well achieved, although inevitably there was
some heterogeneity. For example, in some countries, nurses
routinely lift and move patients, whereas in others such tasks may
normally be undertaken by care assistants or patients’ family
members. For ‘‘other workers’’, there was more variation in
occupational activities, reflecting the greater diversity of groups
selected for study. Nevertheless, the mix of activities tended to
differ from that of nurses and office workers, with a relatively high
prevalence of work with the arms elevated; and apart from sales
personnel in Japan, all groups of ‘‘other workers’’ had a high
prevalence of work involving prolonged repetitive movement of
the wrists or hands.
The international analysis of data is restricted to subjects aged
20–59 years at baseline, who had held their current job for at least
Table 4. Cont.
Country/Occupational Group Primary care doctor Hospital doctorOtherpractitioner Occupational health service
Sri Lanka
Nurses Free/insured Free/insured Free/insured No
Office workers Free/insured Free/insured Free/insured No
Other workers (1) Free/insured Free/insured Free/insured No
Other workers (2) Free/insured Free/insured Free/insured No
Japan
Nurses Free/insured Free/insured Free/insured Through employer and external
Office workers Free/insured Free/insured Free/insured Through employer and external
Other workers (1) Free/insured Free/insured Free/insured Through employer and external
Other workers (2) Free/insured Free/insured Free/insured Through employer and external
South Africa
Nurses Full fee Small fee Full fee Yes
Office workers Full fee Small fee Full fee Yes
Australia
Nurses Small fee Small fee Full fee Through employer and external
New Zealand
Nurses Small fee Free/insured Payment varies External and possibly through employer
Office workers Small fee Free/insured Payment varies External and possibly through employer
Other workers Small fee Free/insured Payment varies Through employer and external
doi:10.1371/journal.pone.0039820.t004
CUPID Study: Methods & Description of Study Sample
PLoS ONE | www.plosone.org 11 July 2012 | Volume 7 | Issue 7 | e39820

Table 5. Characteristics of study sample – prevalence (%) by occupational group.
Country/Occupational Group Sex Age (years)
Age finished full timeeducation (years)
Years incurrent job Hours worked/week
Males 20–29 30–39 40–49 50–59 ,14 14–16 17–19 20+ .5 ,30 30–49 .50
Brazil
Nurses 11.4 15.7 24.9 43.8 15.7 32.6 38.6 13.6 15.2 90.3 5.6 87.2 7.3
Office workers 21.7 1.4 23.1 57.3 18.1 36.9 35.0 17.9 10.2 86.6 50.5 44.7 4.8
Other workers 94.6 32.3 34.4 23.7 9.7 59.1 21.6 12.5 6.8 57.1 0.0 100.0 0.0
Ecuador
Nurses 0.0 6.8 17.8 33.8 41.6 1.8 2.3 29.7 66.2 78.5 73.5 26.5 0.0
Office workers 0.0 11.9 19.8 44.9 23.5 0.4 0.0 35.8 63.8 77.0 3.3 90.5 6.2
Other workers 0.0 43.6 41.4 11.9 3.1 52.0 19.4 11.9 16.7 39.6 2.2 90.3 7.5
Colombia
Office workers 37.0 27.2 44.6 25.0 3.3 0.0 6.5 17.4 76.1 64.1 26.1 64.1 9.8
Costa Rica
Nurses 33.6 32.3 28.2 25.9 13.6 2.3 3.2 22.2 72.2 65.1 0.5 72.1 27.4
Office workers 38.1 32.7 27.8 25.6 13.9 0.5 1.4 21.2 77.0 63.3 1.4 94.6 4.1
Other workers 36.6 49.8 23.4 16.1 10.7 0.0 0.5 27.9 71.6 49.0 16.1 82.4 1.5
Nicaragua
Nurses 3.2 7.4 34.0 37.9 20.6 0.4 2.5 10.7 86.4 88.3 1.1 91.4 7.5
Office workers 27.4 33.3 35.1 22.1 9.5 0.7 4.6 7.4 87.4 57.9 5.3 93.3 1.4
Other workers 54.8 51.8 37.1 7.1 4.1 9.6 24.4 35.0 31.0 21.8 0.0 100.0 0.0
UK
Nurses 10.1 24.5 37.4 26.1 12.1 0.0 23.7 31.9 44.4 73.4 27.6 72.4 0.0
Office workers 44.7 14.7 31.3 32.1 21.8 0.0 11.1 21.6 67.4 62.5 1.6 94.1 4.3
Other workers 62.4 5.4 19.9 36.8 37.8 0.8 31.5 33.3 34.4 85.5 21.8 70.9 7.3
Spain
Nurses 9.9 25.0 29.2 29.4 16.4 0.3 7.8 154 76.5 72.4 11.8 87.3 0.9
Office workers 16.4 16.7 37.7 34.7 11.0 0.0 2.5 21.7 75.8 67.4 11.6 88.1 0.2
Italy
Nurses 16.4 17.5 34.9 32.5 15.1 3.5 11.2 19.4 65.9 79.3 13.1 86.1 0.8
Other workers 28.1 5.0 36.0 37.4 21.6 16.5 33.1 40.3 10.1 83.2 9.6 90.4 0.0
Greece
Nurses 12.1 5.8 67.0 27.2 0.0 0.0 0.4 18.3 81.3 92.0 0.5 97.3 2.3
Office workers 25.1 7.0 46.2 32.7 14.1 0.0 0.0 20.1 79.9 86.4 16.1 71.9 12.1
Other workers 82.9 1.4 12.1 57.9 28.6 2.9 2.1 66.4 28.6 88.6 2.9 92.9 4.3
Estonia
Nurses 0.5 15.1 31.3 26.1 27.5 0.3 10.3 46.7 42.7 70.0 5.8 86.4 7.8
Office workers 15.3 17.3 31.2 27.7 23.8 0.0 0.0 20.5 79.5 66.3 5.0 89.0 6.0
Lebanon
Nurses 33.7 57.6 31.0 9.8 1.6 0.5 0.0 4.9 94.6 48.4 0.0 97.3 2.7
Office workers 42.4 20.3 31.4 30.2 18.0 0.0 1.2 15.1 83.7 70.9 0.0 85.5 14.5
Other workers 52.6 53.3 29.9 12.4 4.4 26.3 29.2 29.9 14.6 47.4 0.0 70.8 29.2
Iran
Nurses 18.3 32.5 46.7 17.9 2.8 0.0 0.8 12.2 87.0 68.7 0.8 65.9 33.3
Office workers 35.2 49.5 34.6 14.8 1.1 0.5 0.5 30.8 68.1 50.0 1.1 63.7 35.2
Pakistan
Nurses 25.7 72.2 23.0 3.7 1.1 0.0 4.3 29.0 66.7 36.4 0.5 26.7 72.7
Office workers 82.2 53.9 34.4 10.6 1.1 0.0 1.7 17.4 80.9 48.0 1.1 35.0 63.9
Other workers 100.0 9.9 22.5 53.6 14.0 0.9 7.8 25.1 66.2 86.9 16.7 77.5 5.9
CUPID Study: Methods & Description of Study Sample
PLoS ONE | www.plosone.org 12 July 2012 | Volume 7 | Issue 7 | e39820

12 months. These restrictions were set when the CUPID study was
first planned, the latter because some outcomes of interest from the
baseline survey, such as sickness absence in the past 12 months,
would otherwise be difficult to interpret.
The questions used in the baseline and follow-up surveys were
for the most part well-established, having been used successfully in
previous studies. In particular, the items on mental health and
somatising tendency were taken from validated instruments, and
have previously demonstrated predictive validity for the incidence
and persistence of musculoskeletal symptoms [7]. Similarly, the
questions on fear avoidance beliefs were based on a validated
questionnaire [25], and have shown predictive validity in a
longitudinal study [7]. The questions on occupational physical
activities have been successfully used in earlier studies
[7,13,23,24], and the consistency of answers with expectation
(e.g. the high prevalence of prolonged keyboard use in office
workers) supports their validity. There is no reliable standard
against which to assess the accuracy with which subjective
symptoms such as pain are reported, but the questions about
pain and disability had again been used successfully in earlier
studies. Moreover, the style of our questions about symptoms was
similar to that of the Nordic questionnaire, which has been shown
to have acceptable reliability [28].
Ensuring the accuracy with which the questionnaire was
translated into local languages was a challenge. Care was taken
to check the accuracy of translation by independent back-
translation to English, and this revealed a number of problems.
One was the distinction between ‘‘stairs’’ and ‘‘flights of stairs’’,
and despite attempts to resolve this problem, it is not certain that
the term ‘‘30 flights of stairs’’ was always interpreted correctly.
Therefore, this question will be ignored in future analyses based on
the full dataset. Another difficulty arose with questions of the form
‘‘Do you expect that your back pain will be a problem in 12
months time’’. In some languages this became ‘‘Do you expect
your back pain will be a problem over the next 12 months’’.
Attempts were made to correct this misunderstanding, but it is
possible that they were not fully successful.
In addition, terms such as ‘‘pain’’ may be understood differently
in different languages even though translated as closely as possible.
For this reason, when comparing countries, differences in the
relative frequency of pain at different anatomical sites may be
particularly revealing – there should have been little ambiguity in
the understanding of anatomical sites since they were depicted
clearly in diagrams. Interpretation should also be assisted by the
questions that were asked about associated difficulty with tasks of
daily living, since these were probably understood more uniformly.
Another difficulty that had not been expected was in the use of
dates. It emerged that some participants in Iran and Japan used
different numbering for calendar years, and where this occurred,
corrections had to be made.
Some local investigators opted to include extra questions in
addition to the core questions prescribed by CUPID. However,
these additions were relatively minor and generally followed after
the core questions. Thus, it seems unlikely that they will have
influenced answers to the core questions importantly.
Ideally, all questionnaires would have been completed in the
same way (interview or self-administration) by all participants.
However, this proved impractical. Some occupational groups
(especially manual workers in developing countries) would have
had great difficulty in answering a written questionnaire, while
some employers were unwilling to release their staff for interviews.
Moreover, in New Zealand, where nurses and office workers were
recruited from across the country, interviews would have been
prohibitively expensive.
Table 5. Cont.
Country/Occupational Group Sex Age (years)
Age finished full timeeducation (years)
Years incurrent job Hours worked/week
Males 20–29 30–39 40–49 50–59 ,14 14–16 17–19 20+ .5 ,30 30–49 .50
Sri Lanka
Nurses 0.0 46.2 38.6 12.7 2.5 0.0 0.8 38.6 60.6 50.4 0.0 34.3 65.7
Office workers 71.7 75.7 19.1 2.6 2.6 0.0 0.0 12.5 87.5 30.9 0.0 36.8 63.2
Other workers (1) 100.0 0.4 8.4 46.0 45.2 3.6 65.2 28.0 3.2 81.6 0.0 21.6 78.4
Other workers (2) 0.0 67.5 17.9 10.6 4.0 2.6 29.1 47.0 21.2 40.4 0.0 25.8 74.2
Japan
Nurses 3.4 43.1 32.6 13.5 10.8 0.0 0.0 10.1 89.9 62.5 5.7 59.6 34.7
Office workers 56.5 4.5 36.1 32.9 26.5 0.0 1.3 13.2 85.5 73.9 13.1 50.7 36.3
Other workers (1) 99.6 20.9 40.4 27.4 11.3 0.0 5.7 65.8 28.5 78.3 14.3 15.3 70.5
Other workers (2) 93.2 29.0 50.1 17.7 3.1 0.0 1.4 4.8 93.8 78.3 8.8 12.7 78.5
South Africa
Nurses 3.6 16.2 31.6 37.2 15.0 0.0 0.8 18.0 81.2 69.6 0.0 100.0 0.0
Office workers 32.3 42.8 28.4 20.5 8.3 0.4 11.2 62.3 26.0 41.9 0.0 100.0 0.0
Australia
Nurses 6.8 13.2 29.6 29.2 28.0 0.0 6.8 31.3 61.8 57.8 43.1 48.4 8.5
New Zealand
Nurses 5.6 8.5 21.5 35.6 34.5 0.6 14.7 37.3 47.5 75.7 32.2 62.7 5.1
Office workers 6.2 4.1 12.4 40.0 43.4 0.7 40.7 49.0 9.7 71.7 31.7 64.8 3.5
Other workers 33.6 18.6 17.7 31.0 32.7 0.0 37.2 46.0 16.8 54.9 47.3 51.8 0.9
doi:10.1371/journal.pone.0039820.t005
CUPID Study: Methods & Description of Study Sample
PLoS ONE | www.plosone.org 13 July 2012 | Volume 7 | Issue 7 | e39820

Table 6. Physical activities in an average working day – prevalence (%) by occupational group.
Country/OccupationalGroup Activitya
Use keyboard.4 hours
Other repeated wrist/hand movement.4 hours
Repeated elbowbending .1 hour
Hands aboveshoulder height.1 hr
Lifting $25 kgby hand
Kneeling/squatting.1 hour
Brazil
Nurses 9.7 51.9 68.1 11.9 49.7 34.1
Office workers 70.8 70.8 81.5 12.5 10.3 13.2
Other workers 0.0 100.0 100.0 0.0 0.0 100.0
Ecuador
Nurses 8.2 82.6 89 36.1 68.0 62.6
Office workers 84.0 78.6 84.8 39.1 5.3 16.0
Other workers 11.5 92.1 95.2 82.4 21.1 79.3
Colombia
Office workers 90.2 62.0 72.8 18.5 6.5 4.3
Costa Rica
Nurses 10.9 66.4 82.7 30.9 63.6 44.1
Office workers 96.0 76.2 84.8 19.3 5.4 9.4
Other workers 99.0 86.3 88.3 20.5 4.9 4.9
Nicaragua
Nurses 0.7 78.4 83.0 35.8 42.2 50.0
Office workers 89.8 91.6 84.9 46.0 13.3 17.2
Other workers 4.1 73.6 81.7 26.4 13.2 14.7
UK
Nurses 12.8 44.0 54.9 8.9 28.4 18.7
Office workers 88.9 31.1 27.1 1.3 4.2 0.5
Other workers 4.1 81.9 91.2 51.8 12.2 9.8
Spain
Nurses 18.9 59.4 93.7 52.5 82.2 70.5
Office workers 96.8 71.0 91.8 27.4 2.1 14.8
Italy
Nurses 4.9 55.4 80.2 24.6 60.6 17.0
Other workers 10.1 84.2 85.6 29.5 26.6 4.3
Greece
Nurses 2.7 71.4 88.8 29.0 70.1 30.4
Office workers 87.4 58.8 74.9 6.0 7.0 6.5
Other workers 1.4 83.6 96.4 65.7 47.1 22.1
Estonia
Nurses 18.1 64.4 72.5 21.0 56.6 28.6
Office workers 94.6 40.6 51.0 8.4 2.5 2.5
Lebanon
Nurses 3.3 97.3 96.2 42.9 51.6 34.2
Office workers 85.5 73.8 77.3 13.4 14.5 7.0
Other workers 1.5 98.5 97.1 45.3 44.5 25.5
Iran
Nurses 10.2 63.0 81.3 43.1 24.8 49.6
Office workers 97.3 89.6 81.3 40.1 7.1 18.7
Pakistan
Nurses 54.5 93.6 64.2 90.9 73.3 23.0
Office workers 91.7 95.6 35.6 83.9 24.4 10.0
Other workers 7.2 78.4 30.2 77.5 25.7 7.2
CUPID Study: Methods & Description of Study Sample
PLoS ONE | www.plosone.org 14 July 2012 | Volume 7 | Issue 7 | e39820

To explore whether the two methods of answering the
questionnaire might lead to systematic differences in answers, we
therefore elected to interview a random subset of UK participants
while collecting data from the remainder by self-administration.
Comparison of responses using the two approaches (Table 10)
suggests that no major bias will have occurred as a consequence
using both interviews and self-administration. However, if
appropriate, method of data collection can be taken into account
in statistical analyses.
Participation rates among subjects eligible for study were mostly
high, but were less than 50% in five occupational groups (Table 2).
We have no reason to expect that those who elected to take part
were importantly unrepresentative in the prevalence of pain and
its associations with risk factors. However, in future work it may be
appropriate to carry out sensitivity analyses, excluding the
occupational groups with the lowest response rates. The incom-
plete response to the baseline questionnaire will be less of a
concern in longitudinal analyses based on the follow-up question-
naire.
The numbers of participants by occupational group that were
suitable for analysis ranged from 92 to 1018 with a mean of 264.
At the outset, our aim was to recruit at least 200 subjects in each
group, and this was for the most part achieved (only 7 groups
provided fewer than 150 subjects). Furthermore, the occupational
groups studied varied substantially in their employment conditions
(Table 3), access to healthcare (Table 4), and prevalence of
psychosocial risk factors (Tables 7, 8, and 9). When exploring
possible reasons for differences in the prevalence of pain and
disability between occupational groups, it will be important to
investigate these group-level characteristics as well as individual-
level risk factors such as mental health and somatising tendency.
The heterogeneity in their distribution should enhance statistical
power to address their impact.
As might be expected, the demographic constitution of
occupational groups also varied. In particular, many of the
samples of nurses were largely or completely female, whereas some
groups of ‘‘other workers’’ were all men. This reflects the nature of
the occupations of interest. However, it should not be a major
problem in interpretation of comparisons since there were an
adequate number of occupational groups with a fairly even
distribution of sex and age. Moreover, the occurrence of common
musculoskeletal complaints appears not to vary greatly between
men and women or between older and younger adults of working
age [13,23,24].
In summary, the CUPID study is a major resource for the
investigation of cultural and psychological determinants of
common musculoskeletal disorders and associated disability.
Although the data collected have inevitable limitations, the large
differences in psychosocial risk factors (including knowledge and
beliefs about MSDs) between occupational groups carrying out
similar physical tasks in different countries should allow the study
hypothesis to be addressed effectively. It will also allow exploration
of differences in patterns of musculoskeletal complaint between the
three categories of occupation examined, and the consistency of
these differences across countries.
Table 6. Cont.
Country/OccupationalGroup Activitya
Use keyboard.4 hours
Other repeated wrist/hand movement.4 hours
Repeated elbowbending .1 hour
Hands aboveshoulder height.1 hr
Lifting $25 kgby hand
Kneeling/squatting.1 hour
Sri Lanka
Nurses 1.3 60.6 43.2 14.4 36.9 9.3
Office workers 100.0 94.7 72.4 11.8 25.7 17.1
Other workers (1) 0.0 95.6 95.6 95.6 0.0 0.0
Other workers (2) 0.7 86.1 60.9 25.2 4.6 29.1
Japan
Nurses 23.5 23.8 72.8 12.5 66.9 48.5
Office workers 89.0 12.9 22.6 1.6 3.2 2.3
Other workers (1) 2.4 32.8 77.8 33.7 83.3 52.3
Other workers (2) 27.9 10.1 30.1 4.2 9.3 12.1
South Africa
Nurses 11.3 76.1 85.0 53.4 80.2 26.3
Office workers 100.0 76.9 78.6 26.2 4.8 1.3
Australia
Nurses 25.6 32.8 47.6 8.4 25.2 15.2
New Zealand
Nurses 26.6 32.8 42.4 4.0 31.6 14.1
Office workers 91.7 40.0 44.8 0.7 2.1 0.0
Other workers 10.6 87.6 91.2 34.5 51.3 5.3
doi:10.1371/journal.pone.0039820.t006
CUPID Study: Methods & Description of Study Sample
PLoS ONE | www.plosone.org 15 July 2012 | Volume 7 | Issue 7 | e39820
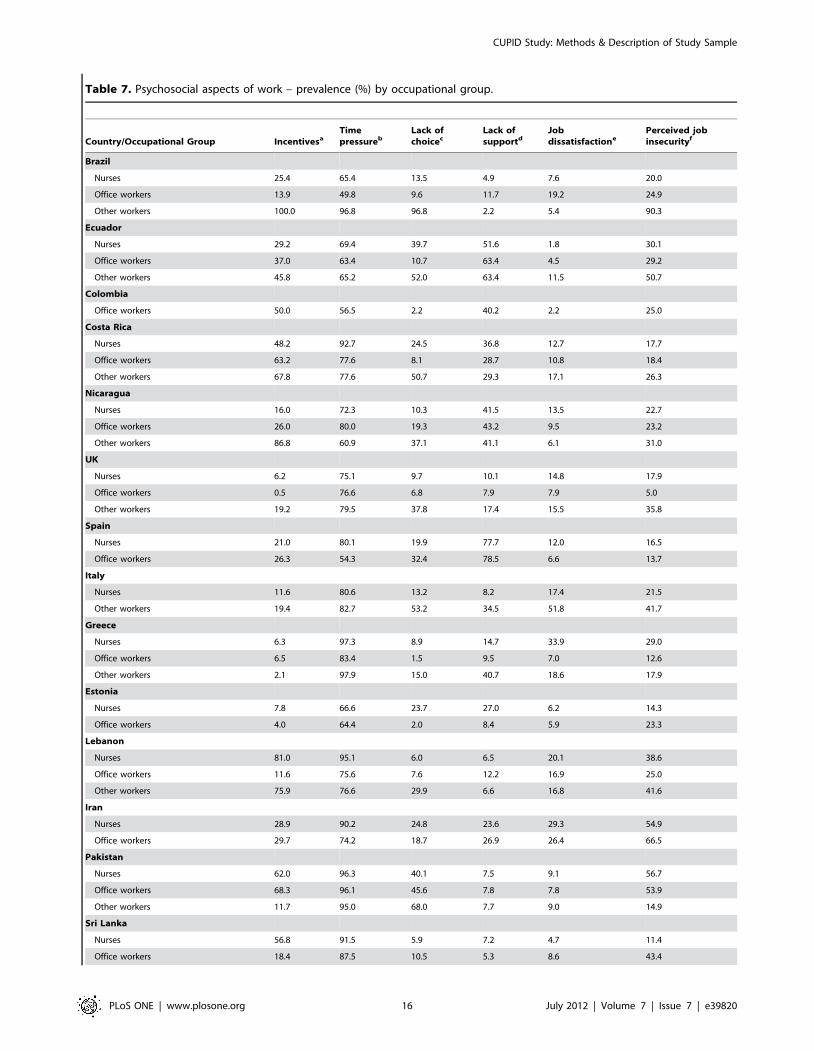
Table 7. Psychosocial aspects of work – prevalence (%) by occupational group.
Country/Occupational Group IncentivesaTimepressureb
Lack ofchoicec
Lack ofsupportd
Jobdissatisfactione
Perceived jobinsecurityf
Brazil
Nurses 25.4 65.4 13.5 4.9 7.6 20.0
Office workers 13.9 49.8 9.6 11.7 19.2 24.9
Other workers 100.0 96.8 96.8 2.2 5.4 90.3
Ecuador
Nurses 29.2 69.4 39.7 51.6 1.8 30.1
Office workers 37.0 63.4 10.7 63.4 4.5 29.2
Other workers 45.8 65.2 52.0 63.4 11.5 50.7
Colombia
Office workers 50.0 56.5 2.2 40.2 2.2 25.0
Costa Rica
Nurses 48.2 92.7 24.5 36.8 12.7 17.7
Office workers 63.2 77.6 8.1 28.7 10.8 18.4
Other workers 67.8 77.6 50.7 29.3 17.1 26.3
Nicaragua
Nurses 16.0 72.3 10.3 41.5 13.5 22.7
Office workers 26.0 80.0 19.3 43.2 9.5 23.2
Other workers 86.8 60.9 37.1 41.1 6.1 31.0
UK
Nurses 6.2 75.1 9.7 10.1 14.8 17.9
Office workers 0.5 76.6 6.8 7.9 7.9 5.0
Other workers 19.2 79.5 37.8 17.4 15.5 35.8
Spain
Nurses 21.0 80.1 19.9 77.7 12.0 16.5
Office workers 26.3 54.3 32.4 78.5 6.6 13.7
Italy
Nurses 11.6 80.6 13.2 8.2 17.4 21.5
Other workers 19.4 82.7 53.2 34.5 51.8 41.7
Greece
Nurses 6.3 97.3 8.9 14.7 33.9 29.0
Office workers 6.5 83.4 1.5 9.5 7.0 12.6
Other workers 2.1 97.9 15.0 40.7 18.6 17.9
Estonia
Nurses 7.8 66.6 23.7 27.0 6.2 14.3
Office workers 4.0 64.4 2.0 8.4 5.9 23.3
Lebanon
Nurses 81.0 95.1 6.0 6.5 20.1 38.6
Office workers 11.6 75.6 7.6 12.2 16.9 25.0
Other workers 75.9 76.6 29.9 6.6 16.8 41.6
Iran
Nurses 28.9 90.2 24.8 23.6 29.3 54.9
Office workers 29.7 74.2 18.7 26.9 26.4 66.5
Pakistan
Nurses 62.0 96.3 40.1 7.5 9.1 56.7
Office workers 68.3 96.1 45.6 7.8 7.8 53.9
Other workers 11.7 95.0 68.0 7.7 9.0 14.9
Sri Lanka
Nurses 56.8 91.5 5.9 7.2 4.7 11.4
Office workers 18.4 87.5 10.5 5.3 8.6 43.4
CUPID Study: Methods & Description of Study Sample
PLoS ONE | www.plosone.org 16 July 2012 | Volume 7 | Issue 7 | e39820
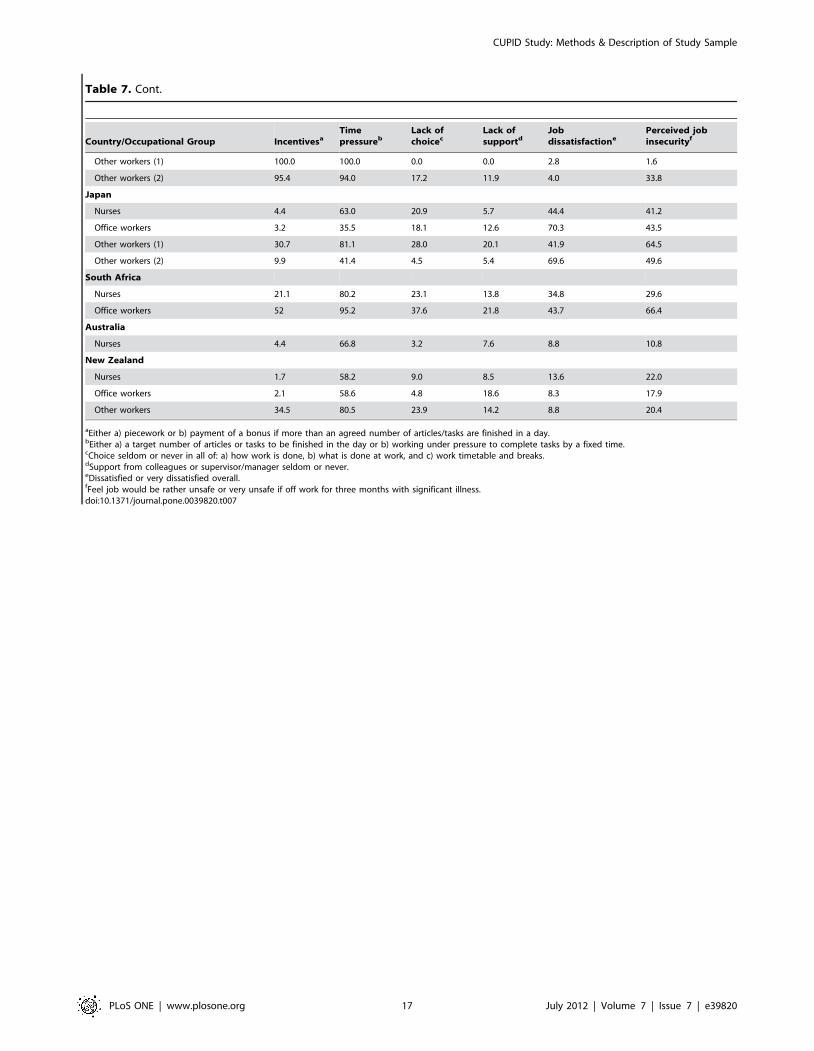
Table 7. Cont.
Country/Occupational Group IncentivesaTimepressureb
Lack ofchoicec
Lack ofsupportd
Jobdissatisfactione
Perceived jobinsecurityf
Other workers (1) 100.0 100.0 0.0 0.0 2.8 1.6
Other workers (2) 95.4 94.0 17.2 11.9 4.0 33.8
Japan
Nurses 4.4 63.0 20.9 5.7 44.4 41.2
Office workers 3.2 35.5 18.1 12.6 70.3 43.5
Other workers (1) 30.7 81.1 28.0 20.1 41.9 64.5
Other workers (2) 9.9 41.4 4.5 5.4 69.6 49.6
South Africa
Nurses 21.1 80.2 23.1 13.8 34.8 29.6
Office workers 52 95.2 37.6 21.8 43.7 66.4
Australia
Nurses 4.4 66.8 3.2 7.6 8.8 10.8
New Zealand
Nurses 1.7 58.2 9.0 8.5 13.6 22.0
Office workers 2.1 58.6 4.8 18.6 8.3 17.9
Other workers 34.5 80.5 23.9 14.2 8.8 20.4
aEither a) piecework or b) payment of a bonus if more than an agreed number of articles/tasks are finished in a day.bEither a) a target number of articles or tasks to be finished in the day or b) working under pressure to complete tasks by a fixed time.cChoice seldom or never in all of: a) how work is done, b) what is done at work, and c) work timetable and breaks.dSupport from colleagues or supervisor/manager seldom or never.eDissatisfied or very dissatisfied overall.fFeel job would be rather unsafe or very unsafe if off work for three months with significant illness.doi:10.1371/journal.pone.0039820.t007
CUPID Study: Methods & Description of Study Sample
PLoS ONE | www.plosone.org 17 July 2012 | Volume 7 | Issue 7 | e39820

Table 8. Awareness of repetitive strain injury (RSI) work related upper limb disorder (WRULD) or cumulative trauma syndrome(CTS) – prevalence (%) by occupational group.
Country/Occupational Group Proportion (%) of participants reporting awareness of
RSI, WRULDor CTS Someone outside work with pain in past 12 months in
Low back Neck Upper limb Knee
Brazil
Nurses 94.6 62.7 49.2 53.0 55.1
Office workers 94.3 60.9 49.1 52.7 50.2
Other workers 0.0 60.2 12.9 36.6 14.0
Ecuador
Nurses 52.1 42.9 34.7 30.1 42.5
Office workers 28.0 50.6 46.1 37.0 42.4
Other workers 24.2 48.0 27.3 39.2 32.2
Colombia
Office workers 43.5 40.2 34.8 32.6 39.1
Costa Rica
Nurses 54.1 55.9 43.6 42.7 46.4
Office workers 26.9 61.0 49.3 48.4 45.7
Other workers 36.1 74.6 65.9 65.9 61.5
Nicaragua
Nurses 56.0 71.6 57.8 58.2 62.8
Office workers 34.0 60.4 54.0 51.2 48.8
Other workers 29.4 41.6 28.4 31.5 26.9
UK
Nurses 76.3 59.1 30.0 35.0 41.2
Office workers 93.7 60 31.8 33.4 42.6
Other workers 47.9 42.5 21.0 26.7 35.0
Spain
Nurses 67.9 82.6 73.1 49.8 55.9
Office workers 59.8 82.9 80.2 45.3 50.6
Italy
Nurses 84.7 82.3 75.6 56.0 55.4
Other workers 77.0 69.8 66.9 54.0 51.1
Greece
Nurses 21.4 82.6 62.5 56.3 50.4
Office workers 24.6 81.4 68.3 64.8 51.3
Other workers 15.7 70.7 50 43.6 36.4
Estonia
Nurses 66.6 69.0 55.3 46.9 57.1
Office workers 49.5 65.8 59.4 47.0 51.5
Lebanon
Nurses 67.9 70.1 58.2 39.1 57.6
Office workers 67.4 56.4 40.7 36.6 32.6
Other workers 34.3 38.7 27.7 16.1 29.2
Iran
Nurses 45.5 76.8 53.3 59.3 69.5
Office workers 25.3 67.0 46.7 54.4 63.2
Pakistan
Nurses 36.9 44.4 23.5 31.0 52.4
Office workers 17.8 39.4 15.0 20 41.1
Other workers 32.4 30.6 19.8 18.9 26.6
CUPID Study: Methods & Description of Study Sample
PLoS ONE | www.plosone.org 18 July 2012 | Volume 7 | Issue 7 | e39820
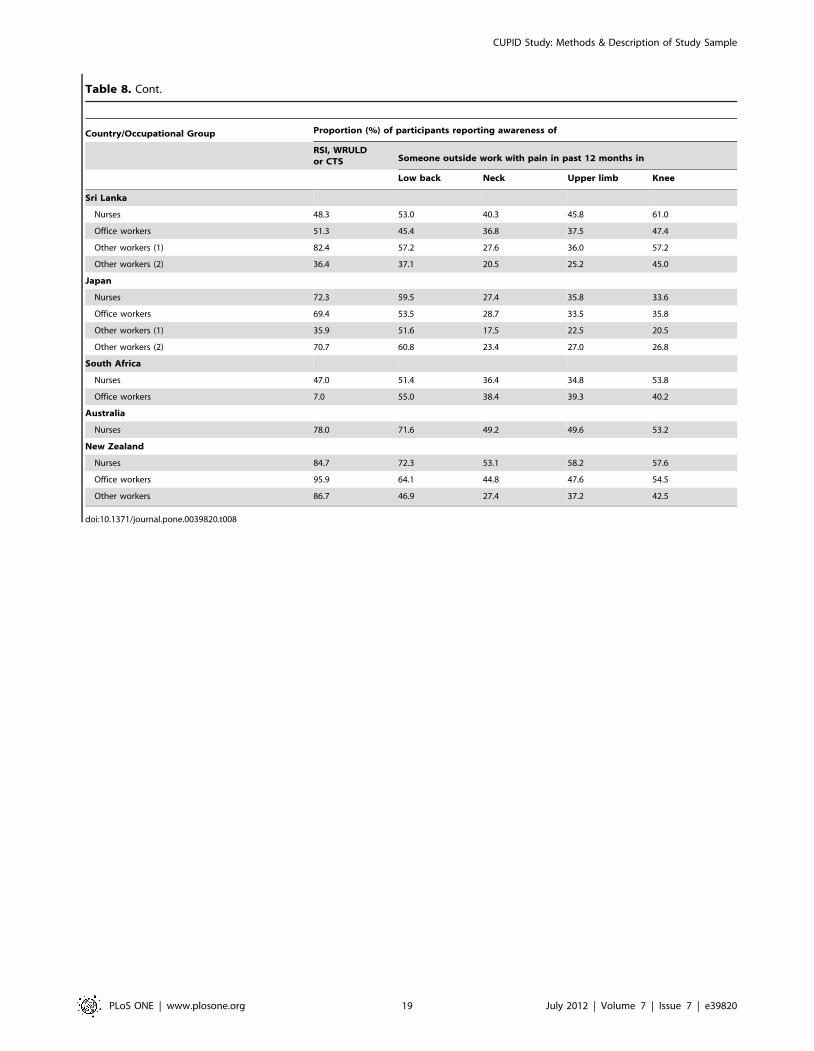
Table 8. Cont.
Country/Occupational Group Proportion (%) of participants reporting awareness of
RSI, WRULDor CTS Someone outside work with pain in past 12 months in
Low back Neck Upper limb Knee
Sri Lanka
Nurses 48.3 53.0 40.3 45.8 61.0
Office workers 51.3 45.4 36.8 37.5 47.4
Other workers (1) 82.4 57.2 27.6 36.0 57.2
Other workers (2) 36.4 37.1 20.5 25.2 45.0
Japan
Nurses 72.3 59.5 27.4 35.8 33.6
Office workers 69.4 53.5 28.7 33.5 35.8
Other workers (1) 35.9 51.6 17.5 22.5 20.5
Other workers (2) 70.7 60.8 23.4 27.0 26.8
South Africa
Nurses 47.0 51.4 36.4 34.8 53.8
Office workers 7.0 55.0 38.4 39.3 40.2
Australia
Nurses 78.0 71.6 49.2 49.6 53.2
New Zealand
Nurses 84.7 72.3 53.1 58.2 57.6
Office workers 95.9 64.1 44.8 47.6 54.5
Other workers 86.7 46.9 27.4 37.2 42.5
doi:10.1371/journal.pone.0039820.t008
CUPID Study: Methods & Description of Study Sample
PLoS ONE | www.plosone.org 19 July 2012 | Volume 7 | Issue 7 | e39820
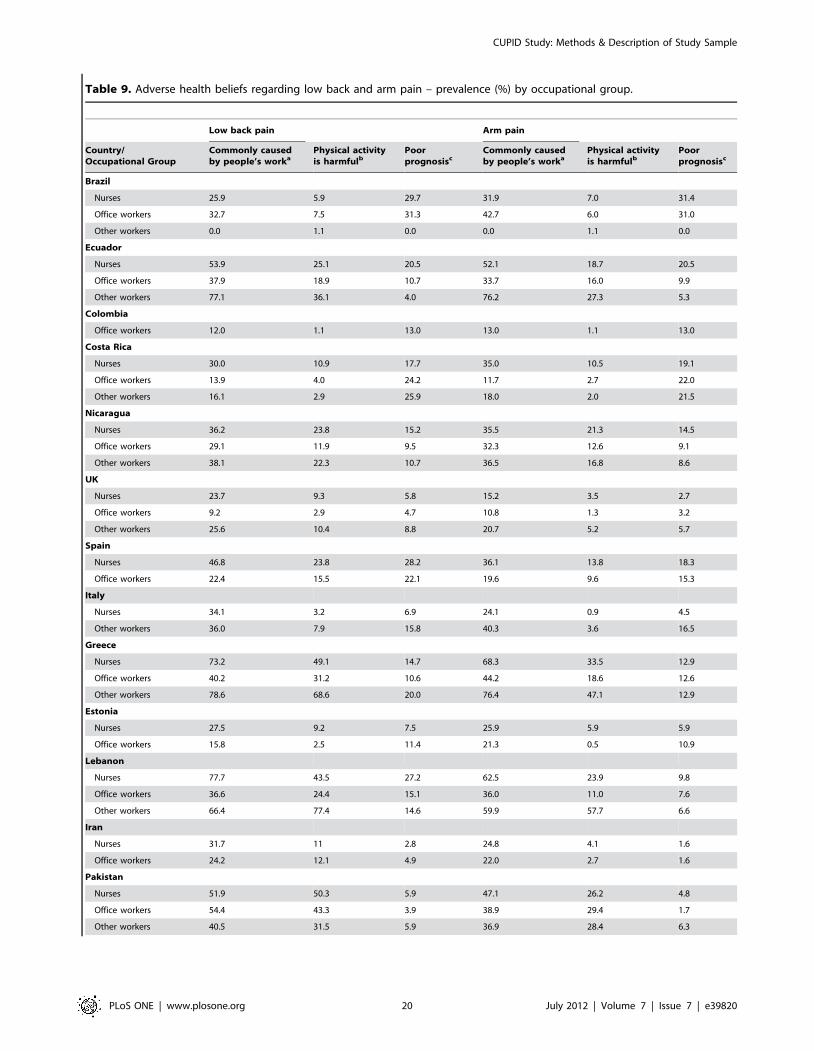
Table 9. Adverse health beliefs regarding low back and arm pain – prevalence (%) by occupational group.
Low back pain Arm pain
Country/Occupational Group
Commonly causedby people’s worka
Physical activityis harmfulb
Poorprognosisc
Commonly causedby people’s worka
Physical activityis harmfulb
Poorprognosisc
Brazil
Nurses 25.9 5.9 29.7 31.9 7.0 31.4
Office workers 32.7 7.5 31.3 42.7 6.0 31.0
Other workers 0.0 1.1 0.0 0.0 1.1 0.0
Ecuador
Nurses 53.9 25.1 20.5 52.1 18.7 20.5
Office workers 37.9 18.9 10.7 33.7 16.0 9.9
Other workers 77.1 36.1 4.0 76.2 27.3 5.3
Colombia
Office workers 12.0 1.1 13.0 13.0 1.1 13.0
Costa Rica
Nurses 30.0 10.9 17.7 35.0 10.5 19.1
Office workers 13.9 4.0 24.2 11.7 2.7 22.0
Other workers 16.1 2.9 25.9 18.0 2.0 21.5
Nicaragua
Nurses 36.2 23.8 15.2 35.5 21.3 14.5
Office workers 29.1 11.9 9.5 32.3 12.6 9.1
Other workers 38.1 22.3 10.7 36.5 16.8 8.6
UK
Nurses 23.7 9.3 5.8 15.2 3.5 2.7
Office workers 9.2 2.9 4.7 10.8 1.3 3.2
Other workers 25.6 10.4 8.8 20.7 5.2 5.7
Spain
Nurses 46.8 23.8 28.2 36.1 13.8 18.3
Office workers 22.4 15.5 22.1 19.6 9.6 15.3
Italy
Nurses 34.1 3.2 6.9 24.1 0.9 4.5
Other workers 36.0 7.9 15.8 40.3 3.6 16.5
Greece
Nurses 73.2 49.1 14.7 68.3 33.5 12.9
Office workers 40.2 31.2 10.6 44.2 18.6 12.6
Other workers 78.6 68.6 20.0 76.4 47.1 12.9
Estonia
Nurses 27.5 9.2 7.5 25.9 5.9 5.9
Office workers 15.8 2.5 11.4 21.3 0.5 10.9
Lebanon
Nurses 77.7 43.5 27.2 62.5 23.9 9.8
Office workers 36.6 24.4 15.1 36.0 11.0 7.6
Other workers 66.4 77.4 14.6 59.9 57.7 6.6
Iran
Nurses 31.7 11 2.8 24.8 4.1 1.6
Office workers 24.2 12.1 4.9 22.0 2.7 1.6
Pakistan
Nurses 51.9 50.3 5.9 47.1 26.2 4.8
Office workers 54.4 43.3 3.9 38.9 29.4 1.7
Other workers 40.5 31.5 5.9 36.9 28.4 6.3
CUPID Study: Methods & Description of Study Sample
PLoS ONE | www.plosone.org 20 July 2012 | Volume 7 | Issue 7 | e39820

Table 9. Cont.
Low back pain Arm pain
Country/Occupational Group
Commonly causedby people’s worka
Physical activityis harmfulb
Poorprognosisc
Commonly causedby people’s worka
Physical activityis harmfulb
Poorprognosisc
Sri Lanka
Nurses 5.9 6.4 9.3 9.7 3.0 11.4
Office workers 13.8 10.5 4.6 19.7 4.6 3.9
Other workers (1) 4.0 36.0 10.4 3.6 11.2 8.0
Other workers (2) 20.5 9.9 7.3 20.5 6.0 6.0
Japan
Nurses 46.6 14.7 18.2 24.3 5.7 9.3
Office workers 16.5 19.7 14.2 11.6 9.0 7.4
Other workers (1) 47.2 25.6 21.8 33.2 11.7 10.1
Other workers (2) 21.4 23.7 17.5 12.4 16.1 6.5
South Africa
Nurses 37.7 5.3 7.7 36.0 3.6 6.1
Office workers 24.9 6.6 4.8 22.7 3.1 3.5
Australia
Nurses 19.2 2.8 6.8 12.4 2.4 2.4
New Zealand
Nurses 20.3 2.8 2.3 11.9 1.1 4.0
Office workers 6.2 2.1 2.8 9.0 2.1 4.1
Other workers 21.2 14.2 6.2 29.2 12.4 5.3
aCompletely agree that such pain is commonly caused by people’s work.bCompletely agree that for someone with such pain, a) physical activity should be avoided as it might cause harm, and b) rest is needed to get better.cCompletely agree that for someone with such pain, rest is needed to get better, and completely disagree that such problems usually get better within three months.doi:10.1371/journal.pone.0039820.t009
Table 10. Comparison of UK participants who provided information by interview and by self-administered questionnaire.
Nurses Office workers Other workers
InterviewSelf-administeredquestionnaire Interview
Self-administeredquestionnaire Interview
Self-administeredquestionnaire
Number selected 190 500 200 851 240 1329
Number (%) participated 91 (48) 199 (40) 88 (44) 388 (46) 122 (51) 320 (24)
Number of subjects analysed 78 179 66 314 110 276
Prevalence (%) of activities in anaverage working day
Use keyboard .4 hr 6.4 15.6 84.9 89.8 1.8 5.1
Other repeated wrist/hand movement .4 hr 46.2 43.0 22.7 32.8 86.4 80.1
Repeated elbow bending .1 hr 60.3 52.5 13.6 29.9 96.4 89.1
Hands above shoulder height .1 hr 7.7 9.5 1.5 1.3 55.5 50.4
Lifting $25 kg by hand 28.2 28.5 9.1 3.2 12.7 12.0
Kneeling/squatting .1 hr 21.8 17.3 1.5 0.3 15.5 7.6
Prevalence (%) of pain in past month
Low back 26.9 36.3 28.8 26.8 34.6 34.4
Neck 14.1 20.1 21.2 22.9 20.9 20.7
Shoulder 9.0 21.8 21.2 20.7 33.6 31.2
Elbow 2.6 2.8 12.1 8.0 14.6 15.2
Wrist/hand 14.1 15.6 19.7 17.5 24.6 21.7
Knee 12.8 18.4 27.3 22.3 21.8 24.6
doi:10.1371/journal.pone.0039820.t010
CUPID Study: Methods & Description of Study Sample
PLoS ONE | www.plosone.org 21 July 2012 | Volume 7 | Issue 7 | e39820

Supporting Information
Appendix S1 Committees which provided ethical ap-proval for the cupid study.(DOCX)
Appendix S2 Baseline questionnaire.(DOCX)
Appendix S3 Follow-up questionnaire.(DOCX)
Acknowledgments
We thank: Pietro Munoz, Patricio Oyos, Gonzalo Albuja, Marıa Belduma
and Francisco Lara for their assistance with data collection in Ecuador;
Patrica Monge, Melania Chaverrri and Freddy Brenes, who helped with
data collection in Costa Rica; Aurora Aragon, Alberto Berrıos, Samaria
Balladares and Martha Martınez who helped with data collection in
Nicaragua; Alfredo Jose Jiron who assisted with data entry in Nicaragua;
Catalina Torres for translation and piloting of the questionnaire in Spain;
Ben and Marie Carmen Coggon for back translation of the Spanish
questionnaire; Cynthia Alcantara, Xavier Orpella, Josep Anton Gonzalez,
Joan Bas, Pilar Pena, Elena Brunat, Vicente San Jose, Anna Sala March,
Anna Marquez, Josefina Lorente, Cristina Oliva, Montse Vergara and
Eduard Gaynes for their assistance with data collection in Spain; Natale
Battevi, Lorenzo Bordini, Marco Conti and Luciano Riboldi who carried
out data collection in Italy; Paul Maurice Conway for back translation of
the Italian questionnaire; Tiina Freimann, who helped with data collection
in Estonia; Asad Ali Khan for supervision of data collection and checking
in Pakistan; Khalil Qureshi for training of field workers and supervision of
data collection and checking in Pakistan; Masami Hirai, Tatsuya Isomura,
Norimasa Kikuchi, Akiko Ishizuka and Takayuki Sawada for their help
with data collection and management in Japan; and Peter Herbison for
assistance with data collection in New Zealand.
We are particularly grateful to all of the organisations that allowed us to
approach their employees; and all of the workers who kindly participated in
the study.
Author Contributions
Conceived and designed the experiments: DC KTP. Performed the
experiments: DC GN KTP KC VEF MHM LMS RH FH RF NH LHB
MVM LAQ MR SAF DG EJSV ECH AC SVP CS JMM GD FGB MB
MC MMF ACP ES LC PB MK EM KO TS RRH FS AS MMK SSPW
RJPJ NS ARW KM NY BN DK MRS HLK VCWH DMU HH SD DM
AG. Analyzed the data: GN DC. Wrote the paper: DC. Principal
investigator Brazil: VEF. Principal investigator Ecuador: RH. Principal
investigator Colombia: LHB. Principal Investigators Costa Rica and
Nicaragua: SAF DG. Principal investigator UK: DC. Principal investigator
Spain: SV-P. Principal investigator Italy: MB. Principal investigator
Greece: ES. Principal investigator Estonia: EM. Principal investigator
Lebanon: RRH. Principal investigator Iran: FS. Principal investigator
Pakistan: MMK. Principal investigator Sri Lanka: SSPW. Principal
investigator Japan: KM. Principal investigator South Africa: BN. Principal
investigator Australia: MRS. Principal investigator New Zealand: HH. All
authors reviewed the draft manuscript and contributed to its finalization.
References
1. Lotters F, Burdorf A, Kuiper J, Miedema H (2003) Model for the work-
relatedness of low-back pain. Scand J Work Environ Health 29: 431–40.
2. Palmer KT, Smedley J (2007) Work relatedness of chronic neck pain with
physical findings – a systematic review. Scand J Work Environ Health 33: 165–
91.
3. Palmer KT (2011) Carpal tunnel syndrome: the role of occupational factors. Best
Pract Res Clin Rheumatol 25: 15–29.
4. Palmer KT, Harris EC, Coggon D (2007) Compensating occupationally related
tenosynovitis and epicondylitis: a literature review. Occup Med 57: 67–74.
5. Linton SJ (2000) A review of psychological risk factors in back and neck pain.
Spine 25: 1148–56.
6. Macfarlane GJ, Hunt IM, Silman AJ (2000) Role of mechanical and
psychosocial factors in the onset of forearm pain: prospective population based
study. Br Med J 321: 676–9.
7. Palmer KT, Reading I, Linaker C, Calnan M, Coggon D (2008) Population-
based cohort study of incident and persistent arm pain: role of mental health,
self-rated health and health beliefs. Pain 136: 30–37.
8. Macfarlane GJ, Pallewatte N, Paudyal P, Biyth FM, Coggon D, et al. (2009)
Evaluation of work-related psychosocial factors and regional musculoskeletal
pain: result from a EULAR Task Force. Ann Rheum Dis 68: 885–91.
9. Palmer K, Calnan M, Wainwright D, Poole J, O’Neill C, et al. (2005) Disabling
musculoskeletal pain and its relation to somatization: A community-based postal
survey. Occup Med 55: 612–617.
10. Clinical Standards Advisory Group (1994) Epidemiology review: the epidemi-
ology and cost of back pain. London: HMSO.
11. Gun RT (1990) The incidence and distribution of RSI in South Australia 1980–
81 and 1986–87. Med J Aust 153: 376–80.
12. Coggon D (2005) Occupational Medicine at a turning point. Occup Environ
Med 62: 281–3.
13. Madan I, Reading I, Palmer KT, Coggon D (2008) Cultural differences in
musculoskeletal symptoms and disability. Int J Epid 37: 1181–1189.
14. Ramond A, Bouton C, Richard I, Roquelaire Y, Baufreton C, et al. (2011)
Psychosocial risk factors for chronic low back pain in primary care – a systematic
review. Fam Prac 28: 12–21.
15. Buchbinder R, Jolley D, Wyatt M (2001) Population based intervention to
change back pain beliefs and disability: three part evaluation. Br Med J 322:
1516–1520.
16. Ferrari AL, Baptista PCP, Felli VEA, Coggon D (2010)Translation, adaptation
and validation of the ‘‘Cultural and Psychosocial Influences on Disability(CUPID) Questionnaire’’ for use in Brazil. Rev Latino-Am Enfermagem 18:
1092–8.17. Harcombe H, McBride D, Derrett S, Gray A (2009) Prevalence and impact of
musculoskeletal disorders in New Zealand nurses, postal workers and office
workers. Aust N Z J Public Health 33: 437–41.18. Harcombe H, McBride D, Derrett S, Gray A (2010) Physical and psychosocial
risk factors for musculoskeletal disorders in New Zealand nurses, postal workersand office workers. Injury Prevention 16: 96–100.
19. Hoe VCW, Kelsall HL, Urquhart DM, Sim MR (2011) Risk factors formusculoskeletal symptoms of the neck or shoulder alone or neck and shoulder
among hospital nurses. Occup Environ Med 69: 198–204.
20. Matsudaira K, Palmer KT, Reading I, Hirai M, Yoshimura N, et al. (2011)Prevalence and correlates of regional pain and associated disability in Japanese
workers. Occup Environ Med. 68: 191–196.21. Solidaki E, Chatzi L, Bitsios P, Markatzi I, Plana E, et al. (2010) Work related
and psychological determinants of multi-site musculoskeletal pain. Scand J Work
Environ Health 2010;36: 54–61.22. Warnakulusariya S, Peiris-John R, Ntani G, Coggon D, Sathiakumar N, et al.
(In press) Musculoskeletal pain in four occupational populations in Sri Lanka.Occupational Medicine.
23. Palmer KT, Walsh K, Bendall H, Cooper C, Coggon D (2000) Back pain inBritain: Comparison of two prevalence surveys at an interval of ten years. Br
Med J 320;1577–8.
24. Palmer KT, Walker-Bone K, Griffin MJ, Syddall H, Pannett B (2001) Theprevalence and occupational associations of neck pain in the British population.
Scand J Work Environ Health 27: 49–56.25. Waddell G, Newton M, Henderson I, Somerville D, Main CJ (1993) A Fear-
Avoidance Beliefs Questionnaire (FABQ) and the role of fear-avoidance beliefs
in chronic low back pain and disability. Pain 52: 157–68.26. Derogatis LR, Melisoratos N (1983) The Brief Symptom Inventory: an
introductory report. Psychol Med 13: 595–605.27. Ware JE, Sherbourne CD (1992) The MOS 36-item short-form health survey
(SF-36). Med Care 30: 473–83.28. Kuorinka I, Jonsson B, Kilbom A, Vinterberg H, Biering-Sørensen F, et al.
(1987) Standardised Nordic questionnaires for the analysis of musculoskeletal
symptoms. Appl Ergon;18: 233–7.
CUPID Study: Methods & Description of Study Sample
PLoS ONE | www.plosone.org 22 July 2012 | Volume 7 | Issue 7 | e39820