The Colloidal Domain
Chapter 8
Colloidal Stability
1
Peter Schurtenberger
Specific colloid properties: Stability
lyophilic lyophobic
colloids
colloidal system: dispersion medium is notsimple mixing of a “solvent”: fat, oil,components inorganic particles (Au, TiO2,…)surfactants, polymers,…
colloidal system is thermodynamically
stable unstable

Colloids in daily life
Colloids everywhere:
Milk, cheese, paint, foam, ceramics (teeth implants, coatings,...), drugs,...
The colloid scientistʼs daily quiz:
• Formation of a river delta near the sea. Sedimentation of small particles that would not sediment by gravity only.
Why?
• Carbon is insoluble in water. The egypts (2500 BC) already
How?
made ink dispersing smoke particles in water.
Aggregation and Gelation - From Ceramics to Yoghurt
4
Medicine:protein aggregation(protein condensation diseases)
Food sciences:yoghurt and cheese
Materials science:ceramics
Colloid stability: fundamentals and applications

Aggregation and gel formation
5
Ds(c)
gel formation
viscoelastic networkδ2, τc
model systems: latex (Φ = 0.1- 30 %)
real systems: Al2O3 suspensions;
biopolymer solutions
U(r)
[kT]
r/2a1
energy barrier Rc ≈ aΦ−1 /(3−dF )
Aggregation and cluster formation
screening
addition of salt,acid, enzymes...
Milk - a food colloid system
6
water 87wt%lactose 4.6wt%fat 3.9wt%protein 3.3wt% casein, 80% whey, 20%salts 0.7wt%
Colloidal systemmade of 5
principal components:
A colloid scientists view of milk:
+ + =
hydrophobic core
hydrophilic shell: κ-casein molecules → “hairy layer” → steric stabilization
Casein micelle:
<R> ≈ 100 - 150nm
Production 85,000,000,000 kg/year

YoghurtCheese
CreamButter
7
Milk - composition and products
Casein micelles - a model colloid?
8
Latex: Solid particles with pH-dependent charge density
S.H. Behrens et. al. , Langmuir 16, 2566 (2000)
D.J. McMahon, W.R. McManus J. Dairy Sci. 81, 2985 (1998)
Casein micelles: Self assembled particleswith pH-dependent charge densitybut electro-sterically stabilized
Dual binding model of casein micellesD.S. Horne, Int. Dairy J. 8 (1998) 171
Casein interaction potentialR. Tuinier, C.G. de Kruif, J. Chem. Phys. 117 (2002) 1290

Milk destabilization - cheese and yoghurt formation
9
hydrophilic shell: κ-casein molecules → “hairy layer” → steric stabilization
flocculation or aggregation of the micelles: • hairs are removed enzymatically (cheese) • acidification (glucono-δ lactone): → brush
collapse (yoghurt)U(r)
r
removing thestabilizing ʻhairsʼ from
the surface
The sol-gel transition in skim milk
10
0.001
0.01
0.1
1
10
100
1000
4.5
4.7
4.9
5.1
5.3
5.5
5.7
5.9
6.1
6.3
6.5
0 100 200 300 400 500 600
pHG', G"[Pa]
time [min]
pH induced
sol-gel transition
rU(r)
P. Schurtenberger, A. Stradner, S. Romer, C. Urban, and F. Scheffold, Chimia 55, 155 (2001)
P. Aichinger, Nestlé
gel point(collapse of electrosteric layer)
Instead of lactobacilli:slow pH-shift by addition of GDL
A. Stradner et al., Prog. Colloid Polym. Sci. 118, 136-140 (2001)

RLCA
Brownian motion results in collisions
11
particles experience effective interaction forces
Colloid stability and interaction potential
Colloid stability and interaction potential
12
stability
coagulation
flocculation
reversiblevs.irreversible
13
DLVO theory
Interaction potential as sum of two contributions:
el.stat.: U(D) ~ exp(-κD)
vdW: U(D) ~ 1/Dn
(Derjaguin and Landau (1941),
Verwey and Overbeek (1948))
explicit dependence on R
(small particles are difficult to stabilize)
addition of salt -> destabilization of
particles
U(D) ≈2πσ 2R
κ 2εε0e−κD −
AR
12DHR
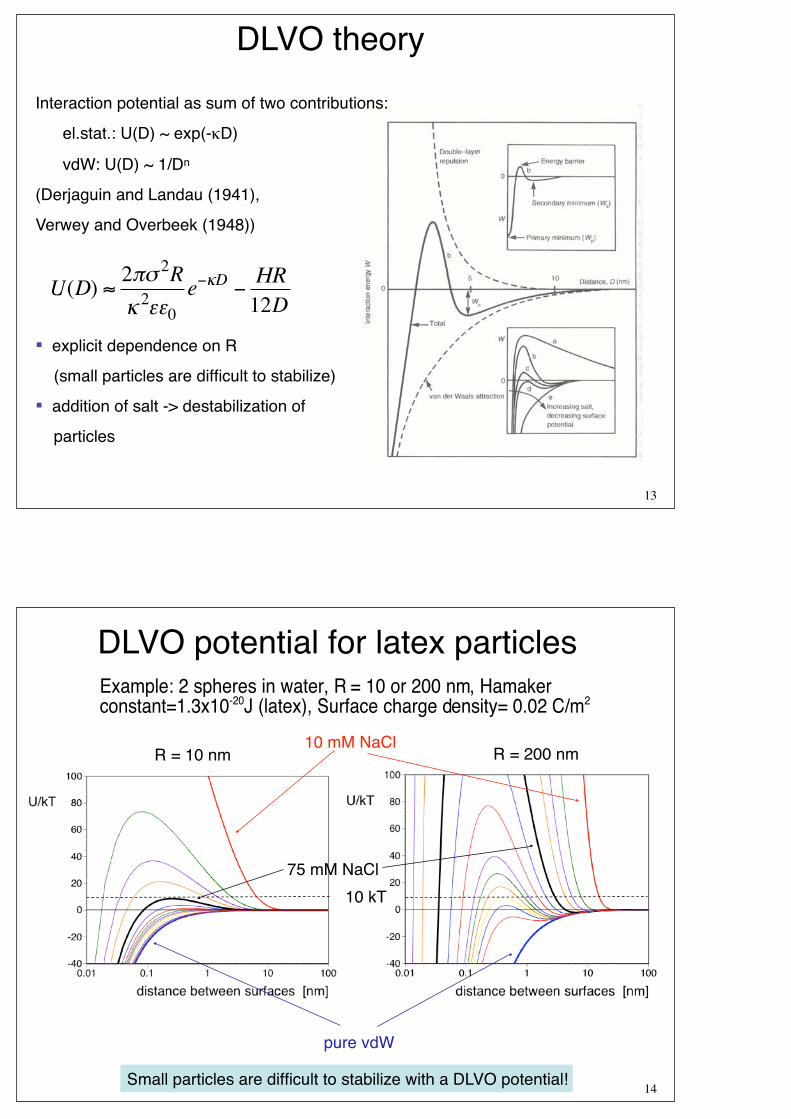
DLVO potential for latex particles
14
Example: 2 spheres in water, R = 10 or 200 nm, Hamakerconstant=1.3x10⁻²⁰J (latex), Surface charge density= 0.02 C/m2
10 mM NaCl
75 mM NaCl
pure vdW
10 kT
R = 10 nm R = 200 nm
Small particles are difficult to stabilize with a DLVO potential!

explicit size dependence
15
-0.5
-0.3
-0.1
0.1
0.3
0.5
0.7
0.9
0.01 0.1 1 10 100
VdWkT
dlvo10
dlvo25
dlvo37.5
dlvo50
dlvo75
dlvo100
dlvo125
dlvo150
dlvo175
dlvo200
dlvo300
dlvo500
dlvo1000
U/kT
distance between surfaces [nm]
-10
-8
-6
-4
-2
0
2
4
6
8
10
0.01 0.1 1 10 100
VdWkT
dlvo10
dlvo25
dlvo37.5
dlvo50
dlvo75
dlvo100
dlvo125
dlvo162.5
dlvo150
dlvo175
dlvo187.5
dlvo200
dlvo
U/kT
distance between surfaces [nm]
weak vs. deep secondary minimum
CCC approx. 160 mM
steric stabilization
16
steric repulsion
poor solvent condition

steric stabilization
17
assume steric layer with 1 nm
Colloids in daily life
Colloids everywhere:
Milk, cheese, paint, foam, ceramics (teeth implants, coatings,...), drugs,...
The colloid scientistʼs daily quiz:
• Formation of a river delta near the sea. Sedimentation of small particles that would not sediment by gravity only.
Why?
• Carbon is insoluble in water. The egypts (2500 BC) already
How?
made ink dispersing smoke particles in water.

Colloid stability and aggregation: initial stages of aggregation
calculate rate constant by looking at particle flux through spherical shell at distance r around „stationary“ or central particle using Ficks law:
4πr2Jr( )i= − 4πr2( )Di
d X1[ ]dr
k =∞ −
4 22
1
π e
D r rdr
a ( )
Vr( )/kT
k TB≈ 8
3ηk k e Q/kT∝ −
fast slow
how to measure rate constants
different salt concentrations:
1 M
♦ 0.75 M
▼ 0.5 M
0.25 M
■ 0.2 M
Δ 0.075 M
fast aggregation limit
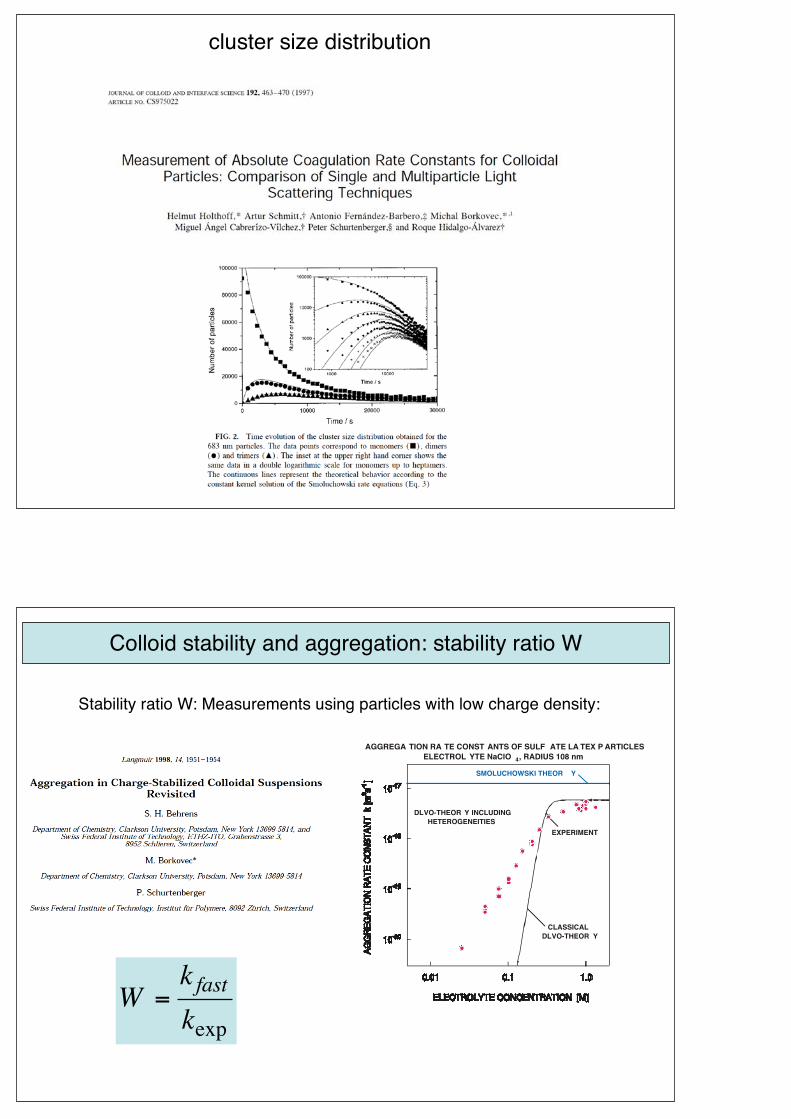
cluster size distribution
W =k fastkexp
Colloid stability and aggregation: stability ratio W
Stability ratio W: Measurements using particles with low charge density:
SMOLUCHOWSKI THEOR Y
EXPERIMENT
CLASSICALDLVO-THEOR Y
DLVO-THEOR Y INCLUDINGHETEROGENEITIES
AGGREGA TION RA TE CONST ANTS OF SULF ATE LA TEX P ARTICLESELECTROL YTE NaClO , RADIUS 108 nm4

Colloid stability and aggregation: stability ratio W
Stability ratio W: Measurements using particles with low charge density (S. H. Behrens et al., Langmuir (1998)):
• rate constant determined by barrier height
• DLVO breaks down at r < 1 nm
30.9.2011
24

Colloid stability and aggregation: how to model aggregation
Computer simulations:
diffusion limited (DLA, fast) vs. reaction limited (RLA, slow) cluster growth
seed particle
starting circle
killing circle
DLA simulation: fractal growth

DLA simulation: how to determine fractal diemnsion
Determination of the fractal dimension of a cluster generated via computer simulation ofmonomer-cluster aggregation:
i) "experiment counting numbers": N(r) ~ rdF
ii) determination of the density-density correlation function
g(r) ~ N(r)
rd ~ rdF - d , d: lattice dimension
→ S(q), d.h. direct comparison with results from scattering experiments
DLCA RLCA
power-law cluster size distribution
N(M;t) = A2M−τ exp −
MMc (t)
⎛
⎝ ⎜
⎞
⎠ ⎟
(slightly) peaked cluster size distribution
N(M;t) =A1
M2 (t)1−
2M2(t)
⎛
⎝ ⎜
⎞
⎠ ⎟ M−1
RLCA
Cluster-cluster aggregation - the two limiting regimes
28
no barrier -> diffusion limited barrier ≥ kT -> reaction limited
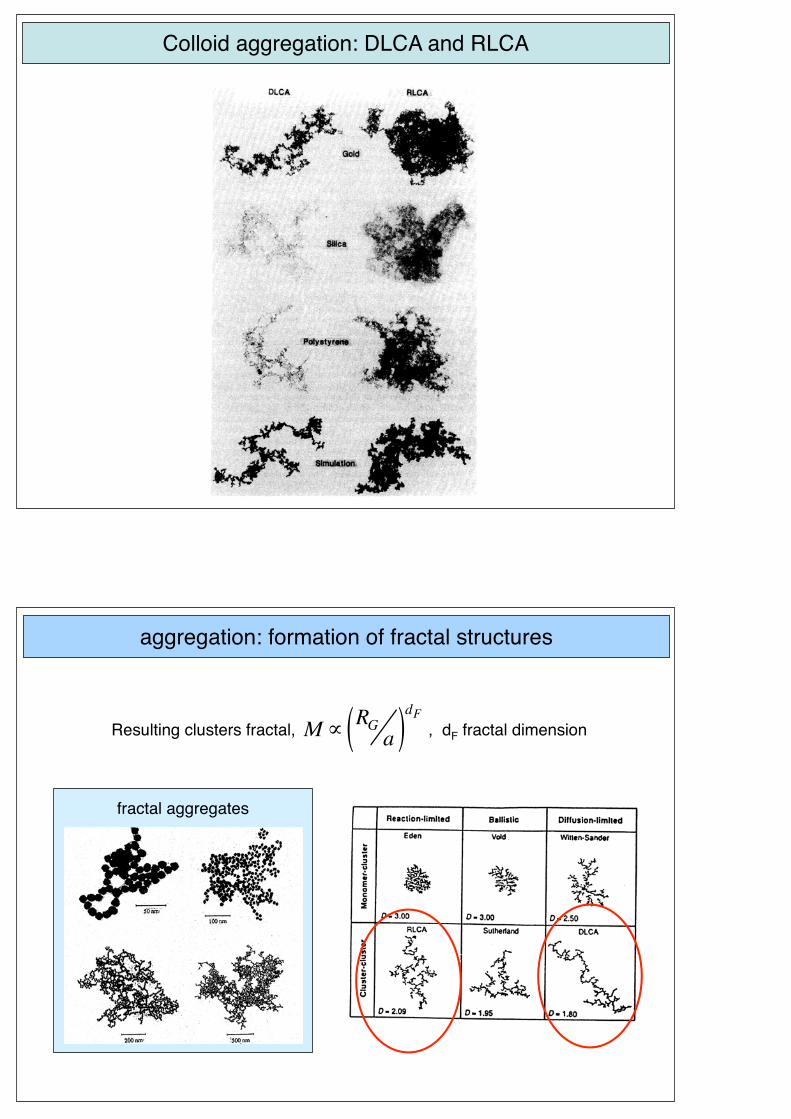
Colloid aggregation: DLCA and RLCA
Resulting clusters fractal, , dF fractal dimensionM ∝ RGa( )
dF
fractal aggregates
aggregation: formation of fractal structures