Preliminary QUARTERLY REPORT
September 2014
External Sector Statistics Unit
Economic Information & Publications Department RESEARCH AND ECONOMIC PROGRAMMING DIVISION
THE BALANCE OF
PAYMENTS
External Sector Statistics Unit Economic Information & Publications
Department RESEARCH AND ECONOMIC PROGRAMMING DIVISION
BANK OF JAMAICA
P.O. Box 621 Kingston, Jamaica

I S S N 0 7 9 9 3 2 9 3

THE BALANCE OF PAYMENTS
Preliminary QUARTERLY REPORT
September 2014
External Sector Statistics Unit Economic Information & Publications Department
RESEARCH AND ECONOMIC PROGRAMMING DIVISION BANK OF JAMAICA
P.O. BOX 621 Kingston, Jamaica

Copyright © 2015
Bank of Jamaica Nethersole Place
P.O. Box 621 Kingston, Jamaica, W.I.
All rights reserved The material in this publication is copyrighted. Copying and/or transmitting portions or all of this work without permission may be a violation of applicable law. The Bank of Jamaica encourages dissemination of its work and will normally grant permission promptly to reproduce portions of the work. For permission to photocopy or reprint any part of this work, please send a request to Economic Information and Publications Department, Bank of Jamaica, Nethersole Place, P.O. Box 621, Kingston, Jamaica, Telephone: (876) 922-0750-9, Fax: (876) 967-4265, Email: [email protected].
ISSN 0799-3293
Printed in Jamaica
5
TABLE OF CONTENTS
Pages
Introduction to the Balance of Payments Manual 6th Edition 1
Balance of Payments: July to September 2014 Quarter 3
Balance of Payments: April to September 2014/15 5
Balance of Payments Analytical Presentation 7
Historical Balance of Payments Tables 9
Glossary (BPM6) 12

6
This page was intentionally left blank

1
Background to BPM6
Since the first edition of the Balance of Payments Manual (BPM) was published in 1948,
developments in global transactions have created the need for amendments to the publication,
which adequately capture international economic transactions. Currently, the manual utilized by
most economies is the Fifth Edition (BPM5), which was published in 1993. However, the Sixth
Edition (BPM6) of the manual was released in 2009 and is titled the Balance of Payments and
International Investment Position Manual. This improved compilation methodology provides
detailed information on Financial Account transactions, among other changes. This new
presentation of Balance of Payments data is aimed at enhancing the understanding of the types of
financing and investments associated with the activities reflected in Current Account and Capital
Account.
Understanding BPM6
One major change in the sixth edition of the Balance of Payments (BOP) manual is that the Capital
Account will no longer be grouped with the Financial Account, but with the Current Account
instead. The overall balance from the Current and the Capital account is now referred to as Net
Lending or Borrowing. Also, the use of debits and credits for the Financial Account is replaced by
Net Acquisition of Financial Assets and the Net Incurrence of Liabilities. BPM6 also introduces the
categories of Primary and Secondary Income, which are conceptually consistent with the System of
National Accounts (SNA). Primary Income encompasses returns that accrue to institutional units
for their contribution to the production process or for the provision of financial assets and renting of
natural resources, while Secondary Income represents Current Transfers between residents and
non-residents. Please see mapping of BPM5 terminologies with the new terminologies found in
BPM6 on next page.
Introduction to the Balance of Payments Manual 6th
Edition

2
Comparison of BOP Presentations
Old Terminology New Terminology
Goods + Services = Goods & Services
Current a/c + Capital a/c = Net lending (+) / Net borrowing (-)

3
Balance of Payments: July to September 2014 Quarter
Table 1
Balance of Payments
July-September 2014
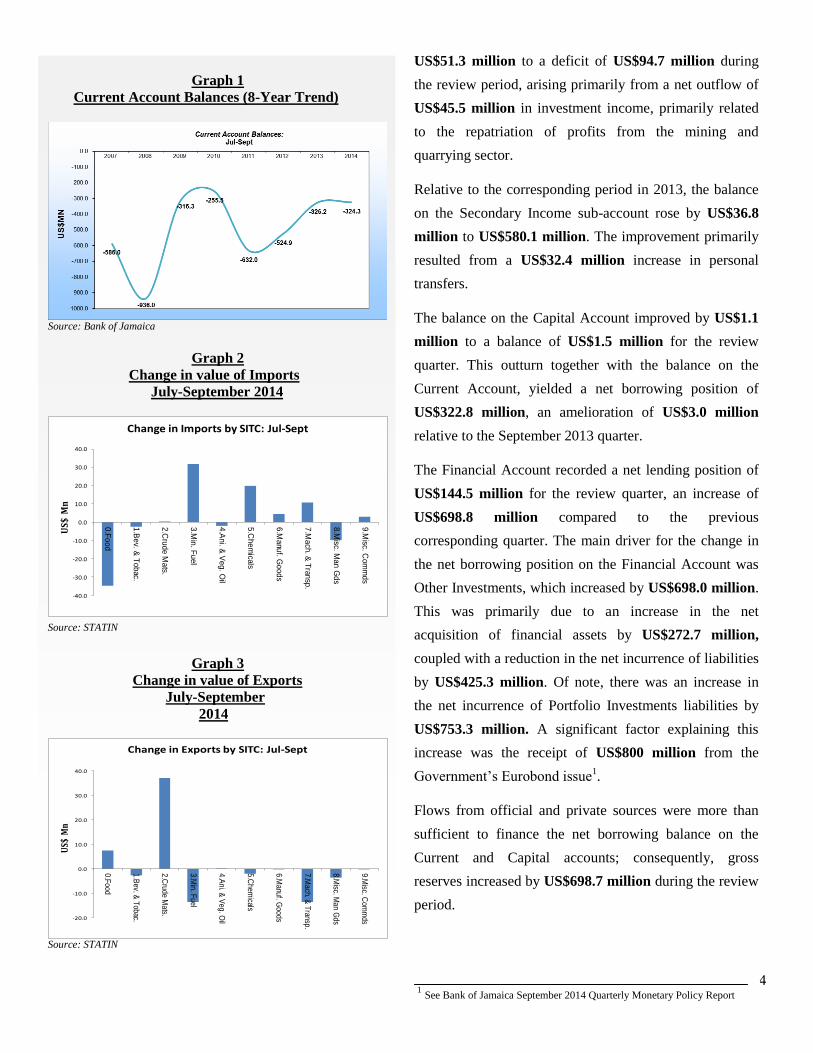
For the September 2014 quarter, there was a Current
Account deficit of US$324.3 million, representing an
improvement of US$1.9 million relative to the
corresponding period in 2013 (Table 1). The outturn for
the review quarter represents a continuation of the
improvement in the Current Account for September
quarters, since 2012 (Graph 1). The improved outturn for
the review period emanated from the Goods & Services
and Secondary Income sub-accounts.
The improvement in the Goods & Services balance was
attributable to a larger increase in the exports of Goods
and Services relative to the increase in the imports of
Goods and Services (Table 1). Goods imports increased
by US$20.0 million to US$1 304.9 million. This increase
was primarily driven by increases of US$31.9 million and
US$19.8 million in Mineral Fuel and Chemical imports,
respectively (Graph 2). This was partially offset by a
US$34.8 million decrease in food imports, particularly
reported in cereal and cereal preparations. Goods exports
increased by US$10.6 million to US$373.4 million,
primarily as a result of a US$37.2 million increase in the
exports of crude materials, in particular Alumina, and a
US$7.4 million increase in the export of food. This was
partially offset by a US$13.6 million decrease in
Machinery & Transport goods exports as well as a
US$13.5 million decrease in Mineral Fuel exports (Graph
3).
There was an increase of US$25.9 million to US$121.7
million in the balance on the Services sub-account for the
review period. This resulted primarily from an increase of
US$45.1 million in travel services, which was partially
offset by decreases of US$9.6 million and US$6.5
million in other business services and insurance &
pension services, respectively.
The Primary Income sub-account deteriorated by
4
Graph 1
Current Account Balances (8-Year Trend)
Source: Bank of Jamaica
Graph 2
Change in value of Imports
July-September 2014
-40.0
-30.0
-20.0
-10.0
0.0
10.0
20.0
30.0
40.0
0.F
oo
d
1.B
ev. &
To
bac.
2.C
rud
e M
ats.
3.M
in. F
ue
l
4.A
ni. &
Ve
g. O
il
5.C
he
micals
6.M
anu
f. Go
od
s
7.M
ach. &
Tran
sp.
8.M
isc. Ma
n G
ds
9.M
isc. Co
mm
ds
US$
Mn
Change in Imports by SITC: Jul-Sept
Graph 3
Change in value of Exports
July-September
2014
-20.0
-10.0
0.0
10.0
20.0
30.0
40.0
0.Food
1.Bev. &
Tobac.
2.Crude M
ats.
3.Min. F
uel
4.Ani. &
Veg. O
il
5.Chem
icals
6.Manuf. G
oods
7.Mach. &
Transp.
8.Misc. M
an Gds
9.Misc. C
omm
ds
US$
Mn
Change in Exports by SITC: Jul-Sept
Source: STATIN
US$51.3 million to a deficit of US$94.7 million during
the review period, arising primarily from a net outflow of
US$45.5 million in investment income, primarily related
to the repatriation of profits from the mining and
quarrying sector.
Relative to the corresponding period in 2013, the balance
on the Secondary Income sub-account rose by US$36.8
million to US$580.1 million. The improvement primarily
resulted from a US$32.4 million increase in personal
transfers.
The balance on the Capital Account improved by US$1.1
million to a balance of US$1.5 million for the review
quarter. This outturn together with the balance on the
Current Account, yielded a net borrowing position of
US$322.8 million, an amelioration of US$3.0 million
relative to the September 2013 quarter.
The Financial Account recorded a net lending position of
US$144.5 million for the review quarter, an increase of
US$698.8 million compared to the previous
corresponding quarter. The main driver for the change in
the net borrowing position on the Financial Account was
Other Investments, which increased by US$698.0 million.
This was primarily due to an increase in the net
acquisition of financial assets by US$272.7 million,
coupled with a reduction in the net incurrence of liabilities
by US$425.3 million. Of note, there was an increase in
the net incurrence of Portfolio Investments liabilities by
US$753.3 million. A significant factor explaining this
increase was the receipt of US$800 million from the
Government’s Eurobond issue1.
Flows from official and private sources were more than
sufficient to finance the net borrowing balance on the
Current and Capital accounts; consequently, gross
reserves increased by US$698.7 million during the review
period.
Source: STATIN
1 See Bank of Jamaica September 2014 Quarterly Monetary Policy Report
(Page 25)

5
Balance of Payments: April to September 2014
Table 2
Balance of Payments
April-September 2014/15
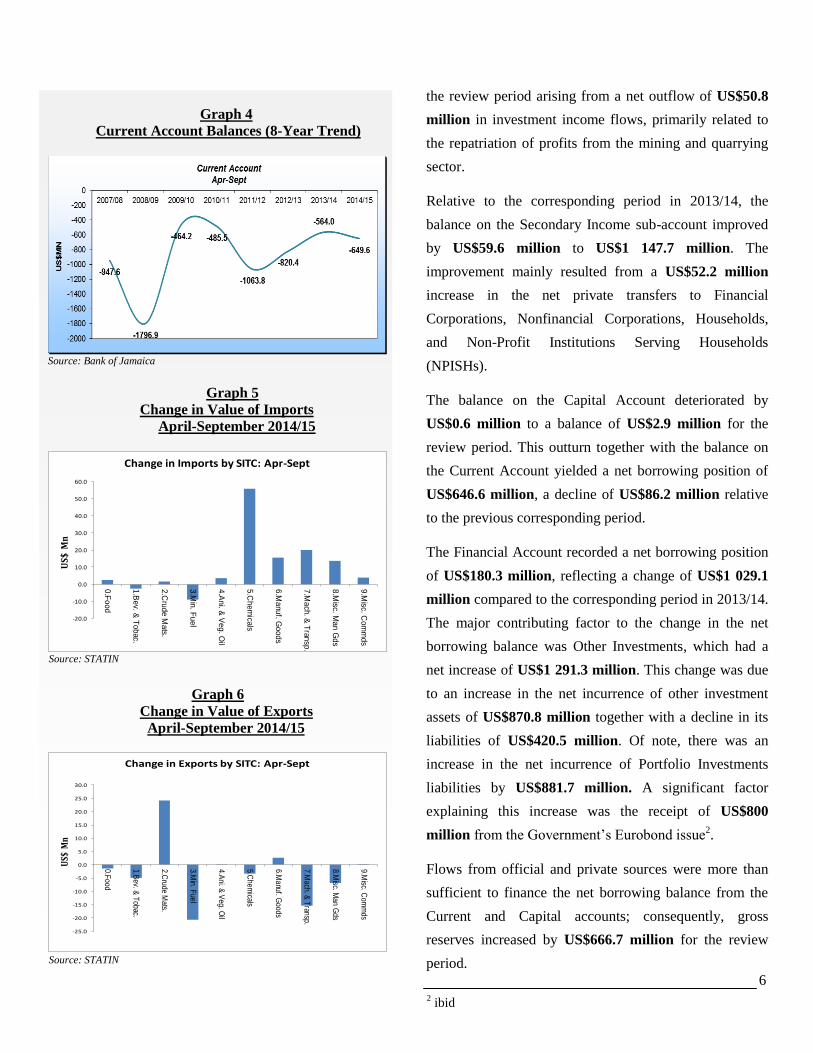
The Current Account balance for April to September
2014/15 deteriorated by US$85.6 million to a deficit of
US$649.6 million, relative to the previous corresponding
period (Table 2). The outturn for the review period
represents a reversal of the improvement in this indicator
relative to the previous corresponding period (Graph 4).
The outturn for the review period emanated primarily
from deteriorations in the Goods & Services and Primary
Income sub-accounts which were partially offset by the
improvement in the Secondary Income account.
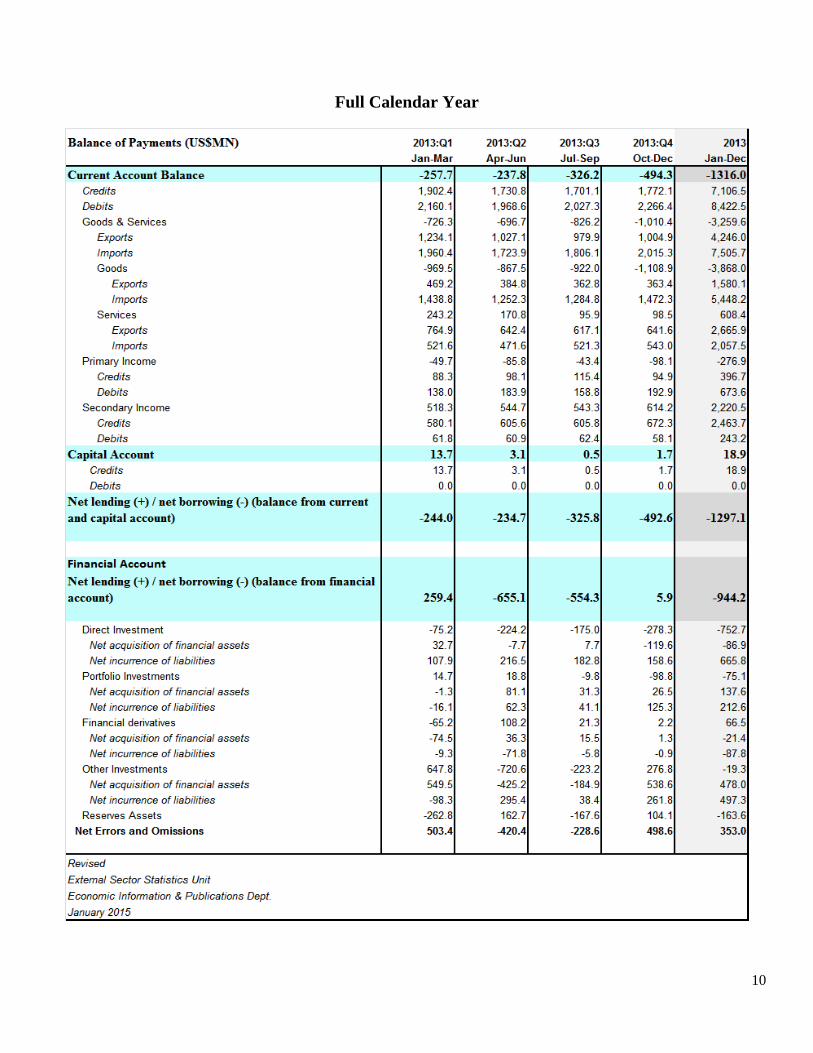
The deterioration in the Goods and Services sub-account
was attributable to the increase in the imports of Goods
& Services which outpaced the increase in the exports of
Goods & Services. For the Goods sub-account, the
deficit deteriorated to US$1 894.6 million, relative to the
previous corresponding period which recorded a deficit
of US$1 789.6 million (Table 2). Imports of goods
increased by US$86.5 million to US$2 623.7 million.
The increase was primarily driven by US$55.8 million,
US$20.1 million and US$15.5 million increases in
Chemicals, Machinery & Transport and Manufactured
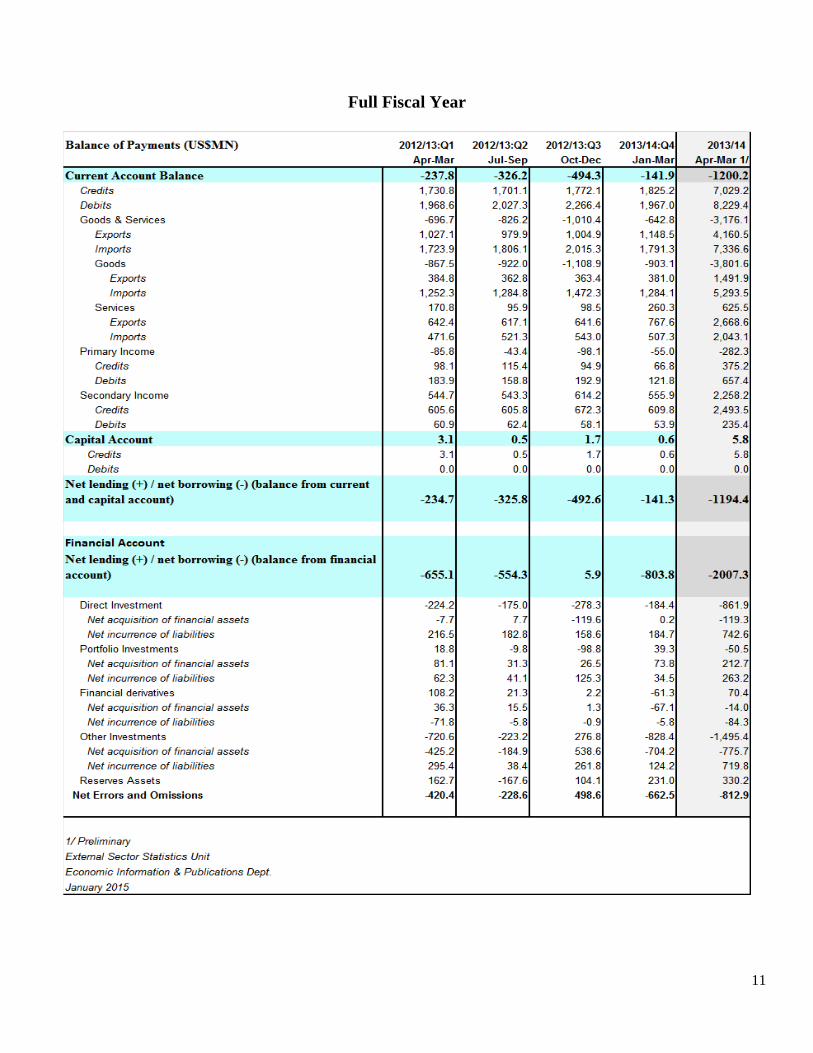
goods imports, respectively (Graph 5). Exports of goods
decreased by US$18.5 million to US$729.1 million,
primarily as a result of a decline of US$20.7 million in
Mineral Fuel exports.
The balance on the Services sub-account improved by
US$17.7 million to US$284.4 million for the review
period which resulted primarily from an improvement of
US$80.6 million in net Travel flows for the period. This
was partially offset by declines in US$22.4 million,
US$18.3 million and US$16.8 million in flows from
insurance & pension services, other business services
and transportation services, respectively.
The Primary Income sub-account deteriorated by
US$57.9 million to a deficit of US$187.1 million during
6
Graph 4
Current Account Balances (8-Year Trend)
Source: Bank of Jamaica
Graph 5
Change in Value of Imports
April-September 2014/15
-20.0
-10.0
0.0
10.0
20.0
30.0
40.0
50.0
60.0
0.F
oo
d
1.B
ev. &
To
bac.
2.C
rud
e M
ats.
3.M
in. F
ue
l
4.A
ni. &
Ve
g. O
il
5.C
he
micals
6.M
anu
f. Go
od
s
7.M
ach. &
Tran
sp.
8.M
isc. Ma
n G
ds
9.M
isc. Co
mm
ds
US$
Mn
Change in Imports by SITC: Apr-Sept
Graph 6
Change in Value of Exports
April-September 2014/15
-25.0
-20.0
-15.0
-10.0
-5.0
0.0
5.0
10.0
15.0
20.0
25.0
30.0
0.Food
1.Bev. &
Tobac.
2.Crude M
ats.
3.Min. F
uel
4.Ani. &
Veg. O
il
5.Chem
icals
6.Manuf. G
oods
7.Mach. &
Transp.
8.Misc. M
an Gds
9.Misc. C
omm
ds
US$
Mn
Change in Exports by SITC: Apr-Sept
the review period arising from a net outflow of US$50.8
million in investment income flows, primarily related to
the repatriation of profits from the mining and quarrying
sector.
Relative to the corresponding period in 2013/14, the
balance on the Secondary Income sub-account improved
by US$59.6 million to US$1 147.7 million. The
improvement mainly resulted from a US$52.2 million
increase in the net private transfers to Financial
Corporations, Nonfinancial Corporations, Households,
and Non-Profit Institutions Serving Households
(NPISHs).
The balance on the Capital Account deteriorated by
US$0.6 million to a balance of US$2.9 million for the
review period. This outturn together with the balance on
the Current Account yielded a net borrowing position of
US$646.6 million, a decline of US$86.2 million relative
to the previous corresponding period.
The Financial Account recorded a net borrowing position
of US$180.3 million, reflecting a change of US$1 029.1
million compared to the corresponding period in 2013/14.
The major contributing factor to the change in the net
borrowing balance was Other Investments, which had a
net increase of US$1 291.3 million. This change was due
to an increase in the net incurrence of other investment
assets of US$870.8 million together with a decline in its
liabilities of US$420.5 million. Of note, there was an
increase in the net incurrence of Portfolio Investments
liabilities by US$881.7 million. A significant factor
explaining this increase was the receipt of US$800
million from the Government’s Eurobond issue2.
Flows from official and private sources were more than
sufficient to finance the net borrowing balance from the
Current and Capital accounts; consequently, gross
reserves increased by US$666.7 million for the review
period.
Source: STATIN
Source: STATIN
2 ibid

7
Review Quarter
Balance of Payments Analytical Presentation

8
Review Fiscal Year-To-Date

9
Recent Five Quarters
Historical Balance of Payments Tables
10
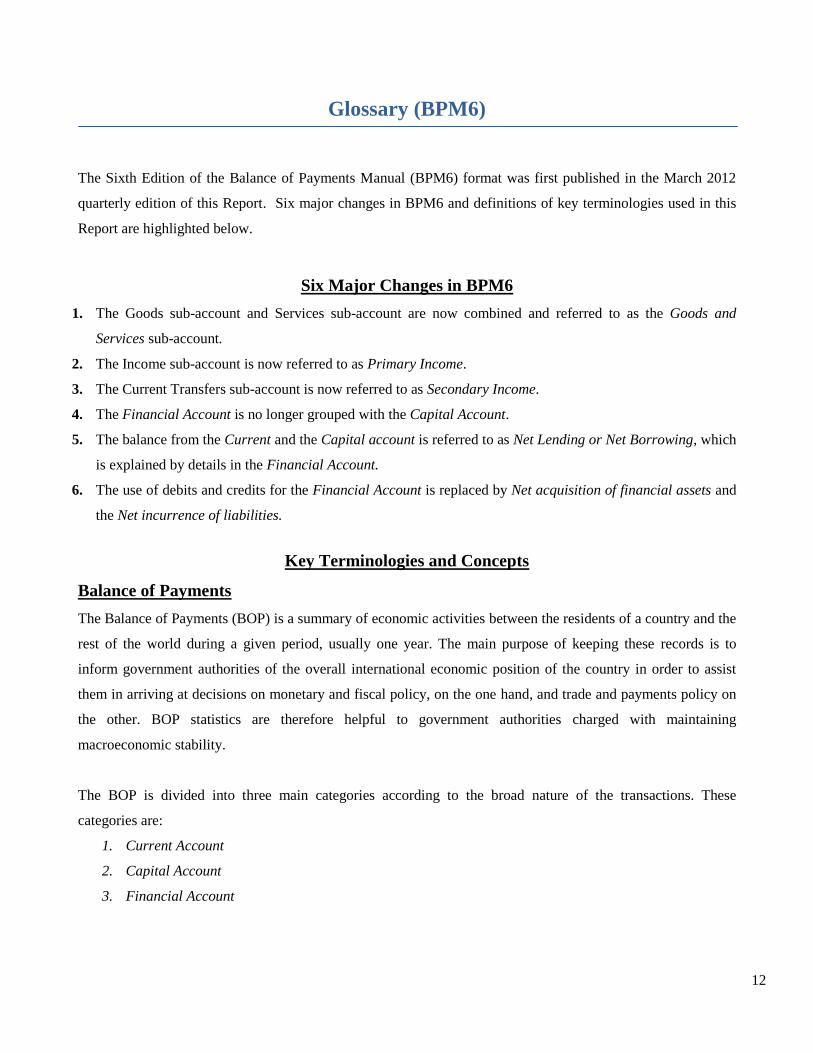
Full Calendar Year
11
Full Fiscal Year
12
Glossary (BPM6)
The Sixth Edition of the Balance of Payments Manual (BPM6) format was first published in the March 2012
quarterly edition of this Report. Six major changes in BPM6 and definitions of key terminologies used in this
Report are highlighted below.
Six Major Changes in BPM6
1. The Goods sub-account and Services sub-account are now combined and referred to as the Goods and
Services sub-account.
2. The Income sub-account is now referred to as Primary Income.
3. The Current Transfers sub-account is now referred to as Secondary Income.
4. The Financial Account is no longer grouped with the Capital Account.
5. The balance from the Current and the Capital account is referred to as Net Lending or Net Borrowing, which
is explained by details in the Financial Account.
6. The use of debits and credits for the Financial Account is replaced by Net acquisition of financial assets and
the Net incurrence of liabilities.
Key Terminologies and Concepts
Balance of Payments
The Balance of Payments (BOP) is a summary of economic activities between the residents of a country and the
rest of the world during a given period, usually one year. The main purpose of keeping these records is to
inform government authorities of the overall international economic position of the country in order to assist
them in arriving at decisions on monetary and fiscal policy, on the one hand, and trade and payments policy on
the other. BOP statistics are therefore helpful to government authorities charged with maintaining
macroeconomic stability.
The BOP is divided into three main categories according to the broad nature of the transactions. These
categories are:
1. Current Account
2. Capital Account
3. Financial Account

13
The sum of the balances on the Current and Capital accounts represents the Net Lending (surplus) or Net
Borrowing (deficit) by the economy with the rest of the world. This is conceptually equal to the net balance of
the Financial Account. In other words, the Financial Account measures how the Net Lending to or Net
Borrowing from non-residents is financed.
1. Current Account
The current account includes all transactions (excluding those recorded in the capital and financial account)
between resident and non-resident entities that involve economic value. This account is sub-divided into:
a. Goods and Services
b. Primary Income, and
c. Secondary Income
a. The Goods and Services account covers merchandise trade, travel, transportation and other services.
i. Merchandise Trade records the value of exports and imports, of tangible goods, including those of the
free-zones and goods procured in ports by international carriers.
ii. Travel covers goods and services acquired from an economy by non-resident travellers for business
and personal purposes during their visits (of less than one year). Expenditures made by seasonal workers
(e.g. Jamaican farm workers) and those for educational and health-related purposes made by students
and medical patients are recorded in this sub-account.
iii. Transportation covers all transportation services (sea, air and land), bought and sold, that involve the
carriage of passengers, movement of goods (freight), charter of carriers with crew and other supporting
services.
iv. Other Services consist of the purchase and sale of: communication services, construction services,
insurance services, financial services, computer and information services, royalties and licences fees and
government services.
b. Primary Income represents the return that accrues to institutional units for their contribution to the
production process or for the provision of financial assets and renting natural resources to other
institutional units. It encompasses the compensation of employees, that is, salaries, wages and benefits of
seasonal and other non-resident workers. In addition, it includes investment income that consists of
dividends, profits, reinvested earnings, interest on debt and income on portfolio investment.
c. Secondary Income shows current transfers between residents and non-residents. It covers transactions
such as taxes on income, workers' remittances, and premiums and claims on non-life insurance.

14

15
2. Capital Account
The Capital Account covers:
(i) Capital Transfers include the transfer of ownership of fixed assets, the transfer of funds linked
to disposal/acquisition of fixed assets and the cancellation of debt by creditors.
(ii) Acquisition/disposal of non-produced, non-financial assets mainly involves intangibles such
as patents and leases. It also includes purchases and sales of land by foreign embassies.
3. Financial Account
The Financial Account records transactions that directly affect the wealth and debt of the country and
records transactions that involve financial assets and liabilities between residents and non-residents.
This account covers:
(i) Direct investment is the category of international investment in which a resident entity in one
economy acquires or disposes of 10 per cent or more of the ordinary shares or voting power of
an enterprise located in another economy and has an effective voice in management.
(ii) Portfolio Investment covers transactions in equity securities and debt securities. With respect
to equity, a portfolio investment would imply less than 10 per cent ownership of the voting
power of an enterprise located in another country. Debt securities include bonds and notes,
money market instruments and financial derivatives.
(iii) Financial Derivatives (other than reserves) covers transactions of forward-type contracts and
options traded in financial markets used to transfer risks linked to another specific financial
instrument or indicator or commodity.
(iv) Other investment is a residual category that includes all financial transactions not covered in
Direct Investment, Portfolio Investment or Reserve Assets. It includes: (i) Loans to finance
trade (ii) Insurance, pension and standardized guarantee schemes; (iii) trade credits and
advances; and (iv) Other accounts receivable/payable.
(v) Reserve Assets represent the foreign exchange which the country has available for financing an
imbalance of payments with the rest of the world.

16
BANK OF JAMAICA Nethersole Place
P.O. Box 621 Kingston, Jamaica
Telephone: 876 922 0750 Internet: www.boj.org.jm
I S S N 0 7 9 9 3 2 9 3