The Association of Maximum Body Weight on theDevelopment of Type 2 Diabetes and MicrovascularComplications: MAXWEL StudySoo Lim1,5,7, Kyoung Min Kim1, Min Joo Kim3, Se Joon Woo2, Sung Hee Choi1, Kyong Soo Park4, Hak
Chul Jang1*, James B. Meigs5,7, Deborah J. Wexler6,7
1Department of Internal Medicine, Seoul National University College of Medicine and Seoul National University Bundang Hospital, Seongnam, Korea, 2Department of
Ophthalmology, Seoul National University College of Medicine and Seoul National University Bundang Hospital, Seongnam, Korea, 3Department of Internal Medicine,
Korea Cancer Center Hospital, Seoul, Korea, 4Department of Internal Medicine, Seoul National University College of Medicine, Seoul, Korea, 5Division of General
Medicine, Harvard Medical School, Boston, Massachusetts, United States of America, 6Diabetes Center, Harvard Medical School, Boston, Massachusetts, United States of
America, 7Massachusetts General Hospital and Harvard Medical School, Boston, Massachusetts, United States of America
Abstract
Background: Obesity precedes the development of type 2 diabetes (T2D). However, the relationship between themagnitude and rate of weight gain to T2D development and complications, especially in non-White populations, hasreceived less attention.
Methods and Findings: We determined the association of rate and magnitude of weight gain to age at T2D diagnosis(AgeT2D), HbA1c at T2D diagnosis (HbA1cT2D), microalbuminuria, and diabetic retinopathy after adjusting for sex, BMI at age20 years, lifestyles, family history of T2D and/or blood pressure and lipids in 2164 Korean subjects aged$30 years and newlydiagnosed with diabetes. Body weight at age 20 years (Wt20y) was obtained by recall or from participants’ medical, school,or military records. Participants recalled their maximum weight (Wtmax) prior to T2D diagnosis and age at maximum weight(Agemax_wt). The rate of weight gain (Ratemax_wt) was calculated from magnitude of weight gain (DWt=Wtmax–Wt20y)divided by DTime (Agemax_wt –20 years). The mean Agemax_wt and AgeT2D were 41.5610.9 years and 50.1610.5 years,respectively. The Wt20y and Wtmax were 59.9610.5 kg and 72.9611.4 kg, respectively. The Ratemax_wt was 0.5660.50 kg/year. After adjusting for risk factors, greater DWt and higher Ratemax_wt were significantly associated with earlier AgeT2D,higher HbA1cT2D after additional adjusting for AgeT2D, and microalbuminuria after further adjusting for HbA1cT2D and lipidprofiles. Greater DWt and higher Ratemax_wt were also significantly associated with diabetic retinopathy.
Conclusions: This finding supports public health recommendations to reduce the risk of T2D and its complications bypreventing weight gain from early adulthood.
Citation: Lim S, Kim KM, Kim MJ, Woo SJ, Choi SH, et al. (2013) The Association of Maximum Body Weight on the Development of Type 2 Diabetes andMicrovascular Complications: MAXWEL Study. PLoS ONE 8(12): e80525. doi:10.1371/journal.pone.0080525
Editor: Noel Christopher Barengo, University of Tolima, Colombia
Received June 17, 2013; Accepted October 14, 2013; Published December 4, 2013
Copyright: � 2013 Lim et al. This is an open-access article distributed under the terms of the Creative Commons Attribution License, which permits unrestricteduse, distribution, and reproduction in any medium, provided the original author and source are credited.
Funding: This study was supported by the National Research Foundation grant funded by the Korea government (2006-2005410). SL receives support from SeoulNational University Bundang Hospital. DJW is supported by an NIDDK Career Development Award (K23 DK 080228-05). The funders had no role in study design,data collection and analysis, decision to publish, or preparation of the manuscript.
Competing Interests: The authors have declared that no competing interests exist.
* E-mail: [email protected]
Introduction
The world prevalence of diabetes among adults (aged 20–79
years) was 6.4%, affecting 285 million adults, in 2010, and will
increase to 7.7%, and 439 million adults by 2030 [1]. Primary
prevention of diabetes and its complications is now an important
public health priority worldwide [2].
Obesity is the major risk factor for developing type 2 diabetes
mellitus (T2D) [3]. Obesity increases insulin resistance in tissues
such as muscle, liver, and adipose tissue. In response to this
condition, the pancreatic beta-cells increase insulin production to
decrease blood glucose level. Thus, obesity has direct connection
with insulin resistance; a condition characterized by increased
insulin production and impaired glucose tolerance [4]. Many
studies have reported associations between body mass index (BMI)
and T2D [5–8]. These studies have shown that besides obesity per
se, an increase in body weight of 3–20 kg is associated with an
elevated risk of incidence of T2D. Prevention of weight gain is
beneficial for the prevention of T2D in many different ethnicities
[9–11].
While obesity antedates the development of T2D by some years,
quantitative investigation of the relationship between magnitude
and rate of weight gain and the development of T2D has been
relatively limited, especially in non-White populations. The
present study was designed to examine the association of
development of T2D and glycemia at diagnosis with weight at
age 20 years, maximum lifetime weight before T2D diagnosis, age
at maximum weight, and the rate of weight gain, and to identify
which of these variables were most predictive of development of
PLOS ONE | www.plosone.org 1 December 2013 | Volume 8 | Issue 12 | e80525
T2D, glucose control, and microvascular complications such as
microalbuminuria and diabetic nephropathy. We hypothesized
that rapid and greater weight gain would increase the risk of T2D
diagnosis and its complications.
Methods
Study PopulationThe MAXWEL cohort was established in 2006 to investigate
the effect of maximum body weight and time interval to maximum
body weight on the development of T2D. We consecutively
screened all individuals (n = 5,321) aged over 30 years who visited
the diabetes clinic first for initial diabetes evaluation at Seoul
National University Bundang Hospital (SNUBH), Seongnam,
Korea, from January 2007 to December 2009.
After excluding previously diagnosed cases with diabetes, we
selected 2977 subjects who had confirmed T2D by glycosylated
hemoglobin (HbA1c) $6.5%, based on the American Diabetes
Association diagnosis criteria for diabetes [12], and not on
antidiabetic medications for more than 1 week before. Of these,
those with type 1 diabetes (measured by Glutamic Acid
Decarboxylase antibody, n = 32), gestational diabetes (n = 12), or
diabetes with secondary causes (n = 16). Patients with malignancy
(n = 44), chronic obstructive pulmonary disease (n = 68), depres-
sion and/or eating disorder (n = 39), chronic gastrointestinal
disorders (n = 39), any medication for weight control for more
than 3 months (n = 37), and organ transplantation (n= 4) were
excluded. Another 522 subjects were excluded because they were
not able to recall their maximum weight or age at maximum
weight. They were similar to other participants in anthropometric
and biochemical parameters such as age, sex, and glucose control.
A total of 2164 newly detected T2D subjects (1220 men and 944
women) men from 2007 to 2009 were included in the current
analysis. Medical history and biochemical tests including fasting
glucose, HbA1c, and lipid profiles were obtained at the first visit.
The protocol was reviewed and approved by the institutional
review board (IRB) of SNUBH (No. B-0909/083-008) and the
patient informed consent requirement was waived by the IRB.
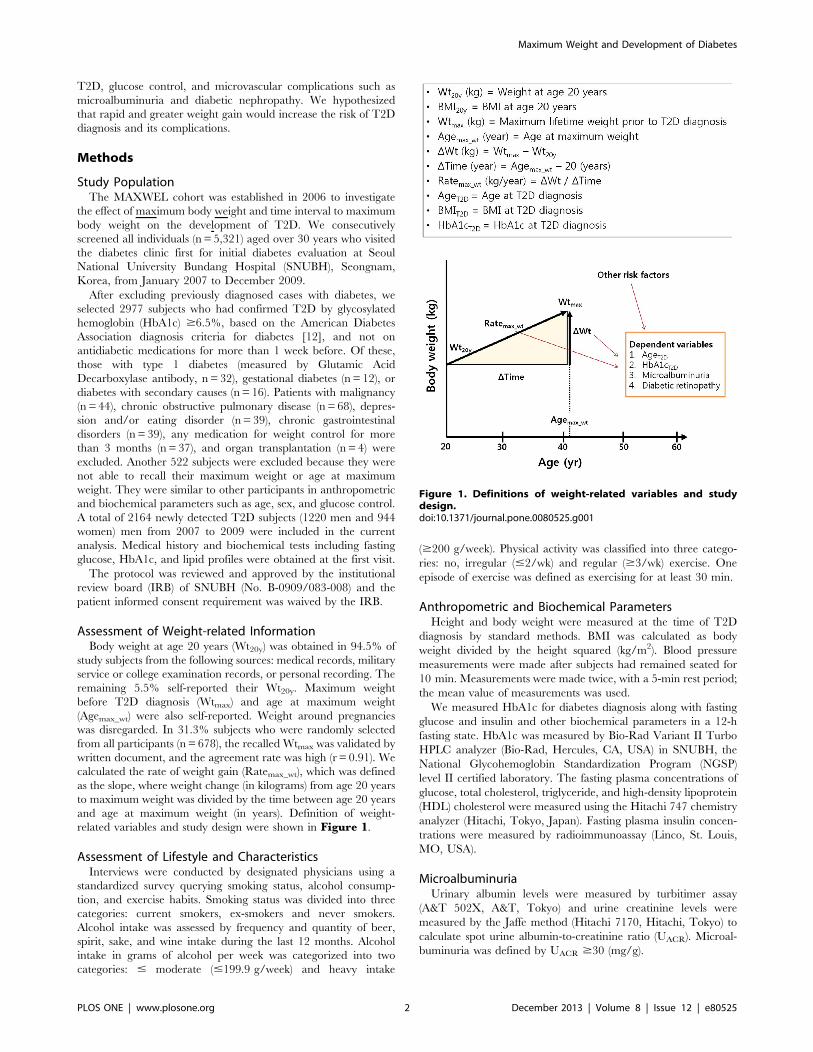
Assessment of Weight-related InformationBody weight at age 20 years (Wt20y) was obtained in 94.5% of
study subjects from the following sources: medical records, military
service or college examination records, or personal recording. The
remaining 5.5% self-reported their Wt20y. Maximum weight
before T2D diagnosis (Wtmax) and age at maximum weight
(Agemax_wt) were also self-reported. Weight around pregnancies
was disregarded. In 31.3% subjects who were randomly selected
from all participants (n = 678), the recalled Wtmax was validated by
written document, and the agreement rate was high (r = 0.91). We
calculated the rate of weight gain (Ratemax_wt), which was defined
as the slope, where weight change (in kilograms) from age 20 years
to maximum weight was divided by the time between age 20 years
and age at maximum weight (in years). Definition of weight-
related variables and study design were shown in Figure 1.
Assessment of Lifestyle and CharacteristicsInterviews were conducted by designated physicians using a
standardized survey querying smoking status, alcohol consump-
tion, and exercise habits. Smoking status was divided into three
categories: current smokers, ex-smokers and never smokers.
Alcohol intake was assessed by frequency and quantity of beer,
spirit, sake, and wine intake during the last 12 months. Alcohol
intake in grams of alcohol per week was categorized into two
categories: # moderate (#199.9 g/week) and heavy intake
($200 g/week). Physical activity was classified into three catego-
ries: no, irregular (#2/wk) and regular ($3/wk) exercise. One
episode of exercise was defined as exercising for at least 30 min.
Anthropometric and Biochemical ParametersHeight and body weight were measured at the time of T2D
diagnosis by standard methods. BMI was calculated as body
weight divided by the height squared (kg/m2). Blood pressure
measurements were made after subjects had remained seated for
10 min. Measurements were made twice, with a 5-min rest period;
the mean value of measurements was used.
We measured HbA1c for diabetes diagnosis along with fasting
glucose and insulin and other biochemical parameters in a 12-h
fasting state. HbA1c was measured by Bio-Rad Variant II Turbo
HPLC analyzer (Bio-Rad, Hercules, CA, USA) in SNUBH, the
National Glycohemoglobin Standardization Program (NGSP)
level II certified laboratory. The fasting plasma concentrations of
glucose, total cholesterol, triglyceride, and high-density lipoprotein
(HDL) cholesterol were measured using the Hitachi 747 chemistry
analyzer (Hitachi, Tokyo, Japan). Fasting plasma insulin concen-
trations were measured by radioimmunoassay (Linco, St. Louis,
MO, USA).
MicroalbuminuriaUrinary albumin levels were measured by turbitimer assay
(A&T 502X, A&T, Tokyo) and urine creatinine levels were
measured by the Jaffe method (Hitachi 7170, Hitachi, Tokyo) to
calculate spot urine albumin-to-creatinine ratio (UACR). Microal-
buminuria was defined by UACR $30 (mg/g).
Figure 1. Definitions of weight-related variables and studydesign.doi:10.1371/journal.pone.0080525.g001
Maximum Weight and Development of Diabetes
PLOS ONE | www.plosone.org 2 December 2013 | Volume 8 | Issue 12 | e80525
Diabetic RetinopathyComplete ophthalmologic examinations including funduscopy
on the entire retina after mydriasis were performed on all patients
by two ophthalmologists. After the thorough funduscopic exam-
ination, patients showing any features of diabetic retinopathy
underwent color fundus photography using mydriatic 45u funduscamera (VX-10a, Kowa Inc., Nagoya, Japan). The presence and
severity of diabetic retinopathy were graded based on international
clinical diabetic retinopathy severity scales proposed by the Global
Diabetic Retinopathy Project Group [13]. Non-proliferative
diabetic retinopathy (NPDR) was defined as the presence of at
least one definite retinal hemorrhage and/or microaneurysm.
Subjects were assigned to the PDR group when retinal neovas-
cularization was visible on retinal photographs.
Statistical AnalysisAll data are presented as the mean and SD, and were analyzed
using SPSS for Windows version 17.0 (SPSS Inc., Chicago, IL,
USA). The distributions of triglycerides and UACR were skewed
(Kolmogorov-Smirnov Z= 1.22 and Z=1.19, both P,0.05).
Those values were normalized by logarithmic transformation for
all analyses. The variables were compared using student’s t or x2
tests. Correlations between variables were analyzed using
Pearson’s correlation.
We compared mean values of AgeT2D, HbA1cT2D and
microalbuminuria, and prevalence of diabetic retinopathy be-
tween the highest and lowest quartile of Ratemax_wt.
To test independent association of weight variables, we
performed three multivariable linear regression models for
AgeT2D, HbA1cT2D and UACR, respectively, and one multivari-
able logistic regression model for diabetic retinopathy.
For AgeT2D, DWt and Ratemax_wt were included as key
independent variables in the multivariable linear regression model
with sex, BMI20y, alcohol consumption, smoking status, exercise
habits and family history of diabetes as covariates. In the
multivariable linear regression analysis for HbA1cT2D, AgeT2Dwas additionally added as a covariate because glycaemic control
might be influenced by age of diagnosis. For log-transformed
UACR, AgeT2D, systolic blood pressure (SBP), diastolic blood
pressure (DBP), HbA1cT2D, and log-transformed triglycerides/
HDL-cholesterol ratio were additionally added to the multivari-
able linear regression model because these variables might be able
to affect kidney function. To assess multicollinearity of the linear
regression models, we checked the variance inflation factor of
variables.
For diabetic retinopathy (combined NPDR and PDR), a
multivariable logistic regression analysis was performed with the
same variables used in the model for UACR; SBP$140 mmHg or
blood pressure medication indicated hypertension to obtain an
odds ratio. Since multiple tests were performed in the analysis, we
adjusted the number (n = 4) of phenotypes, by multiplying P values
by 4. These significance thresholds are conservative given
correlation among the phenotype traits themselves. Statistical
significance was defined as P,0.05.
Results
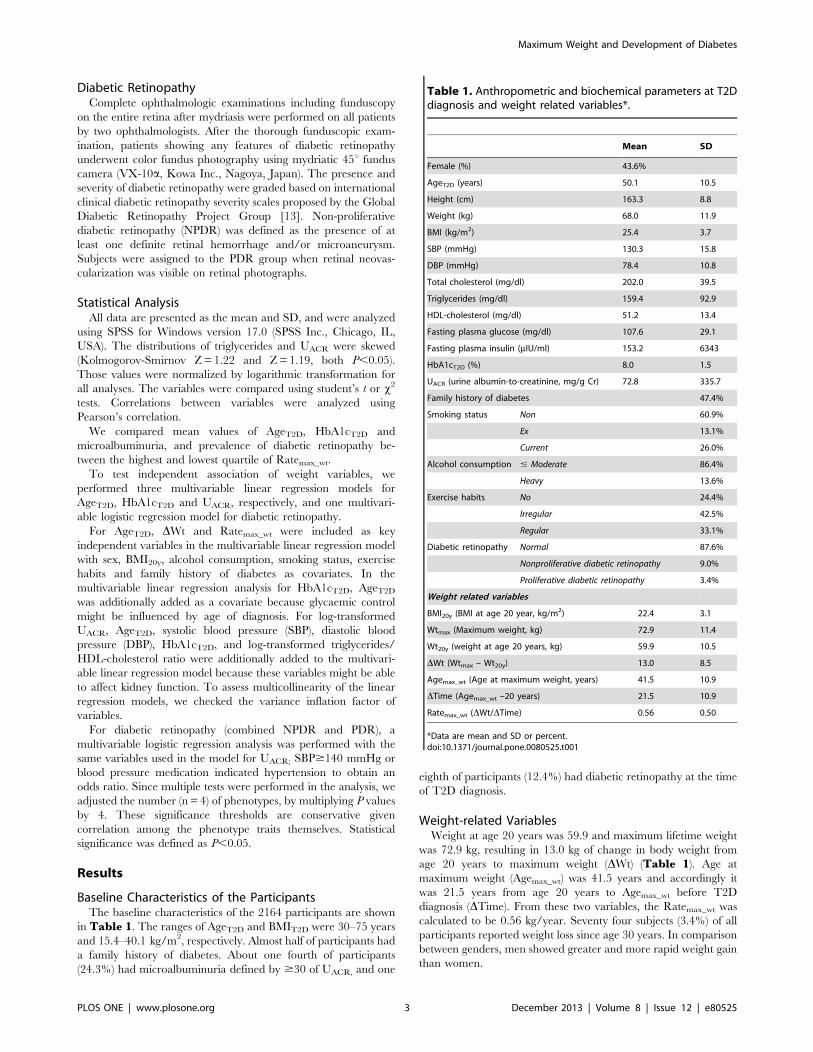
Baseline Characteristics of the ParticipantsThe baseline characteristics of the 2164 participants are shown
in Table 1. The ranges of AgeT2D and BMIT2D were 30–75 years
and 15.4–40.1 kg/m2, respectively. Almost half of participants had
a family history of diabetes. About one fourth of participants
(24.3%) had microalbuminuria defined by $30 of UACR, and one
eighth of participants (12.4%) had diabetic retinopathy at the time
of T2D diagnosis.
Weight-related VariablesWeight at age 20 years was 59.9 and maximum lifetime weight
was 72.9 kg, resulting in 13.0 kg of change in body weight from
age 20 years to maximum weight (DWt) (Table 1). Age at
maximum weight (Agemax_wt) was 41.5 years and accordingly it
was 21.5 years from age 20 years to Agemax_wt before T2D
diagnosis (DTime). From these two variables, the Ratemax_wt was
calculated to be 0.56 kg/year. Seventy four subjects (3.4%) of all
participants reported weight loss since age 30 years. In comparison
between genders, men showed greater and more rapid weight gain
than women.
Table 1. Anthropometric and biochemical parameters at T2Ddiagnosis and weight related variables*.
Mean SD
Female (%) 43.6%
AgeT2D (years) 50.1 10.5
Height (cm) 163.3 8.8
Weight (kg) 68.0 11.9
BMI (kg/m2) 25.4 3.7
SBP (mmHg) 130.3 15.8
DBP (mmHg) 78.4 10.8
Total cholesterol (mg/dl) 202.0 39.5
Triglycerides (mg/dl) 159.4 92.9
HDL-cholesterol (mg/dl) 51.2 13.4
Fasting plasma glucose (mg/dl) 107.6 29.1
Fasting plasma insulin (mIU/ml) 153.2 6343
HbA1cT2D (%) 8.0 1.5
UACR (urine albumin-to-creatinine, mg/g Cr) 72.8 335.7
Family history of diabetes 47.4%
Smoking status Non 60.9%
Ex 13.1%
Current 26.0%
Alcohol consumption # Moderate 86.4%
Heavy 13.6%
Exercise habits No 24.4%
Irregular 42.5%
Regular 33.1%
Diabetic retinopathy Normal 87.6%
Nonproliferative diabetic retinopathy 9.0%
Proliferative diabetic retinopathy 3.4%
Weight related variables
BMI20y (BMI at age 20 year, kg/m2) 22.4 3.1
Wtmax (Maximum weight, kg) 72.9 11.4
Wt20y (weight at age 20 years, kg) 59.9 10.5
DWt (Wtmax – Wt20y) 13.0 8.5
Agemax_wt (Age at maximum weight, years) 41.5 10.9
DTime (Agemax_wt –20 years) 21.5 10.9
Ratemax_wt (DWt/DTime) 0.56 0.50
*Data are mean and SD or percent.doi:10.1371/journal.pone.0080525.t001
Maximum Weight and Development of Diabetes
PLOS ONE | www.plosone.org 3 December 2013 | Volume 8 | Issue 12 | e80525
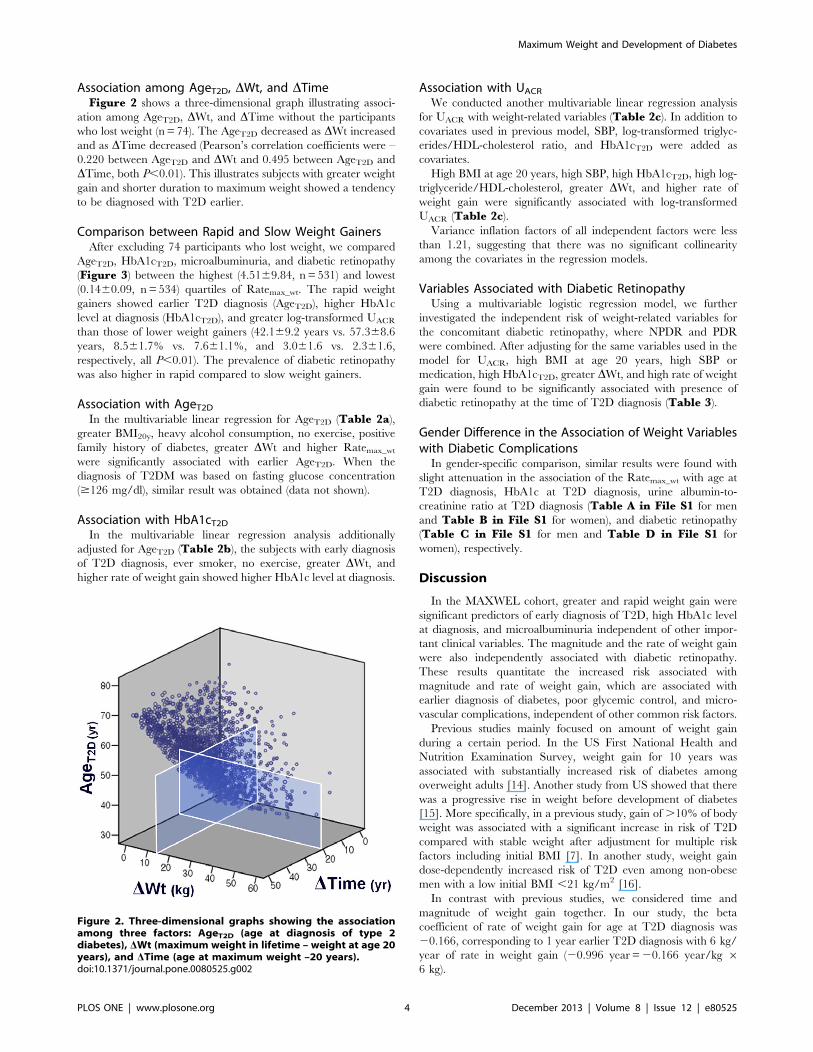
Association among AgeT2D, DWt, and DTimeFigure 2 shows a three-dimensional graph illustrating associ-
ation among AgeT2D, DWt, and DTime without the participants
who lost weight (n = 74). The AgeT2D decreased as DWt increased
and as DTime decreased (Pearson’s correlation coefficients were –
0.220 between AgeT2D and DWt and 0.495 between AgeT2D and
DTime, both P,0.01). This illustrates subjects with greater weight
gain and shorter duration to maximum weight showed a tendency
to be diagnosed with T2D earlier.
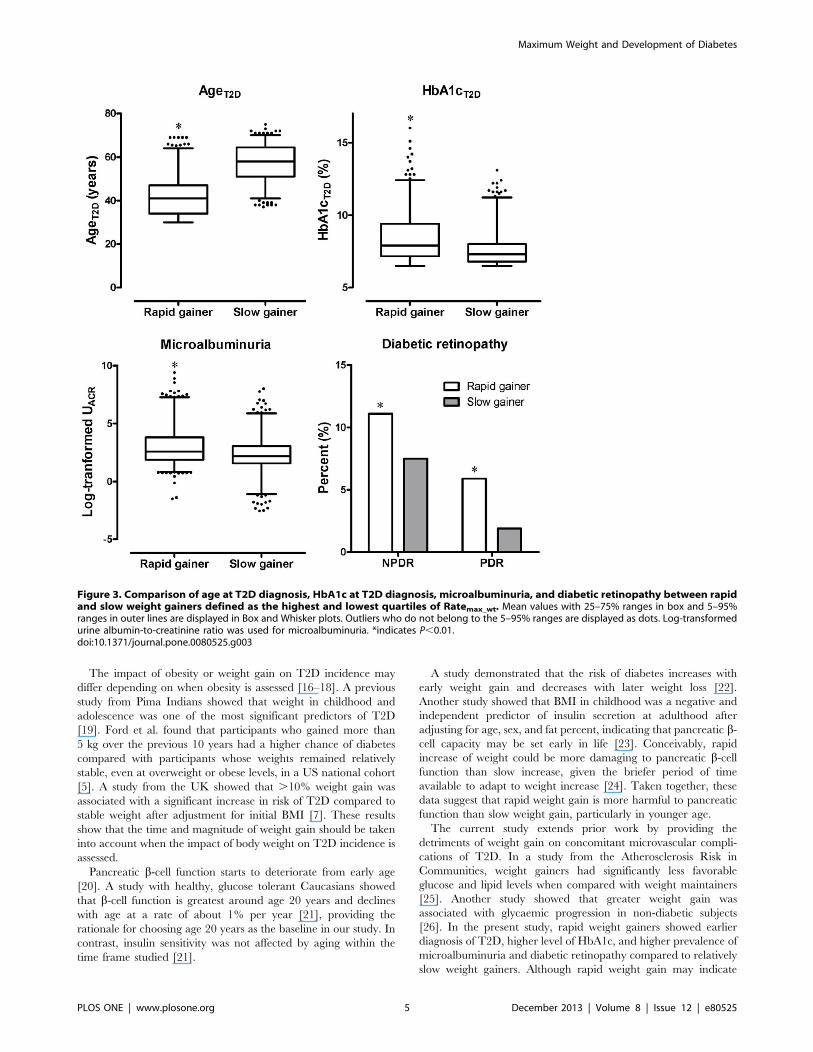
Comparison between Rapid and Slow Weight GainersAfter excluding 74 participants who lost weight, we compared
AgeT2D, HbA1cT2D, microalbuminuria, and diabetic retinopathy
(Figure 3) between the highest (4.5169.84, n = 531) and lowest
(0.1460.09, n = 534) quartiles of Ratemax_wt. The rapid weight
gainers showed earlier T2D diagnosis (AgeT2D), higher HbA1c
level at diagnosis (HbA1cT2D), and greater log-transformed UACR
than those of lower weight gainers (42.169.2 years vs. 57.368.6
years, 8.561.7% vs. 7.661.1%, and 3.061.6 vs. 2.361.6,
respectively, all P,0.01). The prevalence of diabetic retinopathy
was also higher in rapid compared to slow weight gainers.
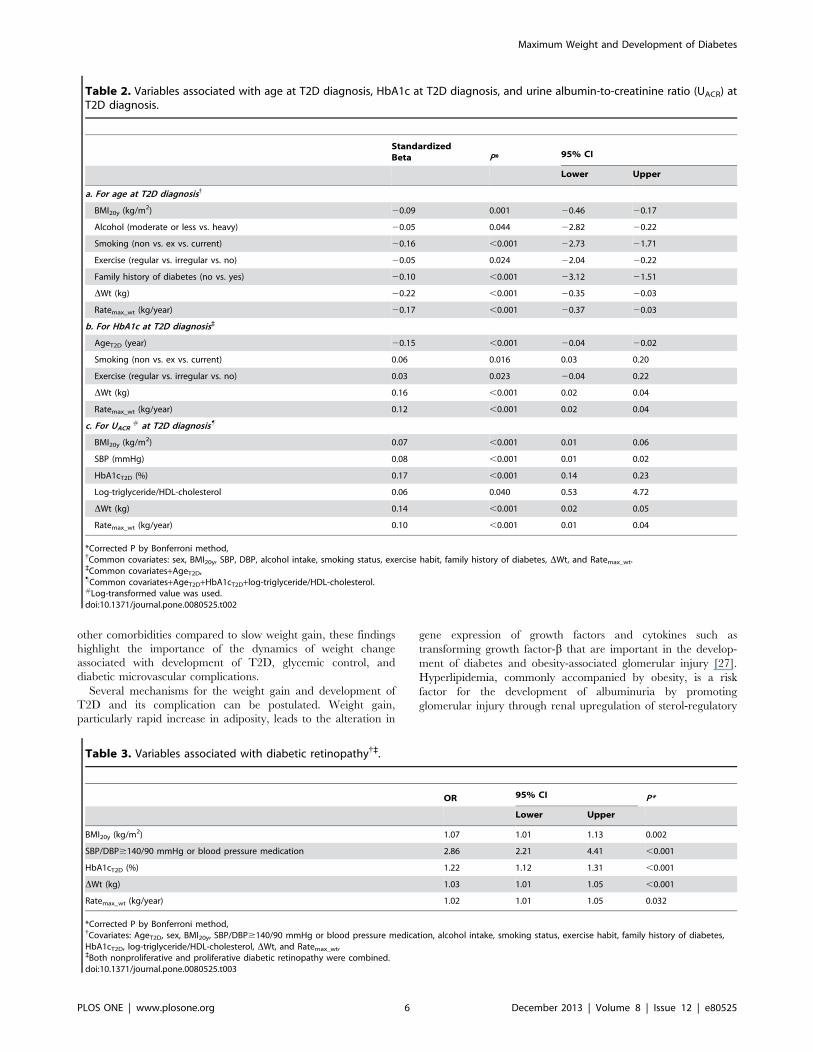
Association with AgeT2DIn the multivariable linear regression for AgeT2D (Table 2a),
greater BMI20y, heavy alcohol consumption, no exercise, positive
family history of diabetes, greater DWt and higher Ratemax_wt
were significantly associated with earlier AgeT2D. When the
diagnosis of T2DM was based on fasting glucose concentration
($126 mg/dl), similar result was obtained (data not shown).
Association with HbA1cT2DIn the multivariable linear regression analysis additionally
adjusted for AgeT2D (Table 2b), the subjects with early diagnosis
of T2D diagnosis, ever smoker, no exercise, greater DWt, and
higher rate of weight gain showed higher HbA1c level at diagnosis.
Association with UACR
We conducted another multivariable linear regression analysis
for UACR with weight-related variables (Table 2c). In addition to
covariates used in previous model, SBP, log-transformed triglyc-
erides/HDL-cholesterol ratio, and HbA1cT2D were added as
covariates.
High BMI at age 20 years, high SBP, high HbA1cT2D, high log-
triglyceride/HDL-cholesterol, greater DWt, and higher rate of
weight gain were significantly associated with log-transformed
UACR (Table 2c).
Variance inflation factors of all independent factors were less
than 1.21, suggesting that there was no significant collinearity
among the covariates in the regression models.
Variables Associated with Diabetic RetinopathyUsing a multivariable logistic regression model, we further
investigated the independent risk of weight-related variables for
the concomitant diabetic retinopathy, where NPDR and PDR
were combined. After adjusting for the same variables used in the
model for UACR, high BMI at age 20 years, high SBP or
medication, high HbA1cT2D, greater DWt, and high rate of weight
gain were found to be significantly associated with presence of
diabetic retinopathy at the time of T2D diagnosis (Table 3).
Gender Difference in the Association of Weight Variableswith Diabetic ComplicationsIn gender-specific comparison, similar results were found with
slight attenuation in the association of the Ratemax_wt with age at
T2D diagnosis, HbA1c at T2D diagnosis, urine albumin-to-
creatinine ratio at T2D diagnosis (Table A in File S1 for men
and Table B in File S1 for women), and diabetic retinopathy
(Table C in File S1 for men and Table D in File S1 for
women), respectively.
Discussion
In the MAXWEL cohort, greater and rapid weight gain were
significant predictors of early diagnosis of T2D, high HbA1c level
at diagnosis, and microalbuminuria independent of other impor-
tant clinical variables. The magnitude and the rate of weight gain
were also independently associated with diabetic retinopathy.
These results quantitate the increased risk associated with
magnitude and rate of weight gain, which are associated with
earlier diagnosis of diabetes, poor glycemic control, and micro-
vascular complications, independent of other common risk factors.
Previous studies mainly focused on amount of weight gain
during a certain period. In the US First National Health and
Nutrition Examination Survey, weight gain for 10 years was
associated with substantially increased risk of diabetes among
overweight adults [14]. Another study from US showed that there
was a progressive rise in weight before development of diabetes
[15]. More specifically, in a previous study, gain of .10% of body
weight was associated with a significant increase in risk of T2D
compared with stable weight after adjustment for multiple risk
factors including initial BMI [7]. In another study, weight gain
dose-dependently increased risk of T2D even among non-obese
men with a low initial BMI ,21 kg/m2 [16].
In contrast with previous studies, we considered time and
magnitude of weight gain together. In our study, the beta
coefficient of rate of weight gain for age at T2D diagnosis was
20.166, corresponding to 1 year earlier T2D diagnosis with 6 kg/
year of rate in weight gain (20.996 year =20.166 year/kg 66 kg).
Figure 2. Three-dimensional graphs showing the associationamong three factors: AgeT2D (age at diagnosis of type 2diabetes), DWt (maximum weight in lifetime – weight at age 20years), and DTime (age at maximum weight –20 years).doi:10.1371/journal.pone.0080525.g002
Maximum Weight and Development of Diabetes
PLOS ONE | www.plosone.org 4 December 2013 | Volume 8 | Issue 12 | e80525
The impact of obesity or weight gain on T2D incidence may
differ depending on when obesity is assessed [16–18]. A previous
study from Pima Indians showed that weight in childhood and
adolescence was one of the most significant predictors of T2D
[19]. Ford et al. found that participants who gained more than
5 kg over the previous 10 years had a higher chance of diabetes
compared with participants whose weights remained relatively
stable, even at overweight or obese levels, in a US national cohort
[5]. A study from the UK showed that .10% weight gain was
associated with a significant increase in risk of T2D compared to
stable weight after adjustment for initial BMI [7]. These results
show that the time and magnitude of weight gain should be taken
into account when the impact of body weight on T2D incidence is
assessed.
Pancreatic b-cell function starts to deteriorate from early age
[20]. A study with healthy, glucose tolerant Caucasians showed
that b-cell function is greatest around age 20 years and declines
with age at a rate of about 1% per year [21], providing the
rationale for choosing age 20 years as the baseline in our study. In
contrast, insulin sensitivity was not affected by aging within the
time frame studied [21].
A study demonstrated that the risk of diabetes increases with
early weight gain and decreases with later weight loss [22].
Another study showed that BMI in childhood was a negative and
independent predictor of insulin secretion at adulthood after
adjusting for age, sex, and fat percent, indicating that pancreatic b-cell capacity may be set early in life [23]. Conceivably, rapid
increase of weight could be more damaging to pancreatic b-cellfunction than slow increase, given the briefer period of time
available to adapt to weight increase [24]. Taken together, these
data suggest that rapid weight gain is more harmful to pancreatic
function than slow weight gain, particularly in younger age.
The current study extends prior work by providing the
detriments of weight gain on concomitant microvascular compli-
cations of T2D. In a study from the Atherosclerosis Risk in
Communities, weight gainers had significantly less favorable
glucose and lipid levels when compared with weight maintainers
[25]. Another study showed that greater weight gain was
associated with glycaemic progression in non-diabetic subjects
[26]. In the present study, rapid weight gainers showed earlier
diagnosis of T2D, higher level of HbA1c, and higher prevalence of
microalbuminuria and diabetic retinopathy compared to relatively
slow weight gainers. Although rapid weight gain may indicate
Figure 3. Comparison of age at T2D diagnosis, HbA1c at T2D diagnosis, microalbuminuria, and diabetic retinopathy between rapidand slow weight gainers defined as the highest and lowest quartiles of Ratemax_wt. Mean values with 25–75% ranges in box and 5–95%ranges in outer lines are displayed in Box and Whisker plots. Outliers who do not belong to the 5–95% ranges are displayed as dots. Log-transformedurine albumin-to-creatinine ratio was used for microalbuminuria. *indicates P,0.01.doi:10.1371/journal.pone.0080525.g003
Maximum Weight and Development of Diabetes
PLOS ONE | www.plosone.org 5 December 2013 | Volume 8 | Issue 12 | e80525
other comorbidities compared to slow weight gain, these findings
highlight the importance of the dynamics of weight change
associated with development of T2D, glycemic control, and
diabetic microvascular complications.
Several mechanisms for the weight gain and development of
T2D and its complication can be postulated. Weight gain,
particularly rapid increase in adiposity, leads to the alteration in
gene expression of growth factors and cytokines such as
transforming growth factor-b that are important in the develop-
ment of diabetes and obesity-associated glomerular injury [27].
Hyperlipidemia, commonly accompanied by obesity, is a risk
factor for the development of albuminuria by promoting
glomerular injury through renal upregulation of sterol-regulatory
Table 2. Variables associated with age at T2D diagnosis, HbA1c at T2D diagnosis, and urine albumin-to-creatinine ratio (UACR) atT2D diagnosis.
StandardizedBeta P* 95% CI
Lower Upper
a. For age at T2D diagnosis{
BMI20y (kg/m2) 20.09 0.001 20.46 20.17
Alcohol (moderate or less vs. heavy) 20.05 0.044 22.82 20.22
Smoking (non vs. ex vs. current) 20.16 ,0.001 22.73 21.71
Exercise (regular vs. irregular vs. no) 20.05 0.024 22.04 20.22
Family history of diabetes (no vs. yes) 20.10 ,0.001 23.12 21.51
DWt (kg) 20.22 ,0.001 20.35 20.03
Ratemax_wt (kg/year) 20.17 ,0.001 20.37 20.03
b. For HbA1c at T2D diagnosis`
AgeT2D (year) 20.15 ,0.001 20.04 20.02
Smoking (non vs. ex vs. current) 0.06 0.016 0.03 0.20
Exercise (regular vs. irregular vs. no) 0.03 0.023 20.04 0.22
DWt (kg) 0.16 ,0.001 0.02 0.04
Ratemax_wt (kg/year) 0.12 ,0.001 0.02 0.04
c. For UACR# at T2D diagnosis"
BMI20y (kg/m2) 0.07 ,0.001 0.01 0.06
SBP (mmHg) 0.08 ,0.001 0.01 0.02
HbA1cT2D (%) 0.17 ,0.001 0.14 0.23
Log-triglyceride/HDL-cholesterol 0.06 0.040 0.53 4.72
DWt (kg) 0.14 ,0.001 0.02 0.05
Ratemax_wt (kg/year) 0.10 ,0.001 0.01 0.04
*Corrected P by Bonferroni method,{Common covariates: sex, BMI20y, SBP, DBP, alcohol intake, smoking status, exercise habit, family history of diabetes, DWt, and Ratemax_wt.`Common covariates+AgeT2D,"Common covariates+AgeT2D+HbA1cT2D+log-triglyceride/HDL-cholesterol.#Log-transformed value was used.doi:10.1371/journal.pone.0080525.t002
Table 3. Variables associated with diabetic retinopathy{`.
OR 95% CI P*
Lower Upper
BMI20y (kg/m2) 1.07 1.01 1.13 0.002
SBP/DBP$140/90 mmHg or blood pressure medication 2.86 2.21 4.41 ,0.001
HbA1cT2D (%) 1.22 1.12 1.31 ,0.001
DWt (kg) 1.03 1.01 1.05 ,0.001
Ratemax_wt (kg/year) 1.02 1.01 1.05 0.032
*Corrected P by Bonferroni method,{Covariates: AgeT2D, sex, BMI20y, SBP/DBP$140/90 mmHg or blood pressure medication, alcohol intake, smoking status, exercise habit, family history of diabetes,HbA1cT2D, log-triglyceride/HDL-cholesterol, DWt, and Ratemax_wt,`Both nonproliferative and proliferative diabetic retinopathy were combined.doi:10.1371/journal.pone.0080525.t003
Maximum Weight and Development of Diabetes
PLOS ONE | www.plosone.org 6 December 2013 | Volume 8 | Issue 12 | e80525
element-binding proteins, which in turn induces mesangial cell
proliferation and cytokine synthesis [28].
The prevalence of diabetic retinopathy was also associated with
rapid and greater weight gain in our study. Obese people were 6.5
times more likely to have PDR than were those with normal
weight, and the degree of obesity was positively associated with
increasing severity of diabetic retinopathy [29]. These findings
suggest that diabetic retinopathy is a multifactorial microvascular
complication, which is associated with obesity, hyperglycemia, and
blood pressure.
The MAXWEL cohort has several novel strengths. First, weight
information at age 20 years was accurately obtained from official
written documents in 94.5% of participants. Second, identification
of diabetes was based on laboratory results, not based on self-
report. Third, only newly detected subjects with diabetes were
included, which enabled us to assess glycaemia and status of
diabetic complications at the time of diagnosis.
The primary limitation of this study is its cross-sectional design
with retrospective components: the identification of maximum
weight and age at maximum weight were based on self-report.
When prevalence estimates for obesity were compared, it was
found that bias in self-reported weight was smaller in-person
interviews than in telephone interviews [30]. In the setting of
rigorous in-person interviews by physicians, it has been shown that
relationships between self-reported and measured weight are
strong [31]. In our sample, self-reported weight was highly
accurate in randomly selected subjects. In addition, we did not
assess weight fluctuation, which may affect pancreatic b-cellfunction [32,33]. However, effect of weight fluctuation has not
been significant after adjustment for overall weight status or
attained BMI in previous studies [32,33].
In conclusion, we found that both rapid and great weight gain
were associated with not only early development of T2D and
glycemic status but also microalbuminuria and diabetic retinop-
athy. These results support public health recommendations to
reduce the risk of T2D and its microvascular complications by
preventing weight gain from adolescent or early adulthood.
Healthcare providers may also consider reviewing patients’ weight
histories when assessing their T2D risk.
Supporting Information
File S1 Supporting Tables: Table A. Variables associated
with age at T2D diagnosis, HbA1c at T2D diagnosis, and urine
albumin-to-creatinine ratio (UACR) at T2D diagnosis in men.
Table B. Variables associated with age at T2D diagnosis, HbA1c
at T2D diagnosis, and urine albumin-to-creatinine ratio (UACR) at
T2D diagnosis in women. Table C. Variables associated with
diabetic retinopathy in men. Table D. Variables associated with
diabetic retinopathy in women.
(DOCX)
Author Contributions
Conceived and designed the experiments: SL MJK SJW SHC KSP.
Performed the experiments: SL MJK. Analyzed the data: SL KMK MJK
SJW SHC KSP HCJ. Contributed reagents/materials/analysis tools: JBM
DJW. Wrote the paper: SL MJK.
References
1. Shaw JE, Sicree RA, Zimmet PZ (2010) Global estimates of the prevalence of
diabetes for 2010 and 2030. Diabetes Res Clin Pract 87: 4–14.
2. Zhang P, Zhang X, Brown J, Vistisen D, Sicree R, et al. (2010) Global
healthcare expenditure on diabetes for 2010 and 2030. Diabetes Res Clin Pract
87: 293–301.
3. Field AE, Coakley EH, Must A, Spadano JL, Laird N, et al. (2001) Impact of
overweight on the risk of developing common chronic diseases during a 10-year
period. Arch Intern Med 161: 1581–6.
4. Olefsky JM, Kolterman OG, Scarlett JA (1982) Insulin action and resistance in
obesity and noninsulin-dependent type II diabetes mellitus. Am J Physiol 243:
E15–E30.
5. Ford ES, Williamson DF, Liu S (1997) Weight change and diabetes incidence:
findings from a national cohort of US adults. Am J Epidemiol 146: 214–22.
6. Hanson RL, Narayan KM, McCance DR, Pettitt DJ, Jacobsson LT, et al. (1995)
Rate of weight gain, weight fluctuation, and incidence of NIDDM. Diabetes 44:
261–6.
7. Wannamethee SG, Shaper AG (1999) Weight change and duration of
overweight and obesity in the incidence of type 2 diabetes. Diabetes Care 22:
1266–72.
8. Wannamethee SG, Shaper AG, Walker M (2005) Overweight and obesity and
weight change in middle aged men: impact on cardiovascular disease and
diabetes. J Epidemiol Community Health 59: 134–9.
9. Knowler WC, Barrett-Connor E, Fowler SE, Hamman RF, Lachin JM, et al.
(2002) Reduction in the incidence of type 2 diabetes with lifestyle intervention or
metformin. N Engl J Med 346: 393–403.
10. Tuomilehto J, Lindstrom J, Eriksson JG, Valle TT, Hamalainen H, et al. (2001)
Prevention of type 2 diabetes mellitus by changes in lifestyle among subjects with
impaired glucose tolerance. N Engl J Med 344: 1343–50.
11. Li G, Zhang P, Wang J, Gregg EW, Yang W, et al. (2008) The long-term effect
of lifestyle interventions to prevent diabetes in the China Da Qing Diabetes
Prevention Study: a 20-year follow-up study. Lancet 371: 1783–9.
12. (2012) Diagnosis and classification of diabetes mellitus. Diabetes Care 35 Suppl
1: S64–S71.
13. Wilkinson CP, Ferris FL, III, Klein RE, Lee PP, Agardh CD, et al. (2003)
Proposed international clinical diabetic retinopathy and diabetic macular edema
disease severity scales. Ophthalmology 110: 1677–82.
14. Resnick HE, Valsania P, Halter JB, Lin X (2000) Relation of weight gain and
weight loss on subsequent diabetes risk in overweight adults. J Epidemiol
Community Health 54: 596–602.
15. Looker HC, Knowler WC, Hanson RL (2001) Changes in BMI and weight
before and after the development of type 2 diabetes. Diabetes Care 24: 1917–22.
16. Oguma Y, Sesso HD, Paffenbarger RS, Jr., Lee IM (2005) Weight change and
risk of developing type 2 diabetes. Obes Res 13: 945–51.
17. Koh-Banerjee P, Wang Y, Hu FB, Spiegelman D, Willett WC, et al. (2004)
Changes in body weight and body fat distribution as risk factors for clinical
diabetes in US men. Am J Epidemiol 159: 1150–9.
18. Brancati FL, Wang NY, Mead LA, Liang KY, Klag MJ (1999) Body weight
patterns from 20 to 49 years of age and subsequent risk for diabetes mellitus: the
Johns Hopkins Precursors Study. Arch Intern Med 159: 957–63.
19. McCance DR, Pettitt DJ, Hanson RL, Jacobsson LT, Bennett PH, et al. (1994)
Glucose, insulin concentrations and obesity in childhood and adolescence as
predictors of NIDDM. Diabetologia 37: 617–23.
20. Szoke E, Shrayyef MZ, Messing S, Woerle HJ, van Haeften TW, et al. (2008)
Effect of aging on glucose homeostasis: accelerated deterioration of beta-cell
function in individuals with impaired glucose tolerance. Diabetes Care 31: 539–
43.
21. Chiu KC, Lee NP, Cohan P, Chuang LM (2000) Beta cell function declines with
age in glucose tolerant Caucasians. Clin Endocrinol (Oxf) 53: 569–75.
22. Black E, Holst C, Astrup A, Toubro S, Echwald S, et al. (2005) Long-term
influences of body-weight changes, independent of the attained weight, on risk of
impaired glucose tolerance and Type 2 diabetes. Diabet Med 22: 1199–205.
23. Thearle MS, Bunt JC, Knowler WC, Krakoff J (2009) Childhood predictors of
adult acute insulin response and insulin action. Diabetes Care 32: 938–43.
24. Lingohr MK, Buettner R, Rhodes CJ (2002) Pancreatic beta-cell growth and
survival–a role in obesity-linked type 2 diabetes? Trends Mol Med 8: 375–84.
25. Truesdale KP, Stevens J, Cai J (2005) The effect of weight history on glucose and
lipids: the Atherosclerosis Risk in Communities Study. Am J Epidemiol 161:
1133–43.
26. Rhee EJ, Choi JH, Yoo SH, Bae JC, Kim WJ, et al. (2011) The association of
unintentional changes in weight, body composition, and homeostasis model
assessment index with glycemic progression in non-diabetic healthy subjects.
Diabetes Metab J 35: 138–48.
27. Chalmers L, Kaskel FJ, Bamgbola O (2006) The role of obesity and its
bioclinical correlates in the progression of chronic kidney disease. Adv Chronic
Kidney Dis 13: 352–64.
28. Rutledge JC, Ng KF, Aung HH, Wilson DW (2010) Role of triglyceride-rich
lipoproteins in diabetic nephropathy. Nat Rev Nephrol 6: 361–70.
29. Dirani M, Xie J, Fenwick E, Benarous R, Rees G, et al. (2011) Are obesity and
anthropometry risk factors for diabetic retinopathy? The diabetes management
project. Invest Ophthalmol Vis Sci 52: 4416–21.
30. Ezzati M, Martin H, Skjold S, Vander HS, Murray CJ (2006) Trends in national
and state-level obesity in the USA after correction for self-report bias: analysis of
health surveys. J R Soc Med 99: 250–7.
Maximum Weight and Development of Diabetes
PLOS ONE | www.plosone.org 7 December 2013 | Volume 8 | Issue 12 | e80525
31. McAdams MA, van Dam RM, Hu FB (2007) Comparison of self-reported and
measured BMI as correlates of disease markers in US adults. Obesity (SilverSpring) 15: 188–96.
32. Waring ME, Eaton CB, Lasater TM, Lapane KL (2010) Incident diabetes in
relation to weight patterns during middle age. Am J Epidemiol 171: 550–6.
33. Field AE, Manson JE, Laird N, Williamson DF, Willett WC, et al. (2004) Weight
cycling and the risk of developing type 2 diabetes among adult women in the
United States. Obes Res 12: 267–74.
Maximum Weight and Development of Diabetes
PLOS ONE | www.plosone.org 8 December 2013 | Volume 8 | Issue 12 | e80525