


The 2016 election:
How and why it’s
President TrumpSofi Sinozich, Gregory Holyk, Gary Langer
Langer Research Associates

Setting the scene
▪ Partisanship and polarization
▪ Long-term economic trends

0
0.1
0.2
0.3
0.4
0.5
0.6
0.7
201620142012201020082006200420022000199819961994199219901988198619841982
Party ID excluding independents
Party ID including independents
Party Identification and Ideology:
Annual Average Correlations, 1981-2016ABC News and ABC News/Washington Post polls
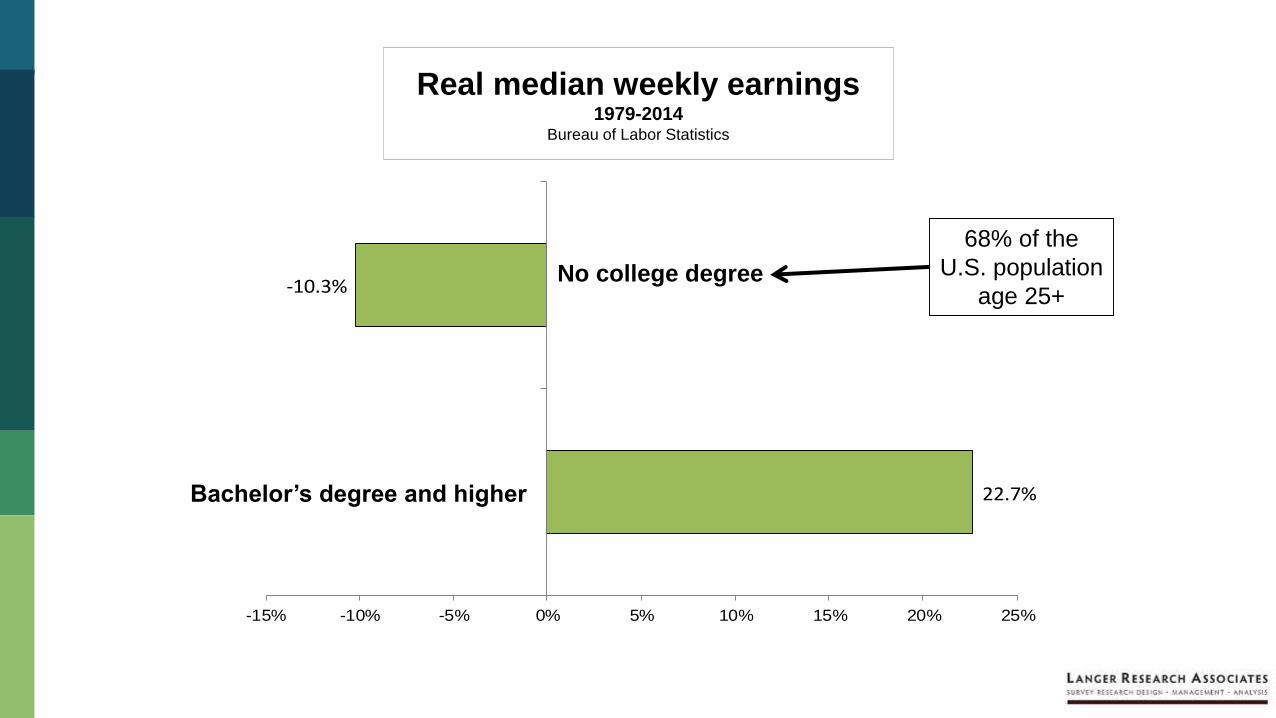
22.7%
-10.3%
-15% -10% -5% 0% 5% 10% 15% 20% 25%
Real median weekly earnings1979-2014
Bureau of Labor Statistics
Bachelor’s degree and higher
68% of the
U.S. population
age 25+No college degree

The promise of
government
▪ Security
▪ Liberty
▪ Opportunity for prosperity

When it’s not
delivered…

When it’s not
delivered…
▪ People get upset
▪ They reject the status quo
▪ They seek alternatives in leadership
▪ Social/values divisions gain salience

What it looks like
▪ In-group retrenchment; suspicion of “others”
▪ Acceptability of radical alternatives
▪ Bitterness and mutual incomprehension
▪ Hyper-motivated reasoning
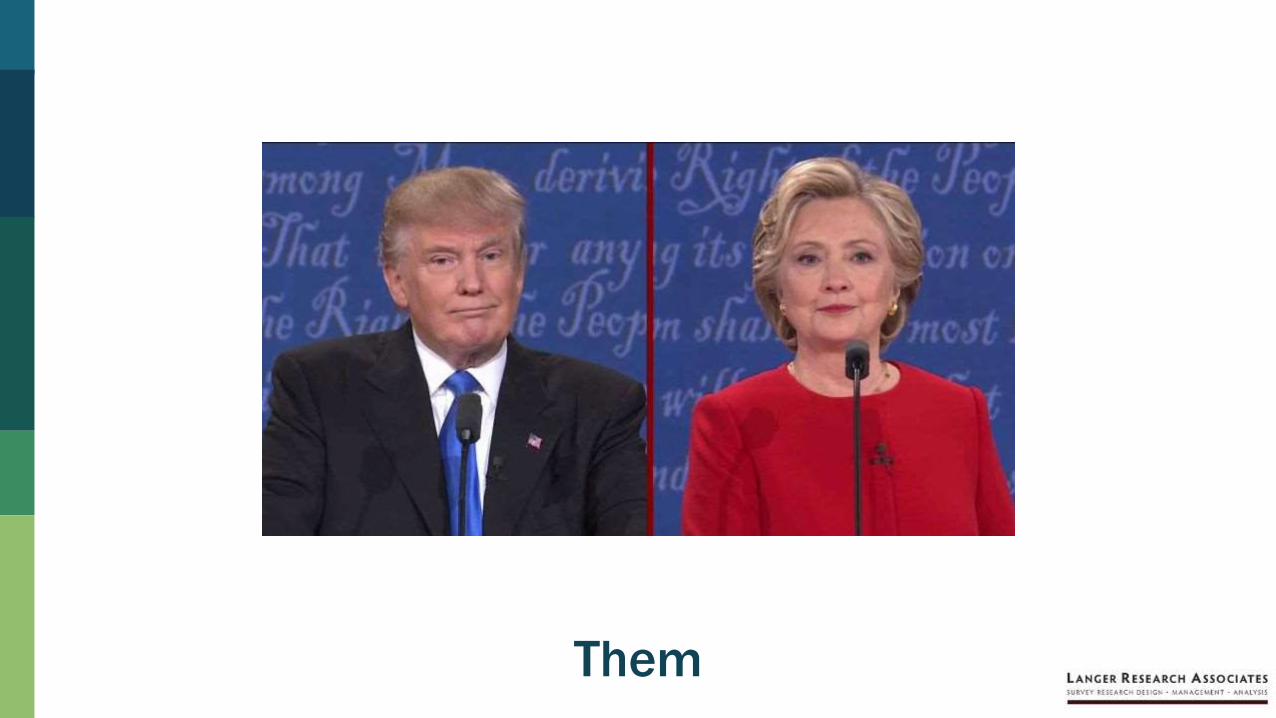
Them

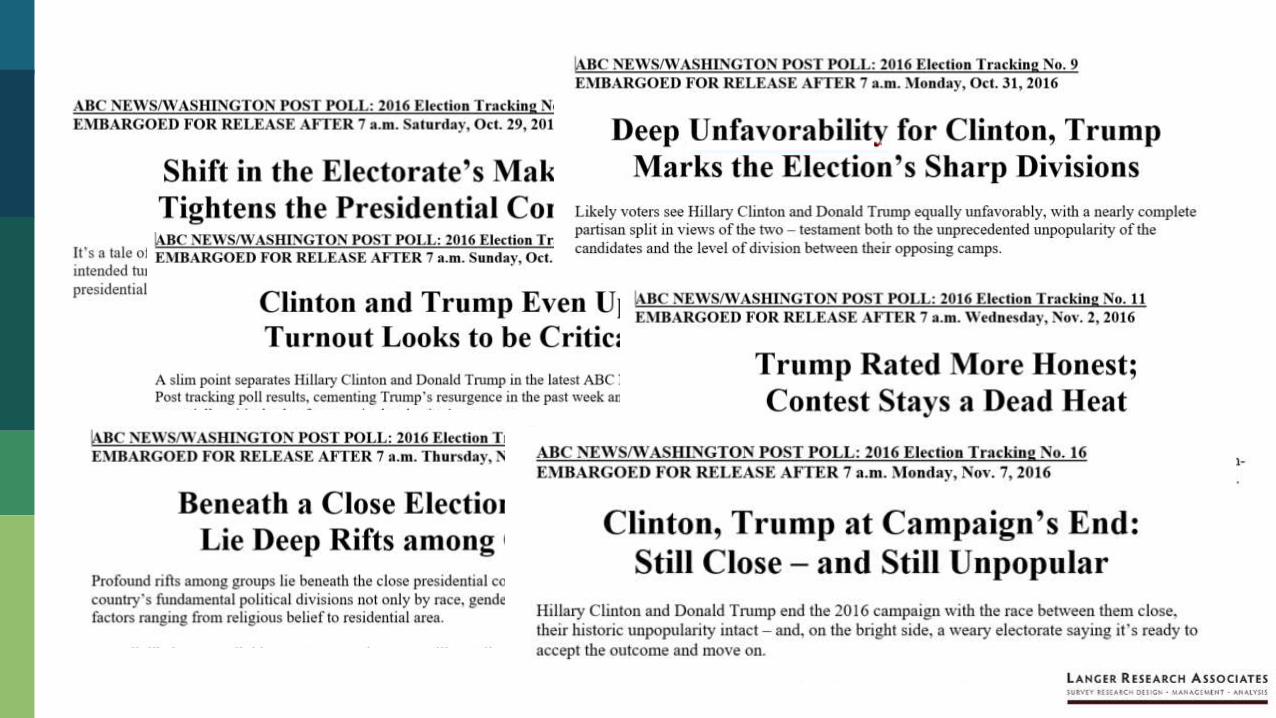
▪ The two most unpopular major-party candidates
▪ The first female major-party presidential candidate
▪ Low enthusiasm; high negative voting
▪ Extreme partisanship
▪ Long-running and late-breaking controversies alike
▪ Flawed personal attributes
▪ Little issue differentiation
▪ Sharp class-based division, populism vs status quo

34%
25%
18%
13%
0%
10%
20%
30%
40%
50%
60%
70%
80%
90%
100%
Mar-15 May-15 Jul-15 Sep-15 Nov-15 Jan-16 Mar-16
Donald Trump
Ted Cruz
Marco Rubio
John Kasich
2016 Republican Primary PreferenceAmong registered leaned Republicans
ABC News/Washington Post polls

Economic
discontent
Preference for
authority
Populist/
prefer an outsider
Pushback against
other groups
Trump support
Modeling Trump
support: Primaries

Economic
discontent
Preference for
authority
Populist/
prefer an outsider
Pushback against
other groups
Support Trump
vs. Clinton
Modeling Trump
support: General
Better/worse
under Obama
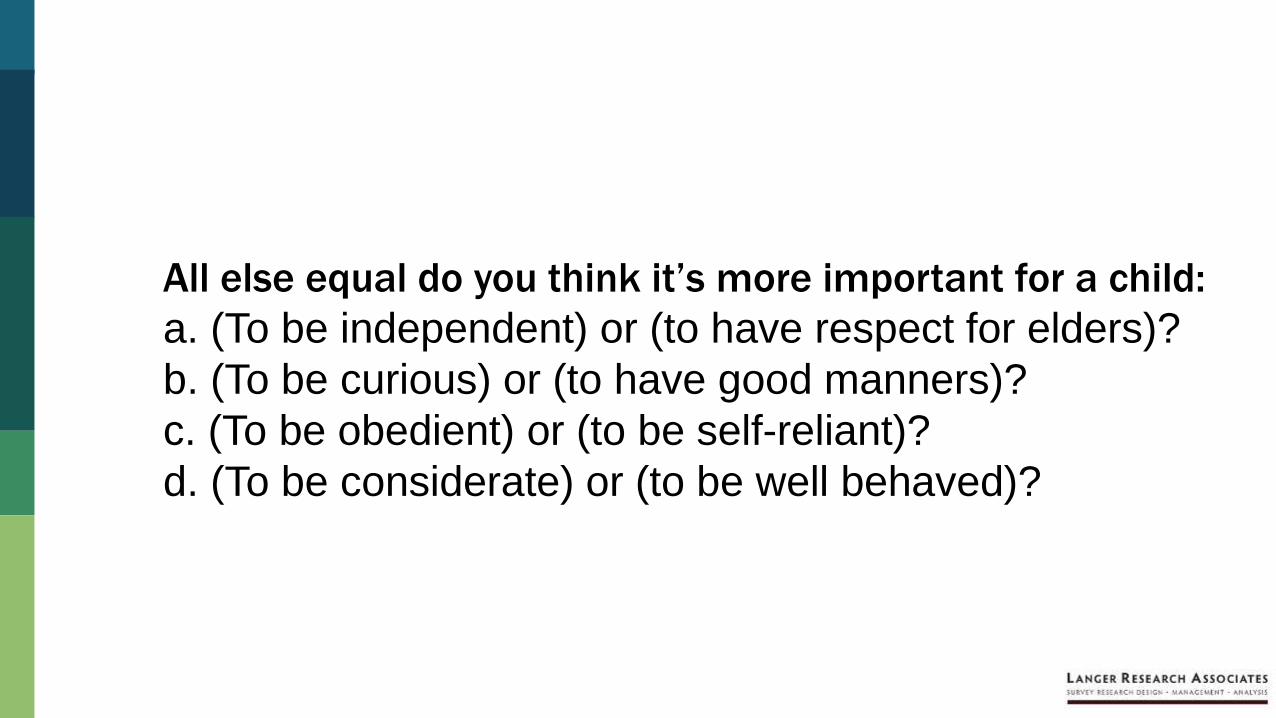
All else equal do you think it’s more important for a child:
a. (To be independent) or (to have respect for elders)?
b. (To be curious) or (to have good manners)?
c. (To be obedient) or (to be self-reliant)?
d. (To be considerate) or (to be well behaved)?

49%
42%
0%
10%
20%
30%
40%
50%
60%
70%
80%
90%
100%
Mar-15 May-15 Jul-15 Sep-15 Nov-15 Jan-16 Mar-16
2016 Democratic Primary PreferenceAmong registered leaned Democrats
ABC News/Washington Post polls
Hillary Clinton
Bernie Sanders

61%
50%48%
71%
77%
62%
37%
49% 50%
28%
21%
38%
0%
10%
20%
30%
40%
50%
60%
70%
80%
90%
100%
Women Men Whites NonwhitesNET
Blacks Hispanics
Clinton Sanders
Democratic Primary Vote by Groups2016 exit polls

28%
50%
65%
71%71%
49%
34%
27%
0%
10%
20%
30%
40%
50%
60%
70%
80%
90%
100%
18-29(16%)
30-44(23%)
45-64(40%)
65+(21%)
Clinton Sanders
Democratic Primary Vote by Age2016 exit polls

On race…
Which of these do you think is the bigger problem in this
country – (blacks and Hispanics losing out because of
preferences for whites), or (whites losing out because of
preferences for blacks and Hispanics)?
Blacks/Hispanics Whites
Clinton supporters 57% 16%
Trump supporters 16% 44%

On race…
Clinton supporters Trump supporters
Think … have too little
influence in society
Women 58% 21%
Minorities 67% 17%
Think … have too much
influence in society
Men 50% 20%
Whites 53% 8%
Minorities 9% 38%

In summary
▪ Controlling for demographics, partisanship, ideology and
presidential approval…
▪ Seeing too little influence for whites/men and too much
influence for minorities/women independently predicted
support for Trump
▪ (Similar effect size to partisanship, ideology, race – outpaced
only by Obama disapproval)

47%
39%
49% 49% 48%47% 48%45% 44%
46%
0%
10%
20%
30%
40%
50%
60%
70%
80%
90%
100%
Economy Corruption Terrorism Health care Immigration
Hillary Clinton Donald Trump
Clinton vs. Trump: IssuesAmong likely voters
ABC News/Washington Post poll
(29%) (17%) (15%) (13%) (5%)
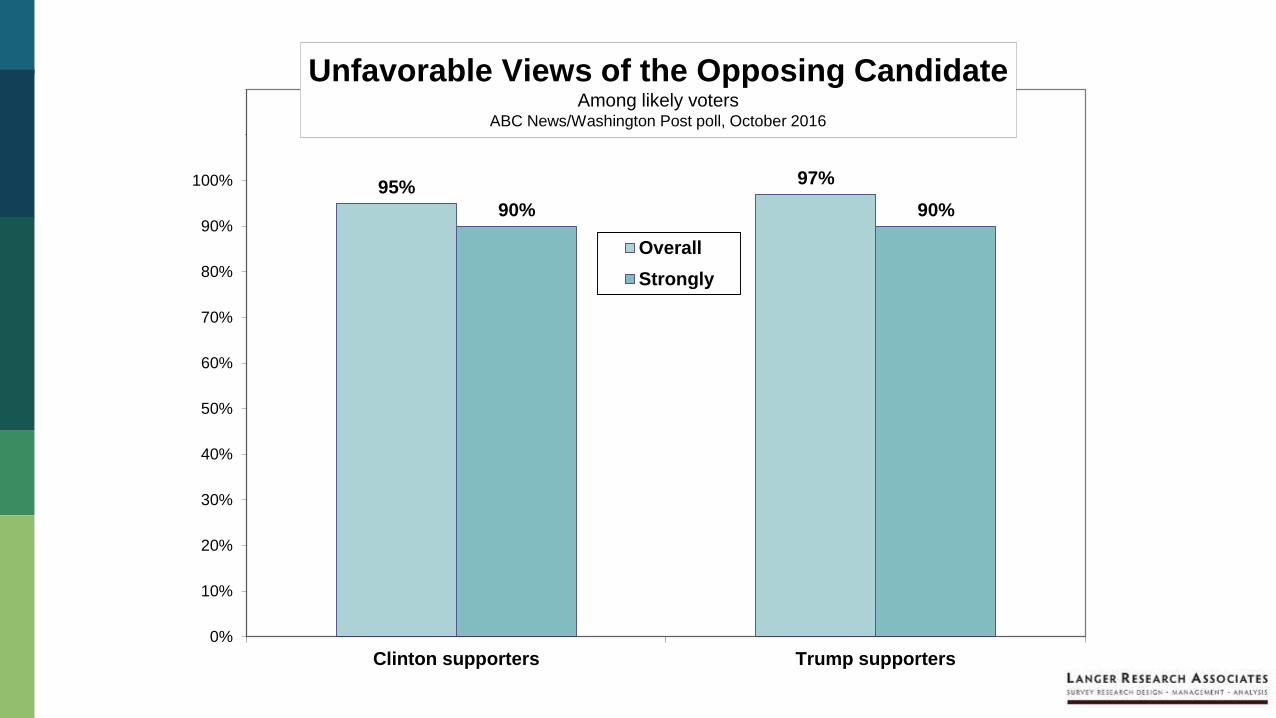
95%97%
90% 90%
0%
10%
20%
30%
40%
50%
60%
70%
80%
90%
100%
110%
120%
Clinton supporters Trump supporters
Overall
Strongly
Unfavorable Views of the Opposing CandidateAmong likely voters
ABC News/Washington Post poll, October 2016
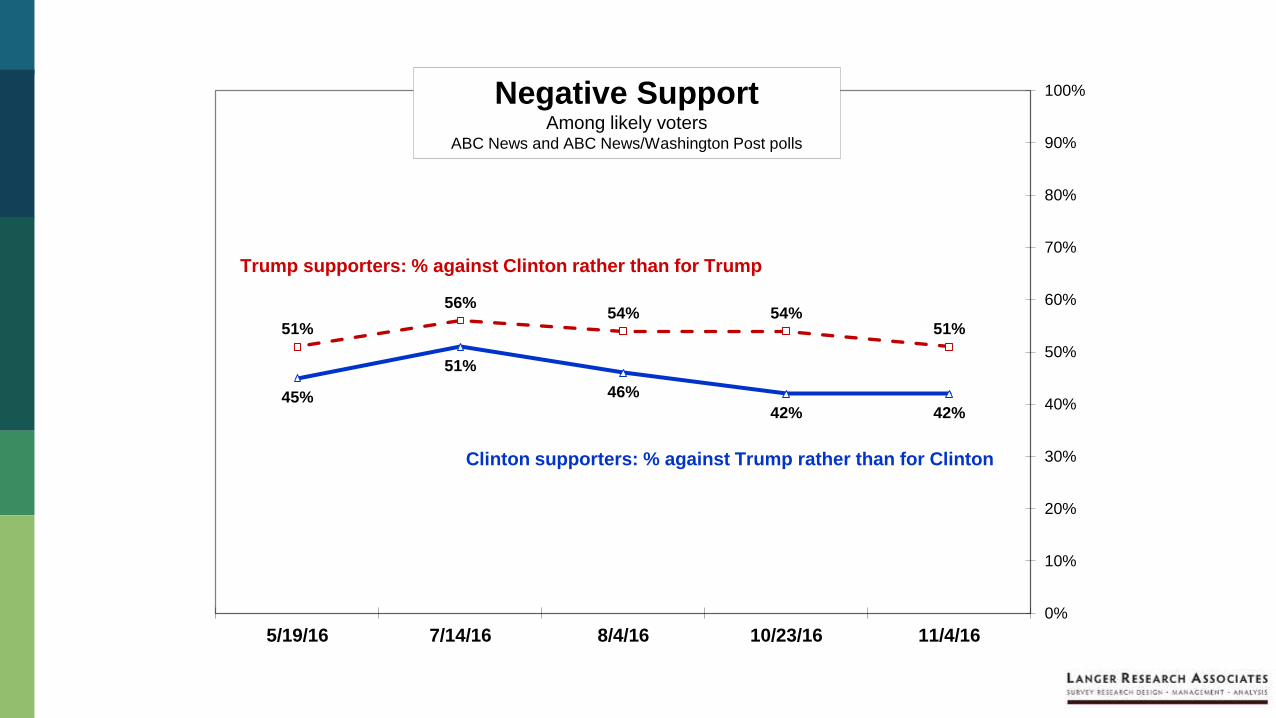
42%42%
46%
51%
45%
51%54%54%
56%
51%
0%
10%
20%
30%
40%
50%
60%
70%
80%
90%
100%
11/4/1610/23/168/4/167/14/165/19/16
Negative SupportAmong likely voters
ABC News and ABC News/Washington Post polls
Clinton supporters: % against Trump rather than for Clinton
Trump supporters: % against Clinton rather than for Trump
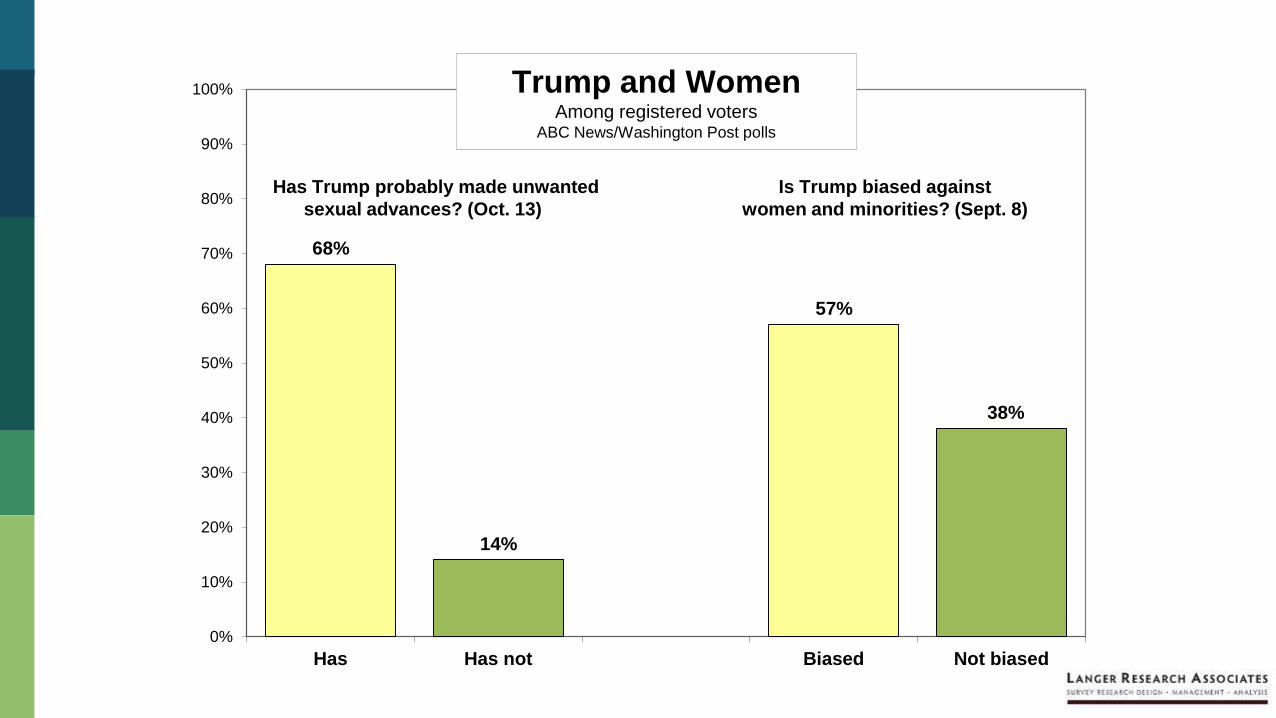
68%
14%
57%
38%
0%
10%
20%
30%
40%
50%
60%
70%
80%
90%
100%
Has Has not Biased Not biased
Trump and WomenAmong registered voters
ABC News/Washington Post polls
Has Trump probably made unwanted Is Trump biased against
sexual advances? (Oct. 13) women and minorities? (Sept. 8)

86%
47% 46%
81%
0%
10%
20%
30%
40%
50%
60%
70%
80%
90%
100%
110%
120%
Leaned Dems Leaned Reps Leaned Dems Leaned Reps
Trump and Women IIAmong registered voters
Think Trump probably made Say it makes no difference
unwanted sexual advances in your vote
Among leaned Republicans who said Trump probably made
unwanted sexual advances, 72 percent also said it made no
difference in their vote.
In September 1998, 66 percent of leaned Democrats thought
Bill Clinton lied under oath. Among them, 78 percent
approved of his job performance, and 63 percent saw him
favorably.Motivated
reasoning

So, about that
horse race…

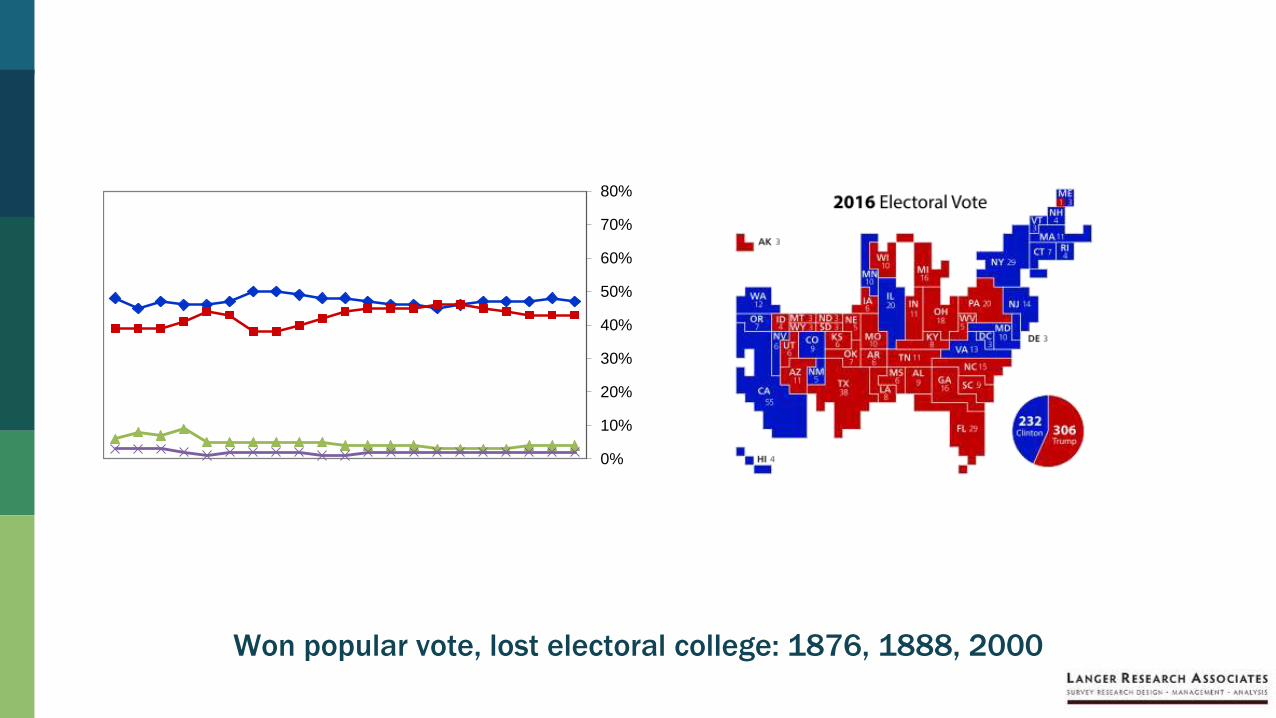
48%47%47%
46%
46%
50%46%
48%
46%43%44%
46%
45%
38%
44%
39%
3%4%3%3%3%
5%5%6%
1%2%2%2%2%2%1%3%0%
10%
20%
30%
40%
50%
60%
70%
80%
90%
100%2016 General Election Vote Preference
Among likely votersABC News and ABC News/Washington Post polls
Hillary Clinton
Donald Trump
Gary JohnsonJill Stein
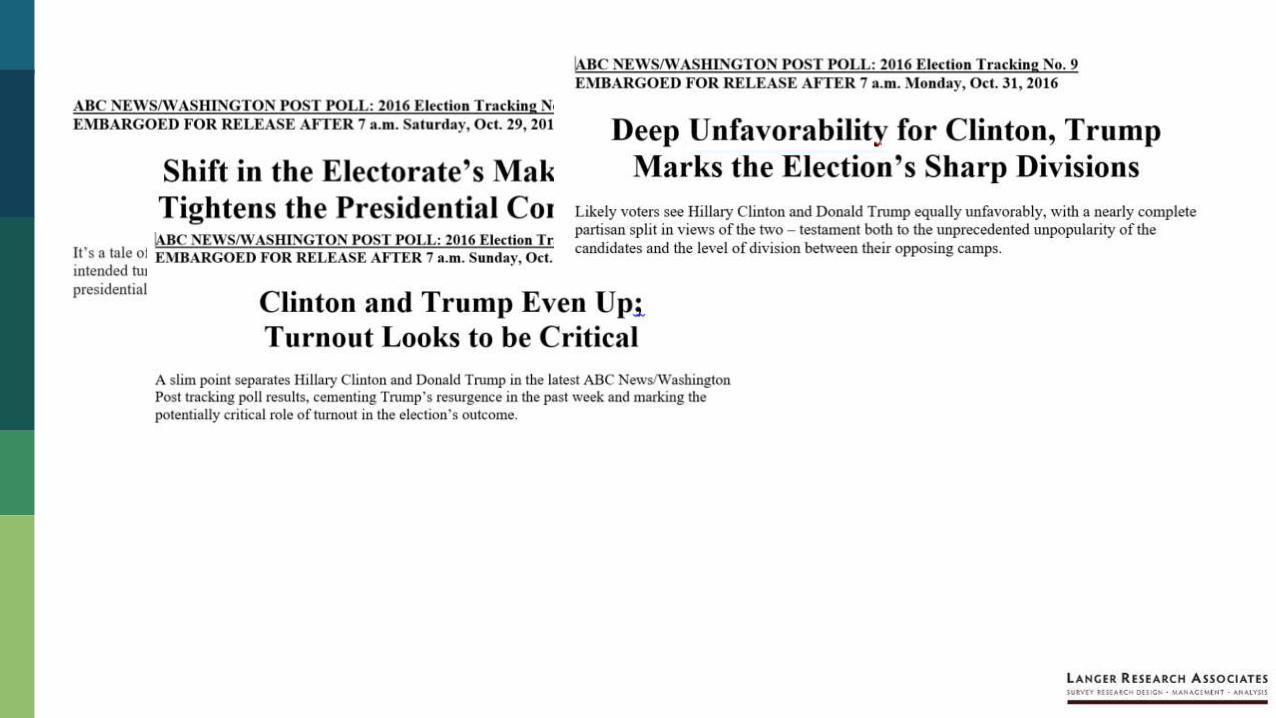
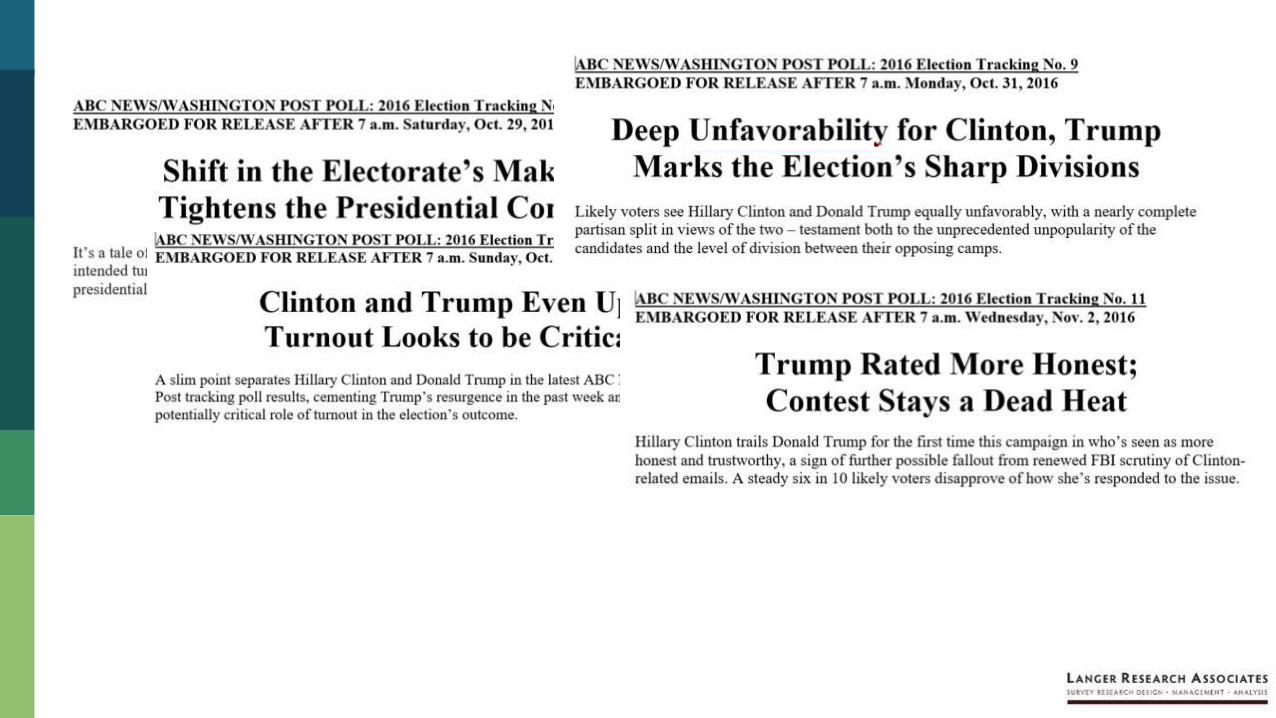
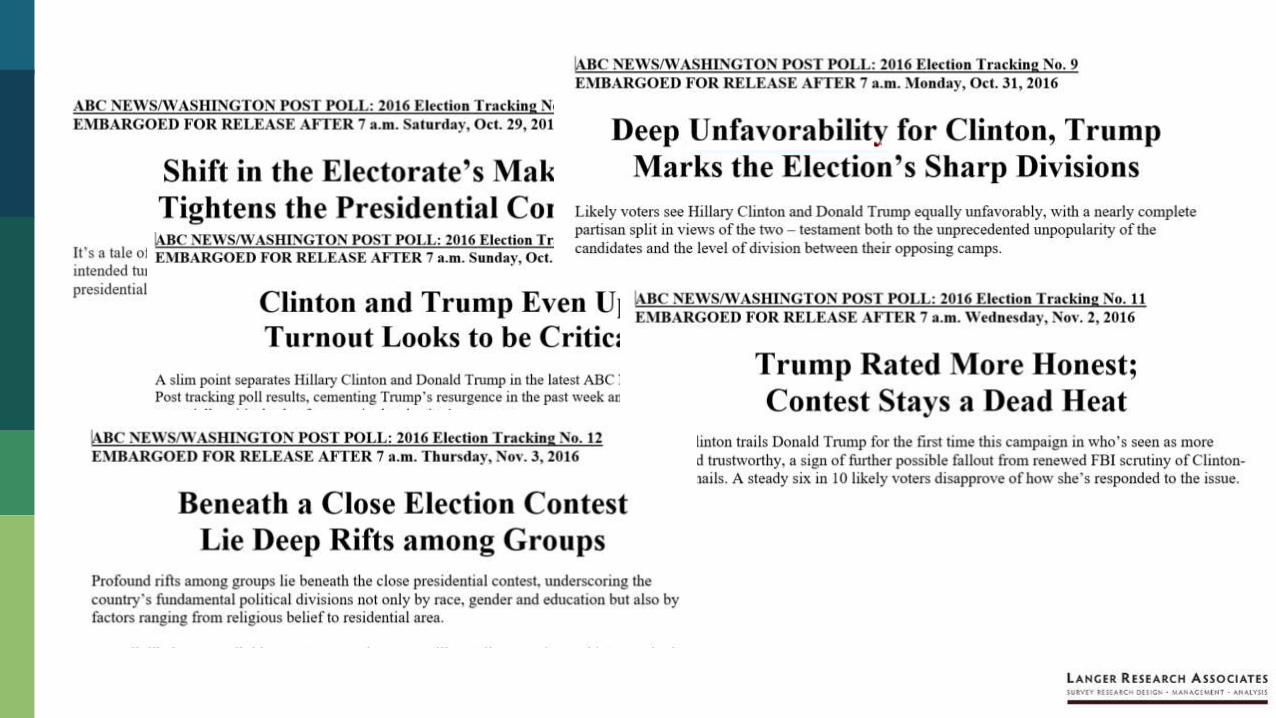
Final two weeks

https://www.washingtonpost.com/news/monkey-cage/wp/2016/12/05/which-was-the-most-accurate-national-poll-in-the-2016-presidential-election/?utm_term=.092e231838d7

Why do we do pre-
election polls?
Why do we do pre-
election polls?
▪ To understand how and why we pick our leaders

Why do we do pre-
election polls?
▪ To understand how and why we pick our leaders
▪ To play fortune-teller

That said…
Major party margin
ABC or ABC/Post
Actual
vote Diff.
2016 4 pts 2 2
2012 3 4 1
2008 9 7 2
2004 1 3 2
2000 3 0 3
1996 12 8 4
1992 7 6 1
1988 8 7 1
1984 15 18 3
Average 2
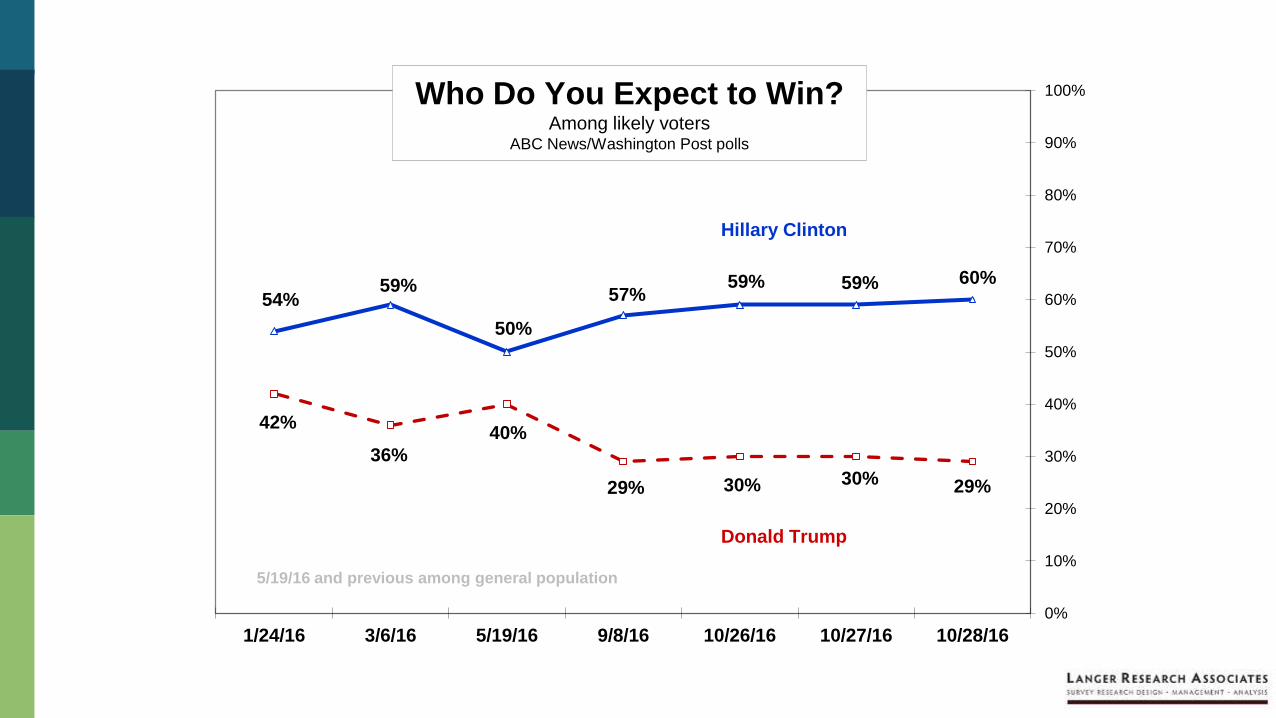
60%59%59%57%
50%
59%54%
29%30%30%29%
40%
36%
42%
0%
10%
20%
30%
40%
50%
60%
70%
80%
90%
100%
10/28/1610/27/1610/26/169/8/165/19/163/6/161/24/16
Who Do You Expect to Win?Among likely voters
ABC News/Washington Post polls
Hillary Clinton
Donald Trump
5/19/16 and previous among general population
0%
10%
20%
30%
40%
50%
60%
70%
80%
Won popular vote, lost electoral college: 1876, 1888, 2000


Our alternative
▪ MRP on our probability-based tracking poll
▫ Correctly predicts 4 out of 5 previous
presidential elections – including 2016State poll ABC/MRP Outcome
WI Marquette Clinton +6 Trump +1 Trump +1
NC Quinnipiac Clinton +2 Trump +6 Trump +4
PA Monmouth Clinton +4 Trump +2 Trump +1
MI RCP avg. Clinton +3.4 Clinton +1 Trump +0.2
NH UNH Clinton +11 Clinton +2 Clinton +0.3
MN Star Trib. Clinton +8 Clinton +3 Clinton +2

The road ahead

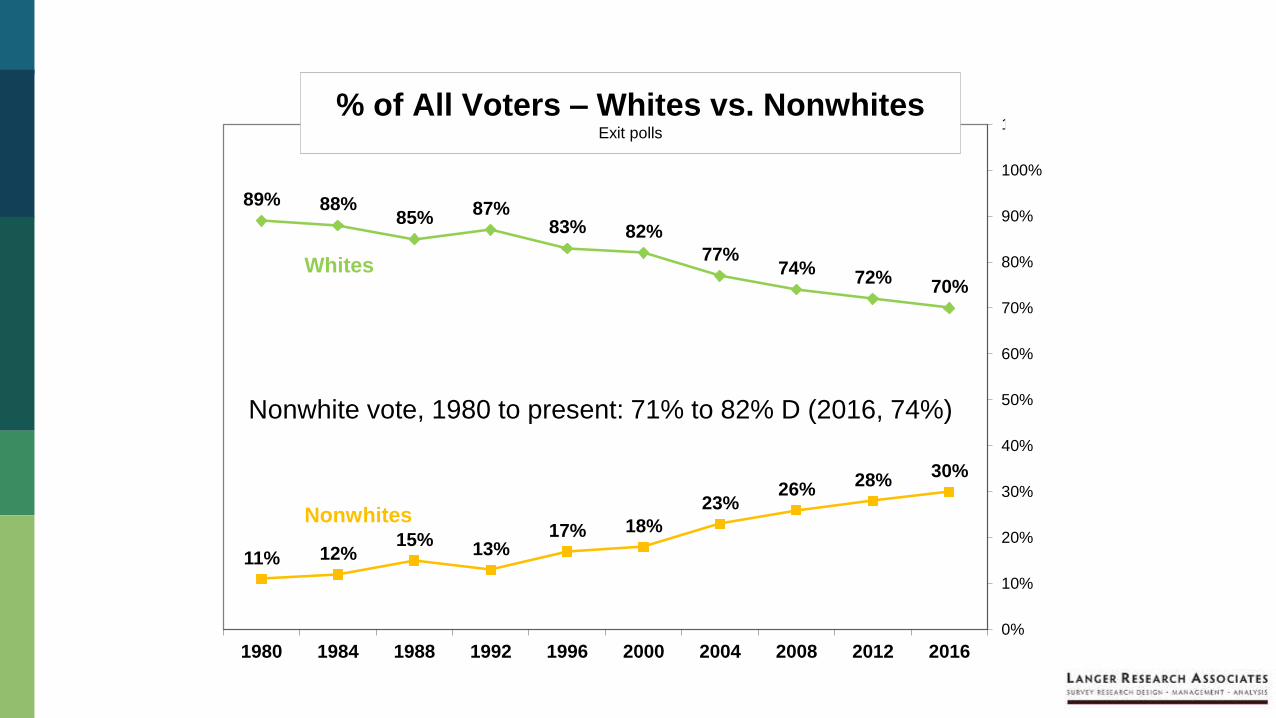
70%72%
74%77%
82%83%87%
85%88%89%
30%28%
26%23%
18%17%13%
15%12%11%
0%
10%
20%
30%
40%
50%
60%
70%
80%
90%
100%
110%
2016201220082004200019961992198819841980
% of All Voters – Whites vs. NonwhitesExit polls
Whites
Nonwhites
70%72%
74%77%
82%83%87%
85%88%89%
30%28%
26%23%
18%17%13%
15%12%11%
0%
10%
20%
30%
40%
50%
60%
70%
80%
90%
100%
110%
2016201220082004200019961992198819841980
% of All Voters – Whites vs. NonwhitesExit polls
Whites
Nonwhites
Nonwhite vote, 1980 to present: 71% to 82% D (2016, 74%)
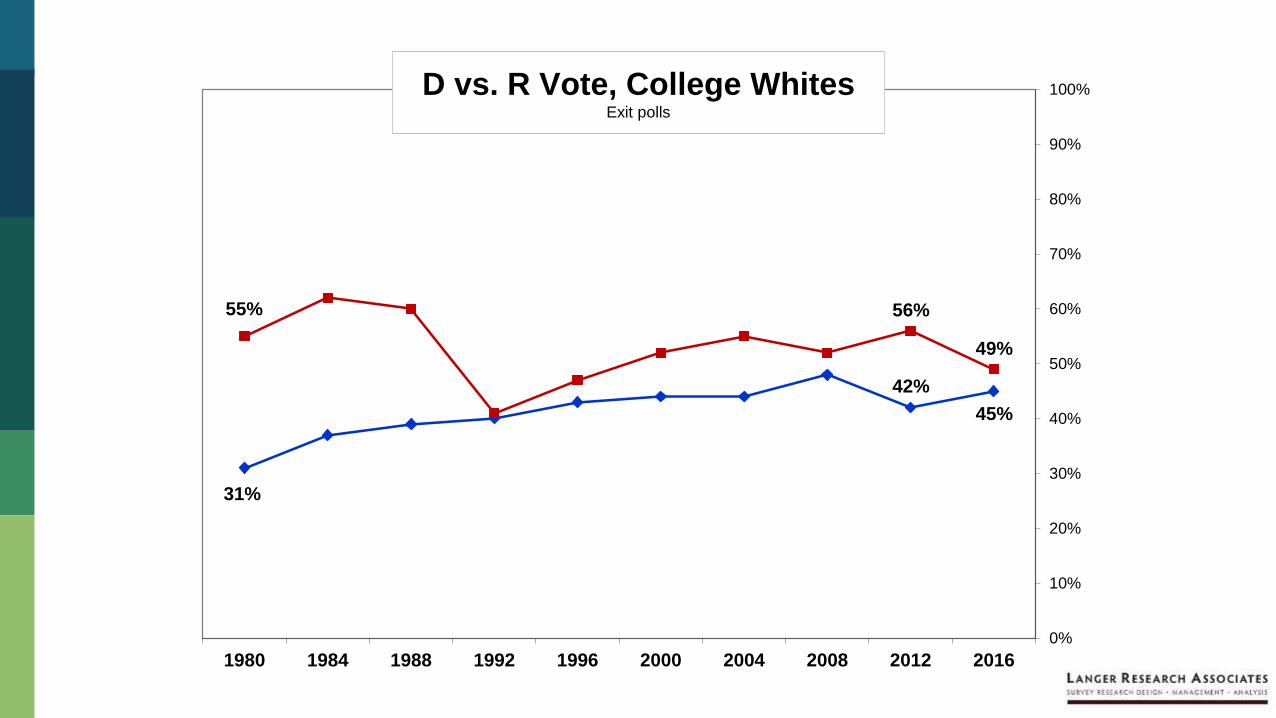
45%
42%
31%
49%
56%55%
0%
10%
20%
30%
40%
50%
60%
70%
80%
90%
100%
2016201220082004200019961992198819841980
D vs. R Vote, College WhitesExit polls

28%36%
67%
57%
0%
10%
20%
30%
40%
50%
60%
70%
80%
90%
100%
2016201220082004200019961992198819841980
D vs. R Vote, Non-College WhitesExit polls

34%36%
65%
37%36%
26%
0%
10%
20%
30%
40%
50%
60%
70%
80%
90%
100%
2016201220082004200019961992198819841980
Non-college whites
College-educated whites
% of All Voters - Whites by Education Exit polls
Key lesson?
Discontent demands change
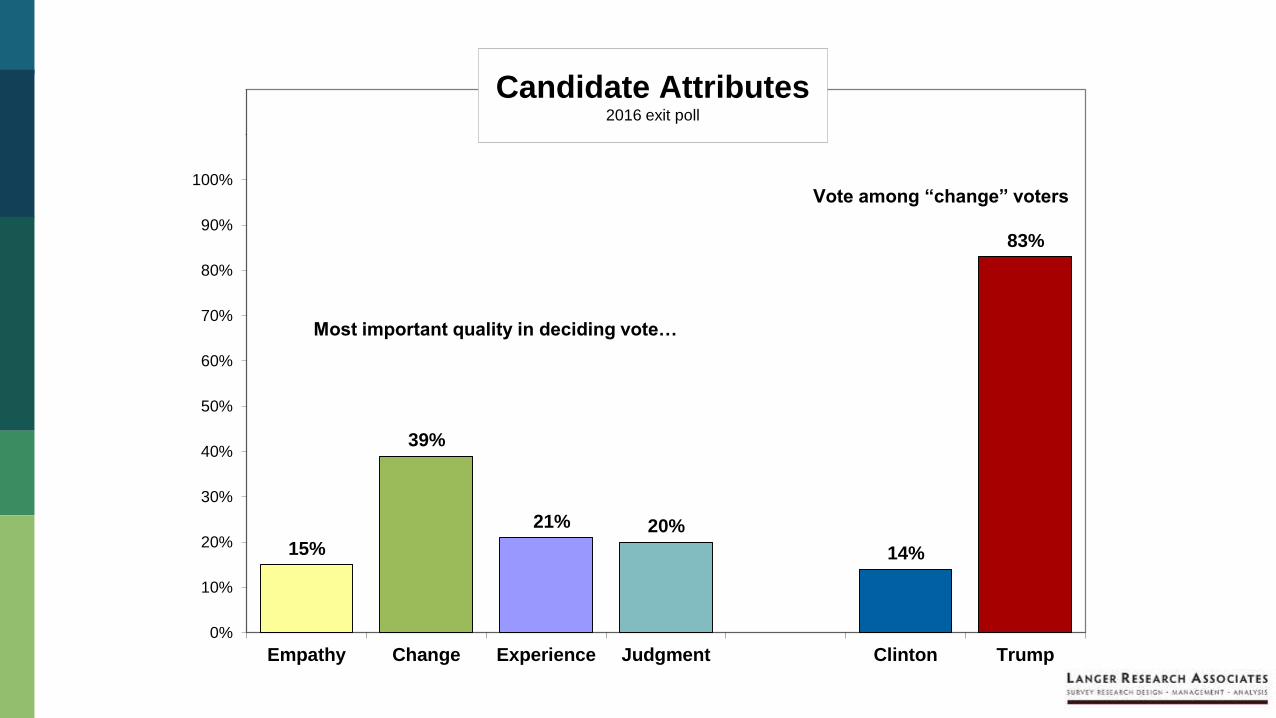
15%
39%
21% 20%
14%
83%
0%
10%
20%
30%
40%
50%
60%
70%
80%
90%
100%
110%
120%
Empathy Change Experience Judgment Clinton Trump
Candidate Attributes2016 exit poll
Most important quality in deciding vote…
Vote among “change” voters

12%
34%
20%
30%
89%
9%
0%
10%
20%
30%
40%
50%
60%
70%
80%
90%
100%
110%
120%
Empathy Change Experience Values Obama McCain
Candidate Attributes2008 exit poll
Most important quality in deciding vote…
Vote among “change” voters

Thank you!ssinozich
gholyk
glanger@ langerresearch.com


![Abaddon-Election Donald Trump - Free · 2016. 11. 16. · Election Donald Trump" [...] Où est le sage? où est le scribe? où est le raisonneur de ce siècle? Dieu n’a-t-il pas](https://static.cupdf.com/doc/110x72/60af7e8bd9a3e44e4002a816/abaddon-election-donald-trump-2016-11-16-election-donald-trump-.jpg)

