Master’s Degree Project in Innovation and Industrial Management
Master’s Degree Project in Management
Technology Acceptance of Future Decision Makers
An Investigation of Behavioral Intention Toward Using
Artificial Intelligence Tools in Decision Making
Author:
Emelie Gunnarsson
GRADUATE SCHOOL
Master of Science in Innovation and Industrial Management
Supervisor: Ph D. Sven Lindmark, Gothenburg University
Master of Science in Management
Supervisor: Ph D. Luigi Marengo, LUISS Guido Carli

I
Technology Acceptance of Future Decision Makers
An investigation of Behavioral Intention Toward Using Artificial Intelligence Tools in Decision
Making
By Emelie Gunnarsson
© Emelie Gunnarsson
School of Business, Economics and Law, University of Gothenburg
Vasagatan 1 P.O. Box 600, SE 405 30 Gothenburg, Sweden
All rights Reserved.
No part of this thesis may be reproduced without the written permission by the author.
Contact: [email protected]

II
Acknowledgements
I would like to express my sincere gratitude to the people that contributed to this master thesis. Firstly,
to the professor and supervisor of the School of Business, Economics and Law, University of
Gothenburg, Sven Lindmark for his continuous support, guidance and motivation throughout the
research process. I would also like to express my appreciation to professor Luigi Marengo at LUISS
University, Rome, for his immense knowledge on the area of Decision Making and his valuable input
to this master thesis. Furthermore, I would like to express my gratitude to my partner John Skoglund,
who has been encouraging me and believed in me during this master thesis journey. At last, I would
like to express my gratitude to my dear friends Izabella Jedel and Angus Palmberg who has brought
in valuable feedback in the research process and who were motivating me and providing me positive
energy to complete this master thesis.
Gothenburg, June 5th, 2020
______________________
Emelie Gunnarsson
III
Abstract
Essay/Thesis: 30 ECTS
Program: MSc in Innovation and Industrial Management &
MSc in Management
Semester/Year: Spring/2020
Supervisor: Sven Lindmark & Luigi Marengo
Keywords: Technological advancements, Technology, Big data, Data driven
decision making, Decision Making (or DM), Decision Support System
(or DSS), Decision Support, Decision aid, Intelligent decision support
system, Artificial intelligence (or AI), Automation, Risk, Technology
Acceptance Model (or TAM), History, Development, Definition,
Concepts and Organization (or Organisation).
Background & Purpose: Rapid technological advancements makes it difficult for organizations
to keep up, this alongside with the world becoming more and more
digital results in large amount of data being produced. The
technological advancements and the large amount of data available
results in that AI can be used as a decision making tool in organizations,
enabling better decision making. This because humans are not rational
or logical when making decisions. The concept of bounded rationality
is introduced and it may be explained as that humans take shortcuts in
the thought process which result in suboptimal decision making. AI
enables data driven decisions to be taken and the restrictiveness of the
human mind indicates that the old way businesses made decisions are
about to change. This thesis focuses on the role of AI in decision
making. The Technological Acceptance Model (TAM) is a theory that
explains to what degree a user is intending to perform a certain
behavior. Because students are likely to reach a decision maker
position in the future working environment, the interest of this study is
to examine students’ behavioral intent to use AI as a decision support
system in their future workplace. This result in the following research
question: What factors in TAM influence business students’ behavioral
intent to use AI in decision making?

IV
Theory: The theory chapter is based upon four main sections; technological
Advancements impact on the business environment, decision making
theory, AI and TAM. The technological advancements is divided into
three subcategories; organization, people and data & information.
Decision making theory includes characteristics, definition and Simons
decision making process with five different phases; intelligent, design,
choice, implementation phase and lastly feedback. In the section about
AI, historical aspects are highlighted and a definition used in this report
is provided. Later, AI is connected to an organizational perspective and
linked to decision support system (DSS) and automation of decision
making. At last, the framework TAM is presented and its history
alongside a description of the components of TAM is provided.
Methodology: The methodology chapter is divided into four subcategorize; research
strategy, research design, research method and data analysis. Firstly,
the research strategy is described and this thesis is based upon a
deductive approach, whereas the assumptions objectivism and
positivism is the basis and this thesis takes upon a quantitative
approach. In the section research design, the quality criteria of this
thesis is described and the chosen research design cross-sectional is
described. Later, in the research method section, the secondary and
primary data collection is accounted for. At last, the data analysis is
motivated.
Result & Discussion: This study concluded that perceived usefulness (PU) is 2,43 times as
important than perceived ease of use (PEU) in influencing behavioral
intention (BI) among students of using AI as a decision making tool.
This information can be valuable when constructing systems because
it shows that time spent on improving PEU might be more useful for
the user and lead toward a stronger behavioral intent of using the
system if more time is spend on increasing the PEU of the system.

V
Table of Contents
1. Introduction 1
1.1 Background 1 1.2 Research Problem 2 1.3 Purpose and Research Question 4 1.4 Delimitations 5 1.5 Disposition 6
2. Theoretical Framework 7
2.1 Technological Advancements’ impact on the business environment 7
2.1.1 Organization 7 2.1.2 People 7 2.1.3 Data & Information 8
2.2 Decision Making Theory 8
2.2.1 Characteristics of Decision Making 8 2.2.2 Definition of Decision Making 9 2.2.3 Decision Style & Decision Makers 9
2.2.3.1 Decision Style 10 2.2.3.2 Decision Makers 10
2.2.4 Phases of the Decision Making Process 11
2.2.4.1 Intelligent Phase 11 2.2.4.2 Design Phase 11 2.2.4.3 Choice Phase 12 2.2.4.4 Implementation Phase 13 2.2.4.5 Feedback 13
2.3 Artificial Intelligence 13
2.3.1 History of Artificial Intelligence 13
2.3.1.1 1950s 14 2.3.1.2 1970s 14 2.3.1.3 1990s 14 2.3.1.4 2010s 15
2.3.2 Definition of Artificial Intelligence 15 2.3.3 The Fundamental Concepts of Artificial Intelligence 16 2.3.4 AI & Organization 18 2.3.5 Artificial Intelligence and application to Decision Making Theory 19
2.3.5.1 Decision Support System 19 2.3.5.2 The Level of Automation in Decision Making 20
2.3.6 Limitations of Artificial Intelligence 20
2.4 Technology Acceptance Model 21
2.4.1 History of the Technology Acceptance Model 21 2.4.2 The Constructs of the Technology Acceptance Model 23
2.4.2.1 Perceived Usefulness (PU) 23 2.4.2.2 Perceived Ease of Use (PEU) 23

VI
2.4.2.3 Perceived Enjoyment (PE) 24 2.4.2.4 Attitude toward using (A) 24 2.4.2.5 Behavioral Intent (BI) 24 2.4.2.6 Actual Use 24
2.4.3 Theoretical Foundations of Technological Acceptance Model 25
2.4.3.1 Self-Efficacy Theory 25 2.4.3.2 Motivational Theory 25 2.4.3.3 Cost-benefit paradigm, behavioral decision theory 25
3. Methodology 27
3.1 Research Strategy 27
3.1.1 Deductive Approach 27 3.1.2 Assumptions, Objectivism & Positivism 28 3.1.3 Quantitative Approach 29
3.2 Research Design 30
3.2.1 Quality Criteria 30
3.2.1.1 Reliability 30 3.2.1.2 Replicability 31 3.2.1.3 Validity 31
3.2.2 Cross-Sectional Research Design 32
3.3. Research Method 33
3.3.1 Secondary data collection 33
3.3.1.1 Databases 34 3.3.1.2 Key words 34
3.3.2 Primary data collection 34
3.3.2.1 Questionnaire Design 35 3.3.2.2 Sampling 36
3.4 Data Analysis 37
4. Empirical Findings 39
4.1 Internal Reliability Test, using Cronbach Alpha 39 4.2 Factor Analysis 40 4.3 Regression Test & Parameter Estimates 42
4.1.2 Causal diagram of Technology Acceptance Model 45
5. Discussion 47
5.1 Main Findings 47
5.1.1 Perceived Usefulness 48 5.1.2 Perceived Ease of Use 49 5.1.3 Attitude Toward Using 50 5.1.4 Behavioral Intent 51
5.2 Comparison to Davis Original Model 51 5.3 The Future Decision Environment in Organizations 52
6. Conclusion 53
6.1 Main Findings 53 6.2 Implications 53 6.3 Suggestion for Future Research 54

VII
7. Bibliography 55 8. Appendixes 60
A - Questionnaire Guide 60 B - Correlation Matrices 68
B.1 Perceived Ease of Use 68 B.2 Perceived Usefulness 68 B.3 Attitude Toward Using 69 B.4 Behavioral Intention 69
C- List of Exhibits 70
C.1 List of Figures 70 C.2 List of Tables 70 C.3 List of Abbreviations 71

1
1. Introduction
________________________________________________________________________________
This chapter aims to present an overview of the background setting, research problem, purpose and
research question. Furthermore, hypotheses are presented. Lastly, limitations of the thesis and a
depiction of the thesis disposition is provided in order to give the reader the structure of the thesis as
a whole.
________________________________________________________________________________
1.1 Background
Society and business environment are characterized by rapid technological advancements. The speed
and the advancements are progressing at such a level that it is becoming hard for organizations to
keep up. Nonetheless, it is of increasing importance that companies are able to manage the setting in
which businesses are currently exposed to.
“Companies don’t fail because of changes in the environment, they fail because their
leaders are either unwilling or incapable of dealing with said change”.
- (Boss, 2016)
Rosenberg (2014) emphasizes that one of the strongest drivers and creators of economic growth is
technological development. Furthermore, technological advances have the ability to cause disruptive
changes in the business environment (ibid) in which organizations operate. One example of a digital
disruptor is Artificial Intelligence. There is no clear definition of Artificial Intelligence that has been
widely accepted, due to the vast amount of applications of the broad range of technologies it provides.
However, in this report, the following definition will be used: “The theory and development of
computer systems able to perform tasks normally requiring human intelligence” (Oxford English
Dictionary, n.d.). Artificial Intelligence, or AI, interrupts the status quo, consequently impacting
businesses, companies, industries and professions (Doshi, Balasingam & Arumugam, 2020). Again,
adapting to change keeps us at the forefront of the competitive edge (Boss, 2016).
The world is becoming more and more digital, resulting in a large amount of produced data. This data
needs to be properly collected and managed (Pereira, Belo & Ravesteijn, 2018). Big data, in
comparison to data, is characterized by three main features that differentiate big data from data. At
first, huge amounts of data that are being produced (volume), that the data is generated at a higher
pace (velocity) and the sources from which the data is collected require different technologies

2
(variety) (ibid). Big data is an asset that enables enhanced insights, decision making and process
automation (Gartner IT Glossary, n.d.). Big data technology enables organizations to lower costs,
increases speed of processing information and allows new data and models that results in better
decision making (Davenport, 2014, p. 115).
Despite the advantages of AI as a decision making tool it might not be used to the expected extent.
This is because there is a discrepancy between normative decision theory, how humans ought to make
decisions, and descriptive decision theory, how decisions actually are made. Humans are not rational
or logical when making decisions. The base of neoclassical economic theory is that individuals will
rationally pursue behavior which minimizes the level of pain while maximizing the level of pleasure
(Swanson, 1996). Simon (1955) presented an alternative to mathematical modeling of decision
making; which is the start of the behavioral economic theory. Bounded rationality, the idea that
humans take shortcuts which will result in suboptimal decision making (ibid). In the late 1960s
cognitive psychology was added to economic theory by Kahneman and Tversky's contribution; brain
as an information processing device. Economist models of rational behavior were compared to
cognitive models of decision-making under risk and uncertainty (Kahneman & Tversky, 1979), so
called Prospect Theory. Another contribution to bounded rationality was “nudge”, referring to that
choice architectures can be altered to nudge humans into making better decisions without restricting
any option (Thaler, 2018). However, it has been argued that changing the choice architectures will
not help humans make long-term behavioral changes (Wright & Ginsberg, 2012).
1.2 Research Problem
From the rapid increases of technological advancements mentioned above, combined with the
restrictiveness of the human mind, it can be argued that the old way businesses made decisions are
about to change. The rest of the thesis therefore aims at investigating how decisions can be made
from technologies instead, and thus focuses on the role of Artificial Intelligence in decision making.
Technological advances, such as AI, develop at a rapid speed, and the number of companies that will
make use of the numerous possibilities AI provides increases. However, it is important to bear in
mind that AI does not only have positive implications but also entail risk. Amodei et al. (2016)
emphasizes the importance of understanding the challenges AI entails in order to be successful in
developing useful, relevant and important AI systems that will make organization thrive. The large
amount of data available for managers has changed how decisions are made, less on intuition and
more based on data (Brynjolfsson & McElheran, 2016).

3
Are humans the best decision makers in a business environment? According to Kahneman,
Rosenfield, Gandhi and Blaser (2016) humans are unreliable as decision makers, because the human
mind is influenced by highly irrelevant factors to make a corporate decision, such as hunger, mood
or today's weather. A study was conducted and the result was algorithms, one form of AI that is called
machine learning, was more accurate in half of the studies, and had the same accuracy as humans in
the remaining studies (ibid). Due to cost efficiencies related to machine learning compared to human
capital, algorithms also won that battle of accuracy (ibid). Marwala and Hurwitz (2017, p. 172) also
argue that decisions would be more reliable if they were made by an AI machine rather than humans.
One of the reasons mentioned is that intelligent machines reduce the impact of bounded rationality in
decision making when a machine rather than a human makes a decision (ibid, p. 41). Another
argument is that machines reduce the degree of information asymmetry in the market, resulting in
more rational markets and improve decision making ability (ibid, p. 105).
“Studies show that algorithms do better than humans in the role of decision maker”.
- (Kahneman et al., 2016)
What will the future decision environment look like? Von Krogh (2018) argues that Artificial
Intelligence will not substitute humans, rather work as an augment in order to make better decisions
that are to a higher degree based on data, while using the machines to process large amounts of data.
In contrast, Agrawal, Gans and Goldfarb (2019) believe that AI tools will work both for automating
decisions as well as an instrument to improve decision making made by humans. Most likely, the
decision environment will change in the future, and decisions made by humans, with the assistance
of machines, or decisions made in full by machines will increase (Marwala & Hurwitz, 2017, p. 7).
Furthermore, technologies such as AI have led to major changes in the economic theories (ibid, p.
103).
That the future holds more AI in managerial decision making is without a doubt. Are corporations
and future decision makers ready to make the switch to more AI as a decision making tool? Because
of the rapid advancements in AI, it has the possibility to play a bigger role in the society. Research
on innovation management has shown that in order for the technology to take on this role, it has to
be accepted by the users. One method to examine whether the future decision makers are ready to
increase the level of AI as a decision making tool is to use the Technology Acceptance Model, TAM
to examine acceptance behavior.

4
TAM is grounded in the Theory of Reasoned Action, a theory that explains to what degree a user is
intending to perform a certain behavior (Djamasbi, Strong & Dishaw, 2010). In order to find the
behavioral intent, BI, of an individual it is divided in different aspects; Perceived Usefulness (PU),
Perceived Ease of Use (PEU) whereas PEU influences PU (ibid). TAM is one of the most influential
Information Systems theories (ibid). This model will be used in this study to understand the
behavioral intent of future decision makers, within the business environment, to use Artificial
Intelligence as a tool in the decision making process.
Students undertaking a bachelor’s or a master’s degree within the field of business and economics
are likely to reach a decision maker position in the future working environment. Consequently, this
study will examine students' behavioral intent to use Artificial Intelligence as a decision aid in their
future workplace.
“The impact of a technological innovation will generally depend not only on its inventors,
but also on the creativity of the eventual users of the new technology. “
- (Rosenberg, 2004, p. 5).
1.3 Purpose and Research Question
The purpose of this thesis is to examine the behavioral intent of future decision makers in the use of
Artificial Intelligence as a decision making tool, this by using the Technology Acceptance Model.
The study focuses on students in Sweden, within the field of business and management. The research
question is displayed below:
What factors in TAM influence business students’ behavioral intent to use
Artificial Intelligence in decision making?
This research question will be broken down into a few hypotheses in order to make sense of the
interpretation of the result. Hypothesis one to five is to test if the model holds true in this survey data,
this is necessary in order to derive hypothesis six, which is related to the research question and in
detail, determine the relative effect PU and PEU has on BI. Davis (1985) concluded all of these
hypotheses to be true in his determination of TAM. Hypothesis four, however was formulated
differently in his study (have a significant effect), however because in the result Davis proved it
falsified, I changed hypothesis four to (have not a significant effect) in order to be in line with the
model constructed from his research.

5
H1: Perceived ease of use (PEU) will have a significant effect on perceived usefulness (PU).
H2: Perceived usefulness (PU) will have a significant effect on attitude toward using (A),
controlling for perceived ease of use (PEU).
H3: Perceived ease of use (PEU) will have a significant effect on attitude toward using (A),
controlling for perceived usefulness (PU).
H4: Attitude toward using (A) will not have a significant effect on behavioral intent (BI),
controlling for perceived usefulness (PU).
H5: Perceived usefulness (PU) will have a significant effect on behavioral intent (BI),
controlling for attitude toward using (A).
The result of Davis (1985) study showed that perceived usefulness had a greater impact on attitude
toward using and consequently behavioral intent than perceived ease of use. Consequently, this study
wants to test if that relationship also holds true in this survey data.
H6: Perceived usefulness (PU) will have a greater impact on behavioral intention (BI) than
perceived ease of use (PEU).
1.4 Delimitations
This paper aims to provide the reader with an understanding of the possible impacts of Artificial
Intelligence to the decision theory and the person in the decision maker position, from a managerial
standpoint. For this reason, the technological or technical aspects of Artificial Intelligence are
disregarded. Furthermore, ethical dilemmas considering the implementation of Artificial Intelligence,
such as fear about if machines will outrun humans, or any cases of a dystopian future due to Artificial
Intelligence will not be discussed.
The participants of the surveys’, that were conducted, consisted of students that are pursuing a
bachelors’ or masters’ degree at School of Business Economics and Law, University of Gothenburg.
This study is limited to understand the future decision makers of the Swedish business market and
their acceptance to AI as a decision making tool. Hence, this study is focusing on the future decision
makers of the Swedish business market.

6
1.5 Disposition
This thesis is divided into six main sections, introduction, theoretical framework, methodology,
empirical findings, analysis and discussion and at last conclusions. The main idea of each chapter is
provided in figure 1.1 below.
Figure 1.1 Overview of Research Process

7
2. Theoretical Framework
________________________________________________________________________________
This chapter presents the theoretical foundation of this thesis. First, an introduction to the
technological advancements’ impact on the business environment will be provided, divided into three
parts, organization, people and data and information. Second, a comprehensive presentation of
decision making theories based upon Simons theory of the decision making process will be presented.
Third, an overview of AI, its definition, development and progress toward taking on a bigger role in
the society will be presented. At last, a comprehensive presentation of the framework TAM which is
the basis of quantitative analysis is carried out in relation to.
________________________________________________________________________________
2.1 Technological Advancements’ impact on the business environment
2.1.1 Organization
The technological advancements taking place all over the globe is affecting the business environment
and changing it. According to Cukier (2019) major technological changes happened since 2008,
particularly in the areas of communications and AI. These technological changes have led to a new
business landscape for companies. According to Ahlstrom (2010) the technological changes currently
taking place are expanding industry boundaries, thus enabling greater competition and coopetition.
Because of globalization and technological advancements, which enables greater competition and
coopetition, companies need to be able to adapt to the changing landscape in order to survive. Being
incapable of dealing with the change taking place because of technological advancements’, might
lead to that a company will cease to exist (Boss, 2016). The speed of the changing taking place is
rapid, consequently making it difficult for companies to keep up. Nonetheless, it is crucial for a
company’s survival to be able to keep up with the changes that affect the business environment to
stay relevant (ibid).
2.1.2 People
The people in the organization are very important to determine if the technological advancement will
be accepted (Davis, 1989; Davis, Bagozzi & Warshaw, 1989), hence used or not. That being said, not
all employees in the organization are willing to adapt to change, consequently it is important to have
the right personnel (Rosenberg, 2004, p. 5). Personal that are willing to strive for change in order to
make the development of technology useful. Because the technology on its own does not have a direct

8
value, it has to be accepted and used by the personal throughout the organization in order for the value
of the technology to be established. Consequently, having the right personnel is important when new
technology has to be managed in order to adapt to changes taking place in the business environment.
Decision Support System, DSS, is a technological advancement that can help people at decision
making positions in organizations to make better decisions. Humans are not logical or rational when
making decisions. This has been shown in numerous studies (i.e. Simon, 1955; Camerer, 1998), there
is a discrepancy present between how humans ought to make decisions and how decisions actually
are made. Because of this discrepancy, humans are unreliable as decision makers (Kahneman et al.,
2016). DSS is part of the field of Artificial Intelligence, hence the focus forward will be to investigate
the role of Artificial Intelligence in decision making.
2.1.3 Data & Information
One consequence of the digitalization taking place in the society and the business environment is that
the number of data both produced and collected is increasing rapidly. Pereira, Belo and Ravesteijn
(2018) emphasizes the importance that the data needs to be properly collected and managed. This is
because data contains a lot of numbers that can be translated into information and this information is
valuable for companies because it can be used as insights when making decisions.
Big data is differentiated from data, by the description of these three features; volume, velocity and
variety (ibid). Because big data contain a lot of sequences of information while being able to
reproduce at such rapid speed big data is a tool that may favor the decision making process by
enhanced insights being present (Gartner IT Glossary, n.d.). Davenport (2014, p. 115) emphasizes the
fact that the technology advancements that have taken place, that enables big data to be collected and
managed, has a potential to lower organizational costs and increase the speed of processing
information. All in all, the big data technology enables new data and models to arise which will result
in better decision making in organizations (ibid, p. 115).
2.2 Decision Making Theory
2.2.1 Characteristics of Decision Making
Decision making may be influenced by several factors. Some of them will be discussed in the below
section. One of the characteristics of decision making is groupthink, referring to the process when
bad decisions are taken by a group because its members do not express opinions or suggest new ideas.

9
Decision makers may be interested in evaluating what-if scenarios, alternatively experimentation with
a real system that might result in failure (Sharda, Delen & Turban, 2018, p. 70).
Changes to the environment in which decisions are taken may occur continuously without the
awareness of the decision makers, thus might lead to invalidating assumptions about a situation (ibid,
p. 70). Another effect of changes in the decision environment is that the quality of the decision might
reduce because time pressure is put on the decision maker (ibid, p. 70).
When it comes to the amount of data and information available it can cause problems in decision
making because collecting information and analyzing a problem takes valuable time from the
managers, and it is hard to detect when to stop the analysis phase and actually take the decision (ibid,
p. 70). Another implication in relation to data and information might be that there is not sufficient
information in order to take an intelligent decision (ibid, p. 70). At last, there is a risk of information
overload, so to say, too much information available (ibid, p. 70).
2.2.2 Definition of Decision Making
Decision making is often referred to the process of choosing among different alternatives of actions
in order to achieve one or more goals. According to Simon (1978), managerial decision making
involves the entire management process. Simon exemplifies this by talking about planning. There are
several decisions in relation to planning: What should be done? When? Where? Why? How? By
whom? Managers in organizations set goals or plan, and as previously made clear, planning involves
decision making (ibid). Organizing or controlling is two examples of other managerial functions
which also involves decision making (ibid).
Sharda, Delen and Turban (2018, p. 71) emphasizes that efficiency often is not the main focus in
decision making tools, rather it may be a by-product obtained when pursuing the main goal
effectiveness. In this thesis, the above approach to decision making, including the entire management
process, will be followed due to it well aligned with the business area approach of this thesis.
2.2.3 Decision Style & Decision Makers
Decision aid is not useful for the end user unless it is adapted to appropriate methodologies in order
to work efficiently and correctly in the environment in which it operates. It is important to understand
how decision makers make decisions, to construct the appropriate decision tool. In order to
understand how people make decisions, the process and issues involved in decision making is

10
important. The focus on the decision making theory in this thesis will be on the business approach,
so to say, managerial decision making.
2.2.3.1 Decision Style
According to Sharda, Delen and Turban (2018, pp. 71-72) decision style may be described as how
decision makers think and react to problems that emerge. This can be decomposed as how they
perceive a problem, their cognitive responses and how values and beliefs vary between individuals
and situations (ibid, pp. 71-72). People go about making decisions in different ways, the path is not
always linear nor all steps of the general decision making process sequence followed (ibid, pp. 71-
72).
There are numerous different decision making styles. As stated above in section 2.2.3, it is important
that the system supports the manager. Hence, the fit between the manager, in detail the fit with the
decision style and the decision situation, is of high importance. As a consequence, the system should
be flexible and adaptable to different users (ibid, pp. 71-72). The system should augment the decision
makers' development of their own style, skills and knowledge (ibid, pp. 71-72). Identifying a decision
style can be done by different tests available, both o personality and temperament. By identifying the
person’s style can impose the most effective communication to take place and an ideal task can be
given for the best suited individual (ibid, pp. 71-72).
2.2.3.2 Decision Makers
Decisions in organizations are often done by individuals in smaller organizations and done by groups
in medium to large organizations. It is important to be aware of difficulties that can arise in
organizations when making decisions as a group (ibid, p. 72). The group may be composed of
personnel from different departments having different interests in the matter etc. The individuals in
the group may also have different decision styles and personality types that makes it harder to reach
an effective decision with the best possible outcome.
But what is the best possible outcome? For whom? A decision support system may help determine
different alternatives when conducting a decision, there might be group thinking present and other
biases might influence the quality of the decision. A decision aid may possibly enhance the quality
of the decision made. But in order for a decision to be fully automated, a human decision maker must
decide such a thing (ibid, p. 72). Hence, human decision making in organization is of high
importance.

11
2.2.4 Phases of the Decision Making Process
Simon (1960, p. 2) defined different phases in the decision making process; intelligence, design,
choice, implementation and feedback, whereas the implementation phase was a later addition.
2.2.4.1 Intelligent Phase
According to Simon (1960, p. 2) the intelligence phase is the first phase of decision making, the
decision maker examines reality while identifying and defining the problem. The intelligence phase
involves activities that are aiming at identifying problem situations or opportunities (Sharda, Delen
& Turban, 2018, pp. 74-76). After the organization's goals and objectives related to an issue of
concern is set, a determination takes place whether they are being met or not (ibid, pp. 74-76). When
the issue is determined, it is important to determine the significance of the problem and make a proper
definition of it (ibid, pp. 74-76).
The classification of the issue is important because it is possible to place it in a definable category,
which can lead to a solution approach (ibid, pp. 74-76). However, problems in organization might be
of complex nature. Hence it is important to be aware that complex problems might be divided into
subproblems. One of the most important decisions in this phase is related to problem ownership.
Problem ownership refers to assigning authority to solve the problem (ibid, pp. 74-76). Before moving
on to the design phase, this phase often ends with a formal problem statement (ibid, pp. 74-76). This
stage may also include monitoring the results of the implementation phase.
2.2.4.2 Design Phase
In this second phase, a model representing the system should be constructed (Simon, 1960, p. 2). The
model is constructed by making assumptions about the reality and by writing down relationships
among the variables (Sharda, Delen & Turban, 2018, p. 73). Later, all alternative courses of actions
are identified and evaluated for feasibility.
In the design phase is often a model used because it is a simplified representation of reality, this
because reality often is too complex. Later, the selection of a principle of choice, a description of the
acceptability of the solution approach, is set (ibid, pp. 77-84). The two most common principles of
choice are normative and descriptive.
A normative model can be described as a model in which the chosen alternative is the best of all
possible alternatives (ibid, pp. 77-84). Normative decision theory is based upon humans wanting to
maximizing the attainment of goals, the decision maker is rational, all possible viable actions are

12
known and decision makers can rank their desirability of all actions (ibid, pp. 77-84). However, as
discussed in the introduction, decision makers are not rational hence the introduction of descriptive
models.
A descriptive model is often mathematically based and describes things as they are believed to be
(ibid, pp. 77-84). The descriptive approach normally checks the performance only for a given set of
alternatives, rather than for all alternatives in the normative model (ibid, pp. 77-84). This is resulting
in that the alternative selected often is of satisfactory level rather than optimal. The most common
approach in descriptive modeling methods is simulation. According to Simon (1960, p. 6-7) most
human decision making involves a willingness to settle for a satisfactory solution. This because there
often is time pressure or that the ability to achieve optimization is too time consuming that it might
not be worth it due to the marginal cost to obtain it. Simons (1955) theory of bounded rationality,
humans have a limited capacity for rational thinking, is one explanation of why many models are
descriptive rather than normative. An experienced decision maker often recognizes the trade-off
between the marginal cost of obtaining further information versus making a better decision (Simon,
1960, p. 6-7).
A common model used when making decisions is scenarios. According to Sharda, Delen and Turban
(2018, pp. 77-84) a scenario may be described as a statement of assumptions about the environment
of a particular system in a given time period. The scenario describes the decision and different
variables and parameters for a specific situation (ibid, pp. 77-84). What is commonly used in business
practices is a description of possible scenarios. There might be thousands of scenarios for every
decision, but some are more used than others. Commonly adopted in businesses is the worst possible
scenario, the best possible scenario or the most likely scenario.
2.2.4.3 Choice Phase
The choice phase includes proposed solutions to the model, not necessarily to the problem it
represents (Sharda, Delen & Turban, 2018, p. 73). The solution has to be tested and the result must
be of satisfactory level and show viability. This phase is often perceived as the most critical in
decision making (ibid, p. 85). In this phase, is the decision made and the commitment to follow actions
in order to reach the desired outcome. There might be some difficulties in detecting the boundary of
the design and the choice phase because some activities can be related to both phases (ibid, p. 85). In
order to have a successful phase it is important to find an appropriate solution to a model. However,
this is not the same as having a recommended solution successfully implemented.

13
Two models often used in order to derive at different choice paths is sensitivity analysis and what-if
analysis (ibid, p. 85). Sensitivity analysis is used to determine the robustness of the alternatives and
what-if analysis is used to explore any larger changes in the parameters (ibid, p. 85).
2.2.4.4 Implementation Phase
Implementation is perceived as the fourth phase of decision making, however this was a later addition
made by Simon, not part of the original model. This phase is about implementing the decision,
whereas successful implementation results in solving the problem and failure leads to a return into an
earlier phase in the process (Sharda, Delen & Turban, 2018, p. 73). The implementation can be seen
as the initiation of a new order of things or the introduction of change (ibid, pp. 85-86), not to forget
that change needs to be managed.
The implementation phase is complex because this is most often a long, involved process in putting
a recommended solution to work (ibid, pp. 85-86). There are also often challenges present when
implementing the decision, such as: resistance to change in the organization, the degree of support of
top management or training.
2.2.4.5 Feedback
In all of the phases mentioned above: intelligent, design, choice and implementation, is it possible to
return to an earlier phase because of the feedback loops available. Consequently, feedback is not seen
as a fifth phase, rather an iterative process whereas feedback may proceed and that can move you
back to a previous step in the decision making model. However, the feedback is most often done after
the implementation phase in order to learn from previous decisions and improve before the next (ibid,
p. 86). Hence, it is important to employ analytics also in the feedback process and not only when
identifying the problem or solution (ibid, p. 86).
2.3 Artificial Intelligence
2.3.1 History of Artificial Intelligence
Even if AI was established as an academic discipline back in the 1950s, the area was receiving limited
practical interest for over half a century (Haenlein & Kaplan, 2019). Because of the recent
improvements made in Big Data and computing power the interest of AI has reached the public
conversation (ibid).

14
2.3.1.1 1950s
During the second world war, Alan Turing developed a code breaking machine called The Bombe for
the British government, with the purpose of deciphering the enigma code used by German soldiers.
The Bombe has later been considered the first working electro-mechanical computer. In 1950, Turing
published “Computing Machinery and Intelligence” which explained how to create intelligent
machines and how to test their intelligence, the so-called Turing Test. The Turing Test can be
described as if a human is interacting with a machine and with another human, and cannot distinguish
them apart, the machine is said to be intelligent.
In 1952, a machine that was able to learn how to play checkers was created by Arthur Samuel,
researcher at IBM. The machine was provided with insights of human experts at the games and it
plays against itself in order to learn to distinguish good moves from bad. This is marked as a milestone
in the history of AI because the machine's ability to learn strategies by playing against itself (Royal
Society, 2017, pp. 26-28).
The Dartmouth Workshop took place during the summer of 1956, and at this workshop the term
Artificial Intelligence was coined by John McCarthy and Marvin Minsky. Participants that took part
in this workshop was later to be considered as the founding fathers of AI, i.e. Nathaniel Rochester
and Claude Shannon (Haenlein & Kaplan, 2019).
2.3.1.2 1970s
Several success stories in the field of AI in the 60s, led to funding being given to AI research, thus
more projects were enabled in the field of AI. However, in 1973 the U.S Congress started to criticize
the spending in AI research and they questioned the outlook of AI presented by researchers. The
Lighthill report noted that “in no part of the field have the discoveries made so far produced the major
impact that was then promised”. As a result, unfortunately both the British and U.S government
stopped the funding of AI projects (Haenlein & Kaplan, 2019; Royal Society, 2017, p. 28).
2.3.1.3 1990s
The machines created earlier had not been excellent just a bit higher than the average human in
performance. Not until 1997, when the first computer chess-playing system that was able to beat the
reigning world chess champion. This machine, compared to the earlier version could exploit the
increased computing power available in 1990s in order to perform searches of potential moves at a
larger scale, process over 200 million moves per second, and then just choose the best one (Campbell,

15
Hoane & Hsu, 2002). James Lighthill was at the end proven wrong, almost 25 years later, when the
machine beat the world champion present at the time (Haenlein & Kaplan, 2019).
2.3.1.4 2010s
In 2011, IBM’s robot Watson competed in Jeopardy and he was up against two earlier champions at
the gameshow and Watson won (Royal Society, 2017, p. 28).
Later, in 2016 AlphaGo, created by Google DeepMind, won four out of five games of Go against Lee
Sedol, who has been the champion at the game for more than a decade at that time (ibid). Go can be
described as substantially more complex than chess and it has long been perceived that computers
could not beat humans in this game. AlphaGo, was able to beat the champion because it was
developed by a specific type of neural network, so called deep learning (Silver et al., 2016).
2.3.2 Definition of Artificial Intelligence
The coined term Artificial Intelligence lacks a broadly agreed definition. One reason for this is that
AI is a very broad concept that covers a range of technologies and vast amounts of areas resulting in
it is hard to precise and distinct a definition (McKinsey, 2017). Burgess (2018, p. 5) highlights another
reason why AI is hard to define, there is a lack of general theory of how and what “intelligence”
consists of. A third reason why a definition of AI is hard to determine, is because its nature, what was
considered intelligent yesterday is standard today and consequently no longer perceived as intelligent
to the same extent (McKinsey, 2017; Capgemini, 2017).
Despite the fact that it is hard to establish a specific definition of AI, most of the suggested definitions
have some elements in common. These definitions relate to systems that think like humans or act like
humans and either think rationally or may act rationally. The definition that will be used throughout
this report is:
“The theory and development of computer systems able to perform
tasks normally requiring human intelligence”
- (Oxford English Dictionary, n.d.)
This definition fulfills the common agreement that the definition should constitute of the system being
able to act like humans and thinks rationally.

16
2.3.3 The Fundamental Concepts of Artificial Intelligence
AI is a widespread term that contains many different technologies and concepts. Due to the nature of
this thesis, the focus on the technological approach of AI will not be accounted for. Hence, the focus
on this short explanation of the different concepts of AI will have a business view of it, and details of
how AI works will not be discussed going forward. The most important trait of AI is that it can learn
and evolve based on its own experiences (Burgess, 2018, p. 2). Burgess (2018, p. 2) emphasizes that
it is important that AI is expressed in simple-enough terms in order to businesses to take on AI and
understand how it may help their business. If the use of AI is not communicated correctly there is an
underlying risk that AI never will reach its full potential. Table 2.1 below will explain the most
common concepts of AI.

17
Concepts Explanation of Concepts
Machine Learning (ML) The process by which an AI uses algorithms to perform AI functions.
Artificial Neural
Network (ANN)
Created when wanting AI to improve in a certain action. ANN are
designed to be similar to the human nervous system and brain. It gives
AI the ability to solve complex problems by breaking different stages
of learning into levels of data.
Deep Learning (DL) The result of when ANN gets to work. The layers in ANN processes
data and the AI gains a basic understanding. DL refers to the action of
learning “why” instead of understanding what something is.
Supervised Learning
(SL)
One method to use when training an AI model. By providing the
machine with the correct answer ahead of time, the AI knows the
answer and the question. The most common method of training
because it yields the most data.
If you want to understand why or how something happens, an AI can
look at the data and determine connections using a SL method.
Unsupervised Learning
(UL)
In contrast to SL, in the method of unsupervised learning, the AI is not
given the answer to a question. The machine is feed with data and it is
allowed to find whatever patterns it discovers.
Algorithm Algorithms can be described in AI as rules that teach computers how
to figure things out on their own. It is a construct of numbers and
commands, and they are proven very useful.
Black Box Black box learning refers to the fact that AI often requires a lot of
complex math that often cannot be understood by humans, despite this,
the output is useful information. This concept is called black box
learning, we do not care of how the computer arrived at the decision,
because we know what rules it used to get to that point.
Table 2.1 Concepts of Artificial Intelligence (Greene, 2017).
18
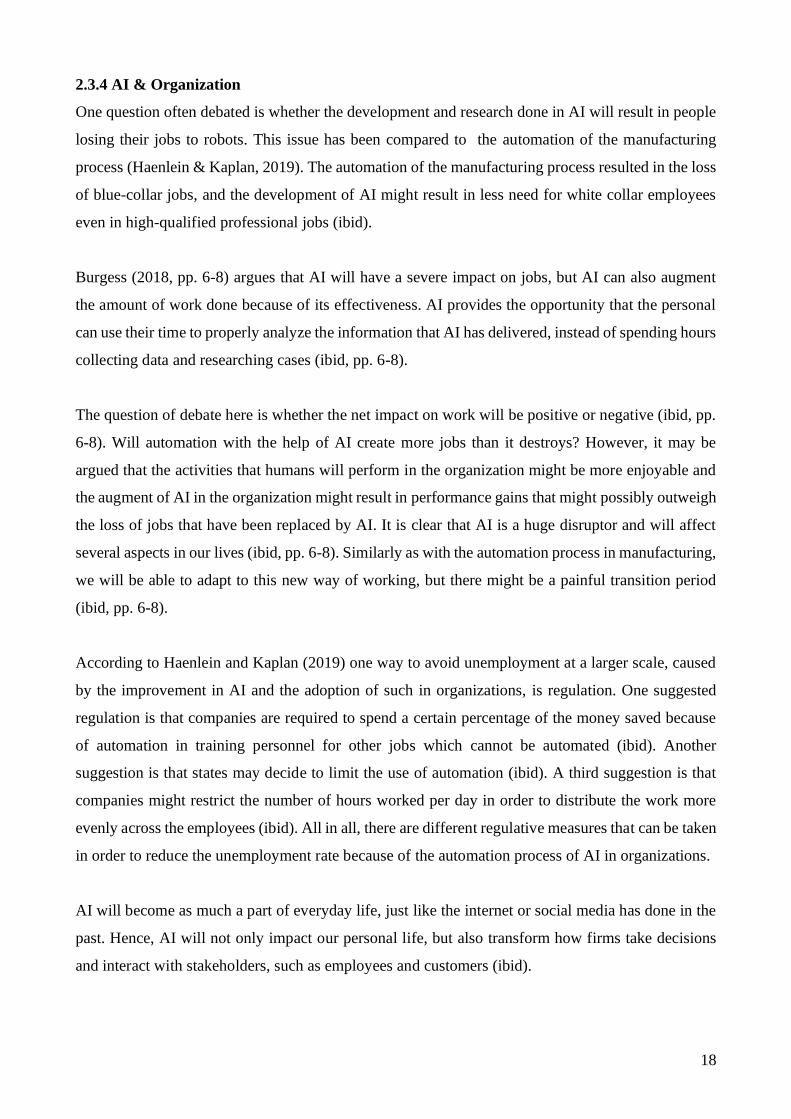
2.3.4 AI & Organization
One question often debated is whether the development and research done in AI will result in people
losing their jobs to robots. This issue has been compared to the automation of the manufacturing
process (Haenlein & Kaplan, 2019). The automation of the manufacturing process resulted in the loss
of blue-collar jobs, and the development of AI might result in less need for white collar employees
even in high-qualified professional jobs (ibid).
Burgess (2018, pp. 6-8) argues that AI will have a severe impact on jobs, but AI can also augment
the amount of work done because of its effectiveness. AI provides the opportunity that the personal
can use their time to properly analyze the information that AI has delivered, instead of spending hours
collecting data and researching cases (ibid, pp. 6-8).
The question of debate here is whether the net impact on work will be positive or negative (ibid, pp.
6-8). Will automation with the help of AI create more jobs than it destroys? However, it may be
argued that the activities that humans will perform in the organization might be more enjoyable and
the augment of AI in the organization might result in performance gains that might possibly outweigh
the loss of jobs that have been replaced by AI. It is clear that AI is a huge disruptor and will affect
several aspects in our lives (ibid, pp. 6-8). Similarly as with the automation process in manufacturing,
we will be able to adapt to this new way of working, but there might be a painful transition period
(ibid, pp. 6-8).
According to Haenlein and Kaplan (2019) one way to avoid unemployment at a larger scale, caused
by the improvement in AI and the adoption of such in organizations, is regulation. One suggested
regulation is that companies are required to spend a certain percentage of the money saved because
of automation in training personnel for other jobs which cannot be automated (ibid). Another
suggestion is that states may decide to limit the use of automation (ibid). A third suggestion is that
companies might restrict the number of hours worked per day in order to distribute the work more
evenly across the employees (ibid). All in all, there are different regulative measures that can be taken
in order to reduce the unemployment rate because of the automation process of AI in organizations.
AI will become as much a part of everyday life, just like the internet or social media has done in the
past. Hence, AI will not only impact our personal life, but also transform how firms take decisions
and interact with stakeholders, such as employees and customers (ibid).

19
2.3.5 Artificial Intelligence and application to Decision Making Theory
2.3.5.1 Decision Support System
An early framework for computerized decision support was proposed by Gorry and Scott-Morton in
the early 1970s. This framework came to evolve into a new technology, namely decision support
system, or in short DSS. The base of the model is the two categorizes “type of decision” and “type of
control (Gorry & Scott-Morton, 1971). The type of decision can either be structured, semi structured
or unstructured and the type of control can be operational, managerial or strategic (ibid).
Similarly, as the definition of AI, there is no universally accepted definition of DSS. Different persons
refer to it differently from the next. What most of the definitions have in common is that it is used for
improving the quality of the decisions made by managers (Gorry & Scott-Morton, 1989; Sharda,
Delen & Turban, 2014, p. 43). In general, DSS uses data, models and knowledge to find solutions for
semi structured and unstructured problems (Sharda, Delen & Turban, 2014, p. 62). In this thesis DSS
will refer to a narrow view, a decision support application used in organizations to guide decisions.
Furthermore, this thesis will not focus on the components of common DSS because of its business
approach.
Sharda, Delen and Turban (2014, p. 70) emphasizes that in order to develop DSS that is useful for
companies there is a need to understand the important issues involved in decision making. The
framework of decision making developed by Simon (1960) can be connected to DSS whereas it can
help in the different phases. In the first phases, the intelligence phase, DSS has proven useful when
dealing with high levels of unstructured ness in the problems (Sharda, Delen & Turban, 2014, pp. 87-
88). The design phase is about generating and forecasting consequences for different alternatives, and
DSS is useful in this phase, i.e. financial and forecasting models etc., because most DSS have
quantitative analysis capabilities (ibid, pp. 87-88). In the third phase, the choice phase, DSS has often
been supported by what-if analysis and goal-seeking analysis, this because several scenarios may be
explored before deriving at a decision (ibid, pp. 87-88). In the last phase, the implementation phase,
DSS may be used when communicating decision explanation and justification (ibid, pp. 87-88).
According to Kacprzyk, Valencia-García, Paredes-Valverde, Salas-Zárate & Alor-Hernández (2018,
p. v) could a proper application of decision making tools increase productivity, efficiency and
effectiveness. Which is important in order for the business to keep an advantage over the competitors.
DSS will allow the decision makers to make optimal choices for technological processes, planning,
logistics or investments (ibid, p. v).

20
2.3.5.2 The Level of Automation in Decision Making
The question whether AI will play a role in decision making or not is clear. However, which role it
will play and how humans and AI systems may peacefully coexist is more important to discuss.
Haenlein and Kaplan (2019) emphasizes that there is a need for a distinction in companies which
decisions should be taken by humans, AI or in collaboration between the two. Shrestha, Ben-
Menahem and Von Krogh (2019) developed a framework on this matter in an attempt to explain under
which conditions organizational decision making should be made by humans, fully delegated to AI,
a hybrid or aggregated. Hybrid decision making refers to whether AI can be used as an input in human
decision making alternatively that humans decisions as an input to AI systems. Aggregated decision
making refers to the fact that humans and AI are making decisions in parallel with the optimal
decision determined by voting.
What will be the level of automation in decision making in organizations in the future? According to
Von Krogh (2018) Artificial Intelligence will not substitute humans, rather work as an augment in
order to make decisions to a higher extent data based. The machines have the ability to process large
amounts of data so why not make use of the data that are available when making decisions in
organizations (ibid). Agrawal, Gans and Goldfarb (2019) has a similar perception as Von Krogh, they
believe that AI will improve decision making made by humans but make the addition that some
decisions probably will be suitable for automating by AI. Marwala and Hurwitz (2017, p. 7) is certain
that the decision environment will change in the future, and follows Von Kroghs reasoning that
decisions made by humans with assistance of machines or automated decisions will increase in the
future.
All of these authors mentioned above are arguing that a change in how companies will make decisions
in the future will change due to the progress made in AI. To what extent automation of decision
making in organization can only future tell.
2.3.6 Limitations of Artificial Intelligence
There are numerous opportunities for companies to make use of technological advances, such as AI.
However, it is important to remember that AI not only has positive implications for companies, it also
entails risk. Amodei et al. (2016) emphasizes that in order to be successful in developing useful,
relevant and important AI systems it is important to understand the challenges of AI. Hence, a shorter
section describing limitations of AI follows.

21
AI is in its essence objective and without prejudice, however it does not refer to that systems based
on AI cannot be biased (Haenlein & Kaplan, 2019). All data put into training the AI system and any
biases present in the input data may persist and even be amplified (ibid). How can such errors in the
input data be avoided in order to reduce biased AI systems? Haenlein and Kaplan (2019) suggests
that the most probable solution is to develop a commonly accepted requirement regarding testing and
training of AI algorithms. This can be done in combination with some form of warranty, similar to
consumer protocols used for physical products (ibid). This solution would allow stable regulation
even if the technical aspects of AI systems evolve over time (ibid).
In reference to the biases discussed above, understanding the intent of humans is complexed. Current
ML methods have a limited understanding of humans, restricted to particular domains (Royal Society,
2017, p. 30). This could possibly present some challenges in collaborative environments when robots
are collaborating with humans or when the level of automation collaborates with humans, such as
driverless cars (ibid, p. 30).
Providing large amounts of labelled training data, which some approaches to ML requires, can be
time-consuming and resource-intensive (ibid, p. 30). Another difficulty with ML methods is that there
are many constraints in the real world that it is not straightforward how to include these constraints
with the ML method (ibid, p. 30). Being able to encode such constraints, would allow more data
efficiency in the learning process.
2.4 Technology Acceptance Model
2.4.1 History of the Technology Acceptance Model
The Technology Acceptance Model, or hereafter called TAM, emerged from the Theory of Reasoned
Action (TRA) developed by Fishbein and Ajzen in 1975. TRA was used in order to predict and
explain human behavior in different settings (Davis, Bagozzi & Warshaw, 1989). The idea of the
model was that a person's behavioral intention (BI) to perform a specific behavior, determines the
performance. The behavioral intention is determined by both a person’s attitude (A) and subjective
norm (SN) with relative weights most likely to be estimated by regression (ibid). Figure 2.1 displays
the structure of the TRA model.

22
Figure 2.1 Theory of Reasoned Action, TRA (Davis, Bagozzi & Warshaw, 1989, p. 984).
Davis (1986) was interested in the field of Management Information Systems (MIS). Consequently,
he wanted to develop a model to empirically test new end-users within information systems, called
the Technology Acceptance Model, (TAM). TAM was derived from the TRA model, and the major
difference between the two models is that TAM is specifically tailored for modeling user acceptance
within information systems (Davis, 1989; Davis, Bagozzi & Warshaw, 1989).
TAM was supposed to be a helpful model, not only for prediction of behavior but furthermore, also
for explanation (Davis, 1989). The explanation part of the goal is important, because when
practitioners can identify why a system may be unacceptable, corrective steps may be taken in order
to correct and make the system better. An important note of the model is consequently, to trace the
impact of external factors on internal beliefs, such as attitudes and intentions (Davis, Bagozzi &
Warshaw, 1989).
According to Davis (1989), there are two main beliefs that can explain user acceptance, perceived
usefulness and perceived ease of use. These beliefs are linked to attitudes and usage. Perceived
usefulness is defined as “the degree to which a person believes that using a particular system would
enhance his or her job performance” (ibid, p. 320) and perceived ease of use is defined as “the degree
to which a person believes that using a particular system would be free of effort” (ibid, p. 320). The
model will be explained in more detail in the following section “2.5.2 The Constructs of the
Technology Acceptance Model”.
Later, in 1992, an addition was made to TAM in terms of a third belief, perceived enjoyment. Earlier
research had shown (Davis, 1989; Davis Bagozzi & Warshaw, 1989) that perceived usefulness had
strong links to usage intentions, however the role of enjoyment in workplace computing had not been

23
proper examined at the time. Perceived enjoyment was defined by Davis, Bagozzi and Warshaw
(1992, p. 1113) as “the extent to which the activity of using the computer is perceived to be enjoyable
in its own right, apart from any performance consequences that may be anticipated”.
2.4.2 The Constructs of the Technology Acceptance Model
The TAM model illustrates user’s behavior by explaining two general elements of acceptance, or so
called beliefs, Perceived Usefulness (PU) and Perceived Ease of Use (PEU). Easy explained, the
distinction between PU and PEU can be compared with the distinction between subjective decision
making performance and effort (Davis, 1989). The model is visualized below, see figure 2.2.
Figure 2.2 Technology Acceptance Model, TAM (Davis, Bagozzi & Warshaw, 1989, p. 985).
2.4.2.1 Perceived Usefulness (PU)
Perceived usefulness is one of the main beliefs in this model and it can be explained as to what extent
the users believe that the way using new technology enhances the performance of their jobs (Davis,
Bagozzi & Warshaw, 1989). The idea of this belief is that if people believe that an application or a
technological advancement will help in order to enhance their job performance they tend to use it. As
the model implies, see figure 2.2, PU may be affected by both perceived ease of use and external
variables.
2.4.2.2 Perceived Ease of Use (PEU)
The idea of this second belief is that even though the application might be useful, if the system is too
hard to use there is a risk that the performance benefits are outweighed by the effort of using the
application (ibid). The easier the application is perceived in relation to another application, the more
likely it is to be accepted by users, all other things equal. PEU, as figure 2.2 illustrates, is to be
determined by external factors.
24
2.4.2.3 Perceived Enjoyment (PE)
This is the third belief of the model, an addition made in 1992, consequently not part of figure 2.2
that was created in 1989. Davis, Bagozzi and Warshaw (1992) wanted to investigate whether people
tend to use computers more at work because it is useful or because it is enjoyable, apart from the
anticipated increase in performance. Carroll and Thomas (1988) suggested that enjoyment may have
a strong linkage to user acceptance, and gives an example in relation to that in the form of the Apple
Lisa computer, a forerunner of the Macintosh.
2.4.2.4 Attitude toward using (A)
Attitude toward using, A, is determined by both PU and PEU with relative weights statistically
estimated by linear regression (Davis, 1989; Davis, Bagozzi & Warshaw, 1989). PU has a positive
influence on A, because positively valued outcomes increase the means to achieve the desired
outcomes (Rosenberg, 1956). PEU plays an important role in determining A, because PEU
distinguishes two mechanisms in which PEU influences behavior and attitudes: self-efficiency and
instrumentality (Davis, 1986). The direct relationship PEU-A is present to capture the intrinsically
motivating aspect of PEU (ibid).
2.4.2.5 Behavioral Intent (BI)
Behavioral intent is determined by both the person’s attitude toward using the system (A) and its
perceived usefulness (PU), with weights estimated by regression. The relationship between BI and
PU is based on the idea that people form intentions toward behaviors in which they have a belief
would increase their performance (Davis, Bagozzi & Warshaw, 1989). The desire of the increase in
job performance, are resting in the ability that it will lead to extrinsic rewards, such as pay increase
and promotion (e.g., Vroom, 1964). The relationship between A-BI, implies that “all else being equal,
people form intentions to perform behaviors toward which they have positive affect” (Davis, Bagozzi
& Warshaw, 1989, p. 986).
2.4.2.6 Actual Use
Actual system use is the last parameter of TAM and it has a direct-relationship with BI. Hence, the
actual usage is dependent on our behavioral intent.
25
2.4.3 Theoretical Foundations of Technological Acceptance Model
2.4.3.1 Self-Efficacy Theory
PEU has a strong linkage to the self-efficacy theory developed by Bandura (1982, p. 122), in which
self-efficiency was defined as “judgements of how well one can execute courses of action required to
deal with prospective situations”. Bandura’s theory on self-efficacy makes an important distinction
between self-efficacy judgement and outcome judgement. Outcome judgement is in concern to which
extent a behavior, that has been successfully executed, is believed to be linked to a valued outcome
(Davis, 1989). These two elements, self-efficacy judgement and outcome judgement, can be related
to PEU respective PU. Following, Bandura (1982, p. 140) argues that “in any given instance, behavior
would be best predicted by considering both self-efficacy and outcome beliefs”.
2.4.3.2 Motivational Theory
Motivational theory can be divided into two main types of motivation, extrinsic and intrinsic.
Extrinsic motivation can be explained as the performance of an activity because it is perceived
important to achieve a valued outcome, such as pay, improved job performance or promotions,
distinct from the activity itself (e.g., Lawler & Porter, 1967; Vroom, 1964). On the other hand,
intrinsic motivation refers to the performance of an activity for no apparent reason other than the
process of performing the activity per se (e.g., Berlyne, 1966; White, 1959).
Connecting motivational theory to TAM, PU can be seen as an example of an extrinsic motivation
whereas an example of intrinsic motivation is PE. This can be explained further, an extrinsic
motivated user is driven by the expectation of some benefits or reward external to the system
interaction, whereas the intrinsically motivated user is driven by the benefits from the interaction with
the system per se (Brief & Aldag, 1977). To demonstrate how motivational theory is relevant for
TAM two examples follow. PU is driven by an outside benefit, so to say external to the system
interaction, for example improving job performance, consequently PU is driven by extrinsic
motivation. PE, on the other hand, specifies to what extent joy may be derived from using the system
itself, therefore PE is driven by intrinsic motivation.
2.4.3.3 Cost-benefit paradigm, behavioral decision theory
The Cost-benefit paradigm is part of the behavioral decision theory (Johnson and Payne, 1985; Payne,
1982). This paradigm is relevant to TAM and more specifically PU and PEU because it explains
people’s choice among different decision making strategies. There is a cognitive trade-off between
the effort required to utilize the strategy and the quality, or so called accuracy, of the resulting decision

26
(Davis, 1989). This, the distinction between subjective decision making performance and effort, can
be compared to the distinction between PU and PEU (ibid).

27
3. Methodology
________________________________________________________________________________
This chapter will present a comprehensive overview of how the study has been conducted. First, the
research strategy will be presented, followed by the research design and thereafter the method for
data collection and data analysis is explained. All of these sections will provide the reasoning behind
the choice and the advantages and disadvantages that are in association to the chosen research.
________________________________________________________________________________
3.1 Research Strategy
The research strategy in this thesis consists of a deductive approach, the main philosophical
assumptions objectivism and positivism and the methodological strategy chosen in this thesis is of
quantitative nature.
3.1.1 Deductive Approach
The chosen approach for this thesis is a deductive approach. The approach is characterized by deriving
hypotheses from theory, collecting data, present findings and later confirm or reject the hypothesis
made. At last, some revision of the theory may be present. This is the most common approach when
conducting quantitative research (Bell, Bryman & Harley, 2019, p. 23). Displayed in figure 3.1 please
see the model of deductive approach.
Figure 3.1 The Process of Deduction (Bell, Bryman & Harley, 2019, p. 21).
The research for this thesis was started by mapping out relevant literature by the overall research
topic, hence finding relevant theories within the research topic. After the theories are established,
hypotheses were drawn from the present theories in an attempt to explain a limited aspect of the
business organizations, in specific how decisions best are determined in business organizations. Later
the hypotheses were translated into operational terms in order to explain how data may be collected
in relation to the concepts that make up the hypothesis. Before the general data collection started a
pilot survey was made in order to establish that the questionnaire was of satisfactory level. The data
was collected by students at School of Business Economics and Law took part of the study and later
the findings were mapped. These findings made it possible to reject or confirm the hypotheses. At
last, revision of theory was made in line with the findings in the collected data. This is because that

28
the data found may not fit with the original hypotheses or that the relevance of the dataset may become
visible first after the data have been collected (ibid, p. 21).
3.1.2 Assumptions, Objectivism & Positivism
It is important to be aware of philosophy assumptions, such as ontological or epistemological
considerations when conducting research (ibid, p. 26). The lack of awareness of these assumptions
may lead to that less valuable knowledge is generated by the findings because of the lack of
consistency between the different assumptions (ibid, p. 26).
Bell, Bryman and Harley (2019, p. 26) explains that ontological considerations “is about the
assumptions we make about what it means for something to exist”. Consequently, understanding
ontological considerations such as: objectivism or constructivism is important in order to understand
reality. When there is awareness of our own ontological assumptions, it is possible to design a
research in which most effectively may capture the reality in which we seek to understand (ibid, p.
26). Objectivism can be described as that they have an objective reality, independent of our role as
an observer whereas constructionism is in regards to socially-constructed entities, so to say are made
by the actions and understanding of humans (ibid, pp. 26-27).
The second philosophical assumption that a researcher needs to be aware of is epistemological
considerations. Epistemological considerations can be understood as a particular understanding of
how researchers may gain knowledge of reality (ibid, p. 29). Hence, epistemology allows us to answer
how researchers should conduct research. Epistemological considerations can be divided in two
different main views; positivism and interpretivism. Positivism argues that “because reality exists
objectively and externally, the appropriate way to gather data is to observe phenomena directly or to
‘measure’ them using surveys or other instruments” (ibid, p. 30). Interpretivism is fundamentally
different from positivism and it requires the researcher to graph the subjective meaning of social
action (ibid, p. 31).
This thesis is based upon the ontological consideration of objectivism and the epistemological
consideration of positivism. Consequently, the understanding of what the reality is and how we can
gain knowledge of that reality is set. By the awareness of philosophical assumptions of reality it is
and what method is most suitable, it is possible to mitigate the risk of soundness of the data produced
and the knowledge generated (ibid, p. 33).

29
3.1.3 Quantitative Approach
There are two different methodological research strategies; quantitative approach and qualitative
approach. This research has applied the quantitative approach which is in line with the underlying
philosophical assumptions that are present, so to say objectivism and positivism. Quantitative
research is characterized by the quantification in the collection and analysis of data and it entails a
deductive approach, which emphasizes testing of theories (ibid, p. 35). Figure 3.2 outlines the main
steps in quantitative approach, and the research done in this thesis follows this process.
Figure 3.2 The Process of Quantitative Research (Bell, Bryman & Harley, 2019, p. 21).
Just as most research (ibid, p. 164), the process in which this thesis was conducted did not follow a
strictly linear approach, as figure 3.1 might imply. Thus, this aim of this figure is to capture the main
steps of the research conducted.
The substance in quantitative research is about the ability to measure. Hence, it is important that
concepts derived from different theories are measurable. In order to measure these concepts,
indicators can be classified as either independent or dependent variables. Measure is essential in
quantitative research because it’s underlying philosophical assumptions, earlier established as being
that an objective reality exist and that in order to develop knowledge about reality, there is a need for
being able to engage objectively with the research topic currently examined. One benefit that Bell,
Bryman and Harley (2019, p. 168) highlights with quantitative research is that being able to measure
a concept enables fine differences between subjects to be established. In contrast to qualitative
research, whereas it is often possible to detect between subjects in extreme categories, the fine
differences are harder to detect. Another aspect that measurement enables is the ability to be
consistent over time and being consistent in relation to other researchers (ibid, p. 168), thus changes
in the phenomenon measured is the only real change in the model applied. All concepts may not be
possible to measure directly, hence in this thesis I will refer to the aspects in which the concept can
be derived as indicators.

30
3.2 Research Design
The research design of this thesis will be discussed in the section below. First, by a discussion about
the quality criteria of the research, namely reliability, replicability and validity. Lastly, a review of
the chosen research design, namely cross-sectional design will be argued for.
3.2.1 Quality Criteria
According to Bell, Bryman and Harley (2019, p. 46) three common measurements for evaluating
business and management research in the quantitative research approach are reliability, replicability
and validity. Providing information about the quality of the research is important in order for the
findings to be strengthened and contribution towards knowledge may be presented. Consequently, all
of these aspects will be discussed below in regards to this thesis.
3.2.1.1 Reliability
The quality criteria, reliability, is concerned about whether the results of a study are repeatable or not
(ibid, p. 46). Reliability is important because it refers to the consistency of measuring a concept.
Reliability can be divided into three subcategories, stability, internal reliability and inter-rater
reliability (ibid, p. 172). These three types of reliability will be clarified below and how these have
been accounted for in the thesis.
Stability
Stability refers to whether a measure is stable over time or not. The most common way of displaying
this measurement is to perform a test-retest method (ibid, p. 172). There are however problems related
to this way of testing. How respondents reply at time period one, may influence how the respondents
reply at time period two. Another problem with this method is that events might happen between the
different time periods resulting in problems with consistency may arise (ibid, p. 172). Partly because
of these indicators, but also because the value of anonymity to the respondents a test-retest method
has not been performed in this thesis. Consequently, this part of reliability has not been established.
Internal reliability
Internal reliability is applied when multiple-indicator measures are present, such as in this thesis.
Internal reliability measures “whether respondents’ scores on any one indicator tend to be related to
their scores on the other indicators associated with that concept” (ibid, p. 172). The internal reliability
has been examined in this thesis through the application of Cronbach’s alpha. In a reliable scale, all
items should correlate well with the total (Field, 2018, p. 826), the correlation between all variables

31
in each model had to exceed .3, all data have an item-total correlation above .3, which is encouraging.
The accepted tolerance level was set to .80 (Davis, 1985), consequently the same tolerance level was
applied in this survey data. The internal reliability of this research showed a high quality, three of the
factors (PEU, PE & A) had ∝´s above .80 whereas two factors (PU & BI) exceeded this and showed
an ∝ above .90. Hence, the internal reliability in this study is proven high.
Inter-rater reliability
This reliability measure is most relevant when there is a great deal of subjective judgement involved
such as translation of data into categories there is a possibility of lack of consistency in these decisions
made (Bell, Bryman & Harley, 2019, p. 172). In this thesis, business decision support has been
examined through the application of the framework TAM. Resulting in that the framework is set, and
no decision has been made of how to classify different subjects because the model of the data
collection and how to analyze the result is already set by another researcher.
However, the rapid development in the field of Artificial Intelligence is changing the settings for
decision support in organizations and that might have an effect on the reliability of the study.
Consequently, if a similar study is carried out in the future, there is a risk that the conditions may be
different from today's setting. However, this study was carried out as an initial study to examine
students preferences and their poses to decision support in organization, this study may still be
considered reliable because future research may add to this research and extend on its findings.
3.2.1.2 Replicability
One aspect that is important in relation to the quality criteria is that the study is replicable, so to say,
the study’s findings need to be replicable for other researchers (ibid, p. 46). To ensure the replicability
of this study, the researchers were transparent and careful in the description of how this research was
conducted. Especially section 3.3 is written in great detail to enable the study to be replicated with
similar results in the future. Replicability of the study is important due to checking that the researchers
biases and values not contaminated the study (ibid, p. 178). If an attempt to replication not is
successful it may possibly undermine the validity of the findings in the research that was attempted
to replicate.
3.2.1.3 Validity
Validity is concerned with the integrity of conclusions made in the research (ibid, p. 46). According
to Bell, Bryman and Harley (2019, p. 46) there are four different main types of validity measurement-
, internal-, external- and ecological validity. Out of these four categories external-, internal- and

32
measurement validity was judged as applicable of this study. A discussion of these sub-categories in
relation to this thesis will follow below.
Measurement Validity
Measurement validity is concerned with if the measures really represent the concepts that they are
intended to represent (ibid, p. 46). Measurement validity can be distinguished even further, by
dividing it into sub-categorizes, face validity, concurrent validity, predictive validity, convergent
validity and discriminant validity. The one of these sub-categorized that is used in this research is
predictive validity. Predictive validity can be described as asking respondents whether they are likely
to perform a certain activity in the future (ibid, p. 175). This has been done in the questionnaire in
this thesis, when collecting the respondents intended use of decision support system in their job
position in the future, please see appendix A.
Internal Validity
Internal Validity raises the problems with causality, whether we can be sure or not that the causal
relationship is genuine and not produced by something else (ibid, p. 47). Causality will be referred to
in this thesis as the factor that has a causal impact, independent variable and the effect as the
dependent variable. The framework for this thesis is TAM, and some causal relationships have been
set between the variables. These have not been determined by the researcher performing this thesis,
but with a tested validated model and hence will be used without any precautions about the variables
causality. Hence, this validity measured has been sought after and it is not presumed to be of any
concern for this thesis.
External Validity
This is one of the most relevant validity measures of this thesis. External validity is to concern whether
the findings of the study can be generalized beyond the specific topic in mind (ibid, p. 47). As a
quantitative researcher, it is crucial that the sample is representable for the entire population in order
to validate the quality of the findings. The external validity is considered strong with the sample from
which the data collected has been randomly selected (ibid, p. 59). In the conducted study, the sampling
was not random, more on this later on section 3.3.2.2 sampling. Thus this raised some concern in
relation to the overall external validity of this thesis.
3.2.2 Cross-Sectional Research Design
Cross-sectional research design is characterized by that the answers on the different variables are
given at a single point in time and more than one case, most often employ quantitative or quantifiable

33
data and the only relationships possible to examine is between the variables (Bell, Bryman & Harley,
2019, p. 58). This design was chosen because it entails collection of data at a single point in time
referring to the fact that the data is collected more or less simultaneously. The approach of this
research was to examine students' behavioral intent of using AI tools to make decisions in the future,
so to say, their perception at a single point in time. Consequently this method was perceived as
suitable. The aspect of “cases” refers to people, or students, because their perception is crucial in
order to understand how AI might be used in decision making in organizations in the future. Derived
from the different “cases” data was collected and examined in order to find relationships and patterns
concerning these individuals.
The study carried out was of quantitative approach which is suitable with cross-sectional design
because this design enables collection of large amounts of data, hence this design was considered
appropriate for this research. Please note that the aim of establishing variation is only possible when
several cases are used, however establishing causality of the variables have proven difficult. More on
causality, please see section “internal validity” above whereas it is discussed in regards to this thesis.
3.3. Research Method
3.3.1 Secondary data collection
The secondary data collection was initially started with the conducting of a systematic literature
review. According to Bell, Bryman and Harley (2019, pp. 92-96) conducting a systematic literature
review is preferable because the actions, such as decisions, procedures and conclusions, taken by the
researcher can be traced and biases may be limited. The systematic literature review was based on the
formulated research question, that the quality of the found research was of satisfactory level and the
information found was sufficient in order to answer the defined research question.
A secondary data collection was conducted in order to acquire information on existing research on
the different fields of interest in order to understand and be able to answer the research question.
According to Bell, Bryman and Harley (2019, p. 91) benefits of using secondary data is that it is an
easily accessible and time-efficient source of high quality data. To start the secondary data collection
off, literature related to the technology acceptance model was collected. This because it felt like a
necessity to understand the theoretical model of which the primary data collection questionnaire
would be based upon. This area is fundamental for both conducting and to answer the research
question. Later the literature of decision making theory and Artificial Intelligence was collected in an
attempt to map the intersection between those areas and understand whereas the field is currently. At

34
last, literature related to decision support system, the intersection of focus between AI and decision
making, and drivers of technological advancements was mapped in order to connect the theoretical
findings.
The mixture between the different sources used throughout the theoretical framework is mainly
articles and books with an emphasis on the first. However, to complement the printed material
collected, dictionaries, government papers, consultancy reports and newspapers published online
were used as a complementary resource. The two following subcategories below will describe which
databases and keywords that were used in the systematic literature review.
3.3.1.1 Databases
Two main databases were used when collecting secondary data; Scopus and Business Source Premier.
These two were used because the author was familiar with the databases and the databases have a lot
of articles in the field of business and economics. Scopus, which was the one most used in the
collection of secondary data, only provides peer-reviewed literature and it is user friendly because the
results can be based on data or relevance. Being able to sort the findings depending on the date of
publication is important in a field that is rapidly undergoing changes, such as AI in order to receive
the latest information available on the field. In order to download the articles, when there was no
direct link connected from the database, Google scholar and Gothenburg University Library.
3.3.1.2 Key words
The following keywords were used in different combinations: Technological advancements,
Technology, Big data, Data driven decision making, Decision Making (or DM), Decision Support
System (or DSS), Decision support, Decision aid, Intelligent decision support system, Artificial
Intelligence (or AI), Automation, Risk, Technology Acceptance Model (or TAM), History,
Development, Definition, Concepts and Organization (or Organisation).
3.3.2 Primary data collection
The primary data was collected through a quantitative study, this approach was chosen because it can
be an useful approach when a large body of empirical data has to be collected. This method of
collection was appropriate because the researcher wanted to gather a large number of respondents.
The quantitative study was based upon a self-completion questionnaire.
The questionnaire was based on Davis “technology acceptance model” and aimed at investigating
students’ perception of their behavioral intent of using AI tools in relation to decision making at their

35
future workplace. The behavioral intent refers to the different components described in section 2.4.2,
such as PEU and PU but these PE, anticipated use of DSS and perceived characteristics of output.
According to Bell, Bryman and Harley (2019, pp. 233-235) there are different aspects to consider
when conducting self-completion questionnaires. This approach is convenient for the respondent
because they can choose wherever and whenever they want to complete it. The “interviewer effect”
is eliminated because there is no interviewer present. Consequently, the risk of having answers be
affected by the interviewer or the interviewee answering according to what he or she believes the
interviewer wants to hear. Another aspect that is eliminated because there is no interviewer present,
is the risk of “interviewer variability”. Self-completion questionnaire does not suffer due to the
interviewer asking questions in different orders or in different ways that might be a present risk in
other collection methods.
However, there are also negative aspects that it is important to be aware of when approaching a self-
completion questionnaire (ibid, pp. 233-235). First, there is no one present to answer any questions
that might arise during the process. Second, the problem of missing data is present in a self-
completion questionnaire. Third, there might be a risk of respondents finding the topic salient and
thus time consuming or dull. Hence, it is of great importance to produce well thought after questions
so that minimizes the risk present that the respondent chooses to leave the survey without sending the
result in, or answer the survey in a careless way. Fourth, there is a risk present in regard to the response
rate. However, during the time period this study was conducted, the virus Covid-19 was present and
distributing the questionnaires in person to class after class was not an option even if it could have
possibly increased the response rate.
3.3.2.1 Questionnaire Design
As earlier mentioned, the questionnaire was based upon research conducted by Davis and the
framework TAM was applied to an AI tool, namely DSS. In an attempt to mitigate the possible risks
with the method of choice, the design of the questionnaire was crucial. It was important that the
questions were clear and unambiguous. In order to address this matter, the self-completion
questionnaire was sent out to review and to alternate before the final version was released. It was
important that the questionnaire was easy to follow, and easy to understand and answer.
The questions were closed and the majority of the questions had a horizontal format. Closed questions
were used because of several reasons, it is both convenient for the respondents that did not have to
write long answers, but also less effort is necessary on coding which is a benefit for the researcher

36
(ibid, pp. 237-239). In order to reduce the risk of fatigue of the respondents, the questionnaire should
be as short as possible. However, this questionnaire was based upon a framework the researcher was
limited in how much could be excluded without losing value of the study. Despite the fact the number
of questions were set, the choice of having horizontal format in the questionnaire played a role,
because the questionnaire is perceived shorter in length (ibid, pp. 237-239). In the questionnaire
design it was made sure that no questions could be left blank in order to reduce the risk of missing
data for the variables. In order to increase the respondents willingness to answer the survey, the
answers were anonymous.
3.3.2.2 Sampling
The approach of the sampling was non-probability sampling, in more detail convenience sampling.
The population was defined as students undertaking a bachelor’s or master’s programme at School of
Business Economics and Law, University of Gothenburg. The size of the population was received
from Ladok, which is a platform in which all students need to be registered, and the size of the
population was 3655 students. Furthermore, the questionnaire was sent out to approximately 600
students’ and the contacts were provided by the school. Hence convenience sampling was used
because the school send out an invitation the questionnaire to a mail list in which they already had
constructed. Convenience sampling refers to that it is simply available to the researcher (ibid, p. 197),
the school that provided and sent out the questionnaire, thus this may be an example of convenience
sampling being used. Consequently, the sample size was 600 thus meaning that 1 out of 16 students
received the questionnaire. Bell, Bryman and Harley (2019, p. 197) argues that when the population
is homogeneous, such as in a company or an occupation, the amount of variation is less leading to
that the relevance of a larger sample group is less important. All participants of the study are students,
hence the homogeneity is large in the population which makes the size of the sample size less crucial.
A screening process was conducted in the self-completion questionnaire in order to make sure that
only people eligible to the study took part of it, see appendix A. In total there were 82 answers,
whereas one person no longer was a student at School of Business Economics and Law, University
of Gothenburg. Consequently, this response will not be part of the data collection it has been sifted
out of the study. The response rate of the questionnaire was 13,5% which is perceived as quite low.
However, because the nature of the sample, only contacts provided by school and that they did not
agree on taking part of the study in beforehand, that the response rate would be quite low was not
unexpected but the researcher did not expect the response rate to be this low.

37
From the data received from Ladok, 3655 students are currently undertaking a bachelor’s or master’s
programme, out of these were 45,6% males and 54,4% were females. This can be compared to the
answers to my questionnaire, in which 44,4% were males and 55,6%. None of the respondents
answered “prefer not to say” or “other” which were available in the questionnaire.
More than half of the respondents answered that they are between 24-26 years old (46), the second
largest age group were 27-30 years old (13) followed by 21-23 years old (12). The age group with
the fewest respondents were 18-20 years old which only had 2 respondents, which is in line with the
fact that you normally do not start University until you are 19 years old at earliest, with a few
exceptions. Consequently, these two individuals are most likely in their first or second year of studies
in the University.
The biggest group in terms of completed education was not too surprisingly bachelor’s degree with
65,43%. The relatively high number of respondents answering master’s degree 24,69% is a bit
worrying. Maybe there are students in their second year of studies at master’s level that perceive
themselves as more or less done with the master degree or maybe the respondents misinterpreted the
question and assigned the level of studies they are currently undertaking to the questionnaire instead
of the level they actually have completed. That only eight respondents have answered high school,
follows the same pattern, maybe people still in the bachelor answered that they were pursuing a
bachelor’s degree instead of that they have completed the high school diploma. None of the
respondents answered “PhD or higher” which is a good indication that the group of students sought
for were reached.
In the aspect of gender, the responses were quite well in relation to the population. However, age or
the level of completed education will not be compared to the population because the population data
only concerns gender, because that was the statistics Ladok, could provide. However, because the
way of sampling is done, a non-probability sampling method, it can be questioned how generalizable
the findings are because of the problem with representative samples. But the only aspect that could
be compared to the population, gender, proved to be representing the population to a satisfactory
level.
3.4 Data Analysis
Initially a reliability test was conducted in order to check the internal reliability of the measures used
in the model. The minimum reliability set out to achieve was .80, as Davis (1985, p. 96) set in the
original model.

38
In the second step a factor analysis was conducted. The aim was to construct one factor each out of
the groups of variables. However, the factor analysis model was constructed by Eigenvalues and not
by fixing the number of factors in the model, this because the researcher wanted to examine whether
the variables could be grouped into several factors or to see if the model holds and only one factor is
extracted from each group of variables. The eigenvalues were set to only retain factors with
eigenvalues greater than one, the so called Kaiser’ criterion (Field, 2018, p. 790). The model was set
to direct oblimin in SPSS statistics, referring to that correlation between the variables is allowed,
however because only one factor was constructed from each group of variables the solution cannot
be rotated. Because of the correlation between the variables, and the model set thereafter, any
correlation between any variables less than .3 is to be excluded (ibid, p. 798). By performing the
factor analysis, loading values for each factor is generated enabling the researcher to establish the
relationship between the components of the technology acceptance model. KMO (or Kaiser-Meyer-
Olkin) is a measure of sampling adequacy and a value closer to one that refers to the fact that the
factor analysis should yield a distinct and reliable factor (ibid, p. 798). In this model, a KMO value
above 0.5 is set to be acceptable. Beta values with an absolute value greater than .4 will be interpreted
as suggested in Field (2018, p. 795).
Later a regression was carried out in order to detect the point estimates of the factors relationships
and to test the hypotheses made in introduction. The confidence interval level in the regression was
set to 95% corresponding to Davis (1985). To measure the accuracy of the model, if the test was to
be carried out in the entire population instead of the sample (Field, 2018, p. 411), the relationship
between R2 and adjusted R2 was determined in the different regression models constructed. The
standardized beta was used in the regression analysis, because contrary to beta, they are not dependent
on the units of measurement of the variable (ibid, p. 415), hence easier to interpret.
The Technology Acceptance Model framework and its building block were used throughout the
process in order to analyze and contrast the theoretical and empirical findings. The empirical findings
were matched with theoretical findings and derived from this, the conclusions emerged.
39
4. Empirical Findings
________________________________________________________________________________
This chapter will present the result of the study conducted. First, a brief overview of the internal
reliability of the model is presented using Cronbach Alpha as the method of testing the reliability.
Second, a comprehensive view of the factor analysis conducted is explained. At last, a presentation
of the result of the regression carried out is presented and estimates of parameters are provided.
________________________________________________________________________________
4.1 Internal Reliability Test, using Cronbach Alpha
As explained in section 3.4, Cronbach Alpha was used in order to test the internal reliability of the
model. The achieved reliability surpassed the .80 that was set in all of the variables, and also exceeded
.90 in perceived usefulness (PU) and behavioral intent (BI), see table 4.1. As discussed in the section
about the internal reliability, the correlation between the variables had to exceed .3, all data have an
item-total correlation above .3, which is encouraging. All in all, this indicates good reliability in the
model.
There were in total four questions in the questionnaire about behavioral intent, see appendix A.
However, only variables one and two will be used because they are based on the scale 1-7 as the other
variables. The other variables, needed to be recoded into 1-7 scale items in order for them to be
applied in the factor analysis. Because, of the complexity of performing this action, the first two
variables for BI will be used, and variable three and four will not be included in the model. Hence,
the item column in table 4.1 below will only show 2 items for behavioral intent.
Item two and four in attitude towards using (A) was recoded because it had harmful and negative to
the left hand side of the likert scale and beneficial and positive on the right hand side. Because all
positive words were put on the left hand side of the likert scale, these needed to be recoded in order
to not generate a negative alpha.
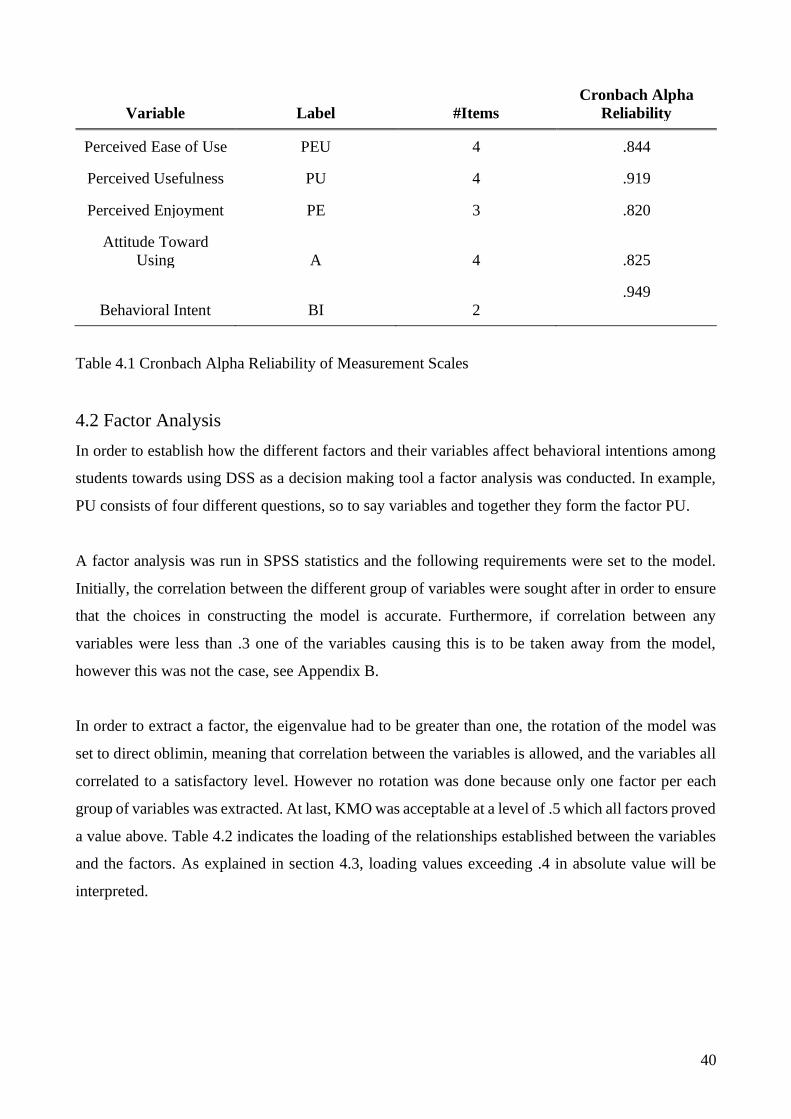
40
Variable Label #Items
Cronbach Alpha
Reliability
Perceived Ease of Use PEU 4 .844
Perceived Usefulness PU 4 .919
Perceived Enjoyment PE 3 .820
Attitude Toward
Using A 4 .825
Behavioral Intent BI 2
.949
Table 4.1 Cronbach Alpha Reliability of Measurement Scales
4.2 Factor Analysis
In order to establish how the different factors and their variables affect behavioral intentions among
students towards using DSS as a decision making tool a factor analysis was conducted. In example,
PU consists of four different questions, so to say variables and together they form the factor PU.
A factor analysis was run in SPSS statistics and the following requirements were set to the model.
Initially, the correlation between the different group of variables were sought after in order to ensure
that the choices in constructing the model is accurate. Furthermore, if correlation between any
variables were less than .3 one of the variables causing this is to be taken away from the model,
however this was not the case, see Appendix B.
In order to extract a factor, the eigenvalue had to be greater than one, the rotation of the model was
set to direct oblimin, meaning that correlation between the variables is allowed, and the variables all
correlated to a satisfactory level. However no rotation was done because only one factor per each
group of variables was extracted. At last, KMO was acceptable at a level of .5 which all factors proved
a value above. Table 4.2 indicates the loading of the relationships established between the variables
and the factors. As explained in section 4.3, loading values exceeding .4 in absolute value will be
interpreted.

41
Construct Mean StD Indicator Loading, β
PEU1 2.8395 1.29862 .616
PEU2 3.5432 1.21500 .778
PEU3 2.9383 1.25843 .875
PEU4 3.3210 1.13828 .781
PU1 2.6790 1.28284 .849
PU2 2.5432 1.29469 .847
PU3 2.5556 1.14018 .868
PU4 2.4938 1.23616 .883
A1 2.4568 1.19425 .682
A2 2.3704 1.21906 .838
A3 2.4691 1.11900 .911
A4 2.6296 1.35503 .563
BI1 2.7037 1.31762 .951
BI2 2.6296 1.25941 .951
Table 4.2 Measurement Statistics of Variables
The measurement statistics of the factors created in the factor analysis are displayed below in table
4.3. The mean refers to the seven likert scale in the questionnaire whereas the lower the mean,
indicates that the students’ perceive the factor more likely to influence whether they will use the DSS
or not. The mean refer to the number one to seven at the likert scale in the questionnaire, whereas
they refer to: extremely likely (1), quite likely (2), slightly likely (3), neither (4), slightly unlikely (5),
quite unlikely (6) and extremely unlikely (7). Table 4.3 show that the mean varies from 1.85 to 2.54
referring to that a positive perception of students willing to use DSS as a decision making tool exist
in the data set.

42
Construct Mean StD
PEU 2.4176 .77755
PU 2.2122 .95824
A 1.8479 .74622
BI 2.5360 1.19586
Table 4.3 Measurement Statistics of Factors Constructed from Variables
4.3 Regression Test & Parameter Estimates
Table 4.4 provides an overview of the OLS regressions carried out in order to confirm or reject
hypotheses. Which independent variables that will be included for each dependent variable is given
from the constructs of TAM framework, see figure 2.2. As explained in section 3.4, the difference
between R2 and adjusted R2 is aiming to be as small as possible. In example, if the difference is (.170-
.160) it accounts for approximately 1% less variance in the outcome if the model were to be derived
from the population rather than the sample. The model would have approximately 1% - 1,6% less
variance in the outcome if it were to be derived from the population rather than a sample.
Beta, β, may be interpreted as if PEU increases by one standard deviation (.126), see table 4.5, PU
increases by .412 standard deviations. The significance level accepted in this model is p < .05, because
of the framework. The significance level is the probability of rejecting the hypothesis when it is true,
this level of significance indicates that there is a 5% risk of concluding that a difference exists when
there is no actual difference.

43
Dep. Var. R2 Adj. R2 Ind. Var. β t. stat Sig. Lvl.
PU .170 .160 Constant 3.067 .003
PEU .412 4.024 .000
A .495 .482 Constant 3.085 .003
PEU -.002 -.025 .980
PU .704 7.971 .000
BI .379 .363 Constant 2.227 .029
PU .428 3.411 .001
A .234 1.861 .067
Table 4.4 TAM Regression Tests
Table 4.4 establishes that four of the hypotheses may be accepted (H1, H2, H4 & H5) and one rejected
(H3). The last hypothesis (H6) will be explained after table 4.6 is presented. Hypothesis one (PEU
will have a significant effect on PU) was supported. Table 4.4 displays that PEU has a significant
effect on PU with the level of p < .001. Meaning, that if the student finds the use of the decision
support system easy to work as an aid in decision making, the student is more likely to find it useful
as well. β, may be interpreted as if PEU increases by one standard deviation (.126), see table 4.5, PU
increases by .412 standard deviations. The second hypothesis (PU will have a significant effect on A,
controlling for PEU) was also supported. This relationship was found significant at a level of p <
.001, see table 4.4. This indicates that if the student finds the decision support system to be useful to
work as an aid in making decisions, the student will develop a favorable attitude toward it. β, may be
interpreted as if PU increases by one standard deviation (.103), see table 4.5, A increases by .704
standard deviations. Hypothesis five (PU will have a significant effect on BI, controlling for A) was
also supported. This relationship was found significant at a level of p < .001, see table 4.4. This
indicates that if a student that uses the decision aid perceived it as useful, the student will have a
positive intention toward using the system in decision making. β, may be interpreted as if PU
increases by one standard deviation (.113), see table 4.5, BI increases by .428 standard deviations,
accounted for A.
Hypothesis three (PEU will have a significant effect on A, controlling for PU) was rejected. Table
4.4 indicates that this relationship is significant at a level of p < .980. The level of significance
acceptance was set to, p < .05, the effect PEU has on A, accounted for PU, is consequently not
significant counter to what the hypothesis were made out.
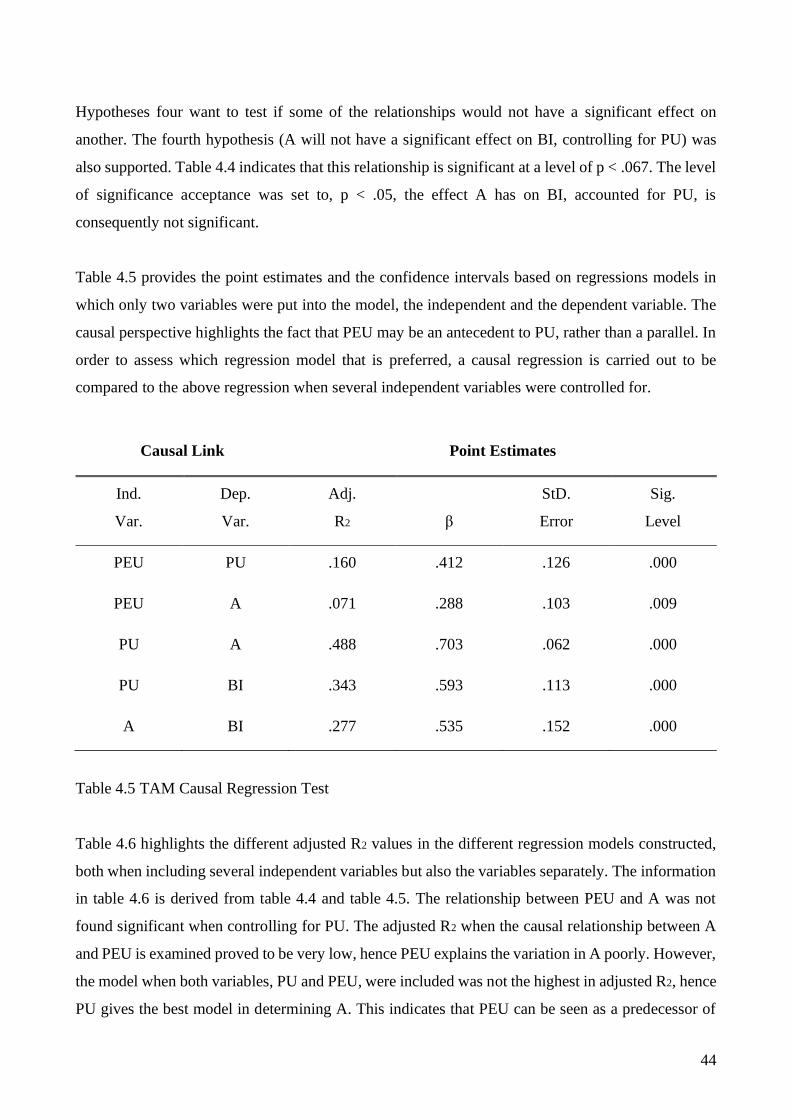
44
Hypotheses four want to test if some of the relationships would not have a significant effect on
another. The fourth hypothesis (A will not have a significant effect on BI, controlling for PU) was
also supported. Table 4.4 indicates that this relationship is significant at a level of p < .067. The level
of significance acceptance was set to, p < .05, the effect A has on BI, accounted for PU, is
consequently not significant.
Table 4.5 provides the point estimates and the confidence intervals based on regressions models in
which only two variables were put into the model, the independent and the dependent variable. The
causal perspective highlights the fact that PEU may be an antecedent to PU, rather than a parallel. In
order to assess which regression model that is preferred, a causal regression is carried out to be
compared to the above regression when several independent variables were controlled for.
Causal Link Point Estimates
Ind.
Var.
Dep.
Var.
Adj.
R2 β
StD.
Error
Sig.
Level
PEU PU .160 .412 .126 .000
PEU A .071 .288 .103 .009
PU A .488 .703 .062 .000
PU BI .343 .593 .113 .000
A BI .277 .535 .152 .000
Table 4.5 TAM Causal Regression Test
Table 4.6 highlights the different adjusted R2 values in the different regression models constructed,
both when including several independent variables but also the variables separately. The information
in table 4.6 is derived from table 4.4 and table 4.5. The relationship between PEU and A was not
found significant when controlling for PU. The adjusted R2 when the causal relationship between A
and PEU is examined proved to be very low, hence PEU explains the variation in A poorly. However,
the model when both variables, PU and PEU, were included was not the highest in adjusted R2, hence
PU gives the best model in determining A. This indicates that PEU can be seen as a predecessor of

45
PU and not a determine in directly influencing A. A was not found significant in affecting BI when
controlling for PU, and when R2 is compared in the models below, A explains the variation in BI less
than PU or the when accounting for both variables in the model. However, in this case the best model
is when both PU and A are accounted for.
Dep. Var. Ind. Var. Adjusted R2
A PEU .071
PU .488
Both are included .482
BI PU .343
A .277
Both are included .363
Table 4.6 Compilation of Adjusted R2 in Different Regression Models
Hypothesis six (PU will have a greater impact on BI than PEU) was confirmed. The direct relationship
between PEU and A showed that PEU is not a good determinant of the explanation is A. Furthermore,
A (which is a component of PU and PEU) did not explain the variation in BI well, but PU showed
significant in hypothesis two and five and also showed to be a good predictor of both A and BI in the
direct relationship. Furthermore, figure 4.1 enables calculations of the relative importance of the
different factors in influencing behavioral intent. PU has both a direct (.593) and an indirect effect
via A (.703.535) in influencing BI, combined this refers to .969. Whereas PEU has an effect through
PU (.412*.969) resulting in an effect of .399. Comparatively, PU is therefore 2,43 times as important
in influencing behavioral intent in the survey data. Hence, PU have a greater impact on BI than PEU.
4.1.2 Causal diagram of Technology Acceptance Model
The findings above indicate that PEU is a predecessor of PU and the constructs of TAM would look
like this if the beta values of the regressions are inserted into the model. This figure aims to provide
an easy overview of the relationships in the survey data. This will enable other researchers to compare
this figure to their own findings about the constructs of TAM.

46
Figure 4.1 Diagram of Technology Acceptance Model

47
5. Discussion
________________________________________________________________________________
This chapter starts by applying the TAM into the gathered data in order to structure and analyze the
findings. The researcher first explain the main findings, and later displays the findings in relation to
the different components of TAM. Simultaneously, the findings are set in relation to the theoretical
framework in order to deepen the level of discussion.
________________________________________________________________________________
5.1 Main Findings
The internal reliability test performed of the data set indicated that there were a good internal
reliability in the model, see table 4.1. Whereas, PU and BI where the components which the highest
result of the Cronbach Alpha test.
The factor analysis showed that each group of variables (PU, PEU, A, BI) each could be categorized
into one factor with different loading indicators, see table 4.2. The fact that they naturally formed one
factor each among the groups, even if the model of the factor analysis allowed more than one factor
to be formed ensured the quality of the variables and the correlation between them as strong. The
measurement statistics of the factors created from the variables is indicated in table 4.3. The mean
refer to the number one to seven at the likert scale in the questionnaire, whereas they refer to:
extremely likely (1), quite likely (2), slightly likely (3), neither (4), slightly unlikely (5), quite unlikely
(6) and extremely unlikely (7). Table 4.3 show that the mean varies from 1.85 to 2.54 referring to that
a positive perception of students willing to use DSS as a decision making tool exist in the data set.
Regressions were carried out in order to test the hypotheses made in the introduction, same as Davis
concluded true in the model back in 1985. These regressions were carried out with more than one
independent variable (in exception to H1), because the research wanted to examine whether the
variable had a significant effect of a certain variable controlling for another variable. The test
confirmed first four of the hypotheses, (H1: PEU will have a significant effect on PU), (H2: PU will
have a significant effect on A, controlling for PEU), (H5: PU will have a significant effect on BI,
controlling for A) and (H4: A will not have a significant effect on BI, controlling for PU), see table
4.4. Hypothesis three, (PEU will have a significant effect on A, controlling for PU) was rejected. The
result of this are that PEU and A does not have a significant effect of PU respectively BI controlling
for PU.

48
The relationship between the different factors were also tested when not controlling for another factor,
see table 4.5. The result of this showed that all variables were significant to the model at the desired
significance level, when not controlling for another variable. However, in order to discuss the
relevance of this test the R2 value in the different models were compared. Table 4.6 displays that R2
was the highest when only PU was seen as a determinant of A and when both PU and A where seen
as a determinant of BI. Hence, the construction of figure 4.1 where PEU is seen as a predecessor of
PU rather than a parallel and PEU are displayed as not having an direct relationship with A, as first
indicated in figure 2.2.
The point estimates derived from the regressions, enabled calculation of the relative importance of
different factors in influencing behavioral intention. This enabled calculation of the relative
importance of PU and PEU in affecting BI. PU was 2,43 times as important in influencing BI than
PEU in the survey data, hence hypothesis six was also confirmed (H6: PU will have a greater impact
on BI than perceived ease of use PEU).
The construct of the causal diagram of TAM enables an accessible view of the relationships
established in table 4.2, 4.4. and 4.5. As Davis concluded in studies conducted in 1985 and 1989,
there are two main beliefs that explain user acceptance, PU and PEU. PU is related to “the degree to
which a person believes that using a particular system would enhance his or her job performance”
(Davis, 1989, p. 320) and PEU as “the degree to which a person believes that using a particular system
would be free of effort (ibid, p. 320). As the causal diagram, see figure 4.1, suggests is PU and PEU
the main building blocks of the model leading up to attitude toward using (A) and behavioral intention
(BI). A more detailed view of the different components and how they affect the behavioral intention
of students will be displayed in below sections.
5.1.1 Perceived Usefulness
The idea of PU is that if people believe that an application or a technological advancement will help
in order to enhance their job performance they tend to use it. As the model implies, see figure 2.2
alternatively figure 4.1, PU may be affected by both perceived ease of use and external variables. The
factor PU is compounded by four variables (PU1, PU2, PU3, PU4). Whereas PU1 (improve job
performance), PU2 (increase productivity), PU3 (enhance effectiveness) and PU4 (useful), see
appendix A. The factor analysis showed that PU4 had the highest influence of the construct of PU
followed by PU3, PU1 and lastly PU2. The factor PU constructed had a mean value of 2.21 referring
to somewhere between “quite likely” and “slightly likely” on the likert scale, with more emphasize
on the first.

49
Two regressions were carried out with PU as the independent variable. The first was in relation to
H2, whereas the significant effect PU had on A was tested controlling for PEU. This relationship was
found significant at a level of p = < .001. The second was in relation to H5, whereas the significant
effect PU had on BI was tested controlling for A. This relationship was also found significant at a
level of p = < .001. Hence, PU is a strong determinant in this model. The R2 value in the different
regression models were analyzed in order to calculate PU’s and PEU’s influence in behavioral intent.
PU had a combined effect of .969 and PEU .399, resulting in that PU is 2,43 times as important in
influencing behavioral intent in this study.
As mentioned in the theoretical framework, PU can be seen as based upon an extrinsic motivational
basis. Driven by the expectation of some benefit or reward external to the system interaction (Brief
& Aldag, 1977). Consequently, as PU is an important determinant of user acceptance, it is important
to understand how companies may exploit the knowledge of pursuing extrinsic motivations to reward
appreciated behavior. Most companies have experienced having personnel that are unwilling or
reluctant to change the way they work, having the right personnel is crucial (Rosenberg, 2004, p. 5).
The technology on its own does not have a direct value, unless it is accepted and used by the personal
across the company. Hence, having the right personnel is important when rapid technological
advancements requires new systems to be managed.
5.1.2 Perceived Ease of Use
The idea of PEU is that even if the application might be useful, if the system is too hard to use there
is a risk that the performance benefits are outweighed by the effort of using the application (Davis,
Bagozzi & Warshaw, 1989). The easier the application is perceived in relation to another application,
the more likely it is to be accepted by users, all other things equal. However, the result of this study
implies that the importance of PEU is less than first perceived by Davis in 1985. As the model implies,
see figure 2.2 alternatively figure 4.1, PEU may be affected by external variables. The factor PEU is
compounded by four variables in this study (PEU1, PEU2, PEU3, PEU4). Whereas PEU1 (learning
to operate), PU2 (get DSS to do what I want), PU3 (easy to become skillful) and PU4 (find easy to
use), see appendix A. The factor analysis showed that PEU3 had the highest influence of the construct
of PEU followed by PEU4, PEU2 and lastly PEU1. The factor PEU constructed had a mean value of
2.42 referring to somewhere between “quite likely” and “slightly likely” on the likert scale, with more
emphasize on the first, however not as much emphasizes as on PU.

50
The study showed that PEU had a significant effect on PU with p < .001. Meaning that the application
is found more useful if it is perceived as easy to use. Hypothesis three, PEU will have a significant
effect on A when it is controlled for PU was rejected (p < .980). However, table 4.5 displays that PEU
has a significant direct effect on A, when it is not controlled for PU at a level of p < .01. Hence, PEU
is not totally irrelevant in explaining A. However, since R2 is larger when only PU is seen as a
determiner of A, PEU is seen as a predecessor of PU and not directly in influencing A.
As earlier discussed, PEU did not influence behavioral intention of students as much as PU did.
However, in today's business environment a lot of time and money is spent to develop as user friendly
tool as possible. Maybe some of this resources would be more efficient used in explaining the
usefulness of the system, because this have a bigger influence of the behavioral intent, just as it did
in Davis study. However, because that PEU is a building block of PU, it cannot be seen as unimportant
in explaining behavioral intention. In the self-efficacy theory developed by Bandura (1982, p. 140)
he argues that behavioral would be best predicted by considering both “self-efficacy judgements”
(PEU) and “outcome judgements” (PU).
5.1.3 Attitude Toward Using
Attitude toward using is determined by both PU and PEU with relative weights statistically estimated
by linear regression (Davis, 1989; Davis, Bagozzi & Warshaw, 1989). The idea of A is that if people
have a positive attitudes toward using the application, the behavioral intention is positive. As the
model implies, see figure 4.1, A may be affected by both PEU and PU. This by PEUs indirect relation
through PU. The factor A is compounded by four variables (A1, A2, A3, A4). Whereas A1 (using
DSS, good or bad), A2 (using DSS, beneficial or harmful), A3 (using DSS, wise or foolish) and A4
(using DSS, positive or negative), see appendix A. The factor analysis showed that A3 had the highest
influence of the construct of A followed by A2, A1 and lastly A4. The factor A constructed had a
mean value of 1.85 referring to somewhere between “extremely likely” and “quite likely” on the likert
scale, with more emphasize on the second.
Attitude toward using, just as hypothesis four implied, did not have a significant effect of behavioral
intention when it was controlled for PU, p < .01. However, when the causal relationship between A
and BI was established it was found significant at a level of p < .001. The R2 values of the different
models were compared, and the R2 with the highest value, corresponding to when both A and PU was
used as a determinants of BI. Hence, this relationship, between A and BI is kept in figure 4.1.
51
5.1.4 Behavioral Intent
Behavioral intent is determined by both the person’s attitude toward using the system (A) and its
perceived usefulness (PU), with weights estimated by regression, see table 4.4. The relationship
between BI and PU is based on the idea that people form intentions toward behaviors in which they
have a belief would increase their performance (Davis, Bagozzi & Warshaw, 1989). As explain in the
section about PU, the desire of increase in job performance rest in that the belief that will lead to
extrinsic rewards (e.g., Vroom, 1964). The direct relationship between A and BI implies that all else
being equal, people for intentions to perform behaviors toward which they have positive affect (Davis,
Bagozzi & Warshaw, 1989).
The direct relationship between BI and PU were significant at a level of p < 0.001 when controlling
for A, whereas the relationship between BI and A not were found significant to a satisfactory level,
when controlling for PU. However, because the R2 value is bigger when both factors were included
in this model, this is accounted for in figure 4.1. PU was accounted to be 2,43 times as important than
PEU in determining BI. Hence, this is important to take into account when systems are designed.
DSS is a tool that can help people at decision making positions in organizations to make better
decisions. DSS is based on AI and the availability of amounts of data needed to be processed. These
data can be translated into information that is valuable for companies when making decisions (Pereira,
Belo & Ravesteijn, 2018). This has the potential to lower organizational costs and increase the speed
of processing information (Davenport, 2014, p. 115). Thus, enabling new data and models to arise
which will result in better decision making in organizations.
The behavioral intention among students at School of Business Economics and Law, University of
Gothenburg to use DSS in their future workplace is perceived as fairly high. PU is seen as the single
one most important factor in determining the behavioral intent among students perception of using
DSS in their future workplace. The effect PEU has is not unimportant, because it explains PU. To
conclude, the relative importance in influencing BI is larger in PU than PEU.
5.2 Comparison to Davis Original Model
In Davis (1985), original construct of TAM there is one relationship that differ to the findings in this
thesis. This is the relationship between perceived ease of use and attitude toward using. Davis found
that perceived ease of use is significant in affecting attitude toward using when controlling for
perceived usefulness, p < .05. Table 4.4 displays that PEU is not found significant when controlling
for PU in affecting A. Hence, the direct relationship between PEU and A is not included in figure 4.1.

52
It is interesting to discuss why this relationship between PEU and A, when controlling for PU
differentiate from the original findings by Davis. It could be argued that perceived ease of use were
seen as more important before the digitalization era took place. Today people use technological
advancements such as internet every day and thus indicating that user systems are not that hard to use
resulting in that maybe the importance of perceived ease of use no longer holds. However, it is
important to point out that the respondents of the questionnaire of this thesis has not yet been
introduced to a decision support system, the answers in the survey is only based upon their perception.
5.3 The Future Decision Environment in Organizations
Despite the advantages of AI as a decision making tool it is today not used to the expected extent.
This study shows that the behavioral intention among students of using decision support system in
their future workplace is strong. Hence, there is a need of understanding the business environment
and how this might affect it and how changes can be derived. The large amount of data available for
managers, in combination with the rapid technological advancements in AI drives how decisions are
made, less on intuition and more data based (Brynjolfsson & McElheran, 2016). This in combination
of the restrictiveness of the human mind, it can be argued that the old way businesses made decision
are about to change.
As human has proven unreliable as decision makers (e.g., Kahneman et al., 2016; Marwala &
Hurwitz, 2017; Sharda, Delen & Turban, 2018) the level of automated decisions or hybrid decisions
are about to increase. As an organization in this changing business environment it is important to stay
up to date on these rapid changes taking place, and adapt in order not to fail. The result of this study
provides information that the future decision makers of the businesses in the Gothenburg region are
ready to use AI in order to improve decision making in organizations. Hence, now it is up for the
organizations to be ready for switching to more AI as a decision making tool.
However, it is also important to discuss the possible effects of AI systems taking on a bigger role in
decision making. Because it is crucial that humans and AI systems peacefully coexist in
organizations. Burgess (2018, pp. 6-8) argues that AI might have a severe impact of jobs, but that AI
also provides an opportunity that the work will be more effective and the use of their time more
meaningful. Haenlein and Kaplan (2019) argues that regulation is one way to avoid unemployment
at a larger scale cause by the improvements in AI. It is clear that AI is a huge disruptor and will affect
several aspects in our lives (ibid, pp. 6-8). But to what extent automation of decision making in
organizations will take place can only future tell.

53
6. Conclusion
________________________________________________________________________________
This chapter aims to answer the research question. Second, implications in the research conducted
are presented. At last, a suggestion for future research is presented.
________________________________________________________________________
6.1 Main Findings
The purpose of this research were to examine the behavioral intent among future decision makers to
use Artificial Intelligence as a decision making tool by applying the framework Technology
Acceptance Model. The research focuses on students in Sweden, within the field of business and
management and the research question was:
What factors in TAM influence business students’ behavioral intent
to use Artificial Intelligence in decision making?
This study established that perceived usefulness (PU) is 2,43 times as important than perceived ease
of use (PEU) in influencing behavioral intention (BI) among students in planning to use Artificial
Intelligence as a decision making tool. This information is valuable when constructing user systems
because time spent on improving PEU might be more useful for the user and lead toward a stronger
behavioral intent of using the system if more time is spent of increasing the PU of the system.
The findings of this study may be questionable because that a nonprobability sample method has been
used when collecting the primary data of this study. However, because of the demographics provided
by the questionnaires filled in, the gender representation showed to be close to the original population.
Thus, indicating that the findings may be representative of the population to some extent.
6.2 Implications
It is important to be aware of that PU and PEU are people’s subjective appraisal of performance and
effort, and does not necessarily reflect on objective reality. In example, MIS studies has shown
discrepancies between perceived and actual performance (e.g., Sharda, Barr & McDonnell 1988).
However, Warshaw and Davis (1985) argues for that self-predictions, are among the most accurate
predictors available for an individual’s future behavior. Consequently, because there are few other
predictors of future behavioral available this measurement is perceived as acceptable in the model.

54
This study also focus on the perception of students behavioral intent not their actual behavioral intent
because the students are currently not using any decision making tools to make decisions in
organizations. However, it would be interesting to compare the result of this study with a study
conducted on a specific decision support system, letting students operating this system and therefore
have actual usefulness and actual perceived ease of use and comparing the result of that study to this
one.
Initially, it was hard to interpret and understand the complexity of the framework and how Davis
originally conducted his study back in 1985. Hence, many hours have been spent in trying to conduct
this study and test for reliability and validity as close to the original study as possible, within the given
time frame of this master thesis project. However, the sample size and construct of this study differ
from Davis that originally had 40 master students in his sample, and the sample size of this research
is 81 and the level of completed studies varies from high school degree, bachelor’s degree and
master’s degree. However, in terms of sampling, the researcher wanted the sample to resemble the
population in school as closely as possible, hence the variation in level of completed studies.
6.3 Suggestion for Future Research
A suggestion for future research would be to examine current decision makers’ in the region of
Gothenburg standpoint of using AI tools in order to make decisions in organizations. By performing
this, a specific decision support system tool can be examined and how the current decision makers
perceive this system may be found. These findings can be compared to this study conducted and
differences or similarities can be identified and measures can be taken upon the comparison of these
two studies. In what extent are students and current decision makers viewpoint of using DSS differ?
Why does it differ? What changes has to be done in the organizations in order to adapt for the changes
that will take place when the future decision makers enter the platform as decision makers of today's
organizations.
55
7. Bibliography
Agrawal, A., Gans, J.S. & Goldfarb, A. (2019). Artificial Intelligence: The Ambiguous Labor
Market Impact of Automating Prediction. (National Bureau of Economic Research, NBER Working
Paper Series 25619). Cambridge, Massachusetts: National Bureau of Economic Research.
http://www.nber.org/papers/w25619.
Ahlstrom, D. (2010). Innovation and growth: How business contributes to society. Academy of
Management Perspectives 24(3), pp. 11-24.
Amodei, D., Olah, C., Steinhardt, J., Christiano, P., Schulman, J. & Mané, D. (2016). Concrete
Problems in AI Safety. ArXiv, abs/1606.06565.
Bandura, A. (1982). Self-Efficacy Mechanism in Human Agency. American Psychologist 37(2), pp.
122-147.
Bell, E., Bryman, A. & Harley, B. (2019). Business Research Methods. 5th edition, Oxford: Oxford
University Press. ISBN: 978-0-19-880987-6.
Berlyne, D.E. (1966). Curiosity and exploration. Science 153(3731), pp. 25-33.
Boss, J. (2016). Staying Competitive Requires Adaptability. Online Source. [Available at:
https://www.forbes.com/sites/jeffboss/2016/04/26/staying-competitive-requires-
adaptability/#60549dcb7e6f] [Accessed: 2030-03-15].
Brief, A.P. & Aldag, R.J. (1977). The Intrinsic-Extrinsic Dichotomy: Toward Conceptual Clarity.
Academy of Management Review 2(3), pp. 496-500.
Brynjolfsson, E. & McElheran, K. (2016). The Rapid Adoption of Data-Driven Decision-Making.
American Economic Review 106(5), pp. 133-139.
Burgess, A. (2018). The Executive Guide to Artificial Intelligence: How to identify and implement
applications for AI in your organization. Cham: Springer International Publishing AG. ISBN: 978-
3-319-63820-1.
Camerer, C. (1998). Bounded Rationality in Individual Decision Making. Experimental Economics
1(2), pp. 163-183.
Campbell, M., Hoane, J.A. & Hsu, F-H. (2002). Deep Blue. Artificial Intelligence 134(1-2), pp. 57-
83.
Capgemini. (2017). Turning AI into concrete value: the successful implementers’ toolkot. Online
Source. [Available at: https://www.capgemini.com/gb-en/wp-content/uploads/sites/3/2017/09/dti-ai-
report_final1-1.pdf] [Accessed: 2020-04-29]

56
Carroll, J.M. & Thomas, J.C. (1988). Fun. SIGCHI Bulletin 19(3), pp. 21-24.
Cukier, K. (2019). Ready for robots? How to think about the future of AI. Foreign Affairs 98(4),
pp-192-198.
Davenport, T.H. (2014). Big Data at Work: Dispelling the Myths, Uncovering the Opportunities.
Boston: Harvard Business School Publishing Corporation. ISBN: 978-1-4221-6816-5.
Davis, F.D. (1986). A Technology Acceptance Model for Empirically Testing New End-User
Information Systems: Theory and Results. Doctoral dissertation, Sloan School of Management,
Massachusetts Institute of Technology.
Davis, F.D. (1989). Perceived Usefulness, Perceived Ease of Use, and User Acceptance of
Information Technology. MIS Quarterly 13(3) pp. 319-340.
Davis, F.D., Bagozzi, R. P. & Warshaw, P. R. (1992). Extrinsic and Intrinsic Motivation to Use
Computers in the Workplace. Journal of Applied Social Psychology 22(14) pp. 1111-1132.
Davis, F.D., Bagozzi, R. P. & Warshaw, P. R. (1989). User Acceptance of Computer Technology:
A Comparison of Two Theoretical Models. Management Science 35(8) pp. 982-1003.
Deci, E.L. (1975). Intrinsic Motivation. New York: Plenum Publishing Company Limited. ISBN:
0306344017
Djamasbi, S., Strong, D.M. & Dishaw, M. (2010). Affect and acceptance: Examining the effects of
positive mood on the technology acceptance model. Decision Support Systems 48(2) pp. 383-394.
Doshi, H.A.K., Balasingam, S. & Arumugam, D. (2020). Artificial intelligence as a paradoxical
digital disruptor in the accounting profession: An empirical study amongst accountants.
International Journal of Psychosocial Rehabilitation 24(2), pp. 873-885.
Field, A. (2018). Discovering Statistics Using IBM SPSS Statistics. 5th edition, London: Sage
Publications Ltd. ISBN: 978-1-5264-1951-4
Fishbein, M. & Ajzen, I. (1975). Belief, Attitude, Intention and Behavior: An Introduction to Theory
and Research. Reading, MA: Addison-Wesley. ISBN: 978-0201020892.
Gartner IT Glossary. (n.d.). Big data. Online Source. [Available at:
https://www.gartner.com/en/information-technology/glossary/big-data] [Accessed: 2020-03-15].
Gorry, G.A. & Scott-Morton, M.A. (1971). A Framework for Management Information Systems.
Sloan Management Review 13(1), pp. 55-70.
Gorry, G.A. & Scott-Morton, M.A. (1989) A Framework for Management Information Systems.
(SMR Classic Reprint). Sloan Management Review 30(3), pp. 49-61.

57
Green, T. (2017). A glossary of basic artificial intelligence terms and concepts. TNW News, 10
September. https://thenextweb.com/artificial-intelligence/2017/09/10/glossary-basic-artificial-
intelligence-terms-concepts/
Haenlein, M. & Kaplan, A. (2019). A Brief History of Artificial Intelligence: On the Past, Present,
and Future of Artificial Intelligence. California Management Review 61(4), pp. 5-14.
Johnson, E.J. & Payne, J.W. Effort and Accuracy in Choice. Management Science 31(4), pp. 395-
414.
Kacprzyk, J., Valencia-García, R., Paredes-Valverde, M.A., Salas-Zárate, M.D.P. & Alor-
Hernández, G. (2018). Exploring Intelligent Decision Support Systems: Current State and New
Trends. Cham: Springer International Publishing AG. ISBN: 978-3-319-74002-7.
Kahneman, D., Rosenfield, A.M., Gandhi, L. & Blaser, T. (2016). Noise: How to Overcome the
High, Hidden Cost of Inconsistent Decision Making. Harvard Business Review 94(10), pp. 38-46.
Kahneman, D. & Tversky, A. (1979). Prospect Theory: An Analysis of Decision under Risk.
Econometrica 47(2), pp. 263-292.
Lawler, E.E. & Porter, L.W. (1967). Antecedent attitudes of effective managerial performance.
Organizational Behavior and Human Performance 2(2), pp. 122-142.
Marwala, T. & Hurwitz, E. (2017). Artificial Intelligence and Economic Theory: Skynet in the
Market. Cham: Springer International Publishing AG. ISBN: 978-3-319-66104-9.
McKinsey. (2017). Smartening up with artificial intelligence. Online Source. [Available at:
https://www.mckinsey.com/industries/semiconductors/our-insights/smartening-up-with-artificial-
intelligence] [Accessed: 2020-04-29].
Oxford English Dictionary. (n.d.). Artificial Intelligence. Online Source. [Available at:
https://www.lexico.com/definition/artificial_intelligence] [Accessed: 2020-03-20].
Payne, J.W. (1982). Contingent Decision Behavior. Psychological Bulletin 92(2), pp. 382-402.
Pereira, J.L., Belo, O. & Ravesteijn, P. (2018). Special Issue on Big Data and Digital
Transformation. Journal of Grid Computing 16(4), pp. 531-533.
Rosenberg, M.J. (1956). Cognitive Structure and Attitudinal Affect. Abnormal and Social
Psychology, 53(3), pp. 367-372.
Rosenberg, N. (2004). Innovation and Economic Growth. Organisation for Economic Cooperation
and Development. Online Source. [Available at: https://www.oecd.org/cfe/tourism/34267902.pdf]
[Accessed: 2020-03-15].

58
Royal Society. (2017). Machine learning: the power and promise of computers that learn by
example. Royal Society. Online Source. [Available at:
https://royalsociety.org/~/media/policy/projects/machine-learning/publications/machine-learning-
report.pdf ] [Accessed: 2020-04-29]
Sharda, R., Barr, S.H. & McDonnell, J.C. (1988). Decision Support system Effectiveness: A
Review and Empirical Test. Management Science 34(2), pp. 139-159.
Sharda, R., Delen, D. & Turban, E. (2014). Business Intelligence and Analytics: Systems for
Decision Support. 10th edition, Harlow, Essex: Pearson Education. ISBN: 978-1-292-00920-9
Shrestha, Y.R., Ben-Menahem, S.M. & Von Krogh, G. (2019). Organizational Decision-Making
Structures in the Age of Artificial Intelligence. California Management Review 61(4), pp. 66-83.
Silver, D., Huang, A., Maddison, C.J., Guez, A., Sifre, L., van den Driessche, G., Schrittwieser, J.,
Antonoglou, I., Panneershelvam, V., Lanctot, M., Dieleman, S., Grewe, D., Nham, J.,
Kalchbrenner, N., Sutskever, I., Lillicrap, T., Leach, M., Kavukcuoglu K., Graepel, T. & Hassabis,
D. (2016). Mastering the Game of Go with Deep Neural Networks and Tree Search. Nature
529(7587), pp. 484-489.
Simon, H.A. (1955). A Behavioral Model of Rational Choice. The Quarterly Journal of Economics
69(1), pp. 99-118.
Simon, H.A. (1978). On how to decide what to do. The Bell Journal of Economics 9(2), pp. 494-
507.
Simon, H. A. (1960). The New Science of Management Decision. New York: Harper & Brothers
Publishers.
Swanson, D.L. (1996). Neoclassical Economic Theory, Executive Control, and Organizational
Outcomes. Human Relations 49(6), pp. 735-756.
Thaler, R.H. (2018). Nudge, not sludge. Science 361(6401), p. 431.
Turing, A. (1950). Computing Machinery and Intelligence. Mind 59(236), pp. 433-460.
Von Krogh, G. (2018). Artificial Intelligence in Organizations: New Opportunities for
Phenomenon-based Theorizing. Academy of Management Discoveries 4(4), pp. 404-409.
Vroom, V. (1964). Work and motivation. New York: John Wiley & Sons Inc. ISBN: 0471912050.
Warshaw, P.R. & Davis, F.D. (1985). Disentangling Behavioral Intention and Behavioral
Expectation. Journal of Experimental Social Psychology 21(3), pp. 213-228.
White, R.W. (1959). Motivation reconsidered: The concept of competence. Psychological Review
66(5), pp. 297-333.

59
Wright, J. & Ginsberg, D. (2012). Free to Err?: Behavioral Law and Economics and its Implications
for Liberty. Law & Liberty, February 16. https://www.lawliberty.org/liberty-forum/free-to-err-
behavioral-law-and-economics-and-its-implications-for-liberty/

60
8. Appendixes
A - Questionnaire Guide

61

62

63

64

65

66

67

68
B - Correlation Matrices
B.1 Perceived Ease of Use
B.2 Perceived Usefulness

69
B.3 Attitude Toward Using
B.4 Behavioral Intention

70
C- List of Exhibits
C.1 List of Figures
Figure 1.1 Overview of Research Process
Figure 2.1 Theory of Reasoned Action, TRA
Figure 2.2 Technology Acceptance Model, TAM
Figure 3.1 The Process of Deduction
Figure 3.2 The Process of Quantitative Research
Figure 4.1 Diagram of Technology Acceptance Model
C.2 List of Tables
Table 2.1 Concepts of Artificial Intelligence
Table 4.1 Cronbach Alpha Reliability of Measurement Scales
Table 4.2 Measurement Statistics of Variables
Table 4.3 Measurement Statistics of Factors Constructed from Variables
Table 4.4 TAM Regression Tests
Table 4.5 TAM Causal Regression Test
Table 4.6 Compilation of Adjusted R2 in Different Regression Models

71
C.3 List of Abbreviations
A - Attitude Toward Using
AI - Artificial Intelligence
ANN - Artificial Neural Network
BI - Behavioral Intention
DL - Deep Learning
DMT - Decision Making Theories
DSS - Decision Support System
KMO - Kaiser-Meyer- Olkin
OLS - Ordinary Least Square
MIS - Management Information System
ML - Machine Learning
PE - Perceived Enjoyment
PEU - Perceived Ease of Use
PU - Perceived Usefulness
SL - Supervised Learning
SN - Subjective Norm
SPSS - Statistical Package for Social Sciences
TAM - Technology Acceptance Model
TRA - Theory of Reasoned Action
UL - Unsupervised Learning