www.dmi.dk/dmi/tr12-04 page 1 of 75
Technical Report 13-04
Greenland - DMI Historical Climate Data Collection 1873-2012
-with Danish Abstracts
John Cappelen (ed)
Copenhagen 2013
Technical Report 12-04
www.dmi.dk/dmi/tr12-04 page 2 of 75
Colophon
Serial title:
Technical Report 13-04
Title:
Greenland - DMI Historical Climate Data Collection 1873-2012
Subtitle:
- with Danish Abstracts
Author(s):
John Cappelen (ed)
Other contributors:
Claus Kern-Hansen, Ellen Vaarby Laursen og Peter Viskum Jørgensen
Responsible institution: Danish Meteorological Institute
Language:
English
Keywords:
Greenland, pressure obervations, daily, monthly and annual climate data, time series, graphics,
temperature, atmospheric pressure, precipitation, cloud cover, snow cover
Url: www.dmi.dk/dmi/tr13-04
ISSN:1399-1388
Website: www.dmi.dk
Copyright:
Danish Meteorological Institute. It is allowed to copy and extract from the publication with a
specification of the source material.
Important note:
This report is an annual update (2012 data) of the “DMI observational, daily, monthly and annual Greenlandic climate
data collection” published for the first time in that form in 1) DMI Technical Report 08-05: DMI Daily Climate Data
Collection 1873-2007, Denmark, The Faroe Islands and Greenland - including Air Pressure Observations 1874-2007
(WASA Data Sets). Copenhagen 2008 [8], 2) DMI Technical Report 04-03: DMI Daily Climate Data Collection 1873-
2003, Denmark and Greenland. Copenhagen 2004. [24], 3) DMI Monthly Climate Data Collection 1860-2002, Den-
mark, The Faroe Island and Greenland. An update of: NACD, REWARD, NORDKLIM and NARP datasets, Version 1.
DMI Technical Report No. 03-26. Copenhagen 2003. [20] and 4) DMI Technical Report 05-06: DMI annual climate
data collection 1873-2004, Denmark, The Faroe Islands and Greenland - with Graphics and Danish Abstracts. Copen-
hagen 2005 [7].
Front Page:
3 August 2012 - towards SSE, Tugtilik fiord near Tasiilaq. The inscription on the cross is "Gino Watkins Drowned 20
August 1932". He was leading British Arctic Air Route Expedition 1930-31 – mapping the area. The memorial is
situated on a south-facing foreland in Tugtilik fiord app. N66.15 W35 degrees. The island in the background is Ailsa
Island. Photo: Hans Chr. Florian.
Technical Report 12-04
www.dmi.dk/dmi/tr12-04 page 3 of 75
Content: Abstract ................................................................................................................................................ 4 Resumé ................................................................................................................................................. 4 Preface .................................................................................................................................................. 5 Weather, Greenland 2012 .................................................................................................................... 8 Climate and weather in general; Greenland ......................................................................................... 9
History of stations used in the report ................................................................................................. 21 File formats; Station position file................................................................................................... 23
1. Observational Section: Historical DMI Data Collection ............................................................... 24 1.1. Introduction ............................................................................................................................. 25 1.2. Stations and parametres .......................................................................................................... 27
1.3. Atmospheric pressure observations; Tasiilaq – 4360; 1894-2012 .......................................... 27 1.4. File Formats; Observation data files ....................................................................................... 28
2. Daily Section: Historical DMI Data Collection ............................................................................. 29 2.1 Introduction .............................................................................................................................. 30 2.2. Stations and parameters .......................................................................................................... 31 2.3. Description of the daily data series ......................................................................................... 31
2.3.1 Accumulated precipitation ................................................................................................ 31
2.3.2 Lowest temperature ........................................................................................................... 32
2.3.3 Highest temperature .......................................................................................................... 32 2.4. Metadata .................................................................................................................................. 32 2.5. File formats; Daily data files ................................................................................................... 33
Appendix 2.1. Introduction of the Hellmann rain gauge and Stevenson screens .......................... 36 3. Monthly Section: Historical DMI Data Collection ........................................................................ 37
3.1 Introduction .............................................................................................................................. 38
3.2. Stations and parameters .......................................................................................................... 40
3.3. Description of monthly data series .......................................................................................... 41 3.3.1. Pittufik (PITU) - 4202 ...................................................................................................... 41 3.3.2. Upernavik (UPER) - 4211 ................................................................................................ 42
3.3.3. Ilulissat (ILUL) - 4221 ..................................................................................................... 44 3.3.4. Nuuk (NUUK) - 4250 ...................................................................................................... 46
3.3.5. Ivittuut – (IVIT) - 34262 (Previous part of Narsarsuaq series) ........................................ 48 3.3.6. Narsarsuaq (NARS) - 4270 .............................................................................................. 50 3.3.7. Danmarkshavn (DANM) - 4320 ...................................................................................... 52 3.3.8. Scoresbysund (SCOR) – 34339 (Previous part of Illoqqortoormiut series) .................... 54
3.3.9. Illoqqortoormiut (ILLO) - 4339 ....................................................................................... 55 3.3.10. Tasiilaq (TASI) - 4360 ................................................................................................... 57
3.4. File formats; Monthly data files .............................................................................................. 59
Appendix 3.2. Additional notes on monthly series, Upernavik and Ilulissat ................................. 61 Appendix 3.3. Regarding monthly data of atmospheric pressure .................................................. 63 Appendix 3.4. Note on new corrections in monthly temperature series; Ilulissat ......................... 64
4. Annual Section: Historical DMI Data Collection .......................................................................... 65
4.1. Introduction ............................................................................................................................. 67 4.2. Stations and parameters .......................................................................................................... 68 4.3. Annual values 1873-2012; Greenland ..................................................................................... 69 4.4. Annual mean temperatures and filtered values for seven meteorological stations in
Greenland; 1873-2012.................................................................................................................... 69
4.5. File formats; Annual data files ................................................................................................ 72 4.6. File formats; Annual graphics ................................................................................................. 73
References .......................................................................................................................................... 74
Previous reports.................................................................................................................................. 75
Technical Report 12-04
www.dmi.dk/dmi/tr12-04 page 4 of 75
Abstract This report contains the available DMI historical data collection 1873-2012 for Greenland, includ-
ing obervations (atmospheric pressure) and long daily, monthly and annual series of station based
data.
Resumé Denne rapport indeholder tilgængelige historiske DMI datasamlinger 1873-2012 for Grønland. Det
drejer sig om observationer af lufttryk samt lange daglige, månedlige og årlige stationsdataserier.
Technical Report 12-04
www.dmi.dk/dmi/tr12-04 page 5 of 75
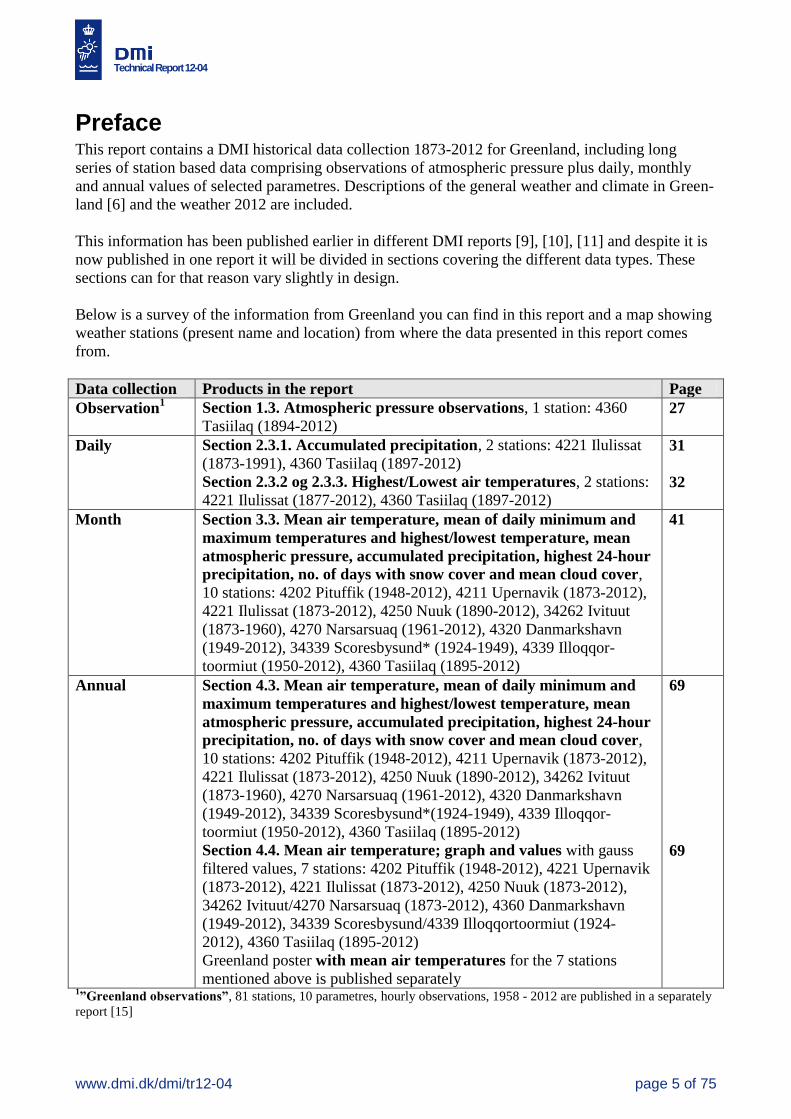
Preface This report contains a DMI historical data collection 1873-2012 for Greenland, including long
series of station based data comprising observations of atmospheric pressure plus daily, monthly
and annual values of selected parametres. Descriptions of the general weather and climate in Green-
land [6] and the weather 2012 are included.
This information has been published earlier in different DMI reports [9], [10], [11] and despite it is
now published in one report it will be divided in sections covering the different data types. These
sections can for that reason vary slightly in design.
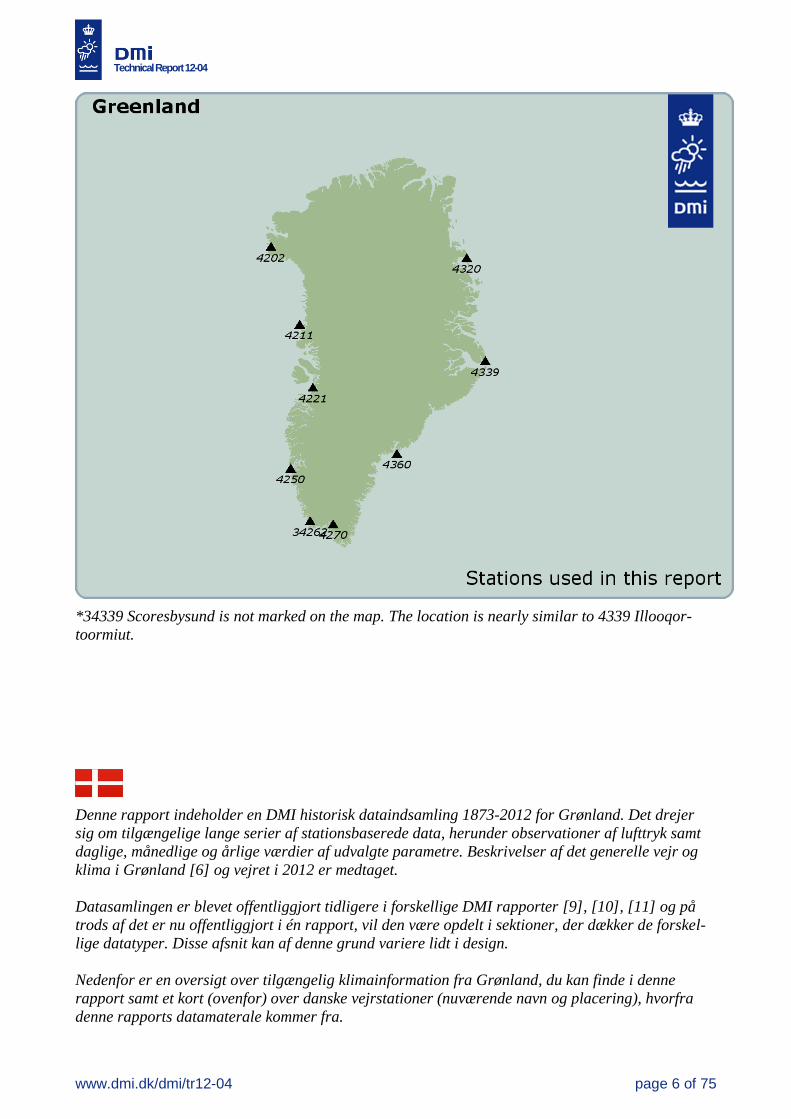
Below is a survey of the information from Greenland you can find in this report and a map showing
weather stations (present name and location) from where the data presented in this report comes
from.
Data collection Products in the report Page
Observation1 Section 1.3. Atmospheric pressure observations, 1 station: 4360
Tasiilaq (1894-2012) 27
Daily Section 2.3.1. Accumulated precipitation, 2 stations: 4221 Ilulissat
(1873-1991), 4360 Tasiilaq (1897-2012)
Section 2.3.2 og 2.3.3. Highest/Lowest air temperatures, 2 stations:
4221 Ilulissat (1877-2012), 4360 Tasiilaq (1897-2012)
31
32
Month Section 3.3. Mean air temperature, mean of daily minimum and
maximum temperatures and highest/lowest temperature, mean
atmospheric pressure, accumulated precipitation, highest 24-hour
precipitation, no. of days with snow cover and mean cloud cover,
10 stations: 4202 Pituffik (1948-2012), 4211 Upernavik (1873-2012),
4221 Ilulissat (1873-2012), 4250 Nuuk (1890-2012), 34262 Ivituut
(1873-1960), 4270 Narsarsuaq (1961-2012), 4320 Danmarkshavn
(1949-2012), 34339 Scoresbysund* (1924-1949), 4339 Illoqqor-
toormiut (1950-2012), 4360 Tasiilaq (1895-2012)
41
Annual Section 4.3. Mean air temperature, mean of daily minimum and
maximum temperatures and highest/lowest temperature, mean
atmospheric pressure, accumulated precipitation, highest 24-hour
precipitation, no. of days with snow cover and mean cloud cover,
10 stations: 4202 Pituffik (1948-2012), 4211 Upernavik (1873-2012),
4221 Ilulissat (1873-2012), 4250 Nuuk (1890-2012), 34262 Ivituut
(1873-1960), 4270 Narsarsuaq (1961-2012), 4320 Danmarkshavn
(1949-2012), 34339 Scoresbysund*(1924-1949), 4339 Illoqqor-
toormiut (1950-2012), 4360 Tasiilaq (1895-2012)
Section 4.4. Mean air temperature; graph and values with gauss
filtered values, 7 stations: 4202 Pituffik (1948-2012), 4221 Upernavik
(1873-2012), 4221 Ilulissat (1873-2012), 4250 Nuuk (1873-2012),
34262 Ivituut/4270 Narsarsuaq (1873-2012), 4360 Danmarkshavn
(1949-2012), 34339 Scoresbysund/4339 Illoqqortoormiut (1924-
2012), 4360 Tasiilaq (1895-2012)
Greenland poster with mean air temperatures for the 7 stations
mentioned above is published separately
69
69
1”Greenland observations”, 81 stations, 10 parametres, hourly observations, 1958 - 2012 are published in a separately
report [15]
Technical Report 12-04
www.dmi.dk/dmi/tr12-04 page 6 of 75
*34339 Scoresbysund is not marked on the map. The location is nearly similar to 4339 Illooqor-
toormiut.
Denne rapport indeholder en DMI historisk dataindsamling 1873-2012 for Grønland. Det drejer
sig om tilgængelige lange serier af stationsbaserede data, herunder observationer af lufttryk samt
daglige, månedlige og årlige værdier af udvalgte parametre. Beskrivelser af det generelle vejr og
klima i Grønland [6] og vejret i 2012 er medtaget.
Datasamlingen er blevet offentliggjort tidligere i forskellige DMI rapporter [9], [10], [11] og på
trods af det er nu offentliggjort i én rapport, vil den være opdelt i sektioner, der dækker de forskel-
lige datatyper. Disse afsnit kan af denne grund variere lidt i design.
Nedenfor er en oversigt over tilgængelig klimainformation fra Grønland, du kan finde i denne
rapport samt et kort (ovenfor) over danske vejrstationer (nuværende navn og placering), hvorfra
denne rapports datamaterale kommer fra.
Technical Report 12-04
www.dmi.dk/dmi/tr12-04 page 7 of 75
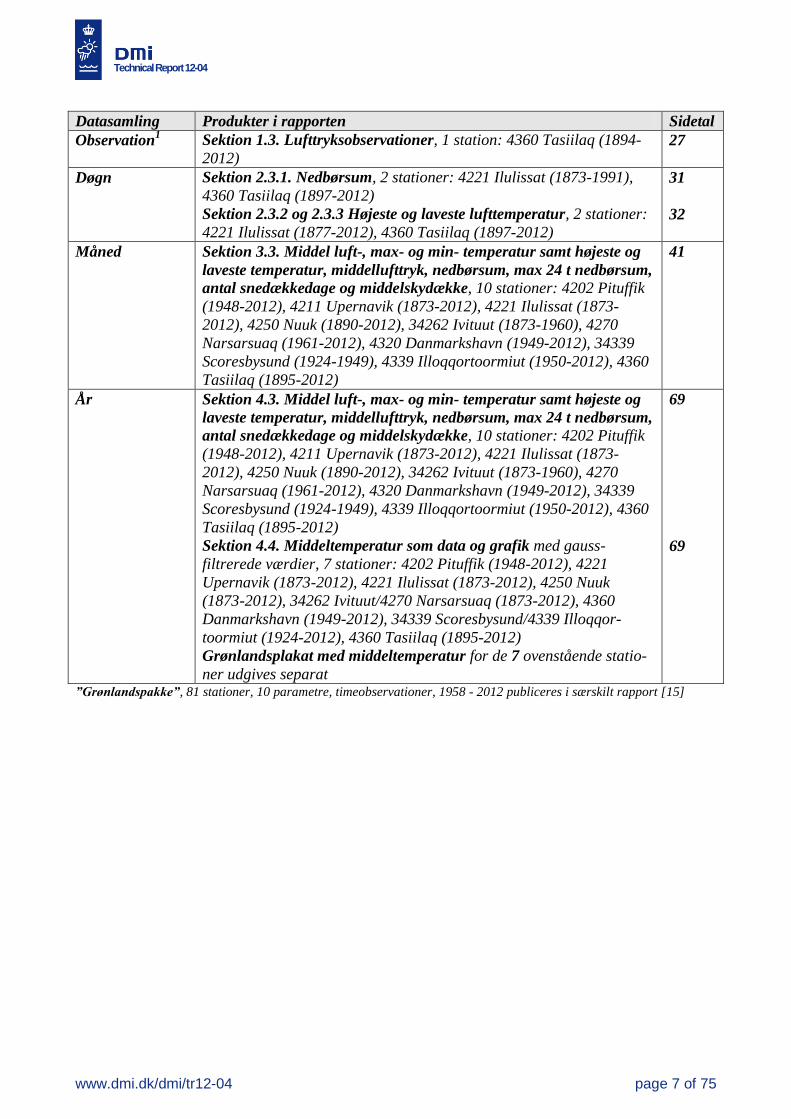
Datasamling Produkter i rapporten Sidetal
Observation1 Sektion 1.3. Lufttryksobservationer, 1 station: 4360 Tasiilaq (1894-
2012) 27
Døgn Sektion 2.3.1. Nedbørsum, 2 stationer: 4221 Ilulissat (1873-1991),
4360 Tasiilaq (1897-2012)
Sektion 2.3.2 og 2.3.3 Højeste og laveste lufttemperatur, 2 stationer:
4221 Ilulissat (1877-2012), 4360 Tasiilaq (1897-2012)
31
32
Måned Sektion 3.3. Middel luft-, max- og min- temperatur samt højeste og
laveste temperatur, middellufttryk, nedbørsum, max 24 t nedbørsum,
antal snedækkedage og middelskydække, 10 stationer: 4202 Pituffik
(1948-2012), 4211 Upernavik (1873-2012), 4221 Ilulissat (1873-
2012), 4250 Nuuk (1890-2012), 34262 Ivituut (1873-1960), 4270
Narsarsuaq (1961-2012), 4320 Danmarkshavn (1949-2012), 34339
Scoresbysund (1924-1949), 4339 Illoqqortoormiut (1950-2012), 4360
Tasiilaq (1895-2012)
41
År Sektion 4.3. Middel luft-, max- og min- temperatur samt højeste og
laveste temperatur, middellufttryk, nedbørsum, max 24 t nedbørsum,
antal snedækkedage og middelskydække, 10 stationer: 4202 Pituffik
(1948-2012), 4211 Upernavik (1873-2012), 4221 Ilulissat (1873-
2012), 4250 Nuuk (1890-2012), 34262 Ivituut (1873-1960), 4270
Narsarsuaq (1961-2012), 4320 Danmarkshavn (1949-2012), 34339
Scoresbysund (1924-1949), 4339 Illoqqortoormiut (1950-2012), 4360
Tasiilaq (1895-2012)
Sektion 4.4. Middeltemperatur som data og grafik med gauss-
filtrerede værdier, 7 stationer: 4202 Pituffik (1948-2012), 4221
Upernavik (1873-2012), 4221 Ilulissat (1873-2012), 4250 Nuuk
(1873-2012), 34262 Ivituut/4270 Narsarsuaq (1873-2012), 4360
Danmarkshavn (1949-2012), 34339 Scoresbysund/4339 Illoqqor-
toormiut (1924-2012), 4360 Tasiilaq (1895-2012)
Grønlandsplakat med middeltemperatur for de 7 ovenstående statio-
ner udgives separat
69
69
”Grønlandspakke”, 81 stationer, 10 parametre, timeobservationer, 1958 - 2012 publiceres i særskilt rapport [15]
Technical Report 12-04
www.dmi.dk/dmi/tr12-04 page 8 of 75
Weather, Greenland 2012 Especially the summer 2012 (JJA) was unusual warm in Greenland. Record breaking and near to
record breaking summer and single months occur many places, but also a single record breaking
cold June 2012 at Tasiilaq at the east coast were seen!
An analysis of extreme daily maximum temperatures shows new station records in 2012 for the
respective months at Ivittuut/Narsarsuaq (24.8°C) in May, and Upernavik (20.3°C) and Ittoqqor-
toormiit (18.6°C) in July. The 24.8°C at Ivittuut/Narsarsuaq was also a new record for the highest
official surface air temperature ever recorded in Greenland in May; it occurred on the 29th of the
month.
Rain and several days of thaw have been registered at the ice cap with high temperatures late June
and several days in a row in July above 0°C. In mid-July 2012 (July 10 to 12) the Kangerlussuaq
area was hit by sudden and violent melt waters, where a bridge in Kangerlussuaq was destroyed by
the torrential melt waters.
In 2012, as in recent warm summers since 2007 (2007, 2008, 2010, 2011 and now 2012), a blocking
high pressure, associated with negative NAO conditions, was present in the mid-troposphere over
Greenland for much of the summer. This circulation pattern advected relatively warm southerly
winds mainly along the west coast favouring warmer and drier summers than normal and shifting
precipitation towards the north of the ice sheet. The very warm temperatures were followed by a
number of unusual melting events. This unusual weather conditions can also be linked to the weath-
er we have experienced in Denmark during the summer 2012. Events in Greenland during the
summer 2012 can not be regarded as 'unnatural', but on the other hand there is an indisputably
gradual rise in temperature in Greenland and along the way, any 'warm incident' thus will have an
increased likelihood of becoming a little bit hotter than the preceding one.
A significant lack of precipitation during summer 2012 in south-east Greenland was also observed
(e.g. 0 mm at Tasiilaq, 0.7 mm at Narsarsuaq and 21.6 mm at Qaqortoq in June 2012, and only 1.4
mm at Tasiilaq in July 2012). In Tasiilaq the summer precipitation was the third lowest on record
(since 1895). In Danmarkshavn in north-east the summer precipitation was 8.2 mm, the second
lowest on record (since 1949) together with summer 2003.
The year 2012 as a whole in Greenland was a rather warm year compared to 1961-90 normal but
around 2001-2010 average following the tendency in the temperature development seen in the last
decades.
In the capital Nuuk, the annual mean temperature was 0.1°C, which is 1.5°C warmer than normal
(normal -1.4°C), but only 0.2°C warmer than the 2001-2010 average. The highest temperature
20.3°C occurred in July and the lowest temperature -22.3°C in March. It was the second wettest
year since measurements started in 1890. Precipitation in Nuuk was 1.211 mm against the normal
752 mm, 459 mm or 61% above normal. The wettest year was 2005 with 1.221 mm.
Technical Report 12-04
www.dmi.dk/dmi/tr12-04 page 9 of 75
Climate and weather in general; Greenland
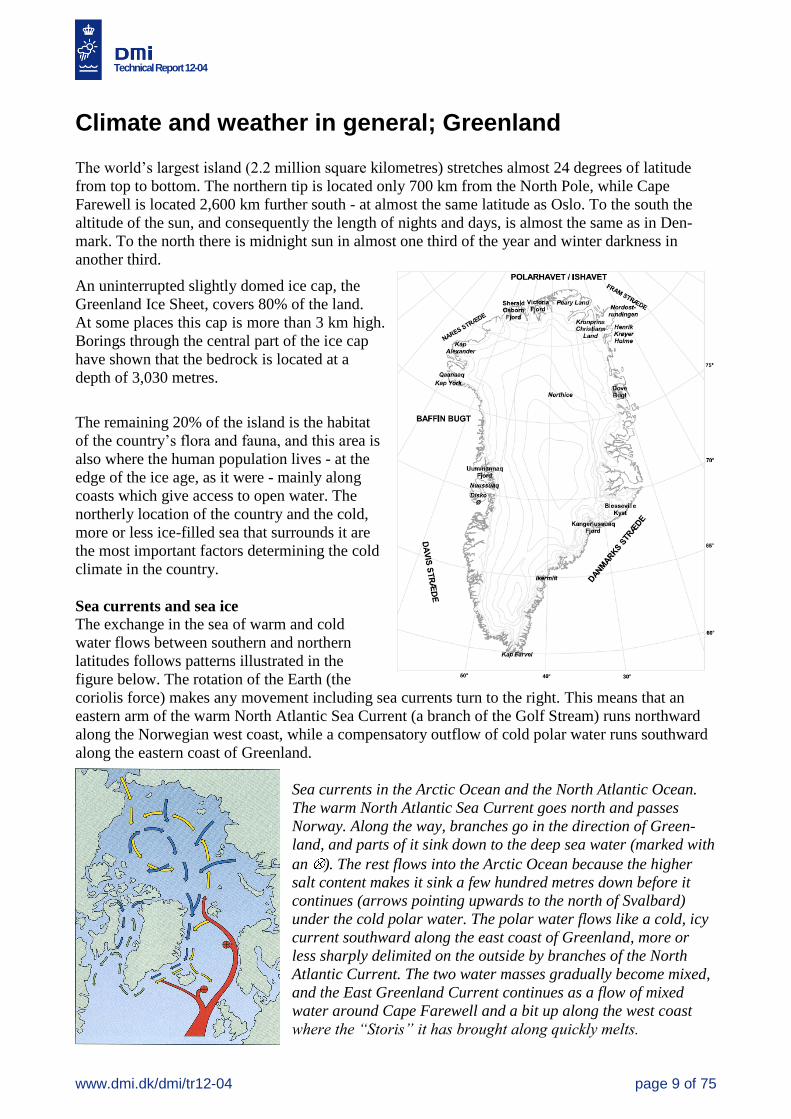
The world’s largest island (2.2 million square kilometres) stretches almost 24 degrees of latitude
from top to bottom. The northern tip is located only 700 km from the North Pole, while Cape
Farewell is located 2,600 km further south - at almost the same latitude as Oslo. To the south the
altitude of the sun, and consequently the length of nights and days, is almost the same as in Den-
mark. To the north there is midnight sun in almost one third of the year and winter darkness in
another third.
An uninterrupted slightly domed ice cap, the
Greenland Ice Sheet, covers 80% of the land.
At some places this cap is more than 3 km high.
Borings through the central part of the ice cap
have shown that the bedrock is located at a
depth of 3,030 metres.
The remaining 20% of the island is the habitat
of the country’s flora and fauna, and this area is
also where the human population lives - at the
edge of the ice age, as it were - mainly along
coasts which give access to open water. The
northerly location of the country and the cold,
more or less ice-filled sea that surrounds it are
the most important factors determining the cold
climate in the country.
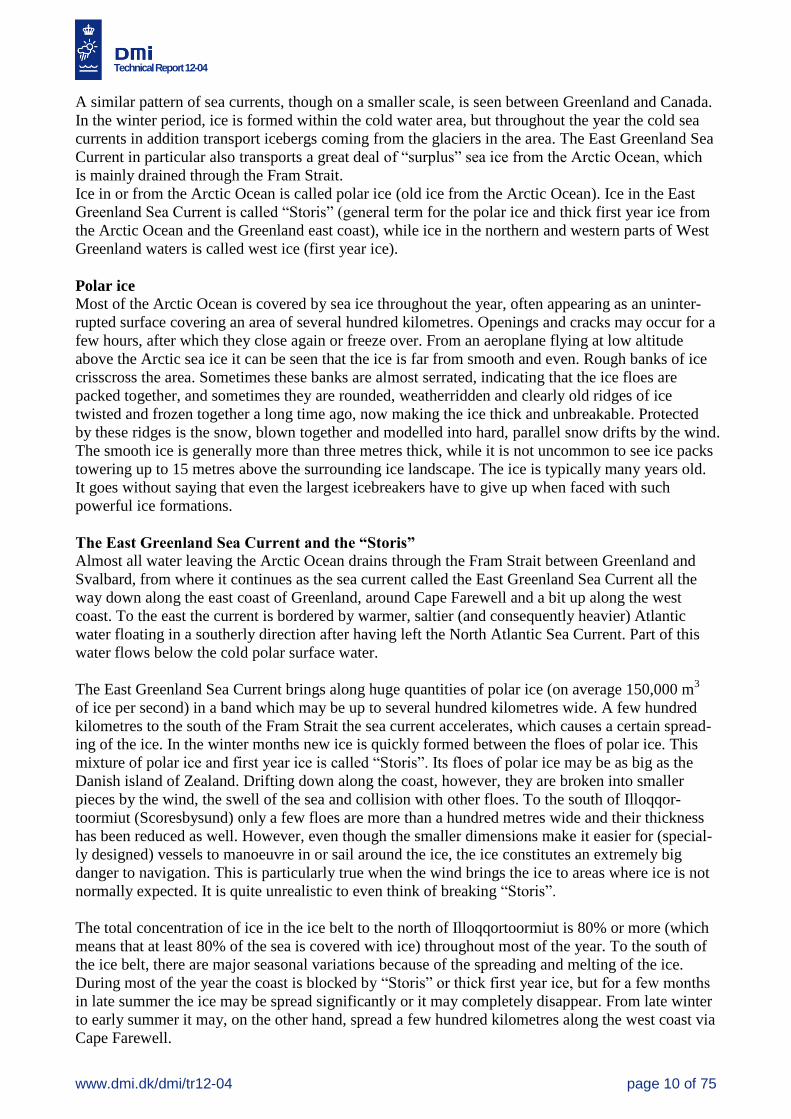
Sea currents and sea ice
The exchange in the sea of warm and cold
water flows between southern and northern
latitudes follows patterns illustrated in the
figure below. The rotation of the Earth (the
coriolis force) makes any movement including sea currents turn to the right. This means that an
eastern arm of the warm North Atlantic Sea Current (a branch of the Golf Stream) runs northward
along the Norwegian west coast, while a compensatory outflow of cold polar water runs southward
along the eastern coast of Greenland.
Sea currents in the Arctic Ocean and the North Atlantic Ocean.
The warm North Atlantic Sea Current goes north and passes
Norway. Along the way, branches go in the direction of Green-
land, and parts of it sink down to the deep sea water (marked with
an ). The rest flows into the Arctic Ocean because the higher
salt content makes it sink a few hundred metres down before it
continues (arrows pointing upwards to the north of Svalbard)
under the cold polar water. The polar water flows like a cold, icy
current southward along the east coast of Greenland, more or
less sharply delimited on the outside by branches of the North
Atlantic Current. The two water masses gradually become mixed,
and the East Greenland Current continues as a flow of mixed
water around Cape Farewell and a bit up along the west coast
where the “Storis” it has brought along quickly melts.
Technical Report 12-04
www.dmi.dk/dmi/tr12-04 page 10 of 75
A similar pattern of sea currents, though on a smaller scale, is seen between Greenland and Canada.
In the winter period, ice is formed within the cold water area, but throughout the year the cold sea
currents in addition transport icebergs coming from the glaciers in the area. The East Greenland Sea
Current in particular also transports a great deal of “surplus” sea ice from the Arctic Ocean, which
is mainly drained through the Fram Strait.
Ice in or from the Arctic Ocean is called polar ice (old ice from the Arctic Ocean). Ice in the East
Greenland Sea Current is called “Storis” (general term for the polar ice and thick first year ice from
the Arctic Ocean and the Greenland east coast), while ice in the northern and western parts of West
Greenland waters is called west ice (first year ice).
Polar ice
Most of the Arctic Ocean is covered by sea ice throughout the year, often appearing as an uninter-
rupted surface covering an area of several hundred kilometres. Openings and cracks may occur for a
few hours, after which they close again or freeze over. From an aeroplane flying at low altitude
above the Arctic sea ice it can be seen that the ice is far from smooth and even. Rough banks of ice
crisscross the area. Sometimes these banks are almost serrated, indicating that the ice floes are
packed together, and sometimes they are rounded, weatherridden and clearly old ridges of ice
twisted and frozen together a long time ago, now making the ice thick and unbreakable. Protected
by these ridges is the snow, blown together and modelled into hard, parallel snow drifts by the wind.
The smooth ice is generally more than three metres thick, while it is not uncommon to see ice packs
towering up to 15 metres above the surrounding ice landscape. The ice is typically many years old.
It goes without saying that even the largest icebreakers have to give up when faced with such
powerful ice formations.
The East Greenland Sea Current and the “Storis”
Almost all water leaving the Arctic Ocean drains through the Fram Strait between Greenland and
Svalbard, from where it continues as the sea current called the East Greenland Sea Current all the
way down along the east coast of Greenland, around Cape Farewell and a bit up along the west
coast. To the east the current is bordered by warmer, saltier (and consequently heavier) Atlantic
water floating in a southerly direction after having left the North Atlantic Sea Current. Part of this
water flows below the cold polar surface water.
The East Greenland Sea Current brings along huge quantities of polar ice (on average 150,000 m3
of ice per second) in a band which may be up to several hundred kilometres wide. A few hundred
kilometres to the south of the Fram Strait the sea current accelerates, which causes a certain spread-
ing of the ice. In the winter months new ice is quickly formed between the floes of polar ice. This
mixture of polar ice and first year ice is called “Storis”. Its floes of polar ice may be as big as the
Danish island of Zealand. Drifting down along the coast, however, they are broken into smaller
pieces by the wind, the swell of the sea and collision with other floes. To the south of Illoqqor-
toormiut (Scoresbysund) only a few floes are more than a hundred metres wide and their thickness
has been reduced as well. However, even though the smaller dimensions make it easier for (special-
ly designed) vessels to manoeuvre in or sail around the ice, the ice constitutes an extremely big
danger to navigation. This is particularly true when the wind brings the ice to areas where ice is not
normally expected. It is quite unrealistic to even think of breaking “Storis”.
The total concentration of ice in the ice belt to the north of Illoqqortoormiut is 80% or more (which
means that at least 80% of the sea is covered with ice) throughout most of the year. To the south of
the ice belt, there are major seasonal variations because of the spreading and melting of the ice.
During most of the year the coast is blocked by “Storis” or thick first year ice, but for a few months
in late summer the ice may be spread significantly or it may completely disappear. From late winter
to early summer it may, on the other hand, spread a few hundred kilometres along the west coast via
Cape Farewell.
Technical Report 12-04
www.dmi.dk/dmi/tr12-04 page 11 of 75
In addition to currents, the wind has a major impact on the drift of the ice, especially if the ice is not
very compact. Winds from the east (on-shore wind) will close the edge of the ice and make it
impenetrable for most vessels. If the wind comes from the west there may be bars and belts of ice
up to several hundred kilometres from the ice field, while there may be open water areas close to
the coast. Such areas may occur more or less permanently in an otherwise uninterrupted ice cover,
depending on local winds or sea currents. A permanent open water area within closed sea ice is
called a polynya. Well-known is the polynya at the mouth of Scoresbysund, the wildlife of which
ensures the survival of the local population.
West Greenland and the west ice
Conditions along the west coast of Greenland differ a great deal from conditions along the east
coast. No real polar ice is seen along the west coast – with the exception of “Storis” that travels
around Cape Farewell. Polar ice which occasionally drifts towards the south through the Nares
Strait between Greenland and Ellesmere Island in northeastern Canada stays close to the Canadian
coast when in drifts further south. The vast majority of the ice to the west of Greenland is thus
formed in the sea area where it is seen, and it is uncommon to see more than a couple of sea ice
types at the same time, for example broken floes of winter ice in a sea covered in dark new, thin ice.
The 3-4 metre thick sea ice which in the winter season covers most of Baffin Bay and closes off
Greenland’s west coast from Qaanaaq (Thule) in the north and almost all the way down to Sisimiut
(Holsteinsborg) in the south is called west ice in Greenland. Varying quantities of west ice is
brought with the Labrador Sea Current down along the Canadian east coast where it may sometimes
cause interruption of oil drilling activities. Navigation further south is rarely affected to any great
extent. Only a small part of the west ice survives the summer.
West ice can generally be broken by ships with sufficient engine power, though it will usually be
both unprofitable and hazardous. Consequently it is only possible to sail to and from Qaanaaq
(Thule) from July to September, while it is usually possible to sail to and from Aasiaat (Egedes-
minde) and Ilulissat (Jakobshavn) from mid-May to mid-December. There is normally no sea ice
between the west ice and the “Storis” further south, and 90% of the population therefore live in the
four “open sea towns” of Paamiut (Frederikshåb), Nuuk (Godthåb), Maniitsoq (Sukkertoppen) and
Sisimiut (Holsteinsborg), where most business enterprises in Greenland are also located.
Icebergs
Glacial outlets from the Greenland ice sheet form icebergs. As opposed to sea ice, icebergs are not
made of frozen sea water but of ice which is many thousand years old. This ice was once snow
falling on the ice cap. Icebergs may be extremely dangerous for ships, the reason being that icebergs
do not follow winds and surface sea currents but go so deep down into the sea (sometimes up to 300
metres below the surface of the sea) that their drifting is primarily determined by deep-sea currents.
A ship sailing in the sea ice may easily end up on collision course with an iceberg if there are major
differences between surface currents and currents deeper down in the sea. To this should be added
that icebergs melt slowly and may therefore drift far away from sea ice areas.
Icebergs are seen along almost all coasts in Greenland, but there are particularly many of them
in the Qeqartarsuaq (Disko) area where some of the world’s most productive glaciers are located.
Many of these icebergs drift to the west, whereupon they are taken south by the Labrador Sea
Current. Some icebergs are moved as far south as the transatlantic shipping routes (as was the case
in 1912 when the Titanic hit an iceberg).
Climate and weather
The climate in Greenland is an Arctic climate - which means that no forest can grow in the area.
The northern part of the country is very close to the North American continent, from which it is
Technical Report 12-04
www.dmi.dk/dmi/tr12-04 page 12 of 75
separated only by a relatively narrow and more or less ice-filled sea. Southern Greenland on the
other hand is something between the continent to the west and the ocean to the east.
Atmospheric flow patterns and cyclone tracks
Because of its height and size Greenland has a great impact on the movement of air in the lower,
dense part of the troposphere, causing the wind to blow mainly along the coast. Greenland thus
contributes to the exchange of air masses between north and south. In the summer, northerly and
southerly winds are almost evenly distributed, while northerly winds are very predominant in the
winter in accordance with the fact that the highest air pressure occur in the coldest areas to the west
or north west.
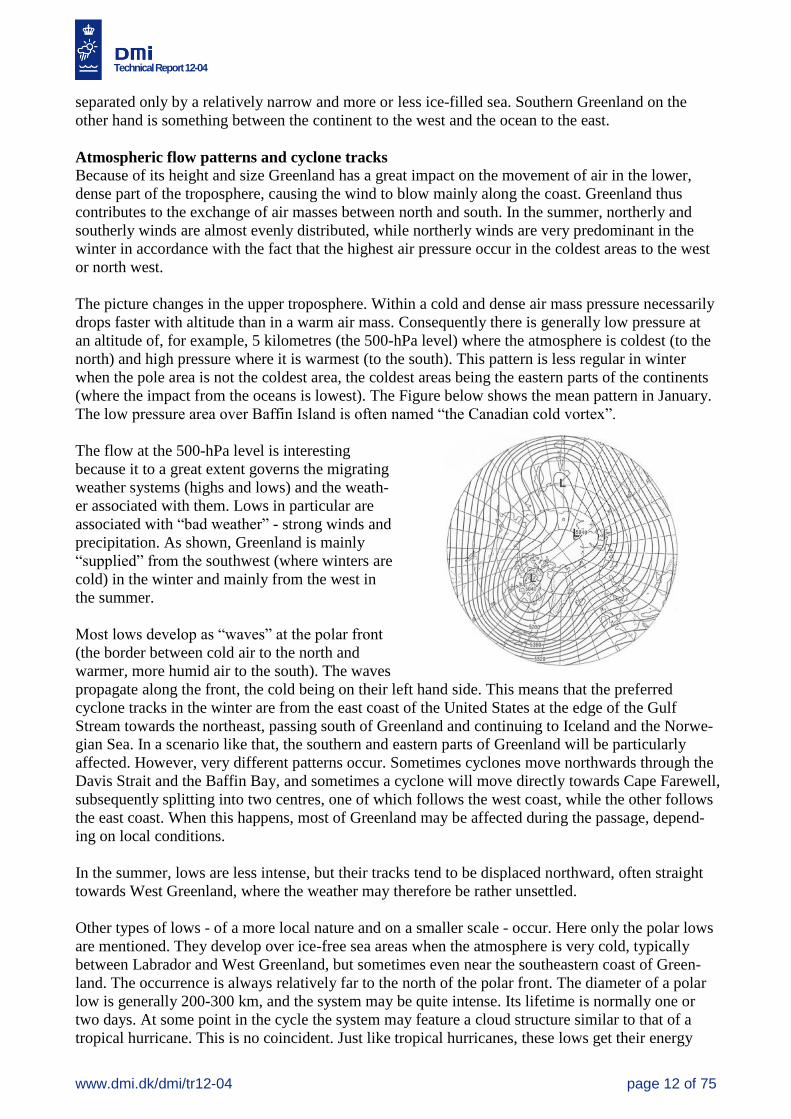
The picture changes in the upper troposphere. Within a cold and dense air mass pressure necessarily
drops faster with altitude than in a warm air mass. Consequently there is generally low pressure at
an altitude of, for example, 5 kilometres (the 500-hPa level) where the atmosphere is coldest (to the
north) and high pressure where it is warmest (to the south). This pattern is less regular in winter
when the pole area is not the coldest area, the coldest areas being the eastern parts of the continents
(where the impact from the oceans is lowest). The Figure below shows the mean pattern in January.
The low pressure area over Baffin Island is often named “the Canadian cold vortex”.
The flow at the 500-hPa level is interesting
because it to a great extent governs the migrating
weather systems (highs and lows) and the weath-
er associated with them. Lows in particular are
associated with “bad weather” - strong winds and
precipitation. As shown, Greenland is mainly
“supplied” from the southwest (where winters are
cold) in the winter and mainly from the west in
the summer.
Most lows develop as “waves” at the polar front
(the border between cold air to the north and
warmer, more humid air to the south). The waves
propagate along the front, the cold being on their left hand side. This means that the preferred
cyclone tracks in the winter are from the east coast of the United States at the edge of the Gulf
Stream towards the northeast, passing south of Greenland and continuing to Iceland and the Norwe-
gian Sea. In a scenario like that, the southern and eastern parts of Greenland will be particularly
affected. However, very different patterns occur. Sometimes cyclones move northwards through the
Davis Strait and the Baffin Bay, and sometimes a cyclone will move directly towards Cape Farewell,
subsequently splitting into two centres, one of which follows the west coast, while the other follows
the east coast. When this happens, most of Greenland may be affected during the passage, depend-
ing on local conditions.
In the summer, lows are less intense, but their tracks tend to be displaced northward, often straight
towards West Greenland, where the weather may therefore be rather unsettled.
Other types of lows - of a more local nature and on a smaller scale - occur. Here only the polar lows
are mentioned. They develop over ice-free sea areas when the atmosphere is very cold, typically
between Labrador and West Greenland, but sometimes even near the southeastern coast of Green-
land. The occurrence is always relatively far to the north of the polar front. The diameter of a polar
low is generally 200-300 km, and the system may be quite intense. Its lifetime is normally one or
two days. At some point in the cycle the system may feature a cloud structure similar to that of a
tropical hurricane. This is no coincident. Just like tropical hurricanes, these lows get their energy
Technical Report 12-04
www.dmi.dk/dmi/tr12-04 page 13 of 75
from the heat and humidity brought to the air from the surface of the sea, being essentially warmer
than the air.
Wind
As mentioned above, strong winds will typically be connected with passing cyclones. Between such
events there will be short or long periods of calm throughout the year, in which the wind regimes
are determined by local conditions.
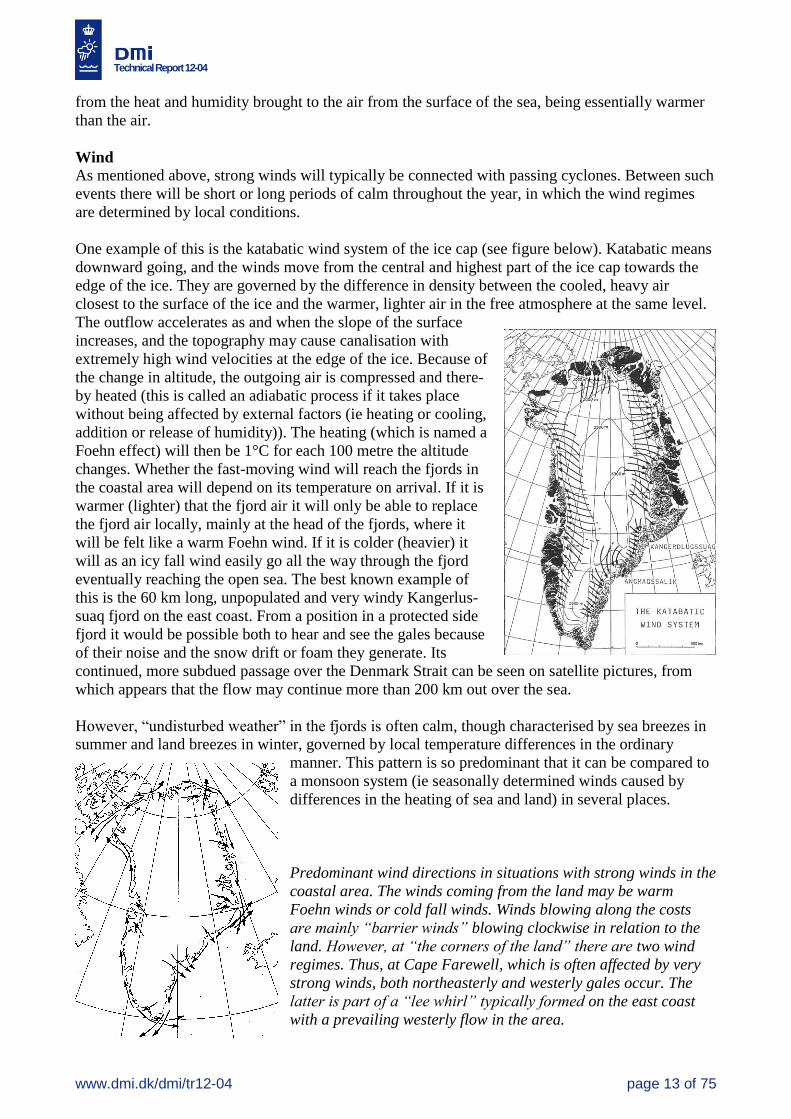
One example of this is the katabatic wind system of the ice cap (see figure below). Katabatic means
downward going, and the winds move from the central and highest part of the ice cap towards the
edge of the ice. They are governed by the difference in density between the cooled, heavy air
closest to the surface of the ice and the warmer, lighter air in the free atmosphere at the same level.
The outflow accelerates as and when the slope of the surface
increases, and the topography may cause canalisation with
extremely high wind velocities at the edge of the ice. Because of
the change in altitude, the outgoing air is compressed and there-
by heated (this is called an adiabatic process if it takes place
without being affected by external factors (ie heating or cooling,
addition or release of humidity)). The heating (which is named a
Foehn effect) will then be 1°C for each 100 metre the altitude
changes. Whether the fast-moving wind will reach the fjords in
the coastal area will depend on its temperature on arrival. If it is
warmer (lighter) that the fjord air it will only be able to replace
the fjord air locally, mainly at the head of the fjords, where it
will be felt like a warm Foehn wind. If it is colder (heavier) it
will as an icy fall wind easily go all the way through the fjord
eventually reaching the open sea. The best known example of
this is the 60 km long, unpopulated and very windy Kangerlus-
suaq fjord on the east coast. From a position in a protected side
fjord it would be possible both to hear and see the gales because
of their noise and the snow drift or foam they generate. Its
continued, more subdued passage over the Denmark Strait can be seen on satellite pictures, from
which appears that the flow may continue more than 200 km out over the sea.
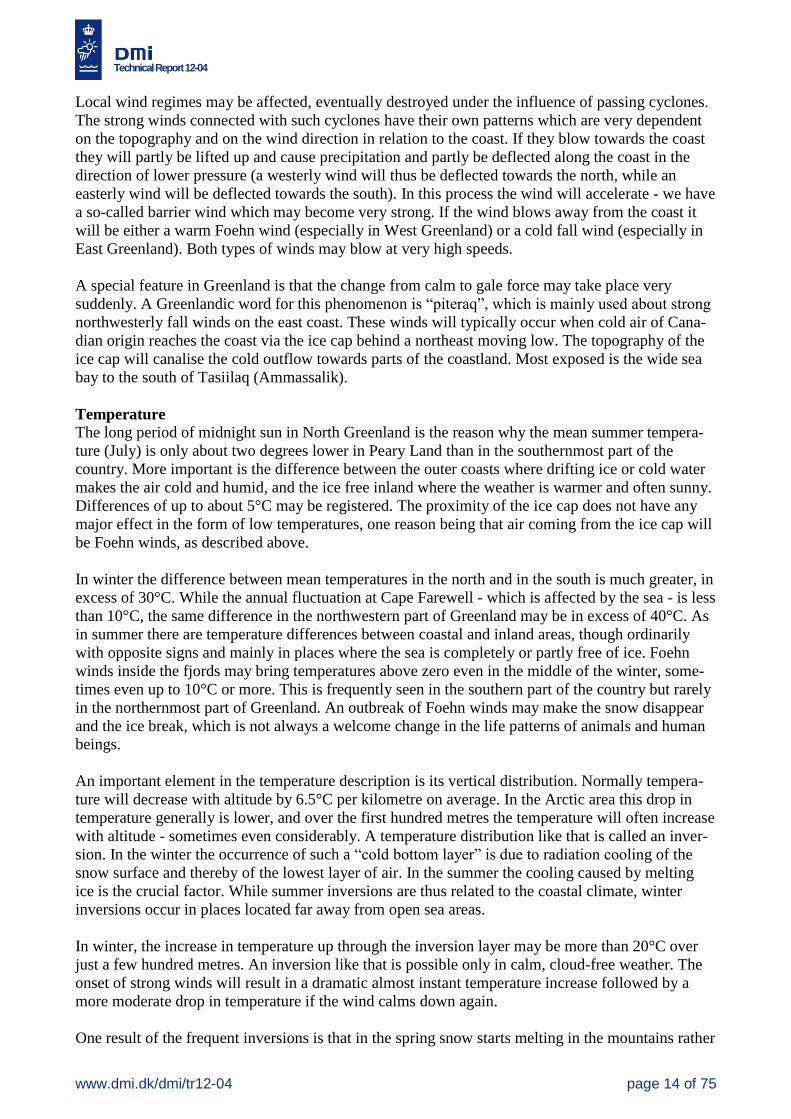
However, “undisturbed weather” in the fjords is often calm, though characterised by sea breezes in
summer and land breezes in winter, governed by local temperature differences in the ordinary
manner. This pattern is so predominant that it can be compared to
a monsoon system (ie seasonally determined winds caused by
differences in the heating of sea and land) in several places.
Predominant wind directions in situations with strong winds in the
coastal area. The winds coming from the land may be warm
Foehn winds or cold fall winds. Winds blowing along the costs
are mainly “barrier winds” blowing clockwise in relation to the
land. However, at “the corners of the land” there are two wind
regimes. Thus, at Cape Farewell, which is often affected by very
strong winds, both northeasterly and westerly gales occur. The
latter is part of a “lee whirl” typically formed on the east coast
with a prevailing westerly flow in the area.
Technical Report 12-04
www.dmi.dk/dmi/tr12-04 page 14 of 75
Local wind regimes may be affected, eventually destroyed under the influence of passing cyclones.
The strong winds connected with such cyclones have their own patterns which are very dependent
on the topography and on the wind direction in relation to the coast. If they blow towards the coast
they will partly be lifted up and cause precipitation and partly be deflected along the coast in the
direction of lower pressure (a westerly wind will thus be deflected towards the north, while an
easterly wind will be deflected towards the south). In this process the wind will accelerate - we have
a so-called barrier wind which may become very strong. If the wind blows away from the coast it
will be either a warm Foehn wind (especially in West Greenland) or a cold fall wind (especially in
East Greenland). Both types of winds may blow at very high speeds.
A special feature in Greenland is that the change from calm to gale force may take place very
suddenly. A Greenlandic word for this phenomenon is “piteraq”, which is mainly used about strong
northwesterly fall winds on the east coast. These winds will typically occur when cold air of Cana-
dian origin reaches the coast via the ice cap behind a northeast moving low. The topography of the
ice cap will canalise the cold outflow towards parts of the coastland. Most exposed is the wide sea
bay to the south of Tasiilaq (Ammassalik).
Temperature
The long period of midnight sun in North Greenland is the reason why the mean summer tempera-
ture (July) is only about two degrees lower in Peary Land than in the southernmost part of the
country. More important is the difference between the outer coasts where drifting ice or cold water
makes the air cold and humid, and the ice free inland where the weather is warmer and often sunny.
Differences of up to about 5°C may be registered. The proximity of the ice cap does not have any
major effect in the form of low temperatures, one reason being that air coming from the ice cap will
be Foehn winds, as described above.
In winter the difference between mean temperatures in the north and in the south is much greater, in
excess of 30°C. While the annual fluctuation at Cape Farewell - which is affected by the sea - is less
than 10°C, the same difference in the northwestern part of Greenland may be in excess of 40°C. As
in summer there are temperature differences between coastal and inland areas, though ordinarily
with opposite signs and mainly in places where the sea is completely or partly free of ice. Foehn
winds inside the fjords may bring temperatures above zero even in the middle of the winter, some-
times even up to 10°C or more. This is frequently seen in the southern part of the country but rarely
in the northernmost part of Greenland. An outbreak of Foehn winds may make the snow disappear
and the ice break, which is not always a welcome change in the life patterns of animals and human
beings.
An important element in the temperature description is its vertical distribution. Normally tempera-
ture will decrease with altitude by 6.5°C per kilometre on average. In the Arctic area this drop in
temperature generally is lower, and over the first hundred metres the temperature will often increase
with altitude - sometimes even considerably. A temperature distribution like that is called an inver-
sion. In the winter the occurrence of such a “cold bottom layer” is due to radiation cooling of the
snow surface and thereby of the lowest layer of air. In the summer the cooling caused by melting
ice is the crucial factor. While summer inversions are thus related to the coastal climate, winter
inversions occur in places located far away from open sea areas.
In winter, the increase in temperature up through the inversion layer may be more than 20°C over
just a few hundred metres. An inversion like that is possible only in calm, cloud-free weather. The
onset of strong winds will result in a dramatic almost instant temperature increase followed by a
more moderate drop in temperature if the wind calms down again.
One result of the frequent inversions is that in the spring snow starts melting in the mountains rather
Technical Report 12-04
www.dmi.dk/dmi/tr12-04 page 15 of 75
than at sea level and that the most vigorous vegetation is often found at an altitude of a few hundred
metres. If a temperature measuring station is moved from a low to a slightly higher position it may
result in loss of continuity in measurements.
Cold and mild winters - the temperature seesaw
The Canadian cold vortex is not stationary but fluctuates from day to day around its normal
position. In certain periods there are more significant fluctuations of longer duration, which
may have a significant impact on the winter weather not only in Greenland but also in the north-
western part of Europe and elsewhere.
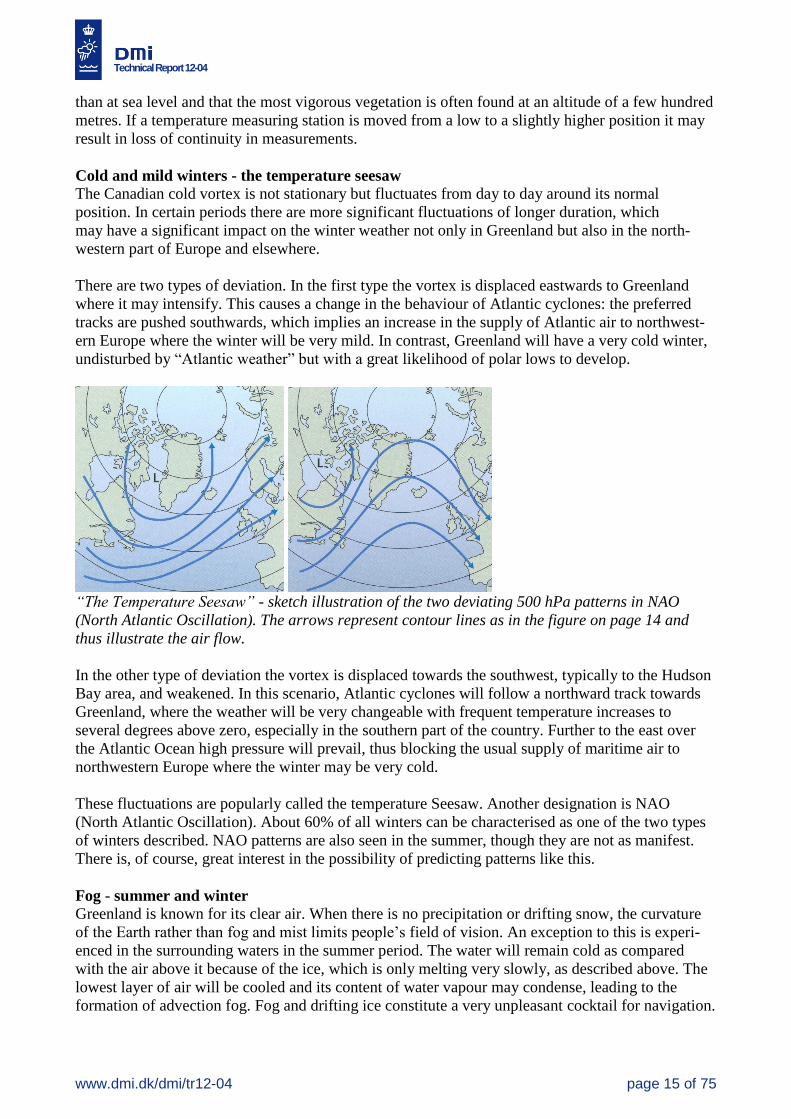
There are two types of deviation. In the first type the vortex is displaced eastwards to Greenland
where it may intensify. This causes a change in the behaviour of Atlantic cyclones: the preferred
tracks are pushed southwards, which implies an increase in the supply of Atlantic air to northwest-
ern Europe where the winter will be very mild. In contrast, Greenland will have a very cold winter,
undisturbed by “Atlantic weather” but with a great likelihood of polar lows to develop.
“The Temperature Seesaw” - sketch illustration of the two deviating 500 hPa patterns in NAO
(North Atlantic Oscillation). The arrows represent contour lines as in the figure on page 14 and
thus illustrate the air flow.
In the other type of deviation the vortex is displaced towards the southwest, typically to the Hudson
Bay area, and weakened. In this scenario, Atlantic cyclones will follow a northward track towards
Greenland, where the weather will be very changeable with frequent temperature increases to
several degrees above zero, especially in the southern part of the country. Further to the east over
the Atlantic Ocean high pressure will prevail, thus blocking the usual supply of maritime air to
northwestern Europe where the winter may be very cold.
These fluctuations are popularly called the temperature Seesaw. Another designation is NAO
(North Atlantic Oscillation). About 60% of all winters can be characterised as one of the two types
of winters described. NAO patterns are also seen in the summer, though they are not as manifest.
There is, of course, great interest in the possibility of predicting patterns like this.
Fog - summer and winter
Greenland is known for its clear air. When there is no precipitation or drifting snow, the curvature
of the Earth rather than fog and mist limits people’s field of vision. An exception to this is experi-
enced in the surrounding waters in the summer period. The water will remain cold as compared
with the air above it because of the ice, which is only melting very slowly, as described above. The
lowest layer of air will be cooled and its content of water vapour may condense, leading to the
formation of advection fog. Fog and drifting ice constitute a very unpleasant cocktail for navigation.
Technical Report 12-04
www.dmi.dk/dmi/tr12-04 page 16 of 75
The sea fog season begins in May, peaks in July and fades out in September. In coastal waters there
will be fog for about 20% of the time in July. Fog is also very common in the central part of the
Greenland ice cap in the summer.
Summer sea breezes lead the sea fog into the fjords, where it is generally dissolved quickly by the
sunheated land. The further into the fjords, the less frequent is the occurrence of fog. Seen in this
perspective, the airports in Kangerlussuaq and Narsarsuaq are ideally located.
In winter the air is generally dry and very clear, unless snow is falling or drifting. However, in areas
where cold air flows out over open water, sea smoke may be formed. Low radiation fog may some-
times be seen in areas with vast snow surfaces. However, a radiation-cooled snow surface will
generally have a drying effect on the lowest layer of air since the humidity contained in this layer
will be sublimated into white frost on the cold surface.
Precipitation
The amount of precipitation is generally higher at the coasts than inside the country. It is very high
in the southern part of the country, especially on the east coast, while it is low in North Greenland,
which has a number of “Arctic deserts”, ie areas nearly snow free in the winter, and where evapora-
tion may exceed precipitation in the summer.
At sea level, precipitation takes the form of rain in the summer and mainly of snow in the winter in
the southern part of the country. In the northernmost part of the country it may sometimes snow in
July, while rain is extremely rare in the winter. Precipitation in the form of showers is common in
the winter at locations close to open sea. In the summer there may be showers inland as a result of
sun warming. Thunder occurs in unstable weather, though only very rarely and generally for very
short periods of time. In the winter time heavy showers over the sea may be accompanied by thun-
der. Precipitation measurements carried out during the winter are unreliable because of frequent
snow drifting.
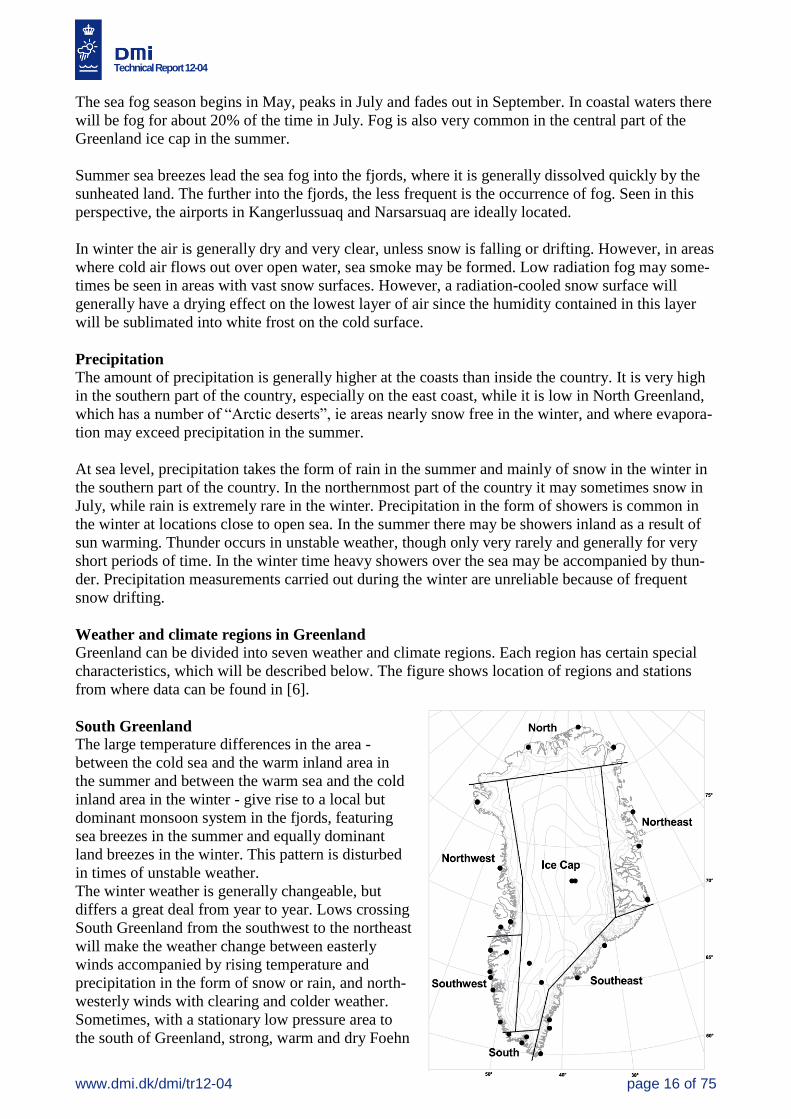
Weather and climate regions in Greenland
Greenland can be divided into seven weather and climate regions. Each region has certain special
characteristics, which will be described below. The figure shows location of regions and stations
from where data can be found in [6].
South Greenland
The large temperature differences in the area -
between the cold sea and the warm inland area in
the summer and between the warm sea and the cold
inland area in the winter - give rise to a local but
dominant monsoon system in the fjords, featuring
sea breezes in the summer and equally dominant
land breezes in the winter. This pattern is disturbed
in times of unstable weather.
The winter weather is generally changeable, but
differs a great deal from year to year. Lows crossing
South Greenland from the southwest to the northeast
will make the weather change between easterly
winds accompanied by rising temperature and
precipitation in the form of snow or rain, and north-
westerly winds with clearing and colder weather.
Sometimes, with a stationary low pressure area to
the south of Greenland, strong, warm and dry Foehn
Technical Report 12-04
www.dmi.dk/dmi/tr12-04 page 17 of 75
winds from an easterly direction may blow in the fjords for relatively long periods of time, in rare
cases for weeks. The temperature of such winds will be in the region of 10°C or more. The winds
may reach gale force with gusts of hurricane scale. Locally these winds are referred to as a “sydost”
(“southeaster”) even though the wind direction is typically northeast. In such scenarios the snow
cover will disappear and the ice in the fjords will break. In contrast, a stationary low pressure area
near Iceland may be characterised by a long period of northwesterly winds with hard frost and in
the coastal area frequent snow showers. Inside the country clear sky will prevail.
Summers are warm inside the country. In certain locations the mean temperature for July is a little
above 10°C. Temperatures are lower near the coast because of the cold sea, where fog is frequent
(above 20% of time). The sea breeze brings the fog into the sun-heated fjord areas where it is
dissolved.
The amount of precipitation is large. In the summer, precipitation will always be in the form of rain,
while snow is most common in the winter. The snow layer can occasionally be reduced by melting.
Southwest Greenland
This area is the part of the country where ships can navigate almost unimpeded in relation to sea ice
allyear round. The open sea means that the coastal zone, where the population is concentrated, has
relatively mild winters, while the summers are characterised by relatively cool and often unsettled
weather. Inside the fjords winters are cold, while summers are warmer. However, just as in South
Greenland, there are major fluctuations in the weather from year to year. The amount of
precipitation is generally large in the southern part of the area but decreases further to the north and
especially in the direction going from the coast and inwards. While winters in Sisimiut are charac-
terised by relatively much snow, there is generally only a thin layer of snow in Kangerlussuaq/Sdr.
Strømfjord.
In winter, winds from northerly directions are predominant. They are typically connected with clear,
cold weather in the coast land, though there are many snow showers over the sea, which occasional-
ly affect the coast. Unstable, rough weather accompanies lows passing through the Davis Strait
from the south or the southwest. During the passage temperatures will rise, and there will be abun-
dant precipitation and strong wind from the south, often reaching gale force and occasionally even
hurricane force in the coastal area. The best known of these winds is the “sydvesten” (“the south-
wester”) at Nuuk (called “nigersuaq” in Greenlandic). When combined with a Foehn effect, this
southerly wind may bring temperatures up to 10-15°C even in the middle of winter, though this is
relatively rare. The high temperatures will only last for a short period of time.
In the event of major outbreaks of cold air from Canada, polar lows will often develop over the sea.
If they reach the coast they will be very manifest in the form of strong winds combined with blind-
ing drifting snow and hard frost.
In summer lows passing from the south and southwest through the Davis Strait are relatively
frequent. Just as in winter, these lows may cause rather abundant precipitation in coastal areas with
strong winds from the south. In June precipitation may still be in the form of snow, but otherwise it
will be rain. Inside the fjords, the winds generally are more moderate, though local outbreaks of
strong Foehn winds or mountain gusts may occur.
Stable summer weather is seen in periods with high pressure over the central part of Greenland. In
such conditions there may be “midsummer weather” even in May, with day temperatures of up to
20°C in the inner part of the fjords, but with frequent fog and temperatures only slightly above 0°C
at the outer coast.
Technical Report 12-04
www.dmi.dk/dmi/tr12-04 page 18 of 75
The midnight sun line goes through Maniitsoq, while the limit for polar nights is located a little to
the north of Sisimiut.
Northwest Greenland
Since the ice cover is almost uninterrupted in Baffin Bay in the winter, winters are less unstable but
colder than in southwest Greenland. The area has the same storm patterns: strong winds from the
southeast or south bringing large amounts of precipitation both summer and winter accompany
cyclones moving towards Baffin Bay from directions between south and west. On the lee side
of the Cap York peninsula, southeasterly winds appear as extremely turbulent Foehn winds at
Pituffik/Thule Air Base. Also in the inner parts of the Disko Bay and Uummannaq Fjord occasional
strong Foehn winds from the southeast occur, while the strait between Disko and Nuussuaq, the
Vaigat, is known for its changeable winds. Generally the mean wind velocity peaks in the autumn
and falls again in December when the sea freezes over.
The amount of precipitation is relatively large in the southern part of the area, but lower in the
northern part. In winter precipitation is almost always in the form of snow, while rain is most
common in the summer, though it may sometimes snow in the northern part. Fog is very frequent at
sea and in coastal areas in the summer.
The duration of the midnight sun/polar night periods in the northern part of the area is 127 and 110
days respectively, in the southern part 52 an 24 days.
North Greenland
In the winter the mean air pressure is highest in this part of the country, the core of the high pres-
sure being located in the large northwest facing fjords - Sherard Osborn Fjord, Victoria Fjord, etc.
The weather is often clear and calm, and the temperature is the lowest found at sea level anywhere
in Greenland, the mean temperature probably being close to -40°C. The cold snow surface results in
a very persistent and strong low level inversion. Because of relatively low air pressure (and relative-
ly warm air) in Baffin Bay, the cold surface air is drained like a winter monsoon to the southwest
down through the Nares Strait. The resulting strong wind causes strong ice drifting in the Strait,
peaking in early winter. Later in the winter fast ice is formed down to a line slightly north of Cape
Alexander, connecting Greenland and Ellesmere Land. To the south of this line a polynya will form,
called the “North Water”, the fauna of which ensures the survival of the local population.
A similar drainage pattern is seen to the east of the high pressure area where the air flows along the
north coast towards Nordostrundingen, where a marked wind maximum exists. It is best registered
by the automatic weather station on Krøyers Holme, a small group of flat islets. Around these is
another polynya called the “North East Water”, which at least partly is kept open by the wind.
Summers are short. The snow covering the area disappears in July and returns in September, though
passing cyclones may cause occasional snowfalls, sometimes even blizzards in this period as well.
However, summers are generally sunny and relatively warm inland, while coastal areas are often
affected by fog or low clouds, which are characteristic of the ice-filled Arctic Ocean.
Precipitation is generally sparse, though unevenly spread. In many areas the wind moves considera-
ble quantities of snow and several areas are almost free of snow in the winter because of the wind.
A maximum of precipitation is seen around Station Nord on the wind side of Kronprins Christian
Land. This precipitation contributes to preserving the ice cap on the peninsula.
The duration of the midnight sun/polar night periods at Cape Morris Jesup is 154 days and 143 days
respectively.
Technical Report 12-04
www.dmi.dk/dmi/tr12-04 page 19 of 75
Northeast Greenland
Winters are generally very cold since there is no open sea in the area. The weather is often clear
with strong radiation cooling. Northerly wind directions are predominant. Strong winds and precipi-
tation are usually connected with cyclonic activities over the Greenland Sea, and may sometimes
last for relatively long periods of time. Maximum winds occur in the coastal area, though winds
coming from the ice cap may be very strong in certain fjords, taking the form of northwesterly and
westerly Foehn or fall winds. One example of this is the inner fjord complex in Scoresbysund,
another the northwestern part of Dove Bay, where the wind moves considerable quantities of snow.
In the summer period the coastal zone is often affected by fog from the ice-filled sea, the mean
temperature of the fog being only a little above zero degrees Celsius. Inside the fjords summers are
relatively warm and sunny, though there may be periods of cold and unsettled weather when lows
pass the area. The highest temperatures are registered a few hundred metres above sea level where
there is no sea breeze.
For the year as a whole, the largest amounts of precipitation are seen in the southern part of the
area. However, inside the fjords the precipitation is sparse, which is the reason why there is a wide
zone of ice-free land to the south. A snow cover is formed in September, and the snow disappears
again in the period from May to July. Sometimes snow falls locally in July and August, but it
always melts away very quickly.
Fast ice in the fjords breaks in July in the southern part of the area, but in the northern part it may
last all summer. The formation of new ice begins in September.
The duration of the midnight sun/polar night periods in the northern part of the area is 137 days and
121 days respectively and 72 days and 52 days in the southern part.
Southeast Greenland
Winds and precipitation in this area are strongly affected by cyclonic activities around Iceland. The
track of the lows typically goes from southwest to northeast. In front of such a low there will be a
barrier wind from the northeast along the coast (Greenlandic: “neqajaq”), accompanied by
precipitation. The wind has its maximum where the coastline is protruding and may here quite often
reach hurricane force. Tasiilaq (Ammassalik) and the Aputiteeq weather station are located close to
the coastline but are often without the reach of the neqajaq, while Ikermiuarsuq and Prins Chr. Sund
are more exposed to it. Behind the low there may be strong winds from directions between north
and west (the hurricane-like piteraq). In most cases the piteraq is a rather local wind, the occurence
of which is determined by the topography of the coastal area and the ice cap. It blows frequently in
the wide sea bay to the south of Tasiilaq (see figure page 15) where the Ikermiit weather station is
located. Tasiilaq itself is rarely affected by the piteraq, but the large Kangerlussuaq fjord (about
68°N) is very exposed to it. The piteraq may be a warm Foehn wind with local temperatures of
more than 20°C, but in the winter it is usually a cold fall wind. During a destructive piteraq in
Tasiilaq in February 1970 the temperature was about -20°C and the peak wind velocity was esti-
mated to be near 90 m/s.
The precipitation in the area is abundant, the largest amounts falling to the south (2,000-3,000 mm a
year). Coastal mountains appear half covered in snow, and at the Blosseville Coast in the northeast
the glaciation line is close to sea level at certain locations. The amount of precipitation is particular-
ly high within the regime of relatively warm easterly (on-shore) winds blowing to the north of a
major low pressure area being stationary over South Greenland or over the sea to the south of
Greenland. In such cases, precipitation may be in the form of rain even in winter. Snow in the
summer is rare.

Technical Report 12-04
www.dmi.dk/dmi/tr12-04 page 20 of 75
In terms of temperature the area is affected by the East Greenland Polar Sea Current which has a
surface temperature close to zero degrees throughout the year and which brings along drift ice most
of the time. Winters are therefore cold with only short periods of thaw. Summers are cool with
frequent fog at the outer coast, but relatively warm and sunny in the fjords.
The midnight sun line passes through Tasiilaq, while the polar night line is located about 200 km
further north.
The Greenland Ice Sheet
The ice cap in Greenland is one of the most arid areas in the world. Along the edge, melting takes
place in the summer, but in the central part air temperatures hardly rise above 0°C. The reason for
this is partly the altitude, partly the high albedo (reflection of light) of the snow surface, which
means that the surface is only to a limited extent warmed by the sun. Temperatures are extremely
low in the winter, sometimes below -60°C in the central and northern part of the area. The British
research station Northice registered a temperature of -70°C in the 1950s. The cold surface “drains”
heat from the lowest layer of air, the result being an almost permanent inversion, which may be
very strong in the winter. The inversion layer is the cause of the katabatic winds mentioned earlier.
They are strongest and most persistent in winter, while in the summer they are mostly felt at night
and in the early morning hours. Passing cyclones may affect the inversion layer and break down the
wind pattern. However, the pattern will quickly be re-established after the passage.
The southern part of the ice cap is partly maintained by abundant precipitation, while the central
and northern parts exist because the melting is rather modest. The surface of the snow bear witness
to the wind conditions. It is relatively even and loose in the central part of the area, where it is not
affected to any great extent by the wind. Along the edges, the snow is hard blown with clear-cut
snow drifts (“sastrugi”) lying parallel to the predominant wind direction.
Technical Report 12-04
www.dmi.dk/dmi/tr12-04 page 21 of 75
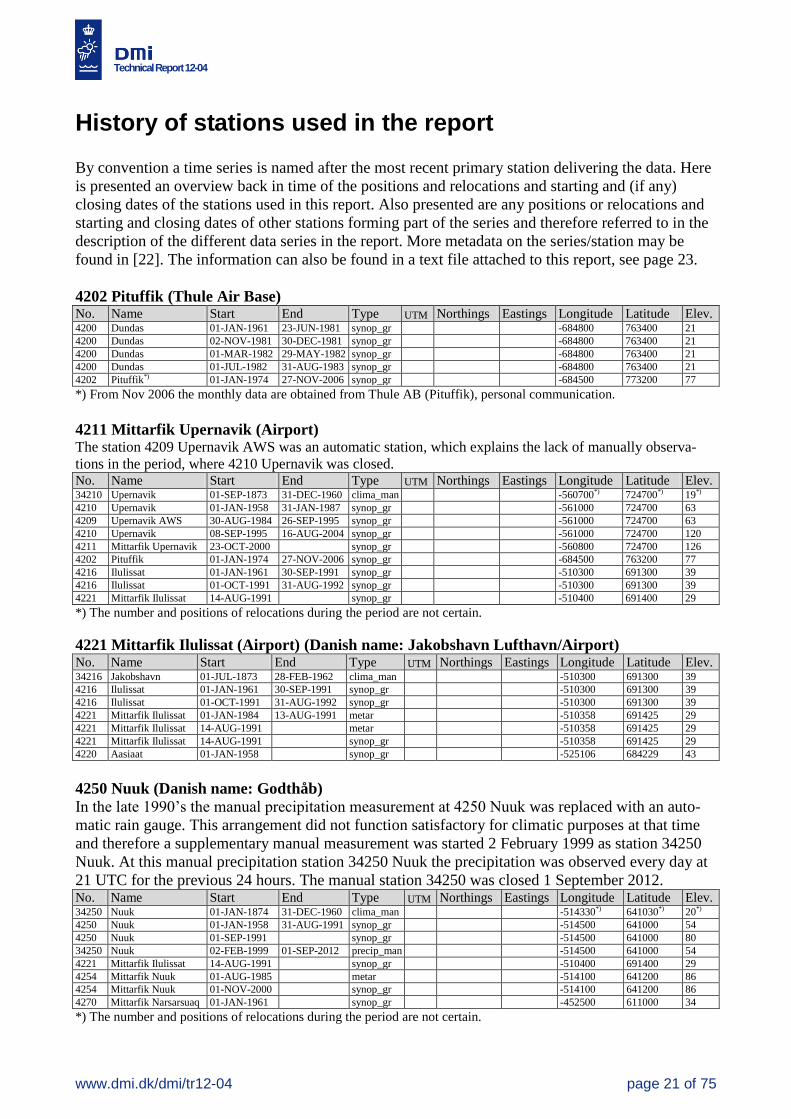
History of stations used in the report
By convention a time series is named after the most recent primary station delivering the data. Here
is presented an overview back in time of the positions and relocations and starting and (if any)
closing dates of the stations used in this report. Also presented are any positions or relocations and
starting and closing dates of other stations forming part of the series and therefore referred to in the
description of the different data series in the report. More metadata on the series/station may be
found in [22]. The information can also be found in a text file attached to this report, see page 23.
4202 Pituffik (Thule Air Base) No. Name Start End Type UTM Northings Eastings Longitude Latitude Elev. 4200 Dundas 01-JAN-1961 23-JUN-1981 synop_gr -684800 763400 21
4200 Dundas 02-NOV-1981 30-DEC-1981 synop_gr -684800 763400 21
4200 Dundas 01-MAR-1982 29-MAY-1982 synop_gr -684800 763400 21
4200 Dundas 01-JUL-1982 31-AUG-1983 synop_gr -684800 763400 21
4202 Pituffik*) 01-JAN-1974 27-NOV-2006 synop_gr -684500 773200 77
*) From Nov 2006 the monthly data are obtained from Thule AB (Pituffik), personal communication.
4211 Mittarfik Upernavik (Airport) The station 4209 Upernavik AWS was an automatic station, which explains the lack of manually observa-
tions in the period, where 4210 Upernavik was closed. No. Name Start End Type UTM Northings Eastings Longitude Latitude Elev. 34210 Upernavik 01-SEP-1873 31-DEC-1960 clima_man -560700*) 724700*) 19*)
4210 Upernavik 01-JAN-1958 31-JAN-1987 synop_gr -561000 724700 63
4209 Upernavik AWS 30-AUG-1984 26-SEP-1995 synop_gr -561000 724700 63
4210 Upernavik 08-SEP-1995 16-AUG-2004 synop_gr -561000 724700 120
4211 Mittarfik Upernavik 23-OCT-2000 synop_gr -560800 724700 126
4202 Pituffik 01-JAN-1974 27-NOV-2006 synop_gr -684500 763200 77
4216 Ilulissat 01-JAN-1961 30-SEP-1991 synop_gr -510300 691300 39
4216 Ilulissat 01-OCT-1991 31-AUG-1992 synop_gr -510300 691300 39
4221 Mittarfik Ilulissat 14-AUG-1991 synop_gr -510400 691400 29
*) The number and positions of relocations during the period are not certain.
4221 Mittarfik Ilulissat (Airport) (Danish name: Jakobshavn Lufthavn/Airport) No. Name Start End Type UTM Northings Eastings Longitude Latitude Elev. 34216 Jakobshavn 01-JUL-1873 28-FEB-1962 clima_man -510300 691300 39
4216 Ilulissat 01-JAN-1961 30-SEP-1991 synop_gr -510300 691300 39
4216 Ilulissat 01-OCT-1991 31-AUG-1992 synop_gr -510300 691300 39
4221 Mittarfik Ilulissat 01-JAN-1984 13-AUG-1991 metar -510358 691425 29
4221 Mittarfik Ilulissat 14-AUG-1991 metar -510358 691425 29
4221 Mittarfik Ilulissat 14-AUG-1991 synop_gr -510358 691425 29
4220 Aasiaat 01-JAN-1958 synop_gr -525106 684229 43
4250 Nuuk (Danish name: Godthåb)
In the late 1990’s the manual precipitation measurement at 4250 Nuuk was replaced with an auto-
matic rain gauge. This arrangement did not function satisfactory for climatic purposes at that time
and therefore a supplementary manual measurement was started 2 February 1999 as station 34250
Nuuk. At this manual precipitation station 34250 Nuuk the precipitation was observed every day at
21 UTC for the previous 24 hours. The manual station 34250 was closed 1 September 2012. No. Name Start End Type UTM Northings Eastings Longitude Latitude Elev. 34250 Nuuk 01-JAN-1874 31-DEC-1960 clima_man -514330*) 641030*) 20*)
4250 Nuuk 01-JAN-1958 31-AUG-1991 synop_gr -514500 641000 54
4250 Nuuk 01-SEP-1991 synop_gr -514500 641000 80
34250 Nuuk 02-FEB-1999 01-SEP-2012 precip_man -514500 641000 54
4221 Mittarfik Ilulissat 14-AUG-1991 synop_gr -510400 691400 29
4254 Mittarfik Nuuk 01-AUG-1985 metar -514100 641200 86
4254 Mittarfik Nuuk 01-NOV-2000 synop_gr -514100 641200 86
4270 Mittarfik Narsarsuaq 01-JAN-1961 synop_gr -452500 611000 34
*) The number and positions of relocations during the period are not certain.
Technical Report 12-04
www.dmi.dk/dmi/tr12-04 page 22 of 75
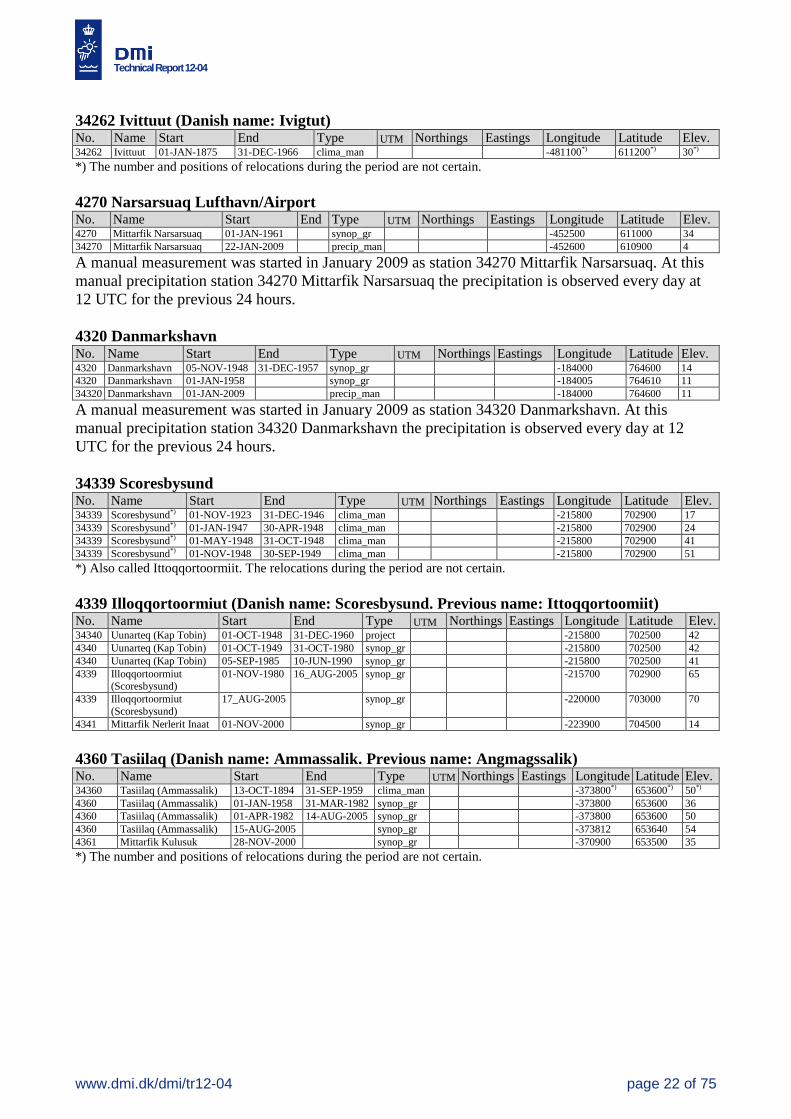
34262 Ivittuut (Danish name: Ivigtut) No. Name Start End Type UTM Northings Eastings Longitude Latitude Elev. 34262 Ivittuut 01-JAN-1875 31-DEC-1966 clima_man -481100*) 611200*) 30*)
*) The number and positions of relocations during the period are not certain.
4270 Narsarsuaq Lufthavn/Airport No. Name Start End Type UTM Northings Eastings Longitude Latitude Elev. 4270 Mittarfik Narsarsuaq 01-JAN-1961 synop_gr -452500 611000 34
34270 Mittarfik Narsarsuaq 22-JAN-2009 precip_man -452600 610900 4
A manual measurement was started in January 2009 as station 34270 Mittarfik Narsarsuaq. At this
manual precipitation station 34270 Mittarfik Narsarsuaq the precipitation is observed every day at
12 UTC for the previous 24 hours.
4320 Danmarkshavn No. Name Start End Type UTM Northings Eastings Longitude Latitude Elev. 4320 Danmarkshavn 05-NOV-1948 31-DEC-1957 synop_gr -184000 764600 14
4320 Danmarkshavn 01-JAN-1958 synop_gr -184005 764610 11
34320 Danmarkshavn 01-JAN-2009 precip_man -184000 764600 11
A manual measurement was started in January 2009 as station 34320 Danmarkshavn. At this
manual precipitation station 34320 Danmarkshavn the precipitation is observed every day at 12
UTC for the previous 24 hours.
34339 Scoresbysund No. Name Start End Type UTM Northings Eastings Longitude Latitude Elev. 34339 Scoresbysund*) 01-NOV-1923 31-DEC-1946 clima_man -215800 702900 17
34339 Scoresbysund*) 01-JAN-1947 30-APR-1948 clima_man -215800 702900 24
34339 Scoresbysund*) 01-MAY-1948 31-OCT-1948 clima_man -215800 702900 41
34339 Scoresbysund*) 01-NOV-1948 30-SEP-1949 clima_man -215800 702900 51
*) Also called Ittoqqortoormiit. The relocations during the period are not certain.
4339 Illoqqortoormiut (Danish name: Scoresbysund. Previous name: Ittoqqortoomiit) No. Name Start End Type UTM Northings Eastings Longitude Latitude Elev. 34340 Uunarteq (Kap Tobin) 01-OCT-1948 31-DEC-1960 project -215800 702500 42
4340 Uunarteq (Kap Tobin) 01-OCT-1949 31-OCT-1980 synop_gr -215800 702500 42
4340 Uunarteq (Kap Tobin) 05-SEP-1985 10-JUN-1990 synop_gr -215800 702500 41
4339 Illoqqortoormiut
(Scoresbysund)
01-NOV-1980 16_AUG-2005 synop_gr -215700 702900 65
4339 Illoqqortoormiut
(Scoresbysund)
17_AUG-2005 synop_gr -220000 703000 70
4341 Mittarfik Nerlerit Inaat 01-NOV-2000 synop_gr -223900 704500 14
4360 Tasiilaq (Danish name: Ammassalik. Previous name: Angmagssalik) No. Name Start End Type UTM Northings Eastings Longitude Latitude Elev. 34360 Tasiilaq (Ammassalik) 13-OCT-1894 31-SEP-1959 clima_man -373800*) 653600*) 50*)
4360 Tasiilaq (Ammassalik) 01-JAN-1958 31-MAR-1982 synop_gr -373800 653600 36
4360 Tasiilaq (Ammassalik) 01-APR-1982 14-AUG-2005 synop_gr -373800 653600 50
4360 Tasiilaq (Ammassalik) 15-AUG-2005 synop_gr -373812 653640 54
4361 Mittarfik Kulusuk 28-NOV-2000 synop_gr -370900 653500 35
*) The number and positions of relocations during the period are not certain.
Technical Report 12-04
www.dmi.dk/dmi/tr12-04 page 23 of 75
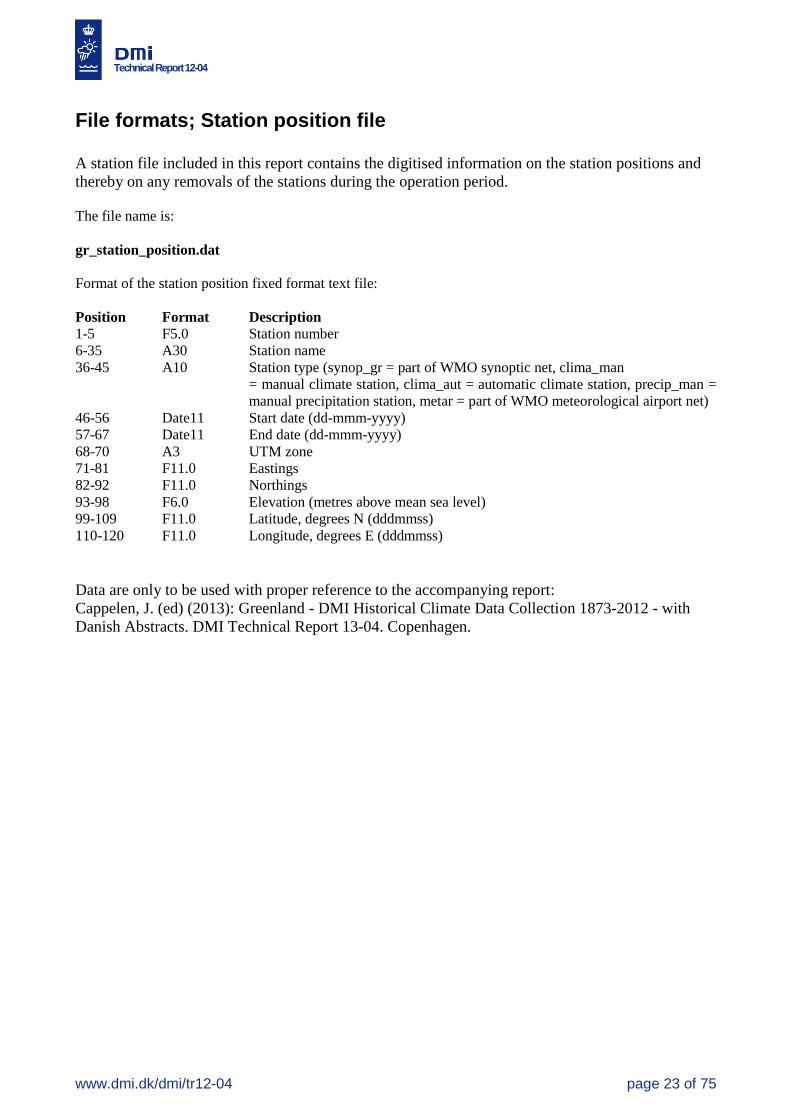
File formats; Station position file
A station file included in this report contains the digitised information on the station positions and
thereby on any removals of the stations during the operation period.
The file name is:
gr_station_position.dat
Format of the station position fixed format text file:
Position Format Description
1-5 F5.0 Station number
6-35 A30 Station name
36-45 A10 Station type (synop_gr = part of WMO synoptic net, clima_man
= manual climate station, clima_aut = automatic climate station, precip_man =
manual precipitation station, metar = part of WMO meteorological airport net)
46-56 Date11 Start date (dd-mmm-yyyy)
57-67 Date11 End date (dd-mmm-yyyy)
68-70 A3 UTM zone
71-81 F11.0 Eastings
82-92 F11.0 Northings
93-98 F6.0 Elevation (metres above mean sea level)
99-109 F11.0 Latitude, degrees N (dddmmss)
110-120 F11.0 Longitude, degrees E (dddmmss)
Data are only to be used with proper reference to the accompanying report:
Cappelen, J. (ed) (2013): Greenland - DMI Historical Climate Data Collection 1873-2012 - with
Danish Abstracts. DMI Technical Report 13-04. Copenhagen.
Technical Report 12-04
www.dmi.dk/dmi/tr12-04 page 24 of 75
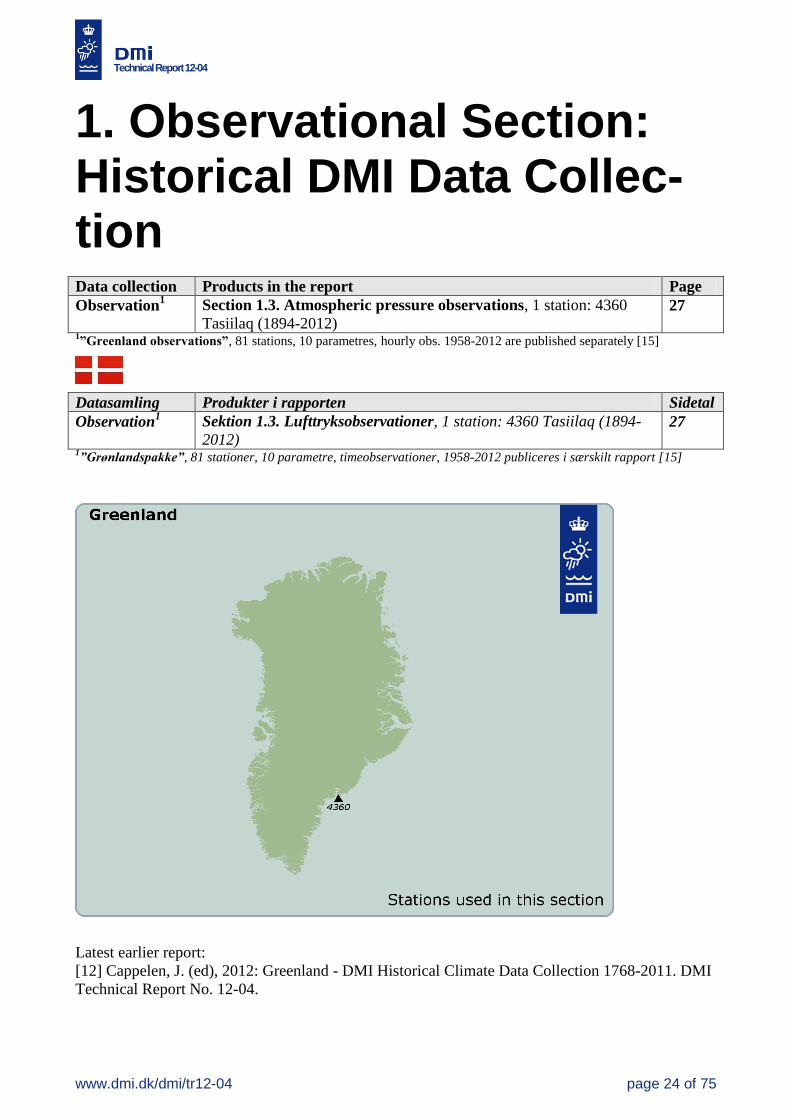
1. Observational Section: Historical DMI Data Collec-tion
Data collection Products in the report Page
Observation1 Section 1.3. Atmospheric pressure observations, 1 station: 4360
Tasiilaq (1894-2012) 27
1”Greenland observations”, 81 stations, 10 parametres, hourly obs. 1958-2012 are published separately [15]
Datasamling Produkter i rapporten Sidetal
Observation1 Sektion 1.3. Lufttryksobservationer, 1 station: 4360 Tasiilaq (1894-
2012) 27
1”Grønlandspakke”, 81 stationer, 10 parametre, timeobservationer, 1958-2012 publiceres i særskilt rapport [15]
Latest earlier report:
[12] Cappelen, J. (ed), 2012: Greenland - DMI Historical Climate Data Collection 1768-2011. DMI
Technical Report No. 12-04.
Technical Report 12-04
www.dmi.dk/dmi/tr12-04 page 25 of 75
1.1. Introduction The purpose of this chapter is to publish one mean sea level atmospheric pressure data series from
Tasiilaq, Greenland (observations) covering the period 1894-2012 as shown as can be seen in table
1.2.1.
According to the intensions to update regularly, preferably every year, this section contains an
update (2012 data) of the one greenlandic mean sea level atmospheric pressure series from Tasiilaq
originally published in DMI technical Report 97-3: North Atlantic-European pressure observations
1868-1995 - WASA dataset version 1.0 [27].
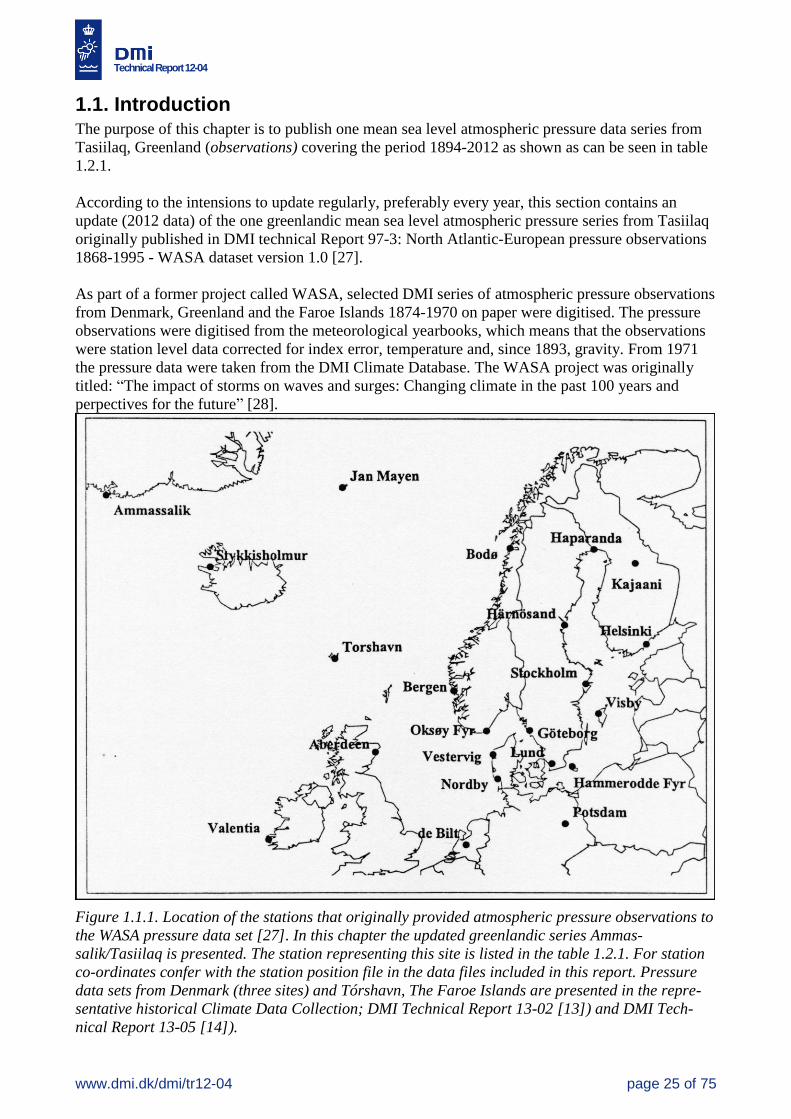
As part of a former project called WASA, selected DMI series of atmospheric pressure observations
from Denmark, Greenland and the Faroe Islands 1874-1970 on paper were digitised. The pressure
observations were digitised from the meteorological yearbooks, which means that the observations
were station level data corrected for index error, temperature and, since 1893, gravity. From 1971
the pressure data were taken from the DMI Climate Database. The WASA project was originally
titled: “The impact of storms on waves and surges: Changing climate in the past 100 years and
perpectives for the future” [28].
Figure 1.1.1. Location of the stations that originally provided atmospheric pressure observations to
the WASA pressure data set [27]. In this chapter the updated greenlandic series Ammas-
salik/Tasiilaq is presented. The station representing this site is listed in the table 1.2.1. For station
co-ordinates confer with the station position file in the data files included in this report. Pressure
data sets from Denmark (three sites) and Tórshavn, The Faroe Islands are presented in the repre-
sentative historical Climate Data Collection; DMI Technical Report 13-02 [13]) and DMI Tech-
nical Report 13-05 [14]).
Technical Report 12-04
www.dmi.dk/dmi/tr12-04 page 26 of 75
Climate change studies and the related analysis of observed climatic data call for long time series of
climate data on all scales, but please note that the digitisation of the observations of atmospheric
pressure only can be considered as the first step towards sensible utilisation of the observations for
climate change studies. Next follows testing for homogeneity of the series, ensuring that any dis-
covered trend are natural.
During the WASA project the data have been homogenised. The updated series presented in this
chapter has been tested and corrected carefully, mainly based on visual tests. Thus it must be
stressed that the updated atmospheric pressure data after the WASA project consist of the values as
observed, and that no final testing for homogeneity has been performed on these observations for
the whole period up to now. They are therefore not necessarily homogenized as such and this
should be considered before applying the data series for climate research purposes.
For the benefit of scientists that may wish to conduct such testing various results and remarks
concerning observational pressure data have been included in the report. For supplementary
metadata, see also [27].
The mean sea level atmospheric pressure data set from 4360 Tasiilaq, Greenland can be download-
ed from the publication part of DMI web pages.
Formålet med denne sektion er at publicere en tilgængelig dataserie af observationer af lufttryk
(msl) fra Tasiilaq, Grønland 1894-2012. Dataseriens detaljer kan ses i tabel 1.3.1 i afsnit 1.3 og
filformat af den medfølgende fil kan ses i afsnit 1.4.
Technical Report 12-04
www.dmi.dk/dmi/tr12-04 page 27 of 75
1.2. Stations and parametres
1.2.1. Station Overview
Country Station Station number First year
1 GR Tasiilaq 43601)
1894
Table 1.2.1 Primary stations used in this report.
1) Before 1958 the observations were taken from 34360 Angmagssalik, see table 1.3.1.
The stations have been relocated several times since the start, new station numbers and names have
been attached, new instruments and new observers have been introduced. The latter have obviously
been replaced many times. See the station history in the chapter “History of stations used in the
report”.
1.2.2. Data Dictionary
Abbr. Element Method Unit
Pppp Atmospheric pressure (MSL) Obs 0,1 hPa
Table 1.2.2. Elements used in this section. ‘Method’ specifies that the element is an observation.
The units of the observation values in the data files are specified in ‘Unit’.
1.3. Atmospheric pressure observations; Tasiilaq – 4360; 1894-2012
The atmospheric pressure measurements started 1894 at a national climate station Angmagssalik.
Measurements of atmospheric pressure were stopped at this manually operated climate stations in
the 1950’s. Therefore the atmospheric pressure series had to be continued from a nearby synoptic
station measuring atmospheric pressure. In the WASA project the data were merged into a long
homogeneous series and the table 1.3.1 indicates how the stations were merged and how many
observations the series contains in the different parts.
Site and period Station Start End Obs. hours (utc)
Tasiilaq 34360 Angmagssalik 01 November 1894 31 November 1956 8,11,17
1894-2012 4360 Tasiilaq 01 January 1958 05 August 2005 0,3,6,9,12,15,18,21
4360 Tasiilaq 05 August 2005 31 December 2012 0 – 23 every hour
Table 1.3.1. The Tasiilaq series of atmospheric pressure observations (at MSL, mean sea level).
Technical Report 12-04
www.dmi.dk/dmi/tr12-04 page 28 of 75
1.4. File Formats; Observation data files
An observation file included in this report contains mean sea level (MSL) atmospheric pressure
observations from 4360 Tasiilaq, Greenland.
The file name is determined as follows:
gr_obs_<station number>_pppp_<period>.dat
More specifically in this report:
gr_obs_pppp_4360_1894_2012.dat
There can be missing dates/records/values between the start and the end date.
Format and units of the atmospheric pressure observation fixed format text file:
Position Format Description
1-5 F5.0 Station number
6-9 F4.0 Year
10-11 F2.0 Month
12-13 F2.0 Day
14-15 F2.0 Hour (UTC)
16-20 F5.0 Atmospheric pressure reduced to MSL (0.1 hPa)
Data are only to be used with proper reference to the accompanying report: Cappelen, J. (ed), 2013:
Greenland - DMI Historical Climate Data Collection 1873-2012 – with Danish Abstracts. DMI
Technical Report 13-04. Copenhagen.
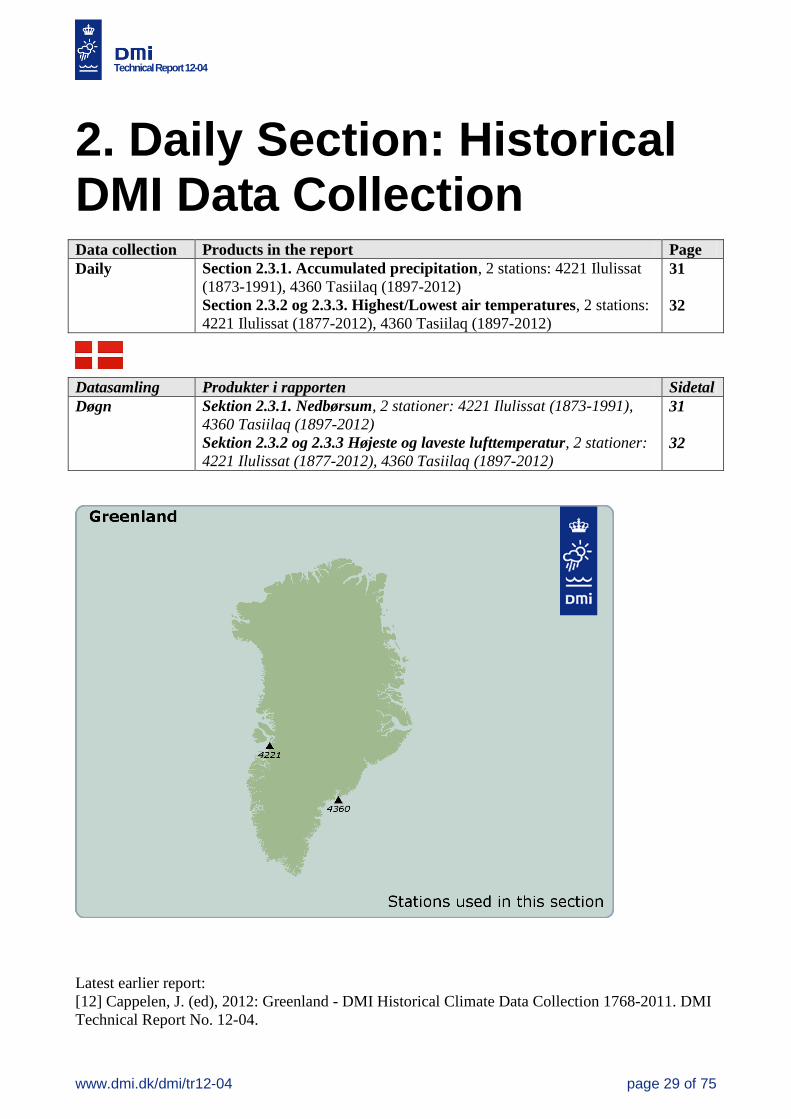
Technical Report 12-04
www.dmi.dk/dmi/tr12-04 page 29 of 75
2. Daily Section: Historical DMI Data Collection
Data collection Products in the report Page
Daily Section 2.3.1. Accumulated precipitation, 2 stations: 4221 Ilulissat
(1873-1991), 4360 Tasiilaq (1897-2012)
Section 2.3.2 og 2.3.3. Highest/Lowest air temperatures, 2 stations:
4221 Ilulissat (1877-2012), 4360 Tasiilaq (1897-2012)
31
32
Datasamling Produkter i rapporten Sidetal
Døgn Sektion 2.3.1. Nedbørsum, 2 stationer: 4221 Ilulissat (1873-1991),
4360 Tasiilaq (1897-2012)
Sektion 2.3.2 og 2.3.3 Højeste og laveste lufttemperatur, 2 stationer:
4221 Ilulissat (1877-2012), 4360 Tasiilaq (1897-2012)
31
32
Latest earlier report:
[12] Cappelen, J. (ed), 2012: Greenland - DMI Historical Climate Data Collection 1768-2011. DMI
Technical Report No. 12-04.
Technical Report 12-04
www.dmi.dk/dmi/tr12-04 page 30 of 75
2.1 Introduction The purpose of this chapter is to publish available long daily DMI data series 1873-2012 for Green-
land. The data parameters include minimum and maximum temperature and accumulated precipita-
tion.
According to the intensions to update regularly, preferably every year, this particular report contains
an update (2012 data) of the “DMI Daily Climate Data Collection” for the first time published in
that form in DMI Technical Report 04-03 [24]. A similar collection of long DMI monthly and
annual Greenlandic climate data series can be found in section 3 and 4 in this report.
The digitisation of a great part of the data presented in this chapter and also much of the station
history presented are results of various projects. The WASA project1, the ACCORD
2 project and
the NACD3 project have all contributed regarding the data from Greenland together with a digitisa-
tion during spring 1999 funded by the Danish Climate Centre [16], situated at the DMI. The old
daily series of maximum temperature, minimum temperature and precipitation from 34360 Tasiilaq
on the east coast of Greenland were digitised thanks to KVUG4.
Climate change studies and the related analysis of observed climatic data call for long time series of
daily climate data. In this context the report also serves as the DMI contribution of daily values to
the European Climate Assessment & Dataset (ECA&D)5. ECA&D was initiated by the European
Climate Support Network (ECSN6) which is a project within the Network of European Meteorolog-
ical Services (EUMETNET7).
Please note that the digitisation of the observations only can be considered as the first step towards
sensible utilisation of the observations for climate change studies. Next follows testing for homoge-
neity of the series, ensuring that any discovered trend are natural. Thus it must be stressed that the
series presented here mostly consist of the values as observed, and that no testing for homogeneity
has been performed on these daily observations. They are therefore not necessarily homogenized as
such, and the report description of each series should therefore be read carefully before applying the
data series for climate research purposes.
For the benefit of scientists that may wish to conduct such testing some metadata have been includ-
ed in the report. For supplementary metadata see also DMI Technical Report 03-24 [22].
The historical daily data sets can be downloaded from the publication part of DMI web pages.
Formålet med denne sektion er at publicere tilgængelige lange daglige dataserier 1873-2012 fra
Grønland. Det omfatter højeste og laveste temperaturer og nedbørsum. I afsnit 2.2 kan ses hvilke
stationer og parametre, det drejer sig om. Stationshistorien kan ses i afsnittet “History of stations
used in the report”. I afsnit 2.3 er de enkelte seriers sammensætning beskrevet, afsnit 2.4 omhand-
ler metadata og endelig er filformatet af de medfølgende filer beskrevet i afsnit 2.5.
1 WASA: ’The impact of storms on waves and surges: Changing climate in the past 100 years and perpectives for the
future’. See [27]. 2 EU project number ENV-4-CT97-0530: Atmospheric Circulation Classification and Regional Downscaling. [1]
3 EU project number EV5V CT93-0277: North Atlantic Climatological Dataset. See [18].
4 The Commission for Scientific Research in Greenland: ’Kommissionen for Videnskabelige Undersøgelser i Grønland’
5 Project homepage: http://eca.knmi.nl/
6 http://www.eumetnet.eu/ecsn
7 http://www.eumetnet.eu/
Technical Report 12-04
www.dmi.dk/dmi/tr12-04 page 31 of 75
2.2. Stations and parameters
2.2.1 Station Overview
Country Station Station number First year
1 GR Ilulissat 42211)
1873
2 GR Tasiilaq 43602)
1895
Table 2.2.1 Primary stations used in this report.
1) Before 1961 the observations were taken from 34216 Jacobshavn, see tables in chapter 2.3.
2) Before 1958 the observations were taken from 34360 Angmagssalik, see tables in chapter 2.3.
The stations have been relocated several times since the start, new station numbers and names have
been attached, new instruments and new observers have been introduced. The latter have obviously
been replaced many times. See the station history in the chapter “History of stations used in the
report”.
2.2.2 Data Dictionary
Abbr. Element Method Unit
Tx Highest temperature max 0,1°C
tn Lowest temperature min 0,1°C
p Accumulated precipitation sum 0,1 mm
Table 2.2.2. Elements used in this report. ‘Method’ specifies whether the element is a sum or an
extreme. The units of the daily values in the data files are specified in ‘Unit’.
2.3. Description of the daily data series
2.3.1 Accumulated precipitation
Two Greenlandic sites have long digitised daily series of accumulated precipitation and low-
est/highest temperatures. The tables 2.3.1 to 2.3.3 present an overview of the station data series
(identified by the station name and number) making up the long series. Overlap periods have been
included when available. For station co-ordinates confer with the station position file in the data
files included.
Site and period Station Start End
Ilulissat, 34216 Ilulissat (Jacobshavn) 1 July 1873 31 December 1960
1873-1991 4216 Ilulissat 2 January 1961 12 October 1991
Tasiilaq 34360 Tasiilaq (Angmagssalik) 1 October 1897 30 September 1959
1897-2012 4360 Tasiilaq 1 January 1958 31 December 2012
Table 2.3.1. Greenlandic series of daily accumulated precipitation.
Technical Report 12-04
www.dmi.dk/dmi/tr12-04 page 32 of 75
2.3.2 Lowest temperature
Site and period Station Start End
Ilulissat, 34216 Ilulissat (Jacobshavn) 1 July 1873 31 December 1960
1873-2012 4216 Ilulissat 1 January 1961 31 August 1992
4221 Ilulissat Mittarfik 16 August 1991 31 December 2012
Tasiilaq 34360 Tasiilaq (Angmagsalik) 15 October 1894 30 September 1959
1894-2012 4360 Tasiilaq 1 January 1958 31 December 2012
Table 2.3.2. Greenlandic series of daily lowest temperature.
2.3.3 Highest temperature
Site and period Station Start End
Ilulissat, 34216 Ilulissat (Jacobshavn) 1 January 1877 31 December 1960
1877-2012 4216 Ilulissat 2 January 1961 1 September 1992
4221 Ilulissat Mittarfik 16 August 1991 31 December 2012
Tasiilaq 34360 Tasiilaq (Angmagssalik) 1 October 1897 30 September 1959
1897-2012 4360 Tasiilaq 1 January 1958 31 December 2012
Table 2.3.3. Greenlandic series of daily highest temperature.
2.4. Metadata
Changes in station position, measuring procedures or observer may all significantly bias a time
series of observations. For that reason metadata (“data on data”) are important.
All available information on station positions regarding the data published in this chapter is includ-
ed in a data file attached to this publication, please see please see the chapter “History of stations”
and chapter 2.5.4.
In Appendix additionally metadata can be found. In Appendix 2.1 dates for the introduction of the
Hellmann rain gauge and for the introduction of Stevenson screens (thermometer screen) are listed
if available.
Finally a compiled set of various metadata, covering aspects such as station position and relocations,
change of instrumentation and observation units etc., that is essential to know when homogenizing
time series of climate data can be found in DMI Technical Report 03-24 [22]. This publication
contains information concerning a major part of the stations included in this report.
Technical Report 12-04
www.dmi.dk/dmi/tr12-04 page 33 of 75
2.5. File formats; Daily data files
The daily files included in this report contain daily DMI data series 1873 - 2012 comprising differ-
ent parameters for selected meteorological stations in Greenland.
The file names are determined as follows:
gr_daily_<element abbr><station number>_<period>
More specifically following fixed format text files in this report:
4 fixed ASCII format data files named gr_daily_p<station number_period>.dat
5 fixed ASCII format data files named gr_daily_tn<station number_period >.dat
5 fixed ASCII format data files named gr_daily_tx<station number_period >.dat
Formats and units can be seen in the sections 2.5.1 to section 2.5.3.
Data are only to be used with proper reference to the accompanying report: Cappelen, J. (ed), 2013:
Greenland - DMI Historical Climate Data Collection 1873-2012 – with Danish Abstracts. DMI
Technical Report 13-04. Copenhagen.
2.5.1 Daily accumulated precipitation files
p<station number_period>.dat
gr_daily_p<station number_<period>.dat
The observation files contain daily accumulated precipitation. There are no missing dates between
the start and the end date. Any missing observations are filled in by -9999.
gr_daily_p4216_1961_1991.dat
gr_daily_p4360_1958_2012.dat
gr_daily_p34216_1873_1960.dat
gr_daily_p34360_1897_1959.dat
Format and units of all precipitation observation files:
Position Format Description
1-5 F5.0 Station number
6-9 F4.0 Year
10-11 F2.0 Month
12-13 F2.0 Day
14-15 F2.0 Hour (Local time or UTC (since 2001 (4216 and 4360, whole period))
16-20 F5.0 Accumalated precipitation previous 24 hours (0.1 mm)
-1 means more than 0 mm, but less than 0.1 mm, -2 means accumulation for
several days up to the day where precipitation differs from 0, -9999 means
missing value. Please note: For station 34216 and station 34360 the ‘daily
precipitation’ may in some cases be the precipitation accumulated for several
days.
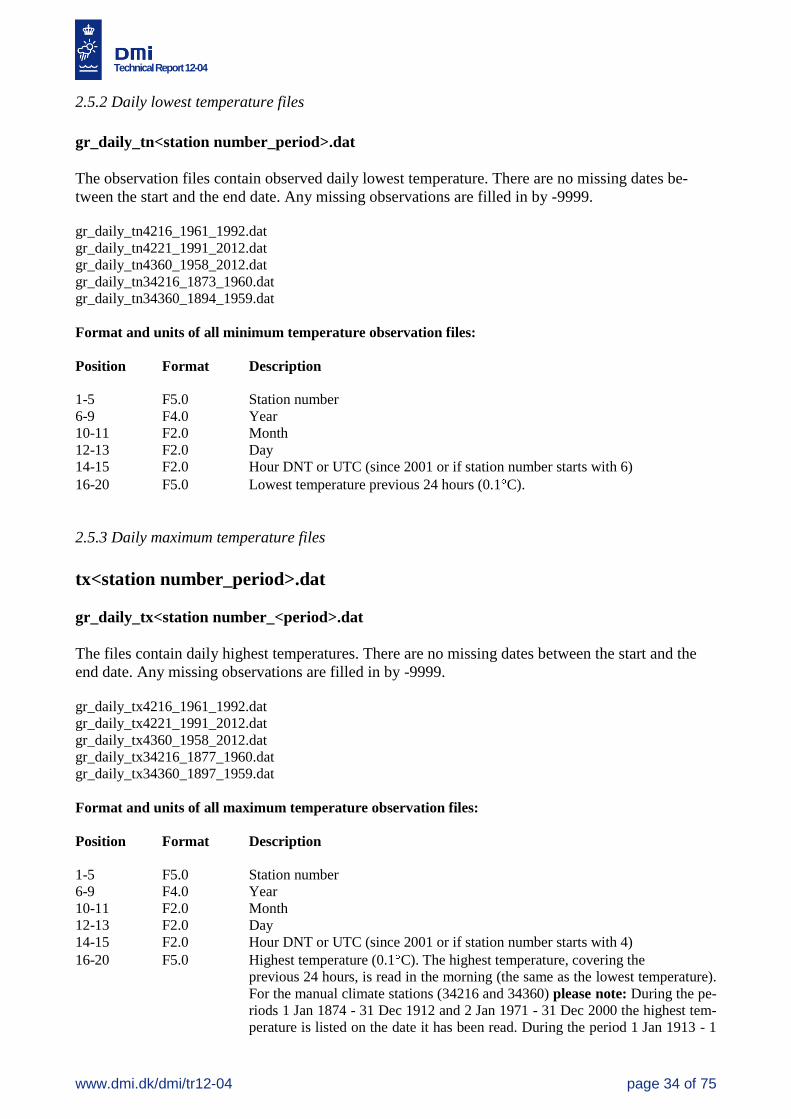
Technical Report 12-04
www.dmi.dk/dmi/tr12-04 page 34 of 75
2.5.2 Daily lowest temperature files
gr_daily_tn<station number_period>.dat
The observation files contain observed daily lowest temperature. There are no missing dates be-
tween the start and the end date. Any missing observations are filled in by -9999.
gr_daily_tn4216_1961_1992.dat
gr_daily_tn4221_1991_2012.dat
gr_daily_tn4360_1958_2012.dat
gr_daily_tn34216_1873_1960.dat
gr_daily_tn34360_1894_1959.dat
Format and units of all minimum temperature observation files:
Position Format Description
1-5 F5.0 Station number
6-9 F4.0 Year
10-11 F2.0 Month
12-13 F2.0 Day
14-15 F2.0 Hour DNT or UTC (since 2001 or if station number starts with 6)
16-20 F5.0 Lowest temperature previous 24 hours (0.1 C).
2.5.3 Daily maximum temperature files
tx<station number_period>.dat
gr_daily_tx<station number_<period>.dat
The files contain daily highest temperatures. There are no missing dates between the start and the
end date. Any missing observations are filled in by -9999.
gr_daily_tx4216_1961_1992.dat
gr_daily_tx4221_1991_2012.dat
gr_daily_tx4360_1958_2012.dat
gr_daily_tx34216_1877_1960.dat
gr_daily_tx34360_1897_1959.dat
Format and units of all maximum temperature observation files:
Position Format Description
1-5 F5.0 Station number
6-9 F4.0 Year
10-11 F2.0 Month
12-13 F2.0 Day
14-15 F2.0 Hour DNT or UTC (since 2001 or if station number starts with 4)
16-20 F5.0 Highest temperature (0.1 C). The highest temperature, covering the
previous 24 hours, is read in the morning (the same as the lowest temperature).
For the manual climate stations (34216 and 34360) please note: During the pe-
riods 1 Jan 1874 - 31 Dec 1912 and 2 Jan 1971 - 31 Dec 2000 the highest tem-
perature is listed on the date it has been read. During the period 1 Jan 1913 - 1

Technical Report 12-04
www.dmi.dk/dmi/tr12-04 page 35 of 75
Jan 1971 the highest temperature is listed on the previous day (where it most
often occurs). This change in practice was only regarding the highest tempera-
ture, not the lowest temperature. The result is repeated here in the data files as
listed above. Because of the change back and forth in practise the data files
(and DMI annals) hold no highest temperature for the 24-hours period starting
in the morning 31 Dec 1912 and ending in the morning 1 Jan 1913. And con-
versely the highest temperature of the 24-hours that starts in the morning 1 Jan
1971 and ends in the morning 2 Jan 1971 is listed TWO times in the data files:
With time stamp 1 Jan 1971 at 8 hours AND with time stamp 2 Jan 1971 at 8
hours, just as the change of practice dictates for those dates.
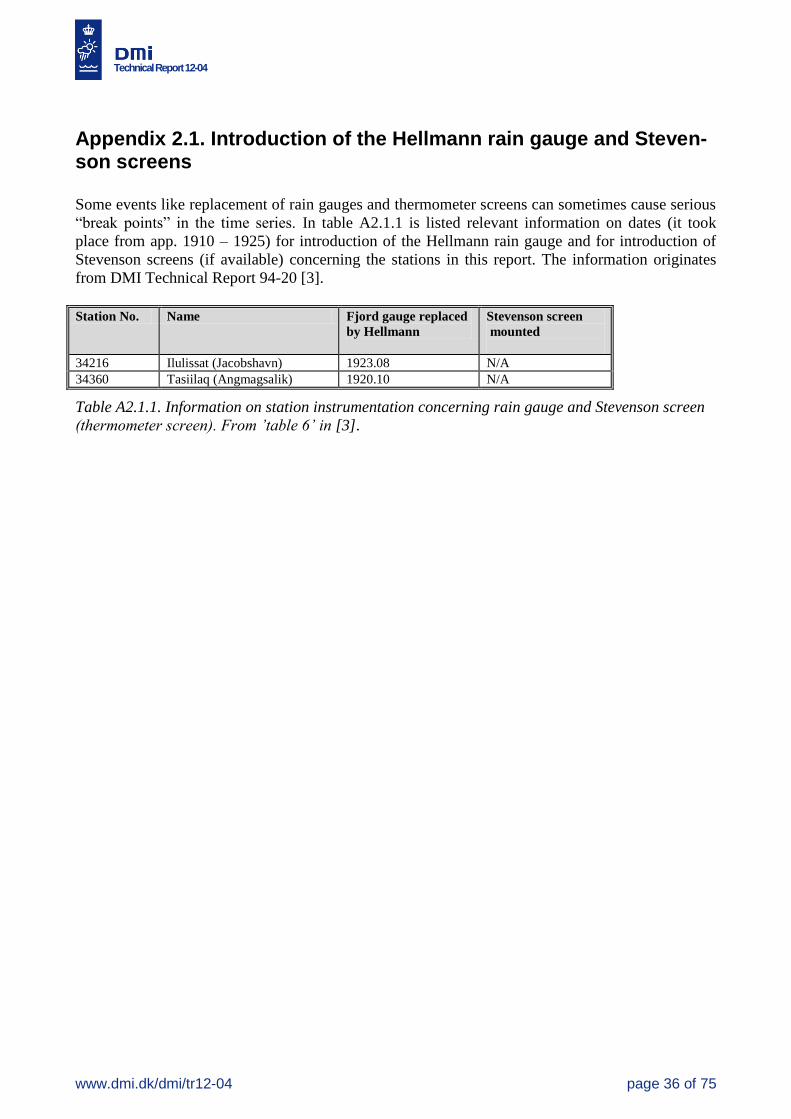
Technical Report 12-04
www.dmi.dk/dmi/tr12-04 page 36 of 75
Appendix 2.1. Introduction of the Hellmann rain gauge and Steven-son screens
Some events like replacement of rain gauges and thermometer screens can sometimes cause serious
“break points” in the time series. In table A2.1.1 is listed relevant information on dates (it took
place from app. 1910 – 1925) for introduction of the Hellmann rain gauge and for introduction of
Stevenson screens (if available) concerning the stations in this report. The information originates
from DMI Technical Report 94-20 [3].
Station No. Name Fjord gauge replaced
by Hellmann
Stevenson screen
mounted
34216 Ilulissat (Jacobshavn) 1923.08 N/A
34360 Tasiilaq (Angmagsalik) 1920.10 N/A
Table A2.1.1. Information on station instrumentation concerning rain gauge and Stevenson screen
(thermometer screen). From ’table 6’ in [3].
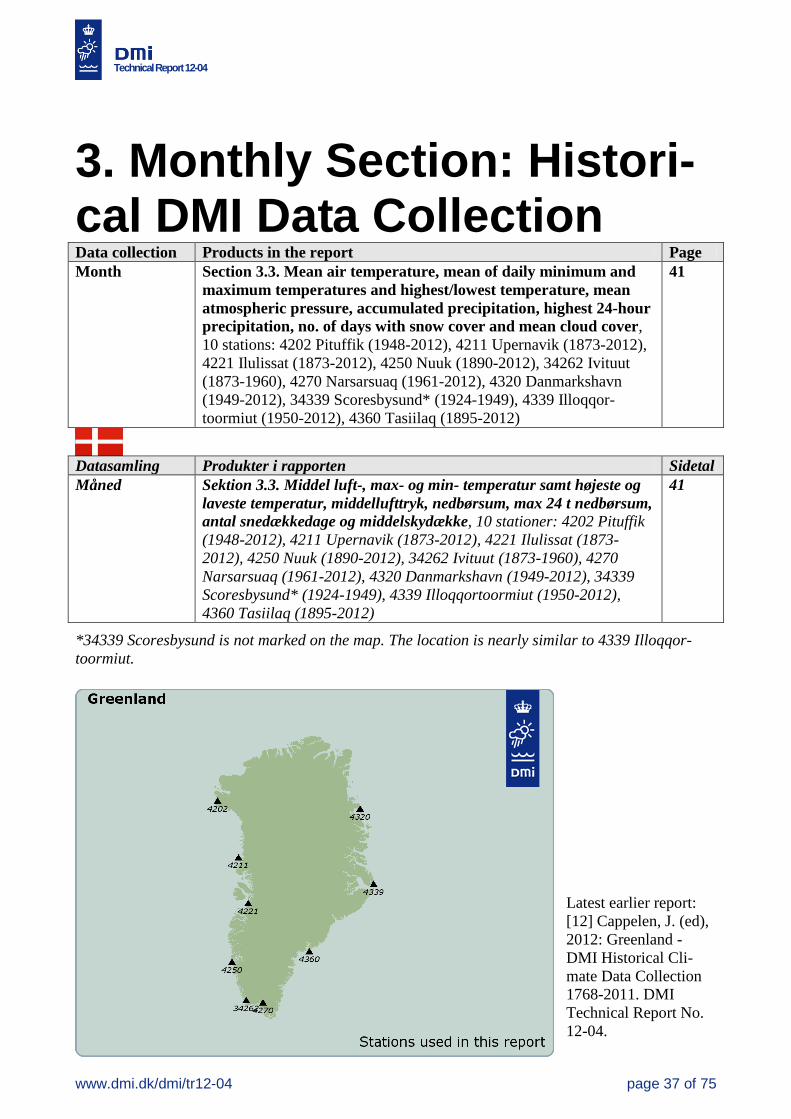
Technical Report 12-04
www.dmi.dk/dmi/tr12-04 page 37 of 75
3. Monthly Section: Histori-cal DMI Data Collection Data collection Products in the report Page
Month Section 3.3. Mean air temperature, mean of daily minimum and
maximum temperatures and highest/lowest temperature, mean
atmospheric pressure, accumulated precipitation, highest 24-hour
precipitation, no. of days with snow cover and mean cloud cover,
10 stations: 4202 Pituffik (1948-2012), 4211 Upernavik (1873-2012),
4221 Ilulissat (1873-2012), 4250 Nuuk (1890-2012), 34262 Ivituut
(1873-1960), 4270 Narsarsuaq (1961-2012), 4320 Danmarkshavn
(1949-2012), 34339 Scoresbysund* (1924-1949), 4339 Illoqqor-
toormiut (1950-2012), 4360 Tasiilaq (1895-2012)
41
Datasamling Produkter i rapporten Sidetal
Måned Sektion 3.3. Middel luft-, max- og min- temperatur samt højeste og
laveste temperatur, middellufttryk, nedbørsum, max 24 t nedbørsum,
antal snedækkedage og middelskydække, 10 stationer: 4202 Pituffik
(1948-2012), 4211 Upernavik (1873-2012), 4221 Ilulissat (1873-
2012), 4250 Nuuk (1890-2012), 34262 Ivituut (1873-1960), 4270
Narsarsuaq (1961-2012), 4320 Danmarkshavn (1949-2012), 34339
Scoresbysund* (1924-1949), 4339 Illoqqortoormiut (1950-2012),
4360 Tasiilaq (1895-2012)
41
*34339 Scoresbysund is not marked on the map. The location is nearly similar to 4339 Illoqqor-
toormiut.
Latest earlier report:
[12] Cappelen, J. (ed),
2012: Greenland -
DMI Historical Cli-
mate Data Collection
1768-2011. DMI
Technical Report No.
12-04.
Technical Report 12-04
www.dmi.dk/dmi/tr12-04 page 38 of 75
3.1 Introduction
The purpose of this chapter is to publish available long monthly DMI data series 1873-2012 for
Greenland. The data parameters include mean temperature, minimum temperature, maximum
temperature, atmospheric pressure, precipitation, highest 24-hour precipitation, number of days with
snow and cloud cover.
According to the intensions to update regularly, preferably every year, this particular report contains
an update (2012 data) of the “DMI Monthly Climate Data Collection” published for the first time in
that form in DMI Technical Report 03-26: DMI Monthly Climate Data Collection 1860-2002,
Denmark, The Faroe Island and Greenland. An update of: NACD, REWARD, NORDKLIM and
NARP datasets, Version 1, Copenhagen 2003 [20]. A similar collection of long DMI daily and
annual greenlandic climate data series can be found in section 2 and 4 in this report.
Some of the monthly data have over the years been published in connection with different Nordic
climate projects like NACD (North Atlantic Climatological Dataset, see [18]), REWARD (Relating
Extreme Weather to Atmospheric circulation using a Regionalised Dataset, see [17]), NORDKLIM
(Nordic Co-operation within Climate activities, see NORDKLIM project homepage:
http://www.smhi.se/hfa_coord/nordklim/ ) and NARP (Nordic Arctic Research Programme).
The original DMI Monthly Climate Data Collection published in DMI Technical Report 03-26 [20])
was for that reason, besides a publication of a collection of recommended DMI long monthly data
series 1860-2002, also an revision/update of the NACD, REWARD, NORDKLIM and NARP
datasets with a clarification on what has been done with the data previously. The method used in
this clarification was based on 3 different datasets:
1) Recommended - a collection of DMI recommended well-documented data series.
2) Observed - based strictly on raw observations, which have to fulfil certain criteria in terms
of frequency etc., in order for arithmetic means, maximums, minimums etc. to be calculated
depending on the parameter. These dataset acts as a baseline, since many of the time-series
previously published represent adjusted data, which are not very well documented.
3) Previous - represents the time-series generated earlier primarily in connection with NACD
and REWARD. These time-series are quite complete for the period 1890 – 1995 and many
holes have been filled compared to the observed dataset.
The revision/update of those datasets is considered done with the DMI Technical Report 03-26 [20].
Therefore only already published recommended DMI monthly data series with relevant
updates/corrections have been included since and will be included in this and the coming
reports comprising DMI Monthly Data Collections.
The monthly data sets can be downloaded from the publication part of DMI web pages.
Technical Report 12-04
www.dmi.dk/dmi/tr12-04 page 39 of 75
Special remarks:
In the following chapters the reference “NARP1” refers to the “NARP dataset version 1”, see [20].
The time series referred to in this report have been constructed by a number of persons.
Their names and initials/abbreviations are: Poul Frich (PF), John Cappelen (JC), Ellen Vaarby
Laursen (EVL), Rikke Sjølin Thomsen (RST), Bent Vraae Jørgensen (BVJ) and Lotte Sligting
Stannius (LSS).
Time series are referred to by their creator (abbreviations seen above) and the number they have
in the internal DMI time series classification.
Therefore, time series “, JC-TS1474” means a time series created by John Cappelen with number
1474 in the time series classification.
“Monthly_db” refers to an internal DMI monthly database with monthly values of various weather
parameters.
In this report months are referred to by year/month number (ex. 2000/03 = March 2000) and the
minimum criteria used here for calculating a valid monthly value is that measurements from more
than 21 days are present in that month, so the number of daily values are ranging 22-31.
During some of the former data projects (i.e. NACD) the data have been homogenised based on
tests against neighbouring stations.
The updated series presented in this report have been tested and corrected carefully, mainly based
on visual tests. Otherwise it is indicated if care should be taken when using the series.
Special care should be taken concerning most of the series with mean cloud cover. There are still
problems to be solved in the data sets mainly due to the difficult character of the observation (visu-
al) and the shift to automatic detection with a ceilometer starting approximately in the beginning of
the new millennium. Care should also be taken in the case of series with number of days with snow
cover, another visual parameter.
Formålet med denne sektion er at publicere tilgængelige lange anbefalede månedlige DMI datase-
rier 1873-2012 fra Grønland. Det omfatter middeltemperatur, minimumtemperatur, maksimumtem-
peratur, atmosfærisk tryk, nedbørsum, maksimal 24t nedbørsum, antallet af dage med sne og
skydække. I afsnit 3.2 kan ses hvilke stationer og parametre, det drejer sig. Stationshistorien kan ses
i afsnittet “History of stations used in the report”. I afsnit 3.3 er de enkelte seriers sammensætning
beskrevet og endelig er filformatet af de medfølgende filer beskrevet i afsnit 3.4.
Technical Report 12-04
www.dmi.dk/dmi/tr12-04 page 40 of 75
3.2. Stations and parameters
3.2.1 Station Overview
Country Station Station number First year
1 GR Pituffik 42021)
1948
2 GR Upernavik 42112)
1873
3 GR Ilulissat 42213)
1873
4 GR Nuuk 42504)
1873
5 GR Ivittuut 34262 1873
6 GR Narsarsuaq 4270 1961
7 GR Danmarkshavn 4320 1949
8 GR Scoresbysund 34339 1924
7 GR Illoqqortoormiut 43395)
1949
8 GR Tasiilaq 43606)
1895
Table 3.2.1 Primary stations used in this report.
1) The series are a combination of 4202 Pituffik and before that 4200 Dundas. From Nov 2006 the monthly data are obtained from Thule AB, personal communication.
2) The series are a combination of 4211 Upernavik, 4210 Upernavik, 4209 Upernavik AWS and before that 34210 Upernavik.
3) The series are a combination of 4221 Ilulissat, 4216 Ilulissat and before that 34216 Jacobshavn. New monthly values in the period 1936-1948 have been applied in
connection with the 2010 update, see details in Appendix 3.3. The corrections are not applied in earlier reports.
4) The series are a combination of 4250 Nuuk and before that 34250 Godthåb.
5) The series are a combination of 4339 Illoqqortoormiut, 4340 Kap Tobin and before that 34340 Kap Tobin.
6) The series are a combination of 4360 Tasiilaq and before that 34360 Angmagssalik.
3.2.2 Data Dictionary
Number Abbr. Element Method Unit
101 T Mean temperature Mean 0,1°C
111 Tx Mean of daily maximum temperature Mean 0,1°C
112 Th Highest temperature Max 0,1°C
121 Tn Mean of daily minimum temperature Mean 0,1°C
122 Tl Lowest temperature Min 0,1°C
401 P Mean atmospheric pressure Mean 0,1 hPa
601 R Accumulated precipitation Sum 0,1 mm
602 Rx Highest 24-hour precipitation Max 0,1 mm
701 DSC No. of days with snow cover (> 50 % covered) Sum days
801 N Mean cloud cover Mean %
Table 3.2.2. Elements used in this report. ‘Method’ specifies whether the element is a sum, a mean
or an extreme. The units of the monthly values in the data files are specified in ‘Unit’. The DMI
system of element numbers contains more than the shown elements. At the moment (2012) there are
about 250 entries.
Technical Report 12-04
www.dmi.dk/dmi/tr12-04 page 41 of 75
3.3. Description of monthly data series
3.3.1. Pittufik (PITU) - 4202
Element No. 101 (Mean Temperature)
Dataset Period Content Total
months
Missing
months
Recommended 1948 – 2012 PF-TS1+JC-TS1423+Monthly-db PITU4202+pers. comm. 780 0
Details:
Created using PF-TS1: 1948-1996, JC-TS1423: 1997-1999, monthly-db PITU 4202: 2000-2006/10 and personal
communication /Thule AB) 2006/11-2012. From 2000-2006/10 data occasionally have been changed due to personal
communication (Thule AB) and too many missing observations.
Technical Report 12-04
www.dmi.dk/dmi/tr12-04 page 42 of 75
3.3.2. Upernavik (UPER) - 4211
Element No. 101 (Mean Temperature)
Dataset Period Content Total
months
Missing
months
Recommended 1873 – 2012 NARP1 + LSS-TS1425 + Monthly-db UPER
4210/4209/4211 1680 0
Details:
Created using NARP1: 1873-1957, LSS-TS1425: 1958-1999, monthly-db UPER 4210/4209: 2000-2001 and monthly-db
UPER 4211: 2002-2012. Missing months were filled using multiple regressions with 4216 Ilulissat (ILUL) and 4202
Pituffik (PITU), one regression for each month January-December, see Appendix 3.1. Months with inserted values:
1977/08, 1982/01-12, 1983/01-07, 1983/09-11, 1984/01+02+04+05+06+07, 1986/02-10, 1988/09+10+11+12, 1989/01,
1990/10+11, 1991/08. For one month 1982/03, 4202 Pituffik (PITU) was not available so the regression was done with
4216 Ilulissat (ILUL) alone (UPER = 0.843 * ILUL – 70.3 = -204, r2=0.876).
Element No. 111 (Mean of Daily Maximum Temperature)
Dataset Period Content Total
months
Missing
months
Recommended 1890 – 2012 NARP1+ LSS-TS1451 + Monthly-db UPER
4210/4209/4211 1476 244
Details:
Created using NARP1: 1890-1957, LSS-TS1451: 1958-1999, monthly-db UPER 4210/4209: 2000-2001 and monthly-db
UPER 4211: 2002-2012. LSS-TS1451 has missing values from 1981/07 - 1995/09, because the number of days per
month for 4209 were low in this period (15-25 pr. month). Missing months: 244 (not listed here).
Element No. 112 (Highest Temperature)
Dataset Period Content Total
months
Missing
months
Recommended 1890 – 2012 NARP1 + JC-TS1474 + Monthly-db UPER
4210/4209/4211 1476 248
Details:
Created using NARP1: 1890-1957, JC-TS1474: 1958-1999, monthly-db UPER 4210/4209: 2000-2001 and monthly-db
UPER 4211: 2002-2012. LSS-TS1474 has missing values from 1981/07 - 1995/09, because the number of days per
month for 4209 were low in this period (15-25 pr. month). Missing months: 248 (not listed here).
Element No. 121 (Mean of Daily Minimum Temperature)
Dataset Period Content Total
months
Missing
months
Recommended 1890 – 2012 NARP1 + JC-TS1495 + Monthly-db UPER
4210/4209/4211 1476 226
Details:
Created using NARP1: 1890-1957, JC-TS1495: 1958-1999, monthly-db UPER 4210/4209: 2000-2001 and monthly-db
UPER 4211: 2002-2012. LSS-TS1495 has missing values from 1981/07 - 1995/09, because the number of days per
month for 4209 were low in this period (15-25 pr. month). Missing months: 226 (not listed here).
Element No. 122 (Lowest Temperature)
Dataset Period Content Total
months
Missing
months
Recommended 1890 – 2012 NARP1 + LSS-TS1516 + Monthly-db UPER
4210/4209/4211 1476 229
Details:
Created using NARP1: 1890-1957, LSS-TS1516: 1958-1999, monthly-db UPER 4210/4209: 2000-2001 and monthly-db
UPER 4211: 2002-2012. LSS-TS1516 has missing values from 1981/07 - 1995/09, because the number of days per
month for 4209 were low in this period (15-25 pr. month). Missing months: 229 (not listed here).
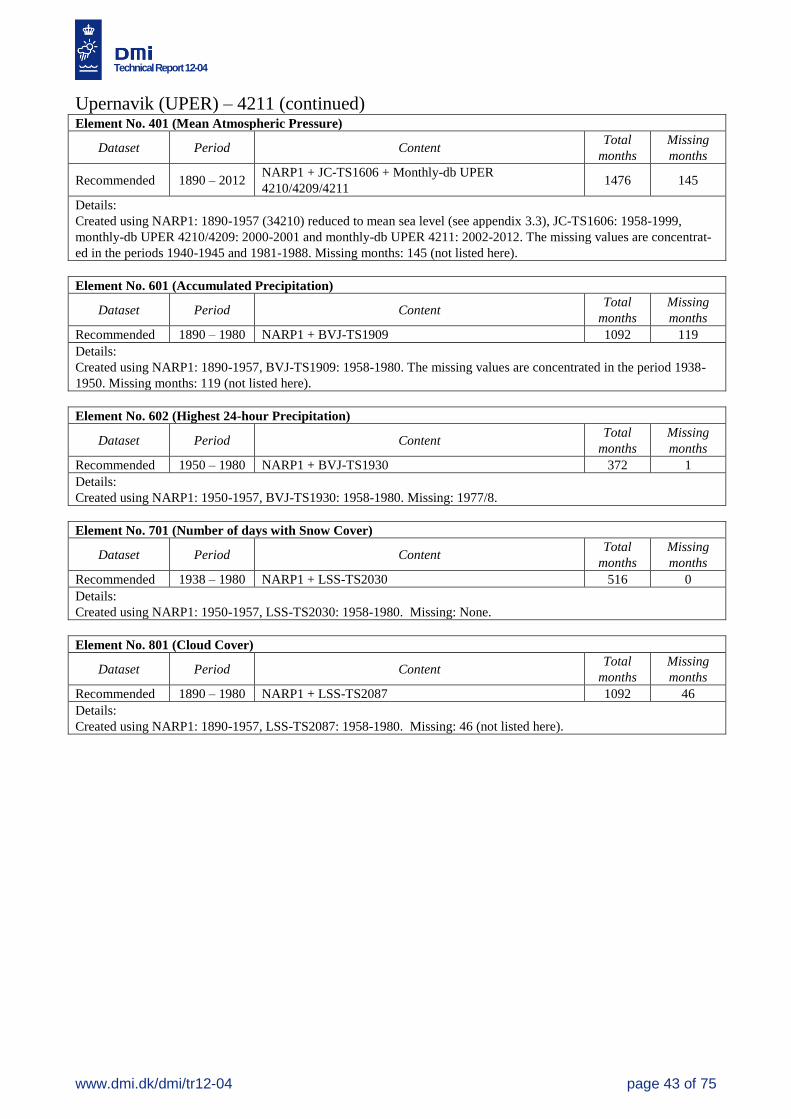
Technical Report 12-04
www.dmi.dk/dmi/tr12-04 page 43 of 75
Upernavik (UPER) – 4211 (continued) Element No. 401 (Mean Atmospheric Pressure)
Dataset Period Content Total
months
Missing
months
Recommended 1890 – 2012 NARP1 + JC-TS1606 + Monthly-db UPER
4210/4209/4211 1476 145
Details:
Created using NARP1: 1890-1957 (34210) reduced to mean sea level (see appendix 3.3), JC-TS1606: 1958-1999,
monthly-db UPER 4210/4209: 2000-2001 and monthly-db UPER 4211: 2002-2012. The missing values are concentrat-
ed in the periods 1940-1945 and 1981-1988. Missing months: 145 (not listed here).
Element No. 601 (Accumulated Precipitation)
Dataset Period Content Total
months
Missing
months
Recommended 1890 – 1980 NARP1 + BVJ-TS1909 1092 119
Details:
Created using NARP1: 1890-1957, BVJ-TS1909: 1958-1980. The missing values are concentrated in the period 1938-
1950. Missing months: 119 (not listed here).
Element No. 602 (Highest 24-hour Precipitation)
Dataset Period Content Total
months
Missing
months
Recommended 1950 – 1980 NARP1 + BVJ-TS1930 372 1
Details:
Created using NARP1: 1950-1957, BVJ-TS1930: 1958-1980. Missing: 1977/8.
Element No. 701 (Number of days with Snow Cover)
Dataset Period Content Total
months
Missing
months
Recommended 1938 – 1980 NARP1 + LSS-TS2030 516 0
Details:
Created using NARP1: 1950-1957, LSS-TS2030: 1958-1980. Missing: None.
Element No. 801 (Cloud Cover)
Dataset Period Content Total
months
Missing
months
Recommended 1890 – 1980 NARP1 + LSS-TS2087 1092 46
Details:
Created using NARP1: 1890-1957, LSS-TS2087: 1958-1980. Missing: 46 (not listed here).
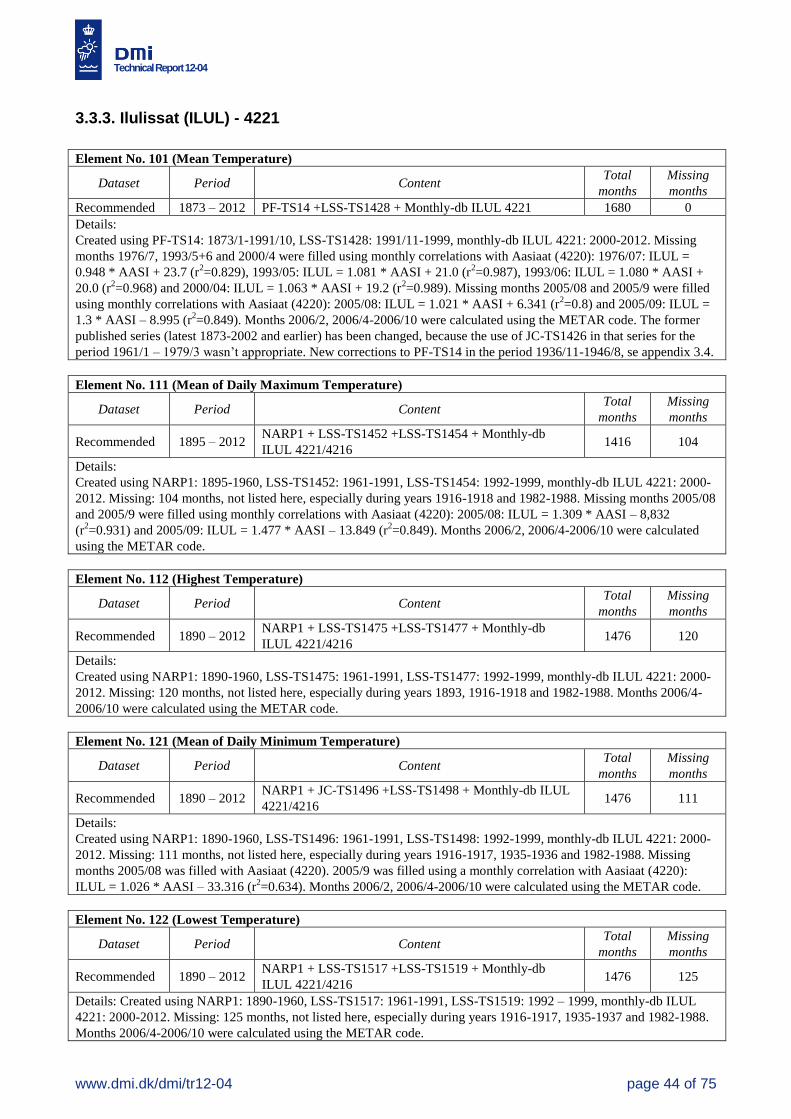
Technical Report 12-04
www.dmi.dk/dmi/tr12-04 page 44 of 75
3.3.3. Ilulissat (ILUL) - 4221
Element No. 101 (Mean Temperature)
Dataset Period Content Total
months
Missing
months
Recommended 1873 – 2012 PF-TS14 +LSS-TS1428 + Monthly-db ILUL 4221 1680 0
Details:
Created using PF-TS14: 1873/1-1991/10, LSS-TS1428: 1991/11-1999, monthly-db ILUL 4221: 2000-2012. Missing
months 1976/7, 1993/5+6 and 2000/4 were filled using monthly correlations with Aasiaat (4220): 1976/07: ILUL =
0.948 * AASI + 23.7 (r2=0.829), 1993/05: ILUL = 1.081 * AASI + 21.0 (r
2=0.987), 1993/06: ILUL = 1.080 * AASI +
20.0 (r2=0.968) and 2000/04: ILUL = 1.063 * AASI + 19.2 (r
2=0.989). Missing months 2005/08 and 2005/9 were filled
using monthly correlations with Aasiaat (4220): 2005/08: ILUL = 1.021 * AASI + 6.341 (r2=0.8) and 2005/09: ILUL =
1.3 * AASI – 8.995 (r2=0.849). Months 2006/2, 2006/4-2006/10 were calculated using the METAR code. The former
published series (latest 1873-2002 and earlier) has been changed, because the use of JC-TS1426 in that series for the
period 1961/1 – 1979/3 wasn’t appropriate. New corrections to PF-TS14 in the period 1936/11-1946/8, se appendix 3.4.
Element No. 111 (Mean of Daily Maximum Temperature)
Dataset Period Content Total
months
Missing
months
Recommended 1895 – 2012 NARP1 + LSS-TS1452 +LSS-TS1454 + Monthly-db
ILUL 4221/4216 1416 104
Details:
Created using NARP1: 1895-1960, LSS-TS1452: 1961-1991, LSS-TS1454: 1992-1999, monthly-db ILUL 4221: 2000-
2012. Missing: 104 months, not listed here, especially during years 1916-1918 and 1982-1988. Missing months 2005/08
and 2005/9 were filled using monthly correlations with Aasiaat (4220): 2005/08: ILUL = 1.309 * AASI – 8,832
(r2=0.931) and 2005/09: ILUL = 1.477 * AASI – 13.849 (r
2=0.849). Months 2006/2, 2006/4-2006/10 were calculated
using the METAR code.
Element No. 112 (Highest Temperature)
Dataset Period Content Total
months
Missing
months
Recommended 1890 – 2012 NARP1 + LSS-TS1475 +LSS-TS1477 + Monthly-db
ILUL 4221/4216 1476 120
Details:
Created using NARP1: 1890-1960, LSS-TS1475: 1961-1991, LSS-TS1477: 1992-1999, monthly-db ILUL 4221: 2000-
2012. Missing: 120 months, not listed here, especially during years 1893, 1916-1918 and 1982-1988. Months 2006/4-
2006/10 were calculated using the METAR code.
Element No. 121 (Mean of Daily Minimum Temperature)
Dataset Period Content Total
months
Missing
months
Recommended 1890 – 2012 NARP1 + JC-TS1496 +LSS-TS1498 + Monthly-db ILUL
4221/4216 1476 111
Details:
Created using NARP1: 1890-1960, LSS-TS1496: 1961-1991, LSS-TS1498: 1992-1999, monthly-db ILUL 4221: 2000-
2012. Missing: 111 months, not listed here, especially during years 1916-1917, 1935-1936 and 1982-1988. Missing
months 2005/08 was filled with Aasiaat (4220). 2005/9 was filled using a monthly correlation with Aasiaat (4220):
ILUL = 1.026 * AASI – 33.316 (r2=0.634). Months 2006/2, 2006/4-2006/10 were calculated using the METAR code.
Element No. 122 (Lowest Temperature)
Dataset Period Content Total
months
Missing
months
Recommended 1890 – 2012 NARP1 + LSS-TS1517 +LSS-TS1519 + Monthly-db
ILUL 4221/4216 1476 125
Details: Created using NARP1: 1890-1960, LSS-TS1517: 1961-1991, LSS-TS1519: 1992 – 1999, monthly-db ILUL
4221: 2000-2012. Missing: 125 months, not listed here, especially during years 1916-1917, 1935-1937 and 1982-1988.
Months 2006/4-2006/10 were calculated using the METAR code.
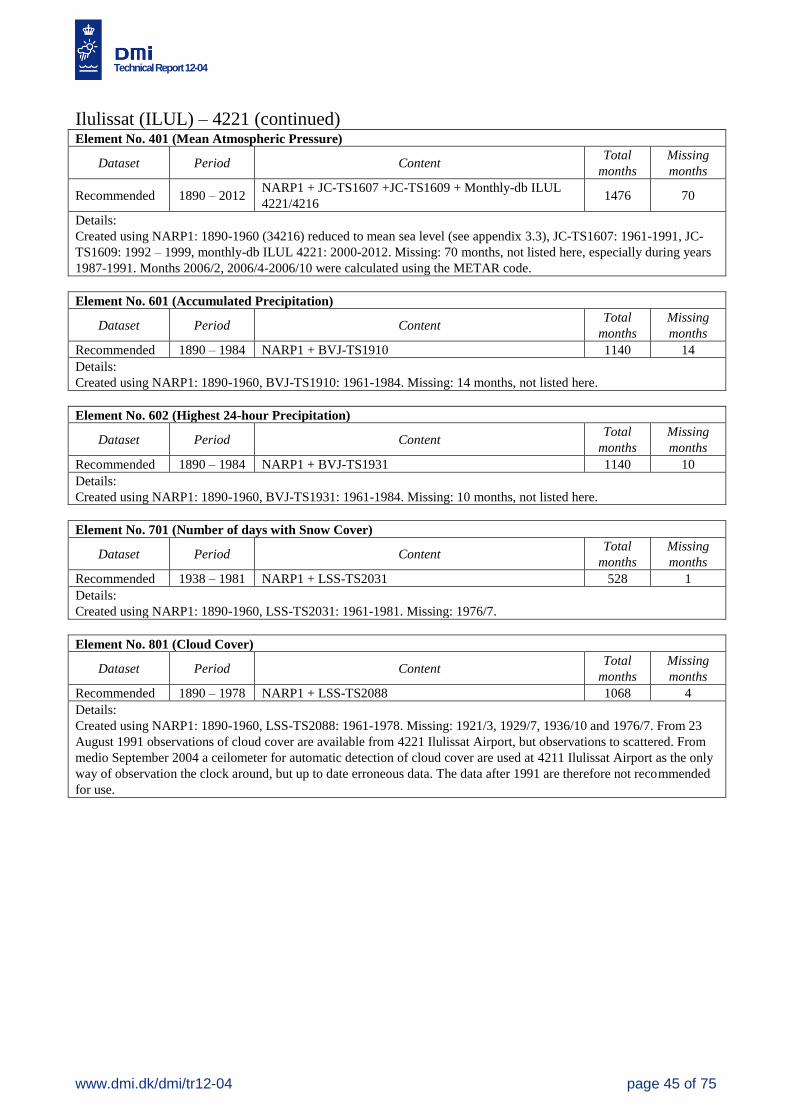
Technical Report 12-04
www.dmi.dk/dmi/tr12-04 page 45 of 75
Ilulissat (ILUL) – 4221 (continued) Element No. 401 (Mean Atmospheric Pressure)
Dataset Period Content Total
months
Missing
months
Recommended 1890 – 2012 NARP1 + JC-TS1607 +JC-TS1609 + Monthly-db ILUL
4221/4216 1476 70
Details:
Created using NARP1: 1890-1960 (34216) reduced to mean sea level (see appendix 3.3), JC-TS1607: 1961-1991, JC-
TS1609: 1992 – 1999, monthly-db ILUL 4221: 2000-2012. Missing: 70 months, not listed here, especially during years
1987-1991. Months 2006/2, 2006/4-2006/10 were calculated using the METAR code.
Element No. 601 (Accumulated Precipitation)
Dataset Period Content Total
months
Missing
months
Recommended 1890 – 1984 NARP1 + BVJ-TS1910 1140 14
Details:
Created using NARP1: 1890-1960, BVJ-TS1910: 1961-1984. Missing: 14 months, not listed here.
Element No. 602 (Highest 24-hour Precipitation)
Dataset Period Content Total
months
Missing
months
Recommended 1890 – 1984 NARP1 + BVJ-TS1931 1140 10
Details:
Created using NARP1: 1890-1960, BVJ-TS1931: 1961-1984. Missing: 10 months, not listed here.
Element No. 701 (Number of days with Snow Cover)
Dataset Period Content Total
months
Missing
months
Recommended 1938 – 1981 NARP1 + LSS-TS2031 528 1
Details:
Created using NARP1: 1890-1960, LSS-TS2031: 1961-1981. Missing: 1976/7.
Element No. 801 (Cloud Cover)
Dataset Period Content Total
months
Missing
months
Recommended 1890 – 1978 NARP1 + LSS-TS2088 1068 4
Details:
Created using NARP1: 1890-1960, LSS-TS2088: 1961-1978. Missing: 1921/3, 1929/7, 1936/10 and 1976/7. From 23
August 1991 observations of cloud cover are available from 4221 Ilulissat Airport, but observations to scattered. From
medio September 2004 a ceilometer for automatic detection of cloud cover are used at 4211 Ilulissat Airport as the only
way of observation the clock around, but up to date erroneous data. The data after 1991 are therefore not recommended
for use.
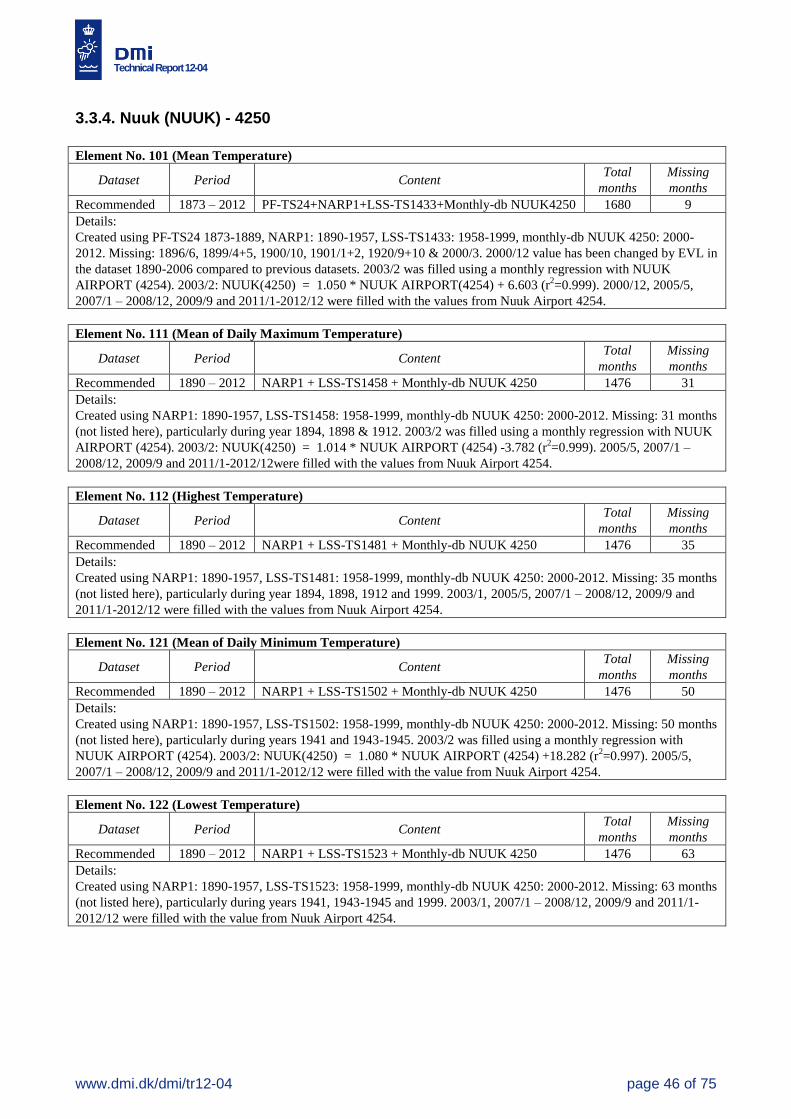
Technical Report 12-04
www.dmi.dk/dmi/tr12-04 page 46 of 75
3.3.4. Nuuk (NUUK) - 4250
Element No. 101 (Mean Temperature)
Dataset Period Content Total
months
Missing
months
Recommended 1873 – 2012 PF-TS24+NARP1+LSS-TS1433+Monthly-db NUUK4250 1680 9
Details:
Created using PF-TS24 1873-1889, NARP1: 1890-1957, LSS-TS1433: 1958-1999, monthly-db NUUK 4250: 2000-
2012. Missing: 1896/6, 1899/4+5, 1900/10, 1901/1+2, 1920/9+10 & 2000/3. 2000/12 value has been changed by EVL in
the dataset 1890-2006 compared to previous datasets. 2003/2 was filled using a monthly regression with NUUK
AIRPORT (4254). 2003/2: NUUK(4250) = 1.050 * NUUK AIRPORT(4254) + 6.603 (r2=0.999). 2000/12, 2005/5,
2007/1 – 2008/12, 2009/9 and 2011/1-2012/12 were filled with the values from Nuuk Airport 4254.
Element No. 111 (Mean of Daily Maximum Temperature)
Dataset Period Content Total
months
Missing
months
Recommended 1890 – 2012 NARP1 + LSS-TS1458 + Monthly-db NUUK 4250 1476 31
Details:
Created using NARP1: 1890-1957, LSS-TS1458: 1958-1999, monthly-db NUUK 4250: 2000-2012. Missing: 31 months
(not listed here), particularly during year 1894, 1898 & 1912. 2003/2 was filled using a monthly regression with NUUK
AIRPORT (4254). 2003/2: NUUK(4250) = 1.014 * NUUK AIRPORT (4254) -3.782 (r2=0.999). 2005/5, 2007/1 –
2008/12, 2009/9 and 2011/1-2012/12were filled with the values from Nuuk Airport 4254.
Element No. 112 (Highest Temperature)
Dataset Period Content Total
months
Missing
months
Recommended 1890 – 2012 NARP1 + LSS-TS1481 + Monthly-db NUUK 4250 1476 35
Details:
Created using NARP1: 1890-1957, LSS-TS1481: 1958-1999, monthly-db NUUK 4250: 2000-2012. Missing: 35 months
(not listed here), particularly during year 1894, 1898, 1912 and 1999. 2003/1, 2005/5, 2007/1 – 2008/12, 2009/9 and
2011/1-2012/12 were filled with the values from Nuuk Airport 4254.
Element No. 121 (Mean of Daily Minimum Temperature)
Dataset Period Content Total
months
Missing
months
Recommended 1890 – 2012 NARP1 + LSS-TS1502 + Monthly-db NUUK 4250 1476 50
Details:
Created using NARP1: 1890-1957, LSS-TS1502: 1958-1999, monthly-db NUUK 4250: 2000-2012. Missing: 50 months
(not listed here), particularly during years 1941 and 1943-1945. 2003/2 was filled using a monthly regression with
NUUK AIRPORT (4254). 2003/2: NUUK(4250) = 1.080 * NUUK AIRPORT (4254) +18.282 (r2=0.997). 2005/5,
2007/1 – 2008/12, 2009/9 and 2011/1-2012/12 were filled with the value from Nuuk Airport 4254.
Element No. 122 (Lowest Temperature)
Dataset Period Content Total
months
Missing
months
Recommended 1890 – 2012 NARP1 + LSS-TS1523 + Monthly-db NUUK 4250 1476 63
Details:
Created using NARP1: 1890-1957, LSS-TS1523: 1958-1999, monthly-db NUUK 4250: 2000-2012. Missing: 63 months
(not listed here), particularly during years 1941, 1943-1945 and 1999. 2003/1, 2007/1 – 2008/12, 2009/9 and 2011/1-
2012/12 were filled with the value from Nuuk Airport 4254.
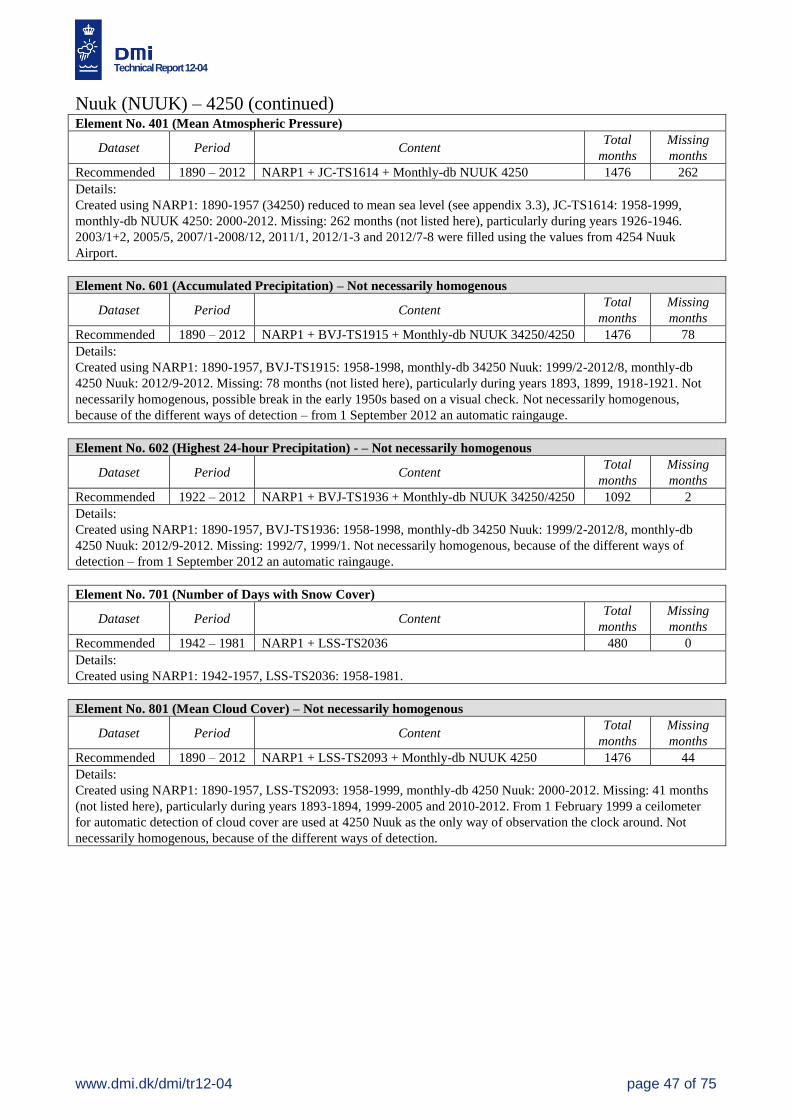
Technical Report 12-04
www.dmi.dk/dmi/tr12-04 page 47 of 75
Nuuk (NUUK) – 4250 (continued)
Element No. 401 (Mean Atmospheric Pressure)
Dataset Period Content Total
months
Missing
months
Recommended 1890 – 2012 NARP1 + JC-TS1614 + Monthly-db NUUK 4250 1476 262
Details:
Created using NARP1: 1890-1957 (34250) reduced to mean sea level (see appendix 3.3), JC-TS1614: 1958-1999,
monthly-db NUUK 4250: 2000-2012. Missing: 262 months (not listed here), particularly during years 1926-1946.
2003/1+2, 2005/5, 2007/1-2008/12, 2011/1, 2012/1-3 and 2012/7-8 were filled using the values from 4254 Nuuk
Airport.
Element No. 601 (Accumulated Precipitation) – Not necessarily homogenous
Dataset Period Content Total
months
Missing
months
Recommended 1890 – 2012 NARP1 + BVJ-TS1915 + Monthly-db NUUK 34250/4250 1476 78
Details:
Created using NARP1: 1890-1957, BVJ-TS1915: 1958-1998, monthly-db 34250 Nuuk: 1999/2-2012/8, monthly-db
4250 Nuuk: 2012/9-2012. Missing: 78 months (not listed here), particularly during years 1893, 1899, 1918-1921. Not
necessarily homogenous, possible break in the early 1950s based on a visual check. Not necessarily homogenous,
because of the different ways of detection – from 1 September 2012 an automatic raingauge.
Element No. 602 (Highest 24-hour Precipitation) - – Not necessarily homogenous
Dataset Period Content Total
months
Missing
months
Recommended 1922 – 2012 NARP1 + BVJ-TS1936 + Monthly-db NUUK 34250/4250 1092 2
Details:
Created using NARP1: 1890-1957, BVJ-TS1936: 1958-1998, monthly-db 34250 Nuuk: 1999/2-2012/8, monthly-db
4250 Nuuk: 2012/9-2012. Missing: 1992/7, 1999/1. Not necessarily homogenous, because of the different ways of
detection – from 1 September 2012 an automatic raingauge.
Element No. 701 (Number of Days with Snow Cover)
Dataset Period Content Total
months
Missing
months
Recommended 1942 – 1981 NARP1 + LSS-TS2036 480 0
Details:
Created using NARP1: 1942-1957, LSS-TS2036: 1958-1981.
Element No. 801 (Mean Cloud Cover) – Not necessarily homogenous
Dataset Period Content Total
months
Missing
months
Recommended 1890 – 2012 NARP1 + LSS-TS2093 + Monthly-db NUUK 4250 1476 44
Details:
Created using NARP1: 1890-1957, LSS-TS2093: 1958-1999, monthly-db 4250 Nuuk: 2000-2012. Missing: 41 months
(not listed here), particularly during years 1893-1894, 1999-2005 and 2010-2012. From 1 February 1999 a ceilometer
for automatic detection of cloud cover are used at 4250 Nuuk as the only way of observation the clock around. Not
necessarily homogenous, because of the different ways of detection.
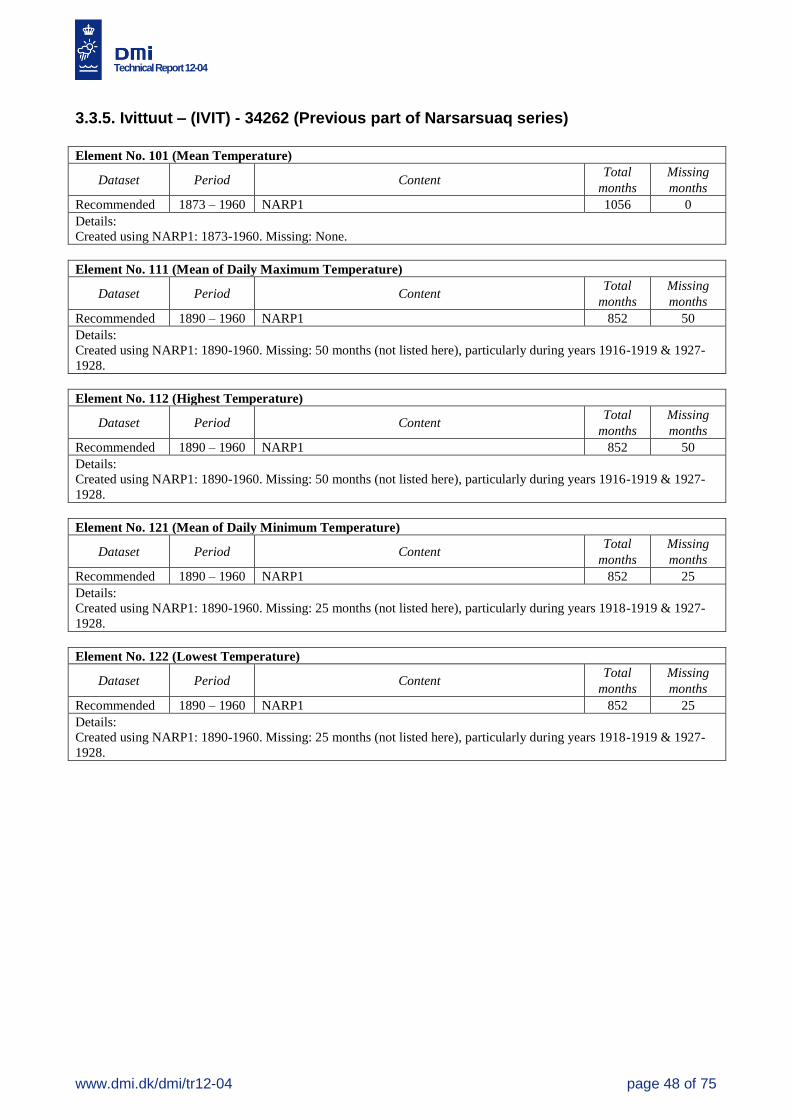
Technical Report 12-04
www.dmi.dk/dmi/tr12-04 page 48 of 75
3.3.5. Ivittuut – (IVIT) - 34262 (Previous part of Narsarsuaq series)
Element No. 101 (Mean Temperature)
Dataset Period Content Total
months
Missing
months
Recommended 1873 – 1960 NARP1 1056 0
Details:
Created using NARP1: 1873-1960. Missing: None.
Element No. 111 (Mean of Daily Maximum Temperature)
Dataset Period Content Total
months
Missing
months
Recommended 1890 – 1960 NARP1 852 50
Details:
Created using NARP1: 1890-1960. Missing: 50 months (not listed here), particularly during years 1916-1919 & 1927-
1928.
Element No. 112 (Highest Temperature)
Dataset Period Content Total
months
Missing
months
Recommended 1890 – 1960 NARP1 852 50
Details:
Created using NARP1: 1890-1960. Missing: 50 months (not listed here), particularly during years 1916-1919 & 1927-
1928.
Element No. 121 (Mean of Daily Minimum Temperature)
Dataset Period Content Total
months
Missing
months
Recommended 1890 – 1960 NARP1 852 25
Details:
Created using NARP1: 1890-1960. Missing: 25 months (not listed here), particularly during years 1918-1919 & 1927-
1928.
Element No. 122 (Lowest Temperature)
Dataset Period Content Total
months
Missing
months
Recommended 1890 – 1960 NARP1 852 25
Details:
Created using NARP1: 1890-1960. Missing: 25 months (not listed here), particularly during years 1918-1919 & 1927-
1928.
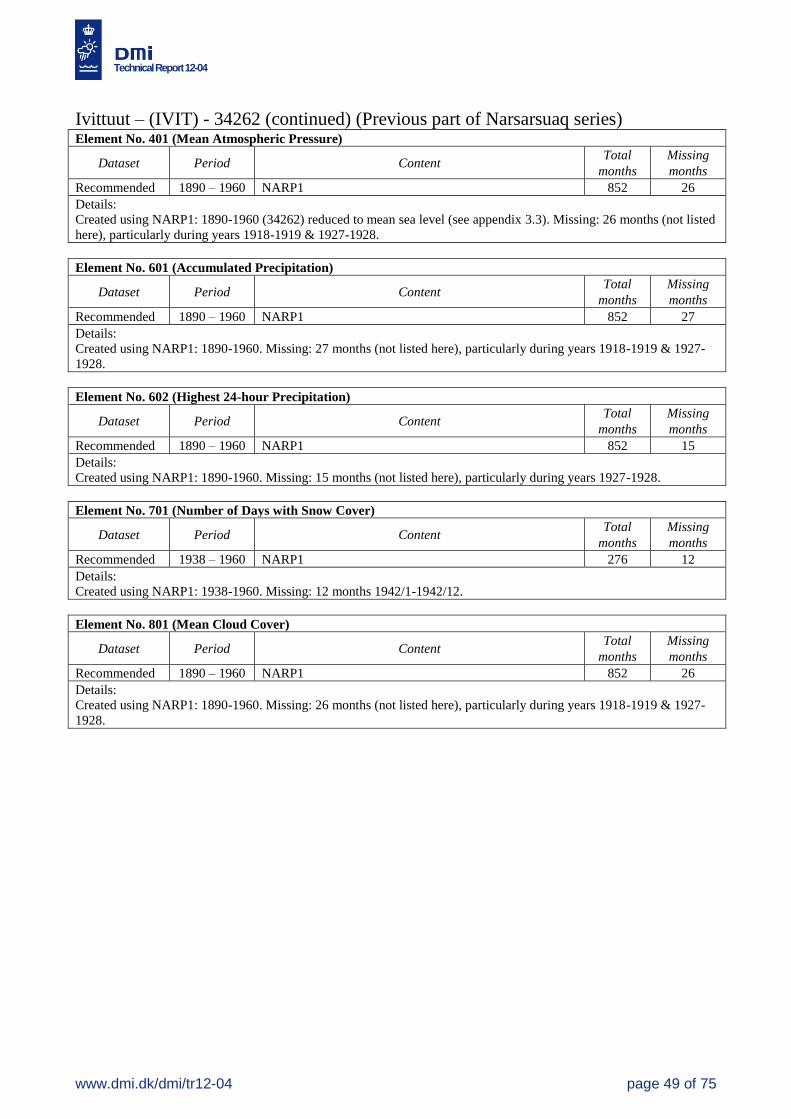
Technical Report 12-04
www.dmi.dk/dmi/tr12-04 page 49 of 75
Ivittuut – (IVIT) - 34262 (continued) (Previous part of Narsarsuaq series) Element No. 401 (Mean Atmospheric Pressure)
Dataset Period Content Total
months
Missing
months
Recommended 1890 – 1960 NARP1 852 26
Details:
Created using NARP1: 1890-1960 (34262) reduced to mean sea level (see appendix 3.3). Missing: 26 months (not listed
here), particularly during years 1918-1919 & 1927-1928.
Element No. 601 (Accumulated Precipitation)
Dataset Period Content Total
months
Missing
months
Recommended 1890 – 1960 NARP1 852 27
Details:
Created using NARP1: 1890-1960. Missing: 27 months (not listed here), particularly during years 1918-1919 & 1927-
1928.
Element No. 602 (Highest 24-hour Precipitation)
Dataset Period Content Total
months
Missing
months
Recommended 1890 – 1960 NARP1 852 15
Details:
Created using NARP1: 1890-1960. Missing: 15 months (not listed here), particularly during years 1927-1928.
Element No. 701 (Number of Days with Snow Cover)
Dataset Period Content Total
months
Missing
months
Recommended 1938 – 1960 NARP1 276 12
Details:
Created using NARP1: 1938-1960. Missing: 12 months 1942/1-1942/12.
Element No. 801 (Mean Cloud Cover)
Dataset Period Content Total
months
Missing
months
Recommended 1890 – 1960 NARP1 852 26
Details:
Created using NARP1: 1890-1960. Missing: 26 months (not listed here), particularly during years 1918-1919 & 1927-
1928.
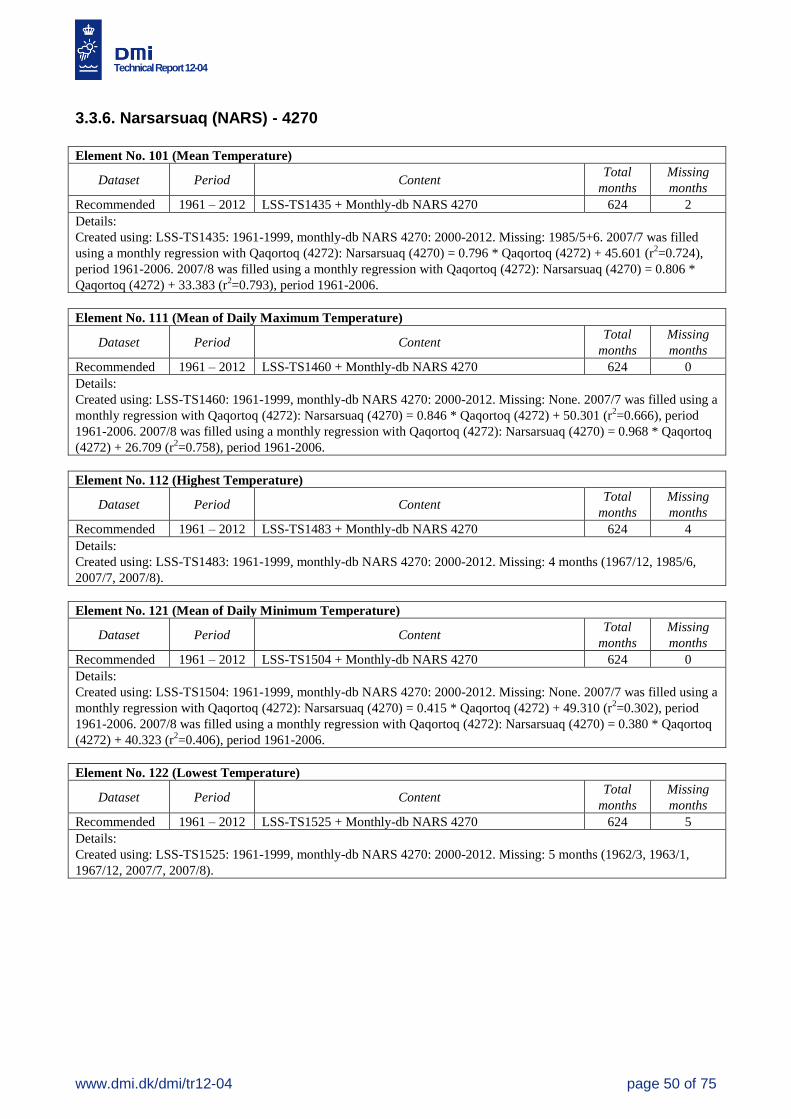
Technical Report 12-04
www.dmi.dk/dmi/tr12-04 page 50 of 75
3.3.6. Narsarsuaq (NARS) - 4270
Element No. 101 (Mean Temperature)
Dataset Period Content Total
months
Missing
months
Recommended 1961 – 2012 LSS-TS1435 + Monthly-db NARS 4270 624 2
Details:
Created using: LSS-TS1435: 1961-1999, monthly-db NARS 4270: 2000-2012. Missing: 1985/5+6. 2007/7 was filled
using a monthly regression with Qaqortoq (4272): Narsarsuaq (4270) = 0.796 * Qaqortoq (4272) + 45.601 (r2=0.724),
period 1961-2006. 2007/8 was filled using a monthly regression with Qaqortoq (4272): Narsarsuaq (4270) = 0.806 *
Qaqortoq (4272) + 33.383 (r2=0.793), period 1961-2006.
Element No. 111 (Mean of Daily Maximum Temperature)
Dataset Period Content Total
months
Missing
months
Recommended 1961 – 2012 LSS-TS1460 + Monthly-db NARS 4270 624 0
Details:
Created using: LSS-TS1460: 1961-1999, monthly-db NARS 4270: 2000-2012. Missing: None. 2007/7 was filled using a
monthly regression with Qaqortoq (4272): Narsarsuaq (4270) = 0.846 * Qaqortoq (4272) + 50.301 (r2=0.666), period
1961-2006. 2007/8 was filled using a monthly regression with Qaqortoq (4272): Narsarsuaq (4270) = 0.968 * Qaqortoq
(4272) + 26.709 (r2=0.758), period 1961-2006.
Element No. 112 (Highest Temperature)
Dataset Period Content Total
months
Missing
months
Recommended 1961 – 2012 LSS-TS1483 + Monthly-db NARS 4270 624 4
Details:
Created using: LSS-TS1483: 1961-1999, monthly-db NARS 4270: 2000-2012. Missing: 4 months (1967/12, 1985/6,
2007/7, 2007/8).
Element No. 121 (Mean of Daily Minimum Temperature)
Dataset Period Content Total
months
Missing
months
Recommended 1961 – 2012 LSS-TS1504 + Monthly-db NARS 4270 624 0
Details:
Created using: LSS-TS1504: 1961-1999, monthly-db NARS 4270: 2000-2012. Missing: None. 2007/7 was filled using a
monthly regression with Qaqortoq (4272): Narsarsuaq (4270) = 0.415 * Qaqortoq (4272) + 49.310 (r2=0.302), period
1961-2006. 2007/8 was filled using a monthly regression with Qaqortoq (4272): Narsarsuaq (4270) = 0.380 * Qaqortoq
(4272) + 40.323 (r2=0.406), period 1961-2006.
Element No. 122 (Lowest Temperature)
Dataset Period Content Total
months
Missing
months
Recommended 1961 – 2012 LSS-TS1525 + Monthly-db NARS 4270 624 5
Details:
Created using: LSS-TS1525: 1961-1999, monthly-db NARS 4270: 2000-2012. Missing: 5 months (1962/3, 1963/1,
1967/12, 2007/7, 2007/8).
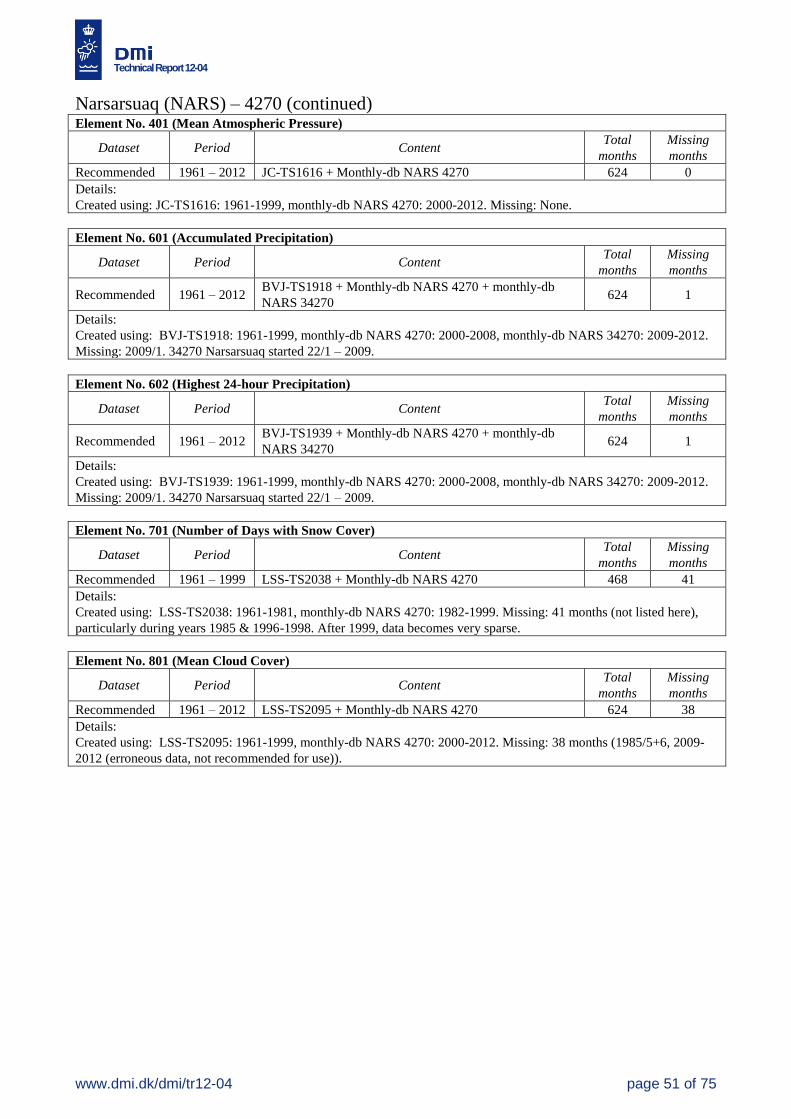
Technical Report 12-04
www.dmi.dk/dmi/tr12-04 page 51 of 75
Narsarsuaq (NARS) – 4270 (continued) Element No. 401 (Mean Atmospheric Pressure)
Dataset Period Content Total
months
Missing
months
Recommended 1961 – 2012 JC-TS1616 + Monthly-db NARS 4270 624 0
Details:
Created using: JC-TS1616: 1961-1999, monthly-db NARS 4270: 2000-2012. Missing: None.
Element No. 601 (Accumulated Precipitation)
Dataset Period Content Total
months
Missing
months
Recommended 1961 – 2012 BVJ-TS1918 + Monthly-db NARS 4270 + monthly-db
NARS 34270 624 1
Details:
Created using: BVJ-TS1918: 1961-1999, monthly-db NARS 4270: 2000-2008, monthly-db NARS 34270: 2009-2012.
Missing: 2009/1. 34270 Narsarsuaq started 22/1 – 2009.
Element No. 602 (Highest 24-hour Precipitation)
Dataset Period Content Total
months
Missing
months
Recommended 1961 – 2012 BVJ-TS1939 + Monthly-db NARS 4270 + monthly-db
NARS 34270 624 1
Details:
Created using: BVJ-TS1939: 1961-1999, monthly-db NARS 4270: 2000-2008, monthly-db NARS 34270: 2009-2012.
Missing: 2009/1. 34270 Narsarsuaq started 22/1 – 2009.
Element No. 701 (Number of Days with Snow Cover)
Dataset Period Content Total
months
Missing
months
Recommended 1961 – 1999 LSS-TS2038 + Monthly-db NARS 4270 468 41
Details:
Created using: LSS-TS2038: 1961-1981, monthly-db NARS 4270: 1982-1999. Missing: 41 months (not listed here),
particularly during years 1985 & 1996-1998. After 1999, data becomes very sparse.
Element No. 801 (Mean Cloud Cover)
Dataset Period Content Total
months
Missing
months
Recommended 1961 – 2012 LSS-TS2095 + Monthly-db NARS 4270 624 38
Details:
Created using: LSS-TS2095: 1961-1999, monthly-db NARS 4270: 2000-2012. Missing: 38 months (1985/5+6, 2009-
2012 (erroneous data, not recommended for use)).
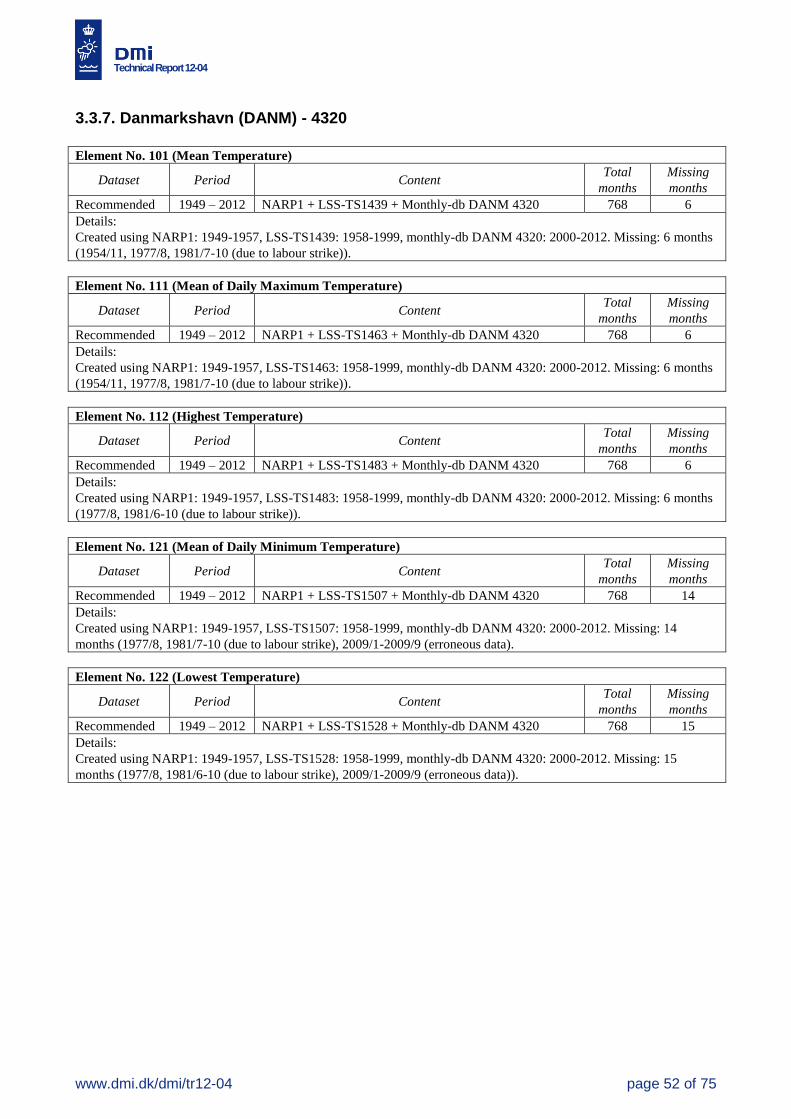
Technical Report 12-04
www.dmi.dk/dmi/tr12-04 page 52 of 75
3.3.7. Danmarkshavn (DANM) - 4320
Element No. 101 (Mean Temperature)
Dataset Period Content Total
months
Missing
months
Recommended 1949 – 2012 NARP1 + LSS-TS1439 + Monthly-db DANM 4320 768 6
Details:
Created using NARP1: 1949-1957, LSS-TS1439: 1958-1999, monthly-db DANM 4320: 2000-2012. Missing: 6 months
(1954/11, 1977/8, 1981/7-10 (due to labour strike)).
Element No. 111 (Mean of Daily Maximum Temperature)
Dataset Period Content Total
months
Missing
months
Recommended 1949 – 2012 NARP1 + LSS-TS1463 + Monthly-db DANM 4320 768 6
Details:
Created using NARP1: 1949-1957, LSS-TS1463: 1958-1999, monthly-db DANM 4320: 2000-2012. Missing: 6 months
(1954/11, 1977/8, 1981/7-10 (due to labour strike)).
Element No. 112 (Highest Temperature)
Dataset Period Content Total
months
Missing
months
Recommended 1949 – 2012 NARP1 + LSS-TS1483 + Monthly-db DANM 4320 768 6
Details:
Created using NARP1: 1949-1957, LSS-TS1483: 1958-1999, monthly-db DANM 4320: 2000-2012. Missing: 6 months
(1977/8, 1981/6-10 (due to labour strike)).
Element No. 121 (Mean of Daily Minimum Temperature)
Dataset Period Content Total
months
Missing
months
Recommended 1949 – 2012 NARP1 + LSS-TS1507 + Monthly-db DANM 4320 768 14
Details:
Created using NARP1: 1949-1957, LSS-TS1507: 1958-1999, monthly-db DANM 4320: 2000-2012. Missing: 14
months (1977/8, 1981/7-10 (due to labour strike), 2009/1-2009/9 (erroneous data).
Element No. 122 (Lowest Temperature)
Dataset Period Content Total
months
Missing
months
Recommended 1949 – 2012 NARP1 + LSS-TS1528 + Monthly-db DANM 4320 768 15
Details:
Created using NARP1: 1949-1957, LSS-TS1528: 1958-1999, monthly-db DANM 4320: 2000-2012. Missing: 15
months (1977/8, 1981/6-10 (due to labour strike), 2009/1-2009/9 (erroneous data)).
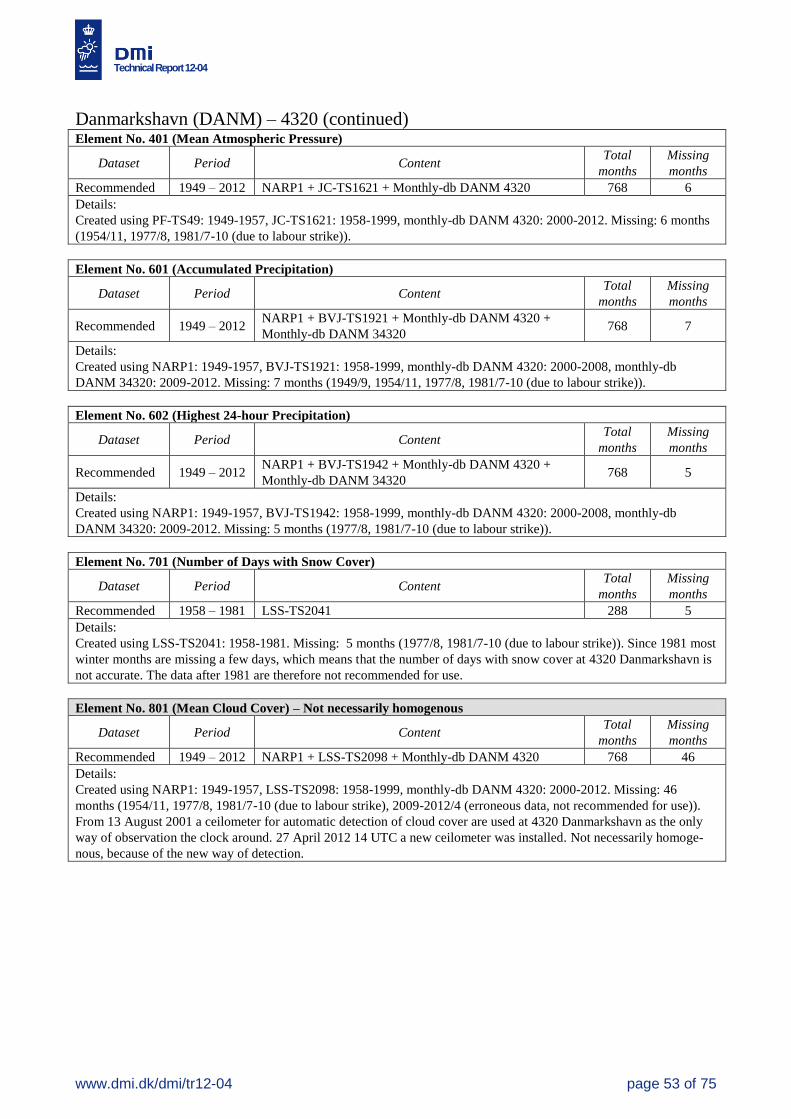
Technical Report 12-04
www.dmi.dk/dmi/tr12-04 page 53 of 75
Danmarkshavn (DANM) – 4320 (continued) Element No. 401 (Mean Atmospheric Pressure)
Dataset Period Content Total
months
Missing
months
Recommended 1949 – 2012 NARP1 + JC-TS1621 + Monthly-db DANM 4320 768 6
Details:
Created using PF-TS49: 1949-1957, JC-TS1621: 1958-1999, monthly-db DANM 4320: 2000-2012. Missing: 6 months
(1954/11, 1977/8, 1981/7-10 (due to labour strike)).
Element No. 601 (Accumulated Precipitation)
Dataset Period Content Total
months
Missing
months
Recommended 1949 – 2012 NARP1 + BVJ-TS1921 + Monthly-db DANM 4320 +
Monthly-db DANM 34320 768 7
Details:
Created using NARP1: 1949-1957, BVJ-TS1921: 1958-1999, monthly-db DANM 4320: 2000-2008, monthly-db
DANM 34320: 2009-2012. Missing: 7 months (1949/9, 1954/11, 1977/8, 1981/7-10 (due to labour strike)).
Element No. 602 (Highest 24-hour Precipitation)
Dataset Period Content Total
months
Missing
months
Recommended 1949 – 2012 NARP1 + BVJ-TS1942 + Monthly-db DANM 4320 +
Monthly-db DANM 34320 768 5
Details:
Created using NARP1: 1949-1957, BVJ-TS1942: 1958-1999, monthly-db DANM 4320: 2000-2008, monthly-db
DANM 34320: 2009-2012. Missing: 5 months (1977/8, 1981/7-10 (due to labour strike)).
Element No. 701 (Number of Days with Snow Cover)
Dataset Period Content Total
months
Missing
months
Recommended 1958 – 1981 LSS-TS2041 288 5
Details:
Created using LSS-TS2041: 1958-1981. Missing: 5 months (1977/8, 1981/7-10 (due to labour strike)). Since 1981 most
winter months are missing a few days, which means that the number of days with snow cover at 4320 Danmarkshavn is
not accurate. The data after 1981 are therefore not recommended for use.
Element No. 801 (Mean Cloud Cover) – Not necessarily homogenous
Dataset Period Content Total
months
Missing
months
Recommended 1949 – 2012 NARP1 + LSS-TS2098 + Monthly-db DANM 4320 768 46
Details:
Created using NARP1: 1949-1957, LSS-TS2098: 1958-1999, monthly-db DANM 4320: 2000-2012. Missing: 46
months (1954/11, 1977/8, 1981/7-10 (due to labour strike), 2009-2012/4 (erroneous data, not recommended for use)).
From 13 August 2001 a ceilometer for automatic detection of cloud cover are used at 4320 Danmarkshavn as the only
way of observation the clock around. 27 April 2012 14 UTC a new ceilometer was installed. Not necessarily homoge-
nous, because of the new way of detection.
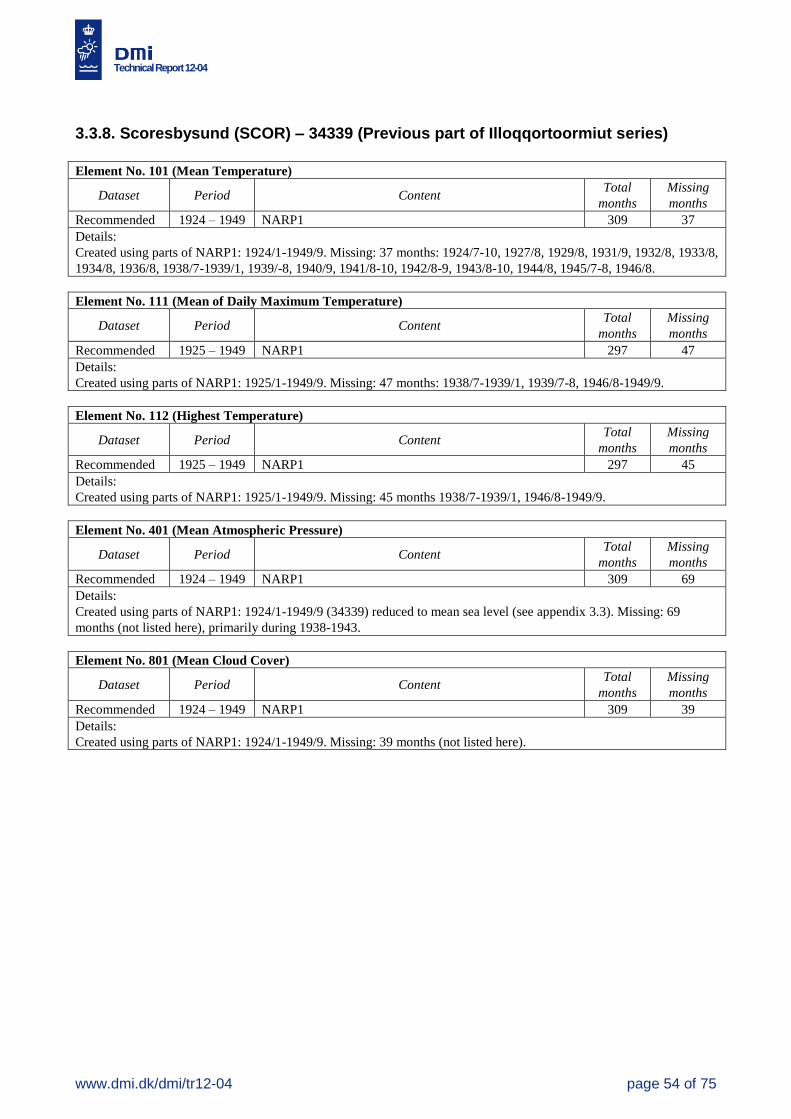
Technical Report 12-04
www.dmi.dk/dmi/tr12-04 page 54 of 75
3.3.8. Scoresbysund (SCOR) – 34339 (Previous part of Illoqqortoormiut series)
Element No. 101 (Mean Temperature)
Dataset Period Content Total
months
Missing
months
Recommended 1924 – 1949 NARP1 309 37
Details:
Created using parts of NARP1: 1924/1-1949/9. Missing: 37 months: 1924/7-10, 1927/8, 1929/8, 1931/9, 1932/8, 1933/8,
1934/8, 1936/8, 1938/7-1939/1, 1939/-8, 1940/9, 1941/8-10, 1942/8-9, 1943/8-10, 1944/8, 1945/7-8, 1946/8.
Element No. 111 (Mean of Daily Maximum Temperature)
Dataset Period Content Total
months
Missing
months
Recommended 1925 – 1949 NARP1 297 47
Details:
Created using parts of NARP1: 1925/1-1949/9. Missing: 47 months: 1938/7-1939/1, 1939/7-8, 1946/8-1949/9.
Element No. 112 (Highest Temperature)
Dataset Period Content Total
months
Missing
months
Recommended 1925 – 1949 NARP1 297 45
Details:
Created using parts of NARP1: 1925/1-1949/9. Missing: 45 months 1938/7-1939/1, 1946/8-1949/9.
Element No. 401 (Mean Atmospheric Pressure)
Dataset Period Content Total
months
Missing
months
Recommended 1924 – 1949 NARP1 309 69
Details:
Created using parts of NARP1: 1924/1-1949/9 (34339) reduced to mean sea level (see appendix 3.3). Missing: 69
months (not listed here), primarily during 1938-1943.
Element No. 801 (Mean Cloud Cover)
Dataset Period Content Total
months
Missing
months
Recommended 1924 – 1949 NARP1 309 39
Details:
Created using parts of NARP1: 1924/1-1949/9. Missing: 39 months (not listed here).
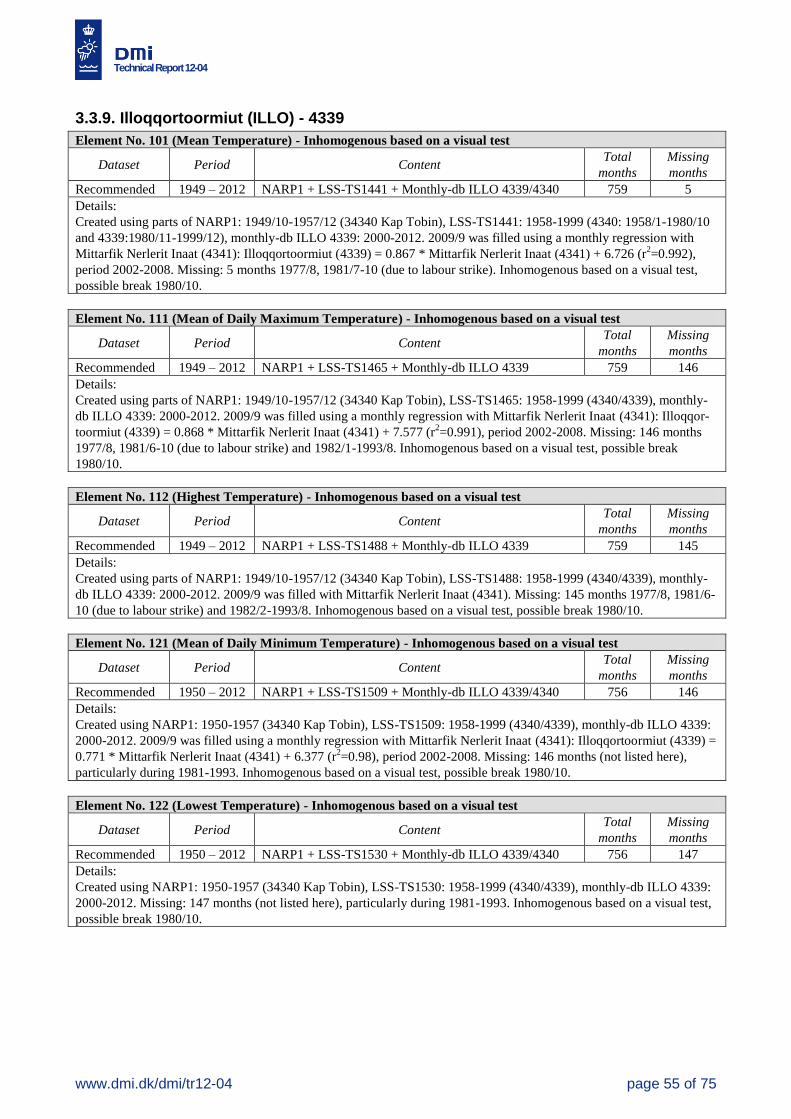
Technical Report 12-04
www.dmi.dk/dmi/tr12-04 page 55 of 75
3.3.9. Illoqqortoormiut (ILLO) - 4339
Element No. 101 (Mean Temperature) - Inhomogenous based on a visual test
Dataset Period Content Total
months
Missing
months
Recommended 1949 – 2012 NARP1 + LSS-TS1441 + Monthly-db ILLO 4339/4340 759 5
Details:
Created using parts of NARP1: 1949/10-1957/12 (34340 Kap Tobin), LSS-TS1441: 1958-1999 (4340: 1958/1-1980/10
and 4339:1980/11-1999/12), monthly-db ILLO 4339: 2000-2012. 2009/9 was filled using a monthly regression with
Mittarfik Nerlerit Inaat (4341): Illoqqortoormiut (4339) = 0.867 * Mittarfik Nerlerit Inaat (4341) + 6.726 (r2=0.992),
period 2002-2008. Missing: 5 months 1977/8, 1981/7-10 (due to labour strike). Inhomogenous based on a visual test,
possible break 1980/10.
Element No. 111 (Mean of Daily Maximum Temperature) - Inhomogenous based on a visual test
Dataset Period Content Total
months
Missing
months
Recommended 1949 – 2012 NARP1 + LSS-TS1465 + Monthly-db ILLO 4339 759 146
Details:
Created using parts of NARP1: 1949/10-1957/12 (34340 Kap Tobin), LSS-TS1465: 1958-1999 (4340/4339), monthly-
db ILLO 4339: 2000-2012. 2009/9 was filled using a monthly regression with Mittarfik Nerlerit Inaat (4341): Illoqqor-
toormiut (4339) = 0.868 * Mittarfik Nerlerit Inaat (4341) + 7.577 (r2=0.991), period 2002-2008. Missing: 146 months
1977/8, 1981/6-10 (due to labour strike) and 1982/1-1993/8. Inhomogenous based on a visual test, possible break
1980/10.
Element No. 112 (Highest Temperature) - Inhomogenous based on a visual test
Dataset Period Content Total
months
Missing
months
Recommended 1949 – 2012 NARP1 + LSS-TS1488 + Monthly-db ILLO 4339 759 145
Details:
Created using parts of NARP1: 1949/10-1957/12 (34340 Kap Tobin), LSS-TS1488: 1958-1999 (4340/4339), monthly-
db ILLO 4339: 2000-2012. 2009/9 was filled with Mittarfik Nerlerit Inaat (4341). Missing: 145 months 1977/8, 1981/6-
10 (due to labour strike) and 1982/2-1993/8. Inhomogenous based on a visual test, possible break 1980/10.
Element No. 121 (Mean of Daily Minimum Temperature) - Inhomogenous based on a visual test
Dataset Period Content Total
months
Missing
months
Recommended 1950 – 2012 NARP1 + LSS-TS1509 + Monthly-db ILLO 4339/4340 756 146
Details:
Created using NARP1: 1950-1957 (34340 Kap Tobin), LSS-TS1509: 1958-1999 (4340/4339), monthly-db ILLO 4339:
2000-2012. 2009/9 was filled using a monthly regression with Mittarfik Nerlerit Inaat (4341): Illoqqortoormiut (4339) =
0.771 * Mittarfik Nerlerit Inaat (4341) + 6.377 (r2=0.98), period 2002-2008. Missing: 146 months (not listed here),
particularly during 1981-1993. Inhomogenous based on a visual test, possible break 1980/10.
Element No. 122 (Lowest Temperature) - Inhomogenous based on a visual test
Dataset Period Content Total
months
Missing
months
Recommended 1950 – 2012 NARP1 + LSS-TS1530 + Monthly-db ILLO 4339/4340 756 147
Details:
Created using NARP1: 1950-1957 (34340 Kap Tobin), LSS-TS1530: 1958-1999 (4340/4339), monthly-db ILLO 4339:
2000-2012. Missing: 147 months (not listed here), particularly during 1981-1993. Inhomogenous based on a visual test,
possible break 1980/10.
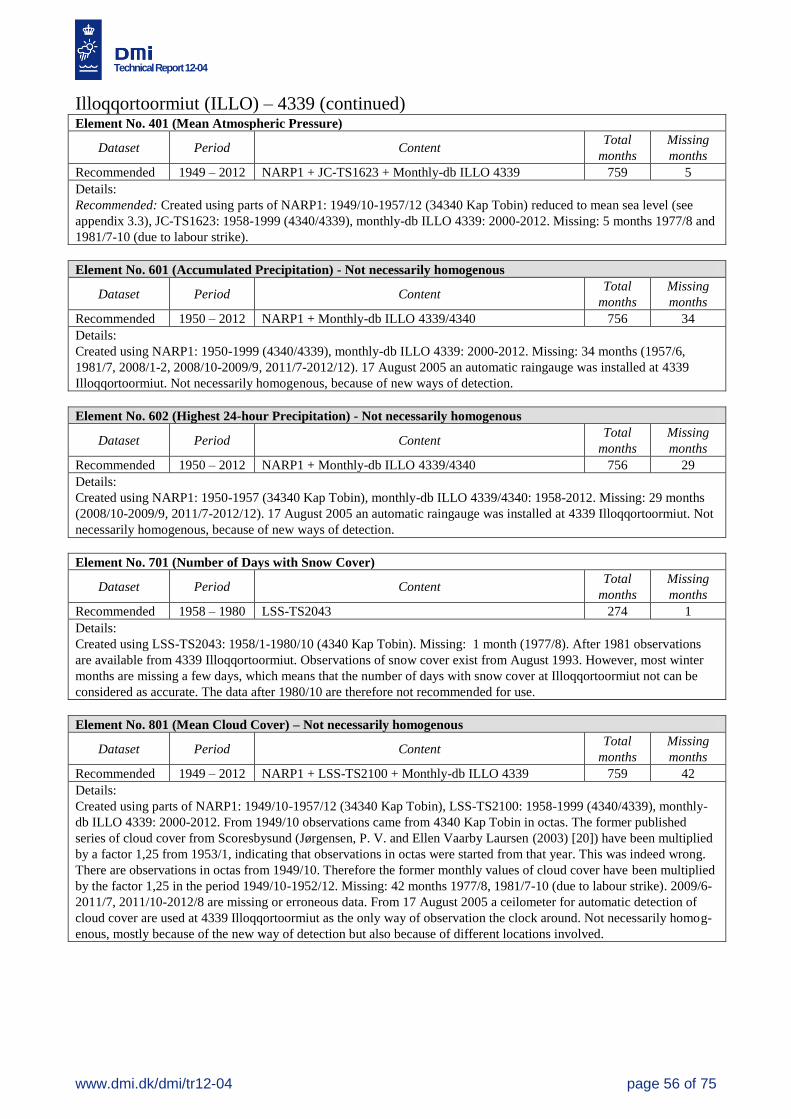
Technical Report 12-04
www.dmi.dk/dmi/tr12-04 page 56 of 75
Illoqqortoormiut (ILLO) – 4339 (continued)
Element No. 401 (Mean Atmospheric Pressure)
Dataset Period Content Total
months
Missing
months
Recommended 1949 – 2012 NARP1 + JC-TS1623 + Monthly-db ILLO 4339 759 5
Details:
Recommended: Created using parts of NARP1: 1949/10-1957/12 (34340 Kap Tobin) reduced to mean sea level (see
appendix 3.3), JC-TS1623: 1958-1999 (4340/4339), monthly-db ILLO 4339: 2000-2012. Missing: 5 months 1977/8 and
1981/7-10 (due to labour strike).
Element No. 601 (Accumulated Precipitation) - Not necessarily homogenous
Dataset Period Content Total
months
Missing
months
Recommended 1950 – 2012 NARP1 + Monthly-db ILLO 4339/4340 756 34
Details:
Created using NARP1: 1950-1999 (4340/4339), monthly-db ILLO 4339: 2000-2012. Missing: 34 months (1957/6,
1981/7, 2008/1-2, 2008/10-2009/9, 2011/7-2012/12). 17 August 2005 an automatic raingauge was installed at 4339
Illoqqortoormiut. Not necessarily homogenous, because of new ways of detection.
Element No. 602 (Highest 24-hour Precipitation) - Not necessarily homogenous
Dataset Period Content Total
months
Missing
months
Recommended 1950 – 2012 NARP1 + Monthly-db ILLO 4339/4340 756 29
Details:
Created using NARP1: 1950-1957 (34340 Kap Tobin), monthly-db ILLO 4339/4340: 1958-2012. Missing: 29 months
(2008/10-2009/9, 2011/7-2012/12). 17 August 2005 an automatic raingauge was installed at 4339 Illoqqortoormiut. Not
necessarily homogenous, because of new ways of detection.
Element No. 701 (Number of Days with Snow Cover)
Dataset Period Content Total
months
Missing
months
Recommended 1958 – 1980 LSS-TS2043 274 1
Details:
Created using LSS-TS2043: 1958/1-1980/10 (4340 Kap Tobin). Missing: 1 month (1977/8). After 1981 observations
are available from 4339 Illoqqortoormiut. Observations of snow cover exist from August 1993. However, most winter
months are missing a few days, which means that the number of days with snow cover at Illoqqortoormiut not can be
considered as accurate. The data after 1980/10 are therefore not recommended for use.
Element No. 801 (Mean Cloud Cover) – Not necessarily homogenous
Dataset Period Content Total
months
Missing
months
Recommended 1949 – 2012 NARP1 + LSS-TS2100 + Monthly-db ILLO 4339 759 42
Details:
Created using parts of NARP1: 1949/10-1957/12 (34340 Kap Tobin), LSS-TS2100: 1958-1999 (4340/4339), monthly-
db ILLO 4339: 2000-2012. From 1949/10 observations came from 4340 Kap Tobin in octas. The former published
series of cloud cover from Scoresbysund (Jørgensen, P. V. and Ellen Vaarby Laursen (2003) [20]) have been multiplied
by a factor 1,25 from 1953/1, indicating that observations in octas were started from that year. This was indeed wrong.
There are observations in octas from 1949/10. Therefore the former monthly values of cloud cover have been multiplied
by the factor 1,25 in the period 1949/10-1952/12. Missing: 42 months 1977/8, 1981/7-10 (due to labour strike). 2009/6-
2011/7, 2011/10-2012/8 are missing or erroneous data. From 17 August 2005 a ceilometer for automatic detection of
cloud cover are used at 4339 Illoqqortoormiut as the only way of observation the clock around. Not necessarily homog-
enous, mostly because of the new way of detection but also because of different locations involved.
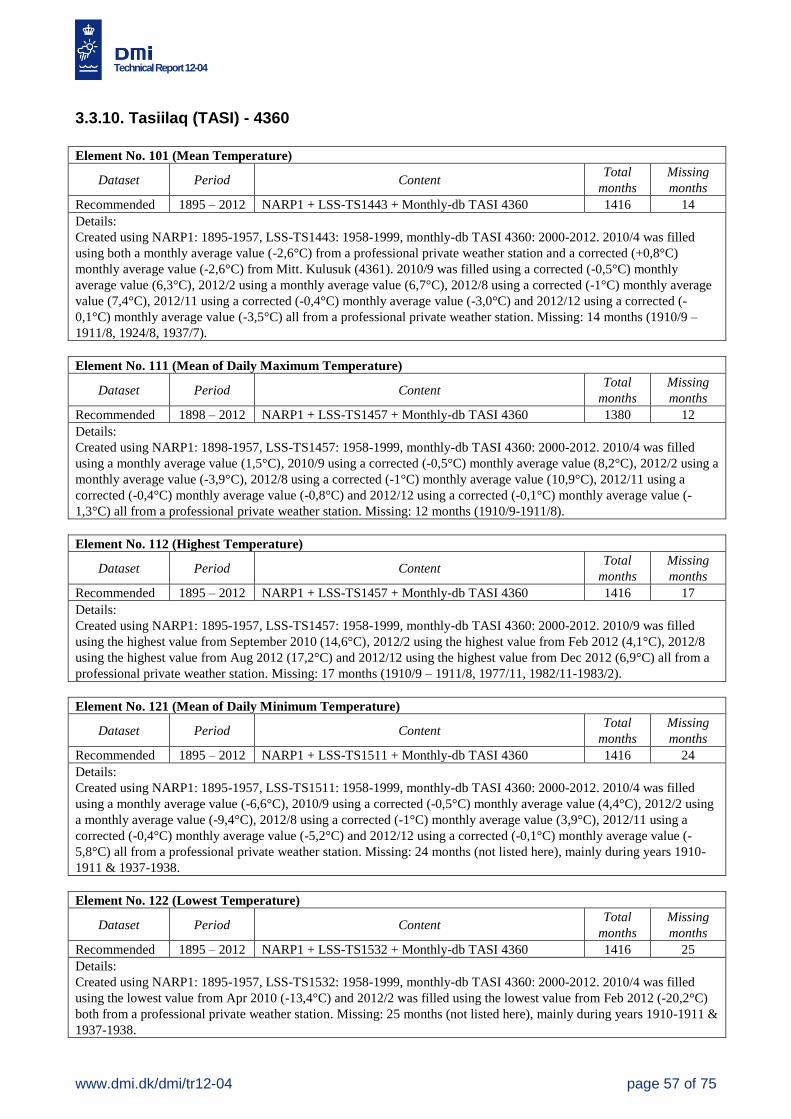
Technical Report 12-04
www.dmi.dk/dmi/tr12-04 page 57 of 75
3.3.10. Tasiilaq (TASI) - 4360
Element No. 101 (Mean Temperature)
Dataset Period Content Total
months
Missing
months
Recommended 1895 – 2012 NARP1 + LSS-TS1443 + Monthly-db TASI 4360 1416 14
Details:
Created using NARP1: 1895-1957, LSS-TS1443: 1958-1999, monthly-db TASI 4360: 2000-2012. 2010/4 was filled
using both a monthly average value (-2,6°C) from a professional private weather station and a corrected (+0,8°C)
monthly average value (-2,6°C) from Mitt. Kulusuk (4361). 2010/9 was filled using a corrected (-0,5°C) monthly
average value (6,3°C), 2012/2 using a monthly average value (6,7°C), 2012/8 using a corrected (-1°C) monthly average
value (7,4°C), 2012/11 using a corrected (-0,4°C) monthly average value (-3,0°C) and 2012/12 using a corrected (-
0,1°C) monthly average value (-3,5°C) all from a professional private weather station. Missing: 14 months (1910/9 –
1911/8, 1924/8, 1937/7).
Element No. 111 (Mean of Daily Maximum Temperature)
Dataset Period Content Total
months
Missing
months
Recommended 1898 – 2012 NARP1 + LSS-TS1457 + Monthly-db TASI 4360 1380 12
Details:
Created using NARP1: 1898-1957, LSS-TS1457: 1958-1999, monthly-db TASI 4360: 2000-2012. 2010/4 was filled
using a monthly average value (1,5°C), 2010/9 using a corrected (-0,5°C) monthly average value (8,2°C), 2012/2 using a
monthly average value (-3,9°C), 2012/8 using a corrected (-1°C) monthly average value (10,9°C), 2012/11 using a
corrected (-0,4°C) monthly average value (-0,8°C) and 2012/12 using a corrected (-0,1°C) monthly average value (-
1,3°C) all from a professional private weather station. Missing: 12 months (1910/9-1911/8).
Element No. 112 (Highest Temperature)
Dataset Period Content Total
months
Missing
months
Recommended 1895 – 2012 NARP1 + LSS-TS1457 + Monthly-db TASI 4360 1416 17
Details:
Created using NARP1: 1895-1957, LSS-TS1457: 1958-1999, monthly-db TASI 4360: 2000-2012. 2010/9 was filled
using the highest value from September 2010 (14,6°C), 2012/2 using the highest value from Feb 2012 (4,1°C), 2012/8
using the highest value from Aug 2012 (17,2°C) and 2012/12 using the highest value from Dec 2012 (6,9°C) all from a
professional private weather station. Missing: 17 months (1910/9 – 1911/8, 1977/11, 1982/11-1983/2).
Element No. 121 (Mean of Daily Minimum Temperature)
Dataset Period Content Total
months
Missing
months
Recommended 1895 – 2012 NARP1 + LSS-TS1511 + Monthly-db TASI 4360 1416 24
Details:
Created using NARP1: 1895-1957, LSS-TS1511: 1958-1999, monthly-db TASI 4360: 2000-2012. 2010/4 was filled
using a monthly average value (-6,6°C), 2010/9 using a corrected (-0,5°C) monthly average value (4,4°C), 2012/2 using
a monthly average value (-9,4°C), 2012/8 using a corrected (-1°C) monthly average value (3,9°C), 2012/11 using a
corrected (-0,4°C) monthly average value (-5,2°C) and 2012/12 using a corrected (-0,1°C) monthly average value (-
5,8°C) all from a professional private weather station. Missing: 24 months (not listed here), mainly during years 1910-
1911 & 1937-1938.
Element No. 122 (Lowest Temperature)
Dataset Period Content Total
months
Missing
months
Recommended 1895 – 2012 NARP1 + LSS-TS1532 + Monthly-db TASI 4360 1416 25
Details:
Created using NARP1: 1895-1957, LSS-TS1532: 1958-1999, monthly-db TASI 4360: 2000-2012. 2010/4 was filled
using the lowest value from Apr 2010 (-13,4°C) and 2012/2 was filled using the lowest value from Feb 2012 (-20,2°C)
both from a professional private weather station. Missing: 25 months (not listed here), mainly during years 1910-1911 &
1937-1938.
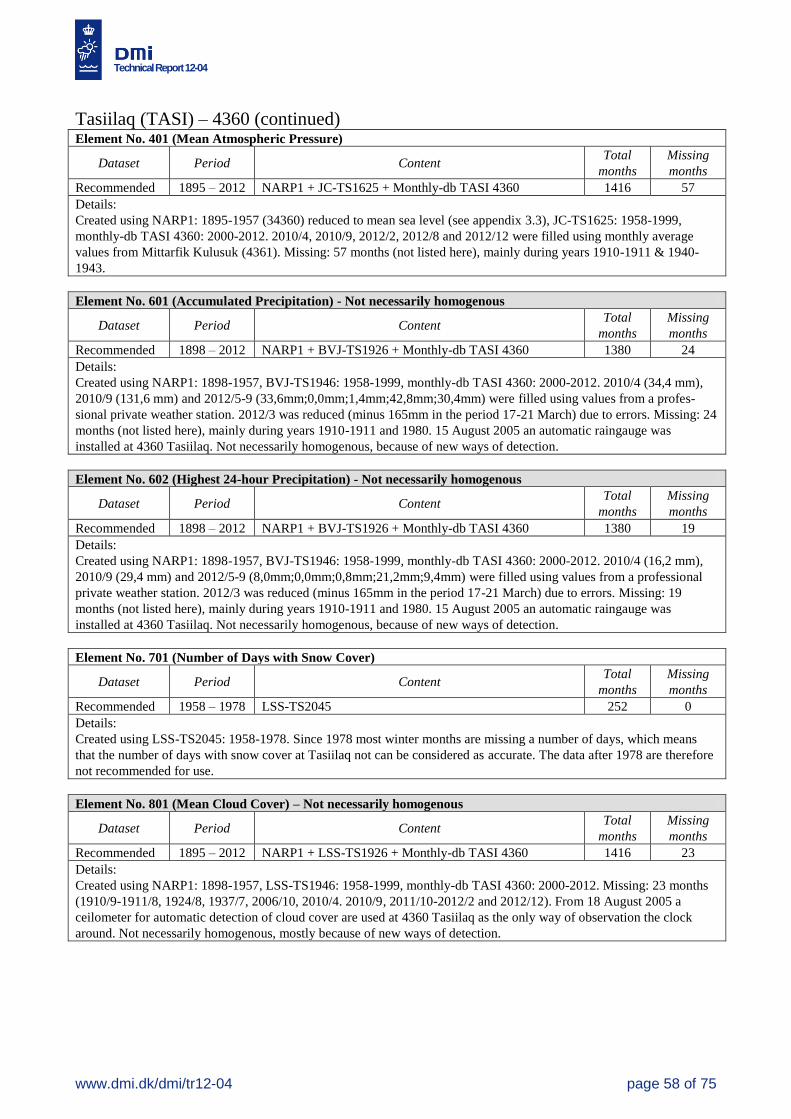
Technical Report 12-04
www.dmi.dk/dmi/tr12-04 page 58 of 75
Tasiilaq (TASI) – 4360 (continued)
Element No. 401 (Mean Atmospheric Pressure)
Dataset Period Content Total
months
Missing
months
Recommended 1895 – 2012 NARP1 + JC-TS1625 + Monthly-db TASI 4360 1416 57
Details:
Created using NARP1: 1895-1957 (34360) reduced to mean sea level (see appendix 3.3), JC-TS1625: 1958-1999,
monthly-db TASI 4360: 2000-2012. 2010/4, 2010/9, 2012/2, 2012/8 and 2012/12 were filled using monthly average
values from Mittarfik Kulusuk (4361). Missing: 57 months (not listed here), mainly during years 1910-1911 & 1940-
1943.
Element No. 601 (Accumulated Precipitation) - Not necessarily homogenous
Dataset Period Content Total
months
Missing
months
Recommended 1898 – 2012 NARP1 + BVJ-TS1926 + Monthly-db TASI 4360 1380 24
Details:
Created using NARP1: 1898-1957, BVJ-TS1946: 1958-1999, monthly-db TASI 4360: 2000-2012. 2010/4 (34,4 mm),
2010/9 (131,6 mm) and 2012/5-9 (33,6mm;0,0mm;1,4mm;42,8mm;30,4mm) were filled using values from a profes-
sional private weather station. 2012/3 was reduced (minus 165mm in the period 17-21 March) due to errors. Missing: 24
months (not listed here), mainly during years 1910-1911 and 1980. 15 August 2005 an automatic raingauge was
installed at 4360 Tasiilaq. Not necessarily homogenous, because of new ways of detection.
Element No. 602 (Highest 24-hour Precipitation) - Not necessarily homogenous
Dataset Period Content Total
months
Missing
months
Recommended 1898 – 2012 NARP1 + BVJ-TS1926 + Monthly-db TASI 4360 1380 19
Details:
Created using NARP1: 1898-1957, BVJ-TS1946: 1958-1999, monthly-db TASI 4360: 2000-2012. 2010/4 (16,2 mm),
2010/9 (29,4 mm) and 2012/5-9 (8,0mm;0,0mm;0,8mm;21,2mm;9,4mm) were filled using values from a professional
private weather station. 2012/3 was reduced (minus 165mm in the period 17-21 March) due to errors. Missing: 19
months (not listed here), mainly during years 1910-1911 and 1980. 15 August 2005 an automatic raingauge was
installed at 4360 Tasiilaq. Not necessarily homogenous, because of new ways of detection.
Element No. 701 (Number of Days with Snow Cover)
Dataset Period Content Total
months
Missing
months
Recommended 1958 – 1978 LSS-TS2045 252 0
Details:
Created using LSS-TS2045: 1958-1978. Since 1978 most winter months are missing a number of days, which means
that the number of days with snow cover at Tasiilaq not can be considered as accurate. The data after 1978 are therefore
not recommended for use.
Element No. 801 (Mean Cloud Cover) – Not necessarily homogenous
Dataset Period Content Total
months
Missing
months
Recommended 1895 – 2012 NARP1 + LSS-TS1926 + Monthly-db TASI 4360 1416 23
Details:
Created using NARP1: 1898-1957, LSS-TS1946: 1958-1999, monthly-db TASI 4360: 2000-2012. Missing: 23 months
(1910/9-1911/8, 1924/8, 1937/7, 2006/10, 2010/4. 2010/9, 2011/10-2012/2 and 2012/12). From 18 August 2005 a
ceilometer for automatic detection of cloud cover are used at 4360 Tasiilaq as the only way of observation the clock
around. Not necessarily homogenous, mostly because of new ways of detection.
Technical Report 12-04
www.dmi.dk/dmi/tr12-04 page 59 of 75
3.4. File formats; Monthly data files
The monthly files included in this report contain monthly DMI data series 1873-2012 comprising
different parameters from selected stations in Greenland.
The files are provided for each station, for each element, named by the 4-letter station abbreviation
plus station number, element number and period.
The file names are determined as follows:
gr_monthly_<station abbreviation>_<station number>_>element number>_<period>.dat
ex. gr_monthly_nuuk_4250_101_1873_2012.dat (all files are not listed here)
The fixed format text files consist of 3 columns: YEAR, MONTH, “VALUE”.
The units of “VALUE” can be seen in the data dictionary table 3.2.2, in chapter 3.2.
Special Remarks: 1) Months are referred to by year/month number (ex. 1981/03 = March 1981).
2) The minimum criteria used here for calculating a valid monthly value is that measurements
from more than 21 days are present in that month, so the number of daily values are ranging 22-31.
In addition a dataset containing all monthly data series is also available as both a fixed format
text file, a Excel file and a csv file (; seperated) named: gr_monthly_all
In the fixed format text file gr_monthly_all.dat each record contains:
Variable Start End Format Description
STAT_NO 1 5 F5.0 Station number (see section 3.2.1)
ELEM_NO 6 8 F3.0 Element number (see section 3.2.2)
YEAR 9 12 F4.0 Year
JAN 13 17 F5.0 Jan. value (units described in section 3.2.2)
FEB 18 22 F5.0 Feb. value (units described in section 3.2.2)
MAR 23 27 F5.0 March value (units described in section 3.2.2)
APR 28 32 F5.0 April value (units described in section 3.2.2)
MAY 33 37 F5.0 May value (units described in section 3.2.2)
JUN 38 42 F5.0 June value (units described in section 3.2.2)
JUL 43 47 F5.0 July value (units described in section 3.2.2)
AUG 48 52 F5.0 Aug. value (units described in section 3.2.2)
SEP 53 57 F5.0 Sep. value (units described in section 3.2.2)
OCT 58 62 F5.0 Oct. value (units described in section 3.2.2)
NOV 63 67 F5.0 Nov. value (units described in section 3.2.2)
ANNUAL 73 77 F5.0 Ann. value (units described in section 3.2.2)
CO_CODE 78 80 A3 Country code (GR= Greenland).
In the files gr_monthly_all data are sorted according to element and station number. Furthermore
all missing values have been replaced with the dummy value -9999 and a calculated annual value
and a country code have been included.
Data are only to be used with proper reference to the accompanying report: Cappelen, J. (ed), 2013:
Greenland - DMI Historical Climate Data Collection 1873-2012 – with Danish Abstracts. DMI
Technical Report 13-04. Copenhagen.
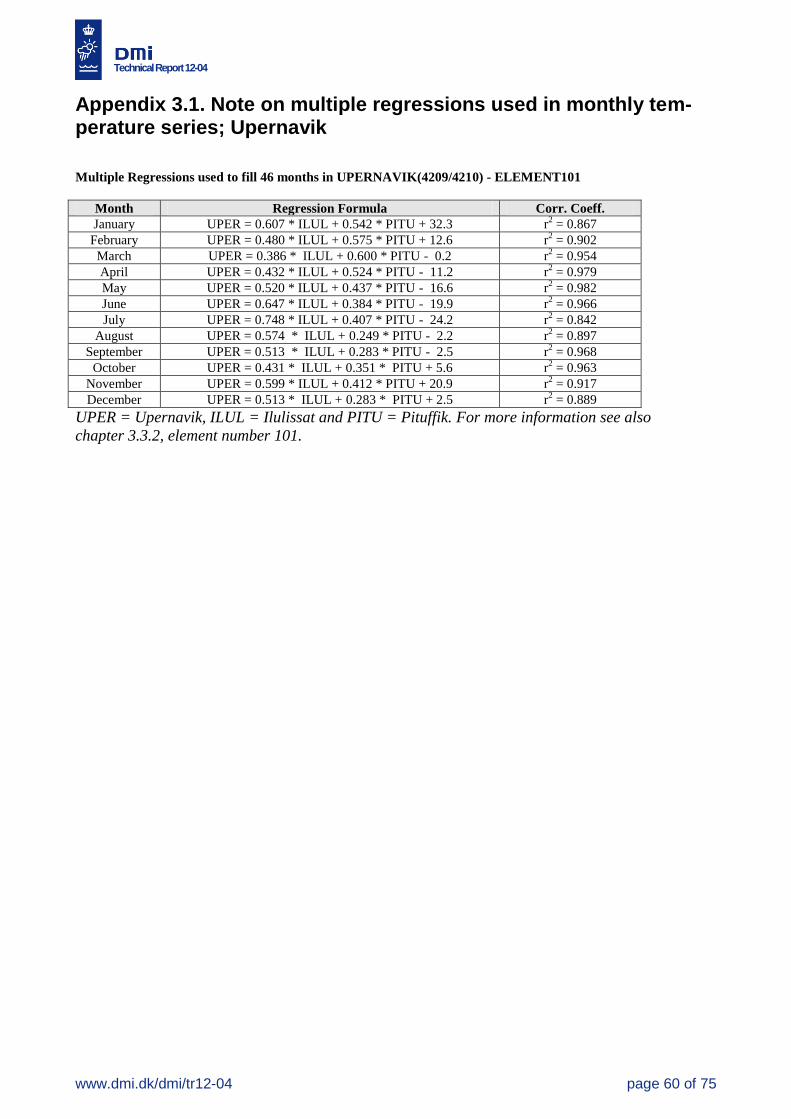
Technical Report 12-04
www.dmi.dk/dmi/tr12-04 page 60 of 75
Appendix 3.1. Note on multiple regressions used in monthly tem-perature series; Upernavik
Multiple Regressions used to fill 46 months in UPERNAVIK(4209/4210) - ELEMENT101
Month Regression Formula Corr. Coeff.
January UPER = 0.607 * ILUL + 0.542 * PITU + 32.3 r2 = 0.867
February UPER = 0.480 * ILUL + 0.575 * PITU + 12.6 r2 = 0.902
March UPER = 0.386 * ILUL + 0.600 * PITU - 0.2 r2 = 0.954
April UPER = 0.432 * ILUL + 0.524 * PITU - 11.2 r2 = 0.979
May UPER = 0.520 * ILUL + 0.437 * PITU - 16.6 r2 = 0.982
June UPER = 0.647 * ILUL + 0.384 * PITU - 19.9 r2 = 0.966
July UPER = 0.748 * ILUL + 0.407 * PITU - 24.2 r2 = 0.842
August UPER = 0.574 * ILUL + 0.249 * PITU - 2.2 r2 = 0.897
September UPER = 0.513 * ILUL + 0.283 * PITU - 2.5 r2 = 0.968
October UPER = 0.431 * ILUL + 0.351 * PITU + 5.6 r2 = 0.963
November UPER = 0.599 * ILUL + 0.412 * PITU + 20.9 r2 = 0.917
December UPER = 0.513 * ILUL + 0.283 * PITU + 2.5 r2 = 0.889
UPER = Upernavik, ILUL = Ilulissat and PITU = Pituffik. For more information see also
chapter 3.3.2, element number 101.
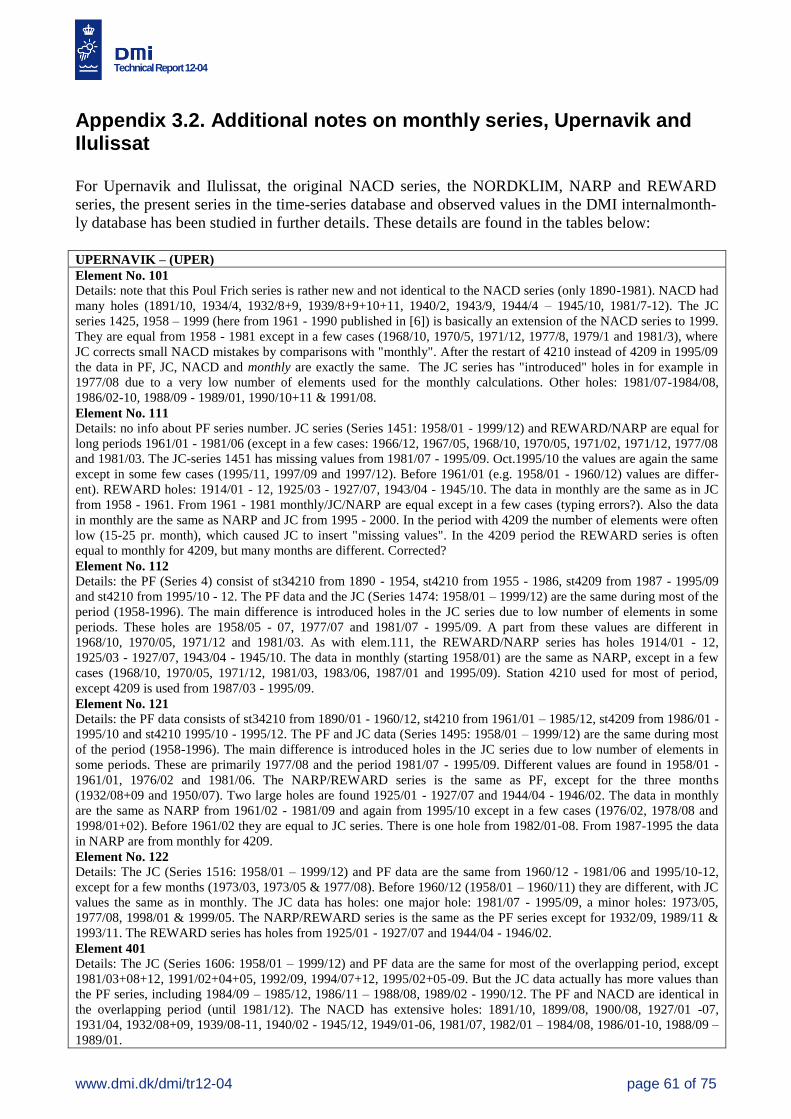
Technical Report 12-04
www.dmi.dk/dmi/tr12-04 page 61 of 75
Appendix 3.2. Additional notes on monthly series, Upernavik and Ilulissat
For Upernavik and Ilulissat, the original NACD series, the NORDKLIM, NARP and REWARD
series, the present series in the time-series database and observed values in the DMI internalmonth-
ly database has been studied in further details. These details are found in the tables below:
UPERNAVIK – (UPER)
Element No. 101
Details: note that this Poul Frich series is rather new and not identical to the NACD series (only 1890-1981). NACD had
many holes (1891/10, 1934/4, 1932/8+9, 1939/8+9+10+11, 1940/2, 1943/9, 1944/4 – 1945/10, 1981/7-12). The JC
series 1425, 1958 – 1999 (here from 1961 - 1990 published in [6]) is basically an extension of the NACD series to 1999.
They are equal from 1958 - 1981 except in a few cases (1968/10, 1970/5, 1971/12, 1977/8, 1979/1 and 1981/3), where
JC corrects small NACD mistakes by comparisons with "monthly". After the restart of 4210 instead of 4209 in 1995/09
the data in PF, JC, NACD and monthly are exactly the same. The JC series has "introduced" holes in for example in
1977/08 due to a very low number of elements used for the monthly calculations. Other holes: 1981/07-1984/08,
1986/02-10, 1988/09 - 1989/01, 1990/10+11 & 1991/08.
Element No. 111
Details: no info about PF series number. JC series (Series 1451: 1958/01 - 1999/12) and REWARD/NARP are equal for
long periods 1961/01 - 1981/06 (except in a few cases: 1966/12, 1967/05, 1968/10, 1970/05, 1971/02, 1971/12, 1977/08
and 1981/03. The JC-series 1451 has missing values from 1981/07 - 1995/09. Oct.1995/10 the values are again the same
except in some few cases (1995/11, 1997/09 and 1997/12). Before 1961/01 (e.g. 1958/01 - 1960/12) values are differ-
ent). REWARD holes: 1914/01 - 12, 1925/03 - 1927/07, 1943/04 - 1945/10. The data in monthly are the same as in JC
from 1958 - 1961. From 1961 - 1981 monthly/JC/NARP are equal except in a few cases (typing errors?). Also the data
in monthly are the same as NARP and JC from 1995 - 2000. In the period with 4209 the number of elements were often
low (15-25 pr. month), which caused JC to insert "missing values". In the 4209 period the REWARD series is often
equal to monthly for 4209, but many months are different. Corrected?
Element No. 112
Details: the PF (Series 4) consist of st34210 from 1890 - 1954, st4210 from 1955 - 1986, st4209 from 1987 - 1995/09
and st4210 from 1995/10 - 12. The PF data and the JC (Series 1474: 1958/01 – 1999/12) are the same during most of the
period (1958-1996). The main difference is introduced holes in the JC series due to low number of elements in some
periods. These holes are 1958/05 - 07, 1977/07 and 1981/07 - 1995/09. A part from these values are different in
1968/10, 1970/05, 1971/12 and 1981/03. As with elem.111, the REWARD/NARP series has holes 1914/01 - 12,
1925/03 - 1927/07, 1943/04 - 1945/10. The data in monthly (starting 1958/01) are the same as NARP, except in a few
cases (1968/10, 1970/05, 1971/12, 1981/03, 1983/06, 1987/01 and 1995/09). Station 4210 used for most of period,
except 4209 is used from 1987/03 - 1995/09.
Element No. 121
Details: the PF data consists of st34210 from 1890/01 - 1960/12, st4210 from 1961/01 – 1985/12, st4209 from 1986/01 -
1995/10 and st4210 1995/10 - 1995/12. The PF and JC data (Series 1495: 1958/01 – 1999/12) are the same during most
of the period (1958-1996). The main difference is introduced holes in the JC series due to low number of elements in
some periods. These are primarily 1977/08 and the period 1981/07 - 1995/09. Different values are found in 1958/01 -
1961/01, 1976/02 and 1981/06. The NARP/REWARD series is the same as PF, except for the three months
(1932/08+09 and 1950/07). Two large holes are found 1925/01 - 1927/07 and 1944/04 - 1946/02. The data in monthly
are the same as NARP from 1961/02 - 1981/09 and again from 1995/10 except in a few cases (1976/02, 1978/08 and
1998/01+02). Before 1961/02 they are equal to JC series. There is one hole from 1982/01-08. From 1987-1995 the data
in NARP are from monthly for 4209.
Element No. 122
Details: The JC (Series 1516: 1958/01 – 1999/12) and PF data are the same from 1960/12 - 1981/06 and 1995/10-12,
except for a few months (1973/03, 1973/05 & 1977/08). Before 1960/12 (1958/01 – 1960/11) they are different, with JC
values the same as in monthly. The JC data has holes: one major hole: 1981/07 - 1995/09, a minor holes: 1973/05,
1977/08, 1998/01 & 1999/05. The NARP/REWARD series is the same as the PF series except for 1932/09, 1989/11 &
1993/11. The REWARD series has holes from 1925/01 - 1927/07 and 1944/04 - 1946/02.
Element 401
Details: The JC (Series 1606: 1958/01 – 1999/12) and PF data are the same for most of the overlapping period, except
1981/03+08+12, 1991/02+04+05, 1992/09, 1994/07+12, 1995/02+05-09. But the JC data actually has more values than
the PF series, including 1984/09 – 1985/12, 1986/11 – 1988/08, 1989/02 - 1990/12. The PF and NACD are identical in
the overlapping period (until 1981/12). The NACD has extensive holes: 1891/10, 1899/08, 1900/08, 1927/01 -07,
1931/04, 1932/08+09, 1939/08-11, 1940/02 - 1945/12, 1949/01-06, 1981/07, 1982/01 – 1984/08, 1986/01-10, 1988/09 –
1989/01.
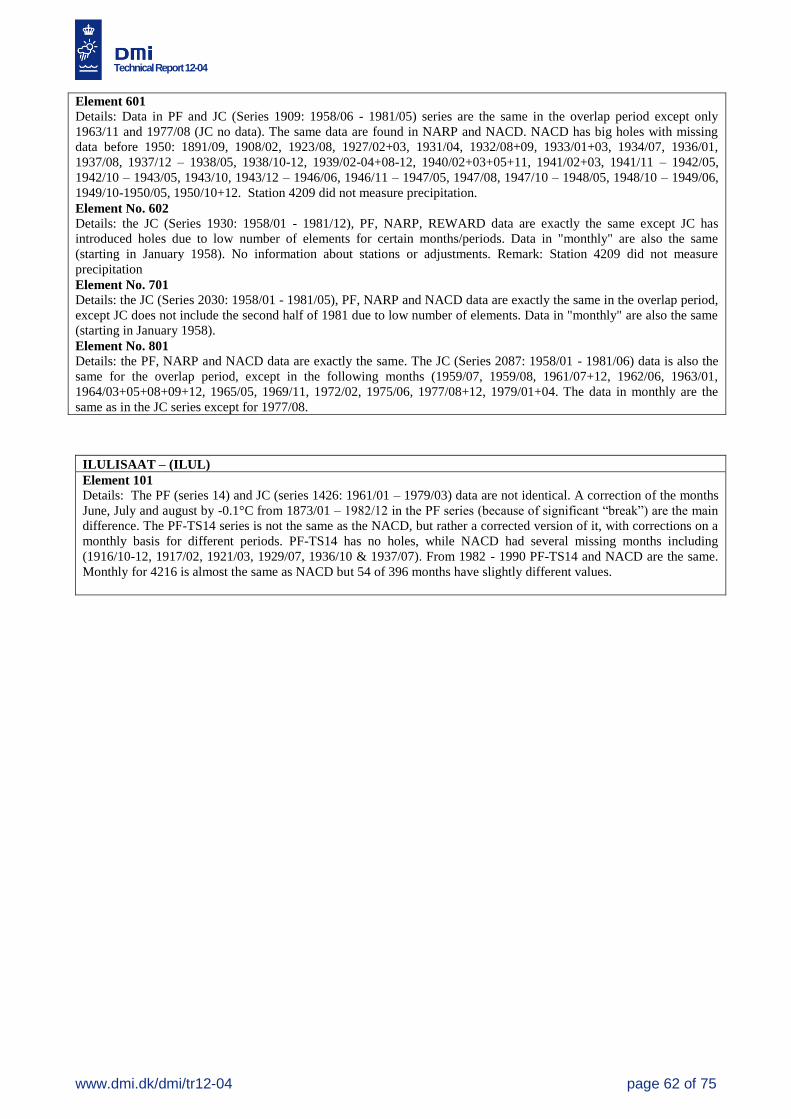
Technical Report 12-04
www.dmi.dk/dmi/tr12-04 page 62 of 75
Element 601
Details: Data in PF and JC (Series 1909: 1958/06 - 1981/05) series are the same in the overlap period except only
1963/11 and 1977/08 (JC no data). The same data are found in NARP and NACD. NACD has big holes with missing
data before 1950: 1891/09, 1908/02, 1923/08, 1927/02+03, 1931/04, 1932/08+09, 1933/01+03, 1934/07, 1936/01,
1937/08, 1937/12 – 1938/05, 1938/10-12, 1939/02-04+08-12, 1940/02+03+05+11, 1941/02+03, 1941/11 – 1942/05,
1942/10 – 1943/05, 1943/10, 1943/12 – 1946/06, 1946/11 – 1947/05, 1947/08, 1947/10 – 1948/05, 1948/10 – 1949/06,
1949/10-1950/05, 1950/10+12. Station 4209 did not measure precipitation.
Element No. 602
Details: the JC (Series 1930: 1958/01 - 1981/12), PF, NARP, REWARD data are exactly the same except JC has
introduced holes due to low number of elements for certain months/periods. Data in "monthly" are also the same
(starting in January 1958). No information about stations or adjustments. Remark: Station 4209 did not measure
precipitation
Element No. 701
Details: the JC (Series 2030: 1958/01 - 1981/05), PF, NARP and NACD data are exactly the same in the overlap period,
except JC does not include the second half of 1981 due to low number of elements. Data in "monthly" are also the same
(starting in January 1958).
Element No. 801
Details: the PF, NARP and NACD data are exactly the same. The JC (Series 2087: 1958/01 - 1981/06) data is also the
same for the overlap period, except in the following months (1959/07, 1959/08, 1961/07+12, 1962/06, 1963/01,
1964/03+05+08+09+12, 1965/05, 1969/11, 1972/02, 1975/06, 1977/08+12, 1979/01+04. The data in monthly are the
same as in the JC series except for 1977/08.
ILULISAAT – (ILUL)
Element 101
Details: The PF (series 14) and JC (series 1426: 1961/01 – 1979/03) data are not identical. A correction of the months
June, July and august by -0.1°C from 1873/01 – 1982/12 in the PF series (because of significant “break”) are the main
difference. The PF-TS14 series is not the same as the NACD, but rather a corrected version of it, with corrections on a
monthly basis for different periods. PF-TS14 has no holes, while NACD had several missing months including
(1916/10-12, 1917/02, 1921/03, 1929/07, 1936/10 & 1937/07). From 1982 - 1990 PF-TS14 and NACD are the same.
Monthly for 4216 is almost the same as NACD but 54 of 396 months have slightly different values.
Technical Report 12-04
www.dmi.dk/dmi/tr12-04 page 63 of 75
Appendix 3.3. Regarding monthly data of atmospheric pressure
The reading of a mercury barometer is proportional to the length of a mercury column in the ba-
rometer, which is balanced against the weight of the entire atmospheric column of air above the
open surface of the mercury. The mercury barometer was therefore calibrated to “standard condi-
tions” (0ºC and a certain standard gravity). At other conditions corrections must be used.
The formula used to correct old barometer readings for the stations presented in this publication is
given below. The formula simply corrects for gravity (part 1) and reduces the pressure to mean sea
level (part 2):
P * (1 – 0,00259 * cos (2* φ * π/180)) * ( 1 + 9.82/287.04 * h/(T/10+273.15 ) )
P is atmospheric pressure (0.1 hPa) at station level, φ is the latitude in degrees, h is the height of the
barometer in metres above sea level and T is the air temperature at station level (0.1 ºC)
For the calculation are used monthly means of P and T. This introduces an error compared to a
reduction performed on the actual observations. The error is proportional to the difference between
‘the average P to T ratio’ and ‘the ratio of average P to average T’ (T in Kelvin). This means the
error is zero if T is constant within the period. Within a month the maximum T-range would nor-
mally be within 30 degrees. And a numerical variation of 30 is small when compared to the temper-
ature in Kelvin and the atmospheric pressure in 0.1 hPa. Therefore the error introduced by using
monthly values may be considered small.
The different station specific corrections, which have been used in the construction of the pressure
series in this report, can be seen in the following DMI publication:
DMI Technical Report 03-24: Metadata, selected climatological and synoptic stations, 1750-1996,
Copenhagen 2003 [22].
This publication can be downloaded from the publication part of DMI’s web site:
http://www.dmi.dk/dmi/dmi-publikationer.htm
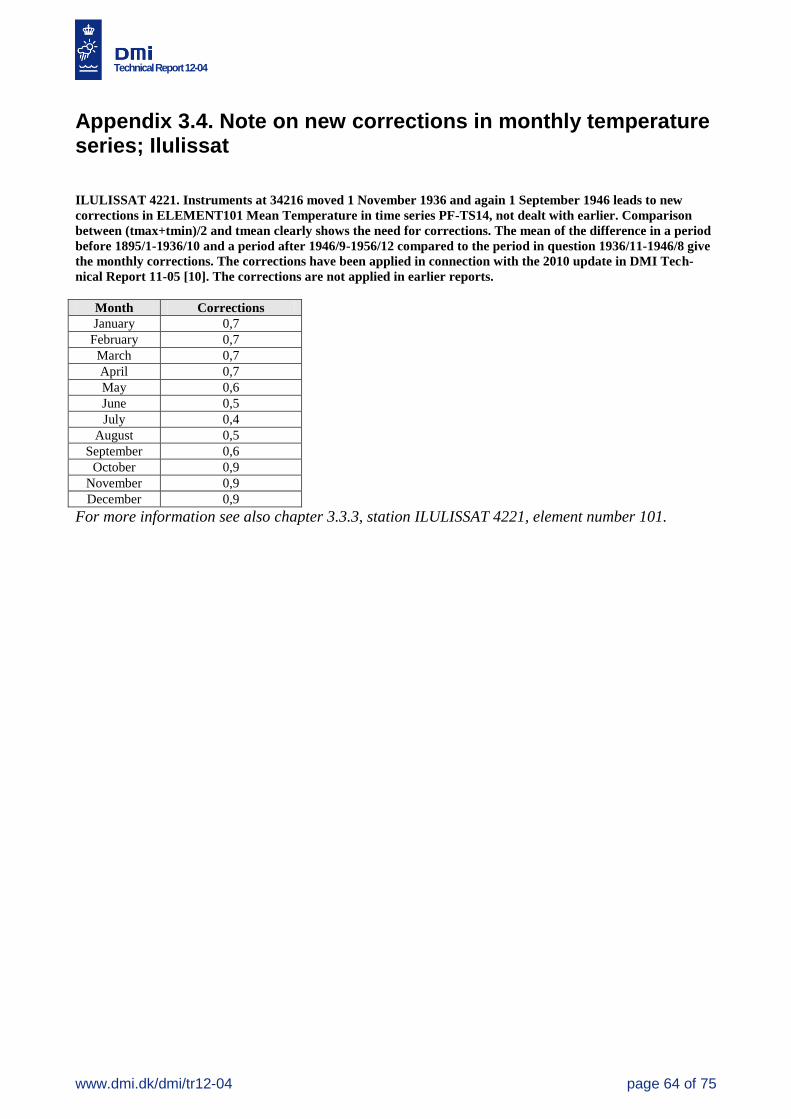
Technical Report 12-04
www.dmi.dk/dmi/tr12-04 page 64 of 75
Appendix 3.4. Note on new corrections in monthly temperature series; Ilulissat
ILULISSAT 4221. Instruments at 34216 moved 1 November 1936 and again 1 September 1946 leads to new
corrections in ELEMENT101 Mean Temperature in time series PF-TS14, not dealt with earlier. Comparison
between (tmax+tmin)/2 and tmean clearly shows the need for corrections. The mean of the difference in a period
before 1895/1-1936/10 and a period after 1946/9-1956/12 compared to the period in question 1936/11-1946/8 give
the monthly corrections. The corrections have been applied in connection with the 2010 update in DMI Tech-
nical Report 11-05 [10]. The corrections are not applied in earlier reports.
Month Corrections
January 0,7
February 0,7
March 0,7
April 0,7
May 0,6
June 0,5
July 0,4
August 0,5
September 0,6
October 0,9
November 0,9
December 0,9
For more information see also chapter 3.3.3, station ILULISSAT 4221, element number 101.
Technical Report 12-04
www.dmi.dk/dmi/tr12-04 page 65 of 75
4. Annual Section: Histori-cal DMI Data Collection
Data collection Products in the report Page
Annual Section 4.3. Mean air temperature, mean of daily minimum and
maximum temperatures and highest/lowest temperature, mean
atmospheric pressure, accumulated precipitation, highest 24-hour
precipitation, no. of days with snow cover and mean cloud cover,
10 stations: 4202 Pituffik (1948-2012), 4211 Upernavik (1873-2012),
4221 Ilulissat (1873-2012), 4250 Nuuk (1890-2012), 34262 Ivituut
(1873-1960), 4270 Narsarsuaq (1961-2012), 4320 Danmarkshavn
(1949-2012), 34339 Scoresbysund* (1924-1949), 4339 Illoqqor-
toormiut (1950-2012), 4360 Tasiilaq (1895-2012)
Section 4.4. Mean air temperature; graph and values with gauss
filtered values, 7 stations: 4202 Pituffik (1948-2012), 4221 Upernavik
(1873-2012), 4221 Ilulissat (1873-2012), 4250 Nuuk (1873-2012),
34262 Ivituut/4270 Narsarsuaq (1873-2012), 4360 Danmarkshavn
(1949-2012), 34339 Scoresbysund*/4339 Illoqqortoormiut (1924-
2012), 4360 Tasiilaq (1895-2012)
Greenland poster with mean air temperatures for the 7 stations
mentioned above is published separately
69
69
Datasamling Produkter i rapporten Sidetal
År Sektion 4.3. Middel luft-, max- og min- temperatur samt højeste og
laveste temperatur, middellufttryk, nedbørsum, max 24 t nedbørsum,
antal snedækkedage og middelskydække, 10 stationer: 4202 Pituffik
(1948-2012), 4211 Upernavik (1873-2012), 4221 Ilulissat (1873-
2012), 4250 Nuuk (1890-2012), 34262 Ivituut (1873-1960), 4270
Narsarsuaq (1961-2012), 4320 Danmarkshavn (1949-2012), 34339
Scoresbysund* (1924-1949), 4339 Illoqqortoormiut (1950-2012),
4360 Tasiilaq (1895-2012)
Sektion 4.4. Middeltemperatur som data og grafik med gauss-
filtrerede værdier, 7 stationer: 4202 Pituffik (1948-2012), 4221
Upernavik (1873-2012), 4221 Ilulissat (1873-2012), 4250 Nuuk
(1873-2012), 34262 Ivituut/4270 Narsarsuaq (1873-2012), 4360
Danmarkshavn (1949-2012), 34339 Scoresbysund*/4339 Illoqqor-
toormiut (1924-2012), 4360 Tasiilaq (1895-2012)
Grønlandsplakat med middeltemperatur for de 7 ovenstående statio-
ner udgives separat
69
69
*34339 Scoresbysund is not marked on the map. The location is nearly similar to 4339 Illooqor-
toormiut.
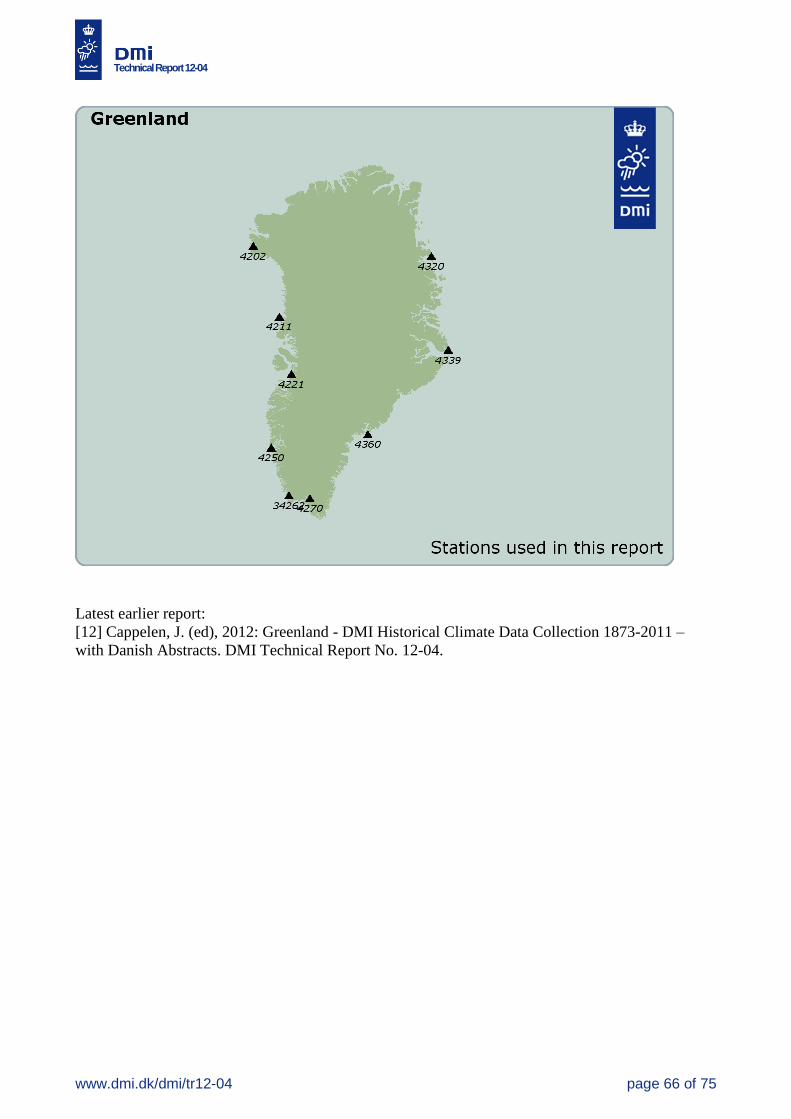
Technical Report 12-04
www.dmi.dk/dmi/tr12-04 page 66 of 75
Latest earlier report:
[12] Cappelen, J. (ed), 2012: Greenland - DMI Historical Climate Data Collection 1873-2011 –
with Danish Abstracts. DMI Technical Report No. 12-04.
Technical Report 12-04
www.dmi.dk/dmi/tr12-04 page 67 of 75
4.1. Introduction
The purpose of this chapter is to publish different annual climate data from Greenland together with
relevant graphics. That is:
Annual values within the period 1873-2012 for Greenland. The data parameters include
mean temperature, minimum temperature, maximum temperature, atmospheric pressure,
precipitation, highest 24-hour precipitation, number of days with snow and cloud cover.
Annual mean temperatures and filtered values for selected meteorological stations in Green-
land; 1873-2012, both as data and graphics.
Annual values of mean temperatures also regularly forms part of other similar publications [13,14].
The greenlandic annual data are partly an annual update (with 2012 data) of the “DMI Annual
Climate Data Collection” published for the first time in that form in DMI Technical Report 05-06:
DMI Annual Climate Data Collection 1873-2004, Denmark, The Faroe Islands and Greenland -
with Graphics and Danish Abstracts. Copenhagen 2005 [7].
The annual data sets can be downloaded from the publication part of DMI web pages.
Formålet med denne sektion er at publicere forskellige årlige klimaværdier indenfor perioden
1873-2012 samt tilhørende grafik. Det drejer sig om henholdsvis:
Årsmiddelværdier for udvalgte meteorologiske stationer i Grønland. Det omfatter middel-
temperatur, minimumtemperatur, maksimumtemperatur, atmosfærisk tryk, nedbørsum, mak-
simal 24t nedbørsum, antallet af dage med sne og skydække.
Årsmiddeltemperaturer og gauss filtrerede værdier for udvalgte meteorologiske stationer i
Grønland, både som data og grafik.
I afsnit 4.2 kan ses hvilke stationer og parametre, det drejer sig om. Årsmiddelværdierne af de
forskellige parametre kan findes sammen med de månedlige data, se sektion 3. I afsnit 4.4 er
årsmiddeltemperaturer for forskellige stationer i Vest- og Østgrønland grafisk vist sammen med
København, Danmark og Tórshavn, Færøerne. Endelig er filformatet af de medfølgende filer og
grafik beskrevet i afsnit 4.5 og 4.6.
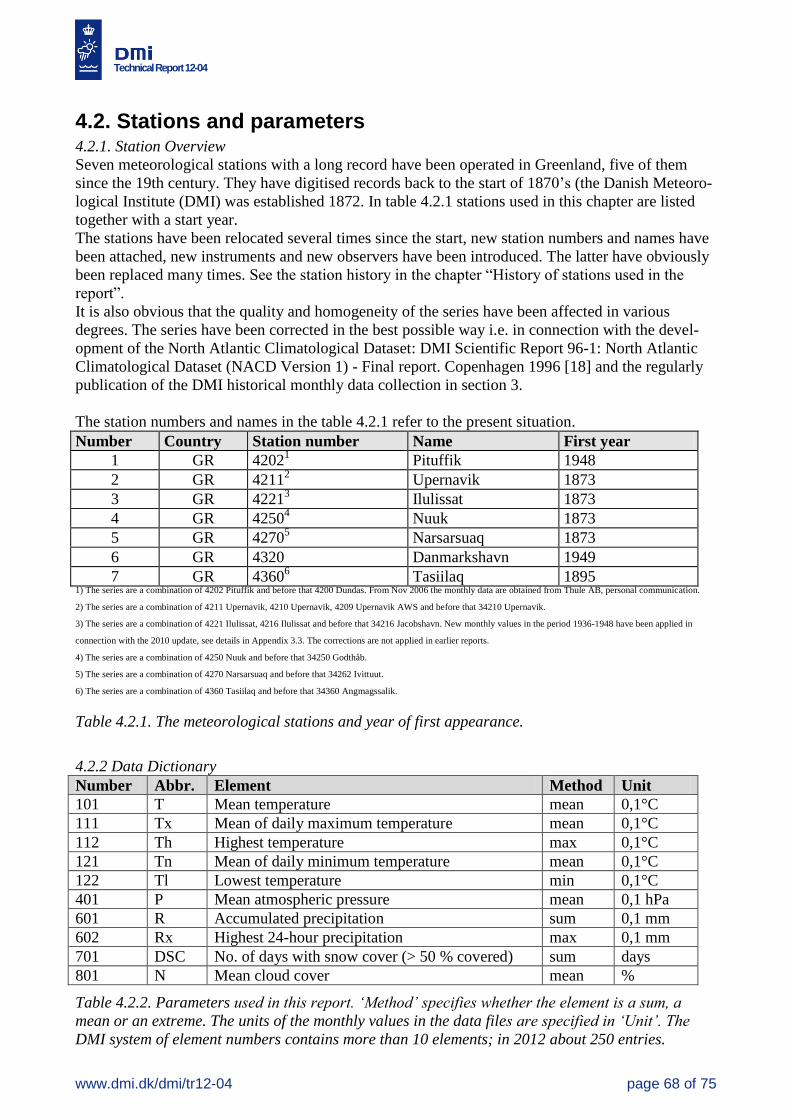
Technical Report 12-04
www.dmi.dk/dmi/tr12-04 page 68 of 75
4.2. Stations and parameters 4.2.1. Station Overview
Seven meteorological stations with a long record have been operated in Greenland, five of them
since the 19th century. They have digitised records back to the start of 1870’s (the Danish Meteoro-
logical Institute (DMI) was established 1872. In table 4.2.1 stations used in this chapter are listed
together with a start year.
The stations have been relocated several times since the start, new station numbers and names have
been attached, new instruments and new observers have been introduced. The latter have obviously
been replaced many times. See the station history in the chapter “History of stations used in the
report”.
It is also obvious that the quality and homogeneity of the series have been affected in various
degrees. The series have been corrected in the best possible way i.e. in connection with the devel-
opment of the North Atlantic Climatological Dataset: DMI Scientific Report 96-1: North Atlantic
Climatological Dataset (NACD Version 1) - Final report. Copenhagen 1996 [18] and the regularly
publication of the DMI historical monthly data collection in section 3.
The station numbers and names in the table 4.2.1 refer to the present situation.
Number Country Station number Name First year
1 GR 42021 Pituffik 1948
2 GR 42112 Upernavik 1873
3 GR 42213 Ilulissat 1873
4 GR 42504 Nuuk 1873
5 GR 42705 Narsarsuaq 1873
6 GR 4320 Danmarkshavn 1949
7 GR 43606 Tasiilaq 1895
1) The series are a combination of 4202 Pituffik and before that 4200 Dundas. From Nov 2006 the monthly data are obtained from Thule AB, personal communication.
2) The series are a combination of 4211 Upernavik, 4210 Upernavik, 4209 Upernavik AWS and before that 34210 Upernavik.
3) The series are a combination of 4221 Ilulissat, 4216 Ilulissat and before that 34216 Jacobshavn. New monthly values in the period 1936-1948 have been applied in
connection with the 2010 update, see details in Appendix 3.3. The corrections are not applied in earlier reports.
4) The series are a combination of 4250 Nuuk and before that 34250 Godthåb.
5) The series are a combination of 4270 Narsarsuaq and before that 34262 Ivittuut.
6) The series are a combination of 4360 Tasiilaq and before that 34360 Angmagssalik.
Table 4.2.1. The meteorological stations and year of first appearance.
4.2.2 Data Dictionary
Number Abbr. Element Method Unit
101 T Mean temperature mean 0,1°C
111 Tx Mean of daily maximum temperature mean 0,1°C
112 Th Highest temperature max 0,1°C
121 Tn Mean of daily minimum temperature mean 0,1°C
122 Tl Lowest temperature min 0,1°C
401 P Mean atmospheric pressure mean 0,1 hPa
601 R Accumulated precipitation sum 0,1 mm
602 Rx Highest 24-hour precipitation max 0,1 mm
701 DSC No. of days with snow cover (> 50 % covered) sum days
801 N Mean cloud cover mean %
Table 4.2.2. Parameters used in this report. ‘Method’ specifies whether the element is a sum, a
mean or an extreme. The units of the monthly values in the data files are specified in ‘Unit’. The
DMI system of element numbers contains more than 10 elements; in 2012 about 250 entries.
Technical Report 12-04
www.dmi.dk/dmi/tr12-04 page 69 of 75
4.3. Annual values 1873-2012; Greenland
Calculated annual values for the different stations in table 4.2.1 and the different parameters in table
4.2.2 can be found together with the monthly data (see section 3).
4.4. Annual mean temperatures and filtered values for seven mete-orological stations in Greenland; 1873-2012
Annual mean temperatures 1873-2012 and filtered values for seven stations in Greenland are
available as a data series and a graph. The graphs in this section show the annual mean temperatures
from selected stations from West and East Greenland together with København, Denmark and
Tórshavn, the Faroe Islands and West Greenland.
The annual mean temperature data within the period 1873-2012 for the seven meteorological
stations are the same as the annual values for parameter 101 Mean Temperature mentioned in
section 4.3. There can be annual values (interpolated) for certain years in the annual data files,
despite they are missing in the calculation (due to missing months) described in chapter 4.3.
A Gauss filter with filter width (standard deviation) 9 years has been used to create the “bold”
smooth curves. A Gauss filter with standard deviation 9 years is comparable to a 30-years running
mean. However, the filter gives a smoother curve than a running mean, as temperatures from central
years are given larger weight than temperatures from periferal years. Filter values are also calculat-
ed for the years at either end of the series. It should be noted that these values are computed from
one-sided Gauss filters, and that values from later years will change, when the series is updated.
Important note: 2010 in West Greenland was extremely record breaking warm many places and the
usual graphics are not tuned to deal with such extreme values. A better graphic presentation can be
seen in a poster showing “Annual mean temperatures 1873-2012, Greenland” (Tr13-
04_gr_temperatur_1873_2012_plakat.pdf); se section 4.6. The following record breaking annual
2010 average temperatures (normal 1961-90) can also help in the interpretation: Pituffik -7.9°C,
Upernavik -3.1°C, Ilulissat -0.1°C, Nuuk 2.6°C, Narsarsuaq 5.4°C. Tasiilaq 1.1°C was the second
warmest in 2010 and Danmarkshavn with -11.3°C in northeast Greenland, ended in the warm end of
the scale, but not near the record.
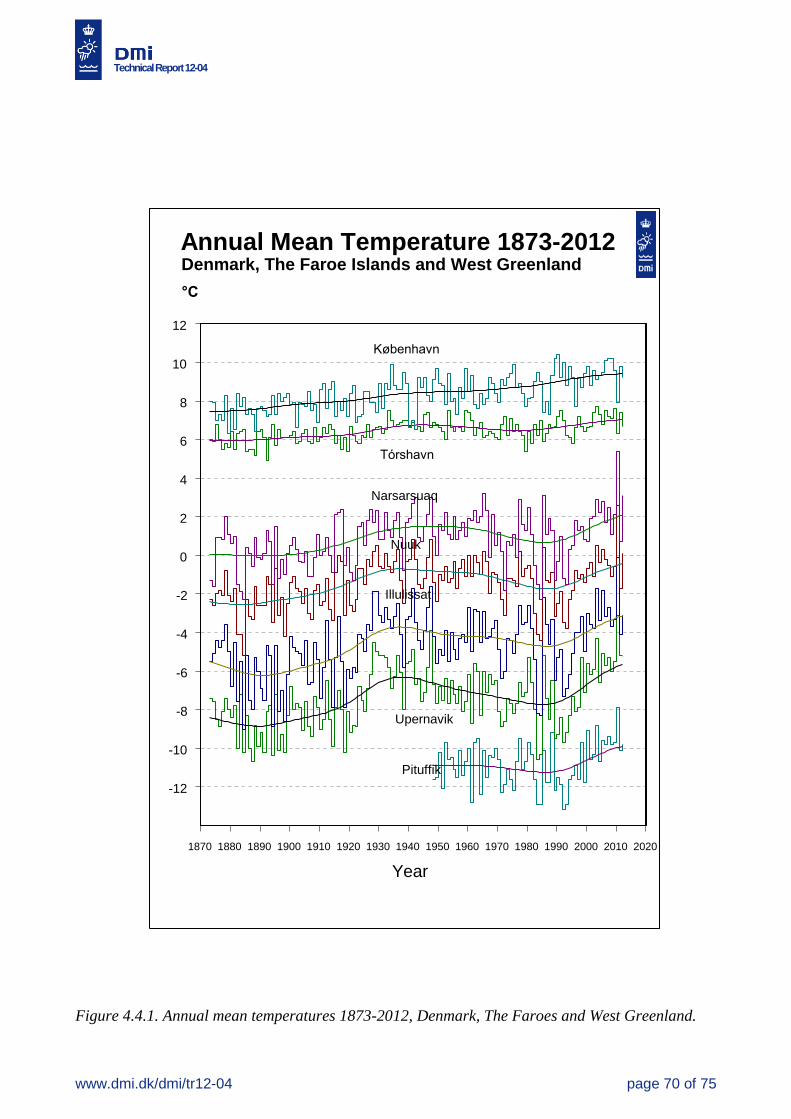
Technical Report 12-04
www.dmi.dk/dmi/tr12-04 page 70 of 75
1870 1880 1890 1900 1910 1920 1930 1940 1950 1960 1970 1980 1990 2000 2010 2020
Year
-12
-10
-8
-6
-4
-2
0
2
4
6
8
10
12
°C
Annual Mean Temperature 1873-2012Denmark, The Faroe Islands and West Greenland
København
Tórshavn
Narsarsuaq
Pituffik
Nuuk
Upernavik
Illulissat
Figure 4.4.1. Annual mean temperatures 1873-2012, Denmark, The Faroes and West Greenland.
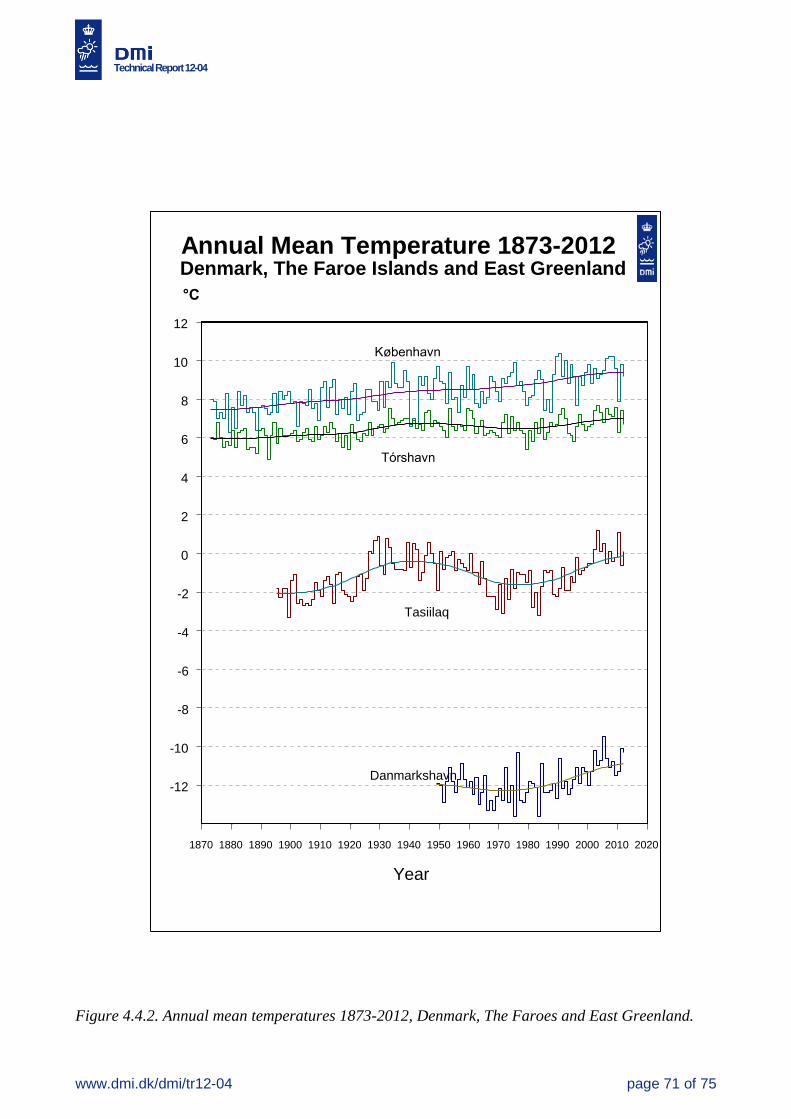
Technical Report 12-04
www.dmi.dk/dmi/tr12-04 page 71 of 75
1870 1880 1890 1900 1910 1920 1930 1940 1950 1960 1970 1980 1990 2000 2010 2020
Year
-12
-10
-8
-6
-4
-2
0
2
4
6
8
10
12
°C
Annual Mean Temperature 1873-2012Denmark, The Faroe Islands and East Greenland
København
Tórshavn
Danmarkshavn
Tasiilaq
Figure 4.4.2. Annual mean temperatures 1873-2012, Denmark, The Faroes and East Greenland.
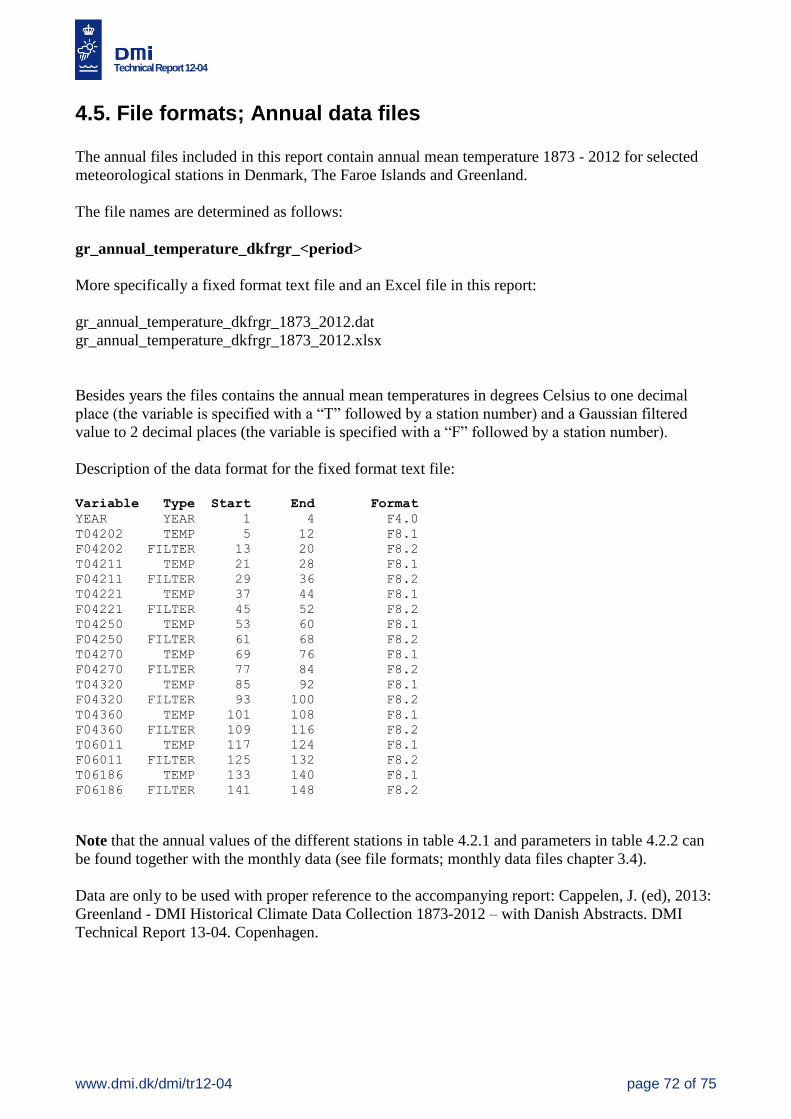
Technical Report 12-04
www.dmi.dk/dmi/tr12-04 page 72 of 75
4.5. File formats; Annual data files
The annual files included in this report contain annual mean temperature 1873 - 2012 for selected
meteorological stations in Denmark, The Faroe Islands and Greenland.
The file names are determined as follows:
gr_annual_temperature_dkfrgr_<period>
More specifically a fixed format text file and an Excel file in this report:
gr_annual_temperature_dkfrgr_1873_2012.dat
gr_annual_temperature_dkfrgr_1873_2012.xlsx
Besides years the files contains the annual mean temperatures in degrees Celsius to one decimal
place (the variable is specified with a “T” followed by a station number) and a Gaussian filtered
value to 2 decimal places (the variable is specified with a “F” followed by a station number).
Description of the data format for the fixed format text file:
Variable Type Start End Format
YEAR YEAR 1 4 F4.0
T04202 TEMP 5 12 F8.1
F04202 FILTER 13 20 F8.2
T04211 TEMP 21 28 F8.1
F04211 FILTER 29 36 F8.2
T04221 TEMP 37 44 F8.1
F04221 FILTER 45 52 F8.2
T04250 TEMP 53 60 F8.1
F04250 FILTER 61 68 F8.2
T04270 TEMP 69 76 F8.1
F04270 FILTER 77 84 F8.2
T04320 TEMP 85 92 F8.1
F04320 FILTER 93 100 F8.2
T04360 TEMP 101 108 F8.1
F04360 FILTER 109 116 F8.2
T06011 TEMP 117 124 F8.1
F06011 FILTER 125 132 F8.2
T06186 TEMP 133 140 F8.1
F06186 FILTER 141 148 F8.2
Note that the annual values of the different stations in table 4.2.1 and parameters in table 4.2.2 can
be found together with the monthly data (see file formats; monthly data files chapter 3.4).
Data are only to be used with proper reference to the accompanying report: Cappelen, J. (ed), 2013:
Greenland - DMI Historical Climate Data Collection 1873-2012 – with Danish Abstracts. DMI
Technical Report 13-04. Copenhagen.
Technical Report 12-04
www.dmi.dk/dmi/tr12-04 page 73 of 75
4.6. File formats; Annual graphics
Annual graphics included in this report contain graphs showing annual mean temperatures 1873-
2012 for selected stations from West and East Greenland together with Tórshavn at The Faroe
Islands and København, Denmark. The graphs are available in a Danish and English version and
also in a larger version as a poster (only Danish version).
The file names are determined as follows:
gr_annual_temperatur_side_<sidetal>_<periode>_<sprog>.pdf
gr_annual_temperature_page_<page number>_<period>_<language.pdf
More specifically a number of pdf files (Danish and English versions) in this report:
gr_annual_temperatur_side1_1873_2012_dk.pdf:
Annual mean temperatures 1873-2012 Denmark, The Faroe Islands and West Greenland (Danish version)
gr_annual_temperatur_side2_1873_2012_dk.pdf:
Annual mean temperatures 1873-2012 Denmark, The Faroe Islands and East Greenland (Danish version)
gr_annual_temperature_page1_1873_2012_eng.pdf:
Annual mean temperatures 1873-2012 Denmark, The Faroe Islands and West Greenland (English version)
gr_annual_temperature_page2_1873_2012_eng.pdf:
Annual mean temperatures 1873-2012 Denmark, The Faroe Islands and East Greenland (English version)
gr_annual_temperatur_side1_1873_2012_plakat.pdf:
Annual mean temperatures 1873-2012 Denmark, The Faroe Islands and West Greenland (Danish poster)
gr_annual_temperatur_side2_1873_2012_plakat.pdf:
Annual mean temperatures 1873-2012 Denmark, The Faroe Islands and East Greenland (Danish poster)
gr_annual_temperatur_1873_2012_plakat.pdf:
Annual mean temperatures 1873-2012, Greenland (Danish poster)
Data are only to be used with proper reference to the accompanying report: Cappelen, J. (ed), 2013:
The Faroe Islands - DMI Historical Climate Data Collection 1873-2012 – with Danish Abstracts.
DMI Technical Report 13-04. Copenhagen.
Technical Report 12-04
www.dmi.dk/dmi/tr12-04 page 74 of 75
References [1] ACCORD, Atmospheric Circulation Classification and Regional Downscaling. See the Internet
site http://www.cru.uea.ac.uk/cru/projects/accord/ for particulars.
[2] Brandt, M. L. (1994): The North Atlantic Climatological Dataset (NACD). Instrumenter og
rekonstruktioner. En illustreret gennemgang af arkivmateriale. DMI Technical Report 94-19.
København.
[3] Brandt, M. L. (1994): Summary of Meta data from NACD-stations in Denmark, Greenland and
the Faroe Islands 1872-1994. DMI Technical Report 94-20. Copenhagen.
[4] Brandt, M. L. and T. Schmith (1994): Correction, reduction and Homogenization of Barometer
Records. DMI Technical Report 94-22. Copenhagen.
[5] Brødsgaard, B. (1992): Stationshistorie i Grønland: dokumenteret for 5 klimastationer. DMI
Technical Report 92-02. Copenhagen.
[6] Cappelen, J. et al. (2000): The Observed Climate of Greenland, 1958-99 – with Climatological
Standard Normals, 1961-1990/Klimaobservationer i Grønland, 1958-99 – med klimanormaler 1961-
90. DMI Technical Report 00-18. Copenhagen.
[7] Cappelen, J. (2005): DMI annual climate data collection 1873-2004, Denmark, The Faroe
Islands and Greenland - with Graphics and Danish Abstracts. DMI Technical Report 05-06: Copen-
hagen.
[8] Cappelen, J., Laursen E. V., Kern-Hansen, C. (2008): DMI Daily Climate Data Collection 1873-
2007, Denmark, The Faroe Islands and Greenland - including Air Pressure Observations 1874-2007
(WASA Data Sets). DMI Technical Report 08-05. Copenhagen.
[9] Cappelen, J., 2011: DMI Annual Climate Data Collection 1873-2010, Denmark, The Faroe
Islands and Greenland - with graphics and Danish summary. DMI Technical Report 11-04. Copen-
hagen.
[10] Cappelen, J. (ed), 2011: DMI monthly Climate Data Collection 1768-2010, Denmark, The
Faroe Islands and Greenland. DMI Technical Report 11-05. Copenhagen.
[11] Cappelen, J. (ed), 2011: DMI Daily Climate Data Collection 1873-2010, Denmark, The Faroe
Islands and Greenland - including Air Pressure Observations 1874-2010 (WASA Data Sets). DMI
Technical Report 11-06. Copenhagen.
[12] Cappelen, J. (ed), 2012: Greenland - DMI Historical Climate Data Collection 1768-2011. DMI
Technical Report No. 12-04.
[13] Cappelen, J. (ed) (2013): Denmark - DMI Historical Climate Data Collection 1768-2012 - with
Danish Abstracts. DMI Technical Report 13-02. Copenhagen.
[14] Cappelen, J. (ed) (2013): The Faroe Islands - DMI Historical Climate Data Collection 1873-
2012 - with Danish Abstracts. DMI Technical Report 13-05. Copenhagen.
[15] Cappelen, J. (ed) (2013): Weather observations from Greenland 1958-2012.
Technical Report 12-04
www.dmi.dk/dmi/tr12-04 page 75 of 75
Observation data with description. DMI Technical Report 13-11. Copenhagen.
[16] Danish Climate Centre, see http://www.dmi.dk/dmi/en/index/klima/danish_climate_centre.htm.
[17] Drebs A., Hans Alexandersson, Povl Frich, Eirik J. Førland, Trausti Jónsson, Heikki Tuomen-
virta (1998): REWARD: -Relating Extreme Weather to Atmospheric Circulation using a Regional-
ised Dataset. Description of REWARD data set, Version 1.0. Det Norske Meteorologiske Institutt
KLIMA Report no: 16/98. Oslo.
[18] Frich, P. (Co-ordinator), H. Alexandersson, J. Ashcroft, B. Dahlström, G. Demarée, A. Drebs,
A. van Engelen, E.J. Førland, I. Hanssen-Bauer, R. Heino, T. Jónsson, K. Jonasson, L. Keegan, P.Ø.
Nordli, Schmith, T. Steffensen, H. Tuomenvirta, O.E. Tveito, (1996): NACD, North Atlantic
Climatological Dataset (NACD Version 1) - Final Report. DMI Scientific Report 96-1. Copenhagen.
[19] Jørgensen, P. V. (2002): Nordic Climate Data Collection 2001. An update of: NACD, RE-
WARD, NORDKLIM and NARP datasets, 1873-2000. Version 0. DMI Technical Report 01-20.
Copenhagen.
[20] Jørgensen, P. V. and Laursen, E.V. (2003): DMI Monthly Climate Data Collection 1860-2002,
Denmark, The Faroe Island and Greenland. An update of: NACD, REWARD, NORDKLIM and
NARP datasets, Version 1. DMI Technical Report 03-26. Copenhagen.
[21] Laursen, E. V. (2002): Observed daily precipitation, maximum temperature and minimum
temperature from Ilulissat and Tasiilaq, 1873-2000. DMI Technical Report 02-15. Copenhagen.
[22] Laursen, E. V. (2003): Metadata, Selected Climatological and Synoptic Stations, 1750-1996.
DMI Technical Report 03-24. Copenhagen.
[23] Laursen, E. V. (2003): DMI Monthly Climate Data, 1873-2002, contribution to Nordic Arctic
Research Programme (NARP). DMI Technical Report 03-25. Copenhagen.
[24] Laursen, E. V. (2004): DMI Daily Climate Data Collection, 1873-2003, Denmark and Green-
land. DMI Technical Report 04-03. Copenhagen.
[25] Lysgaard, L., 1969: Foreløbig oversigt over Grønlands klima i perioderne 1921-50, 1951-60 og
1961-65. Det Danske Meteorologiske Institut, Meddelelser nr. 21. København.
[26] NACD, North Atlantic Climatological Dataset. See (Frich et al. 1996 [18]).
[27] Schmith, T., H. Alexandersson, K. Iden and H. Tuomenvirta (1997). North Atlantic-European
pressure observations 1868-1995 (WASA dataset version 1.0). DMI Technical report 97-3. Copen-
hagen.
[28] WASA: ’The impact of storms on waves and surges: Changing climate in the past 100 years
and perpectives for the future’. See the project report: Schmith et al. 1997 [27].
Previous reports Previous reports from the Danish Meteorological Institute can be found on:
http://www.dmi.dk/dmi/dmi-publikationer.htm