SUSTAINING URBAN GROUNDWATER-FED WATER SUPPLIES
AND SANITATION SYSTEMS IN AFRICA
KISUMU FACT FINDING MISSION REPORT
A Report on Sensitization and Fact finding Mission in Kisumu from 2nd
to 6th
June 2015
PREPARED BY THE KENYA TEAM
Prof. Daniel Olago, Dr. Simeon Dulo, & Mr. Japhet Kanoti
JUNE 2015
Funded by: The Royal Society – DFID Capacity Building Initiative for Africa -Network Grant
Award (AN130031)

1
TABLE OF CONTENS
1.1. Introduction to the Project............................................................................................................. 1
1.2. The common scientific objectives are: .......................................................................................... 1
1.3. Facts finding mission .................................................................................................................... 2
1.4. List of Officers met ....................................................................................................................... 3
1.5. Introduction to Kisumu County .................................................................................................... 3
1.6. Topography and climate................................................................................................................ 4
1.7. Soils............................................................................................................................................... 6
1.8. Communication ............................................................................................................................. 6
1.9. Land and land use ......................................................................................................................... 6
1.10. Water resources ......................................................................................................................... 6
1.11. Demographics ........................................................................................................................... 6
1.12. Access to water ......................................................................................................................... 7
1.13. Water quality ........................................................................................................................... 10
1.14. Liquid and solid waste disposal .............................................................................................. 11
1.15. Conclusion .............................................................................................................................. 12
References ................................................................................................................................................... 14
ANEX 1 LIST OF SOME BOREHOLES IN KISUMU (Source: NAWARD DATABASE) ................... 15
LIST OF TABLES
Table 1: Kisumu County surface area (UN-HABITAT, 2008) ..................................................................... 4
Table 2: Altitude and climatic data for Kisumu (UN-HABITANT, 2008) ................................................... 5
Table 3: Population distribution and density by Constituency (KNBS, 2013; majidata 2015)................. 7
Table 4: Main community water supplies in Kisumu (KCIDP 2013) .......................................................... 7
Table 5: Gazetted water supplies in Kisumu (KCIDP, 2013) ....................................................................... 8
Table 6: Water access in Kisumu County and time taken to fetch water (KCIDP, 2013: majidata 2015) .. 9
Table 7: Distribution of Households by main water sources (%) (KCIDP 2013; majidata 2015) .............. 10
Table 8: community distribution by type of main toilet and waste disposal facilities (KCIDP 2013) ....... 12
Table 9: Prevalence of main diseases in Kisumu (KCIDP 2013) ............................................................... 12
LIST OF MAPS
Map 1: The extent of Kisumu urban and Peri-urban areas (County Planning office 2015) .......................... 4
1
SUSTAINING URBAN GROUNDWATER-FED WATER SUPPLIES AND SANITATION
SYSTEMS IN AFRICA
1.1. Introduction to the Project
The urban/peri-urban Kisumu aquifer supplies water to areas not served by the urban water supply from
Lake Victoria and Kajulu water intakes. The groundwater acts as a strategic reservoir during drought. It is
of major economic importance to the region providing supplementary or emergency water for domestic
and industrial use. The Kisumu aquifer lies south of the equator on the Nyanzian craton. The study area is
bounded to the north by the Nyando fault-scarp running parallel to the Equator, in the east by the volcanic
masses of Tinderet, and to the south by thick and deeply eroded lava flows that wedge out towards the
Kendu Bay, Homa Bay and the lake.
The overall aim of the project is to develop the scientific evidence required to inform policies and
practices that sustain the quantity and quality of urban, low-cost water supply and sanitation systems. The
study involves a network of consortium that form a network of Urban Groundwater Observatories
comprising a town (Lukaya, Uganda), a city (Kisumu, Kenya), and mega-city (Dakar, Sénégal) – figure
below.
1.2. The common scientific objectives are:
1. To map and characterize urban aquifers, well catchments, sanitation facilities, and groundwater
supply coverage and use for the respective cities;
2. To analyze aquifer dynamics, surface-groundwater interaction, and vulnerability of the aquifers to
point and non-point source pollution; and
2
3. To quantitatively assess the impact of different low-cost, sanitation strategies on urban
groundwater;
4. To build capacity to assess, manage, and sustain urban groundwater systems.
1.3. Facts finding mission
The main objective of this fieldwork was to identify the key stakeholder and collaborators, and to gather
baseline information for sustaining urban groundwater-fed water and sanitation systems in Africa Project
under the Royal Society – DFID capacity building initiative for Africa funding.
A sensitization and facts finding mission to Kisumu was undertaken to gather baseline information on the
existing key stakeholders in the project and to create inventory of likely information and data that each
stakeholder can provide. In addition, the following was undertaken during the reconnaissance survey:
Introducing the project and explaining the objectives of the project to key collaborators on the
ground.
Consultation with the management of the County water offices, WRMA regional office and the
LVSWSB aimed identifying sources of relevant data and information.
Getting to know the location of relevant field (regional) offices (if existing).
Collecting first-level information on existing definition of Kisumu City and locations of peri-urban
dwellings (including existing maps if available) and the definition of the slums.
Collecting preliminary information on some issues pertaining to water and sanitation in Kisumu
(surface and groundwater resources and suppliers).
The fact finding mission included the following personnel from the University of Nairobi:
1. Prof. Daniel Olago – Team Leader
2. Dr. Simeon Dulo
3. Mr. Japhet Kanoti
4. Mr Mike Mbugua - Driver
The key offices visited were:
1. Town Planning Department offices – To gather information on the existing boundaries of Kisumu
Urban and Peri-urban areas. The team had a meeting with the Deputy Manager, Town Planning
Department and she provided us with a map showing Kisumu administrative boundaries.
2. Kisumu Water and Sewerage Company (KIWASCO). This is the body mandated to supply water
and offer sewerage services in the region. It also sub-contracts other water service providers in
Kisumu.
3. Lake Victoria South Regional Offices of WRMA – Water Resources Management Authority.
This body manages water resources and authorizes water abstraction and borehole drilling in the
Lake Victoria Administrative region according to the Water Act 2002.
4. Lake Victoria South Water Services Board. This is body responsible for provision of water and
sewerage infrastructure in the region, and licensing water service providers.
5. Kisumu County Director of Water. This is the office responsible for water policy formulation at
county level.

3
6. Majidata website. MajiData is an initiative of the Kenyan Water Sector and provides information
on water and sanitation issues in urban low income areas.
In addition to the above listed offices, the team visited surface water intake in Dunga and the newly
constructed intake in Kajulu near the Nyando Escarpment.
1.4. List of Officers met
Below is a list of key officers visited during the fact finding mission
1. Mr. George Odera – KIWASCO – Production Manager, Kajulu Water Intake.
2. Ms. Muthoni Orlale – Town Planning Department – Deputy Manager, Town Planning
Department.
3. Mr. Enock S. Wanyonyi – WRMA – Deputy Technical Coordination Manager.
4. Mr. Leonard Mashafu – WRMA – Assistant Technical Coordination Manager, Groundwater.
5. Mr. G. Koyier – County Water Office – Chief Officer.
6. Mr. Hesbon Opuko – County Water Office – Director, Infrastructure Development.
7. Mr. John Owenga – County Water Office – Director, Water Services.
The above visited officers were given a brief introduction to the project that is scheduled for official
launch in Dakar, Senegal in August/September, and the areas targeted in Kisumu by this project. These
are the Urban and Peri-urban areas including Manyatta, Otongolo, Migosi and Nyalenda. It emerged
during the meetings that there was need to formally provide the key stakeholders’ with information about
the Project and the likely role each would play to make the project a success.
1.5. Introduction to Kisumu County
Kisumu County is one of the 47 Counties in Kenya. It lies within longitudes 33° 20’E and 35° 20’E and
latitudes 0° 20’South and 0° 50’South (KCIDP 2013). The County is bordered by Homa Bay County to
the South, Nandi County to the North East, Kericho County to the East, Vihiga County to the North West
and Siaya County to the West. The County covers a total land area of 2009.5 km2 and another 567 km
2 is
covered by water. The county has a large area of wetlands, i.e. the Singida Wetland in Nyando.
The people who live around the wetlands are affected by regular flooding.
Politically, Kisumu County has seven sub-counties namely: Muhoroni, Nyakach, Nyando, Kisumu East,
Kisumu Central, Kisumu West and Seme. These sub counties are also constituencies (IEBC 2013). The
County can be divided broadly into the following categories: urban (town center), informal settlements
(slums surrounding the town center), and peri-urban areas located on the outskirts of the Township. The
settlement areas/estates include Bandani, Kamenya lower, Kibos, Lumumba, Makasembo, Mamboleo,
Milimani, Migosi, Manyatta, Nyalenda, Nyamasaria, Nyawita, Obunga, Ondiek and Robert Ouko estates.
Apart from the Kisumu City, the following have been categorized as urban areas within the County:
Ahero, Maseno, Kombewa, Awasi, Holo, Chemilil, Muhoroni, Katito, Pap Onditi and Sondu (KCIDP
2013)

4
The
Map 1: The extent of Kisumu urban and Peri-urban areas (County Planning office 2015)
Table 1: Kisumu County surface area (UN-HABITAT, 2008)
County Area:
Total area Km2 2,085.90
Water mass Km2 567
National Parks/Reserves 2
Arable land 1,342
Non-arable land 209
Total urban areas 40
No. of towns 8
1.6. Topography and climate
The county can be divided into three topographical zones namely: the Kano Plains, the upland area of
Nyabondo Plateau and the midland areas of Maseno. The Kano Plains lie on the floor of the Rift Valley at

5
an altitude of about 1,100m and is a flat stretch bordered to the North and East by the Nyando
escarpment, while the upland area comprise ridges which rise gently to an altitude of 1,835m above sea
level.
The mean annual maximum temperature ranges between 25°C to 35°C and the mean annual minimum
temperature ranges between 9°C to 18°C (KCIDP 2013). Kisumu has two rainy seasons and the long rains
occur between March and May and the short rains between September and November. During the short
rains the average annual rainfall ranges between 450mm and 600mm. Rainfall data indicates that the
county largely receives substantial rainfall during long rains. For example, Maseno has a mean annual
rainfall of 1,630mm, Kisumu 1,280 mm, Ahero 1,260 mm, Kibos 1,290 mm, Muhoroni 1,525 mm, and
Koru 1,103 mm (UN-HABITANT, 2008).
Table 2: Altitude and climatic data for Kisumu (UN-HABITAT, 2008)
Topography and climate
Lowest altitude (metres) 1,100
Highest 1,835
Temperature range (°C)
High 25 - 35
Low 9 - 18
Rainfall (mm)
High 1,800
Low 1,000

6
1.7. Soils
The soils in Kisumu are dominated by lake sediments that consist of sand and clay soils. In the Kano
Plains, the soils are dark brown and grey, a r e poorly drained and are generally very deep and firm.
In the western part of Kano Plains t h e s o i l s are dark cotton soils commonly associated with
the swamps (KCIDP 2013). These types constitute more than 70 per cent of all soil types found in
Kisumu County. The soils are suitable for brick making and sand harvesting especially at Maseno and
Nyakach.
1.8. Communication
The C o u n t y h a s a total length of tarmac road of about 286km, gravel surface (about 725.6km)
and earth surface (about 956.6km). The county is traversed by the main trunk road (B1) linking Nairobi
to Kampala, Uganda through Busia. The Trans-African Highway (A1) links Kisumu to Tanzania
through Kisii and an alternative route to Tanzania from Kisumu is through Homa Bay. There are
several tarmacked roads linking the county to Western Kenya towns like Kakamega, Nandi Hill,
Kapsabet, Eldoret, Bungoma and Kitale among others. The county has Kisumu International Airport that
is the busiest airport in Western Kenya and the third busiest airport in the country (KCIDP,
2013).Kisumu is well served by postal, mail and telephony services with major service providers having
offices and outlets within the city.
1.9. Land and land use
The mean land holding size in the county is 1.6 acres while the mean agricultural parcel is 1.0 acres
(KCIDP, 2013). The main crops grown for subsistence include beans, maize, sorghum, finger millet,
potatoes, groundnuts, kales and cotton. The main cash crop is sugarcane while some rice growing is
practiced along Rivers Nyando, Awach, Chemelil, Miwani and Kibos.
1.10. Water resources
Three major rivers flow through the county into the Winam Gulf namely. These are the Nyando, Kibos
and Sondu (KCIDP 2013) to the south and the Kisian, and Awach Seme to the north (WRMA). These
rivers are heavily silted, resulting in the extensive formation of lakeside swamps. The Kano Plains is
vulnerable to flooding during heavy rains especially the lower Kano Plains and in particular low lying
areas of Nyando. The county has a long shoreline along Lake Victoria. This shoreline is 90 km long and
has more than 17 beaches.
1.11. Demographics
The population of Kisumu County according to 2009 population and housing census was 968,879
comprising of 474,687 males and 494,222 females spread over the seven sub counties (Majidata

7
website). This population is estimated to increase to 1,264,661 by 2015 assuming an annual population
growth of 2.7% as adopted by the World Bank.
Table 3: Population distribution and density by Constituency (KNBS, 2013; Majidata 2015)
Sub-county
2009 (Census) 2012 (Projected) 2015 (Projected) 2017 (Projected)
Population Density Population Density Population Density Population Density
Kisumu
East
150,124 1,105 159,895 1,177 170,293 1,253 177,608 1,307
Kisumu
West
131,246 616 139,789 656 148,879 699 155,274 729
Kisumu
Central
168,892 5,165 179,885 5,501 191,582 5,859 199,812 6,111
Seme 98,805 519 105,236 553 112,079 589 116,894 614
Nyando 141,037 341 150,217 363 159,985 387 166,857 403
Nyakach 133,041 372 141,700 396 150,915 422 157,397 440
Muhoroni 145,764 218 155,252 232 165,347 247 172,449 258
Total 968,879 482 1,031,973 513 1,099,079 547 1,146,290 570
1.12. Access to water
The water supply in the city is privatized in line with the requirements of the Water Act 2002, and the
Kisumu Water and Sewerage Company (KIWASCO) is the sole water utility in the city. There are some
CBO/NGO-instigated water projects that are sub-contracted by KIWASCO and supply water to the
informal settlements. There are 16 active water based NGOs doing a number of projects in the county.
These include: World Vision, Care Kenya, Practical Action, Plan International, Millennium Cities
Initiatives, Umande Trust, Kisumu Urban Project, Cordaid Urban Matters, Kenya Red Cross, UNICEF,
STIPA, CSO Network, SANA, ADS-Kenya, SNV and Living Water Service Centre.
Table 4: Main community water supplies in Kisumu (KCIDP 2013)
Name of Water Supply Sub county Service Area Management Asengo Kisumu West 5km
2 C.B.O Rabuor Kisumu East 8km
2 C.B.O Wandiege Kisumu East 4km
2 C.B.O Kolal Kisumu East 4km
2 C.B.O /Govt Kadete Kisumu East 2km
2 C.B.O /Govt Kawere Nyakach 2km
2 C.B.O Olembo Nyakach 2km
2 C.B.O St. Camilus Nyando 1km
2 C.B.O /Govt Sangoro Nyakach 2km
2 C.B.O /Govt Odino Nyakach 2km
2 Private Kowi Seme 2km
2 C.B.O /Govt Mbaka Oromo Kisumu West 1km
2 C.B.O /Govt Nyabera Kisumu west 1km
2 C.B.O /Govt

8
Paga Seme 1Km2 C.B.O
The City experiences acute water shortage and only about 40% of the population have access to piped
water (Majidata). The water from Lake Victoria is treated at the Dunga Water treatment plant, located 0.6
km from the intake, and is then pumped to storage tanks in Kibuye, while the water from the Kibos River
at Kajulu is treated and then flows by gravity to storage tanks in the city. The two intakes are managed by
KIWASCO and serve the Kisumu Central sub-county. The second Water Service Provider is Gulf Water
Services Company and has four operational water supplies, namely: Kisumu rural, Maseno Kombewa,
Nyahera and Mkendwa Kanyakwar. The third Water Service Provider in Kisumu County is NYANAS
Water and Sanitation Company Limited (NYANAS WASCO) and serves Muhoroni and Nyakach.
According to County strategic plan 2013-2017, the County has a total of 10 gazetted water supplies, 15
Community water supplies, 40 Boreholes, 70 Shallow wells and 7 water pans. The major gazetted water
supplies serve a total area of 956Km2 only, with a total production of about 5,010 m
3/d. The total
population served is 25,000 directly by these water supplies. The number of storage tanks in these water
supplies range between 50m3 – 500m
3. This gives the County a total storage Capacity of 3,752m
3 with a
total pipe network covering 763km (KCIDP, 2013). This report conflict with information gathered from
the Lake Victoria South Water Services Board that indicates that the expanded Dunga Treatment Plant
stabilized water supply to the city and the installed water capacity increased to 46,000m3/day from
22,000m3/day after installation of new water pumps. Water coverage currently includes Nyamasaria,
Usoma, Manyatta, Dunga and Bandani with support from WTSF and other partners. The coverage is
likely to be accelerated in the coming years with completion of Kajulu Water Works. The Kajulu project
was funded by Government of Kenya and French Development Agency (AFD) and will increase the
current water supply from 1,700m3/day to 48,000m
3/day (LVSWSB 2015).
Table 5: Gazetted water supplies in Kisumu (KCIDP, 2013)
Name of Water Supply Sub county Status WSP Kisumu Kisumu Central Full KIWASCO Kisumu Rural Seme Full treatment Gulf Maseno Kombewa Seme/Kisumu West Full treatment Gulf Nyahera Kisumu West Partial treatment Gulf Mkendwa-kwar Kisumu West Partial Gulf Nyakach Nyakach Full NYANAS Muhoroni Muhoroni Full NYANAS Tamu Muhoroni Full NYANAS Koru Mnara Muhoroni Partial NYANAS Kibigori Muhoroni Partial NYANAS
The service delivery within the county is compromised by several factors;
High level of non- revenue water (NRW) of up to 47% for KIWASCO and higher for rural
schemes
High cost of electricity
Old and dilapidated pipelines and distribution lines
Low management capacity particularly of community managed water supply schemes

9
Poor maintenance
Inadequate financial allocation in the county budget
Lack of skilled and adequate staff to manage rural water supplies
Polluted water sources
Groundwater resources supplement surface water. The peri-urban dwellers in Kisumu suffer the most
from inequitable water provision and over 60% of informal settlements obtain their water from unsafe
sources, resulting in high rates of water- and sanitation-related disease and morbidity (UN-HABITAT,
2006).
The water problem is ironic as Kisumu is located on the shores of Lake Victoria, one of the largest fresh
water lakes in the world. Many slum dwellers are forced to buy water from vendors and normally pay
higher prices than in middle- and high income areas. As an alternative, many informal settlements
residents rely on shallow wells, which are often contaminated because of a high density of pit latrines in
the vicinity of the wells.
In recent years, several projects have been initiated to improve the water supply and sanitation in Kisumu
City. These include projects funded by the French Agency for Development (AFD or Agence Française
de Development) and the World Bank, as well as by such non-governmental organizations as World
Vision, Sustainable Aid in Africa (SANA) and Undugu Society. Some of the proposed new water
supplies include Simbi Springs in Kajulu East and Ogongo Springs in Central Kisumu, Holo in
Kisumu West, Gita-Kajulu and Kadete in Kisumu East, Ayier Gweng’ in Nyando, Kipsamwe and
Chemelil supplies in Muhoroni (Kisumu County Water and Sanitation Strategic Plan, 2015).
The main water sources in the county include; Lake Victoria, shallow wells, unprotected springs,
water pans, dam, boreholes and roof catchment systems and over 40% of households spend about 20
minutes to access safe and portable water. During the dry spell some of the water sources run dry
forcing people to travel even longer distances to fetch water. Women and children especially spend
more time in search of water. This consumes a lot of productive time and schooling hours leading to
poor educational for girls and reduced family income.
Table 6: Water access in Kisumu County and time taken to fetch water (KCIDP, 2013: Majidata 2015)
Access to water
Households with access to piped water 166,061
HH with access to potable water 67,067
Number of permanent rivers 11
No. of protected springs 14
No. of un-protected springs 10
No. of water pans 27
No. of Dams 1
No. of Bore holes 212
HH with roof catchment systems 2,362
Mean distance to nearest water point 1
Households' distribution by time taken (minutes, one way) to fetch drinking water (%)
0 19.6

10
1 – 4 27.5
5 – 14 29.3
15 – 29 12.9
30 – 59 9.1
60+ 1.6
Table 7: Distribution of Households by main water sources (%) (KCIDP 2013; Majidata 2015)
Distribution of Households by Main Water sources (%)
Piped into dwelling 3.4
Piped 21.9
Rain/harvested 0.9
Borehole 18.3
Protected well 8.3
Protected spring 2.3
Unprotected well 3.3
Unprotected spring 1.8
Stream 24.5
Jabias 0.1
Water Vendor 8.8
Pond 3.4
Dam 0.9
Lake 2.3
Others 0
A survey carried out by Majidata project (Kenyan online water and sanitation database on urban low
income areas) covering 10,556 dwellings with a population of about 186,436 in Kisumu shows that the
main source of drinking water used by the dwellings (42.5%) is piped water with connection of someone
else outside the plot and dwellings treating water for drinking was about 70%. According to WSTF
definition, the percentage of the urban population residing in low area with access to safe water in
Kisumu is about 19%.
1.13. Water quality
Water from sources such as Lake Victoria and the nearby rivers is of acceptable quality, but it requires
treatment before it is piped to consumers. Water from Lake Victoria is treated at the Dunga Water
Treatment Plant, while the water from the Kibos River is treated at Kajulu Water Treatment Plant. In the
informal settlements, although some residents have access to piped water, most residents rely on water
kiosks, handcart vendors and boreholes for their water supply. The reliance on shallow wells and
boreholes in these neighborhoods is problematic because water from these sources is of poor quality.
Kisumu City has high water tables; consequently, shallow wells are easily contaminated by overflowing
pit latrines, poor wastewater management and inadequate drainage systems. Many residents in peri-urban
areas also use water from shallow wells situated in close proximity to the pit latrines, thereby increasing
the chances of cross-contamination, especially during the rainy season, when dependency on such readily
contaminable water sources contributes to dangerous outbreaks of such diseases as diarrhea, cholera,
typhoid, dysentery and malaria (LVSWSB, 2008).

11
1.14. Liquid and solid waste disposal
The waste disposal in Kisumu is not well organised – the refuse collection efficiency is less than 20%.
Wealthier estates have their refuse collected whereas slums are largely neglected and rely on on-site
burning and open public dumping site along the streets. The city has about 10% sewerage coverage and
the slum dwellers rely on pit latrines that are overused and not adequately maintained (UN-HABITAT,
2006: Majidata 2015). Areas with access to the public sewer network include Lumumba, Makasembo,
Milimani, Ondiek and Robert Ouko. The low lying areas of Manyatta and Nyalenda have no sewer
system as they are lower than the conventional sewer.
Many dumpsites are next to residential and commercial houses and cause health problems and intolerable
living conditions. Plastic waste is a particular nuisance and blocks storm water drains during heavy rains.
Slums are the hardest hit as they have no access to safe drinking water, sanitation or sewerage facilities,
and waste collection is almost non-existent.
The main sewage treatment plant in Kisumu is the Kisat Conventional Sewage Treatment Plant that was
built in 1958. There are in addition three main private industrial wastewater treatment plants, two of
which are pre-treatment facilities only, with just one a full treatment plant. The three are Kisumu
molasses, Kisumu cotton mills and the Kenya breweries. Kisumu molasses is a full treatment plant.
Nyalenda Waste Stabilization Pond serves the eastern part of the city and is located adjacent to the
Nyalenda low-income area. This plant has not been properly maintained and is not fully operational
(LVSWSB, 2008).

12
Table 8: community distribution by type of main toilet and waste disposal facilities (KCIDP 2013)
Community distribution by type of main toilet facility (per cent)
Flush toilet 7.40%
Households with Latrines 80.1%
VIP PIT Latrine 3.10%
Covered/Uncovered Pit Latrine 77.00%
Bucket 0.10%
Other 12.40%
Community distribution by type of waste/garbage disposal (%)
Collected by local Authority 1%
Burning 25.30%
Collected by Private firm 3.90%
Garbage pit 41.40%
Public garbage heap 2.60%
Farm Garden 24.90%
Neighborhood Community group 0.20%
The most common diseases in Kisumu are HIV/AIDS, malaria, upper respiratory tract infections, water-
borne illnesses and diarrhea (Majidata 2015). HIV/AIDS prevalence rates are amongst the highest in
Kenya (15%), making HIV/AIDS the biggest health threat in the city. The reasons for Kisumu’s high
infection rates include high levels of poverty, and traditional beliefs and practices.
Table 9: Prevalence of main diseases in Kisumu (KCIDP 2013)
Five most prevalent diseases (per cent):
Malaria/fever 44.7
Diarrhoea 2.4
Stomach-ache Headache 5.3
Headache 11.2
Respiratory Diseases
Upper 0.6
Lower 3.2
Flu 5.2
1.15. Conclusion
The water sector in Kenya lacks a fully clear sector-specific policy and legal framework to operationalize
the devolution as stipulated in the Constitution. The draft Water Policy and Water Bill contain a number
of aspects that are relevant for future development of the water sector: promotion of the right to water;
ensuring sustainable provision of water services; and an enabling environment for involvement of the
private sector.
About 60 per cent of the county population lives in the informal settlements of Manyatta,
Nyalenda and Obunga where most housing facilities lack basic amenities. As a result, some
household use inappropriate waste disposal methods such as use of open spaces or polythene bags
that are disposed of at night (flying toilets). Where households use septic tanks ground water
contamination has been a challenge.
13
Reduce on disease incidences caused by unsafe drinking water through reduction the mean distances to
water points for convenience of households. The Kisumu County has ambitious plans to improve
sanitation coverage within the rural and urban centres from the current 20% to 60% by 2017 through
connection to main sewer lines and identification and construction of common septic tanks.
The county water office is also very optimistic that the new water Bill and Act under formulation will
empower the counties in provision of water and sanitation services through decentralization of service and
direct funding through the county governments. The proposed Bill and Act recognizes the following:
Right to water: The constitutional right to water is recognized.
Allocation of responsibility: County governments will be responsible for establishing water
service providers or alternative provision arrangements for urban and rural areas for both the
development and management of water services.
Definitions: The draft Bill distinguishes between “national public works” (water infrastructure of
national or strategic importance and cross-county infrastructure) and county water infrastructure.
Transfers: Provision for the transfer of assets, rights, liabilities, obligations, agreements and
other arrangements from Water Services Boards to either the County Service Providers (county
infrastructure) or the proposed Water Works Development Boards (national public works
infrastructure).
Licensing: Provision for the licensing of water service providers by a national regulator
Cost-recovery and ring-fencing: Provision of water services on a cost-recovery basis wherever
feasible and for ring-fencing of water revenues for purposes of operating and maintaining assets
and contributing to capital costs.
County water services providers: Formation of county-level water services providers, set up as
companies under the Companies Act and the merging of multiply water companies in a county
into a single county water services provider.
Skewed and sometimes unrealistic investments in water have further led to inequalities especially from
the geographical perspective. Whereas some areas have abundance of water or water points, others have
hardly any at all. This is as a result of many reasons, but perhaps the biggest influence has been the
political influence. And therefore County Governments have a moral obligation to address these
inequalities.
Kisumu County Water Supply and Urban Sewerage Strategic Plan (KWSUSSP) 2015 – 2019 recognises
that access to safe and sufficient water is considered a basic human right by the Constitution of Kenya
and the devolved system of governance tasks the counties to provide this service. This plan uses the Life
Cycle Cost Approach (LCCA) in planning focusing on the impact and sustainability, equity and inclusion
for services. Safe sanitation and hygiene behavior are linked to access to safe and sufficient water. The
plan also recognizes that water services are better managed at community, town or even at county level,
sanitation is the responsibility of the household.

14
References
KNBS and SDI, 2013. Exploring Kenya’s inequality - Pulling apart or pooling together? Kenya National
Bureau of Statistics (KNBS) and Society for International Development (SID)
KNBS, 2009. Kenya Population and Housing Census, Volume I A; Population by Administrative Units.
Kenya National Bureau of Statistics, Nairobi, Kenya.
Lake Victoria South Water Services Board (LVSWSB), 2008. Kisumu Water Supply and Sanitation
Project. Long Term Action Plan: Water Design Report. Prepared by Mouchel Parkman, J Patchett
(MP), Otieno Odongo and Partners.
Kisumu County Water Supply and Urban Sewerage Strategic Plan (KWSUSSP) 2015 - 2019
Kisumu County Integrated Development Plan (KCIDP), 2013 – 2017
Ministry of Water and Irrigation, 2009. Flood Mitigation Strategy, Nairobi, Kenya
Majidata website (http://www.majidata.go.ke )
UN-HABITAT, 2006. Kisumu Urban Sector Profile. ISBN:92-1-13831-9
WHO/UNICEF, 2010. Progress on Sanitation and Drinking Water - 2010 Update; WHO/UNICEF Joint
Monitoring Programme for Water Supply and Sanitation; ISBN 978 92 4 156395 6.
Water Services Regulatory Board, 2008. Drinking Water Quality and Effluent Monitoring Guideline.
WASREB, Nairobi, Kenya.
Water Services Trust Fund, 2011. Adequate Access, Coverage and Technical Standards (Discussion
Paper), PART I: Background Document, Nairobi, Kenya.
Water Services Trust Fund, 2011. Adequate Access, Coverage and Technical Standards (Discussion
Paper), PART II: Definitions of Adequate Access and Coverage, Nairobi, Kenya.

15
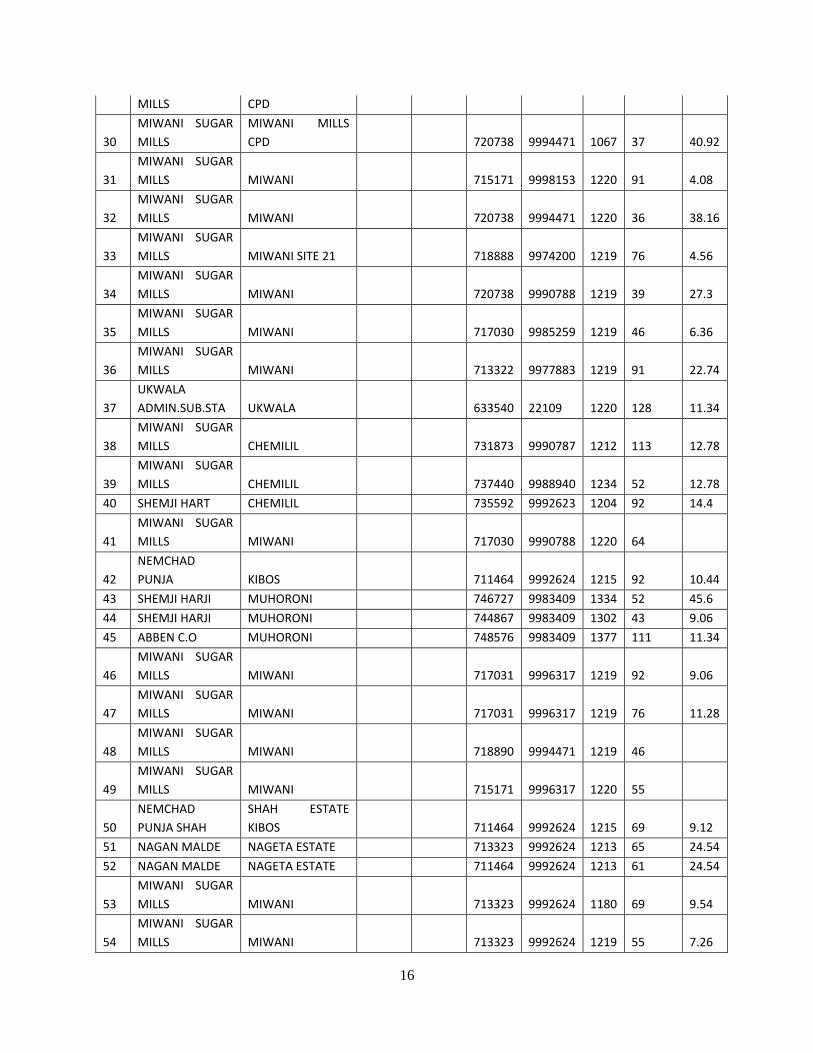
ANEX 1 LIST OF SOME BOREHOLES IN KISUMU (Source: NAWARD DATABASE)
No. OWNER LOCALITY LONGI LAT GRIDX GRIDY ALT TDEPTH YIELD
1
MASENO
UNIVERSITY SIRIBA CAMPUS 679041 9999669 1500 49 4.5
2 KIBOS SCH.BLIND KIBOS SCH. 344853 623 1150 94 8.64
3
MASENO
UNIVERSITY MASENO UNIVER. 677636 9999502 1520 39 12
4 OYUGI H CHEMELIL 360820 140 70 6
5
KORU GIRLS
SEC.SCH. KORU GIRLS' SCH 351550 201157 1420 66 6.5
6
G.T.Z.
WORKSHOP
NYANZA
HOSP.KISUMU 1180 169
7 LATANNERS LTD KIBOS 344803 410 1160 35 2.46
8
PANDALL,
HARTIT KIBOS 344944 420 1140 30 2.4
9 JAGAT, SINGH MIWANI 350008 312 1180 30 1.98
10 AMOLO, S.N MIWANI 344246 42 1220 34 2.1
11 BRAR, SARWAN NYANGETA 345354 238 1200 30 1.02
12 BRAR, HAJIT KIBOS 345033 247 1180 23 1.08
13 L.B.D.A. OMBEYI MKT. 888300 9718000 1286 150 1.8
14 L.B.D.A.
NYANDEMA
SCHOOL 60
15 HOMA LIME LTD KORU 351542 1012 1520 141 0.66
16 D.W.D KISUMU TOWN 696623 9992625 1219 128 0.48
17
MIWANI SUGAR
MILLS MIWANI 717031 9994471 1219 145 7.56
18 WALKER R.H MUHORONI 748576 9983409 1425 34 11.34
19
MIWANI SUGAR
MILLS MIWANI 717031 9996317 1219 91 22.26
20
MIWANI SUGAR
MILLS MIWANI 733732 9990787 1280 83 15.9
21 TANNET C.D CHEMILIL 739300 9992623 1285 55 2.7
22 C.M.S MISSION YALA 652096 5528 1311 122 0.48
23 D.W.D KIBOS 702189 9992624 1219 153 8.58
24 KIPTURI ESTATE MUHORONI 748576 9987092 1417 122 0.04
25
HOMA LINE
CO.LTD KORU 754144 9983408 1829 41
26
MIWANI SUGAR
ESTATE
MIWANI SUGAR
MILLS 720738 9992624 1219 107 20.1
27
MIWANI SUGAR
MILLS MIWANI 718890 9994471 1219 152 17.28
28
MIWANI SUGAR
MILLS
MIWANI MILLS
CPD 720738 9992624 1219 78 18.18
29 MIWANI SUGAR MIWANI MILLS 718890 9994471 1217 137 10.38
16
MILLS CPD
30
MIWANI SUGAR
MILLS
MIWANI MILLS
CPD 720738 9994471 1067 37 40.92
31
MIWANI SUGAR
MILLS MIWANI 715171 9998153 1220 91 4.08
32
MIWANI SUGAR
MILLS MIWANI 720738 9994471 1220 36 38.16
33
MIWANI SUGAR
MILLS MIWANI SITE 21 718888 9974200 1219 76 4.56
34
MIWANI SUGAR
MILLS MIWANI 720738 9990788 1219 39 27.3
35
MIWANI SUGAR
MILLS MIWANI 717030 9985259 1219 46 6.36
36
MIWANI SUGAR
MILLS MIWANI 713322 9977883 1219 91 22.74
37
UKWALA
ADMIN.SUB.STA UKWALA 633540 22109 1220 128 11.34
38
MIWANI SUGAR
MILLS CHEMILIL 731873 9990787 1212 113 12.78
39
MIWANI SUGAR
MILLS CHEMILIL 737440 9988940 1234 52 12.78
40 SHEMJI HART CHEMILIL 735592 9992623 1204 92 14.4
41
MIWANI SUGAR
MILLS MIWANI 717030 9990788 1220 64
42
NEMCHAD
PUNJA KIBOS 711464 9992624 1215 92 10.44
43 SHEMJI HARJI MUHORONI 746727 9983409 1334 52 45.6
44 SHEMJI HARJI MUHORONI 744867 9983409 1302 43 9.06
45 ABBEN C.O MUHORONI 748576 9983409 1377 111 11.34
46
MIWANI SUGAR
MILLS MIWANI 717031 9996317 1219 92 9.06
47
MIWANI SUGAR
MILLS MIWANI 717031 9996317 1219 76 11.28
48
MIWANI SUGAR
MILLS MIWANI 718890 9994471 1219 46
49
MIWANI SUGAR
MILLS MIWANI 715171 9996317 1220 55
50
NEMCHAD
PUNJA SHAH
SHAH ESTATE
KIBOS 711464 9992624 1215 69 9.12
51 NAGAN MALDE NAGETA ESTATE 713323 9992624 1213 65 24.54
52 NAGAN MALDE NAGETA ESTATE 711464 9992624 1213 61 24.54
53
MIWANI SUGAR
MILLS MIWANI 713323 9992624 1180 69 9.54
54
MIWANI SUGAR
MILLS MIWANI 713323 9992624 1219 55 7.26
17
55
MIWANI SUGAR
MILLS MIWANI 715171 9992624 1219 46 23.4
56
MIWANI SUGAR
MILLS MIWANI 715171 9994471 1219 61 25.56
57
SHAMJI HARJI
BROS MUHORONI 737441 9992623 1250 75 7.98
58 TURTON T.A.K SINGHOR 744868 9988939 1433 160 0.84
59
NJANGIR SINGH
ESQ MUHORONI 709604 9996318 1217 104 9.12
60
CONTRACTOR RD
PROJE AWASI SITE NO 9A 731872 9979728 1289 73 2.04
61
CONTRACTOR RD
PROJE AWASI SITE NO 7 739297 9966820 1676 154 0.24
62
CONTRACTOR RD
PROJE AWASI 739298 9972350 1676 136 6.78
63
CONTRACTOR RD
PROJE AWASI SITE NO 9C 730024 9983411 1289 187 5.88
64
MUHORONI
S.FACTORY
MUHORONI SITE
NO 2 743008 9983409 1287 133 8.64
65 D.W.D
CHEMILIL
S.FACTORY 737440 9990787 1265 327 45.48
66 D.W.D BHANJI FARM 735592 9990787 1219 246 8.64
67
ONJIKO SEC
SCHOOL AHERO 715170 9981565 1265 64 9.06
68
AHERO SEC
SCHOOL AHERO 713322 9979730 351 109 11.34
69 D.W.D TAMU TOWNSHIP 744868 9990787 1371 128 7.2
70
KISUMU COTTON
MILLS KISUMU FACTORY 694764 9988943 1160 34 3.36
71 D.W.D MUHORONI 737440 9988940 1463 91 13.56
72
REHMAT
KHANKHERDIN CHEMILIL ESTATE 737441 9994470 1265 91 16.26
73
KIBOS
INDUSTRIES KIBOS 702189 9990789 356 100 3.6
74 731873 9998153 1320 244 0.24
75
BOYA
TEC.SCHOOL AHERO 717030 9979729 1160 180 11.58
76 D.W.D PAPONDIT 715168 9963142 1173 90 3.66
77
REV.JOHN
KUNTNER WEST KANO 705897 9998153 1140 47 6.72
78
REV.JOHN
KUNTNER ORENI NYAKONGO 722597 9977882 174 2.52
79 R.R ODERO CHEMILIL 735592 9994470 30 18
80
GEM RAE
W.PROJECT KAIRO CENTRE 717029 9974200 1160 152 6.54

18
81
EAST A.SUGAR
IND. MUHORONI 741159 9987093 1415 139 13.92
82 L.B.D.A AYWYOLUORA 709603 9976037 1297 90 5.76
83 L.B.D.A OKEYO OGORO 702187 9970509 1689 147
84 L.B.D.A
KANJORIEKO
W.GROUP 722595 9968670 1492 83 2.4
85 L.B.D.A KOBUNDI SCHOOL 702187 9966826 1328 85 2.7
86 L.B.D.A URUDI SCHOOL 709602 9968672 1312 153 3.6
87 L.B.D.A NDUNGA SCHOOL 718887 9966823 1304 75 0.72
88 L.B.D.A
ST.ALLOYS SEC
SCHOOL 700328 9970509 1279 83 0.96
89 L.B.D.A 715169 9970507 1271 150 4.32
90 L.B.D.A BUGO SCHOOL 715168 9964977 1279 84 0.72
91 L.B.D.A CHERWA SCHOLL 726303 9966822 1348 150 2.52
92
OJWANG
KOBUNDO KATITO 722595 9966823 1328 78 0.72
93 L.B.D.A LOLA SCHOOL 711463 9981566 1246 6 1.08
94 L.B.D.A RABUOR 704037 9983413 1287 100 12
95 L.B.D.A 704037 9983413 1287 92 4.8
96 L.B.D.A 702189 9981566 1246 53 0.84
97 L.B.D.A 713322 9981565 1254 83 5.4
98 L.B.D.A 711463 9979730 1271 83 4.8
99 L.B.D.A 713323 9990788 1179 53 1.08
100 L.B.D.A OBIAYO SCHOOL 713322 9981565 1296 45 18
101 L.B.D.A
NYALENDA
SCHOOL 722597 9983411 1327 88 12
102 L.B.D.A MBEME VILLAGE 700328 9972356 1279 68 14.4
103 L.B.D.A ALENDU VILLAGE 702189 9983413 1312 46 18
104 L.B.D.A
KATITU BAPTIST
CHUR. 720736 9970506 1312 83 9
105 L.B.D.A AHERO GIRLS SCH. 711463 9981566 1312 90 12
106 L.B.D.A
AHERO
MULTIPURPUS 713322 9981565 1295 143 3.6
107 L.B.D.A
NYANGOMA
VILLAGE 713322 9981565 1312 197 0
108 PROF.OGADA OTHOO MARKET 722597 9983411 1304 150
109
MWAKANGA
COMM. UKUNDA DIANI 748575 9979726 1476 70
110 MKOMAZUNGA
DIANI
MKOMAZUNGA 741159 9985257 1443 163
111 L.B.D.A MUHULONI 743007 9981562 1739 105 12
112
OGANGO
WOMEN GROUP WAWIDHI 345818 1219 41
113 ISINE WOMEN WAWIDHI 345804 1148 25

19
GROUP
114
ADEDE NYOKELO
W/GR. NYANDO 345800 1222 36
115
SIANY WOMEN
GROUP NYANDO 345804 1148 25
116
NYALBIEGO
W/GROUP NYANDO 345750 1142 32
117
AYWEYO
COMM.DEV.GR. NYANDO 345820 1213 1170 34
118
KOTIENO SAMAKI
W/GR. NYANDO 350337 1000 1300 36
119
KAWA WOMEN
GROUP NYANDO 345903 1320 1160 33
120
KACHIENG
WOMEN GR. NYANDO 350213 1213 1170 30
121
KOWINO
WOMEN GROUP NYANDO 345820 853 1160 31
122
AGUMBA
WOMEN GROUP NYANDO 345853 927 1160 36
123
KODERO
WOMEN GROUP NYANDO 345902 1453 1160 32
124
KOWAGA
WOMEN GROUP NYANDO 345855 1452 30
125
AYWEYO
WOMEN GROUP NYANDO 355812 1303 1160 35
126
NYAMUNGA
WOMEN GR. WAWIDHI 350030 1140 1300 60
127
SWAN
INDUSTRIES
INDUST. AREA/
KSM. 344502 458 1150 54
128
ONURA WOMEN
GROUP WAWIDHI 345911 11353 32
129
GAME WOMEN
GROUP WAWIDHI 345840 11347 45
130 NDOLO AYAH W.SEME 64
131
E.AFRICAN SEA
FOOD INDUST AREA 344550 457 1150 60
132 PECHE FOOD AIRPORT/KSM 344452 456 1140 54
133 FISH PROCESSOR INDUST AREA 344430 458 1150 50
134 UNITED MILLERS AIRPORT/KSM 344430 458 1140 64
135 AFRO MEAT INDUST AREA 344609 415 1150 60
136
MODERN FISH
IND. INDUST AREA 344600 458 1150 72
137 K.P.A KIBOS 344800 428 1165 80
138
MAMBOLEO
SHOW GROUND MAMBOLEO 344638 402 60

20
139
KAGORO
WOMEN GROUP WAWIDHI 345814 1337 39
140
ALENDU WOMEN
GROUP WAWIDHI 345836 1308 37
141
KOWITI WOMEN
GROUP WAWIDHI 345830 1336 25
142
KAKELO WOMEN
GROUP WAWIDHI 345823 1258 28
143
CHEMELIL SUGAR
CO. CHEMELIL 350840 458 100
144
CATHOLIC D OF
KISUMU
CATHOLIC
DEV.CENTRE 1320 100 2
145
RATTA
COMMUNITY RATTA 343036 30 1460 60 1
146
MBUGRA
COMMUNITY WEST KOGUTA 340512 1945 1204 78 1.5
147
KONYANGO
MAINGA WEST KOGUTA 345200 2045 79 2.78
148 PMEU/RDWSSP SAREMBA 340443 4105 1180 43 24
149 PMEU/RDWSSP NYAMAREMBE 340427 4230 1180 46 10
150 PMEU/RDWSSP KOBONGO B 345250 2220 1340 48 3.9
151
MIWANI SUGAR
MILLS
MIWANI MILLS
CPD 717031 9996317 1219 78 6.36
152 PATEL A.N MUHORONI 744867 9983409 1306 52 9.06
153 CHRISTIE C.K SINGHOR 739300 9994470 1326 78 4.98
154
NYANZA OIL
COMPANY KISUMU TOWN 692904 9990789 1219 68 0.9
155 HOME LIME LTD KORU/MUHORONI 750435 9983409 1676 183 0.78
156
MIWANI SUGAR
MILLS MIWANI 713323 9994471 1215 46
157
MIWANI SUGAR
MILLS MIWANI 676206 9994472 1219 61 9.54
158
CONTRACTOR RD
PROJE AWASI SITE NO 9B 730024 9981564 1287 183 8.1
159
MUHORONI
S.FACTORY
MUHORONI SITE
NO 1 743008 9983409 1287 104 8.64
160
KIBOS REMAND
PRISON KIBOS 1189 113 9.54
161 S.SINGH&J.SINGH MIWANI 704038 0 1172 100 9
162 RADIER N.P KIBIGORI 1235 63 10.86
163 A.S.K
KISUMU SHOW
GROUND 80
164 L.B.D.A KIBOGO MARKET 724454 9966822 1312 68 1.44
165 L.B.D.A RAGEN KASHEM 709601 9964978 1304 90 0.72
166 L.B.D.A OBAGO SCHOOL 720738 9985258 1304 75 12

21
167 L.B.D.A KAMAGA VILLAGE 720738 9990788 1304 75 18
168 L.B.D.A OSEMBE SCHOOL 717030 9983412 1260 46 4.8
169 L.B.D.A KUSA VILLAGE 705894 9964979 1164 75 12
170 L.B.D.A LWALA SCHOOL 741160 9994470 1443 90 1.98
171 L.B.D.A
MAGUNGA
SCHOOL 702186 9961297 1263 114 4.8


![PRESENTATION TITLE REGULATIONS ON … meter to measure abstraction from a borehole – 28 August 2017 [NV] Questions Groundwater fed spring,KN3 –4 September 2017 [NV] •Contacts](https://static.cupdf.com/doc/110x72/5b007ece7f8b9a84338cb2ac/presentation-title-regulations-on-meter-to-measure-abstraction-from-a-borehole.jpg)