1
Supplementary Information:
Development of Synthetic Light-Chain Antibodies as Novel and Potent
HIV Fusion Inhibitors
Catarina CUNHA-SANTOS1, Tiago N. FIGUEIRA
2, Pedro BORREGO
1,3, Soraia S. OLIVEIRA
1, Cheila
ROCHA1,3
, Andreia COUTO1, Cátia CANTANTE
1, Quirina SANTOS-COSTA
1, José M. AZEVEDO-
PEREIRA1, Carlos M.G.A. FONTES
4, Nuno TAVEIRA
1,3, Frederico AIRES-DA-SILVA
4,5, Miguel
A.R.B. CASTANHO2, Ana Salomé VEIGA
2, and Joao GONCALVES
1
1 Research Institute for Medicines (iMed.ULisboa), Faculty of Pharmacy, Universidade de Lisboa, Lisbon, Portugal
2Instituto de Medicina Molecular, School of Medicine, University of Lisbon, Lisbon, Portugal
3ISCSEM-Centro de Investigação Interdisciplinar Egas Moniz, Instituto Superior de Ciências da Saúde Egas Moniz, Monte de
Caparica, Portugal
4CIISA-Interdisciplinary Centre of Research in Animal Health, Faculdade de Medicina Veterinária, Universidade de Lisboa,
Lisboa, Portugal
5Scientific BU Manager of TechnoAntibodies
Correspondence to João Gonçalves, iMed-Research Institute for Medicines, Avenida Prof. Gama Pinto, 1649-003 Lisbon, Portugal.
Tel: +351 217 946 400; email: [email protected]

2
SUPPLEMENTARY METHODS
N36 antigen
N36 was synthetized (Thermo Fisher Scientific) based on HIV-1 strain HXB2Env546-581 and
solubilized in 40% (v/v) DMSO at 1 mg mL-1
.
VL construction plasmids
Modified pT7-FLAG-2 plasmid (Sigma-Aldrich) with the cloning sequence from pComb3X
plasmid (ompA peptide leader to amber stop codon) inserted into HindIII/BglII sites was obtained from
Technophage, Lisboa, Portugal.
The anti-HEL VLs were generated by PCR through the CDR3 grafting of a stable rabbit dAb [1]
derived from a scFv specific for HIV-1 Vif protein [2]. VL sequence used as template was the following:
5’-GAGCTCGTGCTGACCCAGACTCCATCCTCCGTGTCTGCAGCTGTGGGGGGCACAGTCACC
ATCAATTGCCAGGCCAGTCAAAGTGTTTATAATAACAACAACTTAGCCTGGTATCAGCAGAA
ACCAGGGCAGCGTCCCAAGCTCCTGATCTATGGTGCATCCGATCTGGCATCTGGGGTCTCAT
CGCGGTTCAAAGGCAGTGGATCTGGGACACAGTTCACTCTCACCATCAGCGGCGTGCAGTGT
GCCGATGCTGCCACTTACTACTGTCAAGGCGAATTCAGTTGTGTTGGTGGTGATTGTTTTGCT
TTCGGCGGAGGGACCGAGCTGGAGATCCTA-3’. Each VL construction was originated by
assembling of two purified PCR fragments (example: CDR3 22 aa F fragment x CDR3 22 aa R fragment;
Table S1) by PCR overlap. PCR-overlap fragments were inserted into the SfiI sites of modified pT7-
FLAG-2. VL sequences were verified by DNA sequencing analysis.
Anti-HR1 VLs were cloned into the NheI/XhoI sites of pET-28a (+) (Novagen, Merck Millipore;
primers sequence in Table S1). F63 dimer with a medium linker (ML, [GGGS]2) was constructed by a
restriction/ligation strategy previously described in Oliveira et al. [3]. Briefly, two PCR fragments were
originated (F63 monomer N-terminal and F63 monomer C-terminal, Table S1), digested by NotI and
assembled together. The resulting fragment was inserted into the Nhe/XhoI sites of pET28a (+).
ELISA measurements
ELISA assays were performed as described [4]. Briefly, high-binding plates (Costar 3690,
Thermo Fisher Scientific) were coated with 1 µg of hen egg-white lysozyme (HEL; Sigma Aldrich)/BSA
or high-adsorption peptide plates (Immobilizer-amino plates, Nunc, Thermo Fisher Scientific) were

3
coated with 500 ng of N36/BSA according to manufacturer’s instructions. After blocking with PBS-BSA,
500 ng of purified VLs were added to the wells and further incubated. VLs were detected by a HRP-
conjugated anti-HA monoclonal antibody (anti-HA-HRP; Roche Diagnostics). For the competitive
ELISA, 30 pmol of VL constructions were incubated with different quantities of HEL or N36 peptide in
solution at 37 ºC. After 1 h, this mixture was added to HEL or N36-coated wells and further incubated.
For epitope mapping, immobilizer-amino plates were coated with 1 µg of each HR1 peptide from HIV-1
Clade B (MN) Env Peptide Set (NIH AIDS Reagent Program)/BSA according to manufacturer’s
instructions. After BSA-PBS blocking. 100 ng of purified VLs were added to the wells and further
incubated during 1 h at 25 °C.
Library construction and selection
Synthetic library was generated using the VL derived from the anti-Vif scFv [2] as scaffold and
accommodating a maximum of 22 aa in CDR1 and CDR3. Briefly, CDR1 randomization was first
introduced by two PCR amplifications (primers sequences in Table S1), using the DVN degenerate
codon. D codifies for bases A, G or T; V codifies for bases A, C or G and N codifies for bases A, C, G
and T. The amino acid distribution for the DVN codon can be found in CodonCalculator algorithm
(http://guinevere.otago.ac.nz/cgi-bin/aef/CodonCalculator.pl) [5]. The two PCR fragments were subjected
to PCR overlap (primer sequences in Table S1). The resulting PCR product was then submitted to a
second round of amplification to introduce the randomization in CDR3 (primers sequences in Table S1).
The final PCR product was cloned into the SfiI sites of pComb3X phagemid (provided by C. Barbas III),
designed to display recombinant proteins on the surface of filamentous phage M13 in a monovalent
format [6]. The synthetic library represented by ~8.0x10⁹ independent clones was transformed into the
amber-stop codon suppressor strain Escherichia coli (E. coli) K12 ER2738 (New England Biolabs) that
allows the expression of the synthetic VLs in fusion with phage p3 surface-protein.
Selection of VLs against HR1 peptide was performed by phage display technology, as previously
described [7]. Briefly, phages from the library were cycled through three rounds of binding selection
(pannings) against HR1-coated 96-well Immobilizer-Amino Plates (Nunc, Thermo Fisher Scientific).
Adsorption of HR1 peptide was performed according to manufacturer’s instructions, using decreasing
quantities of antigen throughout the pannings (1000 ng in the first, 750 ng in the second and 500 ng in the
third panning). Phages expressing the recombinant VLs were incubated with HR1 peptide during 2 h.

4
Washes were performed five times with PBS-Tween 20 0.05% (v/v). Bound phages were eluted with
trypsin for 30 min and then amplified in E. coli K12 ER2738 with the addition of VCSM13 helper phages
(Agilent Technologies). The third panning-selected VLs pool was cloned into previous inserted SfiI sites
of pT7-FLAG-2 expression vector and transformed into E. coli BL21 (DE3) (Invitrogen, Thermo Fisher
Scientific). For protein expression, individual clones from the third-panning were grown in round-bottom
96-well plates using the Overnight Express Auto-induction System 1 (Merck Millipore) according to
manufacturer’s instructions. After overnight expression, cells were lysed with BugBuster Protein
Extraction Reagent (Merck Millipore) and cell extracts harvested through centrifugation. ELISA
screening was performed as described above, using 500 ng of HR1 peptide as antigen. The five clones
that presented more binding to HR1 peptide over BSA were subjected to DNA sequence analysis.
To the anti-HIV screening, 1 µg of bacterial extract from the five anti-HR1 VLs selected by
phage display and ELISA were incubated with 40 000 infectious units (IU) of HIV-1NL4-3. After 3 h at 37
°C, 40 000 TZM-bl cells were infected with the HIV/inhibitors mixture. The medium was changed 3 h
after infection. At 48 h post-infection, β-galactosidase expression was quantified as described [4].
VLs expression and purification
VLparental was provided by Technophage, Lisbon, Portugal. Anti-HEL VL constructions were
transformed into E. coli strain BL21 (DE3) cells and expressed to the bacterial periplasmic space due to
the presence of OmpA leader from pComb3X plasmid. VLs were growth in 0.5 L of super broth (SB)
medium supplemented with 100 µg mL-1
ampicillin and 20 mM MgCl2 at 37 °C until OD600 of 0.9.
Protein expression was induced with 1 mM isopropyl β-D-1-thiogalactopyranoside (IPTG) and lasted for
16 h at 30 ºC. To evaluate VLs expression profile, 10 mL of each VL culture was recovered at different
time points (0, 1, 2, 6 and 16 h). Bacterial pellets were harvested by centrifugation and resuspended in 20
mM NaH2PO4 pH 7.4, 500 mM NaCl and 20 mM imidazole for purification or PBS for western-blot
supplemented with a protease inhibitors cocktail (Roche Diagnostics). Cells were lysed by sonication.
Soluble protein was purified by immobilized metal ion affinity chromatography (IMAC) using HisTrap
HP columns (GE Healthcare) coupled to an ӒKTAprime Plus protein purification system (GE
Healthcare).
E. coli Tuner (DE3) cells (Invitrogen, Thermo Fisher Scientific) were transformed with anti-HR1
VL construction plasmids. VLs were growth in 4 L of lysogeny broth (LB) medium at 37 °C until OD600
5
of 0.4. Protein production was induced with 0.2 mM IPTG and lasted for 4 h at the same temperature. The
recombinant proteins were expressed as inclusion bodies to yield a sufficient amount of protein for
downstream analysis. Bacterial pellets were collected and resuspended in 160 mL of 50 mM HEPES pH
8.0, 1 M NaCl, 10 mM imidazole and 5 mM CaCl2 previous to disruption through sonication during 30
min. The insoluble fraction was then resuspended in 80 mL of the same buffer and further disrupted by
sonication during 20 min. The inclusion bodies were collected by centrifugation, resuspended in 40 mL of
50 mM HEPES pH 78.0, 1 M NaCl, 10 mM imidazole, 2 M urea and 5 mM CaCl2 and subjected to
sonication to remove soluble contaminants. Finally, insoluble proteins were resupended in 25 mL of 50
mM HEPES pH 8.0, 1 M NaCl, 10 mM imidazole, 6 M urea, 1 mM 2-mercaptoethanol, 5 mM CaCl2 and
solubilized overnight at 4 °C with gentle agitation. Soluble denatured proteins were recovered after
centrifugation and purified by IMAC, using His GraviTrap columns (GE Healthcare) according to
manufacturer’s instructions.
Purified VLs underwent buffer exchanging (refolding in case of anti-HR1 VLs) to 20 mM
HEPES pH 7.4, 0.1 M NaCl and 5% (v/v) glycerol using PD-10 Desalting Columns (GE Healthcare)
according to manufacturer’s instructions. Purified VLs were kept at -80 °C for long-term storage or at 4
°C for up to one month with no visible aggregation or loss of function. The protein yield was measured by
Bradford method according to manufacturer’s instructions. Protein purity was as assessed by SDS-PAGE.
VLs expression and purification were analyzed by Western blot, as described [3], where 20 µg of
bacterial extract or 500 ng of purified protein were loaded into 12% Bis-Tris acrylamide gel.
Liposome preparation
Large unilamellar vesicles (LUV) with controlled size and composition were prepared as
described [8]. Formulations composed of 1-palmitoyl-2-oleyl-sn-glycero-3-phosphocholine (POPC;
AvantiAvanti Polar Lipids; Alabaster, AL, USA) and a mixture of POPC and cholesterol (Chol; Sigma-
Aldrich; St. Louis, MO, USA) in a 2:1 ratio were prepared. Each lipid formulation was first solubilized
with spectroscopic grade chloroform (Merck; Darmstadt, Germany) in a round bottom flask. A thin lipid
film was formed after solvent evaporation under nitrogen flow and then in vacuum. Rehydration with 10
mM HEPES pH 7.4, 150 mM NaCl, 5% (v/v) glycerol and a series of 8-10 freeze/thaw cycles yielded a
multilamellar vesicle (MLV) suspension. This suspension was then extruded through a 100 nm pore
polycarbonate membrane (Whatman/GE Healthcare; Kent, United Kingdom) using a LiposoFast-Basic
6
plus Stabilizer setup (Avestin; Mannheim, Germany). The resulting LUV suspension was used in
fluorescence spectroscopy experiments.
Partition experiments
A 15 mM LUV stock solution was successively added to 10 μM of either F63 or parental VL for
final concentrations ranging from 0 to 5 mM. The sample was incubated for 10 min between each
addition. The extent of sdAb partition was followed by steady state fluorescence emission performed in a
Varian Cary Eclipse spectrofluorometer (Palo Alto, CA, USA). A 280 nm radiation wavelength was used
to excite tryptophan (Trp) and tyrosine (Tyr) residues. sdAb emission profiles were collected in the range
between 300 and 450 nm. Fluorescence intensity was corrected for dilution, solvent background and light
scattering [9]. Partition constants (Kp) were determined by fitting the emission spectra integral (I) with the
partition equation [10]:
(1)
In this equation, IW and IL are the emission spectra integral of the sdAb in the aqueous and lipid phase,
respectively; γL is the lipid molar volume and [L] is the lipid concentration.
Membrane dipole potential sensing
LUV were pre-incubated with di-8-ANEPPS (Sigma-Aldrich; St. Louis, MO, USA) overnight
with agitation, to ensure efficient probe incorporation into the lipid membrane. The final probe to lipid
ratio was 1/50 (2 mol% di-8-ANEPPS relative to lipid). Assays were performed with final concentrations
of 200 μM for LUV, 4 μM for di-8-ANEPPS and 9 μM for each sdAb, assayed separately. Variations in
the membrane dipole potential were monitored by di-8-ANEPPS excitation spectra deviations.
Experiments were performed in a Varian Cary Eclipse spectrofluorometer. Spectra were collected
between 380 and 580 nm, with a fixed emission wavelength at 670 nm to avoid membrane fluidity
artifacts [9]. Excitation was corrected for solvent background noise. Controls consisted in di-8-ANEPPS-
stained LUV at the same final concentration but without the addition of the sdAb. These controls were
used to obtain the differential excitation spectra. This was possible by subtraction of the normalized
controls from normalized sample. The normalization was to the individual spectrum integral.

7
Affinity measurements
F63 binding kinetics was determined by surface plasmon resonance (SPR), using a BIAcore
2000 (BIAcore Inc.). Briefly, N36 was captured on a CM5 sensor chip (GE Healthcare) using amine
coupling at ∼1000 resonance units. Serial dilutions of F63 were injected for 4 min and allowed to
dissociate for 10 min before matrix regeneration using 10 mM glycine pH 1.5. Signal from an injection
passing over an uncoupled cell was subtracted from an immobilized cell signal to generate sensorgrams of
the amount of F63 bound as a function of time. The running buffer was used for all sample dilutions.
BIAcore kinetic evaluation software (version 3.1) was used to determine KD from the association (Ka) and
dissociation rates (Kd) using a one-to-one binding model. VLparental was used as negative control.
SUPPLEMENTARY RESULTS
Functional analysis of VLs with elongated CDR3
Evaluation of HEL targeting by each VL construction (VLCDR322, VLCDR326 and VLCDR330)
demonstrated that only VLCDR322 showed binding to HEL antigen (HEL binding was 0.86 ±0.06 for
VLCDR322 vs 0.07 ±0.03 for VL; p<0.001; Fig. 1C). Longer CDR326 and CDR330 may have result in
non-functional conformations of CDR3 or the entire VL domain. The binding presented by the
VLCDR322 was specific for HEL, not observed for BSA (Abs405 nm was 0.86 ±0.06 for HEL binding vs
0.06 ±0.04 for BSA binding; p<0.001; Fig. 1C). Additionally, VLCDR322 showed a dose-dependent
binding to HEL (EC50 was 159.5 ±1.1 nM; Fig. 1D). We also performed a competitive ELISA by
incubating VLCDR322 with soluble HEL (competitor), prior to immobilized-HEL binding, to better
characterize this VL construction specificity. As expected, VLCDR322 binding to immobilized-HEL
decreased as the amount of HEL competitor increased (Fig. 1D). No HEL binding was observed for
VLparental. Besides VLCDR322 specificity towards HEL antigen, this result further proves VL capacity to
bind soluble HEL in addition to immobilized-HEL. Finally, we analyzed VLCDR322 soluble expression
in bacteria. Surprisingly, VLCDR322 showed higher soluble expression than VLparental for all tested post-
induction time points (Fig. 1E). These results suggest that elongated-CDR dAbs remain functional for
antigen binding and could be more stable than standard VL domains.

8
SUPPLEMENTARY FIGURES
Figure Supplementary 1. Functional analysis of VLs with elongated CDR3. A) Three-dimensional
structure prediction of VLparental by the I-TASSER protein structure homology-modelling server [11].
CDR1 is represented in red, CDR2 in yellow and CDR3 in blue. Framework is represented in grey. The
molecular structure was represented using the UCSF chimera package [12]. B) Schematic representation
of VLs specific for hen egg-white lysozyme (HEL) with CDR3 of different sizes. HEL paratope is
represented in grey at the central region of CDR3. Different serines/glycines sequences were added to the
flanks of HEL paratope to increase the flexibility and size of the CDR to 22, 26 or 30 aa. The hexa-
histidine tail (His6) was used for further purification of the VLs and HA tag for detection. C) Selection of
functional anti-HEL VLs. Binding and specificity of each VL construction with distinct CDR3 sizes were
evaluated by ELISA using HEL and BSA as antigens and the VLparental (VL) as negative control. VL
domains were incubated with HEL or BSA-coated wells. Nonspecific binders were washed out. Bound
VL domains were detected by HRP conjugated anti-HA antibody. Data are displayed as Abs
measurement at 405 nm. Error bars correspond to standard deviation (n = 3; * p<0.05; *** p<0.001; ****
p<0.0001; t-test). D) Binding analysis of VLCDR322 to HEL. (Left) Increasing concentrations of
VLCDR322 and VLparental (VL) were incubated with HEL or BSA-coated wells. Data are displayed as Abs
measurement at 405 nm. To facilitate data representation, HEL binding was calculated according to the
following formula: AbsHEL-coated well-AbsBSA-coated well. Error bars correspond to standard deviation (n = 3)
and n.a. to not applicable. (Right) Competitive ELISA. VLCDR322 and VLparental (VL) were pre-incubated
with increasing quantities of soluble HEL (competitor HEL) at 37 ºC. After 1 h, this mixture was
incubated with HEL-coated wells (immobilized-HEL). Data are displayed as percentage of immobilized-
HEL binding (no competitor/immobilized-HEL = 100%) according to formula: [(Abscompetitor/immobilized-HEL-
Abscompetitor/immobilized-BSA)/(Absnocompetitor/immobilized-HEL-Absnocompetitor/immobilized-BSA)]*100. Error bars
correspond to standard deviation (n = 3). E) Soluble expression of VLCDR322 in bacteria. The soluble
expression yields of VLCDR322 and VLparental (VL) were compared by Western-Blot using the HRP
conjugated anti-HA antibody for detection at five time points post-induction (t).

9

10
Figure Supplementary 2. HR1 peptide conservation across HIV-1 subtypes and HIV types and N36
importance for HIV-1 entry. Amino acid sequence alignment of N36 from reference strains of the
diverse HIV-1 subtypes (Top). Data based on 2014 edition of the HIV Sequence Database (http://hiv-
web.lanl.gov). Dashes indicate sequence identity to HIV-1 consensus sequence of HXB2 strain from
subtype B (first sequence). N36 sequence highlighted in blue corresponds to predicted F63 epitope. N36
underlined is D104 predicted epitope. Amino acid sequence alignment of N36 from HIV-1 and HIV-2
types (Middle) [13]. Dashes indicate sequence identity to HIV-1 consensus sequence. Importance of each
individual amino acid of N36 for HIV-1 infection (Bottom), according to Sen et al [14]. In the cited
study, an alanine substitution was performed for each amino acid of N36 region, classifying each one
according to the percentage of HIV-1 infection comparing to the wild-type. Wild-type mutants: >40%
viral entry; Impaired entry-mutants: 5-40% viral entry and non-function entry mutants: <5% viral entry.

11

12
Figure Supplementary 3. Analysis of purified VLs D104 and F63. Western-blot (Left) and SDS-
PAGE (Right) of purified VLs D104 and F63.
Figure Supplementary 4. Viability assays. TZM-bl (A) and Jurkat cells (B) viability was determined in
the presence of the highest used concentration of the inhibitors (F63, D104, T-20 and VL). Error bars
correspond to standard deviation (n = 3).
Figure Supplementary 5. Antiviral activity of F63 against HIV-1 strains resistant to T-20. Antiviral
activity of F63 against HIV-1 variants resistant to T-20 NL4-3 (D36G) V38A/N42D (A) and V38A/N42T
(B) was compared to HIV-1 variant susceptible to T-20 D36G (parental). Titrated amounts of F63 were
incubated with HIV-1 variants for 1 h at 37 ºC prior to TZM-bl cells infection. After 48 h, HIV infectivity
was evaluated by luciferase activity measurement. Data are displayed as percentage of infectivity
inhibition (virus/no inhibitors = 0%; no virus/no inhibitors = background) according to the formula: [1-
(LUvirus/inhibitors-LUbackground)/(LUvirus/noinhibitors-LUbackground)]*100. Error bars correspond to standard
deviation (n = 2). Fold-increase represents fold-increase of IC50 relative to NL4-3 D36G (parental).

13
SUPPLEMENTARY TABLES
Table Supplementary 1. PCR fragments and primers used in this study.
VL CDR3 22 aa F
> VL-F-SfiI
5’- GAGGAGGAGGAGGAGGAGGCGGGGCCCAGGCGGCCGAGCTC-3’
> VL Framework 3 22 aa R
5’-CCTCAATTCG TAGTAGCTA GCGTAGATG GTGGAGTCG GAGCCAC CGCCTGA
ACAGTAGT AAGTGGCAGCATCGGC-3’
VL CDR3 22 aa R
> VL CDR3 22 aa FF
5’-GACT CCACCAT CTACGCT AGCTACTA CGAATTG AGGAGCG GAGGCG GAAGTT TTGC
TTTCGGCGGAGGG-3’
> VL-R-SfiI
5’-CCGCTCGA GCGGCTAAG AAGCGTAGTC CGGAACGTCG TACGGGTAAG AAGCGTAGTC
CGGAACGTC-3’
VL CDR3 26 aa F
> VL-F-SfiI
5’-GAGGAGGAGGAGGAGGAGGCGGGGCCCAGGCGGCCGAGCTC-3’
> VL Framework 3 26 aa R
5’-CCTCAATTCGT AGTAGCTAGCG TAGATGGTGGA GTCGGAGCC ACCGCCAC CGCCTGAC
CCGGAAC AGTAGT AAGTGGCAGCATCGGC-3’
VL CDR3 26 aa R
> VL CDR3 26 aa FF
5’-GACTC CACCATC TACGCTA GCTACT ACGAATT GAGGAG CGGAGG CGGAAG TGGT
TCATTTG CTTTCGGCGGAGGG-3’
> VL-R-SfiI

14
5’-CCGCTC GAGCGGCTAAG AAGCGTAGT CCGGAACGTCG TACGGGTAAG AAGCGTAGTCC
GGAACGTC-3’
VL CDR3 30 aa F
> VL-F-SfiI
5’-GAGGAGGAGGAGGAGGAGGCGGGGCCCAGGCGGCCGAGCTC-3’
> VL Framework 3 30 aa R
5’-CCTCAATTC GTAGTAGCTA GCGTAGAT GGTGGAGTCG GAGCCACCGCC AGAGCCTCCC
CCGGAACAG TAGTAAGTGGCAGCATCGGC-3’
VL CDR3 30 aa R
> VL CDR3 30 aa FF
5’-GACTC CACCATC TACGCTA GCTACT ACGAATT GAGGAG CGGAGG CGGAAG TGGT
TCATTTG CTTTCGGCGGAGGG-3’
> VL-R-SfiI
5’-CCGCTCGA GCGGCTAAG AAGCGTAGTC CGGAACGTC GTACGGGT AAGAAGCG
TAGTCCGG AACGTC-3’
HEL binders overlap
> VL-F-SfiI
5’-GAGGAGGAGGAGGAGGAGGCGGGGCCCAGGCGGCCGAGCTC-3’
> VL-R-SfiI
5’-CCGCTCGAGCG GCTAAGA AGCGTAGTCC GGAACGTCGT ACGGGTAAG AAGCGTAGTCC
GGAACGTC-3’
CDR1 randomization F
> VL-F-SfiI
5’-GAGGAGGAGGAGGAGGAGGCGGGGCCCAGGCGGCCGAGCTC-3’
> CDR1-R
5’-ACTTCCGCCTCCGCTGCAATTGATGGTGACTGTGCCC-3’

15
CDR1 randomization R
> CDR1 library F
5’-CAATTGCAGCGGAGG CGGAAGTD VNDVNDVNDVNDVNDVN DVNDVNDVNDVNDVN
DVNAGCGGAGGCGGAAG TTGGTATCAGCAGAAACCAGGGC-3’
> VL-R-SfiI
5’-CCGCTCGAG CGGCTAAG AAGCGTAGT CCGGAACGTC GTACGGGT AAGAAGCG
TAGTCC GGAACGTC-3’
CDR1 randomization overlap
> VL-F-SfiI
5’-GAGGAGGAGGAGGAGGAGGCGGGGCCCAGGCGGCCGAGCTC-3’
> VL-R-SfiI
5’-CCGCTCG AGCGGCTA AGAAGCGTAG TCCGGAACGTC GTACGGGTAA GAAGCGTAGTCC
GGAACGTC-3’
CDR3 randomization F
> VL-F-SfiI
5’-GAGGAGGAGGAGGAGGAGGCGGGGCCCAGGCGGCCGAGCTC-3’
> CDR3-R
5’-ACTTCCGCCTCCGCTACAGTAGTAAGTGGCAGCATCGGC-3’
CDR3 randomization R
> CDR3 library F
5’-CTTA CTACTGTAG CGGAGGCGGAAG TDVNDVNDVND VNDVNDVNDVN
DVNDVNDVND VNDVNAGCGGAGGCGGAAGTTTTGCTTTCGGCGGAGGG-3’
> VL-R-SfiI
5’-CCGCT CGAGCGGCTA AGAAGCGTAGTC CGGAACGTCGTAC GGGTAAGAAGCGTA
GTCCGGAACGTC-3’

16
VL NheI/XhoI for pET28a (+)
>VL-NheI-F
5’- CTC GCT AGC GAG CTC GTG CTG ACC CAG-3’
> VL-XhoI-R
5’-CCG CTC GAG GCT GCC TCC GCC TCC GCT TAG GAT CTC CAG CTC GGT CCC-3’
F63 monomer N-terminal
>VL-NheI-F
5’- CTC GCT AGC GAG CTC GTG CTG ACC CAG-3’
>VL-NotI-R linker
5’-TTTTCCTTTTGCGG CCGCTGCTACCTCCA CCTCCGCTGTGCTG GGCGGCCTGGCCA GGCCAGGCCGCCCA
GCACAGCGG AGGTGGAGGTAGCAGCGGCCGCAAAAGGAAAA-3’
F63 monomer C-terminal
>VL-NotI-F
5’-AAG GAA AAA AGC GGC CGC GCC CAG GCG GCC GAG CTC-3’
> VL-XhoI-R
5’-CCG CTC GAG GCT GCC TCC GCC TCC GCT TAG GAT CTC CAG CTC GGT CCC-3’
17
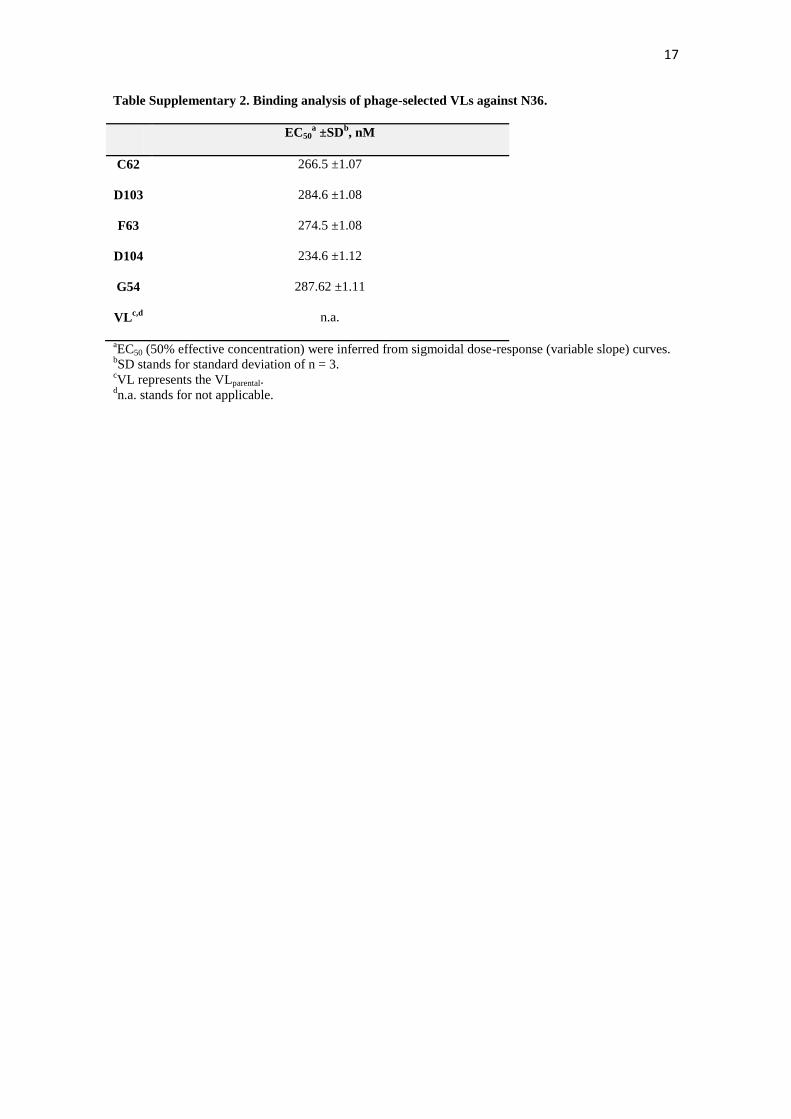
Table Supplementary 2. Binding analysis of phage-selected VLs against N36.
EC50a ±SD
b, nM
C62 266.5 ±1.07
D103 284.6 ±1.08
F63 274.5 ±1.08
D104 234.6 ±1.12
G54 287.62 ±1.11
VLc,d
n.a.
aEC50 (50% effective concentration) were inferred from sigmoidal dose-response (variable slope) curves.
bSD stands for standard deviation of n = 3.
cVL represents the VLparental.
dn.a. stands for not applicable.

18
Table Supplementary 3. Antiviral activity of F63 against HIV-1 primary isolates in PBMCs.
HIV-1 primary isolatea Subtype F63 IC50b
±SDc, nM T-20 IC50b
±SDc, nM VLd,e
UCFL1014 B 4.2 ±0.4 1.2 ±0.3 n.a.
UCFL1025 B 0.4 ±0.1 0.2 ±0.1 n.a.
UCFL1028 C 0.3 ±0.1 0.1 ±0.1 n.a.
UCFL1029 B 7.0 ±2.0 2.5 ±0.8 n.a.
aThe HIV-1 primary isolates were obtained from Calado et al [15].
bIC50 (50% inhibitory concentration) were inferred from sigmoidal dose-response (variable slope) curves.
cSD stands for standard deviation of n = 3.
dVL represents the VLparental.
en.a. stands for not applicable.

19
Table Supplementary 4. Membrane partition constants of F63.
F63 Kp 103 ±SD
a VL
b Kp 10
3 ±SD
a,c
POPC 3.27 ±0.70 ~0
POPC:Chol (2:1) 3.49 ±1.06 ~0
aSD standard deviation of n = 3.
bVL represents the VLparental.
cData fitting was not possible.
20
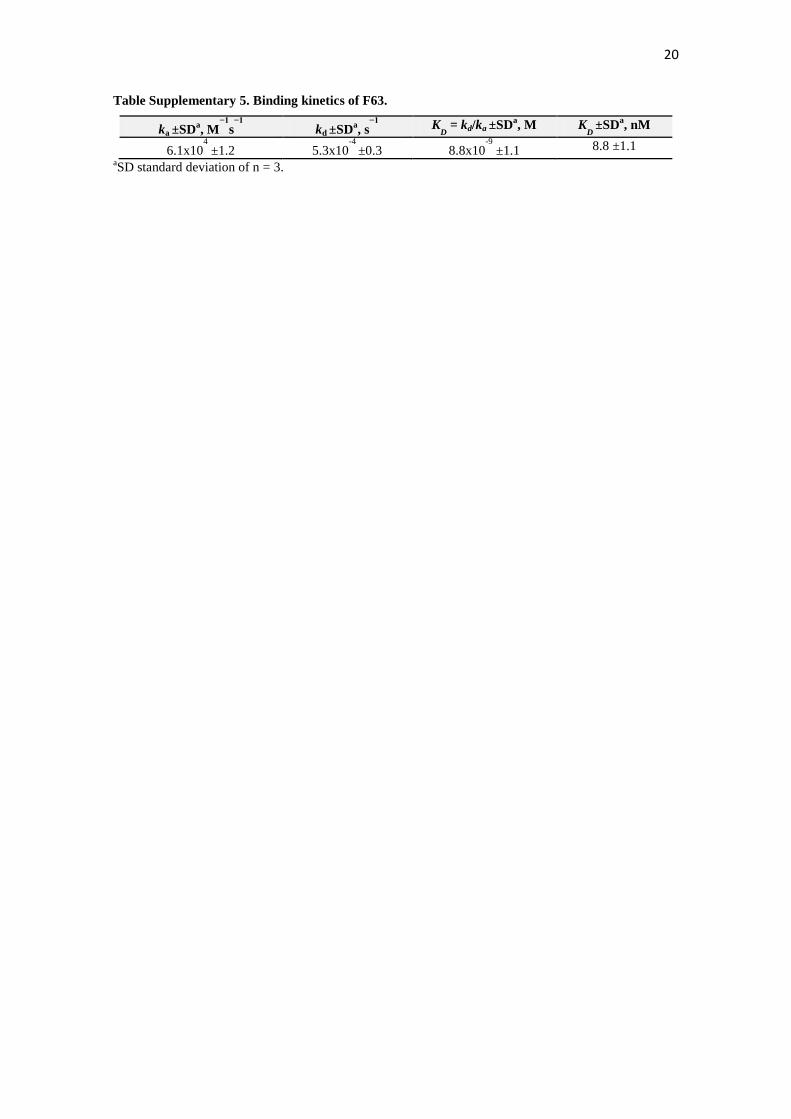
Table Supplementary 5. Binding kinetics of F63.
ka ±SDa, M
−1
s−1
kd ±SDa, s
−1
KD = kd/ka ±SD
a, M K
D ±SD
a, nM
6.1x10⁴
±1.2 5.3x10⁻⁴
±0.3 8.8x10⁻⁹
±1.1 8.8 ±1.1
aSD standard deviation of n = 3.

21
REFERENCES
1 Gonçalves J, Aires da Silva F. Engineering rabbit antibody variable domains and uses thereof.
2008; :WO2008136694A1.
2 Goncalves J, Silva F, Freitas-Vieira A, Santa-Marta M, Malhó R, Yang X, et al. Functional
neutralization of HIV-1 Vif protein by intracellular immunization inhibits reverse transcription
and viral replication. J Biol Chem 2002; 277:32036–32045.
3 Oliveira SS, Da Silva FA, Lourenco S, Freitas-Vieira A, Santos ACC, Goncalves J. Assessing
combinatorial strategies to multimerize libraries of single-domain antibodies. Biotechnol Appl
Biochem 2012; 59:193–204.
4 Da Silva FA, Santa-Marta M, Freitas-Vieira A, Mascarenhas P, Barahona I, Moniz-Pereira J, et
al. Camelized rabbit-derived VH single-domain intrabodies against Vif strongly neutralize HIV-1
infectivity. J Mol Biol 2004; 340:525–542.
5 Firth AE, Patrick WM. GLUE-IT and PEDEL-AA: new programmes for analyzing protein
diversity in randomized libraries. Nucleic Acids Res 2008; 36:W281–W285.
6 Barbas CF, Kang a S, Lerner R a, Benkovic SJ. Assembly of combinatorial antibody libraries on
phage surfaces: the gene III site. Proc. Natl. Acad. Sci. U. S. A. 1991; 88:7978–82.
7 Barbas CFI, Burton DR, Scott JK, Silverman GJ. Phage display: a laboratory manual. NY: Cold
Spring Harbor Laboratory Press; 2000.
8 Szoka F, Olson F, Heath T, Vail W, Mayhew E, Papahadjopoulos D. Preparation of unilamellar
liposomes of intermediate size (0.1-0.2 mumol) by a combination of reverse phase evaporation
and extrusion through polycarbonate membranes. Biochim Biophys Acta 1980; 601:559–71.
9 Ladokhin AS, Jayasinghe S, White SH. How to measure and analyze tryptophan fluorescence in
membranes properly, and why bother? Anal Biochem 2000; 285:235–45.
10 Matos PM, Franquelim HG, Castanho MARB, Santos NC. Quantitative assessment of peptide-
lipid interactions. Ubiquitous fluorescence methodologies. Biochim Biophys Acta - Biomembr
2010; 1798:1999–2012.
11 Yang J, Yan R, Roy A, Xu D, Poisson J, Zhang Y. The I-TASSER Suite: protein structure and
function prediction. Nat Methods 2014; 12:7–8.
12 Pettersen EF, Goddard TD, Huang CC, Couch GS, Greenblatt DM, Meng EC, et al. UCSF
Chimera—A visualization system for exploratory research and analysis. J Comput Chem 2004;
25:1605–1612.
13 Douglas N, Munro G, Daniels R. HIV/SIV glycoproteins: structure-function relationships. J Mol
Biol 1997; 273:122–149.
14 Sen J, Yan T, Wang J, Rong L, Tao L, Caffrey M. Alanine scanning mutagenesis of HIV-1 gp41
heptad repeat 1: Insight into the gp120-gp41 interaction. Biochemistry 2010; 49:5057–5065.
15 Calado M, Matoso P, Santos-Costa Q, Espirito-Santo M, Machado J, Rosado L, et al. Coreceptor
usage by HIV-1 and HIV-2 primary isolates: The relevance of CCR8 chemokine receptor as an
alternative coreceptor. Virology 2010; 408:174–182.