DOCUMENT RESUME
ED 029 606 HE 000 929
By-Lafferty, Gladys E.A Study of the Influence of Age on Predictability of Graduate Record Examinations Aptitude Tests forSuccessful Graduate Students.
South Carolina Univ., Columbia. School of Education.Pub Date [69)Note- 39p.EDRS Price MF-$0.25 HC12.05Descriptors-Academic Performance. Adult Learning. Age Differences. Aptitude Tests. Grade PointAverage. *Graduate Students. Higher Education. Predictive Validity. Success Factors
The purposes of the study were to determine the influence of age on academicachievement, to investigage meaningful relationships between Graduate RecordExamination (GRE) aptitude test scores and graduate grade point ratios (GPR). and toevaluate the student sample in terms of national norms. The assumption underlying thestudy was that significant differences in the predictability of GRE aplitude testscores would result as a direct function of age. The sample consisted of 393students who had received master's degrees during 1966 and 1967. in 18 differentareas of specialization. Findings revealed that the assumption underlying the studycould not be substantiated. For the group as a whole, no significant differences inmeans of GRE total aptitude test scores or in mean graduate GPRs were found. Theoldest group had a lowest GRE scores, showed a tendency to earn slightly lowerquantitative ability scores than the youn9er students, but earned the highestgraduate GPRs. For education students. GRE total scores were found to predictgraduate GPRs better for those 30 years of age and above than for those in theirtwenties. Age had little correlation with CRE scores for the men, but it was associatedwith both GRE scores and GPRs for the women. The men and women in the sampleexceeded the 1964-1967 national norms for their sexes in all instances, except formale performance in verbal ability. (WM)

I
(
N.
.-
U.S. DEPARTMENT OF HEALTH, EDUCATION & WELFARE
OFFICE OF EDUCATION
THIS DOCUMENT HAS BEEN REPRODUCED EXACTLY AS RECEIVED FROM THE
PERSON OR ORGANIZATION ORIGINATING IT. POINTS OF VIEW OR OPINIONS
STATED DO NOT NECESSARILY REPRESENT OFFICIAL OFFICE OF EDUCATION
POSITION OR POLICY.
A STUDY OF THE INFLUENCE OF AGE ON PREDICTABILITY
OF GRADUATE RECORD EXAMINATIONS APTITUDE TESTS
FOR SUCCESSFUL GRADUATE STUDENTS
by
Gladys E. Lafferty
Graduate Student
School of Education
March, 1969
Dr. James A. Keith, Adviser

Introduction
In studies published to date, relatively little at-
tention has been given to the influence of age as it relates
to achievement in graduate school. With expected increases
in the number of graduate applicants of more mature age, in
keeping with current trends in education and business, the
need for greater knowledge about the influence of age on
achievement at the graduate level is essential. Research in
this area, however, is sparce.
Existing studies, utilizing a variety of individual
and multiple variables to predict success in graduate school,
tend to focus on screening devices primarily of an intellec-
tive nature. Madaus and Walsh (1965), using a sample of 569
graduate students in a New England college, found a signifi-
cant correlation of .22 between Graduate Record Examinations
(Aptitude Tests) scores and graduate grade point ratios based
on one semester's work. This finding accounted for only
4.84% of the variance in graduate achievement. The data
yielded significant correlations between Aptitude Test scores
and graduate grade point ratios for chemistry, education,
economics, history, nursing, NSF math, and math institute.
On the other hand, non-significant relationships were obtain-
ed for biology, English, math, languages, philosophy, and
physics. The researchers concluded that Graduate Record
1
2
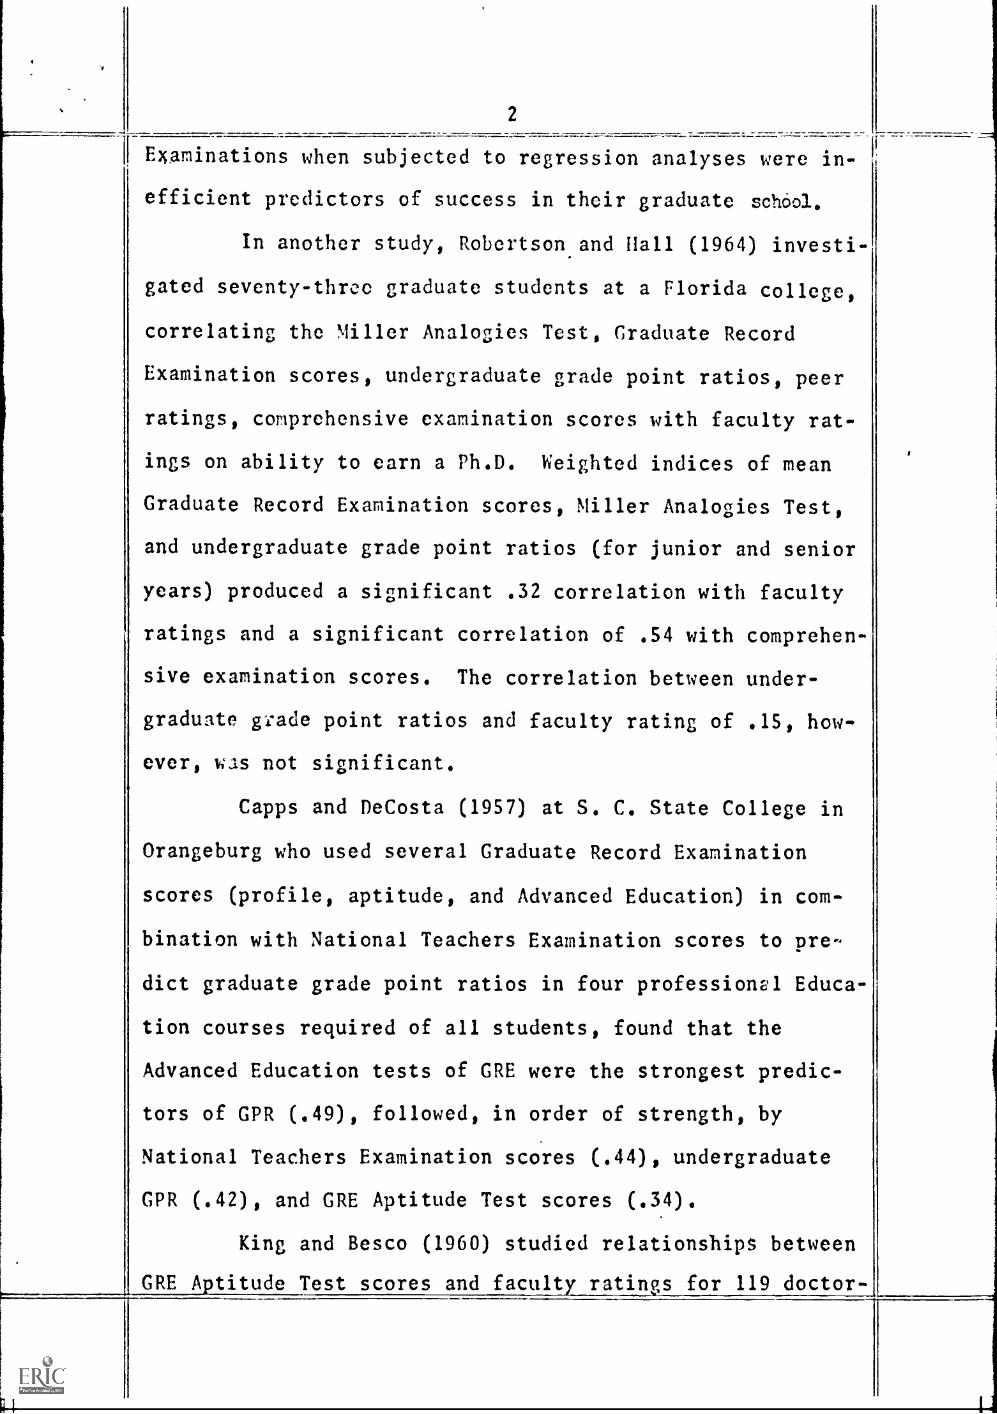
1 Examinations when subjected to regression analyses were in-
efficient predictors of success in their graduate school.
In another study, Robertson.and Hall (1964) investi-
gated seventy-three graduate students at a Florida college,
correlating the %Her Analogies Test, Graduate Record
Examination scores, undergraduate grade point ratios, peer
ratings, comprehensive examination scores with faculty rat-
ings on ability to earn a Ph.D. Weighted indices of mean
Graduate Record Examination scores, Miller Analogies Test,
and undergraduate grade point ratios (for junior and senior
years) produced a significant .32 correlation with faculty
ratings and a significant correlation of .54 with comprehen-
sive examination scores. The correlation between under-
graduate gl.ade point ratios and faculty rating of .15, how-
ever, was not significant.
Capps and DeCosta (1957) at S. C. State College in
Orangeburg who used several Graduate Record Examination
scores (profile, aptitude, and Advanced Education) in com-
bination with National Teachers Examination scores to pre-
dict graduate grade point ratios in four professional Educa-
tion courses required of all students, found that the
Advanced Education tests of GRE were the strongest predic-
tors of GPR (.49), followed, in order of strength, by
National Teachers Examination scores (.44), undergraduate
GPR (.42), and GRE Aptitude Test scores (.34).
King and Besco (1960) studied relationships between
GRE Aptitude Test scores and faculty ratings for 119 doctor-

3
1 al candidates receiving Research Foundation Fellowships in I
;
1956 to 1958, finding a correlation of .34, significant at
the 5% level, for verbal ability, but no significant rela-
tionship between the criterion (faculty ratings) and
quantitative ability ranks. The researchers recommended
that cutting scores for admissions be established on a
departmental rather than a university-wide basis.
Only about a third of the recent studies have employ-
ed undergraduate grade point ratios as predictors of success
in the graduate school despite the success reported by
earlier investigators (Lannholm, 1967). One study by
Eckhoff (1966) in Winona, Minnescta, however, used a combin-
ation of undergraduate GPR, Miller Analogies Test scores,
and advanced Education scores to predict achievement for 185
secondary and 111 elementary majors in Education with respect
to thirty or more quarter hours completed. He obtained a
high correlation of .51 between undergraduate GPR and Miller
Analogies Test scores and the criterion, graduate GPR, for
secondary majors; also, he found a multiple correlation of
.30 by combining undergraduate GPR and Advanced Education
scores to predict graduate GPR for elementary majors.
Eckhoff (1966) concluded that Miller Analogies Test scores
were ineffectual in predicting success for subjects used in
his study. Owens and Roaden (1966) at Ohio found that among
several predictors--undergraduate GPR, Watson-Glaser Criti-
cal Thinking Appraisal Test, and the Ohio State University
Psychological Test--the undergraduate GPR was the most effi-

4
Icient of the three independent variables in predicting the Ir
criteria of graduate GPR and advisor ratings.
Diversity of instruments, methods, and criteria makes
it difficult to compare findings of individual studies. The
validity of predictive screening tests varies from test to
test, from college to college, and even from department to
department within the same institution. Generally, correla-
tion coefficients obtained between such tests and success in
graduate school range from zero to .40 (Willingham, 1965).
Among the most widely used screening instruments for
graduate school admission, affording some degree of compar-
ability among schools, are the Graduate Record Examinations
(GRE) Aptitude Tests. The tests provide concrete, objective,
and relatively easy reference points in evaluating a candi-
date's general educational achievement in the liberal arts
and sciences with respect to graduate level work. The system
of scaled scores (with a mean of 500 and a standard deviation
of 100), based on measurements of The Basic Reference Group_
of 1952, is used for reporting achievement. Norms, construct-
ed originally on the test scores of 3,035 college seniors at
twenty-one colleges, have undergone recent revision. The new
norms for 1964-67 (Educational Testing Service Handbook,
1967) are based on the experiences of more than 368,000 stu-
dents throughout the United States.
Educational Testing Service (ETS), publisher and
administrator of Graduate Record Examinations, recommends the
use of the revised norms for reference purposes only, cau-

5
Itioning that the Aptitude Tests were designed primarily to
supplement rather than to substitute for other pertinent in-
formation about an applicant seeking admission to graduate
school. Their chief value lies in how much they improve
prediction, not how well they act alone.
The fact that GRE Aptitude Test scores are based on
the performance of college seniors gives rise to speculation
as to their applicability to students who have been away from
academic life for an appreciable period of time--that is, to
students who are older than the average college senior.
Age, represented by the number of years elapsing
between the baccalaureate degree and application to graduate
school, was used as a predictive variable with respect to
success (GPR) in only one published study that could be foun
The Ione study, made at Sacramento State College by Johnson
and Thompson (1962) reported a -.26 coefficient between age
and graduate GPR for 298 students, a finding which denoted
trend toward lower graduate grade point ratios with higher
age levels. Correlations between age and GPR for thirteen
areas investigated at Sacramento indicated an inverse rela-
ionship between the two variables for seven of thirteen
fields, a positive relationship for five fields, and a zero
correlation f-r one. Significant correlations were obtained
or history (.43), for social science (.71), and for physical
ducation (-.50). Education was broken down into three sub-
areas, listing a zero correlation between age and GPR for
uidance; a .10 correlation for administration and su ervi-

6
sion; and a .17 correlation for the other areas of education
combined, (all three coefficients were non-significant). For
the fields of art, business administration, English, mathe-
matics, health, and psychology all were reported with nega-
tive, non-significant relationships between the two variables
(age and GPR), except for health which was .13. In most
cases, the numbers of students in various areas of speciali-
zation were small.
Recent psychological research dealing with the subject
of age and mental abilities suggests that the learning curve,
contrary to earlier views, does not necessarily descend with
increases in age. Studies indicate that learning potential
may extend well beyond middle age, especially for those who
have kept pace, particularly in such areas as general inform-
ation and vocabulary. In testing fifty-year old men using
the Army Alpha Test, taken by the same subjects thirty-one
years earlier, Owens (1953) found an increase in tested
ability at the later age. Certain abilities such as arithme-
tic, analogies, and organization of spacial relations, how-
ever, are thought to decline after age 20 or 30, probably at
varying rates (Jones, 1955). Testing results reflect, among
many things, initial intellectual level of individuals test-
ed, types of tests used, and populations studied (Bayley,
1955).
The purposes of the present study are: (1) to find
out the influence of age on the predictability of GRE Apti-
tude Test scores; (2) to investigate general relationships

- 7
among GRE Aptitude Test scores and graduate grade point
ratios (GPR); (3) to evaluate the sample in terms of national
norms.:
An underlying assumption is held: That significant
differences in predictability of GRE Aptitude Test scores
will result as a direct function of age.
Procedures
All students who received a master's degree during
the years of 1966 and 1967, totaling 443 in eighteen differ-
ent areas of specialization, were identified. For each stu-
dent the following information was collected: degree, field
of specialization, total GRE Aptitude Tests score, Verbal
Ability Test score, Quantitative Ability Test score, age upon
taking first graduate course, sex, number of courses taken at
this university to satisfy the master's program, and graduate
grade point ratio based on only the degree program.
From the total number of master's degree recipients,
fifty-four students were excluded: thirty were from foreign
countries and twenty-four did not have Aptitude Test scores.
The remaining students (N=393) constituted the sample.
A table was constructed classifying each of the 393
graduate students by age, sex, and field of specialization.
The data were analyzed globally, pooling information for all
students, then by sex, and finally by department.
For global study, the students were sorted into three
a e groups: the twenties (N=293), the thirties (N=61) and

8
[the forties (N=36). Three students, in their fifties, were
not included. Using analysis of variance, the different age
groups were compared, (1) on means for the variable GRE total
aptitude test scores; (2) on means obtained for the variable
graduate grade point ratio. Differences in means were tested
for significance.
By means of another procedur?., using the Pearson pro-
duct-moment technique, total aptitude test scores were
correlated with graduate GPR, first for each age group in the
total sample; second, for all male students (N=304); and
third, for all female students (N=89). Level of significance
was determined for each of the correlational coefficients.
To examine the data for possible sex differences, the
sample (N=393) was divided into two groups: men (N=304) and
women (N=89). By employing multiple linear regression,
Pearson product-moment correlations were computed, resulting
in matrices--one for each sex--showing relationships between
each two variables used in the study, namely: total GRE
Aptitude Test scores, verbal ability test scores, quantita-
tive ability test scores, age, and graduate grade point ra-
tios.
Statistical study of departments, individually, was
somewhat restricted by insufficient numbers of older students.
To compensate, however, a table was constructed listing nine
of the most populous areas of concentration, showing averages
of total aptitude test scores with corresponding averages of
graduate grade point ratioalfor thro_1=Agrg=g1;pulls_kithin_each_

9
,department.
,
A detailed study, however, was made of one depart-
ment--Education. Pooling all students in education, the
sample (N=66) was separated into three age groups: the
twenties (N=30), the thirties (N=17), and the forties-and-
above (N=19). Using analysis of variance, the three differ-
ent age groups were compared with respect to means, first, on
the variable total aptitude test scores; and second, on the
variable graduate grade point ratio. Differences among means
were tested for significance.
Each of the three age groups in Education was further
studied by means of Pearson product-moment correlations,
using all variables. Relationships between predictors and
criterion were examined and discussed and significant differ-
ences in predictability determined.
The four independent (predictor) variables used in
the study were: total GRE Aptitude Test scores, GRE Verbal
Ability Test scores, GRE Quantitative Ability Test scores,
and age. The one dependent (criterion) variable was graduate
grade point ratio (GPR). Major statistical tools used in the
study included multiple linear regression and Pearson product,
moment correlations; also simple analysis of variance.
Statistical computations were performed on IBM No. 7040
machines by personnel at the U.S.C. Computer Center.
Findings
Classification of students by age, sex, and area of

Table I.--Clasa-fidation of All Students (11393) by Age, Sex, and-Field of Specialization
Fields
Age: 20Is
Education 19 11
Bus, Adm, 63 1
Math. 33 9
For. Lang. 1 5
Enginee::Jig 22
English 17 20
History 14 2
Psych. 13 2
Int. Studies 4 2
Econ, 6
Biol. 16 3
AccountIg, 7
Geog. 1
Physics 6
Poll, Sci, 5
Chemistry 2
Journalism 2 1
Geology 1
Age: 30Is Age: 40Is Age:50Is Total sTot. N
30
69
42
6
22
37
16
15
6
6
19
7
1
6
5
2
3
1
11
7
13
-
3
1
2
3
3
2
-
1
.
.
.
...
-
...
F Tot. M F Tot, M F N F Tot.
6 17 7 9 16 . 3 37 29 66
- 7 3 . 3 .. ... 78 1 79
4 17 2 2 4 . .. 48 15 63
2 2 3 3 6 . . 4 10 14
. 3 3 . 3 . . 28 . 28
2 3 1 . 1 - - 18 23 41
- 2 1 . 1 - . 17 2 19
- 3 - . . . . 16 2 18. 3 - . . . 7 2 9
- 2 1 . 1 . . 9 . 9
1 1 - . . - . 16 4 20
. 1 - - - . . 8 . 8
- . 1 - 1 . . 2 - 2
. ... ... .., . . . 6 - 6
. ... ... - .... . . 5 . 5
. ... .. ... ... ... - 2 - 2
- - - - - - - 2 1 3
. .. ... ... - . . 1 . 1
Totals 237 56 293 46 15 61 22 14 36 3 304 89 393
11
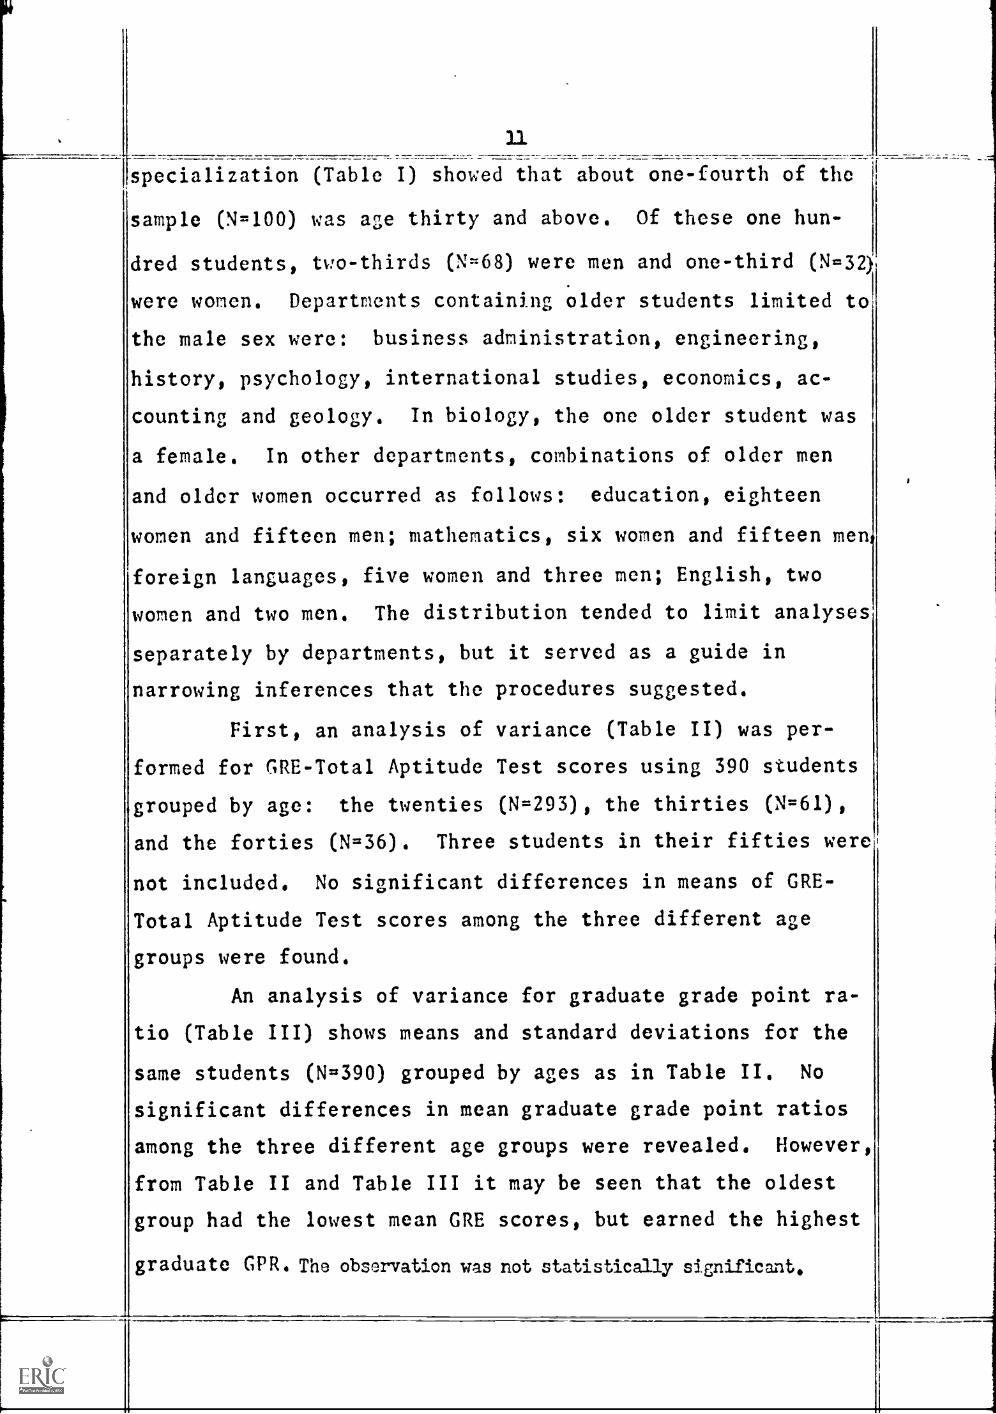
specialization (Table I) showed that about one-fourth of the
sample (N=100) was age thirty and above. Of these one hun-
dred students, two-thirds (N=68) were men and one-third (N=32)
were women. Departments containing older students limited to
the male sex were: business administration, engineering,
history, psychology, international studies, economics, ac-
counting and geology. In biology, the one older student was
a female. In other departments, combinations of older men
and older women occurred as follows: education, eighteen
women and fifteen men; mathematics, six women and fifteen men
foreign languages, five women and three men; English, two
women and two men. The distribution tended to limit analyses
separately by departments, but it served as a guide in
narrowing inferences that the procedures suggested.
First, an analysis of variance (Table II) was per-
formed for GRE-Total Aptitude Test scores using 390 students
grouped by age: the twenties (N=293), the thirties (N=61),
and the forties (N=36). Three students in their fifties were
not included. No significant differences in means of GRE-
Total Aptitude Test scores among the three different age
groups were found.
An analysis of variance for graduate grade point ra-
tio (Table III) shows means and standard deviations for the
same students (N=390) grouped by ages as in Table II. No
significant differences in mean graduate grade point ratios
among the three different age groups were revealed. However,
from Table II and Table III it may be seen that the oldest
group had the lowest mean GRE scores, but earned the highest
graduate GPR. The observation was not statistically significant.

12
able II.--Analysis of Variance for GRE-Total Aptitude Test Scores, fortudents in their Twenties (N=293), Thirties (N=61), and Forties (N..36),
Total Number 390
Age Groups
20's 301s 401s
ample Size 293 61 36
lean GRE Total Score 1078.8 1093.6 1075.3
tandard Deviation 146.5 168.6 186.9
Analysis of Variance
df Mean Sql_ F-Ratio
etween Groups 12208.7751 2 6104.3876 0.2568 Non-sig.
lithin Groups 9198145.5000 387 23767.8176
Total 9210354.2500 389-im..=.=/111=M
Table III.--Analysis of Variance for Graduate GPR for Students in theirTwenties (N=293), Thirties (N=61), and Forties (N=36), Total No. 390
A g e Groups
20's 30's 40's
Sample Size 293 61 36
Mean Graduate GPR 3.4423 3.4368 3.4881
Standard Deviation 3048 .3072 .2875
Sum of NI
Between Groups 0.0731
Within Groups 35.6732
Total 35.7461
Analysis of Variance
df Mean Sq. F-Ratio
2
387
389
0.0365
0.0922
0.3959 Non-sig,
.....

13
To determine the degree of relationship between means
of GRE tests and graduate GPR means for each of the age
groups, Pearson product-monent correlations were computed,
shown in Tables IV, V, and VI. For students in their twen-
ties, GRE scores correlated with GPR at .1578, significant a
the 1% level. Correlations between GRE scores and GPR for
the other two groups (the thirties and forties) were .1551
and .1920, respectively, neither of which was significant.
While all coefficients of correlation between GRE total
scores and GPR were small, accounting for between two and
four per cent of the variation in achievement (GPR), the re-
lationship for the twenties, which contained the largest num-
ber of students and which reached the 1% level of signifi-
cance, was (while very low) the most reliable coefficient.
Among the minor findings were the following observa-
tions: (1) no significant relationships were found between
GRE total scores and age for any of the three age groups, but
a trend toward negative directions was noted for the twenties
and thirties; (2) no significant relationships were found be-
tween age and GPR for any of the age groups, but the direc-
tion for the twenties and forties was positive (but low); for
the thirties negative; (3) relationships between age and
verbal ability for the twenties was -.1692, an inverse rela-
tionship significant at the 1% level; for the thirties, the
direction was positive but not significant; and for the for-
ties, negative but not significant; (4) correlations between
age and quantitative ability for the twenties and forties
were positive but not significant; but, for the thirties the
correlation of -.2894 indicated an inverse relationship
significant at the 5% level.
s

14
Table TV.--Coefficients of Correlation Using GRE Total Scores, VerbalScores, Quantitative Scores, Age, and Graduate GPR for all Students in
their Tuenties (N=293) -GRE-T Verbal . Quan. Grad. GPR_Ase
GRE-Total 100000 6863** 7676** ..0783 .1578**
Ierbal 1.0000 .0667 -.1692** .1311*
Nan. 1.0000 .0434 .0999
Age 1.0000 .0991
Grad. GPR .0991 1.0000
** Significant at 1%* Significant at 5%
Table V.--Coefficients of Corre ation between GHE Total Scores, Verbal,Quantitative Scores, Age, and Graduate GPRI for All Students in their
Thirties (N=61) _GRE-T Verbal Quan. Age Grad. GPR
GRE-Total 1.0000 .7323** .8093** -.1215 .1551
Verbal 1.0000 .1926 .1326 .1018
Quan. 1.0000 -.2894* .1356
Age 1.0000 -.0206
Grad. GPR ..0206 1.0000
** Significant at 1%* Significant at 57
Table VI.-- Coefficients of Correlation for GRE Total Scores, Venal,Quantitative Scores, Age, and Graduate GPRI for All Students in their
Forties (N=36)
GRE-T Verbal Wan. Age Grad. GPR
GRE-Total 1.0000 8194** 8604** .0383 .1920
Verbal 1.0000 .4129** -.0534 .2331
Quan. 1.0000 .1084 .0978
Age 1.0000 .1786
Grad. GPR .1786 1.0000
** Significant at 1%* Significant at 5%

15
A further study was made of the total sample (N=393) I
lusing Pearson product-moment correlations for selected varia-
les: verbal scores, quantitative scores, age, and graduate
grade point ratios. The results shown in Table VII suggest,
for the total group, a low but positive relationship between
age and verbal ability scores; and a low but negative rela-
tionship between age and quantitative ability. Table VII suv
gests also a closer relationship between verbal ability and
GPR (.1430, significant at the 1% level) than quantitative
ability with GPR (.1038, significant at the 5% level). As
would be expected, verbal and quantitative abilities are
significantly related (.1197, at the 5% level). The variable
Table VII.--CoerrIETEfts ofTEFFelicores,Quantitative Scores, Age, and Graduate GPR, for the TotalSample (N=393)
Verbal Quan. Age Grad. GPR..-
Verbal 1.0000 0.1197* 0.0337 0.1430**
Quan. 1.0000 -0.0801 0.1038*
Age 1.0000 0.0169
**Significant at 1% level* Significant at 5% level
of age, for the pooled data, however, is shown to have a very
low relationship to any of the other variables used in the
table.
An investigation by departments was somewhat restrict-
ed by inadequacies of the sample and by distribution patterns
Only in the area of education were total numbers even mini-

16
Table VIII.--Analysis of Variance for GRE Total Scores, for EducationStudents (N=66), by Age Levels: Twenties (N=30), Thirties (N=17), and
the Forties-and-above (N=19)
Age Groups 20'3 30's 40's and Above
Sample Size 30 17 19
Mean GRE Total 957.67 995.24 1010,00
Std. Deviation 106.92 140.52 158.04
Analysis of Variance
Sum of Sgs. df Mean Sq. F-aatio P
Between Groups 35626.2324 2 17813.1162 1.0229 Non-sig.
Within Groups 1097091.6875 63 17414.1536
Total 1132717.9063 65
Table IX.--Analysis of Variance for Graduate GPR for Education Students(N=66), by Age Levels: Twenties (N=30), Thirties (N=17), and the
Forties-and-above (N=19)
Age Groups 20s. 301s 40's and Above
Sample Size 30 17 19
Mean Grad. GPR 3.3781 3.4779 3.3283
Std. Deviation ,2823 .3242 .2776
Analysis of Variance
Sum of Sqs. df Mean Sq., F-Ratio P
Between Groups .2080 2 .1040 1.2178 Non-sig.
Nithin Groups 5.3796 63 0854
Total 5.5875 65

1 7=
ma lly acceptable for statistical analysis. An analysis of
variance, therefore, was made of all education students
(N=66), shown in Table VIII, giving means of GRE-total Apti-
tude Test scores for three different age groups: the twenti
(N=30), the thirties (N=17), and the forties-and-above (N=19).
Although the means differed appreciably among the three age
groups, particularly between the youngest and the oldest age
group, the differences did not reach statistical significance.
The standard deviation for students in their forties-and-
above bracket was relatively large indicating wide dispersion
of scores in contrast to the small range for students in
their twenties. Table IX, also based on the department of
education, is an analysis of variance for graduate GPR using
the same age groups appearing in Table VIII, By inspection,
it racv be seenthat rather large differences occur between the
thirties and the forties-and-above age groups; but the
differences do not reach statistical significance.
To determine the degree of relationship between
ariables, particularly the magnitude of correlation between
RE scores and graduate GPR within each age group, Pearson
roduct-moment correlations were computed, shown in Tables X,
I and XII. The data revealed a significant relationship,
t the 5% level, between GRE-Total scores and graduate GPR
or students thirty and above. Conversely, for younger stu-
ents (the twenties), no significant relationship was obtain-
d between GRE total scores and graduate CPR. Another find-
ng that a significant relationship, but negatively

18
Table X.--Coefftcie.lts of Cd-rrelatn for G score(' Age, and CPY for0
Education Students in their Twenties (N..30)
GRE-Total 1.0000
Verbal
Quan.
fige
GPR** Sig. beyond 15
Verbal
.7575%*
1.0000
01,,....11
Quan. Aae
.6914**
.0521 -.0272
1.0000 -.1878
_21.1-.0309
.2104
-.2801
1.0000 .1175
.1175 1.0000........mm .v.111Mill...1106
Table XI.--Coefficients of Correlation for 09.E scores, Age, and GPR, f;/..
Education Studmts in their Thirties (N=17)OlOrmwm.
GRE-T
GRE-Total 1.0000
Verbal
Quart'
Age
GPR
** Sig. at 1% level* Sig. at 5% level
Verbal
.6826**
1.0000
.11
Quan,
.8542**
.2031
1.0000
.......1014..wir=.1111001..
Age GPR
-.1686 ,4550*
.1228 .3251
-.3133 .3783
1.0000 -.0706
-.0706 1.0000
Table XII.--Coefficients of Correlation for GRE Scores, Age, md GreR, forEducation Studonts in their Forties-and-above (N=19)
GRE-T Verbal
GRE-T 1.0000 .8550**
Verbal
'Quan.
Age
Grad. GPR
** Sig. at 1% level* Sig. at 55 level
*D approaching 5% level
1.0000
Quan. Age
-.1309
.4351* -.3129
1.0000 .1010
1.0000
-.4250*D
7111
GFR
.4304*
.5683**
.1509
-.4250*D
1.000

19
[directed, existed between GPR and age for the forties-and-
above group, at the 5% level. A further observation was a
strong trend toward lower quantitative ability scores with
age advances for the group in their thirties, and lower verb-
al ability scores with age advances for the forties-and-above
category.
A comparison of verbal ability and quantitative
ability scores with GRE-total scores for the various groups
in education showed a stronger relationship of verbal ability
with GRE-totals for both the twenties and the forties-and-
above groups; but for the thirties, quan'zitative ability
correlated higher with GRE-totals than did verbal ability.
As stated earlier, insufficient numbers of older stu-
dents in most of the departments, except education, was a
handicap impeding statistical analysis by areas. To compen-
sate and to provide general information with respect to GRE
scores and GPR relationships, averages were computed for nine
departments and for total M.A. degree recipients and for
total M.S. degree recipients. Within each department of the
nine areas considered, three age groups were established as
follows: (1) through age 24; (2) age 25 through 29; (3) age
30 and over. The age brackets were arbitrarily determined to
afford maximum numbers at the oldest age level. Average GRE
total scores accompanying average graduate GPR for each of
the three age groups within nine departments are shown in
Table XIII. The data showed that, in general, different
levels of CRE scores appeared to be attached to different

20
Table XIII.--Nine of Eighteen Areas of Specialization by Recipients of
Master's Degrees, 1966 and 1967, Showing Average GRE Total Scores, Aver-
age Graduate GPR, and Numbers of Students Involved, by Age Groups
----(37E, Avg. dRiTvg. No, ToCaf
rathematicsAge 30 and beyond 1224 3.398 21
Age 25 through 29 1142 3.588 28
Through age 24 1183 3,441 14
EngineeringAge 30 and beyond 1120 3.51)8 7Age 25 through 29 1105 3,692 11
Through age 24 1135 3.295 11
EnglishAge 30 and beyond 1103 3.699 4
Age 25 through 29 1137 3.188 7
Through age 24 1137 3.487 29
Business AdministrationAge 30 and Feyond 1179 3,376 10
Age 25 through 29 1055 3.399 14
Through age 24 1049 3,284 55
BiologyAge 30 and beyond 1050 3.294 1
Age 25 through 29 1027 3.286 3
Through age 24 1109 3.383 16
TistoryAge 30 and beyond 1050 3.346 3Age 25 through 29 1063 3.308 6
Through age 24 1021 3.522 10
PsychologyAge 30 and beyond 956 3.202 3Age 25 through 29 1093 3.309 3
Through age 24 1083 3.509 12
EducationAge 30 and beyond 1003 3.454 36
Age 25 through 29 941 3.378 18
Through age 24 983 3,378 12
Foreign LanguagesAge 30 and beyondAge 25 through 29Through age 24
965 3.720 8
. (no cases) 0
922 3.640 6
'M.A. Degrees (all) 1077 3.527
M.S. Degrees (all) 1133 3.416,
,
63
29
4o
79
20
19
1.8
66
14.
12651
Fields not shown because of relatively small nunbers include: Interna-
tional Studies, Economics, Accounting, Geography, Physics, Political Sci-'ence, Chemistry, Journalism,and Geology. (See Table I for distribudon.)
_ _

21
areas of specialization; for example, GRE averages for the
departments of mathematics and engineering were 1100 or more
while averages for the departments of education and foreign
languages were 1000 or lower. Yet, average graduate CPR's
did not vary consistently in accordance with differences in
GRE levels. Lack of predictability of GRE averages was
especially notfteable in such fields as mathematics, engineer-
ing, history, and English. On the other hand,higher GRE
average scores appeared to occur with higher GPR averages in
education, foreign languages, psychology and biology.
Although the numbers used in computing averages for
age groups within departments were too small for confidence,
the figures served in a general way to illustrate the varia-
bility of GRE scores and corresponding grade point averages.
The data also lent support to a policy of setting cutting
scores in admissions on a departmental basis rather than on a
university-wide basis.
A final analysis was made in order to examine the
data for possible sex differences. The total sample was
divided into two groups, total men (N=304) and total women
(N=89). Pearson product-moment coefficients were computed
for each two variables, a procedure which yielded two matricel
of values, one for men (lable XIV) and one for women (Table
XV).
For men, no significant correlations were obtained
between age and any other variable. The data yielded, how-
ever, a correlation of .1908 (significant at the 1% level)

22
between GRE total aptitude test scores and graduate GPR. The
multiple correlation between four predictors (GPE total,
verbal, and ability scores plus age) and GPR produced a cor-
relation of .2018 which amounted to an increase of only .011.
Thus, for male students, age appeared to add little improve-
ment to GRE scores in predictive value. GRE total scores,
accordingly, accounted for 3.64% of the variation in GPR and
GRE scores plus age accounted for 4.07%, a difference of .63%
judged to be negligible.
A minor finding was that quantitative ability for
male students correlated with GPR at .1739 (significant at
the 1% level), while verbal ability correlated with GPR at
.1125, below the 5% level.
Thble XIV....77ECTerrnients o Correlation for GRE scores, Age,and GPR, for all Male Students (N=304)
GRE-T Verbal Quan. ARS Grad. GPR
GRE-T
Verbal
Quan.
Age
Grad. GPR
1.0000 .7272**
1.0000
.7913**
.1613**
1.0000
.0365
.0840
-.0226
1.0000
.0569
.1908**
.1125
.1739**
.0569
1.0000
**Sig. at 1% level
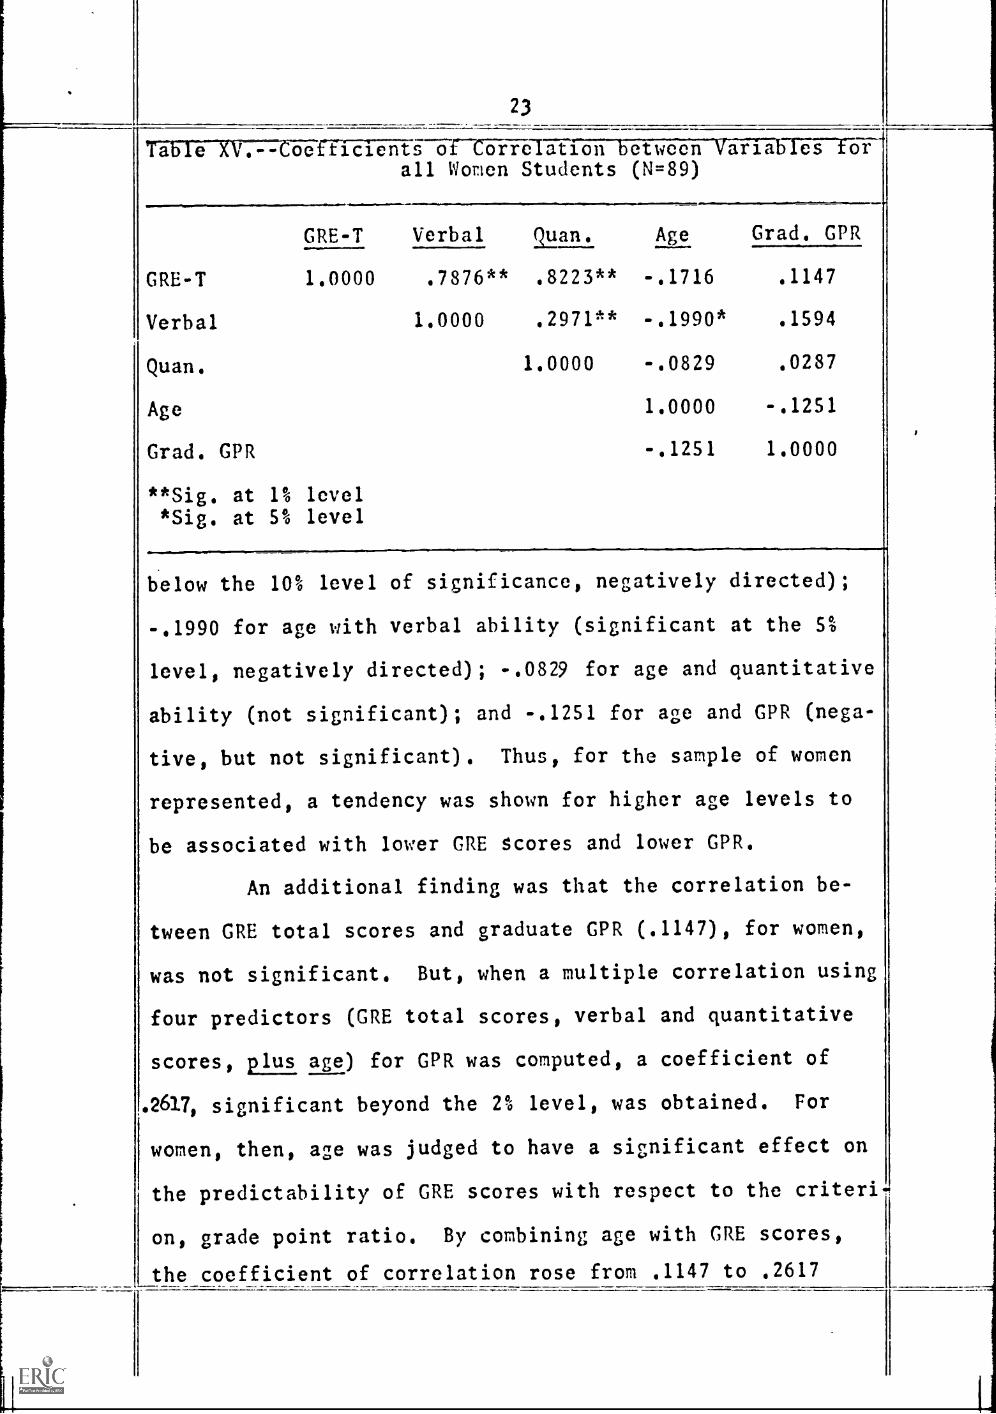
For women (Table XV), age was found to correlate
negatively with each of the other four variables, as follows:
-.1716 for age with GRE total aptitude test scores (slightly
23
birficients orrOi--reTa-tT6TiFeTvTo-CiVi aTfigre-cro-f-all Women Students (N=89)
GRE-T Verbal Quan. Age Grad. GPR
GRE-T 1.0000 .7876** .8223** -.1716 .1147
Verbal 1.0000 .2971** -.1990* .1594
Quan. 1.0000 -.0829 .0287
Age 1.0000 -.1251
Grad. GPR
**Sig. at 1%*Sig. at 5%
levellevel
-.1251 1.0000
below the 10% level of significance, negatively directed);
-.1990 for age with verbal ability (significant at the 5%
level, negatively directed); -.0829 for age and quantitative
ability (not significant); and -.1251 for age and GPR (nega-
tive, but not significant). Thus, for the sample of women
represented, a tendency was shown for higher age levels to
be associated with lower CRE scores and lower GPR.
An additional finding was that the correlation be-
tween GRE total scores and graduate GPR (.1147), for women,
was not significant. But, when a multiple correlation using
four predictors (GRE total scores, verbal and quantitative
scores, plus age) for GPR was computed, a coefficient of
.2617, significant beyond the 2% level, was obtained. For
women, then, age was judged to have a significant effect on
the predictability of GRE scores with respect to the criteri.,
on, grade point ratio. By combining age with GRE scores,
the coefficient of correlation rose from .1147 to .2617
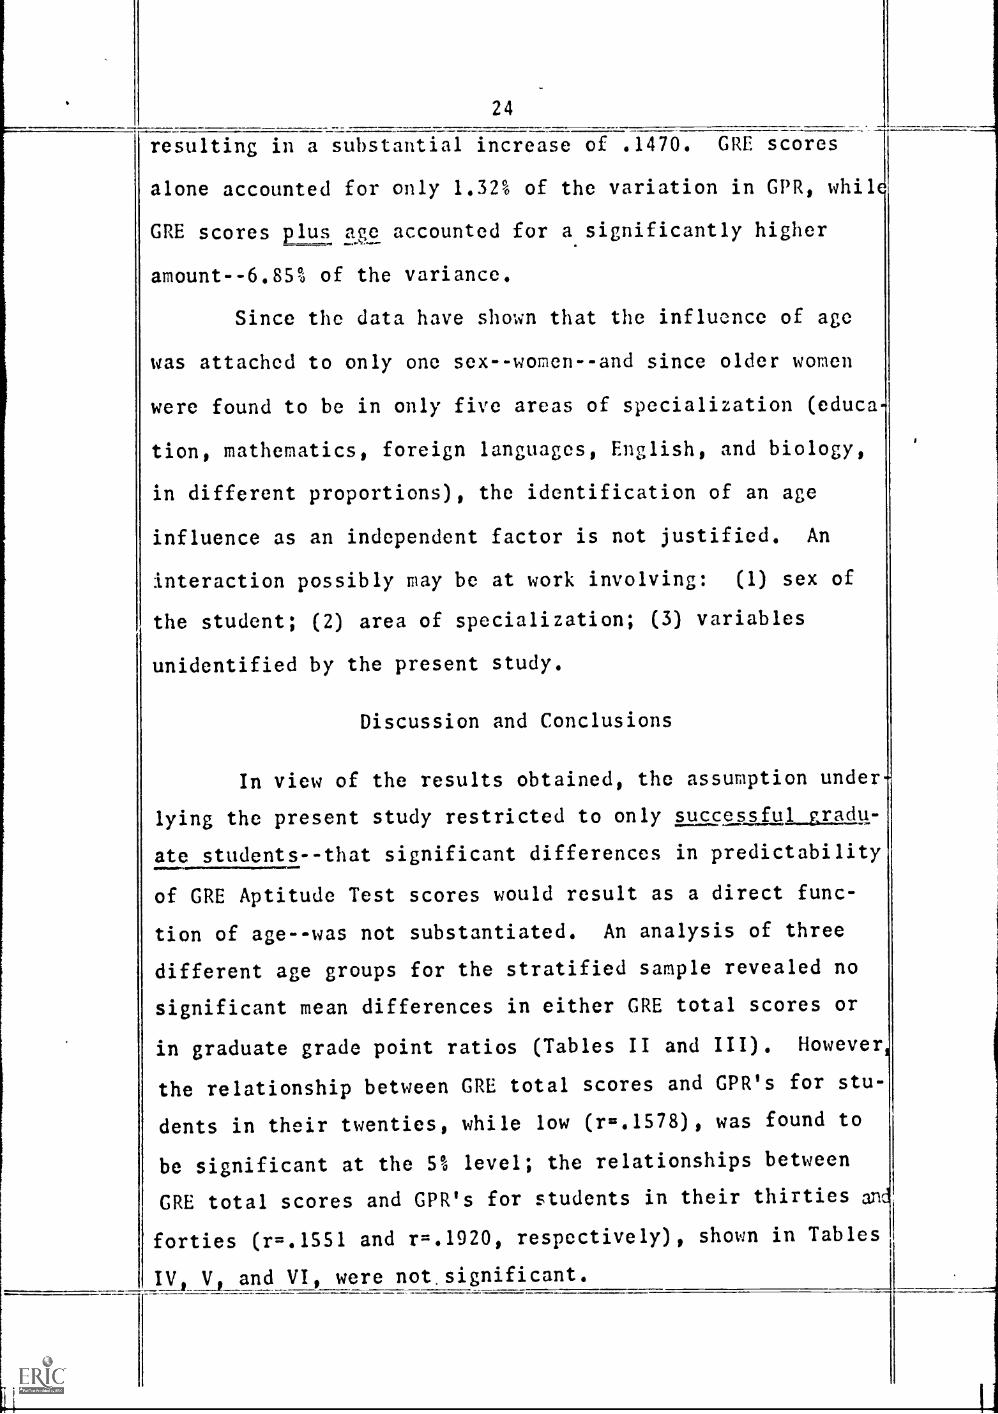
24
resulting in a substantial increase of .1470. GRE scores
alone accounted for only 1.32% of the variation in GPR, while
GRE scores jjage accounted for a significantly higher
amount--6.85% of the variance.
Since the data have shown that the influence of age
was attached to only one sex--women--and since older women
were found to be in only five areas of specialization (educa-
tion, mathematics, foreign languages, English, and biology,
in different proportions), the identification of an age
influence as an independent factor is not justified. An
interaction possibly may be at work involving: (1) sex of
the student; (2) area of specialization; (3) variables
unidentified by the present study.
Discussion and Conclusions
In view of the results obtained, the assumption under
lying the present study restricted to only successful_gractp-
ate students--that significant differences in predictability
of GRE Aptitude Test scores would result as a direct func-
tion of age--was not substantiated. An analysis of three
different age groups for the stratified sample revealed no
significant mean differences in either GRE total scores or
in graduate grade point ratios (Tables II and III). However,
the relationship between GRE total scores and GPR's for stu-
dents in their twenties, while low (r=.1578), was found to
be significant at the 5% level; the relationships between
GRE total scores and GPR's for students in their thirties and
forties (r=.1551 and r=.1920, respectively), shown in Tables
and VI, were not significant.
LI

25
With respect to all variables used in the study, age
correlated poorest of all with the other components (Table
VII). For the total sample as shown in Table VII, age
correlated with verbal ability at .0337, with quantitative
ability at -.0801, and with graduate GPR at .0169. The find-
ings are not in agreement with those obtained at Sacramento
by Johnson and Thompson (1962) who reported a correlation of
-.26 between age and graduate GPR.
In the area of education, however, data were obtained
showing a trend of possible age differences. While no sig-
nificant mean differences were observed in GRE scores or GPR
for students in three different age categories (Tables VIII
and IX), sizeable differences in coefficients were found in
predictability of GRE scores with respect to GPR among three
age groups (Tables X, XI, and XII). For students in their
twenties, no significant correlation resulted between GRE
scores and GPR (-.0309); but for students in their thirties
and forties-andabove definite, positive correlations between
GRE total scores and GPR were obtained (.4550 and .4304, re-
spectively, both significant at the 5% level). While these
data appear to provide tangible support for age influences,
the small numbers involved tend to limit confidence.
The relationships between GRE scores and GPR for edu-
cation students in the present study were difficult to relat
to findings reported elsewhere inasmuch as the populations
and methods differed. In one study, however, by White
0954) who also used master's degree recipients, a correla-___ _ _

26
tion of .40 between GPR and the combined verbal and quantita-
tive scores was reported. This coefficient resembles those
obtained in the present study for students in their thirties
and forties-and-above (.4550 and .4304), but White's posit1v3
coefficient was not in accord with that of -.0309 for the
twenties.
Small numbers of older students in departments other
than education made statistical analysis by areas impractical
The expedient of using simple averages by age groups within
a number of departments provided tenuous evidence of the
unpredictability of GRE scores with respect to GPR (Table
XIII). One characteristic, however, appeared to be consis-
tent: different GRE levels were associated with different
areas of specialization. For example, mean GRE scores
differed considerably between such fields as engineering and
education. King and Besco (1960), noting a comparable trend
in their study, expressed the opinion that different skills
(represented by different levels of GRE scores) might be more
necessary for success in one field than another. The
hypothesis expressed by King and Besco might help to explain
the finding in the present study that M.A. recipients, de-
spite lower mean GRE total scores than M.S. candidates,
earned relatively higher GPR's.
One of the most unexpected findings of the present
investigation, pertaining to women students, concerned rela-
tionships of variables which were distinctly different from
those found for male students and for the_group as a whole

27
(Table XV). For women, while their GRE scores alone were
not significantly related to their GPR's (r=.11), a multiple
correlation of all GRE scores Elus age with GPR yielded a
coefficient of .2617, significant beyond the 2% level. The
multiple correlation, thus, accounted for 6.85% of the vari-
ance in graduate GPR, still leaving about 93% of the vari-
ability in the criterion unidentified.
For men, on the contrary, age contributed very little
to the predictive value of GRE scores. GRE scores, alone,
for men as a group, correlated with GPR at .1908, signifi-
cant at the 1% level (Table XIV). A multiple correlation,
using both GRE scores and age, yielded a coefficient of
.2018, which improved prediction by only a fractional amount
(.011). Four predictors, for men, accounted for only 4% of
the variance in GPR, leaving abcut 96% of the variability in
GPR unexplained.
The question arises with respect to the differences
in the data for men and women: why would age affect the
performance of women, but not that of men? Several hypothe-
ses might be advanced: after many years in the role of home-
maker removed from academic pressures, older women return
to the university for certification and up-grading in their
fields; or, many women may try to further their educational
credentials along with commitments to careers and homes
demanding priority; or perhaps many women pursue master's
degrees without serious future objectives.

28-
Another question arises concerning the low predict-
ability of GRE scores. For the total sample (N=393), the
correlation between GRE total scores and graduate GPR was
.1639, significant at the 1% level, compared to .22 obtained
by Madaus and Walsh (1965), .40 by White (1954), and .34 by
Capps and Decosta (1957). In part, the discrepancies may be
attributed to differences in samples and methods used. Most
of the predictive studies concentrated on one sub-area of a
major department, a practice which minimized canceling
effects. In all studies, however, the size of coefficients
and the level of significance were extremely sensitive to
the number of cases involved and to the instruments used, as
well as the criteria (Robertson and Hall, 1964). In addi-
tion, for students at the graduate level previous controls
for intellective abilities, at least in theory, have been
administered, screening out those with lower scholastic
potential.
Assuming that graduate students have been screened
with respect to intellective abilities, it is tempting to
speculate that personality factors may be of greater conse-
quence to success in graduate school than pure mental abili-
ties, granted minimum requirements are met. Perhaps a por-
tion of the 94-96% variance in GPR left unaccounted for by
GRE scores mignt be explained by personal characteristics
such as temperament, interest, motivation, work habits, stud)
skills, and perseverance (Lavin, 1965; McCandless, 1967;
s

29
Eells, 1961).
A further observation with respect to personality
variables is that students earning marginal scores may com-
pensate by working harder in the classroom. Durnell (1954)
found that very high scores on the Miller Analogies Test
might not be so indicative of scholastic success in certain
areas as scores closer to the mean. Rupiper (1959) found,
however, that of twenty-five students in education at the
University of Oklahoma successful ones scored higher on the
GRE verbal and Advanced Education tests than the unsuccessful
ones. Conversely, Heriot (1967), studying students at a
local technical school, reported that drop-outs due to aca-
demic failure were not significantly different from other
students in entrance examination scores. Lack of consensus
on the reliability of screening devices is typical of the
research.
In conclusion, several reservations and limitations
of the data are evident: The failure of evidence to support
a direct, generalized age influence may, in part, be a pro-
duct of the stratified sample used, of the screening-out
processes at work in admissions and in the classroom, and the
neutralizing effects of combined data across departmental
lines. Further, there is no way of knowing without replica-
tion studies what confidence may be placed in the one-study
findings; and without supplementary investigations of all
graduate students, including drop-outs, there is doubt
whethet or not the inferences stated throughout the paper

30
apply to graduate students in general. Generalization beyond
the definition of the sample (successful graduate students
receiving a master's degree) would be unwarranted at present;
and, results obtained apply to groups rather than to specific
individuals.
A fringe benefit of the study was the accumulation of
data with which to make comparisons on 1964-67-national norms.
Inspection of Table XVI, tabulating verbal, quantitative
ability, and total scores for The 1952 Basic Reference 212112,
1964-67 national norms, and means of GRE scores for students
in the sample, shows that the 393 graduate students in the
study scored favorably with respect to national norms, except
for male performance in verbal ability.
Summary
An analysis of GRE scores, graduate GPR, and age was
made on the performances of 393 successful graduate students
receiving a master's degree during a two year period to
(1) evaluate the relationship of age and achievement; (2) to
discover meaningful relationships between GRE scores and GPR;
and (3) to assess the students' standing on national norms.
Predictor variables were total GRE Aptitude Test
scores, GRE Verbal Ability scores, Quantitative Ability
scores, and age; the criterion was graduate grade point ratio,
Statistical tools were multiple regression analysis, Pearson
product moment correlations, and analysis of variance.
The principal findings with respect to age were:

Table XVI.--Norms for Verbal and Quantitative Abilities of GRE AptittiTiTfe7Ei:7EZTEITE1775-5Tnifr--Reference Group, the 1964-67 Norms Group, and U.S.C. Master's Degree Recipients for the Years 1966, 1967
1952 Basic Reference Group:
Verbal Ability Quantitative Ability
Men Vomon Total Men Women Total
Yean 492 491 492 507 447 480
Standard Deviation 95 101 98 95 81 94
Number of Seniors 1,657 1,378 3,035 1,657 1,378 3,035
'1964-67 NOrms Group:
Mean
Standard Deviation
Number of Candidates
519 529 522 561 469 529
124 127 125 132 117 134
241,468 126,188 368,903# 241,433 126,163 368,842#
(#More than 1,200 candidates did not indicate sex on their registration forms.)
1966 and 1967 Master's DegreeRecipients, U.S.C.:
Mean
Standard Deviation
Number in Sample
505 553 516 580 508 564
95 89 96 107 97 109
304 89 393 304 89 393
Per cent Scoring LowerThan Candidates for1964-67 Norms Group 45% 53% 47% 53% 64% 59%
*GRE Handbook for_the_interpretation of GRE___saores4-19fiL_-68,pp_...

32
For the_zrou2_212 whole, age was not related to GRE
scores nor GPR to any significant degree, but older students
showed a tendency to earn slightly lower quantitative ability
cores than younger stude'llts. GRE total scores were found to
redict GPR in a more reliable fashion for younger students
han for older ones, but the proportion of variance in GPR
accounted for was low.
For Education students, GRE total scores predicted GPR
etter for students thirty and above than for students in
their twenties. For all age groups, achievement (GPR) was
significantly related to good verbal ability, with the need
accelerating as students advanced in age. Weaknesses in
quantitative ability significantly related to GPR's, showed up
in one age group in education--the group in their thirties.
For male students, age had little correlation with GRE
scores or with GPR's considering the group as a whole.
For wonen students, age was associated with all meas-
res of perfornance--GRE scores and GPR's. The trend reached
ignificance with respect to verbal ability. Increases in
ge, for women, had greater relevance to GRE scores than to
PR's. By themselves, GRE scores did not predict GPR with
y degree of confidence. When age was paired with CRE
cores, however, reliable prediction of GRE was afforded.
11 predictors, however, accounted for only about 7% of the
ariability in GPR for women, leaving 93% of the variability
.11 GPR unaccounted for.
Interaction was suspected involving age, a specific

33
sex (women), and certain areas in which women specialized
(education, foreign languages, math, English, and biology);
and possibly other variobles unidentified.
The principal minor findings were:
General relationshins between GRE scores and GPR in-
cluded the following: For the sample as a whole, only about
3-7% of the variability in CPR could be explained by predic-
tors used. Verbal ability for all students (combined)
appeared to be more essential than quantitative ability to
high achievement, although both abilities were significantly
related to classroom success.
For men students, GRE scores were found to be reli-
able in forecasting GPR, but for only 4% of the variance in
GPR, leaving about 96% unexplained. Quantitative ability,
for men, was found to be relatively more important than
verbal ability for achievement in the classroom.
For women students, as a group, GRE scores were not
reliable in predicting GPR. Verbal ability tended to be mor
essential than quantitative ability in successful achieve-
ment. Age, as cited above, appeared related to all perform-
ances.
For departments, informal computations suggested
that high total GRE scores were more essential for success
in certain areas than in others; and higher GRE scores did
not consistently result in higher CPR's.
Norms: The men and women in the sample exceeded
the 1964-67 national norms for their sexes in all instances,
s
1

34
i
except one--male performance in verbal ability.
The paper discussed limitations of the sample, the
possibility of obscuring special effects through pooling of
data, the need for replication of the study to confirm re-
sults, and a recommendation for a supplementary investiga-
tion which would include drop-outs and other graduate
students making lower GRE scores constituting a more repre-
sentative population.

Bibliography
Books
Bayley, Nancy, "A New Look at the Curve of Intelligence."The Adolescent, A Book of Readings. Edited by Jerome M.SHUTan. NFITTOTTT ffolt, RITEITart and Winston, Inc.,1960, 184-196.
Cronbach, Lee J. Essentials of Psychological Testing. NewYork: Harper and brothefT,--T960.
Edwards? Allen L. Statistical Methods for the BehavioralSciences. NewYZ517 Rinehart and 'Company, Inc., MO.
Lavin, David E. The Prediction of Academic Performance. NewYork: RusseITSage Foundation, r965, 58.
Lindquist, E. F. Design and Analysis of Experiments inPsychology and Tducation. Boston: ffEiTTETOri-7ITITinCompany, 1956.
Lyman, Howard B. Test Scores and What They Mean. EnglewoodCliffs, N. J.: Prentice-Hall, Inc., 1963.
McCandless, Boyd R. Children: Behavior and Development.New York: Holt, Rinehart and Winston, Inc., 1967, 301.
Willingham, Warren W., "Graduate Record Examinations AptitudeTests," The Fifth 'iental Measurements Yearbook. Editedby Oscar K. Buros. Highland vaik-TN. J.: IretryphonPress, 1959, 729.
Articles and Periodicals
Capps, Marion P., and Decosta, Frank A. "Contributions ofthe Graduate Record Examinations and the National Teach-er Examinations to the Prediction of Graduate SchoolSuccess," Journal of Educational Research, vol. SO(January, 1957), 383-389.
Durnell, Edward J. Jr. "Predicting Scholastic Success forGraduate Students in Education," School and Society,vol. 80 (October 2, 1954), 107-8.
36
Eckhoff, Constance M. "Predicting Graduate Success at Winon,State College," Educational and Psychological Measure-ment, vol. 26 (19-66J 7-4-87.78-5.
Eells, Kenneth. "How Effective is Differential Predictionin Three Types of College Curricula?," Educational andPsychological easurement, vol. 21 (SumiTe7,--1961I,71-51J.77-17--
Jones, H. E. "Trends in Mental Abilities," AmericanPs chologist, vol. 10 (1955), 405. CitaTHBayley,1960, 191.
King, Donald C., and Besco, Robert 0. "The GRE as a Selec-tion Device for Graduate Research Fellows," Educationaland PsysholDlical Measurement, vol. 20 (1960),
Madaus, George F., and Walsh, John J. "Departmental Differ-entials in the Predictive Validity of the GraduateRecord Examinations Aptitude Tests," Educationql andFlycholofical Measurement, vol. 25 (Spring, 1965).TI05-1110.
Owens, Thomas R., and Roaden, Arliss L. "Predicting AcademiSuccess in Master's Degree Program in Education,"Journal of Educational Research, vol. 60 (November,
II 2 6.
Owens, W. A. "Age and Mental Abilities: A LongitudinalStudy." Genetic Psychology Monographs vol. 48 (1954),3-54. Cited-in Bayley, 1960, 191.
Robertson, Malcom, and Hall, Everett. "Predicting Successin Graduate Study," The Journal of General Psychology,vol. 61 (July, 1964), 359-65.
Rupiper, Omer John. "An Analysis of the Graduate RecordExaminations for Doctoral Majors in Education," PeabodyJournal of Education, vol. 36 (March, 1959), 279-85.
Sleeper, Mildred L. "Relationships of Scores on the GRE toGPA's of Graduate Students in Occupational Therapy,"Educational and Ps chological Measurement, vol. 21Spring, 9 1
Trembly, Dean, and O'Connor, Johnson. "Growth and Declineof Natural and Acquired Intellectual Characteristics,"The Journal of Gerontoloo , vol. 1 (January, 1966),
Webb, Sam C. "Differential Prediction of Success in Graduat9School," Journal of Educational Research, vol. 50(September, 1956) , 45-54.

37
Reports
Campbell, Joel T., Hilton, Thomas L., and Pitcher, Barbara.Effects of Repeating on Test Scores of the Graduate Re-cord Examinations. Princeton: ffareifibiTIFTestingService, April, 1967.
. GRE: Handbook for the Interpretation of GRE5cores , 1967.76-87PrincetonrEdticationai l'EsITfirSer-vice, 1967.
Harvey,, Phi lip R. , and Marco, Gary L. Ltitude and AdvancedTest Scores of 1963-64 National Progran Candidates:byIlii-derp,raduate "lalor FielJT, Princeton: EdiEtionalTeTtrig Service, August, 1965.
Johnson, Hazel, and Thompson, Emmett. The Graduate RecordExaminations at Sacramento State CUTTET,e. 557:717E55-7
Bulletin, #11. Sacramento, California: Student Per-sonnel Division, Sacramento State College, 1962.(Mimeographed.)
Lannholm, Gerald V. Graduate sst.91.1129.2pillas or Recormend-in GRE scores for Initial Admission to GraaafeaT7rincefàn 1idü.ationarTesting Service, June, 1967.
Lannholm, Gerald V. Review of Studies_Ep oying GRE Scoresin Predicting Success in Graduate tuuy, 19M-1967.Princeton: Educational Testing Service:JUTY7-0-67.
Madaus, George T. The Development and Use of ExpectancyTables for the Graduate Record ExaminatilTfiTlideTest. Princeton: EducationarTaTITI-g-5iFiTEe, April,1966.
Unpublished Material
1
Godfrey, Rollin E. "A Study of the Academic Success ofVeteran Former Probation Students in the College of Artsand Sciences of the University of Louisville." Unpub-lished Master's thesis, University of Louisville, 1947.(Typewritten.)
Heriot, Mary Rider. "The Differential Aptitude Tests as Pre-dictors of Success in the Engineering Technologies atRichland Technical Education Center." UnpublishedMaster's thesis, School of Education, University ofSouth Carolina, 1967. (Mimeographed.)

3 8
Nitko, Anthony J., Johnson, Richard T., and Stratton,Lawrence M. "Enumerative and Inferential Statistics Re-garding the Matriculation Examination in the GraduateSchool of Education." New Brunswick: Rutgers--TheState University, 1965. (Mimeographed.)
White, Elizabeth, L. "The Relationship of the Graduate Re-cord Examinaticns Results to Achievement in the GraduateSchool of the University of Detroit." UnpublishedMaster's thesis, University of Detroit, 1954. (Mimeo-
graphed.)