Valentijn Bilsen Jens Gröger Willem Devriendt Ran Liu Simonas Gaušas Felix Behrens Federico Bley Marieke Carpentier Vincent Duchêne Andreas R. Köhler Cathy Lecocq Emma Legein Dietlinde Quack
Study on Greening Cloud Computing and Electronic
Communications Services and Networks
Towards Climate Neutrality by 2050
FINAL STUDY REPORT

Internal identification
Contract number: LC-01568995
VIGIE number: 2020-652
EUROPEAN COMMISSION
Directorate-General for Communications Networks, Content and Technology
Directorate E — Future Networks
Unit E2 — Cloud and Software
Contact: [email protected]
European Commission B-1049 Brussels

EUROPEAN COMMISSION
Directorate-General for Communications Networks, Content and Technology 2022 EN
Study on Greening Cloud Computing and Electronic
Communications Services and Networks
Towards Climate Neutrality by 2050
FINAL STUDY REPORT
Directorate-General for Communications Networks, Content and Technology 2022 EN
LEGAL NOTICE
This document has been prepared for the European Commission however it reflects the views only of the authors, and the European Commission is not liable for any consequence stemming from the reuse of this publication. The Commission does not guarantee the accuracy of the data included in this study. More information on the European Union is available on the Internet
(http://www.europa.eu).
PDF ISBN 978-92-76-46887-5 doi:10.2759/116715 KK-06-22-043-EN-N
Manuscript completed in November 2021
1st edition
The European Commission is not liable for any consequence stemming from the reuse of this publication.
Luxembourg: Publications Office of the European Union, 2022
© European Union, 2022
The reuse policy of European Commission documents is implemented by the Commission Decision 2011/833/EU of
12 December 2011 on the reuse of Commission documents (OJ L 330, 14.12.2011, p. 39). Except otherwise noted, the reuse of
this document is authorised under a Creative Commons Attribution 4.0 International (CC-BY 4.0) licence
(https://creativecommons.org/licenses/by/4.0/). This means that reuse is allowed provided appropriate credit is given and
any changes are indicated.
For any use or reproduction of elements that are not owned by the European Union, permission may need to be sought directly
from the respective rightholders.
EUROPE DIRECT is a service to help you find answers to your questions about the European Union
Freephone number (*): 00 800 6 7 8 9 10 11
(*) The information given is free, as are most calls (though some operators, phone boxes or hotels may charge you)

Directorate-General for Communications Networks, Content and Technology 2022 EN
Contents
Contents .................................................................................................................................................................. 5
Tables ...................................................................................................................................................................... 8
Figures ................................................................................................................................................................... 11
Boxes ..................................................................................................................................................................... 13
Abstract ................................................................................................................................................................. 14
Abstrait .................................................................................................................................................................. 15
Executive Summary ............................................................................................................................................. 16
Context ............................................................................................................................16
Objectives of the study ..................................................................................................16
Methodology ..................................................................................................................17
Policy measures for increasing energy and resource efficiency of greening data
centres and cloud computing ......................................................................................17
Policy options for a transparency mechanism on the environmental footprint of ECNs
and ECSs ..........................................................................................................................20
Deployment of new network components .............................................................. 21
Transparency towards customers in the delivery of telecommunication services 21
The need for minimum efficiency and Ecodesign requirements ........................... 22
Résumé .................................................................................................................................................................. 23
Contexte ..........................................................................................................................23
Objectifs de l‘étude........................................................................................................23
Méthodologie .................................................................................................................24
Mesures politiques visant à accroître l'efficacité énergétique et l'efficacité des
ressources des datacenters écologiques et de cloud computing ............................24
Options politiques pour un mécanisme de transparence sur l'empreinte
environnementale des réseaux et services de télécommunication ..........................28
Déploiement de nouveaux composants de réseau ............................................... 28
Transparence envers les clients-consommateurs dans la prestation des services de
télécommunication .................................................................................................... 29
La nécessité de respecter des exigences minimales en matière d'efficacité et
d'écoconception ....................................................................................................... 29
1. Introduction, background and objectives .................................................................................................... 31
1.1 The digital transformation and increased policy attention towards energy
efficiency and circular economy ..................................................................................31
Total energy demand and carbon footprint ........................................................... 31
Energy efficiency ........................................................................................................ 33

Directorate-General for Communications Networks, Content and Technology 2022 EN
Resource efficiency .................................................................................................... 34
Existing EU policy initiatives ........................................................................................ 35
1.2. Measuring circular economy performance of data centres and cloud
computing, electronic communications services and networks ................................37
1.3. Objectives of the Study ...........................................................................................39
2. Final Results Part 1 – Indicators and Standards ............................................................................................. 43
2.1. Task 1.1: Indicators and standards: Data Centres and Cloud Computing .........43
Task 1.1.1: Propose possible definitions of data centres .......................................... 43
Task 1.1.2: Research current market practices for circularity of data centre
hardware ..................................................................................................................... 71
Task 1.1.3: Research into methods for measuring energy and resource efficiency
and recommendation for a harmonised measurement framework ..................... 91
2.2. Task 1.2: Indicators and standards: Electronic Communications Services and
Networks ........................................................................................................................ 111
Task 1.2.1: Current practices of electronic communications network operators and
service providers on reporting of their environmental performance ................... 111
Task 1.2.1a: Options for communicating the environmental benefits of products to
consumers ................................................................................................................. 127
Task 1.2.2: Current practices on the assessment of the environmental sustainability
of new electronic communications networks ........................................................ 135
Task 1.2.3: Standards and measurement methodologies for the monitoring of
environmental footprint of electronic communications networks and services . 145
Task 1.2.4: Assessment of the suitability of indicators from consumer perspective ................................................................................................................................... 158
Task 1.2.5: Criteria for the assessment of the environmental sustainability of new
electronic communications networks .................................................................... 174
2.3. Main lessons on indicators and standards for Data Centres and Electronic
Communications Services and Networks ................................................................... 182
2.3.1. Main lessons for Data Centres – definitions, market practices and measures ................................................................................................................................... 182
2.3.2. Main lessons for Electronic Communications Services and Networks –
reporting, assessing, and measuring environmental sustainability ....................... 187
3. Final Results Part 2 – Policy Options .............................................................................................................. 189
3.1. Goal and operationalisation................................................................................. 189
3.1.1. Goal ................................................................................................................. 189
3.1.2. Operationalisation: a systematic funnel approach based on intervention
logic with focus on the impacts .............................................................................. 189
3.2. Task 2.1.1. Policy options for Data Centres and Cloud Computing .................. 191
3.2.1. Description of potential policy options ......................................................... 191
Policy options with a direct impact ........................................................................ 193
Policy options with an indirect impact ................................................................... 220
Directorate-General for Communications Networks, Content and Technology 2022 EN
3.3. Task 2.2.1. Policy options for transparency measures for Electronic
Communications Services and Networks ................................................................... 227
3.3.1. Description of policy options for ECNs and ECS ........................................... 227
3.3.2. Comparison of the different policy options .................................................. 238
3.3.3. Ranking of policy options for transparency measures for ECNs ................. 241
3.4. Conclusions: towards more energy and resource efficient data centres and
options for a transparency mechanism for electronic communications services and
networks......................................................................................................................... 242
3.4.1. Data centres and cloud computing ............................................................. 243
3.4.2. Electronic communications services and networks ..................................... 245
Glossary and list of acronyms ........................................................................................................................... 248
References .......................................................................................................................................................... 252
Annex 1: Overview interviewed associations and companies ..................................................................... 262
Annex 2: Distribution reports of the surveys ..................................................................................................... 263
Annex 3: Interview questions for Data Centre Associations related to Tasks 1.1.1., 1.1.2. and 1.1.3. (version
19-01-2021) ......................................................................................................................................................... 265
Annex 4: Questions for survey to electronic communications network operators, service providers and
network equipment suppliers related to Task 1.2.1 and Task 1.2.2 (version 23-02-2021) ........................... 268
Annex 5: Questions for survey about consumer perspectives on potential indicators for environmental
footprint of electronic communications services related to Task 1.2.4 (version 17-05-2021) .................... 272
Annex 6: Task 1.1.3 Methods for measuring energy and resource efficiency of data centres ................. 276
Annex 6.1: Overview of metrics of environmental performance ............................. 276
Annex 6.2: Overview of metrics in terms of environmental performance and general
IT-performance metrics combined ............................................................................. 287
Annex 6.3: Overview of metrics in terms of environmental performance and useful IT-
Performance combined: productivity proxy metrics ................................................. 289
Annex 7: Task 1.2.1 References to telecom operators' online public communication of green claims ... 298
Annex 8: Task 1.2.3 Standards and measurement methodologies for the monitoring of environmental
footprint of electronic communications networks and services ................................................................... 300
Annex 9: The policy intervention logic ............................................................................................................. 339
Directorate-General for Communications Networks, Content and Technology 2022 EN
Tables
Table 1: Objectives in the subsequent tasks ordered by ICT value chain segment and
part in the study process ...................................................................................................42
Table 2: Uptime tier requirements summary ....................................................................53
Table 3: General principle of availability typologies .......................................................53
Table 4: Size classes of data centres according to the US Data Center Energy Usage
Report .................................................................................................................................55
Table 5: Size thresholds used to categorise data centres – DC interview results ..........58
Table 6: Size thresholds used to categorise data centres – DC survey results ..............58
Table 7: Market share of European data centres by purpose (in white space, and in
number) ..............................................................................................................................63
Table 8: Application matrix for analysing ownership and operation across layers of
DCs ......................................................................................................................................70
Table 9: Criteria and thresholds for dividing data centres according to size class
(small, large, hyperscale) ..................................................................................................71
Table 10: Main components of a data centre facility (Garnier, 2012) ..........................74
Table 11: Certifications and standards for data centres' circularity practices related
to hardware, applicable in Europe ..................................................................................76
Table 12: The 10R framework for guiding and identifying potential policy suggestions
for increasing data centre hardware circularity .............................................................79
Table 13: Reuse rate and reusability index of data server components .......................86
Table 14: Overview of metrics classification based on literature ...................................92
Table 15: Colour code for classifying metrics ..................................................................96
Table 16: Overview of 71 selected metrics and 6 DC-relevant labelling or certification
scheme ...............................................................................................................................98
Table 17: Number of metrics based on different perspectives ......................................99
Table 18: ISO/IEC standards concerning energy and resource relevant metrics of DCs ........................................................................................................................................... 101
Table 19: Metrics required in the DCMM ........................................................................ 102
Table 20: ITU and ETSI energy relevant metrics concerning DCs ................................. 103
Table 21: Metrics considered in Green Data Centre (GDC) Assessment Toolkit by the
CATALYST project ............................................................................................................. 104

Directorate-General for Communications Networks, Content and Technology 2022 EN
Table 22: Data centre labelling or certifications ........................................................... 105
Table 23: Requirements of environmental reporting schemes applicable to the
telecommunications sector ............................................................................................ 117
Table 24: Environmental aspects covered by reporting schemes applicable to the
telecommunications sector ............................................................................................ 118
Table 25: Evaluation of the reporting schemes ............................................................. 119
Table 26: Which electronic communications services do you mainly offer? .............. 123
Table 27: How does your company report on its environmental policies and impacts? ........................................................................................................................................... 124
Table 28: Which areas of the company's activities are included in this reporting? ... 125
Table 29: Which indicators do you use for environmental reporting? ......................... 125
Table 30: What standards do you use for company-wide reporting? ......................... 126
Table 31: What key-figures does your company communicate to consumers (e.g.
advertising, product data sheets) when reporting the environmental performance of
communications services? .............................................................................................. 127
Table 32: Methods for measuring the ICT footprint of organisations, products and
services ............................................................................................................................. 136
Table 33: What requirements do you expect suppliers to meet when you procure new
network equipment? What are your requirements when you offer network
components? ................................................................................................................... 143
Table 34: Power consumption of network components along a 2.2 Mbps data stream
(in %) .................................................................................................................................. 148
Table 35: Overview of specific ECN-relevant ITU and ETSI methodologies ................. 152
Table 36: Description of metrics applied in ITU and ETSI methodologies ..................... 154
Table 37: Overview of expected main potential impacts for CoC policy options .... 202
Table 38: Recent revisions of EU GPP criteria in the field of the ICT sector .................. 205
Table 39: Overview of expected main impacts and transition mechanisms for
mandatory EU GPP criteria .............................................................................................. 209
Table 40: Overview of expected main impacts and transition mechanisms for stricter
requirements in the Ecodesign Regulation on servers and data storage products ... 212
Table 41: Overview of expected main impacts and transition mechanisms for the
application of the SFT Delegated Act............................................................................ 216
Table 42: Overview of expected main impacts and transition mechanisms for the
application of a DC sector self-regulation initiative ..................................................... 217

Directorate-General for Communications Networks, Content and Technology 2022 EN
Table 43: Overview of expected main impacts and transition mechanisms for the
application of a European Data Centre Registry ......................................................... 219
Table 44: Overview of expected main impacts and transition mechanisms for policy
measures that are indirectly related to data centres ................................................... 224
Table 45: Policy options for enhancing the efficiency of ECNs .................................... 238
Table 46: Overview of metrics in terms of power and energy, sorted by the field of
application ....................................................................................................................... 276
Table 47: Overview of metrics in terms of natural resource .......................................... 282
Table 48: Overview of metrics in terms of water............................................................ 282
Table 49: Overview of metrics in terms of wastes (e.g. e-waste, waste heat), sorted by
the field of application .................................................................................................... 283
Table 50: Overview of metrics in terms of environmental impacts (in this case: CO2-
eq), sorted by the field of application ........................................................................... 285
Table 51: Relevant general IT- performance metrics .................................................... 287
Table 52: Overview of metrics in terms of environmental performance and general IT-
performance metrics combined .................................................................................... 288
Table 53: Productivity proxy metrics ............................................................................... 289
Table 54: List of ECN-relevant standards and methodologies from the ITU and ETSI
considered ....................................................................................................................... 300

Directorate-General for Communications Networks, Content and Technology 2022 EN
Figures
Figure 1: Global data centre energy demand by data centre type, 2010-2022 .........32
Figure 2: Global estimated carbon footprint related to energy consumption (in Gt
CO2), 2020-2030 ..................................................................................................................33
Figure 3: Global hyperscale operators’ capital expenditure (CAPEX) (in billion euros) .............................................................................................................................................34
Figure 4: Electronic waste generated worldwide from 2010 to 2019 .............................35
Figure 5: Methods operators of data centre infrastructure use to measure success
worldwide 2019, in Percent ...............................................................................................38
Figure 6: Data centre definition overview ........................................................................61
Figure 7: Data Centre Delivery Model worldwide 2018-2019, in % .................................64
Figure 8: Number of data centres by purpose in the DC survey ....................................65
Figure 9: Server age distribution, energy consumption and compute capacity .........66
Figure 10: End-users of data centres ................................................................................66
Figure 11: Average annual growth predictions (time horizon: 5 years) .........................68
Figure 12: Ownership based data centre definition .......................................................69
Figure 13: Circular Economy for Data Centre Lifecycle .................................................72
Figure 14: Data centre server refresh cycles, 2015 versus 2020 ......................................73
Figure 15: Methods of handling outdated data centre server hardware worldwide
2018-2019, in % ...................................................................................................................78
Figure 16: Remanufacturing steps of data centre hardware ........................................81
Figure 17: Connecting data centres to a green energy grid for waste heat
valorisation (Example for the Netherlands)......................................................................83
Figure 18. Illustration of the relationship between metrics and characteristics of
metrics as well as the aspects considered in DCs ...........................................................92
Figure 19: Illustration of the classification of the reporting schemes ............................ 116
Figure 20: Scope of the ECN to be covered in dotted lines ......................................... 145
Figure 21: Categorisation of networks differing technology generations and network
segments .......................................................................................................................... 146
Figure 22: Global energy consumption by category of WAN ...................................... 147

Directorate-General for Communications Networks, Content and Technology 2022 EN
Figure 23: Electricity consumption of global networks including manufacturing and
operation .......................................................................................................................... 149
Figure 24: Useful work concept for ICT based on ITU T-L 1315 and ETSI ES 203 475:
Standardization terms and trends in energy efficiency ................................................ 157
Figure 25: Policy mix for more sustainable products ..................................................... 159
Figure 26: Example for energy efficiency label for access network ............................ 165
Figure 27: Do you consider information to consumers on the environmental footprint
of electronic communications services to be an effective way for achieving a
reduction in the energy consumption of the electronic communications services? 166
Figure 28: In your opinion, what is the role of the following aspects in consumers'
decision to choose a particular electronic communications service (e.g. mobile
operator or internet service provider)? .......................................................................... 167
Figure 29: To which level should the information on environmental impacts refer? .. 168
Figure 30: How understandable do you think the following environmental indicators
on electronic communications services are for consumers? ....................................... 168
Figure 31: Where should such information on the environmental indicators of
communications services be provided? ........................................................................ 169
Figure 32: Do you think a colour coded label would help consumers to take energy
efficiency into account when deciding on a specific service? .................................. 170
Figure 33: What additional information or measures could enhance the effect of such
colour coding? ................................................................................................................. 171
Figure 34: Do you see potential disadvantages or risks for consumers if information on
environmental footprint of services is introduced? ....................................................... 171
Figure 35: Which instruments do you think could be most suitable to improve the
environmental footprint of communication services? .................................................. 172
Figure 36: Funnel approach for identifying and analysing policy measures and
options .............................................................................................................................. 190
Figure 37: Conceptualisation of a DC and related policies with direct and indirect
impacts ............................................................................................................................. 192
Figure 38: Frequency of best practices adopted by data centres participating in the
CoC in 2016 ...................................................................................................................... 198
Figure 39: Generic intervention Logic of a policy option ............................................. 339
Directorate-General for Communications Networks, Content and Technology 2022 EN
Boxes
Box 1: Linking data centre types to information on energy efficiency and
environmental performance ............................................................................................48
Box 2: Facebook business case example for data centre circularity practices ...........82
Box 3 Google business model example for maintenance of IT equipment ..................84
Box 4 Circular Electronics Partnership ...............................................................................85
Box 5: Example of IBM Tape storage innovation .............................................................87
Box 6: The Climate Neutral Data Center Pact: an example of a Self-Regulatory
initiative ...............................................................................................................................89
Box 7: Reference units in the formation of key figures (e.g. subscribers or service units) ........................................................................................................................................... 163
Box 8: Workshop feedback on quantitative energy efficiency goals in the CoC ...... 197
Box 9: Workshop feedback on introducing a tier-system label indicating the adoption
rate of best practices in the CoC ................................................................................... 199
Box 10: Workshop feedback on third-party monitoring obligation for participants in
the CoC ............................................................................................................................ 200
Box 11: Workshop feedback on tools to increase participation in the CoC ............... 201
Box 12: Workshop feedback on mandatory GPP criteria ............................................. 210
Box 13: Workshop feedback on stricter requirements for servers and data storage
products in the Ecodesign Regulation ........................................................................... 212
Box 14: Workshop feedback on the application of the EU Taxonomy and Climate
Delegated Act ................................................................................................................. 216
Box 15: Workshop feedback on a DC sector self-regulation initiative......................... 218
Box 16: Workshop feedback on a European Data Centre Registry ............................ 220
Box 17: General feedback on the proposed metrics ................................................... 228
Box 18: Feedback on an ECN energy register ............................................................... 230
Box 19: Feedback on a Code of Conduct .................................................................... 232
Box 20: Feedback on a topten product database ...................................................... 233
Box 21: Feedback on an energy efficiency –type of label .......................................... 235
Box 22: Feedback on an Eco-Label ............................................................................... 237
Final Report: Greening DCs and ECNs: towards climate neutrality by 2050 14
Abstract
The current rapid digital transformation is characterized by an increase in the generation, use
and transmission of data, and IT infrastructure, which in turn leads to an increased energy and
resource consumption. Therefore in view of the EU Green Deal and related policy strategies,
the digital transformation also requires a green transformation.
Therefore the broad objectives of this study are to propose i) policy measures for increasing
the energy and resource efficiency of data centres as well as ii) policy options that could be
included in a transparency mechanism on the environmental footprint of electronic
communications services and networks (ECNs) and criteria for environmental sustainability
assessments. A dual research strategy was followed, focussing on data centres and cloud
computing on the one hand and ECNs on the other hand.
For data centres the study proposes primarily (a combination of) the following policy
measures:
• Improvements to the Code of Conduct;
• Compulsory green public procurement criteria for publicly procured data centres,
server rooms and cloud services; and
• The set-up of a European Data Centre Registry.
Concerning ECNs, the two main propositions are:
• The deployment of a energy efficient network infrastructure;
• The provision of eco-friendly telecommunications services by ECN operators.

Final Report: Greening DCs and ECNs: towards climate neutrality by 2050 15
Abstrait
La transformation numérique rapide actuelle se caractérise par une augmentation de la
production, de l'utilisation et de la transmission de données, ainsi que de l'infrastructure
informatique, ce qui entraîne à son tour une augmentation de la consommation d'énergie et
de ressources. C'est pourquoi, dans la perspective du "Green Deal" de l'UE et des stratégies
politiques connexes, la transformation numérique nécessite également une transformation
verte.
Les objectifs généraux de cette étude sont donc de proposer i) des mesures politiques pour
augmenter l'efficacité énergétique et l'efficacité des ressources des centres de données ainsi
que ii) des options politiques qui pourraient être incluses dans un mécanisme de transparence
sur l'empreinte environnementale des services et réseaux de communications électroniques
(ECN) et des critères pour les évaluations de la durabilité environnementale. Une double
stratégie de recherche a été appliquée, se concentrant sur les centres de données et
l'informatique en nuage d'une part, et sur les ECN d'autre part.
Pour les centres de données, l'étude propose principalement (une combinaison) des mesures
politiques suivantes :
• Des améliorations au code de conduite ;
• Des critères obligatoires de marchés publics écologiques pour les centres de données,
les salles de serveurs et les services d'informatique en nuage achetés par les pouvoirs
publics ; et
• La création d'un registre européen des centres de données.
Concernant les ECNs, les deux principales propositions sont :
• Le déploiement d'une infrastructure de réseau économe en énergie ;
• La fourniture de services de télécommunications écologiques par les opérateurs ECN.
Final Report: Greening DCs and ECNs: towards climate neutrality by 2050 16
Executive Summary
Context
The current rapid digital transformation is characterized by an increase in the amount of data
to be recorded, processed, stored, and transmitted, entailing an increase in IT infrastructure
and subsequent energy and resource consumption. This digital trend therefore raises
concerns on its environmental impact, especially in the light of the European Green Deal which
is aimed at a more digital and environmentally sustainable economy. To enable this twin –
digital and green – transition, it will be important to introduce policy measures that enhance
energy efficiency and circular economy practices in the ICT value chains. This study aims to
inform and propose future policy measures, focusing specifically on cloud computing and data
centres (DCs), as well as electronic communications services and networks (ECNs).
Objectives of the study
The objectives of this study can be categorized according to the two main parts of the ICT-
value chain that are subject of this study:
Data centres and cloud computing:
1. To propose policy measures for increasing the energy and resource efficiency of data
centres and assess the environmental, social and economic impact.
2. In support of that objective to perform:
o An analysis of data centre definitions and types and determine
meaningful size thresholds;
o An analysis of current market practices related to circularity and identify
potential ways to increase circularity;
o An analysis of standards, metrics, indicators, methods and
methodologies that are currently used in the field for assessing energy
and resource efficiency and an assessment of their suitability for
inclusion in policy measures
o To identify gaps in the value chains where potential for energy efficiency
and/or circularity is lost and potential measures to bridge these gaps;
Electronic communications services and networks:
1. To propose policy options that could be included in a transparency mechanism on the
environmental footprint of ECNs and in view of this:
o To report practices, indicators, standads and methodologies related to
the environmental footprint of electronic communications networks and
services
o To report on sustainability aspects of the service offered to consumers
(in particular to assess a number of possible indicators in view of end-
user communication and for analysing the impact of a voluntary and
mandatory transparency mechanism on the environmental footprint of
electronic communications services and on relevant stakeholders.
2. To consider criteria for the assessment of the environmental sustainability of new
electronic communications networks.
Final Report: Greening DCs and ECNs: towards climate neutrality by 2050 17
Methodology
In line with the objectives for respectively the data centres, and electronic communications
services and networks, a sequential research approach was elaborated focussing first on
indicators, practices and standards, and subsequently on the elaboration of policy measures
for greening data centres, and policy options for transparency mechanisms for electronic
communications services and networks.
Although each of the research topics listed in the objectives has its own approach and
specificities, a set of cross-cutting methodologies were applied. First thorough desk research
was performed where relevant academic and grey literature was reviewed. In parallel, in-depth
interviews were held with top executives of data centres, network operators, cloud service
providers, industry associations and experts with the purpose of gaining deeper insight in
current market practices related to circularity. Additionally, three surveys were launched,
tailored to the two respective target groups: DCs and ECNs/ECSs providers. These surveys
provided further input from a total of 124 individual respondents. The interim results were
presented and discussed in an online validation workshop and event. The validation workshop
for the data centres was held Friday the 4th of June 2021 with representatives from private
companies, and national associations from various Member States. The discussion of the
intermediate results for the ECNs was held on Friday the 25th of June 2021 with company
representatives and a representative from an EU association and 28th June with BEREC (Body
of European Regulators for Electronic Communications) ad hoc working group on
sustainability.
Policy measures for increasing energy and resource efficiency of greening data centres and cloud computing
On the basis of careful analyses, stakeholder feedback from the surveys, interviews, and more
prominently from the online workshop, a number of policy measures can be proposed that are
feasible, effective and specifically targeted to data centres and cloud computing. In our view
this is a combination of:
• Improvements to the Code of Conduct (from here on referred to as the CoC);
• compulsory green public procurement criteria for publicly procured data centres, server
rooms and cloud services; and
• the set-up of a European Data Centre Registry.
Other measures are interesting and useful as well, yet appear to be more focussed on
particular aspects of data centres and cloud computing or rather indirectly affecting their
energy and resource efficiency.
Final Report: Greening DCs and ECNs: towards climate neutrality by 2050 18
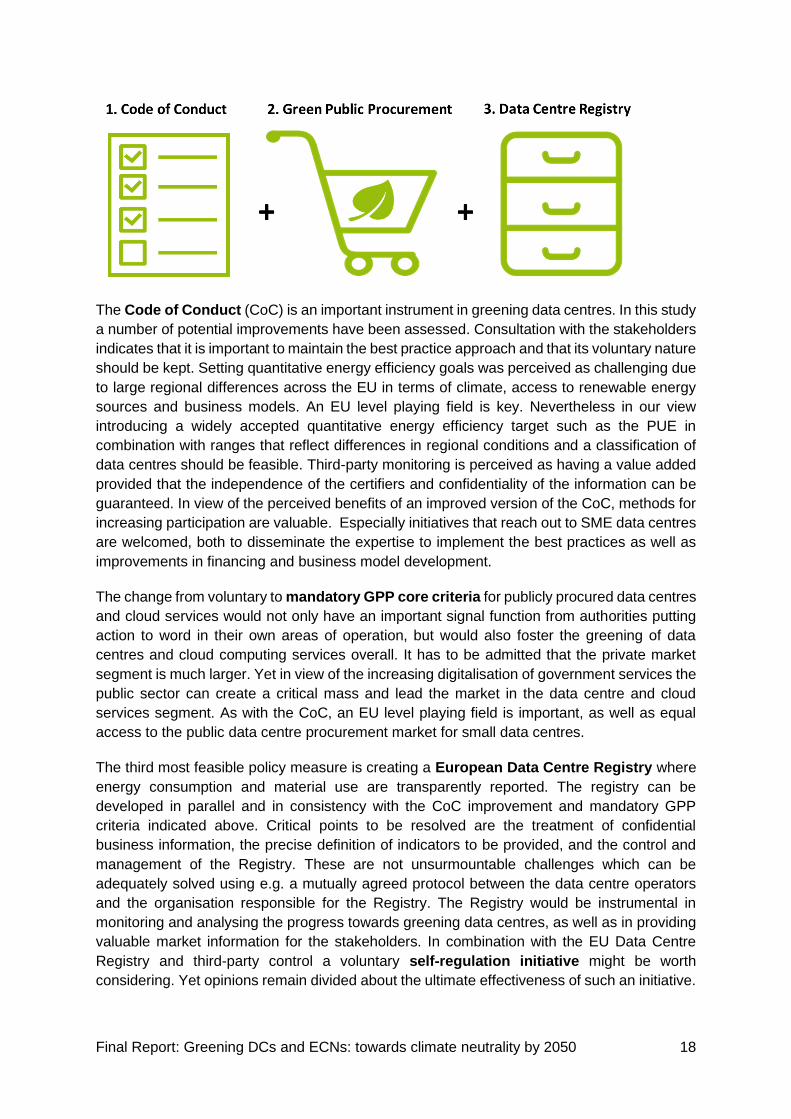
The Code of Conduct (CoC) is an important instrument in greening data centres. In this study
a number of potential improvements have been assessed. Consultation with the stakeholders
indicates that it is important to maintain the best practice approach and that its voluntary nature
should be kept. Setting quantitative energy efficiency goals was perceived as challenging due
to large regional differences across the EU in terms of climate, access to renewable energy
sources and business models. An EU level playing field is key. Nevertheless in our view
introducing a widely accepted quantitative energy efficiency target such as the PUE in
combination with ranges that reflect differences in regional conditions and a classification of
data centres should be feasible. Third-party monitoring is perceived as having a value added
provided that the independence of the certifiers and confidentiality of the information can be
guaranteed. In view of the perceived benefits of an improved version of the CoC, methods for
increasing participation are valuable. Especially initiatives that reach out to SME data centres
are welcomed, both to disseminate the expertise to implement the best practices as well as
improvements in financing and business model development.
The change from voluntary to mandatory GPP core criteria for publicly procured data centres
and cloud services would not only have an important signal function from authorities putting
action to word in their own areas of operation, but would also foster the greening of data
centres and cloud computing services overall. It has to be admitted that the private market
segment is much larger. Yet in view of the increasing digitalisation of government services the
public sector can create a critical mass and lead the market in the data centre and cloud
services segment. As with the CoC, an EU level playing field is important, as well as equal
access to the public data centre procurement market for small data centres.
The third most feasible policy measure is creating a European Data Centre Registry where
energy consumption and material use are transparently reported. The registry can be
developed in parallel and in consistency with the CoC improvement and mandatory GPP
criteria indicated above. Critical points to be resolved are the treatment of confidential
business information, the precise definition of indicators to be provided, and the control and
management of the Registry. These are not unsurmountable challenges which can be
adequately solved using e.g. a mutually agreed protocol between the data centre operators
and the organisation responsible for the Registry. The Registry would be instrumental in
monitoring and analysing the progress towards greening data centres, as well as in providing
valuable market information for the stakeholders. In combination with the EU Data Centre
Registry and third-party control a voluntary self-regulation initiative might be worth
considering. Yet opinions remain divided about the ultimate effectiveness of such an initiative.

Final Report: Greening DCs and ECNs: towards climate neutrality by 2050 19
Stricter requirements for the Ecodesign Regulation on servers and data storage products
are instrumental to greening data centres and cloud computing. Yet the ultimate contribution
to energy efficiency also depends on the entire operational process as well as the business
model used. At the time of the study the Regulation is under review. After the adoption of the
amendments which focus on a methodology to measure active and idle state power, it would
be useful issuing an ecodesign preparatory study defining the minimum requirements for
active and idle state performance, resource efficiency and operational conditions.
Although workshop participants indicated that access to finance is not a problem for DCs, the
Sustainable Finance Taxonomy Climate Delegated Act remains a valuable policy measure
that can facilitate investments in the refurbishment and introduction of new and greener
technologies in DCs. In this context the streamlining with the eligibility criteria for Important
Projects of Common European Interest, which at the time of the study are under revision, is
important.
Other policy measures that initially were not directly targeted at data centres such as
EMAS, the EED, the WEEE Directive, the CSR Directive, the EPBD, and the Green Claims,
do have an effect on greening data centres, yet rather in an indirect manner. These measures
surely help shaping a favourable regulatory environment, yet given that data centres and cloud
computing services are the prime target of this study, and the indirect nature of these
measures, these policy measures are not main candidates for greening data centres and cloud
computing. However it remains important to guard the consistency and coherence between
the direct measures, in particular the CoC and mandatory GPP, and the other measures as
this would reduce compliance costs, create (lead) market leverage and as such increase the
energy and resource efficiency of data centres. An important step in this direction has been
taken by the adoption of the Fit for 55 package in July 2021.
Evidently policy measures need to be implemented and one of the key hindrances that need
to be overcome in this respect is the myriad of concepts and definitions of data centres and
the metrics to measure energy and resource efficiency. We analysed the various concepts
that are used at the time of the study and concluded that it is recommended to use the
definition in the CoC as a starting basis and further align it with the one of the EN50600
standard and then add these to the participant or best practice guidelines documents. We also
recommend avoiding the use of the term ‘managed service provider’ to prevent confusion.
More detail is provided in chapter 2.1. (Task 1.1.1.) where we among others present a
taxonomy of DCs, and chapter 3.2. (Task 2.1.) where we analyse the definition in the context
of applications for policy measures. The size criteria and thresholds as defined in the following
table were perceived by the workshop participants as realistic.
Criteria and thresholds for dividing data centres according to size class (small, large, hyperscale)
• • Small deployment • Large deployment • Hyperscale deployment
• Floor size • 100 m² - 1000 m² • 1000 m² - 10.000 m² • more than 10.000 m²
• Number of racks • 6 to 200 • 200 to 2000 • 2000+
• Power capacity • 50kW – 1 MW • 1MW – 10MW • 10MW+

Final Report: Greening DCs and ECNs: towards climate neutrality by 2050 20
Concerning the methods for measuring the energy and resource efficiency of data
centres (task 1.1.3) our analyses have shown that there are already a large number of
different methods and metrics that focus on data centres and their individual components.
Particularly useful are the metrics from the European Data Centre Standard EN 50600-4 key
performance indicators (KPIs) series, some of them still under development, which very
systematically describe the different environmental characteristics of data centres and support
them with measurement methods. However the existing metrics have a clear focus on energy-
related issues, and circular economy aspects are still insufficiently covered by the metrics.
With regard to climate protection, leakage quantities of refrigerants from cooling systems and
the associated greenhouse gas emissions are still insufficiently recorded.
Despite the challenges in terms of definitions and metrics, we conclude that by pursuing the
three policy measures namely (i) improvements to the Code of Conduct, (ii) compulsory green
public procurement criteria for publicly procured data centres, server rooms and cloud services
and (iii) the set-up of a European Data Centre Registry and by simultaneously implementing
coherent specifications in other (indirect) policy measures a favourable regulatory
environment can be established that fosters greening of data centres and cloud computing,
both for large multinational data centres as well as for SMEs operating in the edge segment.
Policy options for a transparency mechanism on the environmental footprint of ECNs and ECSs
Based on extensive analyses in the study one may conclude that there are currently two main
areas of focus to the ecological optimisation of telecommunications infrastructures:
• The first focus is the deployment of energy efficient network infrastructure, for
example in the construction of new mobile radio base stations or antennas, new fixed
Internet access cabinets or the deployment of broadband cables.
• The second focus is the provision of eco-friendly telecommunications services by
ECN operators, i.e. mobile telephony or broadband contracts, fixed telephone
connections, fixed internet connections, business-to-business data lines, cable TV or
other services that require a fixed or mobile connection to the electronic
communications network.

Final Report: Greening DCs and ECNs: towards climate neutrality by 2050 21
Deployment of new network components
For the planning of new networks, the ECN sector has developed a variety of metrics (see
tasks 1.2.3 and 1.2.5) to determine the energy efficiency of the components used already in
the planning phase and to build energy-optimised systems. This practice could be further
promoted by giving particularly energy-efficient networks a more favourable treatment, for
instance in permit granting (e.g. accelerated procedures), in the use of public infrastructure
(roads, cable ducts, facilities, frequencies), or in the selection procedures for state aid projects.
This could be based on indicators such as the energy intensity of the network [kWh/GByte].
In addition, the study proposes that telecom operators record the energy intensity of the
network in a central or national register (ECN Energy Register), similar to the register
proposed for the data centres, in order to create an overview of the different providers and the
efficiency of the different network technologies. Regulators, professional buyers as well as
investors or financial institutions can get an overview of the efficiency of the respective
provider by comparing within the database. The data contained in the proposed ECN energy
register should be made available in such a transparent way that it can be further processed,
for example to generate information for end-users on the efficiency of providers.
Transparency towards customers in the delivery of telecommunication services
One of the objectives of this study was to investigate what transparency measures by ECN
providers could help to ensure that customers of telecommunication services can choose
energy-efficient offers, thus creating competition for the most environmentally friendly services
(see task 1.2.4). For this purpose, various metrics were considered as well as the opinions of
consumer protection organisations were surveyed. The most promising possible transparency
measure identified is the introduction of an energy efficiency –type of label for
telecommunications services. The specific energy consumption of the communication
service could be shown on the label in a colour scale as well as a classification from A to G.
The label could also include information on the carbon footprint of the service and the share
of renewable energies used. When selling and advertising telecommunication services, the
energy efficiency label would need to be shown.
The existing instrument is already very well established on the market for many electrical
appliances (lamps, refrigerators, washing machines, air conditioners, etc.) and it therefore
offers good conditions for it to be well accepted by consumers. However, it should be noted
that in addition to methodological challenges, the existing efficiency label is assigned for
physical products (goods) and could not be used for services. In addition to private customers,
the information provided by the energy efficiency label could also be used by professional
buyers and the public sector in the context of green public procurement (GPP). As a metric on
which the efficiency scale is based, various options were discussed in the study.
It is important for a suitable metric that it should not be a pure performance metric that for
example assumes maximum data traffic, but that the energy demand must be related to an
understandable and realistic usage unit (e.g. per connection, per average subscriber or per
hour of usage). In order to identify the best calculation method for the efficiency indicator, more
research is therefore needed in the further design of an energy efficiency –type of label.
Final Report: Greening DCs and ECNs: towards climate neutrality by 2050 22
The need for minimum efficiency and Ecodesign requirements
Both proposed policy options (ECN energy register and energy efficiency label) are
information tools that are intended to promote competition for the most efficient telecom
service. So far, information on the energy efficiency of telecommunication networks and
services is still very scarce. Network operators typically do not make such information publicly
available. Therefore, it is also not possible to identify what energy consumption is appropriate
for an electronic communications network. After the introduction of the transparency measures
mentioned above, however, this data situation would change. The evaluation of the data in
the proposed ECN energy register and the information on the energy efficiency label per
telecom service could create the basis for identifying inefficient systems and services.
For the future, pure transparency measures could be expanded and policy instruments to set
minimum efficiency requirements could be introduced. The study proposes two further
instruments that could be considered in the coming years. With regard to the deployment of
electronic communication networks (ECNs), the introduction of minimum efficiency
requirements in the permit granting process or as prerequisite for subsidising deployment
projects could promote efficiency competition. With regard to the telecommunication services
(ECSs), Ecodesign –type of requirements for telecom services could set efficiency
standards, and thus make the market more climate-friendly. However, it should be noted that
the existing Ecodesign Directive applies to “energy-related products”, defined as goods, and
not to services. For these two additional policy instruments, it was not yet possible to carry out
impact assessments within the framework of the present study due to the unsatisfactory data
situation.

Final Report: Greening DCs and ECNs: towards climate neutrality by 2050 23
Résumé
Contexte
La transformation numérique rapide actuelle se caractérise par une augmentation de la
quantité de données à enregistrer, traiter, stocker et transmettre, ce qui requiert une
augmentation de la capacité d'infrastructure informatique et de la consommation d'énergie et
de ressources qui en découle. Cette tendance numérique suscite donc des inquiétudes quant
à son impact sur l'environnement, notamment au regard du Green Deal européen qui vise une
économie plus numérique et écologiquement responsable. Afin de permettre cette double
transition - numérique et verte - il sera important d'introduire des mesures politiques qui
améliorent l'efficacité énergétique et les pratiques d'économie circulaire dans les chaînes de
valeur des TIC. Cette étude vise à informer et à proposer de futures mesures politiques, en
se concentrant spécifiquement sur le cloud computing et les datacenters, ainsi que sur les
services et systèmes de télécommunication.
Objectifs de l‘étude
Les objectifs de cette étude peuvent être classés en fonction de deux parties principales de
la chaîne de valeur des TIC qui font l'objet de cette étude :
Datacenters et cloud computing :
1. Proposer des mesures politiques afin d’augmenter l'efficacité énergétique et l'efficacité
des ressources des datacenters et évaluer l'impact environnemental, social et
économique.
2. A l'appui de cet objectif, réaliser :
o Une analyse des définitions et des types de datacenters et déterminer
des seuils de taille pertinents ;
o Une analyse des pratiques actuelles du marché liées à la circularité et
identifier les moyens potentiels pour augmenter la circularité ;
o Une analyse des normes, mesures, indicateurs, méthodes et
méthodologies qui sont actuellement utilisés dans le domaine afin
d’évaluer l'efficacité énergétique et l'efficacité des ressources et une
évaluation de leur pertinence pour l'inclusion dans les mesures
politiques ;
o Identifier les lacunes dans les chaînes de valeur où le potentiel
d'efficacité énergétique et/ou de circularité est perdu et les mesures
potentielles pour combler ces lacunes ;
Services et systèmes de télécommunication :
1. Proposer des options politiques pouvant être incluses dans un mécanisme de
transparence sur l'empreinte environnementale des systèmes de télécommunication
et, dans cette optique :
o Signaler les pratiques, indicateurs, normes et méthodologies liés à
l'empreinte environnementale des réseaux et services de
communications électroniques
o Rendre compte des aspects de durabilité du service offert aux
consommateurs, notamment pour évaluer un certain nombre

Final Report: Greening DCs and ECNs: towards climate neutrality by 2050 24
d'indicateurs possibles en vue de la communication avec l'utilisateur
final et pour analyser l'impact d'un mécanisme de transparence
volontaire et obligatoire sur l'empreinte environnementale des services
de communications électroniques et sur les parties prenantes
concernées.
2. Examiner les critères d'évaluation de la durabilité environnementale des nouveaux
réseaux de communications électroniques.
Méthodologie
Conformément aux objectifs concernant respectivement les datacenters et les services et
systèmes de télécommunication, une approche séquentielle de la recherche a été élaborée
en se concentrant d'abord sur les indicateurs, les pratiques et les normes, puis sur
l'élaboration de mesures politiques pour l'écologisation des datacenters et d'options politiques
pour les mécanismes de transparence des services et systèmes de télécommunication.
Bien que chacun des sujets de recherche énumérés dans les objectifs ait sa propre approche
et ses propres spécificités, un ensemble de méthodologies transversales a été appliqué. Tout
d'abord, des recherches documentaires approfondies ont été effectuées en passant en revue
la littérature académique et grise pertinente. En parallèle, des entretiens approfondis ont été
menés avec des cadres supérieurs de datacenters, d'opérateurs de réseaux, de fournisseurs
de cloud computing, d'associations industrielles et d'experts, dans le but de mieux comprendre
les pratiques actuelles du marché en matière de circularité. En outre, trois enquêtes ont été
lancées, adaptées aux deux groupes cibles respectifs : datacenters et fournisseurs de
systèmes de télécommunication. Ces enquêtes ont permis d'obtenir des informations
supplémentaires de la part de 124 personnes au total. Les résultats intermédiaires ont été
présentés et discutés lors d'un atelier et d'un événement de validation en ligne. L'atelier de
validation pour les datacenters s'est tenu le vendredi 4 juin 2021 avec des représentants
d'entreprises privées et d'associations nationales de divers États membres. La discussion des
résultats intermédiaires pour les RCE s'est tenue le vendredi 25 juin 2021 avec des
représentants d'entreprises et un représentant d'une association européenne et le 28 juin avec
le groupe de travail ad hoc de l'ORECE (Organe des régulateurs européens des
communications électroniques) sur la durabilité.
Mesures politiques visant à accroître l'efficacité énergétique et l'efficacité des ressources des datacenters écologiques et de cloud computing
Sur base d'analyses approfondies, des réactions des parties prenantes lors des enquêtes,
des entretiens et, surtout, de l'atelier en ligne, il est possible de proposer un certain nombre
de mesures politiques réalisables, efficaces et spécifiquement ciblées sur les datacenters et
le cloud computing. Selon nous, il s'agit d'une combinaison de :
• améliorations du code de conduite (ci-après dénommé "CdC") ;
• des critères obligatoires de marchés publics écologiques pour les datacenters, les
salles de serveurs et les services cloud faisant l'objet de marchés publics ; et
• la création d'un registre européen des datacenters.
D'autres mesures sont également intéressantes et utiles, mais elles semblent davantage
axées sur des aspects particuliers des datacenters et de cloud computing ou affectent plutôt
indirectement leur efficacité énergétique et leur efficacité en matière de ressources.
Final Report: Greening DCs and ECNs: towards climate neutrality by 2050 25
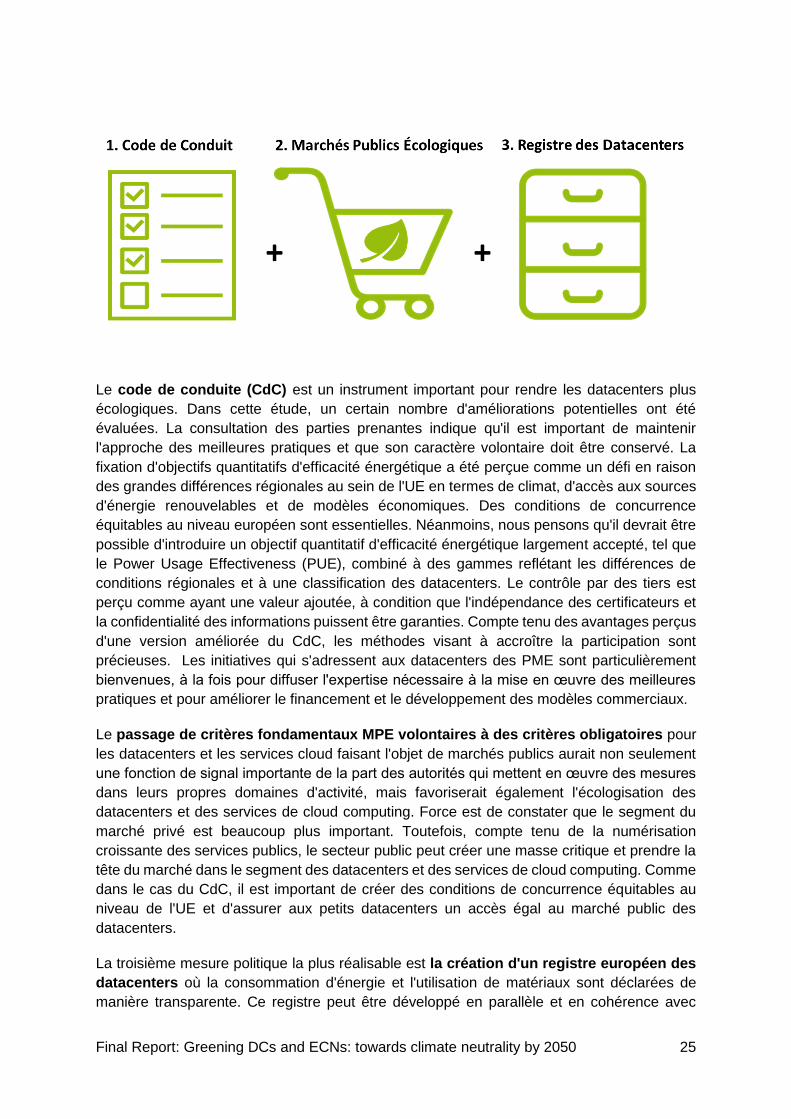
Le code de conduite (CdC) est un instrument important pour rendre les datacenters plus
écologiques. Dans cette étude, un certain nombre d'améliorations potentielles ont été
évaluées. La consultation des parties prenantes indique qu'il est important de maintenir
l'approche des meilleures pratiques et que son caractère volontaire doit être conservé. La
fixation d'objectifs quantitatifs d'efficacité énergétique a été perçue comme un défi en raison
des grandes différences régionales au sein de l'UE en termes de climat, d'accès aux sources
d'énergie renouvelables et de modèles économiques. Des conditions de concurrence
équitables au niveau européen sont essentielles. Néanmoins, nous pensons qu'il devrait être
possible d'introduire un objectif quantitatif d'efficacité énergétique largement accepté, tel que
le Power Usage Effectiveness (PUE), combiné à des gammes reflétant les différences de
conditions régionales et à une classification des datacenters. Le contrôle par des tiers est
perçu comme ayant une valeur ajoutée, à condition que l'indépendance des certificateurs et
la confidentialité des informations puissent être garanties. Compte tenu des avantages perçus
d'une version améliorée du CdC, les méthodes visant à accroître la participation sont
précieuses. Les initiatives qui s'adressent aux datacenters des PME sont particulièrement
bienvenues, à la fois pour diffuser l'expertise nécessaire à la mise en œuvre des meilleures
pratiques et pour améliorer le financement et le développement des modèles commerciaux.
Le passage de critères fondamentaux MPE volontaires à des critères obligatoires pour
les datacenters et les services cloud faisant l'objet de marchés publics aurait non seulement
une fonction de signal importante de la part des autorités qui mettent en œuvre des mesures
dans leurs propres domaines d'activité, mais favoriserait également l'écologisation des
datacenters et des services de cloud computing. Force est de constater que le segment du
marché privé est beaucoup plus important. Toutefois, compte tenu de la numérisation
croissante des services publics, le secteur public peut créer une masse critique et prendre la
tête du marché dans le segment des datacenters et des services de cloud computing. Comme
dans le cas du CdC, il est important de créer des conditions de concurrence équitables au
niveau de l'UE et d'assurer aux petits datacenters un accès égal au marché public des
datacenters.
La troisième mesure politique la plus réalisable est la création d'un registre européen des
datacenters où la consommation d'énergie et l'utilisation de matériaux sont déclarées de
manière transparente. Ce registre peut être développé en parallèle et en cohérence avec

Final Report: Greening DCs and ECNs: towards climate neutrality by 2050 26
l'amélioration du CdC et les critères obligatoires des marchés publics écologiques (MPE)
indiqués ci-dessus. Les points critiques à résoudre sont le traitement des informations
commerciales confidentielles, la définition précise des indicateurs à fournir, ainsi que le
contrôle et la gestion du registre. Il ne s'agit pas de défis insurmontables qui peuvent être
résolus de manière adéquate en utilisant, par exemple, un protocole mutuellement convenu
entre les opérateurs de datacenters et l'organisation responsable du registre. Le registre
permettrait de suivre et d'analyser les progrès réalisés en matière d'écologisation des
datacenters et de fournir des informations commerciales précieuses aux parties prenantes.
En combinaison avec le registre européen des datacenters et le contrôle par des tiers, une
initiative d'autorégulation volontaire pourrait être envisagée. Cependant, les avis restent
partagés quant à l'efficacité finale d'une telle initiative.
Les exigences plus strictes du règlement sur l'écoconception des serveurs et des
produits de stockage de données contribuent à rendre les datacenters et l'informatique
dématérialisée plus écologiques. Cependant, la contribution finale à l'efficacité énergétique
dépend également de l'ensemble du processus opérationnel ainsi que du modèle économique
utilisé. Au moment de l'étude, le règlement est en cours de révision. Après l'adoption des
amendements qui se concentrent sur une méthodologie pour mesurer la puissance en état
d’activité et en état d’inactivité, il serait utile de publier une étude préparatoire d'écoconception
définissant les exigences minimales pour la performance en état d’activité et en état
d’inactivité, l'efficacité des ressources et les conditions opérationnelles.
Bien que les participants à l'atelier aient indiqué que l'accès au financement n'est pas un
problème pour les datacenters, la Taxonomie de la finance durable - Acte délégué sur le
climat reste une mesure politique précieuse qui peut faciliter les investissements dans la
rénovation et l'introduction de technologies nouvelles et plus vertes dans les datacenters.
Dans ce contexte, la rationalisation avec les critères d'éligibilité pour les projets importants
d'intérêt européen commun, qui sont en cours de révision au moment de l'étude, est
importante.
D'autres mesures politiques qui initiallement ne visaient pas directement les
datacenters, telles que l’EMAS, l’EED, la directive WEEE, la directive CSR, la directive EPBD
et les allégations vertes, ont un effet sur l'écologisation des datacenters, mais plutôt de
manière indirecte. Ces mesures contribuent certainement à façonner un environnement
réglementaire favorable, mais étant donné que les datacenters et les services de cloud
computing sont la cible principale de cette étude, et la nature indirecte de ces mesures, ces
mesures politiques ne sont pas les principaux candidats à l'écologisation des datacenters et
de cloud computing. Cependant, il reste important de veiller à l'homogénéité et à la cohérence
entre les mesures directes, en particulier le CdC et les MPE obligatoires et les autres mesures,
car cela permettrait de réduire les coûts de mise en conformité, de créer un effet de levier sur
le marché (principal) et, en tant que tel, d'accroître l'efficacité énergétique et l'efficacité des
ressources des datacenters. Un pas important dans cette direction a été franchi par l'adoption
du paquet "Fit for 55" en juillet 2021.
De toute évidence, les mesures politiques doivent être mises en œuvre et l'un des principaux
obstacles à surmonter à cet égard est la myriade de concepts et de définitions des
datacenters et les paramètres de mesure de l'efficacité énergétique et des ressources. Nous
avons analysé les différents concepts utilisés au moment de l'étude et avons conclu qu'il est

Final Report: Greening DCs and ECNs: towards climate neutrality by 2050 27
recommandé d'utiliser la définition du CdC en tant que base de départ et de l'aligner sur celle
de la norme EN50600, puis de les ajouter aux documents des participants ou aux guides de
bonnes pratiques. Nous recommandons également d'éviter l'utilisation du terme "fournisseur
de services gérés" pour éviter toute confusion. Plus de détails sont fournis dans le chapitre
2.1. (Tâche 1.1.1.) où nous présentons, entre autres, une taxonomie des DC, et au chapitre
3.2. (Tâche 2.1.) où nous analysons la définition dans le contexte des applications des
mesures politiques. Les critères et les seuils de taille définis dans le tableau suivant ont été
perçus par les participants à l'atelier comme réalistes.
Critères et seuils de répartition des datacenters en fonction de la classe de taille (petite, grande, à grande échelle
• Taille • Petit datacenter • Grand datacenter • Datacenter à grande
échelle
• Superficie • 100 m² - 1000 m² • 1.000 m² - 10.000 m² • Plus que 10.000 m²
• Nombre de racks • 6 - 200 Racks • 200 - 2.000 Racks • Plus que 2.000 Racks
• Capacité de puissance • 50 kWel - 1 MWel • 1 MWel - 10 MWel • Plus que 10 MWel
En ce qui concerne les méthodes de mesure de l'efficacité énergétique et des ressources
des datacenters (tâche 1.1.3), nos analyses ont montré qu'il existe déjà un grand nombre de
méthodes et de mesures différentes qui se concentrent sur les datacenters et leurs
composants individuels. Les mesures de la série d'indicateurs clés de performance (ICP) de
la norme européenne pour les datacenters EN 50600-4, dont certaines sont encore en cours
de développement, sont particulièrement utiles car elles décrivent très systématiquement les
différentes caractéristiques environnementales des datacenters et les accompagnent de
méthodes de mesure spécifiques. Cependant, les mesures existantes sont clairement axées
sur les questions liées à l'énergie, et les aspects d'économie circulaire sont encore
insuffisamment couverts par les mesures. En ce qui concerne la protection du climat, les
quantités de fuites de réfrigérants des systèmes de refroidissement et les émissions de gaz à
effet de serre associées sont encore insuffisamment enregistrées.
Malgré les défis en termes de définitions et d'indicateurs, nous concluons qu'en appliquant les
trois mesures politiques, à savoir (i) les améliorations du CdC, (ii) les critères obligatoires de
marchés publics écologiques pour les datacenters, les salles de serveurs et les services de
cloud computing, et (iii) la création d'un registre européen des datacenters, et en mettant
simultanément en œuvre des spécifications cohérentes dans d'autres mesures politiques
(indirectes), il est possible d'établir un environnement réglementaire favorable qui encourage
l'écologisation des datacenters et de cloud computing, tant pour les grands datacenters
multinationaux que pour les PME opérant dans le segment périphérique..

Final Report: Greening DCs and ECNs: towards climate neutrality by 2050 28
Options politiques pour un mécanisme de transparence sur l'empreinte environnementale des réseaux et services de télécommunication
Sur base des analyses approfondies de l'étude, nous pouvons conclure qu'il existe
actuellement deux grands domaines d'intérêt pour l'optimisation écologique des
infrastructures de télécommunications :
• Le premier axe est le déploiement d'une infrastructure de réseau économe en énergie, par
exemple dans la construction de nouvelles stations de base ou antennes de téléphonie
mobile, de nouvelles armoires d'accès à Internet fixe ou le déploiement de câbles à haut
débit.
• Le deuxième axe est la fourniture de services de télécommunication écologiques par les
opérateurs de télécommunication, c'est-à-dire les contrats de téléphonie mobile ou à large
bande, les connexions téléphoniques fixes, les connexions Internet fixes, les lignes de
données interentreprises, la télévision par câble ou d'autres services qui nécessitent une
connexion fixe ou mobile au systèmes de télécommunication.
Déploiement de nouveaux composants de réseau
Pour la planification de nouveaux réseaux, le secteur ECN a développé une variété de
mesures (voir tâches 1.2.3 et 1.2.5) pour déterminer l'efficacité énergétique des composants
utilisés dès la phase de planification et pour construire des systèmes optimisés sur le plan
énergétique. Cette pratique pourrait être encouragée en accordant aux réseaux
particulièrement efficaces sur le plan énergétique un traitement plus favorable, par exemple
lors de l'octroi de permis (par exemple, procédures accélérées), lors de l'utilisation
d'infrastructures publiques (routes, canalisations de câbles, installations, fréquences) ou lors
des procédures de sélection pour les projets d'aide publique. En outre, l'étude propose que
les opérateurs de télécommunications enregistrent l'intensité énergétique du réseau dans un
registre central ou national (registre énergétique ECN), similaire au registre proposé pour les
centres de données, afin de créer une vue d'ensemble des différents fournisseurs et de
l'efficacité des différentes technologies de réseau. Les régulateurs, les acheteurs
professionnels ainsi que les investisseurs ou les institutions financières pourraient ainsi
obtenir un aperçu de l'efficacité du fournisseur respectif en effectuant des comparaisons dans
cette base de données. Les données contenues dans le registre énergétique ECN proposé
doivent être mises à disposition de manière transparente afin qu'elles puissent être traitées
ultérieurement, par exemple pour générer des informations pour les utilisateurs finaux sur
l'efficacité des fournisseurs.

Final Report: Greening DCs and ECNs: towards climate neutrality by 2050 29
Transparence envers les clients-consommateurs dans la prestation des services de télécommunication
L'un des objectifs de cette étude était d'examiner quelles mesures de transparence prises par
les fournisseurs de systèmes de télécommunication pourraient contribuer à garantir que les
clients des services de télécommunication puissent choisir des offres économes en énergie,
créant ainsi une concurrence pour les services les plus respectueux de l'environnement (tâche
1.2.4). À cette fin, divers paramètres ont été pris en compte et les opinions des organisations
de protection des consommateurs ont été sondées. La mesure de transparence possible la
plus prometteuse identifiée est l'introduction d'un type de label d'efficacité énergétique pour
les services de télécommunication. La consommation d'énergie spécifique du service de
communication pourrait être indiquée sur l'étiquette sous la forme d'une échelle de couleurs
et d'une classification de A à G. L'étiquette pourrait également contenir des informations sur
l'empreinte carbone du service et la part d'énergies renouvelables utilisées. Lors de la vente
et de la publicité des services de télécommunication, l'étiquette d'efficacité énergétique devrait
être affichée.
Cet instrument est déjà très bien établi sur le marché pour de nombreux appareils électriques
(lampes, réfrigérateurs, machines à laver, climatisations, etc.) et offre donc de bonnes
conditions pour qu'il soit bien reçu par les consommateurs. Il convient toutefois de noter qu'en
plus des défis méthodologiques, des défis méthodologiques et juridiques doivent encore être
surmontés, car l'étiquette d'efficacité existante est actuellement attribuée à des produits
physiques (marchandises) et ne pourrait pas être utilisée pour les services électroniques. Il
serait nécessaire de modifier l'orientation du règlement sur l'étiquetage énergétique en
passant des "produits liés à l'énergie" aux "produits et services liés à l'énergie". Outre les
clients privés, les informations fournies par le label d'efficacité énergétique pourraient
également être utilisées par les acheteurs professionnels et le secteur public dans le cadre
des marchés publics écologiques (MPE). Différentes options ont été examinées dans le cadre
de l'étude en ce qui concerne le paramètre sur lequel repose l'échelle d'efficacité.
Il est important pour une mesure appropriée qu'elle ne soit pas une mesure de performance
pure qui suppose par exemple un trafic de données maximal, mais que la demande d'énergie
soit liée à une unité d'utilisation compréhensible et réaliste (par exemple par connexion, par
abonné moyen ou par heure d'utilisation). Afin d'identifier la meilleure méthode de calcul pour
l'indicateur d'efficacité, des recherches supplémentaires sont donc nécessaires pour la
conception ultérieure d'un type de label d'efficacité énergétique.
La nécessité de respecter des exigences minimales en matière d'efficacité et d'écoconception
Les deux options politiques proposées (registre énergétique de systèmes de
télécommunication et label d'efficacité énergétique) sont des outils d'information destinés à
promouvoir la concurrence pour le service de télécommunication le plus efficace. Jusqu'à
présent, les informations sur l'efficacité énergétique des réseaux et services de
télécommunication sont encore très rares. Les opérateurs de réseaux ne mettent
généralement pas ces informations à la disposition du public. Par conséquent, il n'est pas non
plus possible de déterminer quelle est la consommation d'énergie appropriée pour un réseau
de communications électroniques. Toutefois, après l'introduction des mesures de
transparence mentionnées ci-dessus, cette situation des données pourrait changer.

Final Report: Greening DCs and ECNs: towards climate neutrality by 2050 30
L'évaluation des données dans le registre énergétique proposé pour les systèmes de
télécommunication et les informations sur le label d'efficacité énergétique par service de
télécommunication pourraient créer la base pour identifier les systèmes et services
inefficaces.
Pour l'avenir, les mesures de transparence pure pourraient être étendues et des instruments
politiques visant à fixer des exigences minimales d'efficacité devraient être introduits. L'étude
propose deux autres instruments qui pourraient être envisagés dans les années à venir. En
ce qui concerne le déploiement des systèmes de télécommunication, l'introduction
d'exigences minimales d'efficacité dans le processus d'octroi des permis ou comme condition
préalable au subventionnement des projets de déploiement pourrait promouvoir la
concurrence en matière d'efficacité. En ce qui concerne les services de télécommunication
(ECS), des exigences de type écoconception pour les services de télécommunication
pourraient fixer des normes d'efficacité et rendre ainsi le marché plus respectueux du climat.
Toutefois, il convient de noter que la directive actuelle sur l'écoconception s'applique aux
"produits liés à l'énergie", définis comme des biens, et non aux services. Pour ces deux
instruments politiques supplémentaires, il n'a pas encore été possible de réaliser des
évaluations d'impact dans le cadre de la présente étude en raison de la situation
insatisfaisante des données.

Final Report: Greening DCs and ECNs: towards climate neutrality by 2050 31
1. Introduction, background and objectives
1.1 The digital transformation and increased policy attention towards energy
efficiency and circular economy
Digital transformation describes a technological structural change characterised by increasing
computerisation and digital networking. This trend affects nearly all areas of the economy and
society, from technical infrastructures, industrial production facilities and administrations to
households as well as their equipment with consumer goods. The rapid digital transformation
of the economy and society entails a constantly increasing use of information and
communication technologies (ICT), as ever greater volumes of data have to be recorded,
processed, stored and transmitted. ICT hardware represents the material basis for the digital
transformation. In particular, the digital background infrastructures such as data transmission
networks and data centres are constantly increasing in scale and capacity. The International
Energy Agency estimates (IEA 2020)1, that the global internet traffic has grown 12-fold, or
around 30% per year since 2010. The global internet traffic is expected to double to 4.2 trillion
gigabytes by 2022. The more data we create, the more ecologically important data centres
and networks become (Liu et al. 2019). As a consequence of the global growth trend in data
volume transferred, a further increase in the global resource requirements for the
establishment of network equipment and the energy consumption for their operation is
expected, followed by an increase in e-waste volumes.
A comprehensive assessment of the global environmental impacts related to the total energy-
and resources demand of the whole digital infrastructure has not been undertaken thus far
(Köhler et al. 2018). However, regarding energy demand, it is estimated that the ICT sector
accounts for approximately 7% of the global electricity consumption, and it is forecasted that
the share will rise to 13% by 2030 (Bertoldi et al. 2017). It is important to note that this study
will focuses solely on data centres, and on the electronic communications services and
networks. The area of end-user devices is out of this study’s scope.
Total energy demand and carbon footprint
The electricity demand of data centres specifically is close to 0.8% of the global final electricity
demand, and amounts to approximately 200 TWh globally in 2019 (IEA 2020) (Figure 1). By
2030, their energy consumption is estimated to grow 5-fold up to 974 TWh worldwide (3.9%),
with a best-case scenario of 366 TWh (1.5%) (Andrae 2020a).2
1 IEA (2020). Data Centres and Data Transmission Networks, IEA, Paris. https://www.iea.org/reports/data-centres-and-data-transmission-networks#resources
2 Andrae, A.S.G. (2020a) New perspectives on internet electricity use in 2030. Engineering and Applied Science Letters DOI: 10.30538/psrp-easl2020.0038
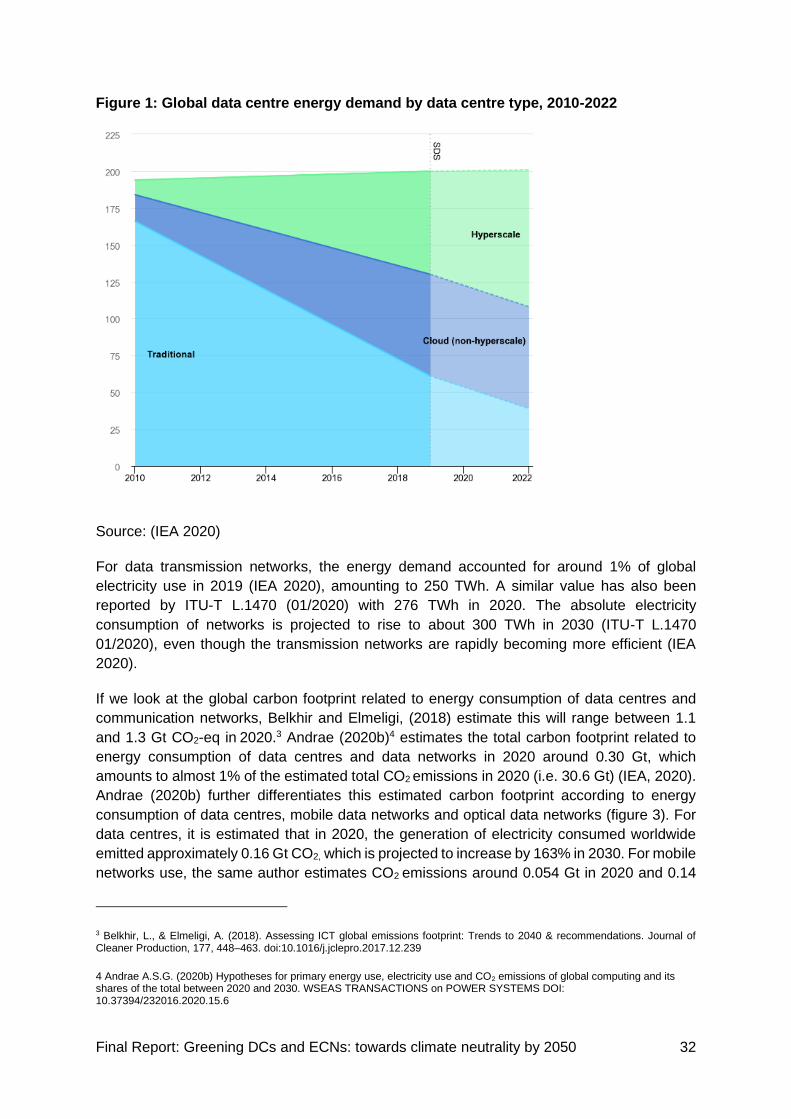
Final Report: Greening DCs and ECNs: towards climate neutrality by 2050 32
Figure 1: Global data centre energy demand by data centre type, 2010-2022
Source: (IEA 2020)
For data transmission networks, the energy demand accounted for around 1% of global
electricity use in 2019 (IEA 2020), amounting to 250 TWh. A similar value has also been
reported by ITU-T L.1470 (01/2020) with 276 TWh in 2020. The absolute electricity
consumption of networks is projected to rise to about 300 TWh in 2030 (ITU-T L.1470
01/2020), even though the transmission networks are rapidly becoming more efficient (IEA
2020).
If we look at the global carbon footprint related to energy consumption of data centres and
communication networks, Belkhir and Elmeligi, (2018) estimate this will range between 1.1
and 1.3 Gt CO2-eq in 2020.3 Andrae (2020b)4 estimates the total carbon footprint related to
energy consumption of data centres and data networks in 2020 around 0.30 Gt, which
amounts to almost 1% of the estimated total CO2 emissions in 2020 (i.e. 30.6 Gt) (IEA, 2020).
Andrae (2020b) further differentiates this estimated carbon footprint according to energy
consumption of data centres, mobile data networks and optical data networks (figure 3). For
data centres, it is estimated that in 2020, the generation of electricity consumed worldwide
emitted approximately 0.16 Gt CO2, which is projected to increase by 163% in 2030. For mobile
networks use, the same author estimates CO2 emissions around 0.054 Gt in 2020 and 0.14
3 Belkhir, L., & Elmeligi, A. (2018). Assessing ICT global emissions footprint: Trends to 2040 & recommendations. Journal of Cleaner Production, 177, 448–463. doi:10.1016/j.jclepro.2017.12.239
4 Andrae A.S.G. (2020b) Hypotheses for primary energy use, electricity use and CO2 emissions of global computing and its shares of the total between 2020 and 2030. WSEAS TRANSACTIONS on POWER SYSTEMS DOI: 10.37394/232016.2020.15.6

Final Report: Greening DCs and ECNs: towards climate neutrality by 2050 33
Gt CO2 in 2030, a rise of 150%. Emissions for optical data networks are estimated at 0.083 Gt
CO2 in 2020 and are expected to rise by 81% in 2030 (ibid).
Figure 2: Global estimated carbon footprint related to energy consumption (in Gt CO2), 2020-2030
Source: based on data from Andrae A.S.G. (2020), table 6
Energy efficiency
It is noteworthy that the total power consumption of data centres worldwide has not grown
much since 2010 despite a 7.5-fold increased computation workload and a 12-fold increase
in network traffic. Clearly, the energy efficiency of data centres has steadily increased during
the past decade. This is mainly the result of a transition from small scale data centres to highly
energy efficient “hyperscale” data centres. Such large-scale data centres are big investments
that can aim for optimal processor efficiency and reductions in idle-state power consumption
(due to better workload planning) (Masanet, et al., 2020). As can be seen in Figure 3, global
capital expenditure has more than doubled from 13 billion euros in 2016 to over 29 billion
euros in Q4 2019. This trend is not expected to slow down in the foreseeable future with
Amazon, Google, Microsoft, Facebook and Apple spending the most on hyperscale capital
expenditure.5
5 Synergy Research Group – Statista estimates, (2019), Global hyperscale operators capital expenditure (CAPEX) from 1st
quarter of 2016 to 4th quarter of 2019, consulted online: https://www.statista.com/statistics/1109393/global-hyperscale-
operators-quarterly-capex/
0,00
0,10
0,20
0,30
0,40
0,50
0,60
0,70
0,80
2020 2030
Data centres Mobile data networks Optical data networks
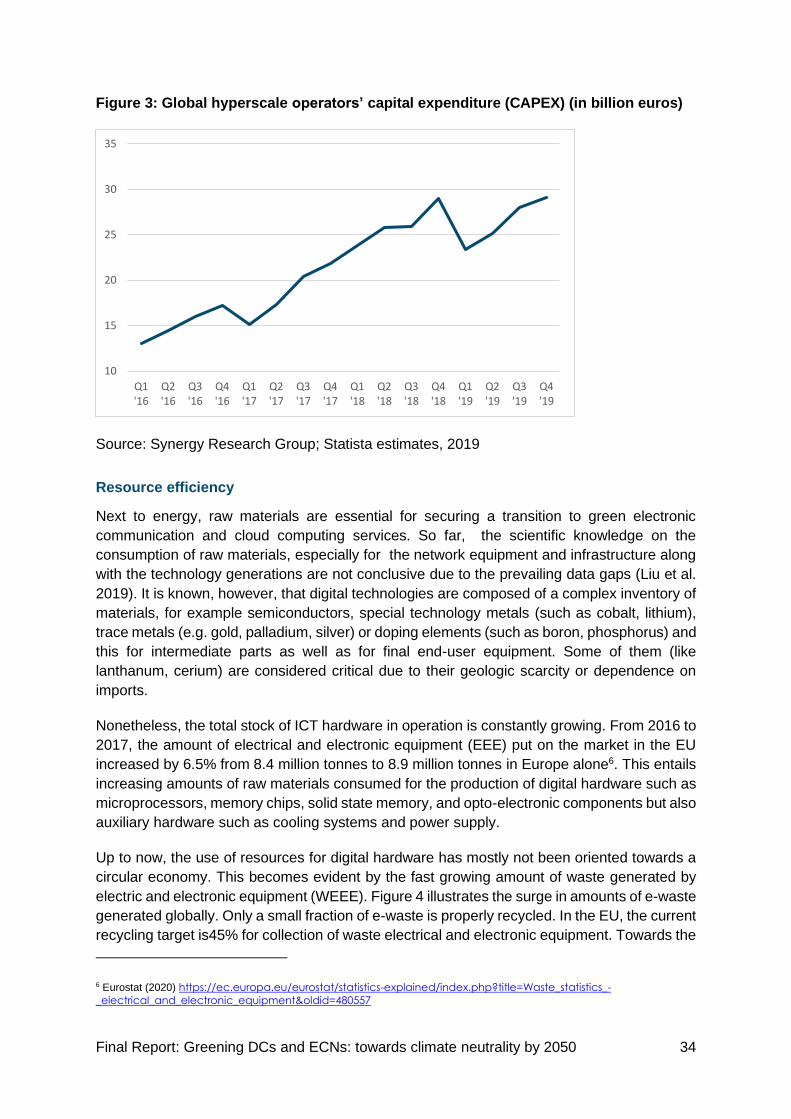
Final Report: Greening DCs and ECNs: towards climate neutrality by 2050 34
Figure 3: Global hyperscale operators’ capital expenditure (CAPEX) (in billion euros)
Source: Synergy Research Group; Statista estimates, 2019
Resource efficiency
Next to energy, raw materials are essential for securing a transition to green electronic
communication and cloud computing services. So far, the scientific knowledge on the
consumption of raw materials, especially for the network equipment and infrastructure along
with the technology generations are not conclusive due to the prevailing data gaps (Liu et al.
2019). It is known, however, that digital technologies are composed of a complex inventory of
materials, for example semiconductors, special technology metals (such as cobalt, lithium),
trace metals (e.g. gold, palladium, silver) or doping elements (such as boron, phosphorus) and
this for intermediate parts as well as for final end-user equipment. Some of them (like
lanthanum, cerium) are considered critical due to their geologic scarcity or dependence on
imports.
Nonetheless, the total stock of ICT hardware in operation is constantly growing. From 2016 to
2017, the amount of electrical and electronic equipment (EEE) put on the market in the EU
increased by 6.5% from 8.4 million tonnes to 8.9 million tonnes in Europe alone6. This entails
increasing amounts of raw materials consumed for the production of digital hardware such as
microprocessors, memory chips, solid state memory, and opto-electronic components but also
auxiliary hardware such as cooling systems and power supply.
Up to now, the use of resources for digital hardware has mostly not been oriented towards a
circular economy. This becomes evident by the fast growing amount of waste generated by
electric and electronic equipment (WEEE). Figure 4 illustrates the surge in amounts of e-waste
generated globally. Only a small fraction of e-waste is properly recycled. In the EU, the current
recycling target is45% for collection of waste electrical and electronic equipment. Towards the
6 Eurostat (2020) https://ec.europa.eu/eurostat/statistics-explained/index.php?title=Waste_statistics_-
_electrical_and_electronic_equipment&oldid=480557
10
15
20
25
30
35
Q1'16
Q2'16
Q3'16
Q4'16
Q1'17
Q2'17
Q3'17
Q4'17
Q1'18
Q2'18
Q3'18
Q4'18
Q1'19
Q2'19
Q3'19
Q4'19

Final Report: Greening DCs and ECNs: towards climate neutrality by 2050 35
transition to a circular economy, there is still a sizeable unexploited potential for recovery of
resources from WEEE.
Figure 4: Electronic waste generated worldwide from 2010 to 2019
Source: The Global E-Waste Monitor (2020) p.247
Existing EU policy initiatives
The general ambition to facilitate and stimulate the digital transition while also working toward
climate-neutrality is embodied in the new Industrial Strategy8 launched by the Commission in
March 2020 and updated in May 20219. The Industrial Strategy is based on three main focus
areas: the green transition, the digital transition and global competitiveness. Designed to
support all minor and major players, the strategy could be seen as a cornerstone for all
European industries as the Commission aims to remove barriers to the single market for
European companies while also working toward climate-neutrality. The European Green Deal
represents a paradigm shift in European politics that is designed to lead the change towards
making the European economy digitalised and environmentally sustainable. The long-term
goal of the new growth strategy is to make Europe the first carbon neutral continent by 2050.
The intermediate goal is to decrease greenhouse gas emissions by 55% by 2030. This entails
7 The Global E-Waste Monitor (2020) Quantities, flows, and the circular economy potential, GEM_2020_def_dec_2020-1.pdf
(ewastemonitor.info)
8 European Commission (2020) A New Industrial Strategy for Europe, available at https://eur-lex.europa.eu/legal-
content/EN/TXT/?qid=1593086905382&uri=CELEX:52020DC0102
9 European Commission (2021), Updating the 2020 industrial strategy: towards a stronger single market for Europe's recovery,
available at https://ec.europa.eu/growth/content/updating-2020-industrial-strategy-towards-stronger-single-market-
europes-recovery_en

Final Report: Greening DCs and ECNs: towards climate neutrality by 2050 36
greater efforts in Research & Development & Innovation (R&D&I) that will eventually shape
EU policy and have a direct impact on industry and civil society.
Clean and energy-efficient digital technologies are considered essential to enabling access to
the digital information society and to securing growth and sustainable consumption. Within the
Green Deal it is recognised that, although digital technologies may enable green solutions,
measures to further improve energy efficiency and circular economy performance of these
technologies themselves need to be put in place. This package puts forward energy efficiency
as a key objective. In the Commission’s priority ‘A Europe fit for the digital age’ actions were
previewed to make sure the digital strategy of the EU is in line with achieving climate neutrality
by 2050.
An important step in the mitigation of environmental impacts of digital technologies, is
acquiring insight in the energy and circular economy performance of (the production and use
of) ICT hardware. To this end, transparent and coherent indicators to properly inform,
compare, monitor, evaluate, and ultimately improve life cycle energy use and footprint, are of
paramount importance. Some policy actions take this insight explicitly into account. A first
example is the Communication ‘Shaping Europe’s Digital Future’ of February 202010 that
refers to transparency measures for telecom operators on their environmental footprint.
Another example is the Circular Economy Action Plan11 that envisions the development of
environmental accounting principles, a better environmental data disclosure and mandatory
green public procurement rules in sectoral legislation combined with compulsory reporting.
Within this Action Plan the Circular Electronics Initiative is one of the key actions for product
value chains. Moreover, at the time of the study, the Commission is elaborating a proposal for
a regulation on Product and Organisation Environmental Footprint methods (PEF/OEF)12 that
requires companies to substantiate their claims about the environmental footprint of their
products and services, making use of standard quantification methods. Additionally, the
Commission is working on a proposal for a directive with the aim to strengthen the role of
consumers in the green transition.13 The proposal targets three fronts i) relevant and reliable
information, ii) preventing greenwashing and iii) the setting of minimum requirements for
sustainability logos and lables.
10 Communication Shaping Europe’s digital future, COM(2020) 67.
11 European Commission (2020) A new Circular Economy Action Plan – For a cleaner and more competitive Europe, Brussels,
11.3.2020 COM(2020) 98 final, available from EUR-Lex - 52020DC0098 - EN - EUR-Lex (europa.eu)
12 Environmental performance of products and businesses – substantiating claims; for more detail see Environmental
performance of products & businesses – substantiating claims (europa.eu)
13 Consumer policy – strengthening the role of consumers in the green transition; for more detail see Consumer policy –
strengthening the role of consumers in the green transition (europa.eu)

Final Report: Greening DCs and ECNs: towards climate neutrality by 2050 37
1.2. Measuring circular economy performance of data centres and cloud
computing, electronic communications services and networks
Digitalisation and the circular economy are closely interlinked. Circularity of data centre and
cloud computing services refers to the efficient use of the resources that are allocated in data
centres and digital networks in form of ICT-hardware, consisting of semiconductors and other
materials as well as metals and plastics, which form the material base of computing services.
The Circular Economy Action Plan of the European Commission14 aims to “reduce its
consumption footprint and double its circular material use rate in the coming decade.” In the
context of ICT, circularity is understood as instrumental to preserve resources and make the
EU economy more independent from imports of critical raw materials. This should be achieved
by increasing product lifetimes (by means of fostering repair, re-use) as well as updating
obsolete software. Moreover, improving the collection and treatment of Waste Electrical &
Electronic Equipment (WEEE) is an important instrument to improve the circularity of the ICT
sector, which is regulated in the WEEE directive15 and in a wider sense by the Waste
Framework Directive16.
Additionally, circularity is related to the potential that digital services bear towards the
dematerialisation of the economy. Digital services can create value on an immaterial level.
Digitally enabled applications could make significant contributions towards a circular economy,
e.g. with the help of interconnected digital tools, which may help improve the use of natural
resources, design, production, consumption, reuse, repair, remanufacturing, recycling, and
waste management.
Nevertheless, digital services require a material basis of ICT hardware, in fact – the ongoing
digital transformation causes a substantial increase in demand for new and more powerful ICT
hardware, notably backbone infrastructure such as data networks and data centres. Data
centres and data transmission networks including their infrastructures cause a variety of
undesired impacts on the ecological sustainability, notably the increasing consumption of
energy and raw materials. From this background, the policy target of increasing the circularity
of the EU economy necessitates the ICT hardware to become circularity compatible. To this
end, several strategies need to be implemented in the design and planning as well as
operation of digital infrastructures.
There are many approaches to increase the circularity of ICT. Some examples are extended
producer responsibility, improving the framework conditions for the repair and reuse of
hardware, increasing the collection rate of ICT goods, monitoring critical raw materials, or
14 Communication from the Commission to the European Parliament, the Council, the European Economic and Social Committee and the Committee of the Regions: A new Circular Economy Action Plan For a cleaner and more competitive Europe, COM(2020) 98.
15 Directive 2012/19/EU of the European Parliament and of the Council of 4 July 2012 on waste electrical and electronic equipment
(WEEE) (recast) , retrieved from https://eur-lex.europa.eu/legal-content/EN/TXT/?uri=CELEX:02012L0019-20180704
16 Directive 2008/98/EC of the European Parliament and of the Council of 19 November 2008 on waste and repealing certain
Directives , retrieved from EUR-Lex - 32008L0098 - EN - EUR-Lex (europa.eu)
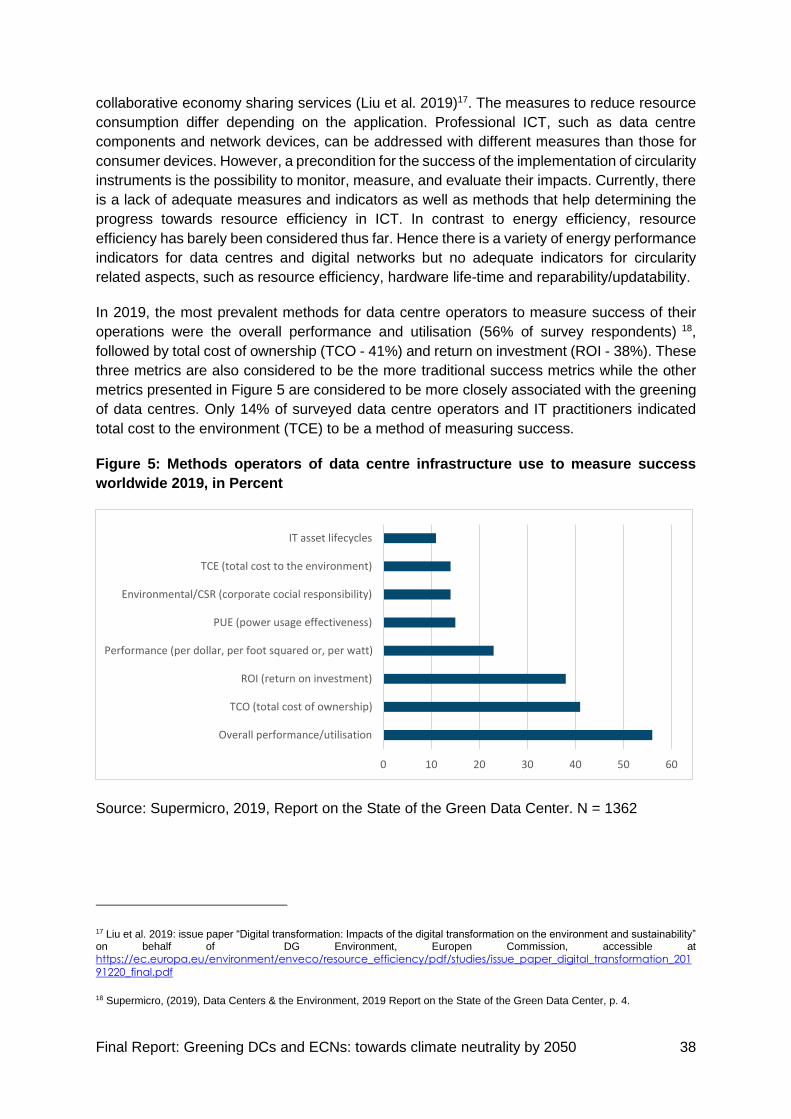
Final Report: Greening DCs and ECNs: towards climate neutrality by 2050 38
collaborative economy sharing services (Liu et al. 2019)17. The measures to reduce resource
consumption differ depending on the application. Professional ICT, such as data centre
components and network devices, can be addressed with different measures than those for
consumer devices. However, a precondition for the success of the implementation of circularity
instruments is the possibility to monitor, measure, and evaluate their impacts. Currently, there
is a lack of adequate measures and indicators as well as methods that help determining the
progress towards resource efficiency in ICT. In contrast to energy efficiency, resource
efficiency has barely been considered thus far. Hence there is a variety of energy performance
indicators for data centres and digital networks but no adequate indicators for circularity
related aspects, such as resource efficiency, hardware life-time and reparability/updatability.
In 2019, the most prevalent methods for data centre operators to measure success of their
operations were the overall performance and utilisation (56% of survey respondents) 18,
followed by total cost of ownership (TCO - 41%) and return on investment (ROI - 38%). These
three metrics are also considered to be the more traditional success metrics while the other
metrics presented in Figure 5 are considered to be more closely associated with the greening
of data centres. Only 14% of surveyed data centre operators and IT practitioners indicated
total cost to the environment (TCE) to be a method of measuring success.
Figure 5: Methods operators of data centre infrastructure use to measure success
worldwide 2019, in Percent
Source: Supermicro, 2019, Report on the State of the Green Data Center. N = 1362
17 Liu et al. 2019: issue paper “Digital transformation: Impacts of the digital transformation on the environment and sustainability” on behalf of DG Environment, Europen Commission, accessible at
https://ec.europa.eu/environment/enveco/resource_efficiency/pdf/studies/issue_paper_digital_transformation_201
91220_final.pdf
18 Supermicro, (2019), Data Centers & the Environment, 2019 Report on the State of the Green Data Center, p. 4.
0 10 20 30 40 50 60
Overall performance/utilisation
TCO (total cost of ownership)
ROI (return on investment)
Performance (per dollar, per foot squared or, per watt)
PUE (power usage effectiveness)
Environmental/CSR (corporate cocial responsibility)
TCE (total cost to the environment)
IT asset lifecycles

Final Report: Greening DCs and ECNs: towards climate neutrality by 2050 39
Concerning the current circular economy performance of data centres and communication
networks, we can conclude that:
• No comprehensive analysis of circular economy performance of data centres
and data transmission network exists.
• Systemic impacts of ICTs and their application on the environment (or ‘third-
order’ effects) should be investigated for cloud computing services and digital
applications, including the intended and unintended consequences such as the
medium- or long-term adaptation of behaviour (e.g. consumption patterns) or
economic structures. The most-discussed effect is the rebound-effect, which
means that efficiency gains are cancelled out or overcompensated for by
increased use (e.g. more intensive lighting through energy-efficient LED
luminaires). However, quantifying systemic impacts is currently not possible
due to i) complexity, and various factors involved, ii) methodological issues and
iii) data gaps.
• There is a need to establish a comprehensive database of information
regarding the material inventory of data centres and data transmission
networks and their infrastructures, at least in the EU.
• There is a need to map and describe best practices regarding maintenance,
re-use, refurbishment, re-manufacturing as well as secondary markets for data
centre components and materials.
• There is a need to establish the degree of ‘circularity’ of data centre operations
at the material resource level and map the end-of-life pathways of the data
centre hardware.
• Finally, appropriate indicators, metrics and policy measures should be
developed in order to close the loop for material resources related to data
centres and digital networks
1.3. Objectives of the Study
Given the large energy and material resource requirements of data creation, transmission,
storage and use described in sections 0 and 0, and the increasing demand of industries that
are going digital as well as private consumers requiring digital services, it is important to
introduce measures to enhance energy efficiency and require improved circular practices from
data centres, as well as electronic communication services and networks. The COVID-19
pandemic has further highlighted the need for policy measures to promote circularity and
resource and energy efficiency19. Specifically in the digital sector, the pandemic has opened
a window for change in business models (3DP, IoT, AI, robotics, DLT, …), work organisation
and even social and cultural events, further exacerbating the need for an energy efficient and
circular digital sector.
Together with the increased attention of policy and society to the momentum of digital
solutions, their environmental footprint is gaining attention. Helping to achieve optimal energy
19 WEF (2020), Opportunities for a circular economy post COVID-19, online:
https://www.weforum.org/agenda/2020/06/opportunities-circular-economy-post-covid-19/
Final Report: Greening DCs and ECNs: towards climate neutrality by 2050 40
efficiency rates and circular economy performance while avoiding adverse economic and
social impacts on society is the ultimate goal of the study, contributing to achieving climate
neutrality by 2050 as stated in the Green Deal.
In order to provide a clear view and a common base of understanding, the study starts by
providing a set of definitions of data centres and cloud computing services that can be
supported by the various stakeholders involved in the field, allowing to appreciate the
differences between them with respect to size, services provided, and other criteria identified
as important. Once a clear use of terms and definitions has been allowed for, an extensive
analysis of data centres, cloud computing institutions, electronic communications services and
networks provides an overview of current industry practices both for data centres and cloud
computing, and for electronic communications services and networks.
More specifically, the goals for the respective parts of the digital value chain under the scope
of the study are:
Data centres and cloud computing:
1. To propose policy measures for increasing the energy and resource efficiency
of data centres and assess the environmental, social and economic impact.
2. In support of that objective to perform:
o An analysis of data centre definitions and types and determine
meaningful size thresholds;
o An analysis of current market practices related to circularity and identify
potential ways to increase circularity;
o An analysis of standards, metrics, indicators, methods and
methodologies that are currently used in the field for assessing energy
and resource efficiency and an assessment of their suitability for
inclusion in policy measures
o To identify gaps in the value chains where potential for energy efficiency
and/or circularity is lost and potential measures to bridge these gaps;
Electronic communications services and networks:
1. To propose policy options that could be included in a transparency mechanism
on the environmental footprint of ECNs and in view of this:
o To report practices, indicators, standards and methodologies related to
the environmental footprint of electronic communications networks and
services
o To report on sustainability aspects of the service offered to consumers
(in particular to assess a number of possible indicators in view of end-
user communication and for analysing the impact of a voluntary and
mandatory transparency mechanism on the environmental footprint of
electronic communications services and on relevant stakeholders.
2. To consider criteria for the assessment of the environmental sustainability of
new electronic communications networks.
Final Report: Greening DCs and ECNs: towards climate neutrality by 2050 41
From an ICT value chain perspective, the study focusses on data centres and cloud computing
and on the electronic communications services and networks. The area of end-user devices
is out of this study’s scope.
Table 1 provides an overview of the various objectives of this study ordered along two
dimensions: horizontally the particular segments of the ICT value chain that this study
focusses on: Data Centres and Cloud Computing on the one hand and Electronic
Communications Services and Networks on the other hand. The vertical dimension highlights
the process steps and tasks in the study ordered in two major blocks: part 1 indicators and
standards and part 2 policy measures and options.
The results from our analyses on indicators and standards in part 1 are used as input for part
2, where we have provided an in-depth qualitative and, where possible, quantitative
assessment of policy options that contribute towards greening cloud computing and electronic
communications services and networks.

42
Table 1: Objectives in the subsequent tasks ordered by ICT value chain segment and part in the study process
Part 1 – Indicators and standards
Part 2 – Policy measures and options
Task 1.1.1
•Overview and market analysis of a validated set of definitions of data centers, cloud and edge forms of computing also referencing computing facilities left outside of the proposed definitions according to size and funciontality
Task 1.1.2
•Mapping of current practices on material resource level and overview/mapping of component life-cycles relating to maintenance, re-use, refurbishment, re-manufacturing and secondary markets through indicators and metrics
Task 1.1.3
•Proposal of a harmonised measurement framework for energy and resource efficiency based on the evaluation of current existing methods, industry practices in regard to Environmental footprint methods
Task 2.2.1
•Impact assessment of different policy options for an EU-wide transparency measure on the environmental footprint of electronic communications networks and services, in particular regarding energy consumption and GHG emissions including costs for stakeholders Task 2.1.1
•Elaboration of policy measures to make data centres and cloud computing more energy efficient and assessment of expected environmental, economic and social impact of these policy options.
Data Centres and Cloud Computing Electronic Communications Services and Networks
Task 1.2.1
•Current practices of electronic communications network operators and service providers for reporting of their environmental performance and options for communicating the environmental benefits to end-users
Task 1.2.2
•Current practices on the assessment of the environmental sustainability of new electronic communications networks including all relevant metrics
Task 1.2.3
•Current standards and measurement methodologies for the monitoring of environmental footprint of electronic communications network and services based on the Environmental Footprint method
Task 1.2.4
•Assessment of the suitability of indicators from consumer perspective
Task 1.2.5
•Criteria for the assessment of the environmental sustainability of new electronic communications networks

43
2. Final Results Part 1 – Indicators and Standards
2.1. Task 1.1: Indicators and standards: Data Centres and Cloud Computing
Task 1.1.1: Propose possible definitions of data centres
Aim of this task
Measuring energy efficiency, circular economy performance and environmental impact of data
centres presumes clarity on the meaning of a data centre. Given the plethora of definitions
currently used in practice, the key objective of this task is to provide the European Commission
with a set of clear definitions of data centres that allow for meaningful distinctions on the basis
of size and other commonly identified criteria and an assessment of the impact of these
definitions on the EU data centre market constellation (market analysis). It is also asked to
recommend, based on the analysis undertaken in Task 1.1.1., a specific definition option that
takes into account the particularities of EU cloud service providers.
What is a Data Centre? General definitions.
A broad definition of a data centre that is used by several standardisation organisations
(ISO/IEC, ETSI, CEN-CENELEC) is the one provided in the EN50600 Series of standards
developed by the European Committee for Electrotechnical Standardization (CENELEC):
Definition 1 (EN50600)
“A structure, or group of structures, dedicated to the centralised accommodation,
interconnection and operation of information technology and network telecommunications
equipment providing data storage, processing and transport services together with all the
facilities and infrastructures for power distribution and environmental control together with the
necessary levels of resilience and security required to provide the desired service availability”.
As an addition to this definition two notes are provided20:
- Note 1: A structure can consist of multiple buildings and/or spaces with specific
functions to support the primary function.
- Note 2: The boundaries of the structure or space considered the data centre, which
includes the information and communication technology equipment and supporting
environmental controls, can be defined within a larger structure or building.
This broad definition encompasses several dimensions that need to be simultaneously present
to determine what a data centre is:
- Infrastructure (structure/group of structures) for the accommodation, interconnection,
and operation of:
o Information technology and,
o Network telecommunications equipment.
20 Not every standardisation organisation adds (all of) the notes to definition 1.

44
- Services: data storage, processing and transport services.
- Facilities and infrastructure:
o For power distribution and,
o Environmental control.
- Resilience and security to provide the desired service availability.
Although this definition provides a broad understanding of what a data centre is and what it is
not, this definition could for example also include a device for data storage and processing in
a car as a data centre as no minimum size requirements are put forward or a distinction
between a static or mobile structure is being made. On the other hand, on its own, it doesn’t
suffice to make meaningful distinctions between data centres. ETSI defines a site containing
a data centre defined as above as an ICT site (ETSI EN 305 174)21.
Another general definition of data centres is the one put forward by the EU Horizon2020
EURECA Project22:
Definition 2 (EURECA Project)
“Is an environment hosting digital services, with power reliability equipment (UPS, Generators,
power switches, PDUs, etc.) and controlled ambient conditions (cooling and humidity).”
Although quite similar to the EN50600 definition (definition 1), this definition focuses on the
necessity of the provision of power reliability equipment while managing cooling and humidity
within a certain environment. If there is no cooling or no UPS one cannot speak of a data
centre. Compared to the EN50600 definition it does not provide an interpretation of what digital
services exactly are, does not imply infrastructure is necessary to control ambient conditions
(as long as there is intentional ambient control, e.g. underwater), and does not mention IT
infrastructure and network and telecommunications equipment. Avoiding the term
‘infrastructure’ in the context of controlling ambient conditions, leaves room for including
smaller structures without active cooling equipment. Even Though the EN50600 definition
does not state that you can only speak of a data centre when there is IT infrastructure and
network equipment present, it does slightly suggest this by mentioning IT infrastructure and
network equipment explicitly. Avoiding this could make it easier to designate for example a
building with just cooling and power equipment as a data centre. Similar to the EN50600
definition, the specific environment that constitutes a data centre is not specified, it could be a
building, a space within a building, a group of buildings, a car, etc. In short, this second
definition put forward by EURECA seems to imply a broader coverage in terms of what can
be considered a data centre.
Examples of specific definitions used by ICT (infrastructure) companies
General definitions of data centres used in industry are similar to definitions 1 and 2 but vary
depending on the key activities of the company considered. Common to all is that they don’t
mention aspects of resilience and security in contrast to the EN50600 general definition. AFL
21 https://www.etsi.org/deliver/etsi_ts/105100_105199/10517402/01.03.01_60/ts_10517402v010301p.pdf
22 Rabih Bashroush, EU H2020 EURECA Project, 2018.

45
Hyperscale, a cabling and connectivity solutions provider for data centres, defines a data
centre as “essentially a building that provides space, power and cooling for network
infrastructure. They centralize a business’s IT operations or equipment, as well as store, share
and manage data”(definition 323, AFL Hyperscale) highlighting the importance of network
infrastructure.
Cisco, producer of IT and network components, describes a data centre as “a physical facility
that organisations use to house their critical applications and data. A data centre’s design is
based on a network of computing and storage resources that enable the delivery of shared
applications and data. The key components of a data centre design include routers, switches,
firewalls, storage systems, servers, and application-delivery controllers” (definition 424, Cisco),
elaborating specifically on the various key components of IT infrastructure and network
equipment.
Digital Reality, a real estate investment trust that invests in carrier-neutral data centres and
provides colocation and peering services, puts more emphasis on the building itself by defining
a data centre as “a physical location – most commonly a building – that houses core IT and
computing services and infrastructure.” (definition 525, Digital Reality).
During several interviews with primarily data centre associations, it became clear that a broad
definition of data centres is desired which allows the inclusion of a great variety of possible
structures/environments in terms of size, ownership and other criteria to ensure a level playing
field.
How to distinguish Data Centres? The most important typologies.
Purpose/business model/ownership
One of the most commonly used distinctions between data centres that is widely used in the
literature26 is the purpose of the data centre which is often linked (albeit sometimes implicitly)
in the definitions to ownership of the data centre and what’s in it (e.g. support infrastructure or
IT-equipment).
- Enterprise data centre: a data centre that is operated by an enterprise which has the
sole purpose of the delivery and management of services to its employees and
customers;
- Colocation data centre (CoLo): a data centre in which multiple customers locate their
own network(s), servers and storage equipment. The support infrastructure of the
23 https://www.aflhyperscale.com/understanding-different-types-of-data-center
24 https://www.cisco.com/c/en/us/solutions/data-center-virtualization/what-is-a-data-center.html
25 https://www.digitalrealty.com/what-is-data-center
26 Standards: EN50600, ISO/IEC TS 22237; Other: e.g. Dodd, N., Alfieri, F., Maya-Drysdale, L., Viegand, J., Flucker, S., Tozer, R., Whitehead, B., Wu, A., Brocklehurst F.,. Development of the EU Green Public Procurement (GPP) Criteria for Data Centres Server Rooms and Cloud Services, Final Technical Report,, EUR 30251 EN, Publications Office of the European Union, Luxembourg, 2020, ISBN 978-92-76-19447-7, doi:10.2760/964841, JRC118558,

46
building (such as power distribution and environmental control) is provided as a service
by the data centre operator.
In an enterprise data centre, the data centre facility and IT-infrastructure is operated by one
company and the only user is the company itself (its employees and customers). In a
colocation data centre, the data centre operator provides support infrastructure, but customers
have their own IT-equipment and services/applications. These definitions are systematically
used in the current standards that are under development such as EN 50600 and ISO/IEC TS
22237. The most important distinguishing criterion between an enterprise and a colocation
data centre is the ownership of the IT-equipment (networks, servers and storage equipment):
the data centre operator (colocation) or the customer(s) (enterprise).
According to Salom et al (201727) the enterprise data centre type, that can be on-premise or
off-premise28, can be subdivided into business supporting data centres and business critical
data centres.
- Business supporting data centre, where the primary function is to support the
activities of the firm. In general, these Data Centres will provide safe, secure and
reliable hosting facilities for the firms core IT systems. Since the Data Centres are not
leading, but supporting, they are most frequently situated close to the actual firm or
organisation, and therefore at short distance of the actual activities.
- Business critical data centre, which are an integral part of the main business
process. These are, for example, the commercial telecom data centres and data
centres of financial institutions. The data centre is at the core of their business process.
Therefore, these Data Centres are situated at locations that are beneficial for the IT
processes, based on criteria such as (not limited) distance to the customers, distance
to a (large) power plant, cost and availability of land, (transatlantic) glass fibre
connectivity or carrier neutrality options.
Also within the class of colocation data centres a further distinction in multiple subtypes is
used in practice. The most popular distinction is the retail versus the wholesaled data centre.
Equinix29 describes both as follows:
- Retail colocation: In retail colocation, companies rent rack, cage or cabinet space for
deploying their own IT equipment. In this model, companies have limited control over
the space, but the cabling, racks, power, cooling, fire suppression systems, physical
security and other amenities are immediately available.
- Wholesale colocation: A wholesale model allows companies to determine how the
space is designed and built, but it also requires a commitment to lease much bigger
chunks of space and power, commonly based on one or more discrete power
27 J. Salom, T. Urbaneck and E. Oró (2017). Advanced Concepts for Renewable Energy Supply of Data Centres.
28 “On-premise" refers to private data centres that companies house in their own facilities and maintain themselves. Source:
https://www.hpe.com/emea_europe/en/what-is/on-premises-vs-cloud.html . The difference between on-premise and off-premise data centres was indicated by a respondent in our survey.
29 Michael Winterson (2020). Hyperscale vs. Colocation. Choosing the right digital infrastructure model for your business . Equinix
https://blog.equinix.com/blog/2020/08/27/hyperscale-vs-colocation/

47
distribution units, such as a 2 MW generator. Usually they also need to bring all their
own resources to design and construct the space: racks, cabinets, power, etc., as well
as the staff to run and maintain the space.
Varying on the specific source, additional popular data centre definitions primarily based on
purpose/ownership/business model are used: (co-)hosting data centres, managed service
provider (MSP) data centres, network operator data centres, etc. What is often lacking in the
definitions provided, even in the same source, is how they compare to each other especially
with respect to mutual exclusiveness.
EN50600 defines in addition to enterprise and colocation data centres, hosting, co-hosting
and network provider data centres. These types of data centres are defined as follows:
- Cohosting data centre: data centre in which multiple customers are provided with
access to network(s), servers and storage equipment on which they operate their own
services/applications. Both the information technology equipment and the support
infrastructure of the building are provided as a service by the data centre operator.
- Hosting data centre: a data centre within which ownership of the facility and the
information technology equipment is common but the software systems are dictated
by others. In short a hosting data centre hosts the software of its customers while
owning/operating the support infrastructure and IT equipment.
- Network operator data centre: a data centre that has the primary purpose of the
delivery and management of broadband services to the operators’ customers.
Based on the first two definitions, a co-hosting data centre is a hosting data centre that hosts
multiple customers. Crucial in both definitions is that customers of these types of data centres
don’t own support infrastructure nor IT-infrastructure, but do determine the services and
software applications of their choice.
A network operator data centre can, based on the above definition, not be seen as distinct
from the enterprise data centre defined earlier: a data centre owned by a network operator
could be seen as an enterprise data centre. A data centre owned by another company than
the network operator that has one or more network providers as customers could also be
designated as a network operator data centre (cf. the earlier definition of a business critical
data centre) . Also AFL Hyperscale30 designates a network operator data centre as a telecom
data centre and states it is a facility owned and operated by a telecommunications or service
provider company.
In a summary report of a 2014 workshop organised by DG CONNECT31, several often used
types of data centres are linked to who could gather and monitor the necessary information
30 https://www.aflhyperscale.com/understanding-different-types-of-data-center
31 Environmentally sound Data Centres: Policy measures, metrics, and methodologies. DG CONNECT workshop. 1 April 2014.
https://ec.europa.eu/digital-single-market/en/news/report-workshop-green-data-centres-policy-measures-metrics-
and-methodologies

48
and data that are required to quantify energy efficiency and environmental performance (Box
1).
Box 1: Linking data centre types to information on energy efficiency and environmental performance
Enterprise data centre: Owner, operator and (main) user of data centre is the same
organisation, bearing all energy cost and having access to all relevant energy efficiency and
environmentally relevant data.
Co-hosting data centre: Both the information technology equipment and the support
infrastructure of the building are provided as a service by the data centre operator, who
bears initially all energy costs, while users pay indirectly, depending on their
contracts/tariffs, which are not related to energy consumption and often are flat rates.
Energy efficiency and environmentally relevant data is available at the same organisation.
Co-location data centre: The support infrastructure of the data centre (such as power
distribution, security and environmental control) is provided as a service by the data centre
infrastructure operator, who bears all initial energy costs. Customers pay energy costs to
data centre infrastructure operator, based on their contract which include actual energy
consumption and a possible fee related to the additional energy costs such as cooling
systems, UPS and other losses. Energy efficiency and environmentally relevant data is
hence spread across different actors.
Network operator data centre: The data centre operator bears initially all energy costs and
the final users pay indirectly, depending on their contracts/tariffs, while these are not related
to energy consumption and often are flat rates; similar to “Co-hosting data centre”. Energy
efficiency and environmentally relevant data is spread across different actors.
Source: Summary report of 2014 workshop organised by DG CONNECT32
A recent JRC report on the development of the EU Green Public Procurement Criteria for data
centres, server rooms and cloud services33 adds a third category, next to enterprise and
colocation data centres, to make a mutually exclusive distinction between three types of data
centres34, namely Managed Service Providers (MSP) . This is a data centre offering server
and data storage services where the customer pays for a service and the vendor provides and
manages the required ICT hardware/software and data centre equipment. The report states
32 Environmentally sound Data Centres: Policy measures, metrics, and methodologies. DG CONNECT workshop. 1 April 2014.
https://ec.europa.eu/digital-single-market/en/news/report-workshop-green-data-centres-policy-measures-metrics-
and-methodologies
33 Dodd, N., Alfieri, F., Maya-Drysdale, L., Viegand, J., Flucker, S., Tozer, R., Whitehead, B., Wu, A., Brocklehurst F.,. Development of the EU Green Public Procurement (GPP) Criteria for Data Centres Server Rooms and Cloud Services, Final Technical Report,, EUR 30251 EN, Publications Office of the European Union, Luxembourg, 2020, ISBN 978-92-76-19447-7, doi:10.2760/964841, JRC118558.
49
that “this management service includes the co-hosting of multiple customers, which may take
the form of a cloud application environment.”
The proposed definition, however, can be somewhat confusing and unclear for several
reasons:
- Its relation to the definition of a hosting data centre.
o The definition implies that hosting data centres can be considered Managed
Service Providers data centres, but at the same time (seems to) suggest(s) that
the software systems don’t need to be dictated by others, which is not
consistent with the earlier definition of a hosting data centre. In other words,
the definition implies that software can be offered as a managed service in a
MSP
- Its relation to the definition of an enterprise data centre.
o It is, furthermore, not straightforward to distinguish a Managed Service
Providers data centre from an enterprise data centre based on the above
definitions. If a company owns a data centre and all IT hardware in it and its
customers pay a fee for certain services, then it can be considered an
enterprise data centre35 as well as a managed service provider data centre
according to the definitions above. Further refinement is necessary to
distinguish between an enterprise data centre and a MSP data centre.
- Ambiguity surrounding the term “managed services”.
The term Managed Services Provider can be confusing as every data centre operator
manages some kind of services (e.g. maintaining the facility, cooling and power, etc.).Although
the above definitions are linked to the ownership criterion, the lack of consistently defining who
owns what part of a data centre and who determines the software applications within these
definitions creates confusion by allowing too much room for interpretation. There might be a
difference between the owners of a building, and those that own the support infrastructure,
the IT infrastructure and the applications that run on top of it.
Cloud data centre
In the context of data centre typology, there is a lot of ambiguity in what exactly constitutes a
cloud data centre. Often it is presented as a different data centre type next to e.g. enterprise,
colocation, hosting due to the association with particular well-known public cloud providers
(often also called hyperscalers) such as Amazon, Google or Microsoft. Cisco36 for example
describes a cloud data centre as an off-premises form of data centre where data and
applications are hosted by a cloud services provider such as Amazon Web Services (AWS),
Microsoft (Azure), or IBM Cloud or other public cloud providers. In other cases a cloud data
centre is designated a particular data centre type. AFL Hyperscale for example designates a
35 AFL Hyperscale for example defines a hyperscale enterprise data centre as a facility owned and operated by the company it supports specifying this companies to be well-known large companies such as Amazon Web Services, Microsoft, Google or Apple.
36 https://www.cisco.com/c/en/us/solutions/data-center-virtualization/what-is-a-data-center.html#~types-of-data-
centers

50
cloud data centre to be a very large enterprise data centre. The JRC seems to include cloud
data centres only in the Managed Service Provider data centre category (cf. supra).
If we go back to the meaning of cloud services, the most frequently cited types are software-
as-a-service (SaaS), platform-as-a-service (PaaS) and infrastructure-as-a-service (IaaS).
- Software-as-a-service: software hosted by a vendor or provider is made available on
demand over a network;
- Platform-as-a-service (PaaS): a platform/environment hosted by a vendor or provider
is made available on demand to allow developers to build applications and services
- Infrastructure-as-a-service (IaaS): provides access to computing resources like
virtual server space, network connections, bandwidth, and IP addresses.
A cloud service provider is then the organisation that provides one or a combination of these
services. In our interviews it became clear that these cloud service providers cannot be linked
to one type of data centre specifically. A cloud service provider can build its own data centre,
rent IT-equipment within a colocation data centre, rent IT-equipment and the building
containing it, etc. Google for example has its own data centres, but is also a client of colocation
data centres. The company just picks the best option depending on the relative costs and
benefits. It was stated during our interviews that in 75% to 80% of the cases cloud service
providers use colocation data centres.
In general, when the cloud data centre type is used as a term, one limits its interpretation to a
very large data centre that is used or owned by the largest public cloud providers. As such it
is more linked to size (hyperscale) and number of tenants (mostly single tenant) than to the
nature of the services offered.
Edge data centre
The simplest description of an edge data centre would be a relatively or very small data centre
(below 2MW) that is physically close to its end-user (at the edge of the network) rather than
further away (at the core of the network)37.
An edge data centre is typically connected to a bigger central data network and/or to a Content
Delivery Network (CDN) made up of Points of Presence (POP). A CDN connects different
edge servers and if one edge server is inaccessible, computing orders are routed to the next
available edge server. A POP is a single geographical location where edge servers (and
consequently data centres) are connected to each other. When all POPs are connected, they
constitute the larger CDN for the considered area.38 Sometimes edge data centres are wrongly
described as one side of the edge-cloud spectrum. The reason is that in this case ‘cloud’ is
again interpreted solely as a large central data centre.
37 See e.g; https://www.sunbirddcim.com/edge-data-center,
https://searchdatacenter.techtarget.com/definition/edge-data-center, https://www.vxchnge.com/blog/what-is-
an-edge-data-center, https://www.techfunnel.com/information-technology/content-delivery-network/
38 CISCO, (2020), Cisco Visual Networking Index: Global Mobile Data Traffic Forecast Update, 2017–2022.

51
Edge data centres are sought for low latency high device density applications such as
autonomous vehicles and other smart-city applications. Main drivers for the adoption of edge
data centres are the proliferation of 5G, industrial IoT and the adoption of Software-defined
networking and network functions virtualisation (SDN/NFV) technologies.39
Data Centre Tiers
To classify and compare data centres one often refers to a tier system consisting of various
tiers or levels based on some underlying criteria. The most prominent underlying criteria used
the continuity of data services40. The Uptime Institute provides a tier system based on the
desired availability of data services (basic capacity, redundant capacity41, concurrently
maintainable, or fault tolerance)42.For each availability, an overview of necessary
infrastructure is given. Moreover, Uptime offers a certification programme. A basic description
of the four tiers is43:
- Tier I. A Tier 1 data centre holds the basic capacity level required for an office setting.
Although are protected against disruptions from human error, unexpected failures or
outages may happen. There is redundant equipment that includes chillers, pumps,
UPS modules and engine generators. To perform preventive maintenance activities
and repairs, a complete shutdown of the data centre is required. The absence of
preventive maintenance and repairs might lead to unplanned disruptions and severe
consequences from system failure. It is estimated an availability of ∼99.671% and 28.8
hours of downtime per year.
- Tier II. Tier II facilities include redundant capacity components for power and cooling
as to allow maintenance and safety against disruptions44. The distribution path of Tier
II serves a critical environment, and components can be removed without shutting
down the facility. Like a Tier I date centre, unexpected shutdown of a Tier II data centre
will affect the system. It is estimated an availability of ∼99.741% and 22 hours of
downtime per year.
- Tier III. Concurrently maintainable with redundant components as a key
differentiator, with redundant distribution paths to serve the critical environment. No
39 PWC, (2019), Edge data centers: Riding the 5G and IoT wave, p. 6.
40 Mark Acton (2008), European Data Centre Standards. CBRE. https://www.slideshare.net/ICTFOOTPRINTEU/european-
data-centre-standards .
41 Redundancy denotes the duplication of certain components or functions of a system so that if they fail or need to be taken down for maintenance, others can take over. N is the base load or number of components needed to function. N+1 means having one more component than is actually needed to function, 2N means having double the amount of total components, and 2N+1 is having double the amount plus one (J. Salom, T. Urbaneck and E. Oró (2017). Advanced Concepts for Renewable Energy Supply of Data Centres).
42 https://uptimeinstitute.com/tiers
43 https://uptimeinstitute.com/tiers
44 Components include: engine generators, energy storage, chillers, cooling units, UPS modules, pumps, heat rejection
equipment, fuel tanks and fuel cels (https://uptimeinstitute.com/tiers ).

52
shutdowns are required when the equipment needs maintenance or replacement. The
components of Tier III are added to Tier II components so that any part can be shut
down without impacting IT operation. A tier III date centre is still susceptible to fault
and thus only addresses unplanned events. It is estimated an availability of ∼99.982%
and 1.6 hours of downtime per year.
- Tier IV. A Tier IV data centre has multiple independent physically isolated systems that
act as redundant capacity components and distribution paths. The separation is
needed to protect against an event that otherwise might compromise both systems.
The environment will not be affected by a disruption from planned as well as unplanned
events. Tier IV facilities add fault tolerance to the Tier III topology. When equipment
fails, or an interruption in the distribution path occurs, IT operations will not be affected.
All of the IT equipment must have a fault-tolerant power design to be compatible. Tier
IV data centres additionally require continuous cooling to ensure a stable environment.
It is estimated an availability of ∼99.995% with 0.4 hours of downtime per year.
In 2009 Uptime removed specific availability predictions to tier levels45 based on, so they state,
“the understanding that operational behaviours can have a huge impact on site availability
regardless of the technical prowess of the design and build”. The various requirements of each
tier are summarized in Table .
45 These were: 99.671% and 28.8 hours of downtime per year (Tier 1), 99.741% and 22 hours of downtime per year (Tier 2), 99.982% and 1.6 hours of downtime per year (Tier 3) and 99.995% with 0.4 hours of downtime per year (Tier 4).
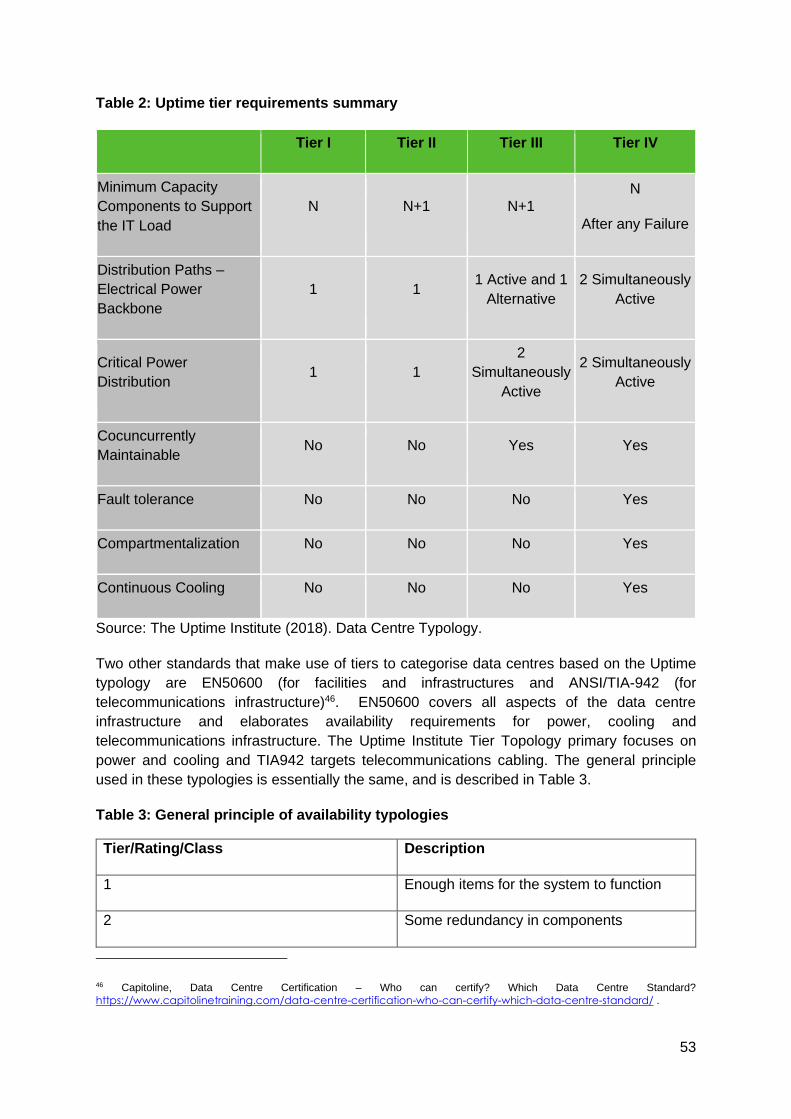
53
Table 2: Uptime tier requirements summary
Tier I Tier II Tier III Tier IV
Minimum Capacity
Components to Support
the IT Load
N N+1 N+1
N
After any Failure
Distribution Paths –
Electrical Power
Backbone
1 1 1 Active and 1
Alternative
2 Simultaneously
Active
Critical Power
Distribution 1 1
2
Simultaneously
Active
2 Simultaneously
Active
Cocuncurrently
Maintainable No No Yes Yes
Fault tolerance No No No Yes
Compartmentalization No No No Yes
Continuous Cooling No No No Yes
Source: The Uptime Institute (2018). Data Centre Typology.
Two other standards that make use of tiers to categorise data centres based on the Uptime
typology are EN50600 (for facilities and infrastructures and ANSI/TIA-942 (for
telecommunications infrastructure)46. EN50600 covers all aspects of the data centre
infrastructure and elaborates availability requirements for power, cooling and
telecommunications infrastructure. The Uptime Institute Tier Topology primary focuses on
power and cooling and TIA942 targets telecommunications cabling. The general principle
used in these typologies is essentially the same, and is described in Table 3.
Table 3: General principle of availability typologies
Tier/Rating/Class Description
1 Enough items for the system to function
2 Some redundancy in components
46 Capitoline, Data Centre Certification – Who can certify? Which Data Centre Standard?
https://www.capitolinetraining.com/data-centre-certification-who-can-certify-which-data-centre-standard/ .

54
Tier/Rating/Class Description
3 Concurrent maintainability i.e. the ability to
maintain any item of infrastructure without
having to shut down the IT equipment.
4 Automatic fault tolerance. The system
continues operating in the event of a failure
without human intervention.
Source: Capitoline (2021), Data Centre Certification – Who can certify? Which Data Centre
Standard?
During our interviews, it was stated that a lot of end-users of higher tier data centres actually
don’t need the corresponding high availability rates. In light of this study, this is an important
remark, as higher availability in general goes together with more energy consumption, and by
consequence: a higher environmental footprint.
Other tiers/ratings/classes used in EN50600 relate to protection and energy granularity47:
- Four protection classes against unauthorized access, internal fire, internal
environmental events, and external environmental events. A criterion to distinguish
between data centres could be the maximum protection class against the four different
categories of events.
- Three levels of energy efficiency measurement granularity:
o Level 1: simple information for the entire data centre.
o Level 2: detailed information for certain installations and infrastructures of the
DC.
o Level 3: Granular data for individual DC elements.
Size
There are no standard thresholds to determine what a small, large or hyperscale data centre
is. There is also no consensus on what the most relevant size criterion is: floor size, power
capacity, number of server racks, etc. Indications of criteria and thresholds used in practice
were however acquired through desk research and interviews. Via the survey for data centre
operators, additional insights in the thresholds used in practice were acquired.
The KTH Royal Institute of Technology of Sweden defines data centres using a minimum
threshold for power capacity of 0.1MW (down from 0.5MW in 2017)48. This falls within the
boundaries of what is denoted as a very small data centre by Salom, Urbaneck & Oró (2017)49:
47 J. Dittrich (2015). EN50600-Series. Data Centre Facilities & Infrastrctures. https://docplayer.net/6452375-En-50600-series-data-centre-facilities-infrastructures-jens-dittrich-ceo-dvt-consulting-ag-convener-cenelec-tc-215-wg3.html
48 https://www.diva-portal.org/smash/get/diva2:1130513/FULLTEXT01.pdf
49 J. Salom, T. Urbaneck and E. Oró (2017). Advanced Concepts for Renewable Energy Supply of Data Centres

55
- Server room: <50 kW
- Very small Data Centre: 50–250 kW
- Small Data Centre: 250–1000 kW
- Medium size Data Centre: 1–2 MW
- Large Data Centre: 2–10 MW
- Very large Data Centre: >10 MW
The authors clarify that all data centre types can range from very small to large. As a general
rule supporting enterprise data centres are the smallest while hosting data centres are the
largest.
AFL Hyperscale describes for various types of data centres size thresholds based on power
capacity and additional criteria such as the number of cabinets and floor size50:
- Hyperscale (or Enterprise Hyperscale):
o Cabinets: 500 or more
o Floor size: 10 000 square feet or more (~930 m²)
o Number of servers: 5000 servers of more
- Wholesale colocation data centre:
o Cabinets: from 100 cabinets to more than 1000
- Enterprise data centre:
o Cabinets: from 10 cabinets upwards
o Power capacity: can be as large as 40MW
Although some size thresholds are specified by AFL Hyperscale, they are not consistently
reported for the various types of data centres. What is however clear is that data centres
defined based on purpose/ownership criteria (such as enterprise or colocation) can vary in
size.
The Data Center Energy Usage report of the US Department of Energy offers is, to our
knowledge, the most granular categorisation of data centres according to size51. The minimum
size for a structure to be designated a data centre is approximately 45 m² (500 ft²). A
hyperscale data centre can be up to about 37000 m² (400.000 ft²). In Table 4 an overview of
the various size classes is given.
Table 4: Size classes of data centres according to the US Data Center Energy Usage Report
Type of structure Floor size Description
Internal server closet < 100 ft² Often outside of central IT
control (often at a remote
50 Data Centres for which no size thresholds were defined are not mentioned here.
51 Shehabi et al (2016). United States Data Center Energy Usage Report. Ernest Orlando Lawrence Berkleley National
Laboratory. https://www.osti.gov/servlets/purl/1372902/

56
Type of structure Floor size Description
location) that has little to no
dedicated cooling.
Internal server room 100-1.999 ft² Usually under IT control,
may have some dedicated
power and cooling
capabilities
Localised internal data
centre
500-1.999 ft² Has some power and cooling
redundancy to ensure
constant temperature and
humidity settings.
Midtier internal data centre 2.000-19.999 Superior cooling systems
that are probably redundant.
High-end internal data
centre
>20.000 ft² Has advanced cooling
systems and redundant
power.
Point-of presence server
closet
<100 ft² At local points of presence
for OSS and BSS services.
Typically leverages POP
power and cooling. Space is
often a premium.
Point-of-presence server
room
100-999 ft² Secondary computer point of
presence for OSS and BSS
services. Typically leverages
POP power and cooling.
Localised service provider
data centre including sub-
segment: containerised data
centre
500-1.999 ft² Has some power or cooling
redundancy to ensure
constant temperature and
humidity settings. These are
typically facilities set up by
VARs to provide managed
services for clients.
Midtier service provider data
centre
2.000-19.999 ft² Location for small or midsize
collocation/hosting provider.
Also includes regional
facilities for multinational
communications service
providers. Has superior
cooling systems that are
probably redundant.
High-end service provider
data centre
>20.000 ft² Primary server location for a
service provider. May be
subdivided into modules for
greater flexibility in
expansion/refresh. Has

57
Type of structure Floor size Description
advanced cooling systems
and redundant power.
Hyperscale data centre Up to over 400.000 ft² Primary server location for
large collocation and cloud
service providers. Based on
modular designs, with
individual modules of 50,000
ft² on average in up to 8
modules. Employs advanced
cooling systems and
redundant power.
Source: Shehabi et al (2016). United States Data Center Energy Usage Report. Ernest
Orlando Lawrence Berkleley National Laboratory. https://www.osti.gov/servlets/purl/1372902/
During the interviews, primarily with data centre associations, it became clear that in general
a good size criterion needs to be one that is user-friendly for the reporting organisation in
terms of measurement. The most straightforward criterion is therefore floor size, followed by
the number of racks. Furthermore, all interviewees saw size as one of the most important
criteria to distinguish data centres next to ownership and availability/reliability. The importance
of size, it was mentioned, is related to the large amount of smaller data centres that have less
capital to invest in measures aimed at greening their businesses, and therefore are often much
less efficient in terms of energy use. It was also stated that small data centres are in danger
of being excluded in the greening data centre discussion.
An additional remark was that, within the boundaries of a specific country, what is considered
a small, large or hyperscale data centre varies. This classification depends on the size of data
centres that are built within a certain country, which is determined by factors such as demand
(e.g. large cities that generate high demand), geography (e.g. availability of large free plots of
land to build data centres), and climate (e.g. in cooler climates it is easier to remove heat by
using outside air, availability of wind/hours of sunshine to generate renewable energy).
Nevertheless, during the interviews, the thresholds mentioned were often similar. Table 5
shows the size thresholds that were derived from the interview responses.
It needs to be stated that every association interviewed confirmed there are no generally
accepted definitions according to size and that small deployments, even those outside the
above minimum thresholds, are seen as relevant. In other words: even a single server rack
can be someone’s data centre. During an interview it was, however, clarified that it is hard to
speak of a ‘real’ data centre when there are less than 6 racks due to absence of systematic
operations of e.g. support infrastructure and IT equipment. Another element that was
highlighted is that thresholds underlying size categorisations might and probably will change
over time. More relevant than the thresholds themselves are the elements of a data centre
that change when it gets larger, e.g. use of automation, redundant components, modularity,
etc.
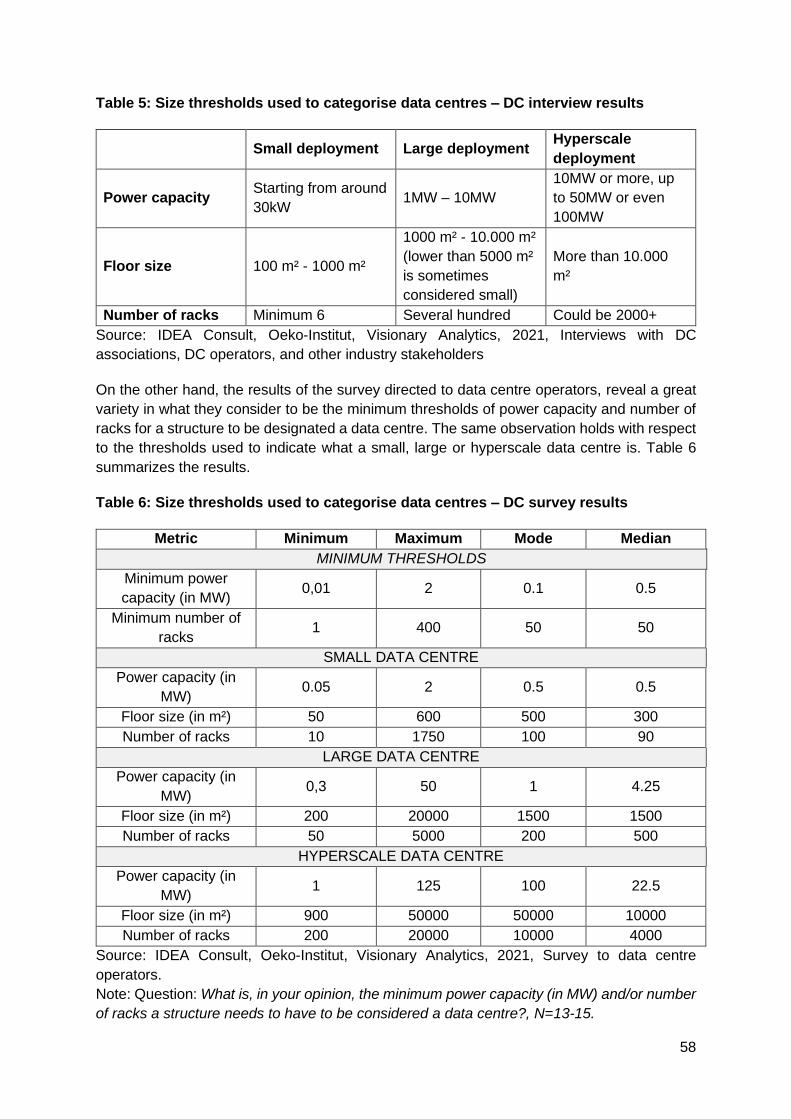
58
Table 5: Size thresholds used to categorise data centres – DC interview results
Small deployment Large deployment Hyperscale
deployment
Power capacity Starting from around
30kW 1MW – 10MW
10MW or more, up
to 50MW or even
100MW
Floor size 100 m² - 1000 m²
1000 m² - 10.000 m²
(lower than 5000 m²
is sometimes
considered small)
More than 10.000
m²
Number of racks Minimum 6 Several hundred Could be 2000+
Source: IDEA Consult, Oeko-Institut, Visionary Analytics, 2021, Interviews with DC
associations, DC operators, and other industry stakeholders
On the other hand, the results of the survey directed to data centre operators, reveal a great
variety in what they consider to be the minimum thresholds of power capacity and number of
racks for a structure to be designated a data centre. The same observation holds with respect
to the thresholds used to indicate what a small, large or hyperscale data centre is. Table 6
summarizes the results.
Table 6: Size thresholds used to categorise data centres – DC survey results
Metric Minimum Maximum Mode Median
MINIMUM THRESHOLDS
Minimum power
capacity (in MW) 0,01 2 0.1 0.5
Minimum number of
racks 1 400 50 50
SMALL DATA CENTRE
Power capacity (in
MW) 0.05 2 0.5 0.5
Floor size (in m²) 50 600 500 300
Number of racks 10 1750 100 90
LARGE DATA CENTRE
Power capacity (in
MW) 0,3 50 1 4.25
Floor size (in m²) 200 20000 1500 1500
Number of racks 50 5000 200 500
HYPERSCALE DATA CENTRE
Power capacity (in
MW) 1 125 100 22.5
Floor size (in m²) 900 50000 50000 10000
Number of racks 200 20000 10000 4000
Source: IDEA Consult, Oeko-Institut, Visionary Analytics, 2021, Survey to data centre
operators.
Note: Question: What is, in your opinion, the minimum power capacity (in MW) and/or number
of racks a structure needs to have to be considered a data centre?, N=13-15.
59
Other definitions/criteria
Below some examples of other definitions and criteria (that could be used for new definitions)
are listed. Other relevant examples will be distilled from our survey for data centres.
- Internal versus service provider data centre
o Internal DCs are available to businesses and institutions, while service provider
DCs provide specialised services to communication companies and social
media companies52.
- Software Defined Data Centre (SDDC53)
o A programmatic abstraction of logical compute, network, storage, and other
resources, represented as software. These resources are dynamically
discovered, provisioned, and configured based on workload. Thus, the SDDC
enables policy-driven orchestration of workloads, as well as measurement and
management of resources consumed.
- Location
o Regional, national and international data centres54: Regional data centres can
be found in one province and have one or more facilities. National data centres
have facilities spread over the country. International data centres focus on the
distribution of online services to multiple countries (e.g. The Amsterdam data
hub).
o Data centres located in metropolitan versus rural areas55
- Type of end-users (e.g. telecom providers, internet service providers, internet
exchange providers, cloud providers, enterprises, financial institutions, public
organisations, etc.)
- PUE (Power Usage Effectiveness)
- Number of tenants
- Maximum rack power
- Sector distribution according to the reporting form for participants in the Code of
Conduct:
o traditional enterprise;
o on demand enterprise;
o telecom;
o high performance computing cluster;
o hosting;
o Internet;
o hybrid56.
52 https://www.osti.gov/servlets/purl/1372902
53 Distributed Management Task Force, inc. (DMTF). Software Defined Data Center (SDDC) Definition. A White Paper from the
OSDCC Incubator. https://www.dmtf.org/sites/default/files/standards/documents/DSP-IS0501_1.0.0.pdf
54 https://www.dutchdatacenters.nl/en/data-centers/what-is-a-data-center/
55 Criteria mentioned in the survey to data centre operators.
56 https://publications.jrc.ec.europa.eu/repository/bitstream/JRC108354/kjna28874enn.pdf
60
- Cooling technologies: type of free cooling technologies57
- Criteria mentioned by DC operators in the survey:
o Density: a higher density denotes the use of more kW per rack or cabinet.58
o Modularity: a modular data centre is based on a design that implies either a
prefabricated data centre module or a deployment method for delivering data
centre infrastructure in a modular, quick and flexible method59.
o Usage of renewable energy
o Waste heat utilization
o Connectivity options (to other data centres and service providers within and
outside Europe)
o Remote hands: a service offered by colocation data centres that allows
customers of a data centre to outsource basic IT maintenance tasks to
technicians that are employed by the data centre, allowing customers to focus
on their own core business60.
57 https://publications.jrc.ec.europa.eu/repository/bitstream/JRC108354/kjna28874enn.pdf
58 https://virtusdatacentres.com/item/389-power-density-the-real-benchmark-of-a-data-centre
59 https://www.datacenterknowledge.com/archives/2013/04/04/what-is-a-modular-data-center
60 https://cloudscene.com/news/2017/07/definesaas/

61
Overview of data centre types by criterion
The following figure provides an overview of the frequently used types of data centres we reported in this section and their underlying criteria. The most
popular criteria are purpose/ownership, size, tiers, location and centralisation/service. In the final column we highlight additional criteria that are used to
categorise data centres, but are less frequently used. This overview highlights the multitude and complexity of data centre typologies used in practice.
Figure 6: Data centre definition overview
Source: IDEA Consult, 2021
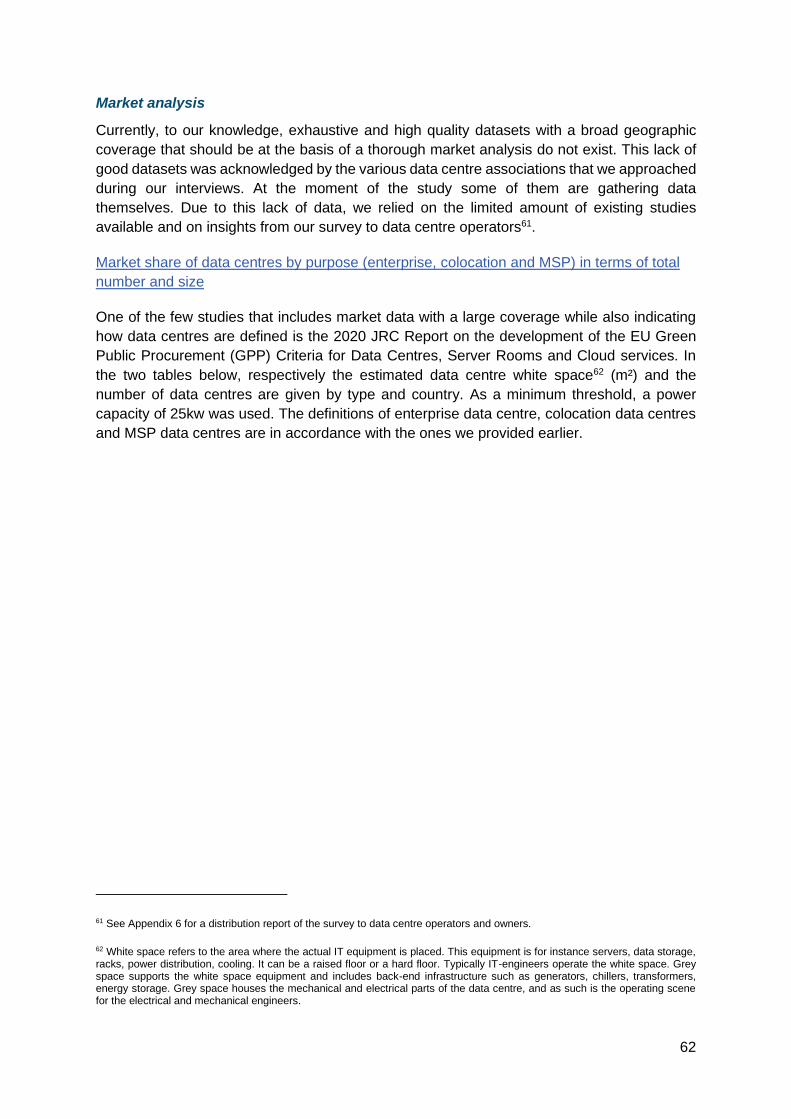
62
Market analysis
Currently, to our knowledge, exhaustive and high quality datasets with a broad geographic
coverage that should be at the basis of a thorough market analysis do not exist. This lack of
good datasets was acknowledged by the various data centre associations that we approached
during our interviews. At the moment of the study some of them are gathering data
themselves. Due to this lack of data, we relied on the limited amount of existing studies
available and on insights from our survey to data centre operators61.
Market share of data centres by purpose (enterprise, colocation and MSP) in terms of total
number and size
One of the few studies that includes market data with a large coverage while also indicating
how data centres are defined is the 2020 JRC Report on the development of the EU Green
Public Procurement (GPP) Criteria for Data Centres, Server Rooms and Cloud services. In
the two tables below, respectively the estimated data centre white space62 (m²) and the
number of data centres are given by type and country. As a minimum threshold, a power
capacity of 25kw was used. The definitions of enterprise data centre, colocation data centres
and MSP data centres are in accordance with the ones we provided earlier.
61 See Appendix 6 for a distribution report of the survey to data centre operators and owners.
62 White space refers to the area where the actual IT equipment is placed. This equipment is for instance servers, data storage, racks, power distribution, cooling. It can be a raised floor or a hard floor. Typically IT-engineers operate the white space. Grey space supports the white space equipment and includes back-end infrastructure such as generators, chillers, transformers, energy storage. Grey space houses the mechanical and electrical parts of the data centre, and as such is the operating scene for the electrical and mechanical engineers.

63
Table 7: Market share of European data centres by purpose (in white space, and in number)
Source: JRC, 2020, report on the development of EU GPP criteria for data centres, server
rooms and cloud services63
The large majority of data centres in the EU seem to be enterprise data centres (96%). If the
white space is taken into account, it becomes clear, however, that colocation data centres are
also important. Enterprise data centres occupy 57% of total white space, while colocation data
centres occupy 40%. The average white space per type of data centre can be derived from
the two tables: enterprise data centres have an average white space of 60m², colocation data
centres of 1157m² and MSP data centres of 1123m².
63 Dodd, N., Alfieri, F., Maya-Drysdale, L., Viegand, J., Flucker, S., Tozer, R., Whitehead, B., Wu, A., Brocklehurst F.,. Development of the EU Gr een Public Procurement (GPP) Crit er ia for Data Centres Server Rooms and Cloud Servic es , Final Technical Report,, EUR 30251 EN, Publications Office of the European Union , Luxembourg, 2020, ISBN 978-92-76-19447-7, doi:10.2760/964841, JRC118558.

64
The above findings seem to diverge significantly from a worldwide survey conducted in 2018
and 201964 that shows only half of the companies that use data centres own and operate their
own data centre. This can be derived from Figure 7 looking at the share of users of the in-
source model (which seems equivalent to enterprise data centres). Again, inconsistency of
definitions used might blur what is actually happening in reality.
Figure 7: Data Centre Delivery Model worldwide 2018-2019, in %
Source: Supermicro, 2019, Report on the State of the Green Data Center. N = 1362
In our survey to data centre operators, the operators were asked to indicate how many data
centres of each type (enterprise, colocation or managed service provider) they operate and if
they also operate data centres of another type. The distribution of the various types of data
centres in our survey is shown in the figure below. Comparing this distribution to the one
displayed in Table 7 reveals large differences indicating we should avoid generalising the
results of our survey to the wider EU data centre population. Additionally, our survey
respondents belong to the group of operators that operate larger data centres65. Nonetheless,
useful insights can be distilled from the survey.
A first insight from our survey results regarding classification by purpose, is that several
operators mentioned hyperscale data centres as a separate category, next to enterprise,
colocation or managed service providers’ data centres. Another example of an additional type
of data centres indicated by a respondent is a high performance computing data centre. The
fact that both hyperscale data centres and high performance computing data centres are seen
by some respondents as additional types of data centres is symptomatic of the lack of clarity
of current definitions of enterprise, colocation and managed service provider data centres, as
64 Supermicro, (2019), Data Centers & the Environment, 2019 Report on the State of the Green Data Center, p. 11.
65 We base this conclusion on the average reported values of gross data hall white space (1540m²), total power (6.3MW) and the number of racks (1014).
0 10 20 30 40 50
Colocation model (renting space for serversand other computing hardware)
Cloud model (managed by a cloud solutionprovider)
Managed service model (equipment and/orservices managed by third-party)
Hybrid model (combination of more thanone of the different models)
In-source model (owner owned andoperated)
2019 2018

65
these two types of data centres are in fact just a further specification of one of the three types
based on scale or performance.
Figure 8: Number of data centres by purpose in the DC survey
Source: IDEA Consult, Oeko-Institut, Visionary Analytics, 2021, Survey to data centre
operators
Note: Other includes hyperscale, ‘mini-enterprise’ and high performance computing. N=15Market share of public data centres in terms of size
In the EU funded EURECA project66 more than 350 European public sector data centres were
analysed. It was found that 80% of the public data centres are smaller than 25 racks, 17%
hold between 25 and 125 racks and only 3% of public data centres have more than 125 racks.
Moreover, the sizeable group of data centres with less than 25 racks runs older IT equipment.
40% of the servers used in this group are older than 5 years and produce only 7% of the
computing capacity while accounting for 66% of energy consumption revealing a large waste
of energy (cf. Figure 9). Furthermore, the facilities with the higher PUE values were typically
the smaller facilities that are more difficult to make efficient due to small-scale IT and the age
of the buildings. The PUE values of public sector data centres range from 1.5 to 7. Given the
high energy waste in smaller facilities, from a policy perspective it is essential to target also
smaller data centres with less than 25 racks when aiming for a greener data centre market.
We should, however, be careful in generalising findings for public data centres to private data
centres. As an example, we found in our survey the range of PUE values reported is much
smaller (1.02-1.6), as is the average PUE value (1.28). Note, however, that the smallest data
centre that reported its PUE counts 100 server racks.
66 Expert and Stakeholder Consultation Workshop on Green ICT. CEF – Deployment Challenges and EU level Intervention (2020-2030). 30 January 2018. European Commission.
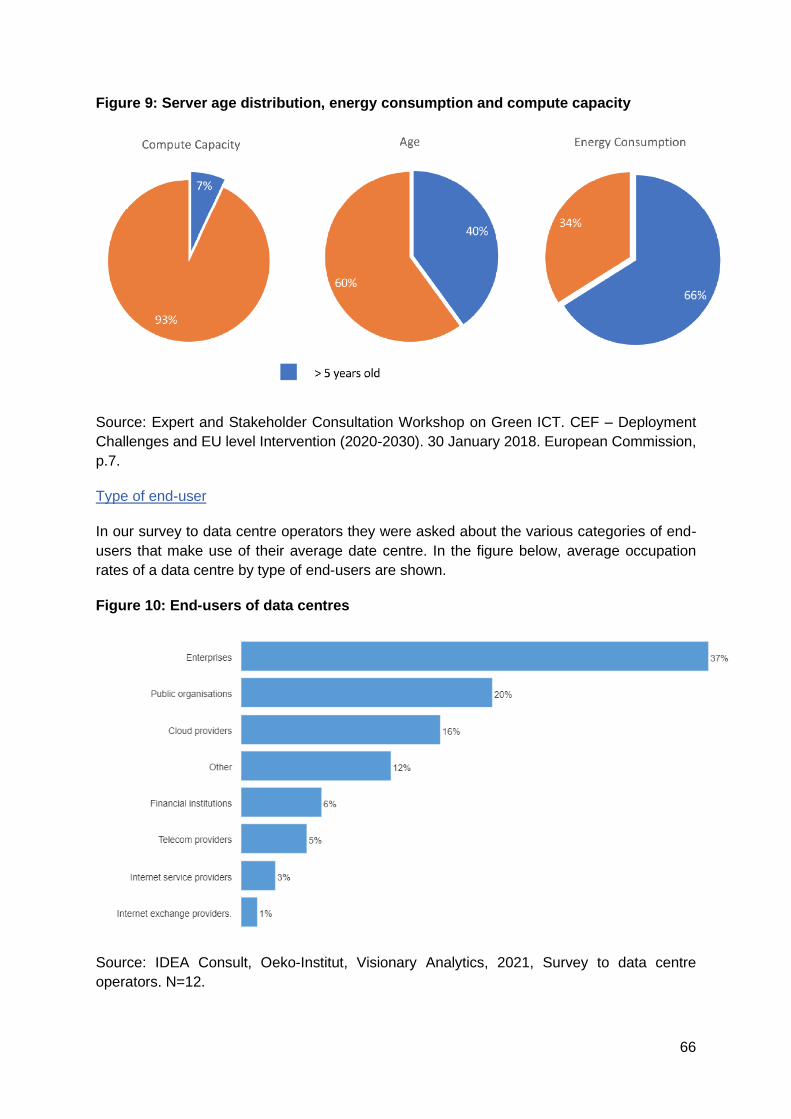
66
Figure 9: Server age distribution, energy consumption and compute capacity
Source: Expert and Stakeholder Consultation Workshop on Green ICT. CEF – Deployment
Challenges and EU level Intervention (2020-2030). 30 January 2018. European Commission,
p.7.
Type of end-user
In our survey to data centre operators they were asked about the various categories of end-
users that make use of their average date centre. In the figure below, average occupation
rates of a data centre by type of end-users are shown.
Figure 10: End-users of data centres
Source: IDEA Consult, Oeko-Institut, Visionary Analytics, 2021, Survey to data centre
operators. N=12.

67
Not a single respondent indicated only one occupant in their average data centre. The largest
group is constituted by enterprises, followed by public organisations and cloud providers. The
most important lesson from this figure is that one should take into account the variety of end-
users when formulating policy measures. At who will you aim them? And could there be
differential effects depending on the type of end-user?
Data centre tiers
In the survey to data centre operators, they were asked to indicate to what tiers their average
data centre belongs to. Three types of tiers were considered: tiers related to availability,
protection and energy efficiency measurement granularity. With respect to availability 63% of
the respondents indicated their average data centre is at Tier 3. 31% indicated their average
data centre to belong to Tier 4. The remaining 6% are Tier 1 data centres. Strikingly, almost
60% of the respondents do not have a certificate that proves this. This observation is even
stronger when we look at the two other types of tier classifications. Although all respondents
indicate their data centres are protected against unauthorized access (best protected against),
internal fire, external and internal environmental events (least protected against), only 40%
have a certificate that proves this. Considering energy efficiency measurement granularity, of
those that indicate to gather at least simple information for the entire data centre (level 1), 67%
do not have a corresponding certificate.
Data centre operators that have certificates related to one or more tier systems were asked to
provide the names of the organisations that provided the certificate. The organisations
mentioned are: Uptime Institute, TÜViT, TÜV Rheinland, BSI, Socom and ISO.
Interview and survey input on market trends in the data centre sector
More specifically we focus on the reported general trends, insights on business performance
and on the technological trends.
General trends
- Strong competition from the US and Asia: the EU share is decreasing.
- Knowledge/human capital is a big challenge: finding people with the right skills.
- Largescale public investment in digital infrastructure is insufficient.
- More attention towards energy efficiency and circular practices driven by client
demands in addition to energy use from a cost perspective.
Business performance
- In the interviews it was stated turnover, employment, value added, etc. is expected to
grow at an annual rate of more than 10% (double digit growth), further accelerated by
the impact of covid (more e-commerce activities, homeworking, cashless payments,
etc.).
- In the survey, the expectations were also positive, albeit a little more modest. More
than 50% of the respondents believe turnover and annual investments will grow at an
average rate of at least 6%. Almost 50% believealso that employment will grow at an
average rate of more than 6%. Note that the group of respondents that expect a stable
or even declining evolution is the largest for the employment indicator (29%).
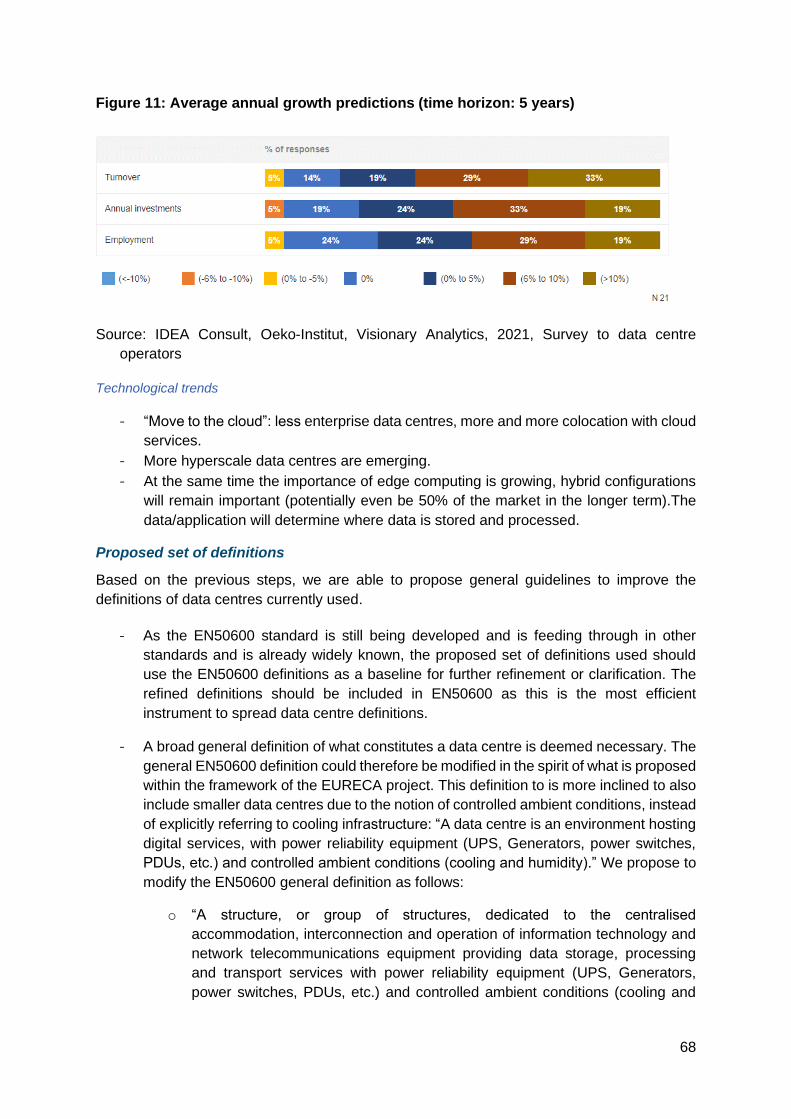
68
Figure 11: Average annual growth predictions (time horizon: 5 years)
Source: IDEA Consult, Oeko-Institut, Visionary Analytics, 2021, Survey to data centre
operators
Technological trends
- “Move to the cloud”: less enterprise data centres, more and more colocation with cloud
services.
- More hyperscale data centres are emerging.
- At the same time the importance of edge computing is growing, hybrid configurations
will remain important (potentially even be 50% of the market in the longer term).The
data/application will determine where data is stored and processed.
Proposed set of definitions
Based on the previous steps, we are able to propose general guidelines to improve the
definitions of data centres currently used.
- As the EN50600 standard is still being developed and is feeding through in other
standards and is already widely known, the proposed set of definitions used should
use the EN50600 definitions as a baseline for further refinement or clarification. The
refined definitions should be included in EN50600 as this is the most efficient
instrument to spread data centre definitions.
- A broad general definition of what constitutes a data centre is deemed necessary. The
general EN50600 definition could therefore be modified in the spirit of what is proposed
within the framework of the EURECA project. This definition to is more inclined to also
include smaller data centres due to the notion of controlled ambient conditions, instead
of explicitly referring to cooling infrastructure: “A data centre is an environment hosting
digital services, with power reliability equipment (UPS, Generators, power switches,
PDUs, etc.) and controlled ambient conditions (cooling and humidity).” We propose to
modify the EN50600 general definition as follows:
o “A structure, or group of structures, dedicated to the centralised
accommodation, interconnection and operation of information technology and
network telecommunications equipment providing data storage, processing
and transport services with power reliability equipment (UPS, Generators,
power switches, PDUs, etc.) and controlled ambient conditions (cooling and

69
humidity) together with the necessary levels of resilience and security required
to provide the desired service availability”.
- The current EN50600 category definitions of data centres, categorized according to
purpose is not clear enough and causes confusion and overlap. Even the term
‘purpose’ is unclear (one could also indicate for example bitcoin mining as a purpose
or high performance computing).
o It would be beneficial to clearly indicate how the various category definitions
relate to each other. A suggestion we obtained during one of the interviews was
to look at who ‘owns’ what within a data centre (e.g. building, support
infrastructure, IT-equipment) and who determines the applications. This should
be elaborated in each of the definitions to avoid confusion. This idea is
visualised in the figure below.
Figure 12: Ownership based data centre definition
Source: IDEA Consult, based on input acquired during an interview with Rabih Bashroush
(Uptime/EURECA).
More specifically, to the definitions of the existing data centre types mentioned
in EN50600 (except for Network Operator Data Centres which is defined at a
different level), the following extensions could be added:
• Enterprise data centre: one organisation owns the building, support
infrastructure and IT equipment, and determines its own applications.
• Colocation data centre: an organisation owns the building and support
infrastructure, but the IT equipment and software is determined by its
users.

70
• Hosting data centre: an organisation owns the building, support
infrastructure, and IT equipment but the software is determined by its
users.
Furthermore, we propose to explicitly add the hybrid data centre type to account
for the data centres that do not fall within one of the definitions listed above.
• Hybrid data centre: e.g. an organisation owns building and support
infrastructure and part of the IT equipment, while another part of the IT
equipment is owned by its users.
- From a policy perspective, irrespective of the specific definitions or labels used, it is of
the highest importance to be aware of the distinction between who owns and/or
operates (who is responsible for) which parts of the data centre (building, support
infrastructure, IT equipment, application layer) in order to determine who should be the
target of policy measures. To do this one could use an ‘applicability matrix’ with the
various parts of the data centre listed in rows and who owns it and operates it in two
separate columns as illustrated in Table 8.
Table 8: Application matrix for analysing ownership and operation across layers of DCs
Data centre layer Owned by: Operated by:
Building xxxx xxxx
Support infrastructure xxxx xxxx
IT equipment xxxx xxxx
Application layer xxxx xxxx
Source: IDEA Consult
- The interpretation of a Managed Service Provider data centre versus hosting data
centre is not clear. Also, managed services can be interpreted in numerous ways:
management of the building, management of the equipment, etc. To avoid further
confusion, the use of a Managed Service Provider data centre as a separate category
of data centres should be avoided.
- Cloud service providers offer cloud services in all types of data centres, sometimes
they own the data centre, sometimes they don’t. What is typically referred to as a cloud
data centre is therefore confusing as it suggests it is one specific type of data centre:
a very large enterprise data centre owned by a well-known public cloud provider. In
our opinion, a cloud data centre can be defined as any data centre that is primarily
used for the provision of cloud services (Infrastructure-as-a-service, Platform-as-a-
service, Software-as-a-service, or a mixture of those).
- Based on desk research and interviews, the best size criteria based on ease of use for
the reporting organisation are floor size followed by number of racks. We found,
however, that the most consistently reported thresholds were based on total power
capacity. Below, several size categories are presented. The number of racks is
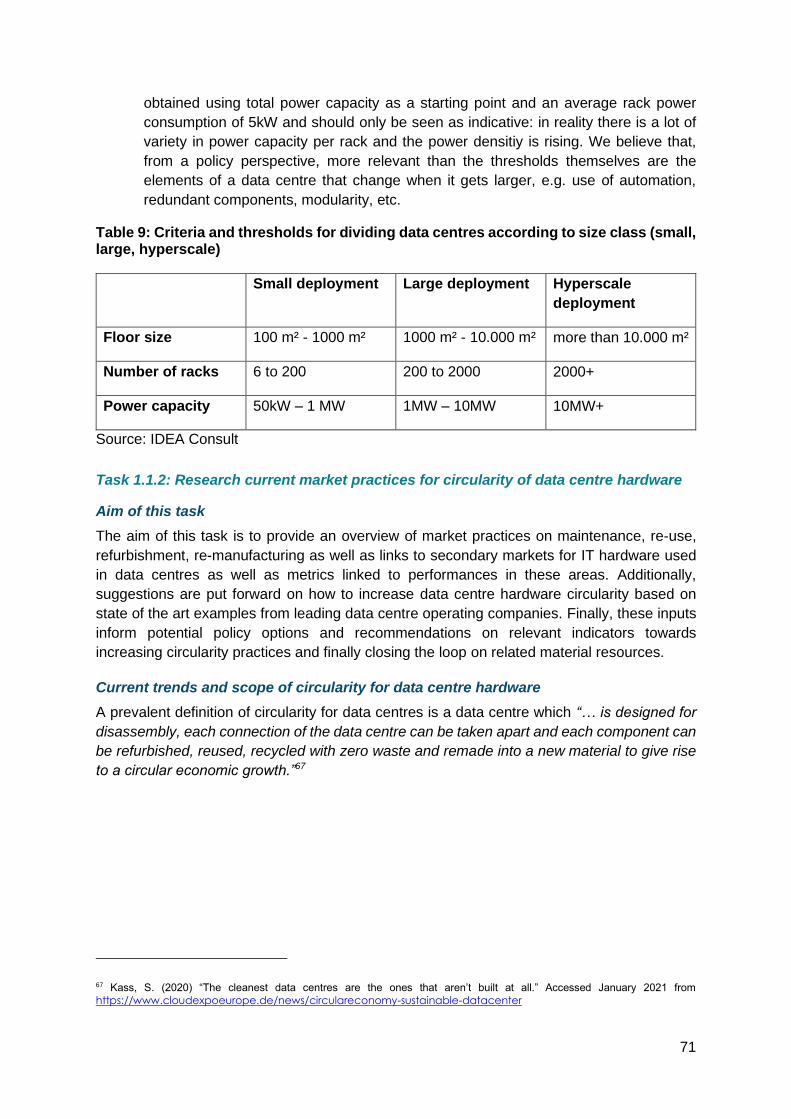
71
obtained using total power capacity as a starting point and an average rack power
consumption of 5kW and should only be seen as indicative: in reality there is a lot of
variety in power capacity per rack and the power densitiy is rising. We believe that,
from a policy perspective, more relevant than the thresholds themselves are the
elements of a data centre that change when it gets larger, e.g. use of automation,
redundant components, modularity, etc.
Table 9: Criteria and thresholds for dividing data centres according to size class (small, large, hyperscale)
• • Small deployment • Large deployment • Hyperscale
deployment
• Floor size • 100 m² - 1000 m² • 1000 m² - 10.000 m² • more than 10.000 m²
• Number of racks • 6 to 200 • 200 to 2000 • 2000+
• Power capacity • 50kW – 1 MW • 1MW – 10MW • 10MW+
Source: IDEA Consult
Task 1.1.2: Research current market practices for circularity of data centre hardware
Aim of this task
The aim of this task is to provide an overview of market practices on maintenance, re-use,
refurbishment, re-manufacturing as well as links to secondary markets for IT hardware used
in data centres as well as metrics linked to performances in these areas. Additionally,
suggestions are put forward on how to increase data centre hardware circularity based on
state of the art examples from leading data centre operating companies. Finally, these inputs
inform potential policy options and recommendations on relevant indicators towards
increasing circularity practices and finally closing the loop on related material resources.
Current trends and scope of circularity for data centre hardware
A prevalent definition of circularity for data centres is a data centre which “… is designed for
disassembly, each connection of the data centre can be taken apart and each component can
be refurbished, reused, recycled with zero waste and remade into a new material to give rise
to a circular economic growth.”67
67 Kass, S. (2020) “The cleanest data centres are the ones that aren’t built at all.” Accessed January 2021 from
https://www.cloudexpoeurope.de/news/circulareconomy-sustainable-datacenter

72
Figure 13: Circular Economy for Data Centre Lifecycle
Source: Kass, S., Salama, A., 2020
Between 2015 and 2020, servers’ lifetime in data centres before being replaced or refurbished
has increased. Of 220 data centre managers surveyed worldwide in 2015, 37% indicated to
refresh their servers every three years, while in 2020, 31% indicated to refresh them every
five years. A further 19% of 418 managers surveyed in 2020 even indicated to extend the use
time beyond five years. These figures converge also with the 2018 EURECA study which
surveyed 300 data centres in Europe and found that 40% of deployed servers were older than
5 years. These old servers required 66% of all energy consumed by the facility centres while
only contributing to 7% of the overall computing capacity.68
Over time, the hardware refresh cycle has succumbed to the slowing down of Moore’s Law,
namely the fact that transistor capacity is not doubling every two years as was the case for
close to 20 years.69 Between 2015 and 2020 Intel and AMD have struggled to maintain the
pace of improvement which practically means that hardware doesn’t need to be replaced as
often, since its computing power stays up to date for a longer period of time with Moore’s Law
slowing down.70 This means that components remain up to date and cutting edge for longer,
making refresh cycles longer and reducing electronic waste. In this sense one could argue
68 European Commission H2020 DC EURECA Project – Final Project Report. April 2018.
69 Bashroush, R., Lawrence, A,.(2020), Beyond PUE: Tackling IT’s wasted terawatts, Uptime Institute, p. 14
70Ascierto, R., Lawrence, A., (2020), Uptime Institute global data center survey 2020, Uptime Institute

73
that ICT progress is inversely connected to circularity and maintaining equipment becomes
not only more environmentally sustainable but also more cost-effective.
Figure 14: Data centre server refresh cycles, 2015 versus 2020
Source: Uptime Institute Global Survey of IT and Data Center Managers 2015 (n=220) and
2020 (n=418)
Total e-waste in 2019 was around 12 million metric tons in Europe. Asia is the region
generating the most e-waste with 24.9 million metric tonnes while the Americas follow with
13.1. Even if the bulk of the generated e-waste is likely to come from private consumption,
increasing data centre capacity in recent years and in the foreseeable future leads to
increasing e-waste over time.71
The leading companies worldwide to manufacture, test and install servers in data centres are
Dell, IBM, HPE, Inspur and Lenovo.72 These companies manufacture servers and server
components and deliver them to data centres. Some private companies running hyperscale
data centres have however started researching and designing their own custom ARM-based
chips. The most recent example is Apple releasing its M1 chip which according to the company
has a 3.5 times higher CPU performance and 15 times higher machine learning performance
then traditional chips. This is a key development as larger players are able to manufacture
hardware for their own data centres according to their own desired specifications without the
71 Hinchliffe, D., Gunsilius, E., Wagner, M., Hemkhaus, M., Batteiger, A., Rabbow, E., Radulovic, V., Cheng, C., Fautereau, B., Ott, D., Kumar Awasthi, A., Smith, E., (2020), Partnerships between the informal and the formal sector for sustainable e-waste
management, The Solving the E-waste Problem Initiative (StEP), consulted online: https://www.step-
initiative.org/files/_documents/publications/Partnerships-between-the-informal-and-the-formal-sector-for-
sustainable-e-waste-management.pdf
72 Weloop, (2019), A Situational Analysis of a Circular Economy in the Data Centre Industry , p. 20, consulted online:
http://weloop.org/wp-content/uploads/2020_04_16_CEDaCI_situation_analysis_circular_economy_report_VF.pdf

74
need to reach out to independent manufacturers.73 This trend has however also a negative
effect on the industry’s potential for circularity as hardware manufacturers’ activities become
more fragmented making it harder to coordinate monitoring or gain an overview of current
practices.
The individual components of data centres that are subject to the analysis of potential
circularity practices are listed in Table 10 together with an overview of their average lifespan.
The components to be replaced most frequently (average lifespan of 3-8 years) are batteries,
servers, storage equipment, and network equipment. These components also pose the
biggest challenge as they constitute a significant contribution to electronic waste. Other
components of which the life expectancy can reach up to 20 years are typically not technology-
intensive and tied to progress. These are usually components necessary for power generation,
cooling systems, security systems and the building infrastructure itself. Therefore it is relevant
to prioritise components with short life spans for circularity considerations
Table 10: Main components of a data centre facility (Garnier, 2012)
Source: Weloop, 2020, consulted online: http://weloop.org/wp-
content/uploads/2020_04_16_CEDaCI_situation_analysis_circular_economy_report_VF.pdf
73 See online: https://www.apple.com/mac/m1/

75
Circularity practices for IT equipment surrounding data centres
This section presents current circularity practices of data centre hardware. The practices
presented in this section can be summarised as follows: Adhering to standards and
certifications
- Implementing KPIs on performance, energy and water consumption and thresholds on
emissions;
- Maintaining hardware;
- Refurbishing and reusing hardware;
- Collaborating with secondary markets;
- Recycling hardware components;
- Repurposing hardware within the business.
From a regulatory point of view, many certifications and standards exist imposing or
suggesting circularity practices for data centres. ISO 50001 and EN 50600 relating to energy
usage are relatively new, having been issued in 2018 and 2016 respectively.
The German Data Centre Association released a comprehensive study on data centres and
some key circularity aspects in 2020.74 This type of report is relatively unique in Europe in
terms of it being very recent and covering a lot of different aspects. Germany is an important
hub for Data Centre development and the report therefore indicative for key industry
developments. According to their survey, ISO 14001 relating to the environment is held by
14% of data centres in Germany, specifically.75 While these standards apply to data centres
in the broader sense, sub-section CLC/TR 50600-99-1 and 50600-99-2 of the European
standards directly relates to the data centre hardware and its potential for circularity. The 2019
European EcoDesign Legislation for servers and storage devices further imposes practices
for the circular design, use and disposal of IT equipment.76 The following table highlights the
main standards and certifications European data centres are subject to.
74 Consulted online: https://www.germandatacenters.com/de/themen/data-center-outlook-2021-big-data-big-
business/
75 German Data Centre Association, (2020), Data Center Outlook 2021, consulted online: https://www.germandatacenters.com/de/themen/data-center-outlook-2021-big-data-big-business/ , p. 27
76 European Commission, (2019), laying down ecodesign requirements for servers and data storage products pursuant to Directive 2009/125/EC of the European Parliament and of the Council and amending Commission Regulation (EU) No 617/2013, Commission Regulation (EU) 2019/424.

76
Table 11: Certifications and standards for data centres' circularity practices related to
hardware, applicable in Europe77
CLC/TR 50600-99-1 Information technology: Data centre facilities and infrastructures -
Part 99-1: Recommended practices for energy management
CLC/TR 50600-99-2 Information technology: Data centre facilities and infrastructures -
Part 99-2: Recommended practices for environmental
sustainability
ETSI EN 300 019
series
Environmental conditions and environmental tests for
telecommunications equipment
ETSI TS 105174-2 Access, Terminals, Transmission and Multiplexing
(ATTM);Broadband Deployment - Energy Efficiency and Key
Performance Indicators; Part 2: ICT sites
ETSI EN 305 174-2 Access, Terminals, Transmission and Multiplexing (ATTM);
Broadband Deployment and Lifecycle Resource Management; ICT
Sites
ETSI EN 305 174-8 Access, Terminals, Transmission and Multiplexing (ATTM);
Broadband Deployment and Lifecycle Resource Management;
Part 8: Management of end of life of ICT equipment (ICT waste/end
of life)
EU CoC BP Best Practices for the EU Code of Conduct on Data Centres
ITU-T L.1300 Series L: Construction, Installation and Protection of cables and
other elements of outside plant: Best practices for data centres
ISO 14001 Defines the criteria for an environmental management system. It
provides a framework that companies or organisations can apply
to implement an effective environmental management system.
ISO 50001 Energy-related performance and relevant systems for companies
ISO/IEC TR 30133 Information technology – Data centres – Guidelines for resource
efficient data centres
Source: IDEA Consult, adapted from CEN/CENELEC/ETSI, 2018
In order to assess the energy efficiency of IT equipment, the PUE rate, as indicated in previous
sections, is a problematic indicator as increasingly efficient IT equipment and stagnating
building efficiency result in a poorer PUE. The relevance of PUE for energy efficiency and
circularity of equipment for that matter is relatively limited. Therefore, it is advisable to monitor
other metrics simultaneously, such as Water Usage Effectiveness (WUE) which would give an
indication on the environmental footprint of the water used to maintain IT equipment at stable
temperatures.78
In addition to PUE used as a main indicator for measuring circularity in data centres overall,
other indicators mentioned by data centres during our survey include heat circularity, building
77 CEN/CENELEC/ETSI, (2018), Energy Management and Environmental Viability of Data Centres.
78 Kass, S., Ramakrishnav, S., (2020), The Impact of the Circular Economy to the Data Center and ICT Sector White Paper, consulted online:
https://static1.squarespace.com/static/5dd2a05acb3ab6681a6ec4b5/t/5e9f7562806be7625483ab19/158750858299
7/Impact+Of+Circular+Economy+to+Data+Center+and+ICT+Sector+DCD.pdf

77
design density, embodied carbon emissions, network usage effectiveness and share of
refurbished inventory. When asked what metrics related to the IT equipment data centre
operators were actively working on improving, the most popular was maintenance,
followed by reuse, refurbishment, exchange with secondary markets for components and
materials and finally remanufacturing.
For the IT equipment itself, the circularity consideration starts necessarily with the first use of
the equipment as operators need to have a strategy in place for maintaining, replacing and
renewing their equipment. During our interviews with national data centre associations it was
highlighted that smaller data centre operators resolve to purchase cheap and fast IT
equipment because they are under pressure from their clients and they do not have the
financial resources and scale to invest into programs dedicated to refurbishing and updating
their hardware. Large operators and hyperscalers especially on the other hand do have the
resources and the financial incentive to develop large scale programmes with the purpose of
updating the hardware.
The most relevant metric in the data centre industry for applying circularity practices for IT
equipment is scale. Large data centres are capable of increasing their efficiency, optimise
refreshment cycles, maximise computing power and rationalise floor space. Small data
centres on the other hand are restricted in their capability of addressing these challenges. The
large majority of data centres are relatively small, running less than 25 racks.79 These are
either individual companies with their own server rooms or even colocation data centres, which
added up require a very large floor space for on average poor circularity performance. Survey
respondents indicated that the most limiting factors in extending the useful lifetime of data
centres’ IT equipment were technology and cost concerns. Consolidating data centres
infrastructure into larger, more efficient data centres reduces the overall floor space required,
but also enables implementation of other circularity aspects mentioned above.
Implementing circular practices in data centres requires large investments. Operators of
hyperscale data centres and especially the Internet Big Five (Amazon, Apple, Facebook,
Google and Microsoft)80, who run the largest data centres, have the financial means at their
disposal to establish and run programmes for circularity and max out the lifetime and efficiency
of their equipment. In contrast and as indicated earlier, small operators and especially
companies with only a few servers typically consider the cost of acquisition and server speed
as primary metrics when establishing their data centres. Therefore they tend to use their
assets until they completely break down, at the expense of energy and processing efficiency.
Other reasons for operators to not employ recycling practices for their hardware include a too
time-consuming process, the difficulty of finding certified partners for material recycling and a
simple lack of e-waste management planning.81
The following graph visualises how data centres operators and IT practitioners worldwide
handled outdated data centres server hardware in 2018 and 2019. Over 1000 IT managers
79 Bashroush, R., (2020), Lawrence, A. Beyond PUE: Tackling IT’s wasted terawatts, Uptime Institute, p. 19
80 Also commonly known under the acronym GAFAM
81 Information from interviews with national data centre associations

78
were surveyed.82 While 4% more operators repurposed outdated hardware within their
business in 2019 than in 2018, 14% fewer operators partnered with certified electronics
recycling companies in the same timeframe.83 These findings converge with the survey we
conducted with data centre operators and further point towards a difficulty of finding certified
electronics recycling companies as partners, but also a trend of product life extension within
data centres.
Figure 15: Methods of handling outdated data centre server hardware worldwide 2018-
2019, in %
Source: Supermicro, 2019, Report on the State of the Green Data Center. N = 1362
For a circular system, the hardware used in data centres can be analysed under the 10 Rs
addressing circularity of any given industry. These are illustrated in the following table.
82 Supermicro, (2019), Data Centers & the Environment, 2019 Report on the State of the Green Data Center.
83 Supermicro, (2019), Data Centers & the Environment, 2019 Report on the State of the Green Data Center, p. 10.
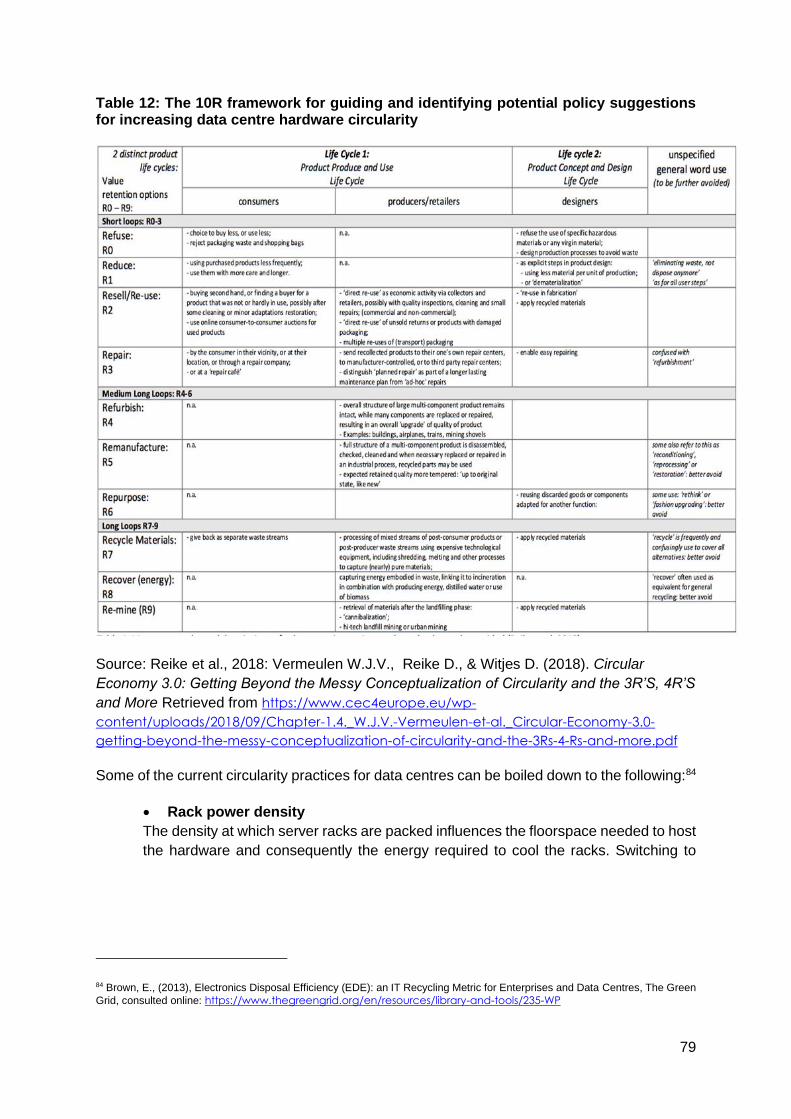
79
Table 12: The 10R framework for guiding and identifying potential policy suggestions for increasing data centre hardware circularity
Source: Reike et al., 2018: Vermeulen W.J.V., Reike D., & Witjes D. (2018). Circular
Economy 3.0: Getting Beyond the Messy Conceptualization of Circularity and the 3R’S, 4R’S
and More Retrieved from https://www.cec4europe.eu/wp-
content/uploads/2018/09/Chapter-1.4._W.J.V.-Vermeulen-et-al._Circular-Economy-3.0-
getting-beyond-the-messy-conceptualization-of-circularity-and-the-3Rs-4-Rs-and-more.pdf
Some of the current circularity practices for data centres can be boiled down to the following:84
• Rack power density
The density at which server racks are packed influences the floorspace needed to host
the hardware and consequently the energy required to cool the racks. Switching to
84 Brown, E., (2013), Electronics Disposal Efficiency (EDE): an IT Recycling Metric for Enterprises and Data Centres, The Green
Grid, consulted online: https://www.thegreengrid.org/en/resources/library-and-tools/235-WP

80
multi-node and blade systems that share fans and power supplies leads efficiency
gains of 10 to 20% as well as requiring less equipment for the same capacity.85
• Whole system reuse
Under whole system reuse can be considered that the entire IT equipment is being
maintained, reused and refurbished.
• Partial system reuse - parts and components reuse
This practice relates to the ongoing maintenance of data centre equipment, in which
servers are monitored, faulty components replaced and the overall servers refurbished.
This occurs when the servers are faulty, or significant increases in energy use are
noted. Depending on the manufacturing date of individual components, data centres
may decide to replace still functional components with newer ones because they are
more efficient, faster or have a higher data storage.
• Remanufacturing
Remanufacturing typically starts with the shredding, crushing or degaussing of
components in order to start the material separation process from which new
equipment can be manufactured.
When data centre operators decide to refurbish their IT equipment, they sometimes
enter the secondary market, aiming to reduce losses and sell their previous equipment
to brokers and remanufacturers. The remanufacturing process consists of the following
steps:86
85 Malyala, V., (2020), Are data centres destroying the environment?, Data Centre Review, consulted online:
https://datacentrereview.com/2020/06/are-data-centres-destroying-the-environment/
86 http://weloop.org/wp-content/uploads/2020_04_16_CEDaCI_situation_analysis_circular_economy_report_VF.pdf

81
Figure 16: Remanufacturing steps of data centre hardware
Source: IDEA Consult, based on WeLoop, 2020
• Recycling
In accordance with the WEEE Directive 2012 when individual components or servers
reach their end of life they are classified into two distinct categories.
o Category 4: Large equipment: any dimension larger than 50cm
o Category 6: Small IT and telecommunication equipment
Recycling of hardware components feeds into the more general topic of WEEE
recycling. Decommissioned servers or components are sent by data centre operators
or their providers to dedicated recycling plants. These receive WEEE from different
sources and separate toxic waste from reusable materials such as plastics and ferrous
and non-ferrous metals.
The electronic and electrical equipment used in data centres consists of components
that are made of metals such as aluminium, copper, steel and gold, plastics and
ceramics. The current Critical Raw Material (CRM) recycling rate in Europe lies around
1%.87
• Reporting
Data centre operators report different metrics relating to the circularity of their hardware
because of lacking regulation and standardisation. The available data on European
level is missing, however some national associations and individual operators to
87 WRAP, EARN, Wuppertal Institute, Innovate UK, and European Recycling Platform, “Critical Raw Material Closed Loop Recovery,” Growth, 2019
1. Disassembly and cleaning
2. Data destruction
3. Rebuilding
4. Engineering changes and uploads
5. Quality checks and performance measurement
6. Packaging and shipping with “as new” warranty and services

82
provide data. Some of the metrics representative of the circularity of data centre
hardware are:
o Percentage of used electronics refurbished
o Percentage of used electronics resold
o Percentage of used electronics recycled
o Percentage of used electronics landfilled
o Percentage of used electronics incinerated (as treatment and for waste energy)
Box 2: Facebook business case example for data centre circularity practices88
Facebook deployed a machine learning model to monitor, predict and optimise the efficiency
of their data centre operations. Such a model not only makes it possible to identify current
potential for improvement, but also how data centre operations can be adapted in the
medium term future. This implies energy use, but also equipment design, use and
maintenance. The model allows Facebook to reduce the number of servers that need to
be on during low-traffic hours, resulting in power savings of 10 to 15% and reduced wear
on the equipment.
Facebook data centre buildings are LEED (Leadership in energy and Environmental
Design) certified, applying principles of systems and design thinking in order to take
advantage of circularity potential across all relevant value chains, mainly related to material
and energy sourcing. Systems thinking further incentivises material innovation. Looking for
alternative materials with a lower carbon footprint, Facebook developed mechanical
parts for their servers made out of natural fibre-filled polypropylene (NFFPP).
Integrating life-cycle thinking into the design process of data centre hardware, Facebook
employs a range of partners that allow them to connect to secondary markets for their
equipment as well as have decommissioned servers and components recycled by certified
companies.
The most straightforward way to increase the environmental sustainability of data centres is
to increase server utilisation. This would rationalise the amount of hardware manufactured
and put into use, effectively reducing electronic waste. With an average utilisation rate of 25%
only, there are gains to be explored. It should be noted, however, that server utilisation rates
have an optimum, balancing the effectiveness of server use and not overloading them.
Therefore utilisation should remain below 50% in order to allow for failovers, comply with
manufacturers’ recommendations and reserve capacity for peak demand instances. The
configuration of key-server components plays a further role in the potential for utilisation
increase.89
88 Facebook, (2020), consulted online: https://sustainability.fb.com/innovation-for-our-world/sustainable-data-centers/
89 Bashroush, R., (2020), Lawrence, A. Beyond PUE: Tackling IT’s wasted terawatts, Uptime Institute, p. 12

83
In Germany only 18% of data centres use more than 50% of the waste heat they generate in
2020 and only one in 10 data centres plan to do so in the future. 90 The Dutch Data Center
Association estimates that if all the heat generated by data centres were consumed, it could
heat more than one million homes and save up 600 kilotons of CO2 emissions.91 Figure 17
illustrates how data centres could potentially be connected to an energy grid to heat homes
and receive cooling in return. This ties into the concept of industrial symbiosis, which provides
the opportunity for using waste heat in industrial and private applications that are in close
proximity. In order to facilitate data centres in valorising their waste heat, the regulatory
framework for construction and maintenance as well as technological capabilities need to be
updated in order to ultimately increase the use of waste heat.
Figure 17: Connecting data centres to a green energy grid for waste heat valorisation (Example for the Netherlands)
Source: Dutch Data Center Association, 2020
Considering that 40% of servers in data centres older than 5 years required 66% of all energy
consumed by the facility centres while only contributing to 7% of the overall computing
capacity points to a significant potential for energy efficiency improvements, but also gains
in computing power in data centres. Additionally, consolidating data centres
infrastructure into larger, more efficient data centres reduces the overall floor space required.
In the following sections we further explore practices around maintenance, reuse,
refurbishment and remanufacturing as well as emerging and future practices.
Maintenance, reuse, refurbishment, remanufacturing
In German data centres the PUE rate ranges from 1.05 to 2.20 with an average of 1.38. As
indicated in section 1.3, the PUE has globally been decreasing by 0.75 points between 2010
and 2018, indicating that data centres are becoming more efficient overall. There is an
important barrier when aiming to significantly improve the PUE. Namely, cheap and effective
90 German Data Centre Association, (2020), Data Center Outlook 2021, consulted online:
https://www.germandatacenters.com/de/themen/data-center-outlook-2021-big-data-big-business/ , p. 30
91 Dutch Data Center Association, (2020), State of Dutch Data Centers, p. 19

84
energy efficiency measures can be undertaken with relative ease, while structural
improvements beyond that require large investments.92
The US-based non-profit organisation The Green Grid proposes the Electronics Disposal
Efficiency (EDE) metric, designed to measure how successfully outdated IT equipment is
managed. This metric measures the share of IT equipment that is being disposed of properly
in total disposed of IT equipment by weight. The Green Grid considers that IT equipment is
only being disposed of responsibly if done by an organisation that is certified and authorised
to recycle or destroy the material.93
Box 3 Google business model example for maintenance of IT equipment94
A circularity effort put forward by Google is their hardware management. Google specifically
focuses on optimising the process at the end of life of their hardware resulting both in
cost savings for the data centre and material savings further up the value chain, amongst
material suppliers and other manufacturers of semi-finished products.
Google’s data centres are tailor-made to their needs just like the servers populating them.
These are purpose built and omit video cards, chipsets or peripheral connectors which off-
the-shelf servers have. Using purpose-built servers and equipment reduces vulnerabilities
of the IT-equipment and increases their energy-efficiency as the number of potential energy
leaks is reduced.
Google has created its own maintenance and repair programme under which it uses both
new and refurbished components to maintain their servers. The most commonly replaced
components are hard-drives and memory disks.
Once servers reach the end of their usable life and they are decommissioned, Google
dismantles them in-house and sorts the components for future use in their maintenance
programme. Google also builds its own servers through their Servers Build program.
Refurbished servers are considered equal to new equipment, no distinction is made in
Google’s inventory.
Circularity at Google’s data centres requires a considerable time and financial investments
as well as requiring organisational strength capability in order to maintain and moderate the
different programmes through which IT equipment is maintained.
92 German Data Centre Association, (2020), Data Center Outlook 2021, consulted online:
https://www.germandatacenters.com/de/themen/data-center-outlook-2021-big-data-big-business/ , p. 29
93 Brown, E., (2013), Electronics Disposal Efficiency (EDE): an IT Recycling Metric for Enterprises and Data Centres, The Green
Grid, consulted online: https://www.thegreengrid.org/en/resources/library-and-tools/235-WP
94 The Ellen McArthur Foundation, (2016), Circular Economy at work in Google data centres, consulted online:
https://www.ellenmacarthurfoundation.org/assets/downloads/data-center-case-study-14-9-16.pdf
85
Google makes a relevant case for modular data centre equipment. As data centres require
the latest technologies to improve their services and remain competitive, one solution is to
disaggregate memory and CPU of servers. This makes it possible to design modular servers,
switches, batteries and other storage equipment of which individual components can be
replaced, ultimately reducing e-waste. Such modular designs can lead to savings in hardware
refresh costs of 45 to 60%.95
It is interesting to note that initiatives from the industry are emerging to decrease
environmental impact and increase circularity in the ICT value chain, driven by consumer
demand but also the realisation by industry stakeholders that such considerations lead to
improved operations overall. The Circular Electronics Partnership (CEP) is a recent example.
Box 4 Circular Electronics Partnership
The initiative
The Circular Electronics Partnership is a group of industrial leaders in technology, consumer
goods and waste management aiming to “reimagine the value of electrical products and
materials using a life cycle approach reducing waste from the design stage through to
product use and recycling96”. One of the key instruments of the partnership is a roadmap
designed by experts and electronics stakeholders with the aim to make the electronics value
chain as circular as possible. The roadmap takes into account all steps in the electronics
lifecycle from product design to recycling. Similarly to the present study, it ultimately aims
at improving transparency in the industry on circular practices as well as contribute towards
establishing international standards and definitions. It further aims at establishing a
repository of best practice examples for industry stakeholders of various sizes to incorporate
circular practices in their operations.
The roadmap is structured into six pathways and three time horizons up to 2023, 2027 and
2030:
95Malyala, V., (2020), Are data centres destroying the environment?, Data Centre Review, consulted online:
https://datacentrereview.com/2020/06/are-data-centres-destroying-the-environment/
96 Circular Electronics Partnership (2021) consulted online from Circular Electronics Partnership (cep2030.org)

86
Source: CEP (2021) available from: https://cep2030.org/our-roadmap/
Stakeholders
The roadmap has been designed in consultation with 80 experts and 40 companies
worldwide such as Microsoft, Google, DELL, Cisco and consulting firms such as Accenture
and KPMG. Within its intended timeline and beyond it will involve many more private and
public stakeholders in view of increasing circular practices and improve transparency in the
industry.
Weblink: https://cep2030.org/our-roadmap
The most frequently reused components in servers are Hard Disk Drives (HDD), and memory
cards. These do not become obsolete as quickly as Central Processing Units (CPU) and
Power Supply Units (PSU), which typically need to be completely replaced by newer ones.
The table below summarises the reuse rate and reusability index of key components for
servers.
Table 13: Reuse rate and reusability index of data server components
Source: JRC, Environmental Footprint and Material Efficiency Support for product policy,
analysis of material efficiency requirements of enterprise servers, no. September. 2015.

87
A straight forward principle for circularity is increasing components’ performance and
lifetime, while decreasing their size and energy requirements. In this light, the EU has
signed a declaration to develop next generation processors and 2 Nanometre chip technology.
The declaration aims to allocate 145 billion euro in the coming two to three years to develop
low-power processors that could, aside from data centres, be used for cars, medical
equipment, telecommunications and medical devices.97
Emerging and future market practices
The design, construction and use of data centres undergoes constant improvements aiming
for energy efficiency, capacity as well as security. Innovations in the field go beyond gradual
gains in efficiency and capacity. Older technologies such as tape storage are revisited and
redesigned for disruptive innovations. Such alternatives would inspire companies to
conceive of new business models for their data centres that bear the potential to significant
steps towards circular practices.
Box 5: Example of IBM Tape storage innovation98
Several companies have been considering alternatives to servers for data storage. IBM
investigates innovation in tape storage towards low-cost, secure and high-volume data
storage. The technology relies in essence on the same principals of electromagnetic tape
found in VHS cassettes, but improves upon it. Furthermore, and perhaps most relevant,
tape storage does not require energy for data storage, contrary to traditional servers. The
most recent product is LTO 9 Ultrium Tape Drive technology.
Tape storage may be used in parallel with cloud services. Through artificial intelligence,
decisions on where data is processed and sent to be stored, cost and energy savings can
be made.
Edge services are currently not a wide-spread market practice but their popularity is slowly
increasing. National data centre association interviewed identify edge-computing as a key
development for data centres. Edge services are an important tool in optimising data centre
infrastructure. On the one hand, edge computing allows to store the data closer to the locations
where it is needed , improving response times and saving on necessary bandwidth, but on the
other hand it gives large data centres the opportunity to further improve on their network. As
large data centres have better circularity practices in place than small data centres, this is a
relevant approach on a larger scale. Edge services are in the focus of national data centre
associations across Europe as they deem it to be very relevant in the coming years for
developing data centres.
97 European Commission, (2020), Declaration, A European Initiative on Processors and semiconductor technologies, consulted
online: https://ec.europa.eu/digital-single-market/en/news/joint-declaration-processors-and-semiconductor-
technologies
98 Urable, K., (2020), The ninth wave of tape storage innovation, IBM, consulted online:
https://www.ibm.com/blogs/systems/the-ninth-wave-of-tape-storage-innovation/

88
Data centres are using servers and processors that are able to operate under higher
temperatures, cutting down on cooling costs. Additive manufacturing holds the solution to
making this technically possible. Manufacturers of semiconductors and CPU cooling
components are looking into the possibility of 3D printing copper, which allows for intricate and
complex designs, accommodating micro cooling channels resulting in flow mixing capabilities
twice as high and twice the heat transfer of traditional components. Not only does this
technology improve the technical specs of data centre hardware, but additive manufacturing
also has circular qualities as components can be manufactured close to the location where
they are required and the technology results in less material losses than conventional
manufacturing techniques.99
Towards policy suggestions to increase circularity of data centre hardware
Metrics for circularity of IT equipment are not individually sufficient to monitor how IT
equipment is used and disposed of. It is therefore necessary to provide a coherent set of
metrics that data centre operators can use to assess the performance and potential
environmental footprint of their IT equipment over its lifetime.
When asking data centre operators in our survey what they expect from public authorities in
order to implement and follow circular practices, financial incentives were the most sought
after form of facilitation, followed by appropriate legislation, best practice examples and
guidance, as well as harmonised regulation and standardisation. In view of closing the
material loop of data centre hardware and on top of the set of indicators and metrics subject
to this study, three key policy recommendations can be formulated:
- Optimising data centre infrastructure;
- Increase server utilisation rates;
- Provide best practice examples and guidance on treating electronic waste towards
improving circularity.
There is an important potential for optimising and further deploying data centre
infrastructure in the EU through, among others, the use of edge services and cloud
computing as highlighted by interviewed national data centres associations. This effort would
make data centres more circular as it reduces the number of servers and other hardware
needed to satisfy an increasing demand while at the same time reducing energy demand of
data centres and e-waste produced. One key aspect would be the connection to the local
energy grid and the potential for industrial symbiosis in which e.g. excess heat is used to
power homes. As such a strategy on optimising data centre infrastructure in Europe, both
for now and in the future could be developed based on the current study, while also monitoring
industry developments.
European-wide recommendations for data centre operators on how to improve their
server utilisation rates would decrease the required floor space for data centres and amount
of IT equipment necessary, reducing overall material use. For this, operators would benefit
from clear instructions on how to maximise their utilisation rates between 25 and 50%, based
99 Donaldson, B., (2020), The Case for Tackling the Toughest Material First, Additive Manufacturing Magazine, consulted online:
https://www.additivemanufacturing.media/articles/the-case-for-tackling-the-toughest-material-first
89
on research of the most recent technology available on the market. Hence such a
recommendation should be updated every two to five years to consider technological
advancements. Furthermore, this would also create a level playing field at the EU level,
contributing to shaping the digital single market.
Box 6: The Climate Neutral Data Center Pact: an example of a Self-Regulatory initiative
The initiative
The Climate Neutral Data Center Pact is a European agreement of national umbrella
associations of data centre operators and private companies to make data centres climate
neutral by 2030. It is intended to use existing directives on energy efficiency, clean energy
and water and mobilise industry stakeholders to meet a specific set of targets in line with
the Green Deal.
Targets
• By January 1, 2025 new data centres operating at full capacity in cool climates will
meet an annual PUE target of 1.3, and 1.4 for new data centres operating at full
capacity in warm climates;
• Data centre electricity demand will be matched by 75% renewable energy or hourly
carbonfree energy by December 31, 2025 and 100% by December 31, 2030.
• By 2022, data centre operators will set an annual target for water usage
effectiveness (WUE), or another water conservation metric, which will be met by new
data centres by 2025, and by existing data centres by 2030.
• Data centres will set a high bar for circular economy practices and will assess for
reuse, repair, or recycling 100% of their used server equipment.
• Data centre operators will increase the quantity of server materials repaired or
reused and will create a target percentage for repair and reuse by 2025.
Weblink: https://www.climateneutraldatacentre.net/
Finally, the matter of electronic waste of data centres could be addressed from a policy
perspective. In order to do so, small data centre operators especially need access to a
database of best practice examples suited to their specific data centre type, location and
overall context. Large operators typically have dedicated resources and internal financial
motives to address hardware circularity autonomously. Best practice examples should
highlight success stories of how different types of data centres address hardware
refurbishing and recycling and what criteria would be applied for implementing a given
practice.
Financial incentives for smaller stakeholder would further contribute to them addressing the
challenge of closing the material loop of their hardware. Such financial incentives could include
subsidies for data centres maintaining hardware beyond its theoretical life expectancy or for
partnering with second hand markets. Policies could also be designed to support small data
centre operators in partnering up with certified electronics recycling companies, putting in
90
place registries of such companies per European region or creating dedicated platforms where
industry stakeholders can find the right partner for them.
Conclusions
Currently, the translation from what circularity means in theory to how it is applied practically
is not based on a common understanding among data centre operators. Based on the desk
research and interviews with stakeholders conducted, it seems that there is a lack of
standardisation for data centre circularity. KPIs for circularity are not universally accepted or
monitored, either because data centre operators do not know how or what to measure,
because it is not technically feasible to measure, or because they do not have the economic
incentives to do so. In regards to the latter, there is little economic incentive for data centre
operators to implement and pursue KPIs related to circularity with pure environmental
sustainability as target. Further research should go into what KPIs are relevant and feasible
for operators to keep track of.
The main takeaways from this section are:
• There is a divide in the potential to implement circular practices between
operators of small and large data centres. Operators of hyperscale data centres
typically have the financial means as well as economic incentives to have strategies in
place that increase their hardware’s circularity, while operators of small data centres
do not. The recent CEP2030100 initiative can be perceived as evidence in line with this
point.
• A market trend that will be key in leveraging the potential for circular practices is that
of developing components with increased performance and decreased size and
energy requirements, right from the design phase onwards. This reduces the material
needs for data centre hardware and the environmental impact of mining metals,
manufacturing plastic components and shipping these components through the world.
• Emerging trends such as edge and cloud computing require new approaches to
designing data centre infrastructure with a holistic approach integrating IoT, AI, and
others. In this regard monitoring future uptake will be key.
• In order for the industry to understand where potential circularity improvements can be
made, it could apply systems thinking, tying to other relating industries as well as
private consumption.
100 http://www.cep2030.org/

91
Task 1.1.3: Research into methods for measuring energy and resource efficiency and
recommendation for a harmonised measurement framework
Aim of this task
The aims of this task are:
• to collect and present information on current industry practices, standards, metrics,
indicators (including composite indicators), methods and methodologies (jointly
referred to here as ‘indicators’) used for the assessment of energy and resource
efficiency of data centres.
• to conduct a gap analysis to identify the factors not covered by existing indicators and
metrics
• to provide a proposal for a harmonised measurement framework for energy and
resource efficiency based on the evaluation of currently existing methods.
The scope of the methods to be assessed covers industry practices, rules, academic literature,
existing and ongoing standards in the EU and at a global level. This task focuses on energy
and resource aspects. Any other aspects associated with economic performance metrics (e.g.
carbon credit) or social impacts are outside the scope of this study. For the same reason,
purely technical parameters, e.g. latency, error rate, will also not be considered, with the
exception of certain performance or productivity metrics which have been embedded into the
existing energy and resource efficiency metric.
Classification of existing metrics of DCs
A wide number of metrics already exist for measuring energy and resource aspects in data
centres (DCs). Due to the high levels of energy consumption associated with IT equipment
and the corresponding infrastructure in data centres, DC metrics are historically focusing on
power or energy efficiency in the use phase. However, the industry has begun to realise that
the focus should go beyond operational power or energy consumption with the expansion of
other environmentally relevant issues, such as water, resource, primary energy, and e-waste.
Metrics are useful tools to quantify and measure as well as to evaluate the environmental
performance of DCs. However, given the complexity of DCs connected with IT equipment (i.e.
servers, storage, network equipment) and infrastructure equipment (i.e. HVAC systems,
uninterruptible power supply (UPS), power distribution units, lighting, generators, mechanical
equipment such as pumps etc.), a diverse wide range of metrics has been proposed and
developed to be able to cover specific aspects of DCs. Figure 18 illustrates the relationship
between metrics and characteristics of metrics as well as the aspects considered in DCs.
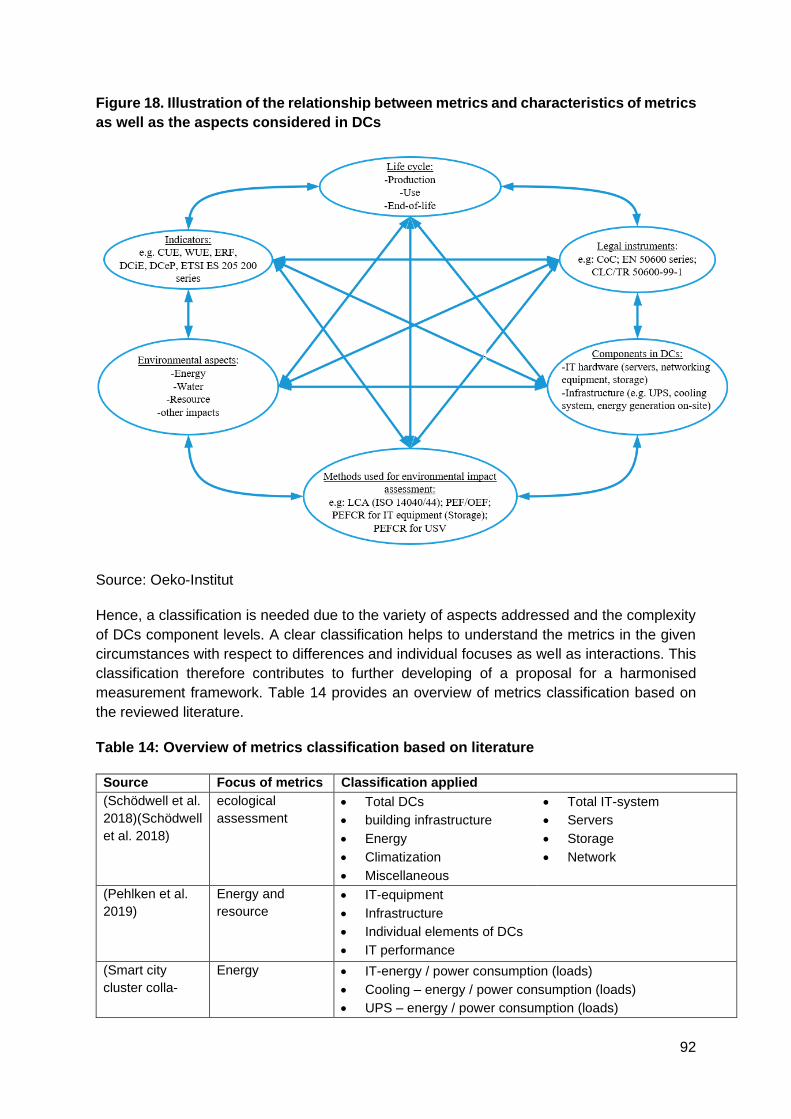
92
Figure 18. Illustration of the relationship between metrics and characteristics of metrics
as well as the aspects considered in DCs
Source: Oeko-Institut
Hence, a classification is needed due to the variety of aspects addressed and the complexity
of DCs component levels. A clear classification helps to understand the metrics in the given
circumstances with respect to differences and individual focuses as well as interactions. This
classification therefore contributes to further developing of a proposal for a harmonised
measurement framework. Table 14 provides an overview of metrics classification based on
the reviewed literature.
Table 14: Overview of metrics classification based on literature
Source Focus of metrics Classification applied
(Schödwell et al.
2018)(Schödwell
et al. 2018)
ecological
assessment
• Total DCs
• building infrastructure
• Energy
• Climatization
• Miscellaneous
• Total IT-system
• Servers
• Storage
• Network
(Pehlken et al.
2019)
Energy and
resource
• IT-equipment
• Infrastructure
• Individual elements of DCs
• IT performance
(Smart city
cluster colla-
Energy • IT-energy / power consumption (loads)
• Cooling – energy / power consumption (loads)
• UPS – energy / power consumption (loads)

93
Source Focus of metrics Classification applied
boration, Task 1
2014)101
• Transformer – energy / power consumption (loads)
• Lighting – energy / power consumption (loads)
• Building – energy / power consumption (loads)
• Energy produced locally
• Heat recovered
• Power shifting
• CO2 emissions
• Performance
(Smart City
Cluster
Collaboration,
Task 4 2015)
Energy (new
developed
metrics)
• Flexibility mechanisms in DCs – Energy Shifting
• Savings family of metrics
• Renewables integration
(Shally et al.
2019)
Energy Efficiency • Computing Energy Metrics
• IT Equipment Energy Metrics
• Facility Energy Metrics
• DC Energy Metrics
• Green Energy Metrics
Chinnici et al.
(2016)
Energy efficiency 3 clusters
• power/energy metrics
• thermal metrics
• productivity metrics
(Pärssinen
2016)
Energy Efficiency
and Green IT
Metrics
Category 1: Energy Efficiency Metric
• energy consumption of physical infrastructure
• energy consumption of communication elements
• energy consumption of computing elements
• network energy consumption
• general energy efficiency
• CO2 and renewables use
Category 2: data centre technology
• Servers
• Network
• Storage
• Cooling
• Air movement
• Uninterruptable Power Supply (UPS)
• Applies to all equipment
(Wilde 2018) Energy Efficiency
of High
Performance
Computing (HPC)
DCs
4 Pillar Framework
• DC infrastructure
• IT system hardware
• IT system Software
• Applications
Reddy et al. Sustainability 9 dimensions
• Energy Efficiency
20In the framework of EU-funded FP7 calls, a 9-project Cluster (All4Green, CoolEmAll, GreenDataNet, RenewIT, GENiC, GEYSER, Dolfin, DC4Cities and EURECA) concerning DCs was created. The goal of the Cluster is to ensure that these 9 projects use the same metric measured in the same way while fulfilling their individual goals so that the outcomes of each project can be directly comparable and understandable by the other members of the Cluster.

94
Source Focus of metrics Classification applied
• Cooling
• Greenness
• Performance
• Thermal and Air management
• Network
• Storage
• Security
• Financial Impact
(Lykou et al.
2017)
Sustainability 2 categories:
• IT Equipment
• DC Facility
5 Sustainability Elements:
• DCs environmental impact
• Resource utilization and Economy
• DCs operational efficiency
• Resources Recyclability
• Societal Impact
(Omar 2019) Sustainability 9 categories
• Energy efficiency metrics
• Cooling metrics
• Greenness metrics
• Performance and productivity metrics
• Thermal and air management metrics
• Network metrics
• Storage metrics
• Security metrics
• Financial metrics
Source: Oeko-Institut
A short summary based on the review of classification of existing literature is described below:
a) from the component perspective:
Metrics are generally classified by IT equipment and building infrastructure equipment.
Depending on different levels of granularity, metrics are addressed to system and specific
equipment levels. As for IT equipment, classification can specifically be further divided
into servers, storage and network equipment, or the IT equipment can be considered as
a whole. As for infrastructure equipment, cooling systems are the most investigated in the
infrastructure equipment segment due to the fact that they consume a significant amount
of energy and are also regarded as an important area for energy efficient solutions. In
addition, thermal and air management describing and monitoring hot and cold air flows
and temperature within DCs is treated as a separate category in infrastructure segment
in certain literature.
b) from the performance perspective:
Metrics are primarily classified by environmental performance and IT performance.
• Environmental performance consists of power / energy consumption, source of energy
such as renewables or share of primary energy, energy shifting after the
95
implementation of flexibility mechanisms, (recycling) materials or equipment needed,
water consumption, waste heat and e-waste.
• IT performance could be regarded as outcome/output of a DC, which is combined with
a high degree of individuality and variability of the services and applications offered by
IT equipment in a DC.
Going deeper into the sub-categories, metrics indicating environmental performance could
focus on the whole DC facility, or solely focus on certain concrete IT equipment (e.g. servers
or storage), or on total IT equipment, or certain single infrastructure equipment (e.g. UPS).
The review of existing studies show that this generic term “environmental performance” could
be divided further into two groups, namely input-related and output-related. An input-related
group indicates energy or materials expenditure. An output-related group was often named as
“Greenness” metrics, which highlights consequences of environmental performance, e.g. CO2-
eq, waste heat reuse, efficiency of recycling etc.
• As for IT performance, “general” IT performance and “useful” IT performance should
be distinguished. “General” IT performance metric describes how much work is being
done without any indication whether the work is being done usefully or not. An example
is utilization of IT equipment, e.g. CPU utilization, which is no determination as to
whether the work being done is useful (The Green Grid 2010b).
• The “useful” IT performance metrics are often used for defining productivity proxy
metrics. The working paper #13 by the Green Grid (The Green Grid 2008) described
that DC productivity is “the quantity of useful information processing done relative to
the amount of some resource consumed in producing the work”. Productivity metrics
are generally understood as how much useful work is done by how much resource.
Useful work is a general expression and defined in ITU-L 1315 as “the expected results
to be delivered by a device” (ITU-T L.1315 2017). Metrics considering useful work aim
to gauge the real computing, e.g. workload-related metrics (Chinnici et al. 2016). Such
a metric is complex and unique for each DC depending on the applications or services
running in a DC (e.g. web service, databank service, email service), so that the users
evaluate the level of usefulness of the IT work-output for their business (Chinnici et al.
2016).
• However, it is important to stress that the real “useful work” has not yet been thoroughly
investigated. An important finding resulting from the German KPI4DCE project
(Schödwell et al. 2018) states that for every computing operation of the CPU, each
stored file and every bit transferred to the outside world is interpreted as “useful”. In
fact, data often is computed and stored twice and needs to be retransmitted without
creating additional benefits.
• We consider broadly the useful work as workload, the number of tasks or operations
executed in DCs productivity proxy metrics, since there is no standard definition of the
real useful work.
c) from the perspective of sustainability:
Metrics can be classified by their contribution to a sustainable development with the sub-
targets environment, economy and social impacts as well as security and privacy issues.
We will not investigate this broad scope and therefore it will not be taken into account, as
the focus of this task is energy and resource efficiency which are mainly environmental
issues.

96
Overview of existing metrics of DCs
A comprehensive desk research focusing on assessing DC's energy and resource efficiency
metrics has been conducted. The literature covered research studies on this topic,
standardisation activities, industry initiatives, regulations etc.
Criteria in the search for existing metrics have to be limited to the following due to the high
number of metrics:
• promoting an improvement in energy and resource efficiency in accordance with the
aims of this task
• already existing international and European standards, e.g. ISO, EN, ITU, ETSI
• well-known and widely accepted and applied in practice / commonly adopted metrics
• organisations who have already made significant contribution to developing metrics,
e.g. the Green Grid, Japan’s Green IT Promotion Council, Uptime Institute, British
Computer Society
• relevant DC certifications and schemes as well as labelling, in order to check whether
and which metrics are adopted in their programs, e.g. German Blue Angel, Energy Star
program, EU CoC for DCs
• diverse research reports and studies, especially in EU-funded projects, which have
compiled metrics and/or developed new metrics.
Based on the above, the following classification has been determined to use for distinguishing
the diverse metrics with the different focuses considered. The colour code as shown in Table
15 is used throughout this task and the corresponding annex.
Table 15: Colour code for classifying metrics
Classification Sub-Category
Environment
al
performance
metrics
Power / Energy
Natural resource: materials, raw materials
Water
Waste: waste heat or e-waste
Environmental impact: CO2-eq or other environmental impact category
Combined
Environmental performance and general IT performance - combined
Environmental performance and useful IT performance - Productivity proxy
metrics
Source: Oeko-Institut
An overview of the metrics is illustrated in Table 16 with the corresponding colour code. A
detailed description of each metric can be found in Annex 4, where metrics are presented

97
based on the above-mentioned classification in separate tables. More information on the
scope, computation, and source can also be found in Annex 4.

98
Table 16: Overview of 71 selected metrics and 6 DC-relevant labelling or certification scheme
Source: Oeko-Institut. Hatching highlighted indicates the metrics covering other life cycle phase beyond operational stage

99
As Table 17 shows, metrics considering only the operational phase and energy consumption
dominate in the existing metrics landscape. Metrics beyond the operational phase focus on
primary energy associated with the production phase or water used in the production of energy
consumed in DCs. Lifecycle based metrics were investigated by the German project KPI4DCE
(Schödwell et al. 2018). They evaluated abiotic resource depletion (ADP) beyond global
warming potential (GWP) and developed a tool to assist DC operators in calculating the
environmental impacts associated with upstream processes. However, the emission factors
provided by the KPI4DCE remains on the general level, without considering technological
advantages and different configuration of IT equipment. Regarding this aspect, a research
investigation is still needed.
Table 17: Number of metrics based on different perspectives
Based on life phases covered number of metrics
metrics considering only operational phase 57
metrics beyond operational phase 7
Based on environmental aspects covered number of metrics
metrics considering energy 50
metrics considering water 2
metrics considering materials 1
metrics considering e-waste 1
metrics considering waste heat 5
metrics considering CO2-eq 4
metrics considering other environmental impacts beyond CO2-eq 1
Source: Oeko-Institut
It was found that certain metrics which had been developed previously have in fact similar
meanings, but come under other names. For instance, Power usage effectiveness (PUE), Site
Infrastructure Energy Efficiency ratio (SI-EER) and KPITE all describe the ratio of total DC
annual power/energy to total IT annual power and energy. Another comparable metric is the
Data centre infrastructure efficiency (DCiE), which is the inverse of the PUE. DCiE is in turn
identical to another metric, namely Facility Energy Efficiency (FEE). The metrics, Carbon
Usage Effectiveness (CUE) and Technology Carbon Efficiency (TCE), basically provide the
same computational formulae.
In contrast, certain metrics with the same abbreviations have different meanings. For instance,
there are two metrics with the abbreviation CPE, one stands for Compute Power Efficiency
quantifying the efficiency of IT equipment utilization in DCs (The Green Grid 2008). The other,

100
stands for Cumulated Performance Efficiency describing the total performance to the
cumulated energy demand (CED) during its lifecycle (Peñaherrera and Szczepaniak 2018).
Gap analysis
The overall purpose of this task is to identify appropriate metrics that allow DC operators to
measure energy and resource efficiency of DCs and also allow policy-makers to monitor
energy consumption and greenhouse gas emissions in order to contribute to achieving the EU
2030 greenhouse gas emission reduction target under the Paris Agreement.
Based on this background, the next step is to examine whether such kinds of metrics already
exist and to identify the potential gaps.
As already shown, there is an abundant number of metrics. It is therefore important to clarify
which of these are widely accepted by the DC industry and applied in the context of policy
measurement. Hence, we will go through the following four blocks below and compile the
metrics used as they were created on the basis of well-established technical committees and
consortia and have been compiled and validated with various stakeholders over many years.
A brief description based on the four blocks above is as follows:
• The existing standards metrics of (ISO/IEC Table 18) set the definition of metrics, the
measurement procedure and also the reporting requirements. These standards should
be the first priority to be addressed to ensure the same applied methodology. It should
be stressed that the intention of these metrics is for self-improvement, not for
comparison among different data centres.
Table 18 shows a series of standards of metrics developed by ISO (the International
Organization for Standardization) and IEC (the International Electrotechnical
Commission). On the European standardisation level, 5 European Standards (EN)
have already been completed: EN 50600-4-2 (Power Usage Effectiveness: PUE), EN
50600-4-3 (Renewable Energy Factor: REF), EN 50600-4-6 (Energy Reuse Factor:
ERF), EN 50600-4-8 (Carbon Usage Effectiveness: CUE), EN 50600-4-9 (Water
Usage Effectiveness: WUE). A new series of further metrics is being developed e.g.
cooling efficiency ratio (CER) under EN 50600-4-7, a data centre maturity model
(DCMM) under EN 50600-5-1 to meet the needs of EU policies for resource efficiency
of DCs.

101
Table 18: ISO/IEC standards concerning energy and resource relevant metrics of DCs
Source: Oeko-Institut
*under development
• Another important development of DC Key Performance Indicators (KPIs) is the Data
centre maturity model (DCMM), which was firstly developed in 2010 by the Green
Grid. CEN/CENELEC/ETSI TC215 WG 3 committee is now working on it. DCMM is
integrated into the EN 50600 series and has been assigned the number EN 50600-5-
1 (Booth 2020). The DCMM provides evaluation criteria so that DC operators can
benchmark the current performance, determine DCs’ levels of maturity and identify the
improvement measurement for a better energy efficiency and sustainability (The Green
Grid 2014b). Five Levels of DC Maturity are defined, namely:
• Level 0: Minimal / No Progress
• Level 1: part best practice
• Level 2: Best Practice,
• Level 3 /4: Reasonable Steps (between current best practices and the visionary
five year projection)
• Level 5: Visionary - 5 years away
DCMM assesses a wide range of DC areas, from facilities to IT. Eight categories
assessed include Power, Cooling, Other Facility, Management, Compute, Storage,
Network, Other IT. The most recent detailed description of criteria of each category
can be found in the CATALYST Report task 8.11 (Booth 2019). Table 19 only lists the
possible metrics required in the DCMM described in the Report task 8.11, since EN
50600-5-1 DCMM is still under development.
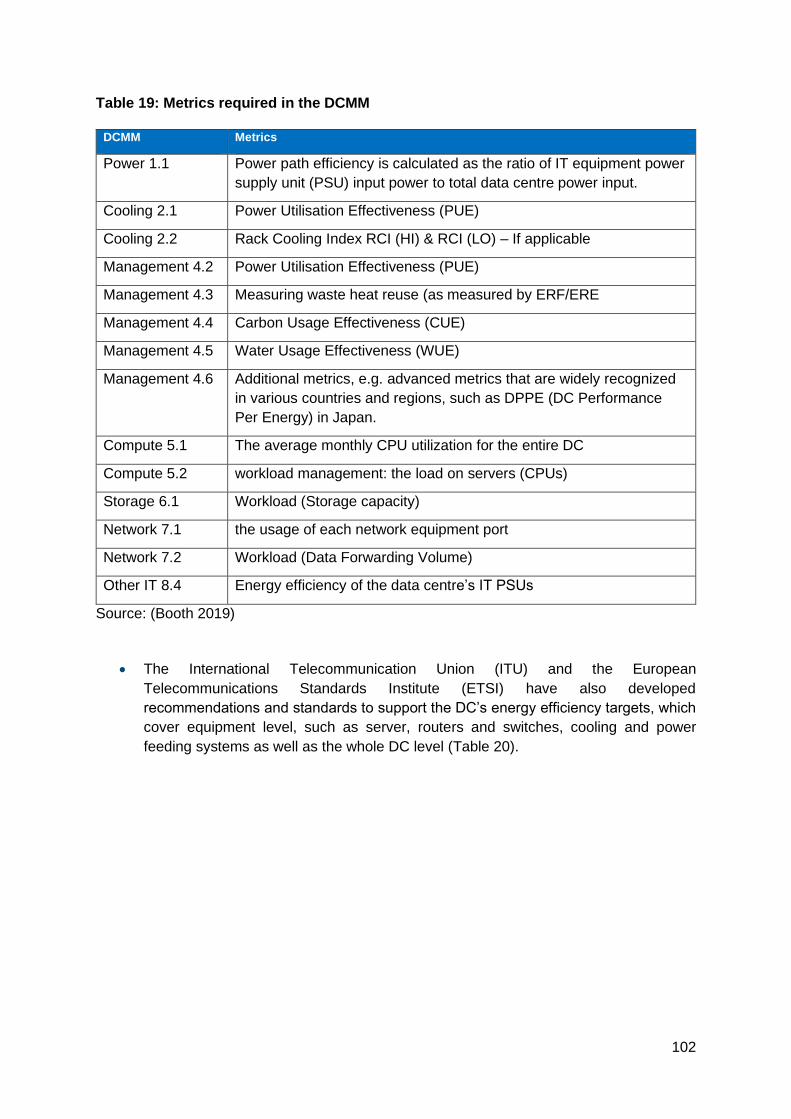
102
Table 19: Metrics required in the DCMM
DCMM Metrics
Power 1.1 Power path efficiency is calculated as the ratio of IT equipment power
supply unit (PSU) input power to total data centre power input.
Cooling 2.1 Power Utilisation Effectiveness (PUE)
Cooling 2.2 Rack Cooling Index RCI (HI) & RCI (LO) – If applicable
Management 4.2 Power Utilisation Effectiveness (PUE)
Management 4.3 Measuring waste heat reuse (as measured by ERF/ERE
Management 4.4 Carbon Usage Effectiveness (CUE)
Management 4.5 Water Usage Effectiveness (WUE)
Management 4.6 Additional metrics, e.g. advanced metrics that are widely recognized
in various countries and regions, such as DPPE (DC Performance
Per Energy) in Japan.
Compute 5.1 The average monthly CPU utilization for the entire DC
Compute 5.2 workload management: the load on servers (CPUs)
Storage 6.1 Workload (Storage capacity)
Network 7.1 the usage of each network equipment port
Network 7.2 Workload (Data Forwarding Volume)
Other IT 8.4 Energy efficiency of the data centre’s IT PSUs
Source: (Booth 2019)
• The International Telecommunication Union (ITU) and the European
Telecommunications Standards Institute (ETSI) have also developed
recommendations and standards to support the DC’s energy efficiency targets, which
cover equipment level, such as server, routers and switches, cooling and power
feeding systems as well as the whole DC level (Table 20).
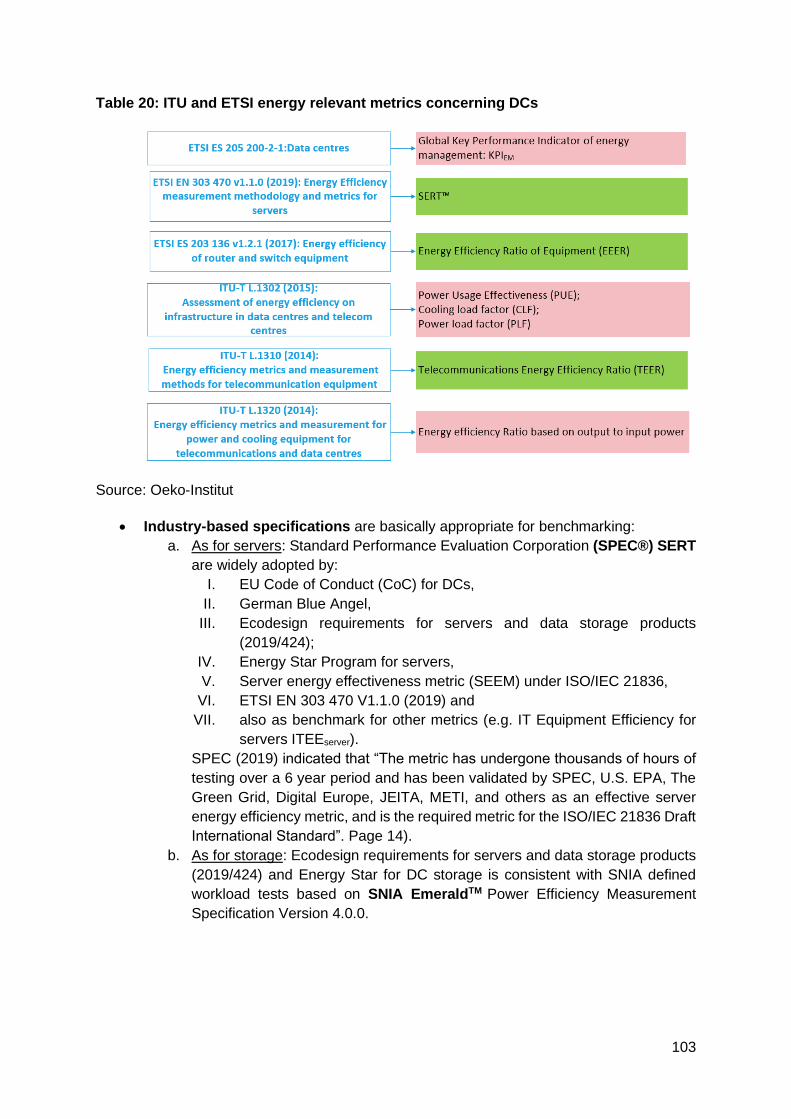
103
Table 20: ITU and ETSI energy relevant metrics concerning DCs
Source: Oeko-Institut
• Industry-based specifications are basically appropriate for benchmarking:
a. As for servers: Standard Performance Evaluation Corporation (SPEC®) SERT
are widely adopted by:
I. EU Code of Conduct (CoC) for DCs,
II. German Blue Angel,
III. Ecodesign requirements for servers and data storage products
(2019/424);
IV. Energy Star Program for servers,
V. Server energy effectiveness metric (SEEM) under ISO/IEC 21836,
VI. ETSI EN 303 470 V1.1.0 (2019) and
VII. also as benchmark for other metrics (e.g. IT Equipment Efficiency for
servers ITEEserver).
SPEC (2019) indicated that “The metric has undergone thousands of hours of
testing over a 6 year period and has been validated by SPEC, U.S. EPA, The
Green Grid, Digital Europe, JEITA, METI, and others as an effective server
energy efficiency metric, and is the required metric for the ISO/IEC 21836 Draft
International Standard”. Page 14).
b. As for storage: Ecodesign requirements for servers and data storage products
(2019/424) and Energy Star for DC storage is consistent with SNIA defined
workload tests based on SNIA EmeraldTM Power Efficiency Measurement
Specification Version 4.0.0.

104
• The CATALYST project102 funded by the European Union’s Horizon 2020 research and
innovation programme have developed a Green Data Centre (GDC) Assessment
Toolkit to self-assess the environmental impact of a DC facility (Georgiadou et al.
2018). The grades are defined simply as Bronze, Silver and Gold. Grade-based
metrics in the examined topic is shown in Table 21. In addition to the two Water Usage
Effectiveness metrics (WUEsite and WUEsource), the Electronics Disposal Efficiency
(EDE) metric is also recommended, although water and e-waste management in the
CATALYST context does not fall within the scope. It should be stressed that the metrics
considered focus on operating expenses and do not take IT performance into account.
Table 21: Metrics considered in Green Data Centre (GDC) Assessment Toolkit by the
CATALYST project
Grade-based metrics in
4 themes
Bronze Silver Gold
Renewable Energy Renewable energy
factor (REF) defined by
EN 50600-4-3
Renewable energy
factor (REF) defined by
EN 50600-4-3, however
only energy generated
on-site is considered
Adaptability Power
Curve (APCren) flexibility
metric defined by the
Cluster
Heat Reuse the ratio of recovered
energy over the total DC
energy consumption : In-
house Reuse Factor
(IRF)
Energy Reuse Factor
(ERF) defined by
ISO/IEC 30134-6; EN
50600-4-6;
• Sustainable Heat
Exploitation (SHE) as
an indicator related to
the efficiency of the
waste heat recovering
equipment or strategy
such as a heat pump
system.
• Heat Usage
Effectiveness (HUE):
to obtain the amount of
heat recovered
Energy Efficient
Infrastructure
Power usage
effectiveness (PUE)
defined by EN 50600-4-2:
Category 1
The DC operator reports
on the PUE Category 2
The DC operator reports
on the PUE Category 3.
Resources Management,
such as energy, water, e-
Waste
CO2-eq resulted from
DC’s facility energy
consumption multiplied
by Carbon Emission
Factor (CEF)
The DC operator
measures and reports
the change in terms of
primary energy
consumed by a DC:
Primary Energy (PE)
Savings (s. Table 50)
Primary Energy (PE)
Savings and CO2
savings (s. Table 50)
Source: (Georgiadou et al. 2018)
102 https://project-catalyst.eu/ The CATALYST project has considered the work resulted by the EU-funded Cluster Project (s. Table 14).
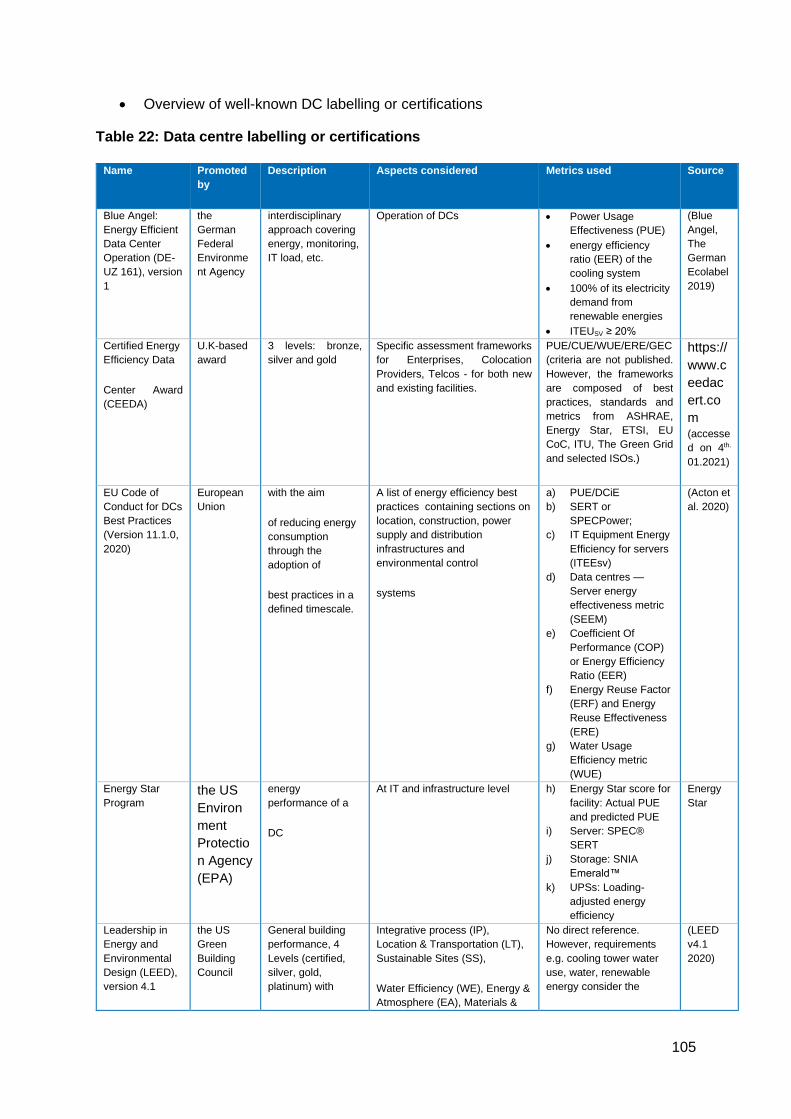
105
• Overview of well-known DC labelling or certifications
Table 22: Data centre labelling or certifications
Name Promoted
by
Description Aspects considered Metrics used Source
Blue Angel:
Energy Efficient
Data Center
Operation (DE-
UZ 161), version
1
the
German
Federal
Environme
nt Agency
interdisciplinary
approach covering
energy, monitoring,
IT load, etc.
Operation of DCs • Power Usage
Effectiveness (PUE)
• energy efficiency
ratio (EER) of the
cooling system
• 100% of its electricity
demand from
renewable energies
• ITEUSV ≥ 20%
(Blue
Angel,
The
German
Ecolabel
2019)
Certified Energy
Efficiency Data
Center Award
(CEEDA)
U.K-based
award
3 levels: bronze,
silver and gold
Specific assessment frameworks
for Enterprises, Colocation
Providers, Telcos - for both new
and existing facilities.
PUE/CUE/WUE/ERE/GEC
(criteria are not published.
However, the frameworks
are composed of best
practices, standards and
metrics from ASHRAE,
Energy Star, ETSI, EU
CoC, ITU, The Green Grid
and selected ISOs.)
https://
www.c
eedac
ert.co
m
(accesse
d on 4th.
01.2021)
EU Code of
Conduct for DCs
Best Practices
(Version 11.1.0,
2020)
European
Union
with the aim
of reducing energy
consumption
through the
adoption of
best practices in a
defined timescale.
A list of energy efficiency best
practices containing sections on
location, construction, power
supply and distribution
infrastructures and
environmental control
systems
a) PUE/DCiE
b) SERT or
SPECPower;
c) IT Equipment Energy
Efficiency for servers
(ITEEsv)
d) Data centres —
Server energy
effectiveness metric
(SEEM)
e) Coefficient Of
Performance (COP)
or Energy Efficiency
Ratio (EER)
f) Energy Reuse Factor
(ERF) and Energy
Reuse Effectiveness
(ERE)
g) Water Usage
Efficiency metric
(WUE)
(Acton et
al. 2020)
Energy Star
Program the US
Environ
ment
Protectio
n Agency
(EPA)
energy
performance of a
DC
At IT and infrastructure level h) Energy Star score for
facility: Actual PUE
and predicted PUE
i) Server: SPEC®
SERT
j) Storage: SNIA
Emerald™
k) UPSs: Loading-
adjusted energy
efficiency
Energy
Star
Leadership in
Energy and
Environmental
Design (LEED),
version 4.1
the US
Green
Building
Council
General building
performance, 4
Levels (certified,
silver, gold,
platinum) with
Integrative process (IP),
Location & Transportation (LT),
Sustainable Sites (SS),
Water Efficiency (WE), Energy &
Atmosphere (EA), Materials &
No direct reference.
However, requirements
e.g. cooling tower water
use, water, renewable
energy consider the
(LEED
v4.1
2020)
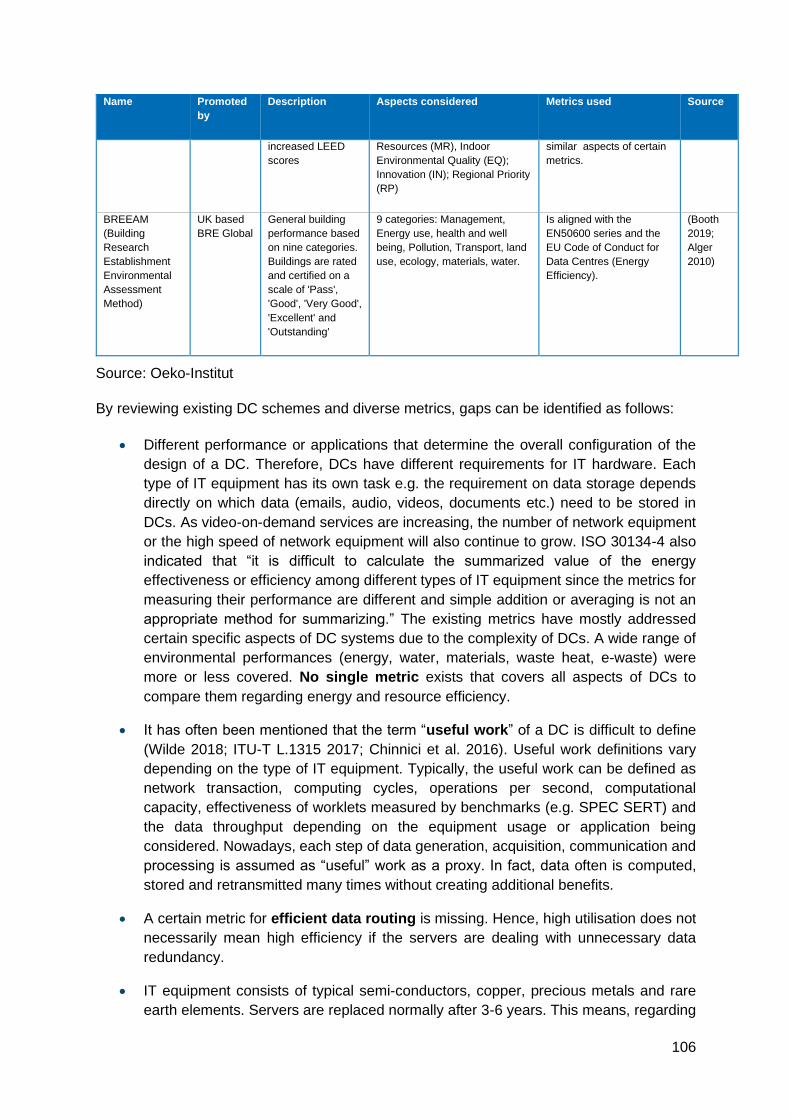
106
Name Promoted
by
Description Aspects considered Metrics used Source
increased LEED
scores
Resources (MR), Indoor
Environmental Quality (EQ);
Innovation (IN); Regional Priority
(RP)
similar aspects of certain
metrics.
BREEAM
(Building
Research
Establishment
Environmental
Assessment
Method)
UK based
BRE Global
General building
performance based
on nine categories.
Buildings are rated
and certified on a
scale of 'Pass',
'Good', 'Very Good',
'Excellent' and
'Outstanding'
9 categories: Management,
Energy use, health and well
being, Pollution, Transport, land
use, ecology, materials, water.
Is aligned with the
EN50600 series and the
EU Code of Conduct for
Data Centres (Energy
Efficiency).
(Booth
2019;
Alger
2010)
Source: Oeko-Institut
By reviewing existing DC schemes and diverse metrics, gaps can be identified as follows:
• Different performance or applications that determine the overall configuration of the
design of a DC. Therefore, DCs have different requirements for IT hardware. Each
type of IT equipment has its own task e.g. the requirement on data storage depends
directly on which data (emails, audio, videos, documents etc.) need to be stored in
DCs. As video-on-demand services are increasing, the number of network equipment
or the high speed of network equipment will also continue to grow. ISO 30134-4 also
indicated that “it is difficult to calculate the summarized value of the energy
effectiveness or efficiency among different types of IT equipment since the metrics for
measuring their performance are different and simple addition or averaging is not an
appropriate method for summarizing.” The existing metrics have mostly addressed
certain specific aspects of DC systems due to the complexity of DCs. A wide range of
environmental performances (energy, water, materials, waste heat, e-waste) were
more or less covered. No single metric exists that covers all aspects of DCs to
compare them regarding energy and resource efficiency.
• It has often been mentioned that the term “useful work” of a DC is difficult to define
(Wilde 2018; ITU-T L.1315 2017; Chinnici et al. 2016). Useful work definitions vary
depending on the type of IT equipment. Typically, the useful work can be defined as
network transaction, computing cycles, operations per second, computational
capacity, effectiveness of worklets measured by benchmarks (e.g. SPEC SERT) and
the data throughput depending on the equipment usage or application being
considered. Nowadays, each step of data generation, acquisition, communication and
processing is assumed as “useful” work as a proxy. In fact, data often is computed,
stored and retransmitted many times without creating additional benefits.
• A certain metric for efficient data routing is missing. Hence, high utilisation does not
necessarily mean high efficiency if the servers are dealing with unnecessary data
redundancy.
• IT equipment consists of typical semi-conductors, copper, precious metals and rare
earth elements. Servers are replaced normally after 3-6 years. This means, regarding

107
the depletion of natural resources that the ICT equipment in data centres are far more
relevant than the infrastructure equipment. Also, ICT equipment causes e-waste after-
life. This is relevant with regard to the circular economy concept since the production
of data centre ICT components (e.g. servers) is very resource intensive and contributes
significantly to the embodied carbon footprint. The current metrics do not take depletion
of natural resources into account. There are certain metrics for material consumption
in the operational phase, but no holistic environmental assessment perspective
exists. For this purpose, a standard tool is required that covers the holistic
environmental impacts of IT equipment so that DC operators can evaluate the
embodied environmental impacts.
• Metrics quantifying refrigerants usage and leakage amount are still missing. These
are important due to their relevance to GWP and ozone depletion potential.
• Different redundancy levels are connected with the infrastructure requirement. Wilde
(2018) described that “as a rule of thumb, the more redundant, the less energy efficient
the data centre is.” Redundancy is directly connected with reliability. The question is
which level of redundancy is sufficient enough without affecting reliability of individual
DCs businesses and how to determine them?
Recommendation on a proposal of a harmonised methodology for measuring energy
and resource efficiency
A harmonised methodology for measuring energy and resource efficiency should meet the
following requirements:
• Goal-oriented: the indicators should describe a clear goal, i.e. resource efficiency and
energy efficiency.
• Measurable: the indicators to be proposed should be measurable with justifiable efforts
• Usability: the indicators to be proposed should be pragmatic so that they can easily be
adopted by the DCs.
• Optimisable: the indicators to be proposed enable the DCs operators to identify the
improvement of the measurement in order to improve their environmental
performance.
• Comparability: the indicators should be standardized to such an extent that it is
possible to compare different data centres.
Recommendations for metrics with corresponding methodologies and their
justification are described below.
1. Total absolute annual IT and facility energy consumption & PUE value according
to EN 50600-4-2: Three PUE1-3 categories have been defined in ISO/IEC 30134-2
depending on the measurement point and at the UPS, PDU and single IT equipment
respectively. It is recommended that each DC should publish the absolute total IT and
facility annual energy consumption, besides the reporting requirements defined in
ISO/IEC 30134-2. PUE is still the dominant metric broadly used in the data centre
industry (Canfora et al. 2020; Shehabi et al. 2016). Most DCs can calculate PUE. The
main limitation to PUE is that it does not measure the energy efficiency of IT equipment

108
and does not take into account IT performance. Due to this limitation, PUE should be
complemented by other well-established metrics of IT efficiency. With regards to the
annual energy consumption, reporting on energy source with the corresponding
consumption value should be given.
2. Renewable Energy Factor (REF) according to EN 50600-4-3: One of the key targets
for 2030 under the EU climate and energy framework is at least a 32% share for
renewable energy103. This renewable energy metric could facilitate an understanding
and the monitoring of the share of renewable energy used in DCs. In addition, this
metric can partially address the limitation of PUE.
3. Energy Reuse Factor (ERF) according to EN 50600-4-6: waste heat from DCs is
considerable and continuously increasing as a consequence of the growing of DC
industry. The big obstacle for reusing waste heat is the low temperature, which does
not meet the temperature required e.g. for the district heating system. Therefore, an
additional investment cost is caused by e.g. installing heat pumps to raise the
temperature. This is not affordable for small or medium DCs operators who might need
more government financial support and/or professional consultants to find the
application solutions with none/low additional investment. The recommendation would
be that DCs with higher than a certain electric load (e.g. 1MWel) should be obliged to
report ERF. DCs below this load should measure and monitor the temperature of white
space. 1 MW (Range between 1MW and 2MW are defined as medium size DCs) is
suggested, since it is assumed that medium size DCs are capable of implementing
energy reuse measurements and therefore calculating ERF metrics.
4. In terms of water consumption and water efficiency of DCs, very little has been
published. Water Usage Effectiveness on site (WUEsite) should be reported
according to EN 50600-4-9: Water Usage Effectiveness (WUE). WUEsite refers to direct
water usage in HVAC systems of DCs to cool the IT equipment.
5. DC operators should be obliged to report on their disposal number and weight of
obsolete IT hardware as well as Electronics Disposal Efficiency (EDE) metric.
Reporting the absolute value of obsolete IT hardware can support policymakers in
monitoring e-waste. The ERE metric expressed in % can increase industry awareness
regarding the responsible disposal of IT assets.
6. Reporting type and amount of refrigerants used and leakage amount per year. This
operation expenditure should be easily obtained by the DCs since yearly technical
inspection should be conducted and new refrigerants would be purchased, if refilling
is required refrigerants play an important role for assessing the GWP and ozone
depletion potential. Hence, understanding the realistic usage is an underlying first step
for environmental impact analysis and further improvement measurements.
7. Benchmarks such as SPEC SERT for server and SNIA for storage are commonly
recognised and have already been embedded in different regulations,
recommendations and model schemes of DCs. ISO/IEC 21836: Server Energy
103 https://ec.europa.eu/clima/policies/strategies/2030_en
109
Effectiveness Metric (SEEM) provides requirements on test method and reporting of
the energy effectiveness of servers. This standard builds upon the SPEC v2
benchmark and additional provides requirement for the creation of alternate server
energy effectiveness metrics for servers where SERT is not applicable.
8. DC utilization, especially the actual distribution of utilization over years, is a critical
indicator with respect to resource efficiency. Utilization metrics of servers, storage
and network equipment released by The Green Grid can be used to track and
communicate how ICT services are being consumed in the DC as a way to measure
efficiency and effectiveness (Newmark et al. 2017). As for standardized measurement,
ISO/IEC 30134-5: IT Equipment Energy Utilisation for Servers (ITEUsv) can be
used for servers. The measurement procedure has been described in the working
paper #72, by the Green Grid104.
We propose to set the above-mentioned recommendations as mandatory since there are
currently a large number of voluntary tools and schemes to promote the energy and resource
efficiency of DCs, such as EU CoC, Green Data Centre (GDC) Assessment Toolkit.
Furthermore, carbon-footprint-relevant metrics (e.g. carbon usage effectiveness based on
ISO/IEC 30134-8 or EN 50600-4-8) could be used as a supplementary metric beyond the
metrics and inventory data mentioned above. Metrics based on the operational expenditure
level provide more transparency and a straightforward statement. Certainly, DC operators can
calculate their CO2-eq by themselves. And policy makers can jointly calculate the CO2-eq
associated with energy consumption and other operational expenditures, e.g. refrigerants or
water, if the expenditure data is available. However, if the carbon-footprint-relevant metrics
would be determined in the policy options, the following aspects should be kept in mind:
• Different countries have a different national electricity mix so the emission factor for 1
kWh electricity generated varies. Each aggregation step hampers transparency of
calculations and comparison of results as well as causing unnecessary documentation.
For instance, if a carbon footprint is calculated / reported, one should document to
which year the emission factor used refers to and which version of the IPCC method
is used, IPCC 2007, IPCC 2013 or probably a new version of the IPCC method will be
published soon.
• The primary benefit of metrics is to reduce operational expenditures, e.g. energy,
resource, or water. Metrics expressed in CO2-eq are not directly equivalent to energy
consumption. France has a very low CO2-eq emission factor for its national electricity
generation due to a high share of nuclear energy. However, this does not mean that
their data centres have a low energy consumption.
Hence, we strongly recommend that the emission factors used for calculating the carbon-
footprint-relevant metrics should be reported together with the carbon-footprint-relevant
metrics, if applied. In this sense, a standard database on the EU-level is needed, in which
emission factors of electricity generated by country-specific electricity grid or by any other
fossil and renewable energy sources are provided. The advantage is that emission factors
in the calculation would be unified and easily updated. Also, it facilitates comparisons of
104 https://www.thegreengrid.org/en/resources/library-and-tools/436-WP#72---ICT-Capacity-and-Utilization-Metrics
110
results and calculation steps. Especially for the small DCs, they might only depend on the
national electricity grid, since they do not have sufficient financial means to set up their own
renewable energy source(s). High emission factors of national electricity do not necessarily
mean that their DCs are operated with a poor energy performance.
Recommendations for further possible policy options to policy makers
1. There is a clear trend to no longer operate data centres locally, for example in a
company, but to use central data centres such as colocation or cloud service providers.
With the use of cloud services, a lot of information about energy consumption and
environmental impact is currently lost. Today, the operators of the data centres usually
do not provide any information about how much energy they require. Nonetheless,
when companies (in the role of customers) want to report on the emissions caused by
their business activities (scope 3 emissions), this information is essential. Data centre
operators should therefore be obliged to report the energy consumption of the
respective service to their customers together with the cost accounting of cloud
services. This obligation can also be laid down in the terms and conditions of the cloud
service contract.
2. DCs are complex, which makes measurement and monitoring challenging. There is no
one-size-fits-all metric so far, but it is impressive how many metrics have already been
developed105 in the last decade, and how many metrics might continue to be further
developed. However, in some cases, certain metrics have very similar meanings but
have different names, and vice versa. In other cases, metrics with the same
abbreviation have different meanings. It could be very tedious for DC operators to
select the right metric for what they want to measure and improve with respect to their
business model of DCs. It is recommend to establish a digital centre of DC metrics
on an EU open platform (possibly in the framework of the existing Global
Harmonisation Task Force for Data Centre Metrics106) to increase replicability, and
avoid overlapping and confusion of metrics. The DC operators would be encouraged
to put their feedback on e.g. practicality or applicability on the platform, which would
be a “living” stakeholder consultation.
3. We recommend establishing a European registration system and statistical
recording for DCs. Such a registration system serves as a database to represent
various characteristics of DCs covering building year (old or new DCs), services of
DCs, sizes, locations, cooling systems and types applied, number of
servers/storage/network equipment, redundancy levels, technical performance
(operations/IOs/throughput), temperature, humidity, IT energy consumption, total
facility consumption etc.
105 For instance, the German TEMPRO Project documented 68 metrics (Pehlken et al. 2019. The German KPI4DCE Project documented 94 metrics (Schödwell et al. 2018. The EU-funded Cluster Project documented 95 metrics (Smart city cluster collaboration, Task 1 2014. And all these focus on environmental performance of DCs, If other issues (i.e. economic and social issues) of sustainability are taken into account, the amount of metrics could be more.
106 https://euroalert.net/news/11898/eu-us-and-japan-harmonize-global-metrics-for-data-centre-energy-efficiency
111
4. Developing a practical guideline on how to utilize waste heat without heavy
investments for small & medium-DC operators.
5. Establishing a standard database for emission factors of electricity generated by
country-specific electricity grid or by any other fossil and renewable energy sources on
the EU-level to facilitate comparisons of results and calculation steps. This supporting
tool could be in harmonisation with EU PEF activity, in which secondary database
might also be provided.
2.2. Task 1.2: Indicators and standards: Electronic Communications Services
and Networks
Task 1.2.1: Current practices of electronic communications network operators and
service providers on reporting of their environmental performance
Aim of this task
The aim of this task is to analyse the current practices of electronic communications network
and service providers regarding the reporting of their environmental performance and how it
could affect end-user behaviour. The scope includes mandatory and voluntary reporting in the
sector of electronic communications services and networks.
Approach to data collection
Information for this task was collected in the following ways:
• desk research of reporting methodologies and studies on current reporting practices;
• review of corporate communication via company websites and publicly available
online reporting to stakeholders and consumers;
• an online survey was carried out for this project among electronic communications
network operators, service providers and network equipment suppliers.
Desk research on reporting methodologies
Environmental impacts, especially greenhouse gas emissions, are the subject of various
standards and guidelines for non-financial corporate reporting. Their common goal is to create
transparency about the methods and frameworks used to calculate and interpret the
environmental impacts that are communicated to the public. Various methodologies and
guidelines for corporate reporting of environmental aspects to stakeholders and consumers
exist.
Non-sector-specific GHG reporting frameworks are listed below:
• The GHG protocol specifies reporting of GHG emissions for companies or products.
The voluntary framework is the most commonly used accounting and reporting
framework. The Corporate Standard107 provides GHG accounting rules for companies
on how to quantify and publicly report an inventory of their GHG emissions. The
107 https://ghgprotocol.org/sites/default/files/standards/ghg-protocol-revised.pdf

112
Product Life Cycle Standard108 helps companies to calculate GHG emissions that are
associated with a specific product. Both guides are essential to ensure that corporate
reporting of GHG emissions is consistent with the following principles of GHG
accounting: relevance, completeness, consistency, transparency, and accuracy. The
specific requirements regarding public reporting aim at facilitating the communication
with a broad variety of audiences, including institutional stakeholders (such as
investors, insurance providers, authorities, etc.), but also the general public and lay
persons. The guide advises its users to report on GHG emissions in such a way that
the target groups can understand their influence possibilities to reduce GHG
emissions. For example, the end user of the product or the consumer in general should
be enabled to make informed purchasing decisions and prioritise their demand
according to the most relevant GHG reduction potentials.
• ISO 14064-1:2018109 “Greenhouse gases — Part 1: Specification with guidance at the
organization level for quantification and reporting of greenhouse gas emissions and
removals”
The international standard builds on the GHG protocol and specifies voluntary
procedures for quantification, monitoring, accounting, and reporting of GHG emission
reductions at the level of organisations. However, the standard does not facilitate the
generation of comparable results as it leaves room for an individual definition of
organisational boundaries in dependence from the reporting objective.
• ISO 14064-2:2019110 “Greenhouse gases – Part 2: Specification with guidance at the
project level for quantification, monitoring and reporting of greenhouse gas emission
reductions or removal enhancements”
o Similar to part 1, this part sets out a voluntary method for accounting and
reporting of GHG emission reductions at the level of individual projects. This
could also refer to individual services of products.
• The Carbon disclosure project (CDP)111 provides a global disclosure system for
companies, to manage and disclose their environmental impacts.
o The CDP is a non-profit organisation that runs a global report system that
allows its user (i.e. companies) to publicly disclose GHG emissions. The CDP
system represents a curated, proprietary repository of greenhouse gas
emissions data that provides accountability and transparency of publicly
disclosed greenhouse gas emissions. It helps companies to communicate their
corporate climate impact figures to stakeholders in a harmonised framework
without having to disclose business-related metadata to achieve credibility.
108 https://ghgprotocol.org/sites/default/files/standards/Product-Life-Cycle-Accounting-Reporting-
Standard_041613.pdf
109 https://www.iso.org/standard/66453.html
110 https://www.iso.org/standard/66454.html
111 https://www.cdp.net/en
113
CDP also provides a scoring methodology112 for companies as an instrument
to assess their progress towards stewardship in carbon footprint reduction.
There are industry-specific scoring methods, but not specifically for the
telecommunications sector.
• ISO 14001:2015113 “Environmental management” offers a certifiable verification for the
implementation of environmental management systems.
o The international standard provides a procedural framework for EMS.
Applicants can obtain a certificate of compliance with the standard, which
involves the principle of continual improvement, i.e. a company is obliged to
state what progress it has made in terms of environmental performance and
what improvement measures are planned for the future. The standard does not
impose an obligation for environmental reporting beyond the publication of an
environmental policy.
• Eco-Management and Audit Scheme114 (EMAS): based on the European EMAS
regulation.
o The EMAS scheme provides certifiable evidence of environmental
management system implementation that is broader in scope than ISO 14001.
Compared to ISO 14001, EMAS requires the fulfilment of several additional
requirements in the EMS, such as a regular environmental audit and the
prioritisation of all direct and indirect environmental aspects. Furthermore,
EMAS requires to report on the company's environmental performance in the
form of a validated environmental statement. The content and details of the
environmental aspects to be reported are to fulfil the requirements of EMAS
Annex IV and also depend on the company's environmental policy and the
environmental aspects defined therein. They may include the carbon footprint
and other relevant environmental aspects. The European Commission
provides industry-specific requirements on the environmental statement in form
of sectoral reference documents. For the Telecommunications and ICT
services sectors, a sectoral reference document is under development. In
2020, the JRC has published a Best Practice report115 that describes a set of
best Environmental Management Practices (BEMP) with high potential for
larger uptake. The report analyses examples of environmentally relevant
indicators and metrics in data centres and telecommunication networks.
112https://guidance.cdp.net/en/tags?cid=18&ctype=theme&gettags=0&idtype=ThemeID&incchild=1µsite=0&
otype=ScoringMethodology&page=1&tags=TAG-605&tgprompt=TG-124%2C
113 https://www.iso.org/standard/60857.html
114 https://ec.europa.eu/environment/emas/index_en.htm
115 Canfora, P., Gaudillat, P., Antonopoulos, I., Dri M. (2020): Best Environmental Management Practice inthe Telecommunications and ICT Services sector. Joint Research Centre, Sevilla - Spain
https://susproc.jrc.ec.europa.eu/activities/emas/telecom.html

114
• Global Reporting Initiative116 (GRI), a series of international reporting standards for
disclosure.
o The GRI is an independent international standards organisation that develops
a framework for corporate sustainability reporting. The GRI guidelines are
among the most well-known guidelines for voluntary corporate social
responsibility (CSR) and sustainability reports worldwide. The aim is to make
responsible and transparent sustainability reporting common practice. In doing
so, the GRI provides reporting principles and assists in meeting content and
quality requirements. The GRI criteria are: accuracy, balance,
comprehensibility, comparability, reliability, and timeliness. They are assessed
through stakeholder engagement, the Sustainability Code, materiality and
completeness. GRI's Sustainability Reporting Guidelines are recognised by the
Directive 2014/95/EU – also called the non-financial reporting directive
(NFRD)117 - as a valid framework for corporate reporting.
Several sector-specific environmental reporting methodologies in the telecommunications and
ICT industry exist:
• ITU-T L.1470 (01/2020)118: “Greenhouse gas emissions trajectories for the
information and communication technology sector compatible with the UNFCCC
Paris Agreement”:
o This guideline can be used as a calculation benchmark for GHG emissions in
the ICT sector and provides a basis for reporting company's GHG emissions to
the public. It constitutes a normative reference for the setup of carbon emission
trajectories in the context of the TK-sector specific three scope model: scope
1: direct GHG emissions; scope 2, GHG emissions related to purchased
energy; scope 3: emissions over a company`s influenceable value chain. The
guideline supports the public communication GHG trajectories in line with the
aim of the of science-based targets (SBT) initiative119. Compliance with these
guidelines is voluntary.
• ITU recommendations L.1331120 and L.1332121: “Assessment of mobile network
energy efficiency / Total network infrastructure energy efficiency metrics”:
o The two guidelines describe a calculation metric for assessing the energy
efficiency of mobile networks and overall network infrastructures. The results
are to be documented in the form of an assessment report, the structure and
required contents of which are described in detail in the guideline. The intended
116 https://www.globalreporting.org/
117 https://eur-lex.europa.eu/legal-content/EN/TXT/?uri=CELEX%3A32014L0095
118 https://www.itu.int/ITU-T/recommendations/rec.aspx?rec=14084
119 https://sciencebasedtargets.org/
120 https://www.itu.int/rec/T-REC-L.1331/_page.print
121 https://www.itu.int/rec/T-REC-L.1332-201801-I/en

115
audience of the assessment reports includes telecommunication administration
and a recognized operating agency rather than the general public. Compliance
with these guidelines is voluntary. However, network operators should rely on
these guidelines when assessing the energy efficiency of network components
if these become environmental statements to be communicated to the public
• ITU-T L.1420 (02/2012)122: “Methodology for energy consumption and greenhouse
gas emissions impact assessment of information and communication technologies in
organizations”
o This ICT-sector specific guideline presents the methodology for assessing
energy consumption and greenhouse gas (GHG) emissions related to the ICT
infrastructure of a company. It builds on the GHG Protocol Product Life Cycle
Accounting and Reporting Standard (see above). The guideline recommends
a standard-conform method for the assessment of life cycle related
environmental impact of ICT goods, networks and services, including PCs,
servers, data centres and networks. Its scope covers direct and indirect (first
and second order) effects. Further, the guideline assists in the interpretation
and the reporting of these impacts in a transparent manner.
• Joint Audit Cooperation (JAC)123
Deutsche Telekom, France Telecom and Telecom Italia founded the JAC in 2010 as a
platform for auditing, evaluating and further developing the implementation of
corporate social responsibility (CSR). It is open to all telecommunications operators
worldwide. It serves to harmonise CSR standards throughout the ICT industry's
manufacturing and supply chain at the international level. The JAC methodology
includes a coordinated on-site audit and CSR implementation development
programme, which also includes a set of Key Performance Indicators (KPIs). It helps
suppliers measure and report their compliance with respect to the defined
requirements, including calculation rules for their energy consumption and carbon
footprint.
After collecting the information, a classification was made to structure the different focuses of
the reporting schemes and the complexity of the different network levels (see Figure 19).
122 https://www.itu.int/rec/T-REC-L.1420-201202-I
123 https://jac-initiative.com/
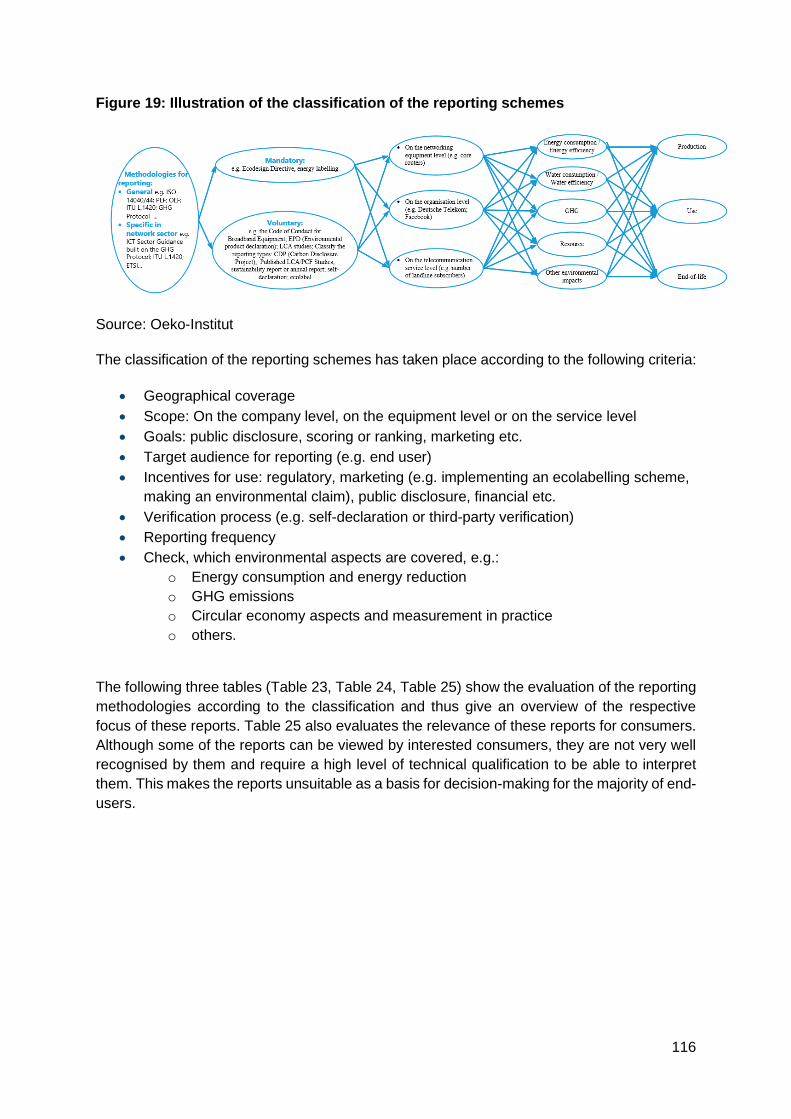
116
Figure 19: Illustration of the classification of the reporting schemes
Source: Oeko-Institut
The classification of the reporting schemes has taken place according to the following criteria:
• Geographical coverage
• Scope: On the company level, on the equipment level or on the service level
• Goals: public disclosure, scoring or ranking, marketing etc.
• Target audience for reporting (e.g. end user)
• Incentives for use: regulatory, marketing (e.g. implementing an ecolabelling scheme,
making an environmental claim), public disclosure, financial etc.
• Verification process (e.g. self-declaration or third-party verification)
• Reporting frequency
• Check, which environmental aspects are covered, e.g.:
o Energy consumption and energy reduction
o GHG emissions
o Circular economy aspects and measurement in practice
o others.
The following three tables (Table 23, Table 24, Table 25) show the evaluation of the reporting
methodologies according to the classification and thus give an overview of the respective
focus of these reports. Table 25 also evaluates the relevance of these reports for consumers.
Although some of the reports can be viewed by interested consumers, they are not very well
recognised by them and require a high level of technical qualification to be able to interpret
them. This makes the reports unsuitable as a basis for decision-making for the majority of end-
users.

117
Table 23: Requirements of environmental reporting schemes applicable to the
telecommunications sector
Name Mandatory
/ voluntary
Geographi
cal
coverage
Scope
Environmen-
tal aspects
addressed
Target audience Incentives for use
GHG
protocol
V worldwide Company GHG
accounting
institutional
stakeholders +
general public
Public communication of
corporate stewardship for
carbon emission
reduction, improvement of
public reputation and
credibility
ISO 14064-1 V Worldwide Company GHG
accounting
institutional
stakeholders
Same as above
ISO 14064-2 V Worldwide Service GHG
accounting
institutional
stakeholders
Same as above but with a
closer focus on sector
internal comparison
CDP V Worldwide Company GHG
accounting
Investors,
customers
Public disclosure of GHG
emissions facilitates
public reputation and
credibility
ISO 14001 V Worldwide Company All relevant
env. aspects
institutional
stakeholders +
general public
Public communication of
the corporate
environmental policy and
targets as well as
progress. Demonstrates
env. Stewardship towards
suppliers, customers and
authorities
EMAS V EU Site specific All relevant
env. aspects
institutional
stakeholders +
general public
Same as above
GRI V Worldwide Company All relevant
social & env.
aspects
institutional stake-
holders / general
public
Same as above +
additional corporate social
responsibility incl. supply
chain
ITU-T L.1470 V Worldwide Company GHG
accounting
Industry,
authorities
Facilitates comparability
of a company`s carbon
footprinting
ITU L.1331 /
32
V worldwide Equipment Energy
efficiency
Industry,
authorities
Facilitates comparability
of equipment energy
efficiency
ITU-T L.1420 V Worldwide Company Energy and
GHG
accounting
Industry,
authorities
Facilitates comparability
of a company`s carbon
footprinting
JAC V worldwide Company CSR including
energy use and
GHG
emissions
institutional
stakeholders +
general public
Supply chain and
customer communication
Source: Oeko-Institut

118
Table 24: Environmental aspects covered by reporting schemes applicable to the
telecommunications sector
Name Environmental aspects covered Verification process Reporting
frequency
GHG protocol GHG emissions (i.e. CO2
equivalents)
Verification by third party
verifiers ensure correct
application of the GHG
Protocol Corporate
Standard
Annual
ISO 14064-1 GHG emissions (i.e. CO2
equivalents)
Third-party validation and
verification required to
ensure that the reported
climate change data and
information is true, fair and
reliable
Unspecified
ISO 14064-2 GHG emissions (i.e. CO2
equivalents)
Same as above The reporting
period and
frequency may
vary
CDP GHG emissions (i.e. CO2
equivalents)
Third party verification
required in accordance
with a recognised
verification standard
Annual
ISO 14001 All environmental aspects identified
as being relevant, incl. energy
consumption, GHG, land use,
resource & water consumption, waste
etc.
Audit by accredited
independent assessor
Annual
EMAS Same as above Same as above + Env.
statement needs approval
by accredited assessor
Annual
GRI Same as above + social aspects
(e.g., Employment, non-
discrimination, Occupational Health
and Safety, etc.)
Voluntary notification of
GRI standards-based
reports, Voluntary third-
party verification of
compliance to GRI
reporting principles is
possible.
Annual or
biennial
ITU-T L.1470 GHG emissions (i.e. CO2
equivalents)
None Not determined
ITU L.1331 / 32 Energy consumption None Not determined
ITU-T L.1420 GHG emissions (i.e. CO2
equivalents)
None Not determined
JAC Focus on Energy consumption and
GHG reduction, safe and fair working
conditions in the supply chain, Health
and Safety aspects, reduction of
resource consumption (such as
energy, water and raw materials) and
harmful emissions, waste
minimization in the supply chain.
On-site audit by a JAC
accredited 3. party audit
firm against JAC’s CSR
principles. Data
assessment based on
suppliers` self-declaration.
Not determined
Source: Oeko-Institut

119
Table 25: Evaluation of the reporting schemes
Name Advantages Disadvantages /
Limitations
Relevance for
Companies
Relevance for
Consumers
GHG protocol Enables companies to
develop
comprehensive and
reliable inventories of
their GHG emissions ->
increases internal and
external confidence in
the reported GHG data
Claimed credibility of
the scheme hinges on
the proprietary
verification process
Voluntary approach
provides for wide
acceptance and
application as a
reporting framework
The credibility of the
system is based on the
multi-stakeholder
process in its creation.
Interested consumers
can access the
guidelines;
ISO 14064-1 Same as above +
additionally a validation
of the reasonable-ness
of the assumptions
taken
Only Part 3 of ISO
14064 specifies the
process for verification
of a GHG assertion
Application of the
standard improved the
quality of GHG
reporting
Hardly known to
consumers; paywall
restricts consumers`
access to standards
ISO 14064-2 Same as above + focus
on product / service is
possible
Same as above Apparently less often
used thus far
Same as above
CDP Uniform GHG data
repository allows for
comparability of the
reported GHG data
Claimed credibility of
the scheme hinges on
the proprietary audit
scheme
Little risk for companies
to disclose confidential
meta data to the public
and competitors
Full access to data is
restricted by
registration & paywall
ISO 14001 Widely accepted in
international business
world and
stakeholders,
none State of the art in
international context
Often emphasised in
marketing but little
known to lay persons
(consumers)
EMAS More ambitious than
ISO 14001,
Recognised by EU
authorities and
insurances
Slightly more elaborate
in the implementation
than ISO 14001; site
specific scope
Verification ensures
credibility with investors
and clients
Same as above,
reporting obligations
provide for
transparency
GRI Clear and
comprehensive
guidelines are freely
available. Detailed
description of reporting
requirements.
none Most commonly used
framework for CSR
reporting,
internationally well
recognized by industry,
authorities, media and
civil society
Guidelines are freely
available and provide a
transparent set of
reporting requirements
as a reference
ITU-T L.1470 Provides detailed and
sector specific
calculation rules
Necessitates technical
and accounting
expertise
Useful as a harmonized
calculation method
Hardly known to
consumers
ITU L.1331 / 32 Same as above Same as above Same as above Same as above
ITU-T L.1420 Same as above Same as above Same as above Same as above
JAC Self-regulation
approach provides for
good acceptance by TK
companies worldwide
Claimed credibility of
the scheme hinges on
the proprietary audit
scheme
Provides a harmonised
approach for supply
chain responsibility
Hardly known to
consumers
Source: Oeko-Institut
120
Review of corporate environmental communication
Approach
The analysis was based on a desk research of online corporate publications. The research
covered the reporting of ten major European telecommunications and network services
companies which are listed in Annex 7. Two forms of corporate communication were
considered: Periodic environmental or CSR reports published by these companies and non-
formal communication on their websites. In reviewing the environmental or CSR reports, the
latest versions of these reports were taken into account where available. These generally refer
to the 2019 and 2020 reporting periods. The analysis of communication via websites was
conducted in the first quarter of 2021 and represents a snapshot of the situation at this time.
The relevant reports were identified through a sequence of search queries (i.e. sustainability,
environment, CSR, annual report, etc.). The reports were checked for coverage of
environmental aspects, environmental goals and scope (direct and indirect aspects), use of
(key performance) indicators, target audiences, and which standard or guidelines were applied
for accounting and reporting. In reviewing environmental communication on corporate
websites, the focus was on analysing accessibility for consumers, i.e. whether, in which form
and how many clicks away from the main website the information is presented. The list of the
investigated reports and websites can be found in Annex 7: Task 1.2.1 References to telecom
operators' online public communication of green claims.
Findings from the review of current practices of environmental reporting by large European telecommunications network service providers
• All ten reviewed network service providers maintain environmental management
systems according to the standard ISO14001, which implies the obligation of
publishing an environmental report on an annual basis. The certification to ISO14001
implies the principle of continuous improvement of an organisations environmental
performance. This means, the corporate environmental policies are subject to periodic
review according to the plan-do-check-act (PDCA) cycle. The environmental reports
are supposed to reflect the progress made and the update of corporate environmental
policies.
• A mapping of current practices in sustainability reporting by major European
telecommunications network service providers shows that priority is given to business
aspects directly related to reducing climate change impacts. In particular, most
network operators have defined targets for increasing the share of renewable energy
in electricity consumption.
• Seven out of ten telecom network service providers explicitly commit to GHG
emission reduction targets while the remainder (three) communicate energy
efficiency targets that serve the same purpose of GHG-reduction.
• The purchase of renewable energy or purchase of guarantees of origin is the most
prominent tool for achieving GHG reduction targets. Some companies also report
about own renewable power plants that provide carbon neutral energy.
121
• However, the GHG reduction targets vary in ambition. Two operators claim to have
already accomplished climate-neutrality for their own operations. Six out of ten
companies target net-zero CO2 emissions from operations by 2050 at the latest
while two of them pursue this target by 2022 or 2030.
• Several network service providers aim at inducing GHG emission reductions beyond
the scope of their own operations as they intend to green their supply chain as well
as the upstream value chain, i.e. helping their customers to save energy.
• Another topic in sustainability reporting is circularity. Three out of ten companies
mention circularity as a strategic objective to be achieved in the future. Two more
report on the recycling of electronic waste (WEEE). This is commonly expressed in
form of measures to be implemented, such as goals to increase the reuse, reselling
or recycling of electronic waste (WEEE) generated by networks and data centres.
• The reporting of green targets and the disclosure of data that underpin their
achievement is usually subjected to a CDP evaluation. CDP124 (Carbon Disclosure
Project, a non-profit charity) provides a disclosure system for companies based on a
guidance for data aggregation on environmental impacts. This facilitates a scoring of
a company`s environmental performance on a highly aggregated level and eliminated
the need to the disclosure of detailed operational data.
• Green claims encompass targets on energy efficiency and carbon emission reduction
on corporate level, as well as circular economy related measures such as take back
and refurbishment / recycling schemes for post consumer equipment. Hardly reported
are product / technology-related performance indicators, such as carbon
footprints of network services of end user equipment. Only one company reports a
customer-related carbon footprint indicator.
Description and summary of the main features of current reporting schemes
• Nine out of ten network service providers have published sustainability reports,
either as a part of their corporate annual reports or in form of annual CSR /
environmental reports. One network service provider communicates its sustainability
commitment only via website (but without providing performance data).
• Reports concerning environmental targets focus on GHG emissions and electricity
consumption or energy efficiency indicators. Some companies distinguish different
scopes of their energy efficiency or GHG reduction targets, e.g. 1) direct impact (own
operations), 2) indirect impacts caused indirectly during the supply chain (such as
electricity generation in power plants), and 3) the influencing potential on the
customers` power consumption. The definitions of the scope and the respective
reduction targets varies among the companies and differ in their ambition.
• Most network service providers (nine out of ten) are members of the Joint Audit
Cooperation (JAC), which is an association of telecommunications service providers
124 Carbon Disclosure Project: https://www.cdp.net/

122
that aims at reviewing, evaluating and further developing the implementation of
corporate social responsibility (CSR). It has developed a common verification,
assessment and development methodology in the area of Corporate Social
Responsibility (CSR) and also provides reporting guidelines describing how the audit
findings shall be communicated based on objective evidence.
Description of the key findings with regard to information that affects the consumer’s behaviour
• Most network service providers publish their sustainability/environmental/CSR reports
as part of their annual corporate reporting and address an expert community as well
as institutional stakeholders. Although the reports are publicly available (for free
download) on the companies’ websites, their content is very technical and difficult
understand for non-experts.
• Most companies provide summarised facts and figures on GHG / energy reduction
targets on their websites in order to communicate to an interested non-expert
audience. However, the sustainability-related information is usually presented on the
business-to-business web-interfaces rather than the consumer web-interfaces, in
national languages. Climate and energy related arguments are typically not part of
marketing towards consumers whereas B2B communication presents these aspects
on the websites. Reporting is usually presented in the English language as well as the
language of the main market (i.e. the country where the head quarter is located).
• One of the providers has published a survey with consumers of 13 EU countries to ask
about the environmental awareness of telecommunications customers (Vodafone
2020). The survey concludes that 65% of respondents want to take action themselves
to tackle climate change. In terms of telecommunication services, they see the
reduction of new smartphone purchase frequency as a way to achieve this. None
of the survey questions asked about the efficiency of the network itself or gave the
choice between different network technologies. The survey therefore shows in
particular that while customers' consumption behaviour is being questioned in this one
particular case, the environmental impact of the telecommunications companies
themselves is not.
• A review of the academic literature did not reveal any relevant information on how
the disclosure of environmental information might affect end-user behaviour in terms
of choice of provider and in terms of use/consumption of services. Hardly any studies
focusing on the state of play of environmental information disclosure at European level
could be identified in the scientific literature.
Results from the online survey with electronic communications network providers and
equipment manufacturers
In order to gain further insight into the practices of telecommunications companies, an online
survey among electronic communication network operators, communications equipment
manufacturers and European telecommunications associations was conducted in March
2021. The questionnaire for this survey can be found in Annex 4: Questions for survey to
electronic communications network operators, service providers and network equipment
suppliers related to Task 1.2.1 and Task 1.2.2.

123
A total of 25 companies responded to this survey and contributed information to this research,
16 of them answered to all the questions. Only five of the companies included in the review of
corporate environmental communication (see previous section “Review of corporate
environmental communication”) were among the respondents to the online questionnaire, the
other respondents represent national or specialised network operators. The surveyed
companies have a regional coverage of their business activities across all EU Member States
and are additionally active in other European countries and partly worldwide. The results of
the online survey thus provide a good overview of European telecommunications service
providers. The answers of the online survey were assigned to the respective Tasks 1.2.1
(reporting) and Task 1.2.2 (assessment).
The responding companies are mainly electronic communications service providers
(telephone, internet, television) and operators of electronic communication networks (14 out
of 25). Some of them operate data centres (9 of 25) and some are suppliers for network
equipment (8 of 25). A smaller number of the respondents (4 of 25) were associations to
represent operators of electronic communications networks, semiconductor manufacturers,
transport companies or software-as-a-service providers.
Table 26 shows the mainly offered services by the responding companies. The main services
offered are fixed broadband internet access (100%), fixed voice communications (telephony)
(91%), mobile services (voice, internet, messaging) (82%) and fixed TV (82%). Other services
provided by 27% of the respondents are co-location services, satellite communications,
international fiber optic cable management, streaming and media content production, internet
of things, connectivity services, crowd data analytics or fixed business connectivity services.
Table 26: Which electronic communications services do you mainly offer?
Source: online survey with ECN providers and equipment manufacturers, multiple answers
possible
Table 27: Most companies (70%) report on their environmental protection efforts and their
environmental impact in annual reports. Almost half (45%) integrate this information into their
company-wide reports as a sub-section. They also use their website (40%) and other
communication channels which are presentations to business partners, research articles,
press releases and internal reporting.

124
Table 27: How does your company report on its environmental policies and impacts?
Source: online survey with ECN providers and equipment manufacturers, multiple answers
possible
The surveyed companies have described what objective they are pursuing through this
reporting and why these reporting formats have been chosen. The following statements were
made particularly often, with the most frequent statements mentioned first:
• The visibility as a sustainable company is supposed to be increased;
• This also includes the transparency of environmentally related corporate activities;
• The target group of this information is the stakeholders and in particular financial
investors;
• This should also help to reassure the company's own staff and the public of the
company's environmental friendliness;
• Reporting partially fulfils legal (e.g. UK Companies Act 2006) or compliance
requirements (e.g. Socially responsible investing – SRI, reporting obligations);
• In summary, and thus also representative of the other statements, one company
describes its motivation as follows: “We believe our reporting is essential for attracting
Environmental, Social and Governance (ESG) investments and building relationships
with our customers.”
Table 28: The environmental reports mainly cover three areas of direct and indirect
environmental effects. Direct environmental impacts (80%), environmental impacts from
upstream value chains (e.g. energy, equipment, etc.) (75%), environmental impacts from
downstream value chains (e.g. energy consumption or electronic waste of customers) (70%).
As others (15%) emissions from transport, production and other parts of the value chain were
mentioned.

125
Table 28: Which areas of the company's activities are included in this reporting?
Source: online survey with ECN providers and equipment manufacturers, multiple answers
possible
Table 29: When asked about the specific environmental impacts that are recorded for reporting
purposes, all companies (100%) indicated three impact categories: energy consumption, CO2
equivalent and water consumption. Also very frequently mentioned are e-waste management
and use of renewable energies (92%). Material consumption (73%) and energy intensity of
communication networks (71%) are also widely reported. The use of renewable raw materials
more seldom (27%). Other impact categories (31%) are e.g. avoided emissions through
connectivity and digital services, land usage, participation at environmental initiatives.
Table 29: Which indicators do you use for environmental reporting?
Source: online survey with ECN providers and equipment manufacturers, multiple answers
possible
Table 30: As standards to record these environmental indicators, companies mainly name the
Global Reporting Initiative (GRI) (82%) and the Greenhouse Gas Protocol (GHGP) (76%).
Both environmental management standards ISO 14 001 (53%) and ISO 50 001(47%) are
used by approximately half of the surveyed companies. Other used standardisation
frameworks are the following that were named additionally:
• International Telecommunication Union (ITU),
• European Telecommunications Standards Institute (ETSI),
• Intergovernmental Panel on Climate Change metrics (ICCP),
• LCA,
• the Eco ICT Council Guidelines Japan,
• International Standard on Assurance Engagements (ISAE),
Count % of responses %
Energy consumption 16 100% 100%
CO2 equivalent 16 100% 100%
Water consumption 16 100% 100%
E-Waste Management 15 92% 92%
Use of renewable energies (e.g. electr., fuel) 15 92% 92%
Material consumption 12 73% 73%
Energy intensity of communication networks 11 71% 71%
Use of renewable raw materials 4 27% 27%
N 16
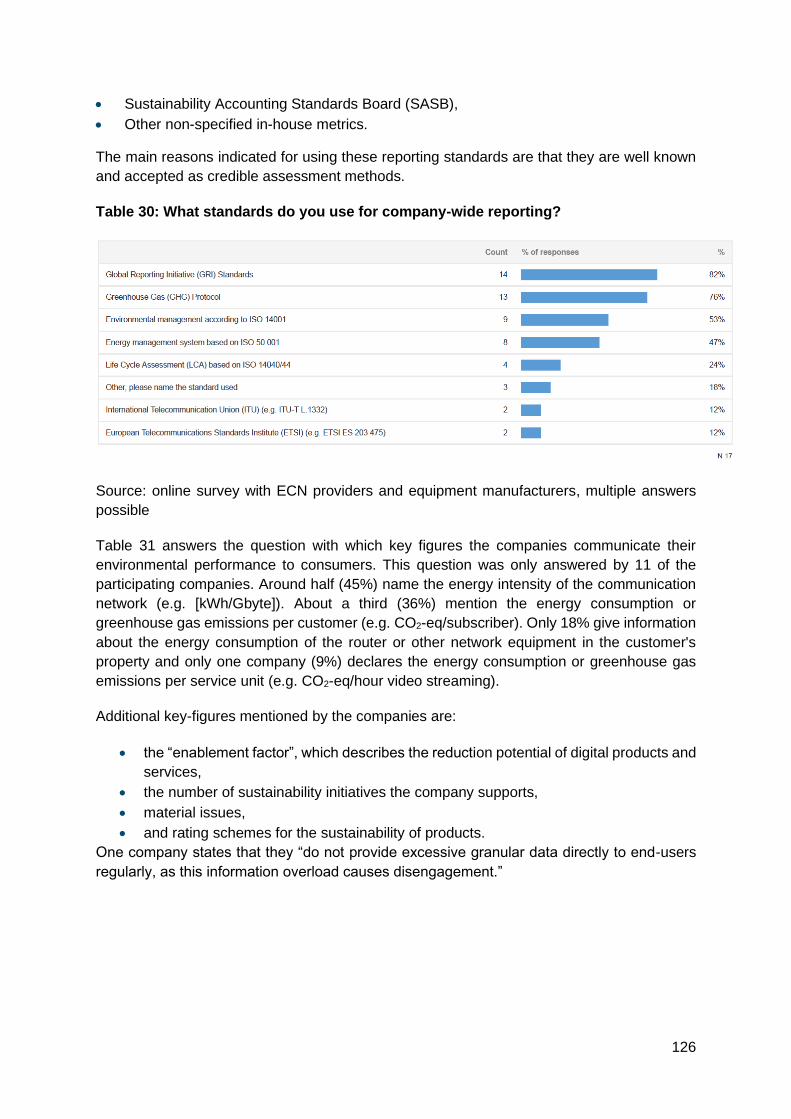
126
• Sustainability Accounting Standards Board (SASB),
• Other non-specified in-house metrics.
The main reasons indicated for using these reporting standards are that they are well known
and accepted as credible assessment methods.
Table 30: What standards do you use for company-wide reporting?
Source: online survey with ECN providers and equipment manufacturers, multiple answers
possible
Table 31 answers the question with which key figures the companies communicate their
environmental performance to consumers. This question was only answered by 11 of the
participating companies. Around half (45%) name the energy intensity of the communication
network (e.g. [kWh/Gbyte]). About a third (36%) mention the energy consumption or
greenhouse gas emissions per customer (e.g. CO2-eq/subscriber). Only 18% give information
about the energy consumption of the router or other network equipment in the customer's
property and only one company (9%) declares the energy consumption or greenhouse gas
emissions per service unit (e.g. CO2-eq/hour video streaming).
Additional key-figures mentioned by the companies are:
• the “enablement factor”, which describes the reduction potential of digital products and
services,
• the number of sustainability initiatives the company supports,
• material issues,
• and rating schemes for the sustainability of products.
One company states that they “do not provide excessive granular data directly to end-users
regularly, as this information overload causes disengagement.”

127
Table 31: What key-figures does your company communicate to consumers (e.g.
advertising, product data sheets) when reporting the environmental performance of
communications services?
Source: online survey with ECN providers and equipment manufacturers, multiple answers
possible
Survey respondents were asked how end-users could be encouraged to choose and use
climate-friendly and resource-saving electronic communications services. The answers
vary from “almost impossible” to ”better and more information” and approaches to make
sustainable communication services “more trendy”. The most important statements of the
companies on how end users could be motivated to environmentally friendly purchasing
behaviour are:
• transparent information on energy consumption of purchased products and services;
• usage of credible eco-labels marking the most eco-friendly products;
• introduction of energy labels (e.g. showing the energy consumption per data transfer);
• introduction of a colour-coded labelling scheme (e.g. traffic light);
• possibility to compare environmental performances of different products on the market
by eco-rating databases;
• awareness campaigns on the environmental impacts of ICT;
• increased focus on sustainability when advertising products to end-users;
• promoting the advantages of certain technologies (namely fibre optic cable);
• encourage the use of digital technologies instead of the physical alternatives (e.g.
telepresence instead of driving to the office).
Task 1.2.1a: Options for communicating the environmental benefits of products to
consumers
Aim of this task
This section gives an overview of how environmental characteristics and environmental
benefits are communicated to consumers in practice. In doing so, the narrow perspective on
telecommunication networks is left behind and the instruments used for other products and
services are presented.
The following instruments are considered:

128
• Environmental labelling (Type I, II and III)
• Conformance marking
• Energy labelling
• EU Ecodesign
• Energy performance certificates for buildings
• Car label
• Electricity labelling
• Topten Product database / online search tool for consumers
• Eco-Rating for mobile handsets
• Product Environmental Footprint (PEF)
• Product Carbon Footprint (PCF)
Environmental labelling (Type I, II and III)
The ISO 14020 to 14025 standards set out the framework for the Type I, II and III
environmental labels ISO (2021). Type I and III ecolabels are labels awarded by third parties
with regard to specific criteria determined over the entire life cycle. While Type I ecolabels are
intended to state that products are qualitatively better with regard to the environmental
properties considered, Type III ecolabels make quantitative statements based on
environmental declarations (life cycle data declarations). Examples for Type I environmental
labels are the European Ecolabel and national ecolabels like the German Blue Angel.
Examples for Type III environmental labels are Environmental Product Declarations (EPDs).
Type II labels represent claims that manufacturers make themselves for their products.
Examples for Type II environmental labels are the Universal Recycling Symbol and statements
like "designed to be dismantled", "reduced energy consumption".
Consumer research (e.g. BfR (2010)) states that Type I labels are among the most successful
labels, especially when it comes to certain national eco-labels, like the German Blue Angel or
the Nordic Swan. They have a relatively high awareness and consideration in purchasing
decisions amongst consumers. In contrast, the European Ecolabel – depending on the country
(e.g. in France it is relatively well known whereas in Spain not) – is less known by consumers.
Target group of Type III labels are professionals and not consumers (B2B). The information
delivered e.g. by EPDs is too complex as to give orientation to consumers and to be included
in consumer purchase decisions.
Conformance marking
Conformance marking is used to indicate the conformity of a product, process or system with
re-spect to the fulfilment of specified requirements of a standard, specification or certification
scheme. The best-known conformance marking in Europe is the CE125 mark which is intended
to indicate the conformity of a product with the relevant EU directives. The legal basis for the
CE marking is the Directive 93/68/EEC.
125 CE is the abbreviation for European Communities (French "Communautés Européennes")
129
According to consumer research (see e.g. BfR 2010) the CE mark has a relatively high level
of awareness among consumers in European countries. For Germany also other conformance
markings like the GS mark, the VDE mark and the GEEA Energy label are relatively well known
and considered in purchase decisions of consumers.
Energy labelling
The Regulation (EU) 2017/1369, Article 1 lays down a framework that applies to energy-
related products placed on the market or put into service (European Commission 2017). It
provides for the labelling of those products and the provision of standard product information
regarding energy efficiency, the consumption of energy and of other resources by products
during use and supplementary information concerning products, thereby enabling customers
to choose more efficient products in order to reduce their energy consumption. The
energy labelling requirements for individual product groups are then determined in a process
coordinated by the European Commission. Until now, 15 product groups require an energy
label (European Commission 2021a). The energy consumption and energy efficiency
class must be declared for these products on the energy label. The classification into an
energy efficiency class is based on the energy consumption or the energy efficiency of a
product.
According to BfR (2010) various studies have shown that the EU energy label has a high level
of awareness among consumers (approx. 70-89%) and is included by a large proportion of
consumers in their purchasing decisions (Germany: 64%). Consumer research done by
London Economics (2014) focused on the evidence base on the most effective labelling design
for possible future EU energy labels. Among other things they found some evidence that label
frames which use alphabetic scales lead to more consumers choosing energy efficient
products compared numeric scales - with an A to G scale leading to more consumers choosing
energy efficient products compared to the A+++ to D scales. Furthermore, the choice of label
design is of greater importance in influencing behaviour for products where energy efficiency
is not of key importance to consumers when selecting the product.
EU Ecodesign
With the Directive 2009/125/EC, the European Commission has created a framework for
certain energy-related products to be placed on the EU market only if they meet minimum
requirements for environmentally sound design ("ecodesign"). Minimum criteria for
environmental compatibility are defined in detail for each product group by implementing
certain measures. Additionally, the directive states in article 14 Consumer information: “In
accordance with the applicable implementing measure, manufacturers shall ensure, in the
form they deem appropriate, that consumers of products are provided with: (a) the
requisite information on the role that they can play in the sustainable use of the product; and
(b) when required by the implementing measures, the ecological profile of the product and
the benefits of ecodesign.” Until now EU ecodesign legislation applies to 31 product groups
European Commission (2021a). National market surveillance authorities verify whether
products sold in the EU follow the requirements laid out in ecodesign regulations.
Energy performance certificates for buildings
The Directive 2010/31/EU on the energy performance of buildings, article 11, paragraph 1
Energy performance certificates for buildings lays down the following: “Member States shall
130
lay down the necessary measures to establish a system of certification of the energy
performance of buildings. The energy performance certificate shall include the energy
performance of a building and reference values such as minimum energy performance
requirements in order to make it possible for owners or tenants of the building or building
unit to compare and assess its energy performance.”
The aim of the energy performance certificate is to provide consumers with a uniform, cost-
effective and easy-to-understand instrument that provides information on the energy
characteristics of a building. In Germany the German Building Energy Act
[GebäudeEnergieGesetz] implements the EU directive. It allows two types of energy
certificates: Type 1 is based on an expert calculation of the theoretical energy demand of a
building required for heating, ventilation, air-conditioning and hot water preparation during
average use. Type 2 is based on the recorded energy consumption of a building for example
referring to the heating bills. Weather influences are factored out and water heating is taken
into account. For both types, the final energy consumption for heating and hot water production
has to be determined and expressed in kilowatt hours per year and per square meter of useful
building area. For residential buildings the energy efficiency class must also be stated on
energy performance certificates. The energy efficiency classes range from energy efficiency
class A+ (best class) to class H (worst class). Additionally the CO2-emissions must be stated
from May 2021 onwards.
Consumer research in Germany has shown that both parameters – energy rating (energy
consumption per square metre) and the colour-coded energy efficiency class (A+ to H) – are
given high relevance when choosing a property (Steininger et al 2017). But the two different
types of issuance (demand and consumption certificates) and their implications are often
intransparent for the consumer and make comparability difficult.
Car label
The Directive 1999/94/EC relating to the availability of consumer information on fuel economy
and CO2 emissions in respect to the marketing of new passenger cars aims “to ensure that
information relating to the fuel economy and CO2 emissions of new passenger cars
offered for sale or lease in the Community is made available to consumers in order to enable
consumers to make an informed choice.” The directive is diversely implemented and
operationalised throughout the EU Member States. In Germany the Passenger Car Energy
Consumption Labelling Ordinance [Pkw-Energieverbrauchskennzeichnungsverordnung]
informs consumers about the CO2 efficiency of the vehicle with the passenger car label. In
addition to the absolute consumption values, the coloured CO2 efficiency scale provides
information on how efficient the vehicle is compared to other models. The CO2 efficiency is
determined on the basis of the CO2 emissions, taking into account the vehicle mass. The
efficiency scale ranges from 'A+' (very efficient) to 'G' (least efficient). The car label also
provides information on electricity consumption in order to take into account current
developments in the field of electromobility.
Consumer research (Grünig et al 2010) stated that the purchase decision for a new car
typically is done in two steps by consumers: in step one the type of car is chosen (e.g. small
car, van) and in step two the details are considered. It seems that consumers have a low
understanding of fuel economy and the real costs of cars and that consumers make little effort
to include fuel consumption in purchasing decisions or assume that increased fuel

131
consumption is only obtained when sacrificing other qualities. Against this background, Grünig
et al (2010) recommend that a car label should contain information on fuel consumption and
CO2 emissions in a way that consumers can easily include it in both steps one and two and
thus include aspects related to fuel consumption in their purchasing decision.
Electricity labelling
The Directive 2009/72/EC concerning common rules for the internal market in electricity,
article 3, paragraph 9, points a and b lays out the following: “Member States shall ensure that
electricity suppliers specify in or with the bills and in promotional materials made available to
final customers: (a) the contribution of each energy source to the overall fuel mix of the
supplier over the preceding year in a comprehensible and, at a national level, clearly
comparable manner; (b) at least the refer-ence to existing reference sources, such as web
pages, where information on the environmental impact, in terms of at least CO2 emissions
and the radioactive waste resulting from the electricity produced by the overall fuel mix.” The
implementation of the directive is country-specific and thus considers country-specific
peculiarities. In Germany e.g. the Energy Industry Act [Energiewirtschaftsgesetz] which
implements the EU Directive refers to the German Renewable Energies Act [Erneuerbare
Energien Gesetz] and requires to distinguish between subsidised and non-subsidised
renewable energy sources. In Germany electricity suppliers are obliged to label the individual
electricity tariffs and the total electricity mix of a provider as well as the national electricity mix
on the provider's website and other advertising material as well as on the electricity bill.
Consumers have access to the information on CO2 emissions and radioactive waste
generated of a specific electricity tariff as a basis for decision-making before choosing a tariff
and supplier. In addition, the electricity bill regularly informs them about the specific electricity
composition and impact of their electricity tariff.
Consumer research on the electricity labelling in Germany showed little effect until now (UBA
2019): The lack of awareness of electricity labelling on the consumer side has so far been the
big-gest obstacle to influencing decision-making behaviour. In order to have an effect, the
information must additionally be the same for all electricity suppliers and presented in a way
that is as easy to understand as possible.
Topten product database / online search tool for consumers
Topten is a consumer-oriented online search tool, which presents the best models in
various product categories such as white goods, cars, computer, computer monitors, TV sets
etc. Topten’s key selection criteria are energy efficiency and energy consumption. The aim is
to deliver tailored product information to consumers and allow for an informed
consumer choice. Topten sees itself as a market transformation tool. Topten websites are
present in 15 European countries, in 4 countries in Latin America and in China. The European
websites are partially financed by different EU-projects (see e.g. Topten Act (2018)).
According to Topten Act (2018) a major barrier to broad dissemination of more energy efficient
and environment-friendly equipment, products and services is that consumers do not have
quick and easy access in their language to ready-made qualified, independent and up-to-date
product information. The purpose of Topten is to provide consumers and energy professionals
with credible, up-to-date information on the most efficient products available on their local
132
markets. The selection is much narrower than typical labelling systems, making it easier for
consumers to choose from among the thousands of products available.
Eco-Rating for mobile handsets
A review of current eco-rating schemes of mobile handsets done by ITU (2012) identified two
different approaches: in the first approach a score is assigned to each device and consumers
are able to compare different devices on the bases of their scores. In the second approach all
certified devices meet a minimum level of performance but no further differentiation between
certified devices is provided to consumers. What unites all approaches is the overarching life
cycle view and the consideration of environmental aspects. ITU (2012) recommends that any
eco-rating scheme should have an audit or verification process to ensure that the final outputs
are trusted by the consumer.
In May 2021, five major European telecom operators have launched a new eco rating labelling
scheme (www.ecoratingdevices.com). The companies Deutsche Telekom, Orange,
Telefónica, Telia Company and Vodafone want to enable their customers to compare the
environmental characteristics of different mobile phones and thus select the most
environmentally friendly devices. The mobile phones are evaluated on the basis of 19 different
indicators grouped in five categories:Durability, Resource efficiency, Repairability, Climate
efficiency and Recyclability. The best rated appliances can achieve a maximum total score of
100 points. The aim of the joint branch initiative is to ensure that mobile phones are evaluated
according to uniform standards, thus creating comparability.
Product Environmental Footprint (PEF)
The Product Environmental Footprint (PEF) method measures the life cycle environmental
performance of products and considers the relevant environmental impacts of all steps
needed. In general 15 different environmental impact categories are considered (climate
change; ozone depletion; human toxicity, cancer; human toxicity, non-cancer; Particulate
matter; Ionising radiation, human health; photochemical ozone formation, human health;
acidification; eutrophication, terrestrial; eutrophication, freshwater; eutrophication, marine;
ecotoxicity, freshwater; land use; resource use, minerals and metals; resource use, fossils)
and the most relevant are chosen (European Commission 2018b). In order to be able to
compare the environmental performance of one product to another it is necessary to follow
exactly the same rules. Therefore, the availability of specific PEF category rules for the
respective product group is necessary that complement the general guidance. Product
category rules were developed during the pilot phase for a limited number of product groups
European Commission (2019b).
Consumer research was done on possible ways of communicating the PEF results of products
to consumers (European Commission 2018a). The study identified a series of lessons learned
on conditions for the effectiveness of communicating environmental footprint information to
consumers: it is essential that information is clear, readable und transparent. Consumers
understand impact categories like CO2 emissions and energy consumption but they have
difficulties to understand more complex impact categories like e.g. ecotoxicity. Consumers
prefer the use of graphics, bars and colour scales to numbers and scientific terms. Moreover,
consumers supported strongly the traffic light (better, average and worse represented with
colours) and to the energy label format (A-E performance scale). In line with this it is
133
recommended to avoid information overload. For consumers, certification proves an important
element to increase trustworthiness of information. Certification must be third party or come
from a consumer association.
The aim of the Product Environmental Footprint (PEF) is to set the basis for better
reproducibility and comparability of product related environmental assessments (European
Commission 2018b). One of the main reasons why comparability is important is that “it
enables consumers to take better informed purchasing decisions by comparing the
performance of products in the same product category”.126 Hence, communication and
disclosure of environmental impacts to the public is the purpose of PEF. However, there is still
no clear communication format after 24 product groups have been investigated during 2013-
2016 in the Environmental Footprint pilot phase.
Product Environmental Footprint Category Rules (PEFCR) could be used to substantiate the
claimed envionmental performance/efficiency of electronic communications services.
However, the following aspects should be kept in mind:
• Applying existing Product Environmental Footprint Category Rules (PEFCR) is a very
time-consuming process, i.e. the investigation begins with a complex life cycle
assessment study, preparation of a PEFCR draft, calculation of environmental footprint
by supporting studies, communication phase, and revision and finalisation of PEFCR.
• Existence of Product Environmental Footprint Category Rules (PEFCR) is one of the
preconditions to use PEF-results for the purpose of communicating the environmental
benefits of products to consumers. Until now, there is no PEFCR for any electronic
communications services. One other limitation of the PEF process is that there are no
criteria to determine which product’s PEFCR should be developed first. If it is intended
to use the PEF as a communication tool for telecommunication services, Product
Environmental Footprint Category Rules (PEFCR) would first have to be developed.
• Whether and to which extend PEF-results could be suitable for communicating the
environmental benefits of products to consumers would be investigated in the course
of supporting studies. The results of supporting studies are the basis for the
communication phase and for the testing of verification approaches.127 Based on the
experiences with the supporting studies and communication phase, the final PEFCR
is produced. Although a PEFCR takes into account 15 impact categories to be used to
calculate the PEF profile, it is possible to communicate e.g. 3-4 impact categories
depending on which are most relevant. Different sectors or products to be investigated
have different hot spots concerning the environmental performance.
• To carry out PEFs, a lot of LCA data is required, especially on the manufacturing
process of electronic components. This data is usually not even available to the device
manufacturers, as the telecommunication products are made up of a large number of
individual components from different suppliers. Therefore, an open database with LCA
126 https://ec.europa.eu/environment/eussd/smgp/pdf/q_a.pdf, page 4
127 https://ec.europa.eu/environment/eussd/smgp/ef_pilots.htm
134
data of electronic components and equipment would be a prerequisite for PEFs to be
elaborated in a uniform and efficient way. Such kind of database is not publicly
available at the time of this study.
It can be summarised for the Product Environmental Footprint that this instrument can be very
time-consuming and costly to apply. For ECN services, this is further complicated by the fact
that they use a large number of physical products (the network) in a distributed manner and
there are no suitable allocation rules for this at the moment of writing this study.
Product Carbon Footprint (PCF)
The Product Carbon Footprint (PCF) is a method for determining the climate impact of a
product. It considers the whole life cycle of a product and the therewith connected greenhouse
gas emissions. In the last years, various guidelines have been developed for determining the
carbon footprint of products. The best known standards for calculating a carbon footprint are
the British PAS 2050, the GHG Protocol and the ISO 14067 standard.
Consumer research of Carbon Trust (2020) in seven European countries and the US showed
that about two thirds of respondents think that it is a good idea to feature carbon labels on
products. On the other hand, 50% of consumers reply that the carbon footprint of a product is
not something that they think of when selecting a product to buy. But almost two-thirds of
consumers say they would feel more positive towards companies that have reduced the
carbon impacts of their products.
Hottenroth et al (2013) stress that from the consumer's point of view, climate-related product
infor-mation should be comparable, clear, easily accessible, instructive and available in the
environment of use.
General Conclusions concerning a promising consumer communication:
• The consumer information / the label has to be simple and understandable, this is also
reflected in the design (e.g. colour code, letters / numbers).
• The consumer information / label has to be easily visible and easy to find for consumers
in connection with product offers (e.g. in the shop, on the website).
• The label, the way the consumer information has to be presented, has to have a high
level of recognition and credibility among consumers. A high proportion of consumers
should be familiar with the label.
• The classification of the consumer information / label should be relative to a reference,
for example the average consumption of a household or a comparable product/service.
This will allow consumers to assess whether in their specific case, the value for
electricity consumption is relatively high or low or a product has a relatively low or high
energy efficiency.
• An alternative is to award a Type I eco-label (e.g. European Eco-label, German Blue
Angel), which is only awarded to products that meet specific minimum criteria.
Consumers can thus be sure that eco-labelled products meet high standards of
environmental performance without having to deal with further details.

135
• Ideally, the integration of the consumer information / label into the consumer decision
is as easy as possible, i.e. the statement fits well with the way consumers make their
decision for the specific product.
Against the background of these requirements, the energy label, an eco-label or a Topten
product database are the most suitable for communicating the environmental aspects of
telecommunication services. Due to its complexity, the Product Environmental Footprint
(PEF), on the other hand, does not seem to be very suitable for communicating the
environmental characteristics to consumers in an easily understandable way. The first three
information tools mentioned were therefore considered as possible policy options for
transparency measures.
Task 1.2.2: Current practices on the assessment of the environmental sustainability of
new electronic communications networks
Aim of this task
The key objective of this task is to provide comprehensive information on current practices of
public authorities and independent bodies for the monitoring and assessment of the
environmental sustainability of new electronic communications networks. The scope of this
task is limited to the new electronic communications networks as long as these networks are
in a planning stage and are not yet in operation or in the process of being upgraded.
Approach
In order to obtain this overview, official documents of the EU Commission, regulatory
authorities and standardisation organisations are examined to see whether requirements are
set for the sustainability of new electronic communication networks. The analysis is structured
into the areas encouragements and declarations, legal requirements, and voluntary
instruments. In addition, telephone interviews were conducted with providers of electronic
communication networks and equipment manufacturers.
Encouragements and declarations
The Digital Agenda of the European Commission from 2010 (European Commission 2010)
already has the environmental impacts of ICT in mind and states as a “key action” that the ICT
sector must present by the year of 2011 appropriate methods to measure energy efficiency
and greenhouse gas emissions and propose appropriate legal measures.
“2.7.1. ICT for environment: … The ICT sector should lead the way by reporting its own
environmental performance by adopting a common measurement framework as a
basis for setting targets to reduce energy use and greenhouse gas emissions of all
processes involved in production, distribution, use and disposal of ICT products and
delivery of ICT services.”
“The Commission will:
• Key Action 12: Assess by 2011 whether the ICT sector has complied with the timeline
to adopt common measurement methodologies for the sector's own energy
performance and greenhouse gas emissions and propose legal measures if
appropriate;”

136
As a reaction to the Digital Agenda, various initiatives have been launched by the EU
Commission to implement the measuring of the environmental impacts of ICT in practice. One
of these is the study on the “ICT footprint” which was carried out together with 27 ICT
companies (varying from telecommunication operators, software & services providers to
equipment and components manufacturers) to test different methodologies in pilot projects
(European Commission 2013). The different methods whose applicability has been verified in
practice by the project are listed in Table 32.
Table 32: Methods for measuring the ICT footprint of organisations, products and
services
Methodology Description
ITU-T L.1410 Methodology for environmental impacts assessment of
ICT goods, networks and services
ITU-T L.1420 Methodology for environmental impacts assessment of
ICT in organisations
ETSI TS 103 199 Life Cycle Assessment (LCA) of ICT equipment, networks
and services: General methodology and common
requirements
GHG Protocol Product
Standard – ICT-sector
Guidance
Product Life Cycle Accounting and Reporting Standard -
ICTsector Guidance
GHG Protocol Corporate
(Value Chain) Standard
Corporate Accounting and Reporting Standard - including
the Corporate Value Chain (Scope 3) Standard (not ICT
specific)
IEC/TR 62725 Analysis of quantification methodologies for greenhouse
gas emissions for electrical and electronic products and
systems
Source: European Commission 2013
The pilot study on ICT footpints (European Commission 2013) concluded that existing
methods are well suited to measure the energy consumption and CO2 emissions of ICT.
However, there are still several methodological challenges to ensure that the results are
consistently recorded and are comparable between different applications.
Another study commissioned by the EU Commission “Study on the practical application of the
new framework methodology for measuring the environmental impact of ICT” (Prakash et al.
2014) concluded that the existing accounting methods are sufficient, but that there is a
significant implementation deficit. The study described the status quo as follows:
• Lack of environmental policy measures on data centres and telecommunication
networks,
• Lack of publicly available data on data centres and telecommunication networks,
• No need to develop more detailed and restrictive methodologies for the ICT sector.

137
The Commission's Recommendation (EU) 2020/1307 on a common Union toolbox for
reducing the cost of deploying very high capacity networks (European Commission 2020a)
resumed the original intention of the Digital Agenda and recommends promoting the roll-out
of new networks in a way that reduces their greenhouse gas footprint:
“The environmental footprint of the electronic communications sector is increasing, and
it is essential to consider all possible means of counteracting this trend. Incentives to
deploy networks with, for example, a reduced carbon footprint can contribute to the
sustainability of the sector and to climate change mitigation and adaptation. Member
States are called upon, in close cooperation with the Commission, to identify and
promote such incentives, which might include fast-track permit granting procedures or
reduced permit and access fees for networks which meet certain environmental
criteria.”
In 2020, the European Commission has relaunched its digitisation strategy (European
Commission 2020b). Under the title "Shaping Europe's digital future", digitital transformation
should be put at the service of people (“technology that works for the people”), further
strengthen the European economy (“a fair and competitive digital economy”) and enhance
European climate protection goals as well as data protection (“an open, democratic and
sustainable society”). In the strategy, the European Commission states:
“Data centres and telecommunications will need to become more energy efficient,
reuse waste energy, and use more renewable energy sources. They can and should
become climate neutral by 2030.”
Several key actions are presented that should be implemented to achieve these goals. They
include launching initiatives to ensure that by climate-neutral, highly energy-efficient and
sustainable data centres are established by 2030 at the latest. In addition, transparency
measures are to be introduced for telecommunication operators that provide information about
their environmental footprint.
A stakeholder survey conducted by the Body of European Regulators for Electronic
Communications (BEREC) among telecommunications service providers showed that there is
a great willingness to improve the sustainability of electronic networks and reduce greenhouse
gas emissions (BEREC 2020).
Legal requirements
In order to build new networks, telecommunication network operators must comply with a
number of legal requirements. This concerns in particular the construction of new buildings
(e.g. switching exchanges or antenna masts), the installation of antennas and radio
equipment, as well as work to install cables through the terrain or along roads or general
electrical installations. These legal requirements will not be examined in detail here. Rather,
the aim is to show whether requirements are placed here on the energy efficiency or resource
conservation of the network infrastructure.

138
European Electronic Communications Code 2018/1972/EU (EECC)
The European Electronic Communications Code (EECC)128 establishes a harmonised
framework for the regulation of electronic communications networks, electronic
communications services, associated facilities and associated services, and certain aspects
of terminal equipment. It lays down tasks of national regulatory authorities and, where
applicable, of other competent authorities, and establishes a set of procedures to ensure the
harmonised application of the regulatory framework throughout the Union.
Radio Equipment Directive 2014/53/EU (RED Directive)
The Radio Equipment Directive (RED)129 specifies the regulatory requirements for radio
equipment. It sets out basic requirements for health and safety, electromagnetic compatibility
and the use of the radio spectrum. Several other regulations build on the RED, regulating
additional technical and data protection-related aspects. The RED does not include
requirements for energy efficiency or the use of materials in radio equipment.
Electromagnetic Compatibility Directive 2014/30/EU (EMC Directive)
The Electromagnetic Compatibility Directive (EMC Directive)130 ensures that electrical and
electronic equipment does not cause electromagnetic interference and is not itself disturbed
by such interference. For this purpose, requirements are set for maximum electromagnetic
emissions from equipment so that radio and telecommunications systems can be operated
without disturbance. In order for equipment to be sold and put into operation in Europe, it must
meet these requirements. The directive has only an indirect effect on the energy consumption
of radio equipment, since the risk of electromagnetic interference increases with increasing
transmission power.
Strategic Environmental Assessment Directive 2001/42/EC (SEA Directive)
The Strategic Environmental Assessment Directive (SEA Directive)131 must be applied to a
wide range of public plans and programmes (e.g. on land use, transport, energy, waste,
agriculture, etc.). The Protocol on Strategic Environmental Assessment ensures that potential
environmental impacts are identified and avoided at an early stage in the implementation of a
construction project.
Member states must carry out a screening process to determine whether plans are likely to
have significant environmental effects. If there are significant effects, a Strategic
Environmental Assessment is required. The screening procedure is based on criteria set out
in the Directive.If, for example, the expansion of digital infrastructures is promoted by the
member states, the requirements of the SEA Directive must also be taken into account.
128 https://eur-lex.europa.eu/eli/dir/2018/1972/2018-12-17
129 https://ec.europa.eu/growth/sectors/electrical-engineering/red-directive_en
130 https://ec.europa.eu/growth/sectors/electrical-engineering/emc-directive_en
131 https://ec.europa.eu/environment/eia/sea-legalcontext.htm
139
Environmental Impact Assessment Directive 2011/92/EU (EIA Directive)
The Environmental Impact Assessment Directive (EIA Directive)132 applies to a wide range of
public and private projects as set out in the Annexes to the Directive. For example, long-
distance railway lines, motorways, aircraft runways, waste disposal plants, sewage treatment
plants above a certain size are each considered to have a significant environmental impact.
These installations must carry out an environmental impact assessment at the planning stage.
Whether telecommunication networks also fall under this directive could not be examined
within the framework of this project, as no legal expertise was involved here. In principle,
however, it is conceivable that such projects could also be subject to an environmental impact
assessment.
Broadband Cost Reduction Directive 2014/61/EU
The Directive on measures to reduce the cost of deploying high-speed electronic
communications networks (Broadband Cost Reduction Directive)133 (European Commission
2014) aims to help speed up the roll-out of electronic communications networks and reduce
their costs. This is to be achieved, among other things, through the sharing and reuse of
existing infrastructures. The measures of the directive focus on four main areas: access to
existing physical infrastructure, efficient coordination of civil works, simplified permits,
requirements for buildings to facilitate access for high-speed networks.
The directive does not contain any requirements for the energy efficiency of networks or for
resource protection.
Voluntary Instruments
EU Code of Conduct on Energy Consumption of Broadband Equipment (CoC)
The EU Code of Conduct on Energy Consumption of Broadband Equipment (CoC)134 (Bertoldi
and Lejeune 2020) is one of the tools described in Task 1.2.3 Standards and measurement
methodologies for the monitoring of environmental footprint of electronic communications
networks and services. The EU Code of Conduct is a voluntary system of minimum
requirements for broadband equipment developed by the EU's own research institute Joint
Research Centre (JRC) in cooperation with network component manufacturers and network
operators. The agreement sets minimum requirements for network components, both on the
customer premises equipment (CPE) side and on the network side.
The EU Code of Conduct is widely used by network operators and is a recognised
benchmarking data base. As the technical development in this area is very fast, the Code may
have the disadvantage that it does not include certain technologies (e.g. currently not 5G) or
sets requirements for them that are already technically outdated. However, as it is a voluntary
132 https://ec.europa.eu/environment/eia/eia-legalcontext.htm
133 https://ec.europa.eu/digital-single-market/en/cost-reduction-measures
134 https://e3p.jrc.ec.europa.eu/publications/eu-code-conduct-energy-consumption-broadband-equipment-version-71

140
instrument negotiated through stakeholder dialogue, it can be adapted and updated
comparatively quickly.
ITU Telecom Network Planning for evolving Network Architectures Reference Manual
In 2007 and 2008, the International Telecommunication Union (ITU) undertook the effort to
develop a good practice guide for telecommunications network planning called “ITU Telecom
Network Planning for evolving Network Architectures Reference Manual”135 (ITU 2008). The
reference manual is addressed to telecommunications network operators, policy makers and
regulators. And is intended to facilitate the strategic planning of network expansion. Even
though the handbook is now more than 13 years old, it still presents basic methods that can
be considered in network planning. As technical development has progressed in the meantime
and new requirements, such as energy and resource consumption have become more
prominent, the handbook would need to be thoroughly updated once again to help increase
efficiency in networks.
Procurement guidelines of electronic communication providers
In the discussions with the telecommunications companies about their purchasing practices,
they mentioned on several occasions their own company guidelines that they use in
procurement. The company Liberty Global even makes these guidelines publicly available,
which is why they can be mentioned here as an example (Liberty Global 2019: Responsible
Procurement and Supply Chain Principles)136.
In principle, such in-house minimum standards are suitable for imposing stricter environmental
or social requirements on purchased products and thus assuming producer responsibility for
the supply chain. This is particularly necessary if there are no ambitious legal minimum
requirements. For the companies offering the products themselves, the problem arises that
different customers may demand different minimum standards or accept different verification
systems. Against this background, it would be desirable to define uniform standards that can
then be used equally by all companies.
Results from telephone interviews with electronic communication network providers
and equipment manufactureres
In order to get an overview of what is being done in practice for planning new networks and
for energy-efficient operation, questionnaire-based interviews were conducted with a total of
9 network operators, manufacturers and associations (see
135 https://www.itu.int/ITU-D/tech/NGN/Manual/Version5/NPM_V05_January2008_PART1.pdf
136 https://www.libertyglobal.com/wp-content/uploads/2019/06/Responsible-Procurement-and-Supply-Chain-Principles-2019.pdf
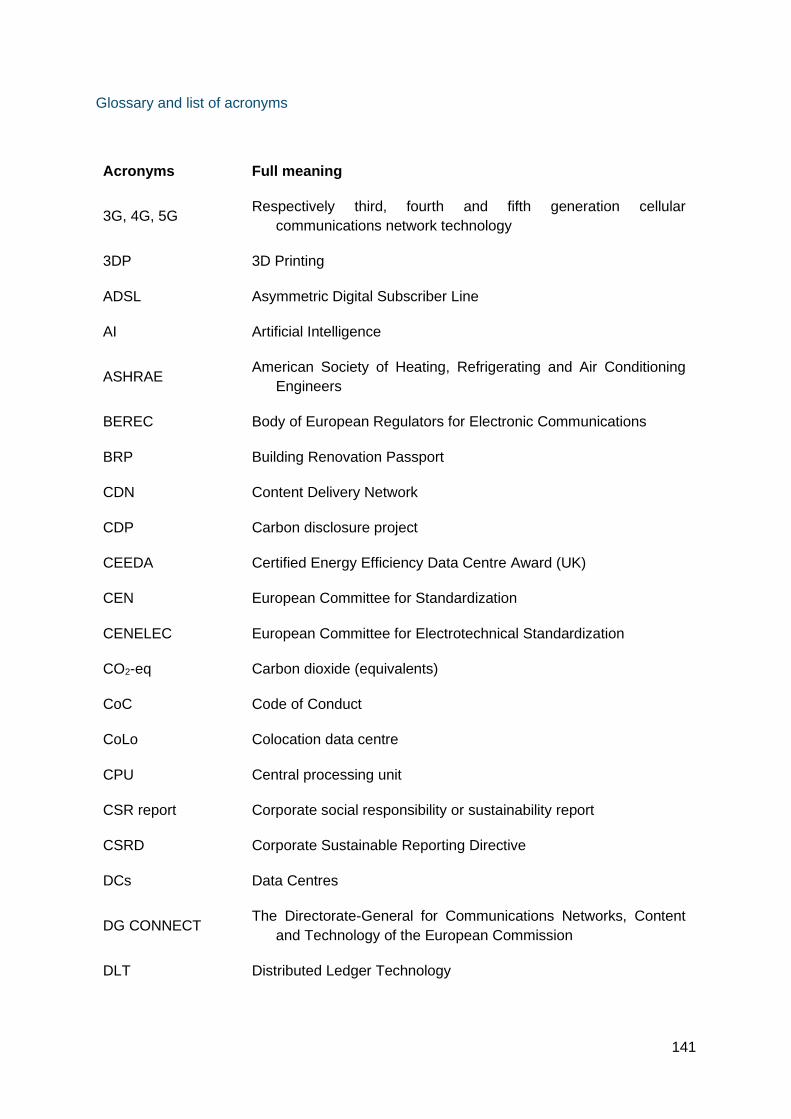
141
Glossary and list of acronyms
Acronyms Full meaning
3G, 4G, 5G Respectively third, fourth and fifth generation cellular
communications network technology
3DP 3D Printing
ADSL Asymmetric Digital Subscriber Line
AI Artificial Intelligence
ASHRAE American Society of Heating, Refrigerating and Air Conditioning
Engineers
BEREC Body of European Regulators for Electronic Communications
BRP Building Renovation Passport
CDN Content Delivery Network
CDP Carbon disclosure project
CEEDA Certified Energy Efficiency Data Centre Award (UK)
CEN European Committee for Standardization
CENELEC European Committee for Electrotechnical Standardization
CO2-eq Carbon dioxide (equivalents)
CoC Code of Conduct
CoLo Colocation data centre
CPU Central processing unit
CSR report Corporate social responsibility or sustainability report
CSRD Corporate Sustainable Reporting Directive
DCs Data Centres
DG CONNECT The Directorate-General for Communications Networks, Content
and Technology of the European Commission
DLT Distributed Ledger Technology

142
DNSH Do not significantly harm criteria
EC European Commission
ECN Electronic Communications Network
ECS Electronic Communications Service
EEA European Economic Area
EED Energy Efficiency Directive
EEE electrical and electronic equipment
EMAS Eco-Management and Audit Scheme
EMF electromagnetic field
EPBD Energy Performance of Buildings Directive
EPC Energy Performance Certificates
ESO European Standards Organisation
ETSI European Telecommunications Standards Institute (one of the
ESOs besides CEN and CENELEC)
EU European Union
FAN Fixed Asset Network
FWC Framework contract
FTTH Fiber To The Home network
GDC Green Data Centre
GHG Greenhouse gas
GRI Global Reporting initiative
Gt Giga tonnes
GWP Global warming potential
HDD Hard Disk Drive
ICCP Intergovernmental Panel on Climate Change
ICT Information and communication technologies,
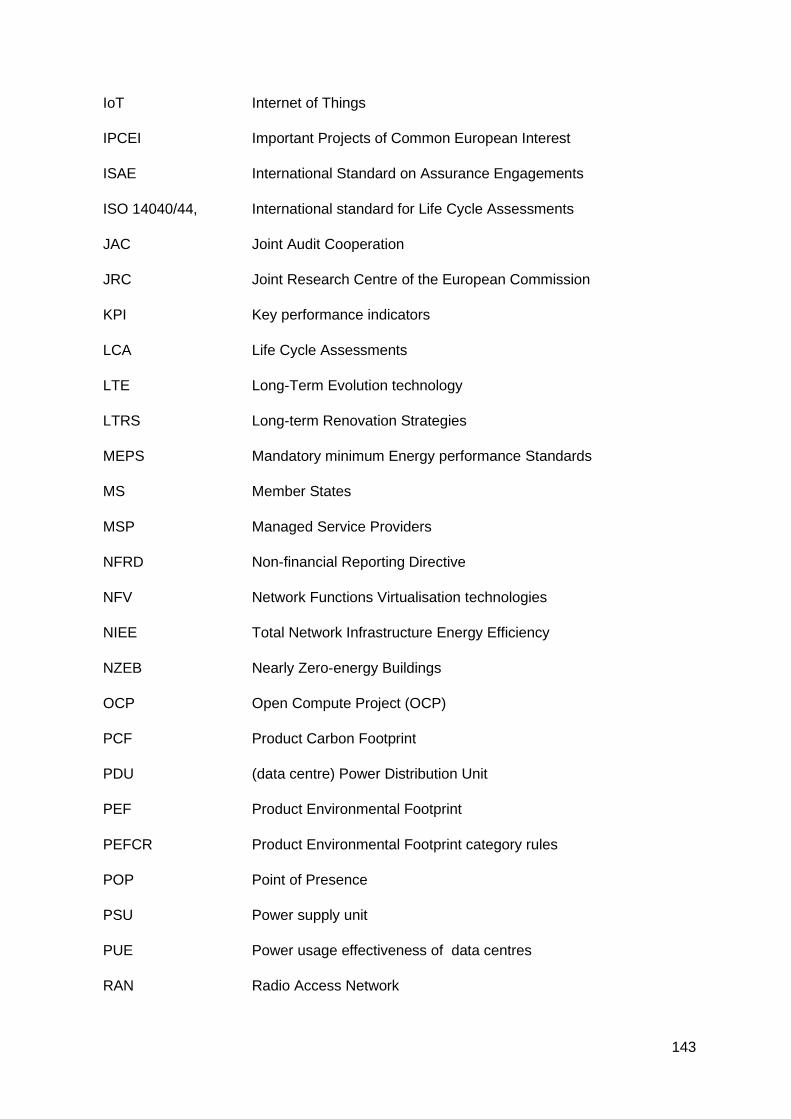
143
IoT Internet of Things
IPCEI Important Projects of Common European Interest
ISAE International Standard on Assurance Engagements
ISO 14040/44, International standard for Life Cycle Assessments
JAC Joint Audit Cooperation
JRC Joint Research Centre of the European Commission
KPI Key performance indicators
LCA Life Cycle Assessments
LTE Long-Term Evolution technology
LTRS Long-term Renovation Strategies
MEPS Mandatory minimum Energy performance Standards
MS Member States
MSP Managed Service Providers
NFRD Non-financial Reporting Directive
NFV Network Functions Virtualisation technologies
NIEE Total Network Infrastructure Energy Efficiency
NZEB Nearly Zero-energy Buildings
OCP Open Compute Project (OCP)
PCF Product Carbon Footprint
PDU (data centre) Power Distribution Unit
PEF Product Environmental Footprint
PEFCR Product Environmental Footprint category rules
POP Point of Presence
PSU Power supply unit
PUE Power usage effectiveness of data centres
RAN Radio Access Network

144
ROI Return On Investment
SASB Sustainability Accounting Standards Board
SCM Standard Cost Model
SDN Software Defined Networking
SFDR Sustainable Finance Disclosure Regulation
SFT Sustainable Finance Taxonomy
SRI Smart Readiness Indicator
TCE Total Cost to the Environment
TCO Total Cost of Ownership
TEG Technical Expert Group on Sustainable Finance
ToR Terms of references
TRL Technology Readiness Level
TSSP Thematic Smart Specialisation Platform
TWh Tera-Watthours
UMTS Universal Mobile Telecommunications System
UPS Uninterruptible Power Supply
VDSL Very high-speed Digital Subscriber Line
WAN Wide Area Network
WEEE Waste Electrical and Electronic Equipment

145
References
Acton, M.; Bertoldi, P.; Booth, J. (2020): 2020 Best Practice Guidelines for the EU Code of Conduct on Data Centre Energy Efficiency. Version 11.1.0 (Final Version). European Commission, Ispra, 2020, JRC119571. Available online at https://e3p.jrc.ec.europa.eu/sites/default/files/documents/publications/jrc119571_jrc119571_2020_best_practice_guidelines_v11.1.0a_br_ma_21_jan.pdf, checked on 1/14/2021.
Alfieri, F., Dodd, N., Gama-Caldas, M., Wolf, O., Maya-Drysdale, L., Huang, B., Viegand, J., Flucjer, S., Tozer, R., Whitehead, B., Brocklehurst, F., (2019) Development of European Green Public Procurement Criteria for Data Centres – Preliminary report, JRC Technical Report, EUR 29945 EN, Publications Office of the European Union, Luxemburg, 2019, ISBN 978-92-76-10382-0, doi:10.2760/327087, JRC118550.
Alger, Douglas (2010): Grow a Grenner Data Center. Chapter 2: Measuring Green Data Centers. Available online at https://cdn.ttgtmedia.com/searchSystemsChannel/downloads/Growing_a_Green_Data_Center_9781587058134_CH02.pdf, checked on 12/29/2020.
Al-Shehri, Salman M.; Loskot, Pavel; Numanoglu, Tolga; Mert, Mehmet (n.d.): Common Metrics for Analyzing, Developing and Managing Telecommunication Networks. Available online at https://arxiv.org/ftp/arxiv/papers/1707/1707.03290.pdf, checked on 1/14/2021.
Andor, Mark; Gerster, Andreas; Sommer, Stephan (2017): Consumer Inattention, Heuristic Thinking and the Role of Energy Labels. Essen (Ruhr economic papers, 671). Available online at http://www.rwi-essen.de/media/content/pages/publikationen/ruhr-economic-papers/rep_17_671.pdf.
Andrae A.S.G. (2020) Hypotheses for primary energy use, electricity use and CO2 emissions of global computing and its shares of the total between 2020 and 2030. WSEAS TRANSACTIONS on POWER SYSTEMS DOI: 10.37394/232016.2020.15.6 https://www.wseas.org/multimedia/journals/power/2020/a125116-083.pdf
BEREC (2020): BEREC Report on the outcome of the public consultation on the draft BEREC Work Programme 2021. BEREC - Body of European Regulators for Electronic Communications. Available online at https://berec.europa.eu/eng/document_register/subject_matter/berec/download/0/9719-berec-report-on-the-outcome-of-the-publi_0.pdf, checked on 3/10/2021.
Bertoldi, P. ; Avgerinou, M.; Castellazzi, L. (2017) Trends in data centre energy consumption under the European Code of Conduct for Data Centre Energy Effificiency, EUR 28874 EN, Publications Office of the European Union, Luxembourg, 2017, ISBN 978-92-79-76445-5, doi:10.2760/358256, JRC108354
Bertoldi, P; Lejeune, A (2020): Code of Conduct on Energy Consumption of Broadband Equipment. Version 7.1. European Commission, Ispra 2020, JRC119761. Available online at https://e3p.jrc.ec.europa.eu/publications/eu-code-conduct-energy-consumption-broadband-equipment-version-71, checked on 1/23/2021.
Berwald, Anton; Faninger, Thibault; Bayramoglu, Sara; Tinetti, Benoît; Mudgal, Shailendra; Stobbe, Lutz; Nissen, Nils (2015): Ecodesign Preparatory Study on Enterprise Servers and Data Equipment. ENTR Lot 9. Edited by European Union, checked on 1/14/2021.
BfR (2010): Grenzen und Möglichkeiten der Verbraucherinformation durch Produktkennzeichnung. With assistance of W. Konrad, D. Scheer. Edited by A. Epp, S.

146
Kurzenhäuser, R. Hertel, G.-F. Böl. Bundesinstitut für Risikobewertung (BfR). Institut für ökologische Wirtschaftsforschung – IÖW.
Blackburn, Mark (2012): Data Center Storage Efficiency Metrics. The Green Grid Forum 2012. Available online at https://www.thegreengrid.org/en/resources/library-and-tools/145-2012-Forum-%E2%80%93-Data-Center-Storage-Efficiency-Metric, checked on 1/14/2021.
Blue Angel, The German Ecolabel (Ed.) (2019): Energy Efficient Data Center Operation. Blue Angel, The German Ecolabel, Basic Award Criteria Edition January 2019, Version 1. Available online at https://produktinfo.blauer-engel.de/uploads/criteriafile/en/DE-UZ%20161-201901-en%20Criteria-2019-03-21.pdf, checked on 5/31/2021.
Booth, John (2019): D8.6 Green DC Energy Efficiency Roadmap V1. CATALYST.D8.6.GIT.WP8.v1.0 (H2020-EE-2016-2017), checked on 1/5/2021.
Booth, John (2020): D8.11 Green DC Energy Efficiency Roadmap V2. CATALYST.D8.11.GIT.WP8.v1.0 (H2020-EE-2016-2017). Available online at https://project-catalyst.eu/wp-content/uploads/2020/09/CATALYST.D8.11.GIT_.WP8_.V1.0package.pdf, checked on 1/20/2021.
Brill, Kenneth G. (2007): Data center energy efficiency and productivity. The Uptime Institute. Available online at http://large.stanford.edu/courses/2017/ph240/yu2/docs/brill.pdf, checked on 12/30/2020.
Brotherton, Heather M. (2013): Datacenter Efficiency Measures, checked on 12/30/2020.
Canfora P., Gaudillat P., Antonopoulos I., Dri M., (2020) Best Environmental Management Practice in the Telecommunications and ICT Services sector, EUR 30365 EN, Publications Office of the European Union, Luxembourg, 2020, ISBN 978-92-76-21574-5, doi:10.2760/354984, JRC121781
Carbon Trust (2020): Product carbon footprint labelling. Consumer research 2020. Available online at https://prod-drupal-files.storage.googleapis.com/documents/resource/restricted/Product-carbon-footprint-labelling-report-v3.pdf.
Chinnici, M.; Capozzoli, A.; Serale, G. (2016): Measuring energy efficiency in data centers. In Ciprian Dobre, Fatos Xhafa, M. Chinnici, A. Capozzoli, G. Serale (Eds.): Pervasive computing. Next generation platforms for intelligent data collection. Amsterdam, Boston: Elsevier/AP Academic Press is an imprint of Elsevier (Intelligent data-centric systems).
CISCO (2020): 2019 Corporate Social Responsibility Report. Available online at https://www.cisco.com/c/dam/m/en_us/about/csr/csr-report/2019/_pdf/csr-report-2019.pdf.
Consumer Focus (2012): Under the influence? Consumer attitudes to buying appliances and energy labels, checked on 12/21/2015.
Define (2017): Broadband Fibre Qualitative Research. Final Report. Edited by Define research & insight. Available online at https://www.asa.org.uk/uploads/assets/uploaded/d791272c-805a-495d-8e25650af1740ab7.pdf.
Dodd, N., Alfieri, F., Maya-Drysdale, L., Viegand, J., Flucker, S., Tozer, R., Whitehead, B., Wu, A., Brocklehurst F., (2020) Development of the EU Gr een Public Procurement (GPP) Crit er ia for Data Centres Server Rooms and Cloud Servic es , Final Technical Report,, EUR 30251 EN, Publications Office of the European Union , Luxembourg, 2020, ISBN 978-92-76-19447-7, doi:10.2760/964841, JRC118558

147
EDNA (2019): Intelligent Efficiency For Data Centres & Wide Area Networks. Report Prepared for IEA-4E EDNA. Available online at https://www.iea-4e.org/document/428/intelligent-efficiency-for-data-centres-and-wide-area-networks, checked on 1/29/2021.
Egmond, C.; Bruel, R. (2007): Nothing is as practical as a good theory,. Analysis of theories and a tool for developing interventions to influence energy-related behaviour. Available online at http://www.cres.gr/behave/pdf/paper_final_draft_CE1309.pdf.
Egmond, C.; Jonkers, R.; Kok G. (2005): A strategy to encourage housing associations to invest in energy conservation. In Energy Policy (33), pp. 2374–2384. Available online at https://www.sciencedirect.com/science/article/abs/pii/S0301421504001600, checked on 7/30/2021.
EN ISO 14024:2018: Environmental labels and declarations - Type I environmental labelling - Principles and procedures (ISO 14024:2018).
Energy Star (2018): ENERGY STAR Score for Data Centers in the United States. Technical Reference. Available online at https://www.energystar.gov/sites/default/files/tools/Data_Center_August_2018_EN_508.pdf, checked on 12/30/2020.
Ericsson (2020): Ericsson Mobility Report. Available online at https://www.ericsson.com/4adc87/assets/local/mobility-report/documents/2020/november-2020-ericsson-mobility-report.pdf.
ETSI EN 303 470 V1.1.0 (2019): ETSI EN 303 470 - V1.1.0 - Environmental Engineering (EE); Energy Efficiency measurement methodology and metrics for servers, checked on 1/14/2021.
ETSI ES 203 136 v1.2.1 (2017): ES 203 136 - V1.2.1 - Environmental Engineering (EE); Measurement methods for energy efficiency of router and switch equipment, checked on 1/13/2021.
ETSI ES 203 199 V1.2.1: ES 203 199 - V1.2.1 - Environmental Engineering (EE); Methodology for environmental Life Cycle Assessment (LCA) of Information and Communication Technology (ICT) goods, networks and services, checked on 2/9/2021.
ETSI ES 205 200-2-1 (2014): ETSI ES 205 200-2-1 - V1.2.1 - Access, Terminals, Transmission and Multiplexing (ATTM); Energy management; Global KPIs; Operational infrastructures; Part 2: Specific requirements; Sub-part 1: Data centres, checked on 1/17/2021.
European Commission (2010): A Digital Agenda for Europe. Communication from the Commission to the European Parliament, the Council, the European Economic and Social Committee and the Committee of the Regions. COM(2010)245 final. Available online at https://eur-lex.europa.eu/LexUriServ/LexUriServ.do?uri=COM:2010:0245:FIN:EN:PDF, checked on 3/10/2021.
European Commission (2013): ICT footprint. Pilot testing on methodologies for energy consumption and carbon footprint of the ICT-sector. SMART-Nr 2011/0078. Ecofys; Quantis; BIO Intelligence Service. Available online at https://ec.europa.eu/newsroom/dae/document.cfm?doc_id=1710, checked on 3/10/2021.
European Commission (2014): Directive 2014/61/EU of the European Parliament and of the Council of 15 May 2014 on measures to reduce the cost of deploying high-speed electronic communications networks. Available online at https://eur-

148
lex.europa.eu/legal-content/EN/TXT/PDF/?uri=CELEX:32014L0061&from=EN, checked on 3/10/2021.
European Commission (2017): Regulation (EU) 2017/1369 of the European Parliament and of the Council of 4 July 2017 setting a framework for energy labelling and repealing Directive 2010/30/EU. Available online at https://eur-lex.europa.eu/legal-content/en/TXT/?uri=CELEX%3A32017R1369, checked on 8/16/2021.
European Commission (2018a): Assessment of different communication vehicles for providing Environmental Footprint information. Final Report. Francisco Lupiáñez-Villanueva, Pietro Tornese, Giuseppe A. Veltri and George Gaskell. Presented in consortium by LSA & Partner. European Commission. Directorate General Environment. Directorate A – Green Economy. ENV.A.1 – Eco-Innovation & Circular Economy. Available online at https://ec.europa.eu/environment/eussd/smgp/pdf/2018_pilotphase_commreport.pdf.
European Commission (2018b): Product Environmental Footprint Category Rules Guidance. Version 6.3 – May 2018. Available online at https://ec.europa.eu/environment/eussd/smgp/pdf/PEFCR_guidance_v6.3.pdf, checked on 8/6/2021.
European Commission (2018c): Report from the Commission to the European Parliament and the Council. on the implementation of Directive 2014/61/EU of the European Parliament and of the Council of 15 May 2014 on measures to reduce the cost of deploying high-speed electronic communications networks. Available online at https://eur-lex.europa.eu/legal-content/EN/TXT/?uri=COM%3A2018%3A492%3AFIN, checked on 3/10/2021.
European Commission (2019a): Special Eurobarometer 490. Climate Change. Conducted by Kantar Public at the request of Directorate-General for Climate Action. Survey coordinated by the Directorate-General for Communication (DG COMM ‘Media monitoring and Eurobarometer’ Unit). Available online at https://europa.eu/eurobarometer/api/deliverable/download/file?deliverableId=70456.
European Commission (2019b): Single Market for Green Products - The Product Environmental Footprint Pilots - Environment - European Commission. Available online at https://ec.europa.eu/environment/eussd/smgp/ef_pilots.htm, updated on 12/31/2019, checked on 8/6/2021.
European Commission (2020a): Commission Recommendation (EU) 2020/1307 of 18 September 2020 on a common Union toolbox for reducing the cost of deploying very high capacity networks and ensuring timely and investment-friendly access to 5G radio spectrum, to foster connectivity in support of economic recovery from the COVID-19 crisis in the Union. Available online at https://eur-lex.europa.eu/legal-content/EN/TXT/?uri=CELEX:32020H1307, checked on 3/10/2021.
European Commission (2020b): Shaping Europe's digital future. Luxembourg: Publications Office of the European Union. Available online at https://ec.europa.eu/info/sites/info/files/communication-shaping-europes-digital-future-feb2020_en_4.pdf, checked on 4/8/2021.
European Commission (2021a): Rules and requirements for energy labelling and ecodesign. Available online at https://ec.europa.eu/info/energy-climate-change-environment/standards-tools-and-labels/products-labelling-rules-and-requirements/energy-label-and-ecodesign/rules-and-requirements_en, updated on 3/8/2021, checked on 8/6/2021.
European Commission (2021b): Special Eurobarometer 510. E-Communications in the Single Market. Available online at https://europa.eu/eurobarometer/surveys/detail/2232, checked on 8/9/2021.
149
forsa (2009): Verständlichkeit und Einflussfaktoren für verschiedene Optionen der grafischen Neugestaltung der EU-einheitlichen Energieverbrauchskennzeichnung [Understandability and influencing factors for different options for the graphical redesign of the common EU Energy Label]. dena Deutsche Energie Agentur, checked on 12/21/2015.
Georgiadou, Vasiliki; Chenadec, Julie; Irazoqui, Cristobal (2018): D2.2 Green Data Centre Assessment Toolkit. Version 1.0. CATALYST.D2.2.GIT.WP2.v1.0 (H2020-EE-2016-2017), checked on 12/22/2020.
GHG Protocol ICT Sector Guidance (2017): ICT Sector Guidance built on the GHG Protocol Product Life Cycle Accounting and Reporting Standard. Available online at https://www.ghgprotocol.org/sites/default/files/ghgp/GHGP-ICTSG%20-%20ALL%20Chapters.pdf, checked on 2/9/2021.
Green IT Promotion Council (2012): New Data Center Energy Efficiency Evaluation Index - (DPPE) Datacenter Performance per Energy Measurement Guidelines (Ver 2.05). Available online at https://home.jeita.or.jp/greenit-pc/topics/release/pdf/dppe_e_DPPE_Measurement_Guidelines.pdf, checked on 1/20/2021.
Green, L. W.; Kreuter, M. W. (1999): Health promotion planning. An Educational and Ecological Approach. 3rd edition. Mountain View, California.
Gröger, Jens; Liu, Ran (2021): Green Cloud Computing. Lebenszyklusbasierte Datenerhebung zu Umweltwirkungen des Cloud Computing. With assistance of Lutz Stobbe, Jan Druschke, Nikolai Richter. Edited by Umweltbundesamt. Dessau-Roßlau. Available online at https://www.umweltbundesamt.de/sites/default/files/medien/5750/publikationen/2021-06-17_texte_94-2021_green-cloud-computing.pdf, checked on 8/10/2021.
Grünig et al (2010): Study on Consumer Information on Fuel Economy and CO2 Emissions of New Passenger Cars. Implementation of the Directive 1999/94/EC. Available online at https://www.europarl.europa.eu/RegData/etudes/etudes/join/2010/433455/IPOL-ENVI_ET(2010)433455_EN.pdf, checked on 8/6/2021.
Hottenroth et al (2013): Carbon Footprints für Produkte. Handbuch für die betriebliche Praxis kleiner und mittlerer Unternehmen. With assistance of Heidi Hottenroth, Bettina Joa, Mario Schmidt. Hochschule Pforzheim, Institut für Industrial Ecology. Available online at https://www.hs-pforz-heim.de/fileadmin/user_upload/uploads_redakteur/Forschung/INEC/Dokumente/Hottenroth_et_al_Carbon_Footprints_fuer_Produkte_web.pdf.
Hurtado, R.; Paralera, M. (2016): Preferences of university students on the choice of internet service provider. Available online at http://www.revistalatinacs.org/071/paper/1102/22en.html.
Ipsos MORI; London Economics; AEA (2012): Research on EU product label options. Final report, checked on 12/21/2015.
ISO (2021): Environmental labels. Available online at https://www.iso.org/publication/PUB100323.html, updated on 8/6/2021, checked on 8/6/2021.
ISO 14040 (2006): Environmental management - Life cycle assessment - Principles and framework.
ITU (2008): Telecom Network Planning for evolving Network Architectures Reference Manual. Draft version 5.1; January 2008. Document NPM/5.1. International Telecommunication Union (ITU). Geneva. Available online at https://www.itu.int/ITU-

150
D/tech/NGN/Manual/Version5/NPM_V05_January2008_PART1.pdf, checked on 3/11/2021.
ITU (2012): Review of mobile handset eco-rating schemes. Edited by International Telecommunication Union (ITU). Available online at https://www.itu.int/dms_pub/itu-t/oth/4B/01/T4B010000030001PDFE.pdf.
ITU-T L.1315 (2017): ITU-T Rec. L.1315 (05/2017) Standardization terms and trends in energy efficiency. Edited by International Telecommunication Union (ITU, checked on 1/13/2021.
ITU-T L.1410 (2014): ITU-T Rec. L.1410 (12/2014) Methodology for environmental life cycle assessments of information and communication technology goods, networks and services. Available online at https://www.itu.int/rec/T-REC-L.1410-201412-I, checked on 2/9/2021.
ITU-T L-1302 (2015): ITU-T Rec. L.1302 (11/2015) Assessment of energy efficiency on infrastructure in data centres and telecom centres. Edited by International Telecommunication Union (ITU, checked on 1/14/2021.
ITU-T L1310 (2020): ITU-T Rec. L.1310 (09/2020) Energy efficiency metrics and measurement methods for telecommunication equipment. Recommendation ITU-T L.1310. Edited by International Telecommunication Union (ITU. Available online at https://www.itu.int/rec/T-REC-L.1310-202009-I/en, checked on 1/23/2021.
ITU-T L-1320 (2014): ITU-T Rec. L.1320 (03/2014) Energy efficiency metrics and measurement for power and cooling equipment for telecommunications and data centres. Edited by International Telecommunication Union (ITU, checked on 1/13/2021.
ITU-T L-1470 (2020): ITU-T Rec. L.1470 (01/2020) Greenhouse gas emissions trajectories for the information and communication technology sector compatible with the UNFCCC Paris Agreement. Available online at https://www.itu.int/rec/T-REC-L.1470-202001-I/en, checked on 2/3/2021.
Köhler, Andreas R.; Gröger, Jens; Liu, Ran (2018): Energie- und Ressourcenverbräuche der Digitalisierung. Expertise für das WBGU-Hauptgutachten „Unsere gemeinsame digitale Zukunft“. Available online at https://www.researchgate.net/publication/335490910_Energie-_und_Ressourcenverbrauche_der_Digitalisierung_Expertise_fur_das_WBGU-Hauptgutachten_Unsere_gemeinsame_digitale_Zukunft.
Kollaras, Antonios; Tirabasso, Fabio (2014): Deliverable D2.1 Business scenarios and use case analysis. FP7-ICT-609140 – DOLFIN. Data Centres Optimization for Energy-Efficient and EnvironmentalLy Friendly INternet, checked on 1/17/2021.
LEED v4.1 (2020): LEED v4.1 Building Design and Construction. Edited by U.S. Green Building Council. Available online at https://www.usgbc.org/leed/v41, checked on 1/5/2021.
Levy, Moises; Raviv, Daniel (2017): A Novel Framework for Data Center Metrics using a Multidimensional Approach. 15th LACCEI International Multi-Conference for Engineering, Education, and Technology: “Global Partnerships for. Available online at http://www.laccei.org/LACCEI2017-BocaRaton/full_papers/FP387.pdf, checked on 12/28/2020.
Liberty Global (2019): Responsible Procurement and Supply Chain Principles. Available online at https://www.libertyglobal.com/wp-content/uploads/2019/06/Responsible-Procurement-and-Supply-Chain-Principles-2019.pdf, checked on 3/11/2021.
Liu, Ran; Gailhofer, Peter; Gensch, Carl-Otto; Köhler, Andreas; Wolff, Franziska (2019): Impacts of the digital transformation on the environment and sustainability. Issue

151
Paper under Task 3 from the “Service contract on future EU environment policy”. Available online at https://ec.europa.eu/environment/enveco/resource_efficiency/pdf/studies/issue_paper_digital_transformation_20191220_final.pdf.
London Economics (2014): Study on the impact of the energy label - and potential changes to it - on consumer understanding and on purchase decisions. ENER/C3/2013-428. Final Report. Ordered by the European Commission. Available online at https://ec.europa.eu/energy/sites/ener/files/documents/Impact%20of%20energy%20labels%20on%20consumer%20behaviour.pdf.
London Economics; IPSOS (2014): Study on the impact of the energy label – and potential changes to it – on consumer understanding and on purchase decisions ENER/C3/2013-428 Final Report, checked on 12/21/2015.
Lundberg, Sofia and Marklund, Per-Olov and Brännlund, Runar, Assessment of Green Public Procurement as a Policy Tool: Cost-Efficiency and Competition Considerations (May 8, 2009). Available at SSRN: https://ssrn.com/abstract=1831089 or http://dx.doi.org/10.2139/ssrn.1831089
Lykou, G.; Mentzelioti, D.; Gritzalis, D. (2017): A new methodology towards effectively assessing data center sustainability. DOI: 10.1016/j.cose.2017.12.008.
Molenbroek, Edith; Smith, Matthew; Groenenberg, Heleen; Waide, Paul; Attali, Sophie; Fischer, Corinna et al. (2013): Evaluation of the Energy Labelling Directive and specific aspects of the Ecodesign Directive. ENER/C3/2012-523. Background report I: Literature review.
Montevecchi, F., Stickler, T., Hintemann, R., Hinterholzer, S. (2020). Energy-efficient Cloud Computing Technologies and Policies for an Eco-friendly Cloud Market. Final Study Report on behalf of the European Commission, DG CONNECT . Vienna
Mudgal, Shailendra; Tinetti, Benoît; Faninger, Thibault; Proske, Marina; Schischke, Karsten; Prakash, Siddharth; Liu, Ran (2013): Toward an overall measurement methodology of the carbon and energy footprints of the ICT sector. FINAL REPORT (SMART 2011/0073). Available online at https://op.europa.eu/en/publication-detail/-/publication/9a79fd07-27af-4ad5-b39f-0fe11a49b9e5, checked on 2/9/2021.
Newcombe, Liam; Limbuwala, Zahl; Latham, Paul; Smith, Victor (2012): Data centre Fixed to Variable Energy Ratio metric DC-FVER. An alternative to useful work metrics which focuses operators on eliminating fixed energy consumption. Edited by BCS Data Centre Specialist Group. Available online at https://www.bcs.org/media/2917/dc_fver_metric_v10.pdf, checked on 1/12/2021.
Newmark, Rona; Isaak, Phil; Vincent, Jay (2017): Applying ICT Capacity and Utilization Metrics to Improve Data Center Efficiency. Available online at https://www.thegreengrid.org/en/resources/library-and-tools/443-Applying-ICT-Capacity-and-Utilization-Metrics-to-Improve-Data-Center-Efficiency, checked on 1/20/2021.
Omar, Emad (2019): Data Center Simulator for Sustainable Data Centers. Available online at https://elib.uni-stuttgart.de/bitstream/11682/10604/1/Masterarbeit%20-%20Data%20Center%20Simulator%20for%20Sustainable%20Data%20Centers.pdf, checked on 1/6/2021.
Pärssinen, Matti (2016): Analysis and Forming of Energy Efficiency and GreenIT Metrics Framework for Sonera Helsinki Data Center HDC. Available online at https://core.ac.uk/download/pdf/80719192.pdf, checked on 1/6/2021.
Patel, Chandrakant D.; Sharma, Ratnesh K.; Bash, Cullen E.; Beitelmal, Monem; (Keine Angabe) (2006): Energy Fow in the Information Technology Stack: Coefficient of

152
Performance of the Ensemble and its Impact on the Total Cost of Ownership. Edited by L. P. Hewlett-Packard Development Company, checked on 12/30/2020.
Patterson, Michael K; Poole, Stephen W; Hsu, Chung-Hsing; Maxwell, Don; Tschudi, William; Coles, Henry et al. (2013): TUE, a new energy-efficiency metric applied at ORNL's Jaguar. In International Supercomputing Conference ISC 2013, pp. 372–382. Available online at https://dcpro.lbl.gov/sites/all/files/isc13_tuepaper.pdf, checked on 12/30/2020.
PCFCR - UPS (2020): Product Environmental Footprint Category Rules – Uninterruptible Power Supply (UPS). Version: 5.3. Available online at https://ec.europa.eu/environment/eussd/smgp/pdf/PEFCR_UPS_Feb%202020_2.pdf, checked on 1/5/2021.
Pehlken, Alexandra; Hintemann, Ralph; Penaherrera, Fernando; Gizli, Volkan; Hurrelmann, Karsten; Hinterholzer, Simon et al. (2019): Abschlussbericht Verbundprojekt TEMPRO. Total Energy Management for Professional Data Center Ganzheitliches Energiemanagement in professionellen Rechenzentren. Edited by Bundesministerium für Wirtschaft und Technologie, 6. Energieforschungsprogramm. Available online at https://tempro-energy.de/images/pdfs/Tempro_Endbericht_final_2020_05_14.pdf, checked on 1/6/2021.
Peñaherrera, Fernando; Szczepaniak, Katharina (2018): Development and Application of Metrics for Evaluation of Cumulative Energy Efficiency for IT Devices in Data Centers. In Alexandra Pehlken, Matthias Kalverkamp, Rikka Wittstock (Eds.): Cascade Use in Technologies 2018. Berlin, Heidelberg: Springer Berlin Heidelberg, pp. 142–153.
Pino, Albena (2017): The Environmental Impacts of The Environmental Impacts of Core Networks for Mobile Telecommunications: A Study Based on the Life Cycle Assessment (LCA) of Core Network Equipment. Available online at https://pdfs.semanticscholar.org/5be6/bcba0a0b0d1d01f804bb44157b3377ff8a95.pdf.
Prakash, S.; Baron, Y.; Liu, R. (2014): Study on the practical application of the new framework methodology for measuring the environmental impact of ICT - cost/benefit analysis (SMART 2012/0064). With assistance of M. Proske, A. Schlösser. Available online at https://ec.europa.eu/newsroom/dae/document.cfm?doc_id=6917, checked on 3/10/2021.
Reddy, V. Dinesh; Setz, Brian; Rao, G.S. V.R.K.; Gangadharan, G.R.; Aiello, M. (2017): Metrics for Sustainable Data Centers (VOL. 2; NO. 3). Available online at https://ieeexplore.ieee.org/stamp/stamp.jsp?arnumber=7921551, checked on 12/21/2020.
Renda, A., Pelkmans, J., Egenhofer, C., Schrefler, L. Luchetta, G., Selçuki, C., Balesteros, J., Zirnhelt, A. (2012) The uptake of Green Public Procurement in the EU27, study on behalf of the European Commission, DG Environment, prepared by CEPS and College of Europe, Brussels, 29th of February 2012, accessible from CEPS-CoE-GPP MAIN
REPORT.pdf (europa.eu)
Rivas Calvete, Silvia; Cuniberti, Barbara; Bertoldi, Paolo (2016): Effective information measures to promote energy use reduction in EU Member States. Analysis of information, empowerment and training measures in Member States National Energy Efficiency Action Plans (EUR 27997 EN). Available online at https://publications.jrc.ec.europa.eu/repository/handle/JRC100661, checked on 7/30/2021.
Schödwell, Björn; Zarnekow, Rüdiger; Liu, Ran; Gröger, Jens; Wilkens, Marc (2018): Kennzahlen und Indikatoren für die Beurteilung der Ressourceneffizienz von Rechenzentren und Prüfung der praktischen Anwendbarkeit. Edited by Umweltbundesamt (Forschungskennzahl 3715 31 601 0). Available online at
153
https://www.umweltbundesamt.de/sites/default/files/medien/1410/publikationen/2018-02-23_texte_19-2018_ressourceneffizienz-rechenzentren.pdf, checked on 12/30/2020.
Shally; Sharma, Sanjay Kumar; Kumar, Sunil (2019): Measuring Energy Efficiency of Cloud Datacenters. In International Journal of Recent Technology and Engineering (IJRTE) (Volume-8 Issue-3). DOI: 10.35940/ijrte.B3548.098319.
Shehabi, A.; Smith, S.J.; Horner, N.; Azevedo, I.; Brown, R.; Koomey, J. et al. (2016): United States Data Center Energy Usage Report. Lawrence Berkeley National Laboratory, Berkeley, California, checked on 12/24/2020.
Smart city cluster collaboration, Task 1 (2014): Existing Data Centres energy metrics - Task 1. Edited by Seventh Framework Programme. Available online at http://www.dolfin-fp7.eu/wp-content/uploads/2014/01/Task-1-List-of-DC-Energy-Related-Metrics-Final.pdf, checked on 12/29/2020.
Smart City Cluster Collaboration, Task 4 (2015): Data Centre Integration. Energy, Environmental, and Economic Efficiency Metrics: Measurement and Verification Methodology. Edited by Seventh Framework Programme.
SNIA (2020): SNIA Emerald™ Power Efficiency Measurement Specification V4.0.0. SNIA Technical Position. Edited by SNIA Advancing storage & information technology. Available online at https://www.snia.org/tech_activities/standards/curr_standards/emerald, checked on 1/1/2021.
SPEC (2008): SPEC Power®. Edited by Standard Performance Evaluation Corporation. Available online at https://www.spec.org/power_ssj2008/, checked on 1/14/2021.
SPEC (2019): Server Efficiency Rating Tool (SERT) Design Document 2.0.3. Standard Performance Evaluation Corporation (SPEC®). Design Document, checked on 1/4/2021.
Steininger et al (2017): Evaluierung des Energieausweises. Eine empirische Studie zur Wahrnehmung der Energieeffizienz von Wohnimmobilien aus der Verbraucherperspektive. Working Papers des KVF NRW 7. With assistance of Claudia Nadler, Melanie Franke, Carolin Pommeranz. Edited by Verbraucherzentrale NRW/Kompetenzzentrum Verbraucherforschung NRW. Düsseldorf.
Stobbe, Lutz; Berwald, Anton (2019): State of sustainability research for network equipment. Large Network Equipment - Enterprise Switches and Routers - Final Report. Prepared for the Green Electronics Council and TÜV Rheinland in support of criteria development for the EPEAT and Green Product Mark ecolabels. Fraunhofer IZM. Berlin.
Talens Pieró, L., Polverini, D., Ardente, F., Mathieux, F., (2020) Advances towards circular economy policies in the EU: The new Ecodesign regulation of enterprise servers, in: Resources, Conservation & Recycling, vol. 154, available at: Advances towards
circular economy policies in the EU: The new Ecodesign regulation of enterprise servers
- ScienceDirect
The Green Grid (2007): Green Grid Metrics: Describing Datacenter Power Efficiency. Technical Committee White Paper, checked on 1/1/2021.
The Green Grid (2008): A Framework for data center energy productivity. White Paper #13, checked on 1/1/2021.
The Green Grid (2010a): ERE: A metric for measuring the benefit of reuse energy from a data center. WHITE PAPER #29. Available online at https://eehpcwg.llnl.gov/documents/infra/06_energyreuseefficiencymetric.pdf, checked on 12/29/2020.

154
The Green Grid (2010b): The Green Grid Data Center Compute Efficiency Metric: DCcE. WHITE PAPER #34, checked on 1/7/2021.
The Green Grid (2011): Water Usage Effectiveness (WUE™): A green Grid Data Center Sustainability Metric. WHITE PAPER #35, checked on 12/29/2020.
The Green Grid (2012): Electronics Disposal Efficiency (EDE): An IT recycling metric for enterprises and data centers. WHITE PAPER #53.
The Green Grid (2014a): Harmonizing Global Metrics for Data Center Energy Efficiency. Global Taskforce Reaches Agreement Regarding Data Center Productivity. Available online at https://www.thegreengrid.org/en/resources/library-and-tools/215-Harmonizing-Global-Metrics-for-Data-Center-Energy-Efficiency-%E2%80%93-March-2014, checked on 12/30/2020.
The Green Grid (2014b): The Green Grid Data Center Storage Productivity Metrics (DCsP): Application of Storage System Productivity Operational Metrics. WHITE PAPER #58, checked on 1/1/2021.
The Green Grid: Carbon Usage Effectiveness (CUE): A Green Grid Data Center Sustainability Metric. WHITE PAPER #32. Available online at https://www.netalis.fr/wp-content/uploads/2016/04/Carbon-Usage-Effectiveness-White-Paper_v3.pdf, checked on 12/29/2020.
Topten Act (2018): Click your way to energy savings. TOPTEN ACT 2015-2018. Find out the most efficient products in Europe with a simple click on the Topten websites. Available online at https://storage.topten.eu/source/files/TOPTEN-ACT-Results-Summary.pdf.
TÜV Rheinland and Global Electronics Council (Ed.) (2021): Criteria for the Sustainability Assessment of Network Equipment for the Global Electronics Council EPEAT® Ecolabel and the TÜV Rheinland Green Product Mark. Available online at https://globalelectronicscouncil.org/wp-content/uploads/EPEAT-Network-Equipment-Criteria_FINAL-April-2021.pdf, checked on 5/31/2021.
UBA (2019): Marktanalyse Ökostrom II. Available online at https://www.umweltbundesamt.de/sites/default/files/medien/1410/publikationen/2019-08-15_cc_30-2019_marktanalyse_oekostrom_ii.pdf, checked on 8/6/2021.
Vodafone (2020): Digitising Europe Pulse. Tackling Climate Change. A Survey of 13 EU Countries. Vodafone Institute for Society and Communications. Available online at https://www.vodafone-institut.de/wp-content/uploads/2020/10/VFI-DE-Pulse_Climate.pdf, checked on 3/11/2021.
Waide, Paul; Watson, Rowan (2013): The New European Energy Label: Assessing Consumer Comprehension and Effectiveness as a Market Transformation Tool. Edited by Navigant, in collaboration with The Collaborative Labeling and Appliance Standard Program (CLASP).
Wilde, Torsten (2018): Assessing the Energy Efficiency of High Performance Computing (HPC) Data Centers. Available online at https://mediatum.ub.tum.de/doc/1399734/file.pdf, checked on 1/5/2021.

155
Annex 1: Overview interviewed associations and companies). To create a comprehensive
understanding of the various reporting systems and the benefits, barriers, and challenges, the
experts were asked to provide perspectives on current practices. The results are documented
below.
Purchasing of new network equipment
There are a number of metrics that describe the energy consumption and efficiency of
individual network components. For example, at the level of energy consumption per port or
energy consumption in idle mode. A frequently cited example of minimum requirements for
components is the EU Code of Conduct for Broadband Equipment. When planning new
networks and purchasing new network components, the specific values according to these
metrics are requested and minimum efficiency requirements are set for the suppliers. In some
cases, there are even contractual obligations that component manufacturers must take on that
their equipment may not consume more than a specified amount of energy during operation.
If the devices nevertheless require more energy, contractual penalties ensue.
In order to optimise the planning of networks, economic methods are also used that lead to
energy savings at the same time. By calculating life-cycle costs (total costs of ownership), both
the purchase price of equipment and the operating costs due to maintenance and energy
consumption are taken into account. According to the network operators, the consideration of
the total costs leads to a preference for the procurement of energy-efficient equipment, if for
no other reason than economic considerations.
Some operators include in their planning not only the environmental impacts from “scope 1”
(direct emissions) and “scope 2” (emissions from energy supply), but also the environmental
impacts from “scope 3” (production of equipment and use of equipment by customers). For
this purpose, the product environmental footprint methodology is applied to end-user devices,
which examines the products along their entire life cycle. Since network operators often also
lend or sell end devices to their customers (e.g. modems or telephones), corporate
responsibility is also seen in this area, which goes beyond the actual network.
According to one network operator, the greatest energy savings are achieved through the right
choice of network topology and the technology used. Through continuous modernisation,
telecommunication network operators manage to keep their energy consumption constant or
even reduce it, even though more data is being transmitted overall and the network is being
expanded.
Operation of telecommunication networks
According to the interviewees, telecommunications network operators have a very good
overview of how much energy is consumed in their networks overall. This is also because
energy costs are a relevant item in the economic balance sheet. In their reporting they
therefore often voluntarily show their total energy consumption and the related CO2 emissions.
According to a large telecommunications network operator, 80% of the energy consumption
of the whole company results from the electricity consumption of the networks. The remaining
20% is fuel consumption of vehicles for maintenance and customer service and building
energy consumption.
156
In addition, each network operator has corresponding statistics on how much data is
transmitted over their networks. It has therefore become established as a frequently used key
figure to indicate the energy efficiency of networks through the KPI energy consumption per
data volume (e.g. kWh/terabyte).
However, when it comes to calculate individual network connections and, for example, the
energy consumption per network service, data connection or per subscriber line, suitable
calculation methods to allocate the distributed energy consumption to the individual services
have been lacking up to now. Although the individual network components have the
corresponding monitoring interfaces that would allow efficiency measurement at component
level, the possibilities are usually not fully utilised. According to the information of an operator,
this would lead to considerable additional costs and higher energy consumption due to the
additional monitoring technology that would then be required. Against this background,
appropriate monitoring of individual connections takes place at most within the framework of
individual case studies.
In principle, all companies are obliged to carry out energy audits and introduce energy
management systems according to the Energy Efficiency Directive (2012/27/EU). However,
the national implementation of this obligation differs. In fact, it is easier for those network
operators to collect the relevant detailed information on the energy consumption of their
networks in whose countries this directive has been well implemented into national law.
In addition to the energy-related optimisation potential, efforts are also being made by
telecommunications network operators in the area of resource protection. These efforts relate
both to the extension of the useful life of equipment and end user devices through the
refurbishment of old devices, and to the responsible handling of electronic waste.
Suggestions of ECN operators for minimum information requirements
Telecommunications network operators are very interested in reducing their energy costs and
improving their environmental performance. They can be supported in this by standardised
key figures and information requirements for all telecommunication network operators. Of the
figures that are already regularly calculated and reported, from the perspective of the
interviewed companies these three in particular could be included in a common reporting
system:
• Energy consumption for the operation of the networks (geographically allocated),
• Energy consumption per amount of data transmitted (broken down by access
technology, if applicable),
• Share of renewable energies in energy consumption (electricity and other energy
sources).
Results from online survey with electronic communication network providers and
equipment manufactureres
In the online survey mentioned in the previous chapter on Task 1.2.1, questions were also
asked to assess the environmental performance of network equipment. These questions were
directed towards both network operators and network equipment manufacturers.

157
Table 33: When asked what environmental requirements they expect or are requested for
network equipment, the majority answers that they have to fulfil the requirements according to
EU Code of Conduct on Energy Consumption of Broadband Equipment (67%). Another
important requirement are guarantees to provide spare parts and software updates over the
expected useful life (60%). About half of the companies (47%) have to meet requirements for
the environmentally sustainable production as well as the obligation to take back old or
defective components for refurbishment. A third of the surveyed companies (33%) have to
comply with other energy consumption requirements (e.g. W/port, in different operation states)
and only two companies (13%) are expecting contractual guarantees for the minimum energy
efficiency.
Table 33: What requirements do you expect suppliers to meet when you procure new
network equipment? What are your requirements when you offer network
components?
Source: online survey with ECN providers and equipment manufacturers, multiple answers
possible
The companies have listed the following most important environmental requirements in
purchasing or selling network equipment that go beyond the above mentioned
requirements:
• Banned chemical list of the Cradle to Cradle program
• Certified “green” products (e.g. Blue Angel certificate , Green Product Award, Energy
Star, Eco-Rating OR equivalent)
• Commitment to develop sustainable products
• Due diligence on international regulations (e.g. WEEE, ROHS, REACH, EU directive
on conflict minerals)
• Eco-design guideline according to ITU-T L.CE_2 or equivalent
• Energy efficiency according to ITU, ATIS, ETSI or equivalent
• In-house product sustainability criteria
• Life Cycle Assessment based on ITU-T L.1410 or equivalent
• Signing of a CSR clause, including environmental requirements
• Sustainable packaging (plastic-free, reusable)
• Use of recyclable materials
• Use of recycled materials in production
• WEEE targets: existing take back programs.
Count % of responses
Requirements according to EU Code of Conduct on Energy Consumption of Broadband Equipment 10 67%
Guarantees to provide spare parts and software updates over the expected useful life 9 60%
Requirements for the environmentally sustainable production 7 47%
Taking back old or defective components for refurbishment 7 47%
Other energy consumption requirements (e.g. W/port, in different operation states) 5 33%
None of the above 3 20%
Contractual guarantees for the minimum energy efficiency 2 13%
N 15

158
The companies were asked, if there is a further need for environmental reporting
standards for electronic communication networks that still need to be developed and
what these should cover. The answers vary from “no, the current standards are sufficient” to
specific needs for certain environmental aspects. The main suggestions are:
• A standardised energy efficiency metric, developed by the industry (i.e. ETSI or ITU).
• Guidelines for the energy intensity calculation in electronic communications
companies.
• ICT enabling impact: Reporting positive sustainability/environmental impacts of ICT
because digital technologies not only consume energy and resources but also can do
a lot to enable its customers and the society to reduce energy and resource
consumption and to decreasse carbon emissions.
• No! The number of standards is exponentially increasing already. Unless you produce
a standard with little complexity, well written, don't even try...
• Not to be used to compare different operators but more as a way to measure their
footprints over time.
• Social topics as human rights in the supply chain etc.
• Technology neutrality should be included in any standards used.
• There are a wide range of environmental reporting standards currently available which
are fit for purpose.
• There is a need for standardization in how sustainable materials are (EPDs ISO14044
based).
• We do not see a need for further regulatory intervention.
• We see also increasing interest within circular economy topics.
• With respect to climate change also science based targets, renewable enery targets
and carbon neutrality targets are increasingly expected.
As a final question the companies were asked, how electronic communications providers
could contribute to the European Green Deal to achieve climate neutrality in 2050. 13
companies responded to this question, some of them in great detail, and referred to further
documents and additional statements. In the following, the individual contributions of the
companies and assessments are summarised, whereby the points mentioned first are the
most frequently mentioned:
• Almost all responding companies emphasise the special role of digital transformation
in achieving the goals of the European Green Deal. Telecommunication can help to
reduce traffic, transform the energy system and produce more efficiently (“enabling
effects”). The expansion and increased use of electronic infrastructure is already a
contribution in itself.
• Frequently mentioned are the efforts of companies to become climate-neutral
themselves. This shall be achieved in particular by purchasing electricity from
renewable energies.
• Several mentions refer to the efficiency advantages of certain technologies (FTTH
and 5G). The expansion of highly efficient technologies should make the digital
infrastructure reliable and future-proof. In doing so, it should also be accepted that
initially higher investments and possibly higher environmental burdens will be incurred,
but that these will then pay off in the future.

159
• In another direction, various contributions argue that existing infrastructures (copper
cables) should be used for as long as possible and should be adapted to the
increasing data demand through upgrades. This prevents expensive road works and
increases the useful life of electronic components, which is seen as a contribution to
resource conservation.
• Several proposals refer to the sharing of infrastructures among different, competing
providers. By sharing infrastructures, parallel investments are avoided and
infrastructures are better utilised. This leads to cost savings and greater efficiency.
• Other individual mentions include increasing the energy efficiency of network
components by improving sleep modes when not in use.
• More efficient cooling technologies, which still account for around 40% of energy
demand.
• The introduction of CO2 taxes for electricity, which should further strengthen the self-
interest of companies to save energy.
• Dismantling of mobile phone infrastructures and increased use of the more energy-
efficient fixed network infrastructures.
• The reduction of material consumption and e-waste generation through longer
useful lifetimes and better take-back systems.
• Introduction of rental systems for end user devices (device as a service), which
guarantee an orderly take-back of the devices.
• Use of recycled materials in and better recyclability of devices.
• Moving away from flat-rate tariffs to billing tariffs that take into account the amount of
data. This should encourage consumers and device manufacturers to consume less data.
Task 1.2.3: Standards and measurement methodologies for the monitoring of
environmental footprint of electronic communications networks and services
Aim of this task
The key objective of this task is to provide comprehensive information on existing standards
(or such under development) and measurement methodologies for monitoring the
environmental footprint of electronic communication networks and services.
The scope of this task includes the standards and measurement methodologies for monitoring
the environmental footprint, particularly with regard to energy consumption and GHG
emissions. In the following sections only ECN-relevant standards are described, i.e.
equipment on the end-user side, is not part of this task.

160
Figure 20: Scope of the ECN to be covered in dotted lines
Source: Oeko-Institut
Categorisation of networks and their electricity consumption
Networks are highly complex systems. Basically, a network can be classified as follows:
• By generations of technology:
o legacy,
o modern and
o next generation
• By communication medium and type of services provided:
o fixed network
o mobile network
• By hierarchy levels:
o access network,
o aggregation network (also called metro network)
o core network (also called backbone network)
The intermediate layer between two respective access networks, the so-called aggregation
network, transports data between the interconnected nodes. EDNA (2019) pointed out that it
is becoming increasingly difficult to distinguish the boundary between the aggregation and
core networks. Hence, according to the EDNA study the aggregation network is considered
part of the core network which is shown in Figure 21.
For both fixed and mobile networks, the JRC study on the best environmental management
practice (BEMP) in the telecommunications and ICT services sector found that the access
network can be a major energy consumer due to the presence of a large number of active
elements (Canfora et al. 2020). Furthermore, radio base stations (RBS) are the dominant part
of the total energy consumption of a wireless access network (ITU-T L1310 and (Al-Shehri et
al. n.d.)

161
Figure 21: Categorisation of networks differing technology generations and network
segments
Source: Oeko-Institut based on EDNA (2019)
The FAN (Fixed access network) uses thousands of kilometres of electric copper cables and
optical fibres to ensure communication. The RAN (Radio access network) connects mobile
devices to the internet by using radio wave transmissions (ranging widely from 3 kHz to 300
GHz) as signals (Canfora et al. 2020). The core networks are the main internet highways
which connect RAN and FAN over long distances between different regions and cities with
high data volumes.
The energy consumption modelling of the WAN (wide area networks) carried out by EDNA (s.
Figure 22) shows that the core network only consumes a small fraction, around 13% of the
total WAN energy. Most energy is consumed to get into the network (access network). The
forecast shows that WAN energy consumption will decrease in the period 2014 to 2022 and
then slowly increase thereafter, based on assumptions of the “high efficiency scenario”. It is
predicted that the energy consumption of RAN (radio access network) will overtake the
demand for energy by FAN (fixed access network) in the future (EDNA 2019). The use of 2G
and 3G networks is expected to decline over time. It should be emphasized that projections
are based on various assumptions and uncertainties remain, as it is unclear to what extent
efficiency improvements can be achieved.

162
Figure 22: Global energy consumption by category of WAN
Source: EDNA (2019), Page 49
The study by Gröger and Liu (2021) investigated the power consumption of network
components along the path from the access network via the aggregation network to the core
network and further to the data centre. For this purpose, a data stream of 2.2 Mbps was
calculated, which proportionally requires the network components along the transmission path
and to which a share of the respective energy consumption of the components is assigned. If
the total power consumption for this data transmission is taken as a reference, the proportional
energy consumption for each network component is obtained. Table 34 shows this as a value
in percent.
Table 34: Power consumption of network components along a 2.2 Mbps data stream
(in %)
Component VDSL FTTH 4G 5G
Network Access Unit 80% 49% 67% 81%
Network Access Terminal 14% 25% 32% 15%
Broadband Network Gateway 2.1% 9.4% 0.4% 1.2%
Aggregation Switch 1.3% 5.7% 0.2% 0.7%
Core Router 1.5% 6.5% 0.3% 0.8%
Inline Amplifier 0.7% 3.1% 0.1% 0.4%

163
Datacenter Broadband Network Gateway
0.3% 1.1% 0.0% 0.1%
Total 100% 100% 100% 100%
Source: Data calculated from Gröger and Liu 2021
When a data stream is transmitted, the majority of the energy consumption takes place in
the access network. The network access unit and the network access terminal (see Table
34) together account for between 74 percent (FTTH) and 99 percent (4G) of the respective
energy consumption.
ITU-T L.1470 (01/2020) also quantified the electricity consumption and greenhouse gas
(GHG) emissions for the year 2015 and made estimates for 2020, 2025 and 2030 for the global
ICT sector, including data centres, networks, end-user devices (ITU-T L-1470 2020). Figure
23 shows the selected results associated with the global network sector. It is estimated that
the total electricity consumption of networks worldwide will continue to increase. After the base
year 2015, the electricity consumption of mobile networks is expected to still dominate the
entire network (mobile and fixed networks, including manufacturing). The global electricity
consumption associated with manufacturing the mobile network equipment is predicted to
increase. In contrast, the energy consumption of fixed networks is estimated to be relatively
constant from 2020 to 2030. The tracking report by IEA 2020 indicated that energy efficiency
of data transmission networks has improved rapidly. It was estimated that networks consumed
around 250 TWh in 2019. Mobile networks account for two-thirds of them. Electricity
consumption is projected by IEA report to rise to about 270 TWh in 2022.

164
Figure 23: Electricity consumption of global networks including manufacturing and
operation
Source: Oeko-Institut based on ITU-T L.1470, Annex A: Analysis of ICT sector and sub-
sectors trajectories
Energy efficiency metrics concerning the networks, ITU-T L.1315 Standardization terms and
trends in energy efficiency and ITU-T L.1310 Energy efficiency metrics and measurement
methods for telecommunication equipment indicate that an energy efficiency metric can be
defined at three levels:
• Energy efficiency at network level, which evaluates the energy efficiency of an entire
network or parts of it, e.g. the access network, or mobile network. Hence, all equipment
used to build the investigated telecommunication network should be considered.
• Energy efficiency at equipment and system level, which is mostly used to compare
telecommunication equipment of the same technology and similar configuration.
• Energy efficiency at component level, which evaluates the energy efficiency or energy
consumption of individual components. Component-level metrics can help to identify
the hot spots of energy use of each component without considering the context of the
overall equipment.
This classification is used for the following section to distinguish metrics and methodologies
for the ECN, especially at the network level and at the equipment/system level. The
component level is not relevant for this task.
165
Existing standards and methodologies in terms of energy and environmental footprint
of ECN
This task focuses on standards and methodologies for monitoring the environmental footprint
of electronic communications networks and services, particularly energy consumption and
GHG emissions. A desk research was conducted.
SMART 2011/0073 (Mudgal et al. 2013) commissioned by DG CONNECT analysed diverse
methodologies and initiatives for accounting and reporting of GHG emissions for ICT sector.
ICT-specific methodologies/initiatives in terms of telecommunication networks and services
are:
• GHG Protocol137 is the common methodological framework applied by companies,
when they disclose their scope 1, 2 and 3 GHG emissions regarding the Carbon
Disclosure Project (CDP). With the framework of GHG Protocol, the ICT Sector
Guidance for Telecommunication Networked Services (TNS)138 (GHG Protocol ICT
Sector Guidance 2017) was developed to provide guidance and calculation methods
for assessing GHG emissions of for example service platform involving network
equipment and infrastructure used by the service provider to deliver the TNS.
• ITU-T Rec. L.1410 (12/2014) and ETSI ES 203 199 V1.2.1 as a “Methodology for
environmental life cycle assessments of information and communication technology
goods, networks and services” were developed jointly by ETSI TC EE and ITU-T Study
Group 5. It was published respectively by ITU and ETSI as Recommendation ITU-T
L.1410 (ITU-T L.1410 2014) and ETSI Standard ES 203 199 (ETSI ES 203 199
V1.2.1), which are technically-equivalent.
These methodologies are based on the life-cycle thinking (i.e. cradle-to-grave). GHG Protocol
assesses only greenhouse gas emissions, while the method by ITU and ETSI consider
besides climate change as a required category, also other optional environmental impact
categories, e.g. ozone depletion, human toxicity.
Network components are usually shared by different services. An important step in the
assessment of network services is the allocation of the environmental impact of the network
to the specific service under consideration. Allocation is a very challenging step while
calculating shared resources (transmission nodes, core nodes etc.) and further GHG, since
data is often not known. For instance, different telecommunication services are hosted in
parallel in the same access networks or network equipment shared by different virtual
services.
According to the GHG Protocol ICT Sector Guidance – TNS, apportionment may be based
on, for example:
• Usage-based allocation, for example, number of subscribers or amount of data
137 Greenhouse Gas Protocol (GHG Protocol) was jointly convened in 1998 by World Business Council for Sustainable Development (WBCSD) and World Resources Institute (WRI).
138 ICT Sector Guidance built on the GHG Protocol Product Life Cycle Accounting and Reporting Standard, Chapter 2: Guide for assessing GHG emissions Telecommunications Network Services (TNS)
166
• Provisioned capacity, for example, ports or bandwidth
• Mean traffic across a network or equipment
For different network layers, different allocation methods may be appropriate.
ETSI ES 203 199 V1.2.1 (2014-10) and ITU-T Rec. L.1410 recommend a top-down approach,
i.e. it is in most cases more practicable to calculate the overall energy consumption of a
network than to calculate the energy consumption per service. The following allocation
principle of ICT Network data to an ICT Service shall be used based on (ETSI ES 203 199
V1.2.1; ITU-T L.1410 2014) in terms of networks:
• As for access networks, control and core nodes and operator activities: access/active
use time is preferred for circuit-switched networks and data traffic is preferred for
packet-switched networks. Data traffic is also preferred for e.g. mobile access
networks as mobile access networks show a large dependency between data traffic
and energy consumption and need a traffic model that takes data traffic into account.
• As for transport equipment: allocation shall be conducted based on data traffic.
• As for data centres and service provider activities: allocation shall be based on number
of subscriptions and service users or amount of data/transactions
Allocation requirements are described in the methodologies. However, more practical
research on application is needed to examine whether the allocation rules can be actually
applied in the reality.
The following standardization bodies and institutions are crucial for the development of
standards and measurement methodologies in terms of energy and environmental impacts of
ECN:
• ITU: International Telecommunication Union
The International Telecommunication Union (ITU) is the United Nations specialized
agency in the field of telecommunications, information and communication
technologies (ICTs). The ITU Telecommunication Standardization Sector (ITU-T)
Study Group 5 (SG5) is responsible for studies on methodologies for evaluating ICT
effects on climate change and for the publication of guidelines for the eco-friendly use
of ICTs139.
ITU recommendations are available for free.
• ETSI: European Telecommunications Standards Institute
ETSI is recognized as a European Standards Organization that supports European
regulations and legal provisions by creating harmonised European Standards. ETSI
creates specifications (e.g. Technical Specifications TS; Group Specifications GS),
standards (e.g. European Standard EN, ETSI Standard ES), reports (e.g. Technical
report TR, Special Report SP) and guidelines (e.g. ETSI Guide). ETSI Standards can
be downloaded free of charge.
139 https://www.itu.int/en/ITU-T/about/groups/Pages/sg05.aspx
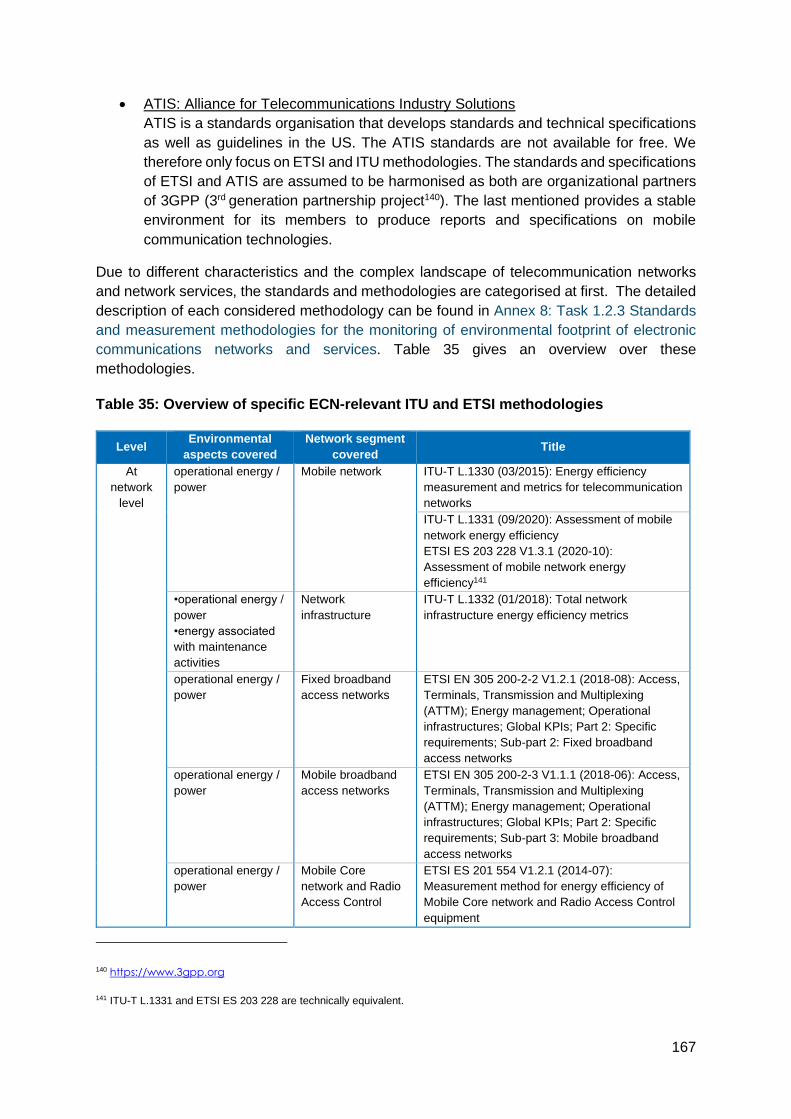
167
• ATIS: Alliance for Telecommunications Industry Solutions
ATIS is a standards organisation that develops standards and technical specifications
as well as guidelines in the US. The ATIS standards are not available for free. We
therefore only focus on ETSI and ITU methodologies. The standards and specifications
of ETSI and ATIS are assumed to be harmonised as both are organizational partners
of 3GPP (3rd generation partnership project140). The last mentioned provides a stable
environment for its members to produce reports and specifications on mobile
communication technologies.
Due to different characteristics and the complex landscape of telecommunication networks
and network services, the standards and methodologies are categorised at first. The detailed
description of each considered methodology can be found in Annex 8: Task 1.2.3 Standards
and measurement methodologies for the monitoring of environmental footprint of electronic
communications networks and services. Table 35 gives an overview over these
methodologies.
Table 35: Overview of specific ECN-relevant ITU and ETSI methodologies
Level Environmental
aspects covered
Network segment
covered Title
At
network
level
operational energy /
power
Mobile network ITU-T L.1330 (03/2015): Energy efficiency
measurement and metrics for telecommunication
networks
ITU-T L.1331 (09/2020): Assessment of mobile
network energy efficiency
ETSI ES 203 228 V1.3.1 (2020-10):
Assessment of mobile network energy
efficiency141
•operational energy /
power
•energy associated
with maintenance
activities
Network
infrastructure
ITU-T L.1332 (01/2018): Total network
infrastructure energy efficiency metrics
operational energy /
power
Fixed broadband
access networks
ETSI EN 305 200-2-2 V1.2.1 (2018-08): Access,
Terminals, Transmission and Multiplexing
(ATTM); Energy management; Operational
infrastructures; Global KPIs; Part 2: Specific
requirements; Sub-part 2: Fixed broadband
access networks
operational energy /
power
Mobile broadband
access networks
ETSI EN 305 200-2-3 V1.1.1 (2018-06): Access,
Terminals, Transmission and Multiplexing
(ATTM); Energy management; Operational
infrastructures; Global KPIs; Part 2: Specific
requirements; Sub-part 3: Mobile broadband
access networks
operational energy /
power
Mobile Core
network and Radio
Access Control
ETSI ES 201 554 V1.2.1 (2014-07):
Measurement method for energy efficiency of
Mobile Core network and Radio Access Control
equipment
140 https://www.3gpp.org
141 ITU-T L.1331 and ETSI ES 203 228 are technically equivalent.

168
Level Environmental
aspects covered
Network segment
covered Title
At
equipment
and
system
level
Operational energy /
power
Mobile network:
base station site
ITU-T L.1350 (10/2016): Energy efficiency
metrics of a base station site
Operational energy /
power
Mobile network:
radio access
network
ETSI EN 303 472 V1.1.1 (2018-10): Energy
efficiency measurement methodology and
metrics for RAN equipment
Operational energy /
power
Mobile network:
access equipment
ETSI ES 202 706-1 V1.6.0 (2020-11): Metrics
and measurement method for energy efficiency
of wireless access network equipment; Part 1:
Power consumption - static measurement
method
Operational energy /
power
Mobile network:
access equipment
ETSI TS 102 706-2 V1.5.1 (2018-11): Metrics
and measurement method for energy efficiency
of wireless Access Network Equipment; Part 2:
Energy Efficiency - dynamic measurement
method
Operational energy /
power
Fixed network ETSI EN 303 215 V1.3.1 (2015-04):
Measurement methods and limits for power
consumption in broadband telecommunication
network equipment
Operational energy /
power
Fixed network: all
the transmission
equipment
connected to the
network by means
of wired medium
(i.e. copper or fiber),
typically running at
the network OSI
level 1 and OSI
level 2
ETSI ES 203 184 V1.1.1 (2013-03):
Measurement methods for Power Consumption
in Transport Telecommunication Networks
Equipment
Operational energy /
power
General networks ITU-T L.1310 (09/2020): Energy efficiency
metrics and measurement methods for
telecommunication equipment
Operational energy /
power
General networks:
routers and
switches
ETSI ES 203 136 V1.2.1 (2017-10):
Measurement methods for energy efficiency of
router and switch equipment
Operational energy /
power
Virtualized network
functions and
infrastructure
ITU-T L.1361 (11/2018): Measurement method
for energy efficiency of network functions
virtualization
ETSI ES 203 539 - V1.1.1 (2019-06) -
Environmental Engineering (EE); Measurement
method for energy efficiency of Network
Functions Virtualisation (NFV) in laboratory
environment142
Management of
WEEE
calculation of
recycling and
recovery rates
General ICT
equipment
ETSI EN 305 174-8 V1.1.1 (2018-01): Access,
Terminals, Transmission and Multiplexing
(ATTM);
Broadband Deployment and Lifecycle Resource
Management; Part 8: Management of end of life
of ICT equipment (ICT waste/end of life)
Source: Oeko-Institut
142 ITU-T L.1361 and ETSI ES 203 539 are technically equivalent.

169
Table 36 specifies the corresponding metrics applied in ITU and ETSI methodologies
Table 36: Description of metrics applied in ITU and ETSI methodologies
Level Network and
Equipment Title Metrics used
At
network
level
Mobile network:
ITU-T
L.1331143
(09/2020)
ETSI ES 203
228 V1.3.1
(2020-10)
• Mobile network (MN) data energy efficiency (EEMN,DV)
[bit/J]:
the ratio between the data volume (DVMN) and the
energy consumption (ECMN)
• Mobile network coverage energy efficiency (EEMN,CoA)
[m2/J]:
the ratio between the area covered by the MN under
investigation and the energy consumption when
assessed for one year
• Latency based metric (EEMN,L) [ms-1/J]
is the inverse ratio of the end-to-end user plane latency
and the energy consumed by the MN.
• Site energy efficiency (SEE):
the ratio between the ratio of "IT equipment energy" and
"Total site energy" including rectifiers, cooling, storage,
security and IT equipment.
• Provides a method to extrapolate the assessment of
energy efficiency from sub-network to total networks
based on demography (5 classes: dense urban, urban,
suburban, rural, unpopulated), topography (3 classes:
Flat, Rolling, Mountainous) and climate classifications (5
classes: Tropical, dry, temperate, cold, polar).
Total network
infrastructure
ITU-T
L.1332
(01/2018)
Total network infrastructure energy efficiency definition
(NIEE):
The ratio between ICT load energy consumption and
total energy consumption of the network. When
reporting metric values, network site owners should use
the average NIEE measured over a one-year period to
get an averaged value.
Fixed broadband
access networks
ETSI EN
305 200-2-2
V1.2.1
(2018-08)
KPIEM consists of KPIEC, KPITE and KPIREN
• KPI of energy consumption, KPIEC [Wh]: total energy
consumption by fixed access network site (Operator
Site, Network Distribution Node sites, Last Operator
Connection sites)
• KPI for task effectiveness, KPITE [bits/Wh]
The ratio between the data volumes (both upstream and
downstream data) and KPIEC
• KPI for renewable energy contribution, KPIREN [%]
Share of renewable energy generated on-site at
Operator Site, Network Distribution Node sites, Last
Operator Connection sites
Mobile
broadband
access networks
ETSI EN
305 200-2-3
V1.1.1
(2018-06)
KPIEM consists of KPIEC, KPITE and KPIREN
• KPI of energy consumption, KPIEC [Wh]: total energy
consumption by fixed access network site (Operator
Site, Network Distribution Node sites)
143 ITU-T L.1331 Assessment of mobile network energy efficiency is regarded as an advanced version of ITU-T L.1330. ITU-T L.1331 introduces new requirements for 5G New Radio (NR). ITU-T L.1330 (03/2015) is therefore not represented to avoid repetition. The detailed description can be found in the Annex.

170
Level Network and
Equipment Title Metrics used
• KPI for task effectiveness, KPITE [bits/Wh]
The ratio between the data at base stations and KPIEC
• KPI for renewable energy contribution, KPIREN [%]
Share of renewable energy generated on-site at
Operator Site, Network Distribution Node sites
Mobile Core
network and
Radio Access
Control
equipment
ETSI ES 201
554 V1.2.1
(2014-07)
Energy Efficiency Ratio (EER) [Erlang/W | PPS/W |
Subscribers/W | SAU/W]:
• The ratio between useful output and average power
consumption.
• Useful output can be the number of Erlang (Erl),
Packets/s (PPS), Subscribers (Sub), Simultaneously
Attached Users (SAU)
• Average power consumption is measured at low,
medium, and high load levels.
At
equipment
and
system
level
At base station
site
ITU-T
L.1350
(10/2016)
Site energy efficiency (SEE) [%]:
The ratio between the total energy consumption of
telecommunication equipment and the total energy
consumption on site consisting of electric energy from
the public grid and locally produced electrical energy.
Base stations
(BS)
ETSI EN
303 472
V1.1.1
(2018-10)
• Capacity energy efficiency KPI (KPIEE-capacity) [Mbits/Wh]:
The ratio between data volume of the BS and the total
energy consumption of the BS site including the support
infrastructure
• Coverage energy efficiency KPI (KPIEE-coverage) [km2/Wh]:
The ratio between coverage area of the BS and the total
energy consumption of the BS site including the support
infrastructure
• Site energy efficiency KPI (KPIEE-site) [%]:
The ratio between the total energy consumption of all
the BS equipment at the site and the total energy
consumption of the BS site
• Extended BS total renewable energy KPI (KPIREN-tot) [%]:
the fraction of the electricity used by an extended BS
site that has been supplied by renewable resources
• Extended BS on-site renewable energy KPI (KPIREN-
onsite) [%]:
The fraction of electricity generated from renewable
energy at a site vs. the total electricity generated at a
site
Base stations
under static test
conditions
ETSI ES 202
706-1 V1.6.0
(2020-11)
Average power consumption [W] is measured with pre-
defined and fixed three load levels (low, medium, busy-hour
loads) under given reference configuration.And daily energy
consumption [Wh] of BS is calculated.
LTE Base
stations under
dynamic test
conditions
ETSI TS 102
706-2 V1.5.1
(2018-11)
Base Station Energy Efficiency (BSEP) [bits/Wh]:
The ratio between the measured data volume in bits for
low, medium and busy-hour load level and the total
energy consumption of the base station which results
from the weighted energy consumption for each traffic
level i.e. low, medium and busy-hour traffic.
DSLAM DSL,
MSAN, GPON
OLT and Point to
Point OLT
equipment.
ETSI EN
303 215
V1.3.1
(2015-04)
Power consumption per port of broadband network
equipment, PBBport [W/port]:
Power consumption (in W) of a fully equipped
broadband network equipment, measured at the electric
power input interface pro maximum number of ports
served by the broadband network equipment

171
Level Network and
Equipment Title Metrics used
The transmission
equipment
connected to the
network by
means of wired
medium
ETSI ES 203
184 V1.1.1
(2013-03)
Transport Equipment Energy Efficiency Ratio (EEER)
[Mbps/W]:
• The ratio between total capacity of a defined
configuration (the sum of the interface data rates
[Mbps]) and power consumption of a defined
configuration [Watt].
• The power consumption considers three different levels
of load (0%, 50%, 100%)
•DSLAM, MSAM
GPON GEPON
equipment144
ITU-T
L.1310
(09/2020)
Pport [W/port]: the power (in watts) of a fully equipped wireline
network equipment with all its line cards working in a specific
profile/state pro maximum number of ports served by the
broadband network equipment
•Wireless access
technologies:
Radio base
stations (RBS) at
static load: GSM,
UMTS and LTE
ITU-T
L.1310
(09/2020)
energy efficiency metric at RF (radio frequency) unit level,
EERFU:
The ratio between daily RF output energy consumption
[Wh] under different loads and daily RF units energy
consumption [Wh] under different loads (low, medium,
busy-hour loads)
•Wireless access
technologies:
LTE RBS at
dynamic load
ITU-T
L.1310
(09/2020)
Energy efficiency of an RBS [bits/Wh]:
The ratio between the work done in terms of delivered
bits to the UEs and the consumed energy for delivering
these bits.
•Routers,
Ethernet
switches
ITU-T
L.1310
(09/2020)
Energy efficiency rating (EER) [Mbit/s/W]:
• The ratio between weighted throughput [Mbit/s] and
weighted power [W]
• Power and throughput measured at respective utilization
levels (3 levels) depending on routers and switches.
•WDM/TDM/OTN
transport
MUXes145
/switches
ITU-T
L.1310
(09/2020)
Transport Equipment Energy Efficiency Ratio (EEER)
[Mbps/W] (the same as ETSI ES 203 184)
•Converged
packet optical
equipment
ITU-T
L.1310
(09/2020)
Energy Efficiency Ratio (EER) [bps/W]:
• Maximum throughput per average power consumption.
• Average power consumption is measured power
consumption (W) at a 0% and 100% data traffic
utilization
• Core, edge and
access routers
• Ethernet
switches
ETSI ES 203
136 V1.2.1
(2017-10)
Energy Efficiency Ratio of Equipment (EEER) [Gbps/Watt]
The ratio between Total weighted throughput and the
weighted power for different traffic loads (low, medium
and high)
Network
functions
virtualization
(NFV)
ITU-T
L.1361
(11/2018)
ETSI ES 203
539 - V1.1.1
(2019-06)
• The VNF (virtualized network functions) energy
efficiency ratio (EER) [bps/W | PPS/W | Subscribers/W]:
The ratio between useful output and power
consumption. The useful output can be throughput (e.g.
bps), packet per second (PPS), or capacity (e.g. number
of subscribers or sessions)
• The VNF (virtualized network functions) resource
efficiency ratio (RER) [bps/W | PPS/W | Subscribers/W]:
144 digital subscriber line access multiplexer (DSLAM), multiservice access node (MSAN), gigabit passive optical network (GPON) and gigabit Ethernet passive optical network (GEPON), Optical Line Termination (OLT)
145 wavelength division multiplexing (WDM), Time Division Multiplex (TDM), Optical Transport Network (OTN), Multiplexer (MUX)

172
Level Network and
Equipment Title Metrics used
The ratio between useful output and resource
consumption.
Resource consumption of virtual machines (VMs) is
specified as CPU capacity, total memory used, total
storage used and the sum of average network
throughput of bytes transmitted and received per
second.
• The NFV infrastructure (NFVI) energy efficiency ratio
(EER)
the ratio of useful output of VNFs and power
consumption of NFVI platform with VNF deployed
WEEE within ICT
sites, core and
access networks
ETSI EN
305 174-8
V1.1.1
(2018-01)
Recycling and recovery rates [%] based on the weight of the
WEEE
Source: Oeko-Institut
A useful work concept for network equipment according to ITU-T L. 1315 (05/2017) or ETSI
Standard ETSI ES 203 475 v1.1.1 (2017-11) is depictured in Figure 24.
Figure 24: Useful work concept for ICT based on ITU T-L 1315 and ETSI ES 203 475:
Standardization terms and trends in energy efficiency
Source: Oeko-Institut
In terms of end-user perspective, ITU-T L.1315 also lists some indicators describing the
“useful work” related to the applications to a network. That could be:
• Number of users,
• Service per user,
• Level of oversubscription,
• Total network egress traffic,

173
• Combinations of the above.
ETSI ES 201 554 V1.2.1 (2014-07) and ITU-T L. 1361 (11/2018) specify that useful output
could be expressed as Subscribers (Sub) or Simultaneously Attached Users (SAU) also for
functions which normally have the maximum capacity expressed in Erlang146 (Erl) or Packets/s
(PPS).
Task 1.2.4: Assessment of the suitability of indicators from consumer perspective
Aim of this task
The focus of this task is to investigate the suitability of possible indicators for electronic
communications services, in view of communicating them to end-users, who could make
informed choices on their service provider and on their service consumption.
Methodological approach
In order to achieve a transformation of the telecommunications sector towards energy-efficient
and environmentally friendly products, several approaches are possible in principle (see
Figure 25). The figure shows the hypothetical distribution of products of different sustainability
on the market. The aim of governance instruments is to increase the number of sustainable
products and thus - figuratively speaking - to shift the curve to the right. The instruments act
at different points of the distribution curve. Firstly on the left side, by setting minimum
requirements for market entry (e.g. ecodesign). Secondly in the middle in the mainstream
market (with the most products) by transparency measures and product labelling requirements
(e.g. energy efficiency labels) to trigger competition between products and companies. Thirdly
on the right side by highlighting innovative practices (e.g. through eco-label) and targeted
promotion of green technologies (e.g. through green public procurement).
146 Erlang: Average number of concurrent calls carried by the circuits (ITU-T L.1361, Clause 3.2.5)

174
Figure 25: Policy mix for more sustainable products
Source: Oeko-Institut based on European Commission, DG Environment
In creating more transparency, a distinction can be made between company-wide approaches
on the one hand (e.g. CSR reports), which primarily target business customers and financial
investors, and approaches that target individual products and their consumers on the other
hand. The effectiveness of the latter point (consumer decision) is linked to certain
preconditions that must be fulfilled.
Technical preconditions are:
• Existing methodologies and standards to monitor and calculate the environmental
impacts of telecommunication products (task 1.2.3 of this study),
• significant difference of energy (or environmental) performance in the range of
products (which can only be answered when there is a sufficient number of
benchmarks of the same product category that allow a comparison to be made),
• technical feasibility of providing information in the level of detail (granularity) required
by consumers (early feedback from telecom providers suggests that it is very difficult
to allocate the company's total energy consumption to individual services, as the main
energy consumption consists of a base load and the additional consumption for
individual services is lost in the overall noise.),
• consumer has a choice of different products, between which he can easily and
regularly select.
Furthermore, there are several consumer-related preconditions. Such preconditions can be
derived from the evaluation of previous policy practice, especially the EU Energy Label which
has been extremely well researched. Core preconditions are:
• Consumers view energy efficiency / energy savings in that product as a relevant
characteristic and potential purchase criterion.

175
• For home appliances, this has repeatedly shown to be the case - presumably due to
a long history of campaigning by various state and NGO actors in combination with
the fact that significant amounts of money could be saved. (forsa 2009; Waide and
Watson 2013)
• For electronics, the relevance of energy efficiency has been shown to be lower,
because functionality and novelty aspects are weighted higher. (Consumer Focus
2012)
• Functionality (or other consumer relevant properties) is similar for products that differ
in their energy / environmental performance levels (that is, energy efficiency or other
positive environmental properties are interesting as an “add-on” if the core functionality
is fulfilled). (Ipsos MORI et al. 2012)
• The information about energy performance is communicated in a simple and visually
appealing way. For the EU Energy label, it has been shown that the colour coding in
combination with the alphabetical class names have been the decisive success factor
(London Economics and IPSOS 2014; Ipsos MORI et al. 2012; Molenbroek et al. 2013;
Waide and Watson 2013). The ease of recognition of the efficiency classes directs
consumer choice even in cases where there is little actual difference in energy
performance (Andor et al. 2017).
• The information is communicated by a trusted source (forsa 2009; Waide and Watson
2013).
The research therefore focuses on the question of how these core preconditions can be met
by a label or metric for telecommunication services. The choice of the exact indicator should
be a sub-question of the question, how information can be presented in a simple and visually
appealing way.
Desk research
In the literature many studies can be found on how to raise energy awareness in different
target groups. For this study we focused on the Precede-Proceed planning model Green and
Kreuter (1999) for developing policy interventions that was adapted by Egmond et al. (2005)
for energy related behaviour. The model consists of three phases:
• Phase 1: diagnosing the relevant changes in behaviour and environment to meet policy
goals;
• Phase 2: assessing the corresponding determinants;
• Phase 3: choosing the matching instruments.
The intention to save energy was found to be formed by predisposing factors, like awareness,
knowledge, norms, attitude and self-efficacy (Rivas Calvete et al. 2016). They are further
influenced by so called “enabling factors” like financial resources, technical resources, new
skills and intensified or weakened by “reinforcing factors” feedback from peers, advice from
experts, subsidies and regulations from authorities. Policies reach their goals if they are able
to correctly identify the action point and the susceptibility of their information targets. Rivas
Calvete et al. (2016) mentions three classical approaches:
• the price-based approach: save money;
• the environmental approach: save the planet
• and the social approach: be a good citizen.

176
Following Egmond's (2005) model, the objective should first be identified. The objective of a
con-sumer-oriented policy instrument would be that consumers:
• Choose the most energy-efficient network connection (e.g. fibre if available).
o Intended impact: Telecommunications service providers should be motivated
by the eventually stronger demand from consumers for more energy-efficient
connections compared to less efficient connections to design their network
connection technology to be energy-efficient as quickly as possible and thus
gain a market advantage. In this context, it is certainly necessary to consider
how much optimisation potential the respective connection types offer in
themselves (e.g. potentially more energy-efficient technology for the provision
of a cable connection for a provider who specialises in cables) and which
technological leaps are thus virtually predetermined, depending on local
availability.
• Select a provider that offers services in a particularly energy-efficient way (indicator
e.g. energy consumption per hour telephoning, energy consumption per Gigabyte data
transfer etc.).
o Intended impact: Telecommunications service providers should be motivated
to design the technology required for the services offered as energy-efficiently
as possible or, if they are not responsible for the technologies themselves, to
work towards making them as energy-efficient as possible. In this way, they
can present themselves to their customers as best practice.
How energy-efficient the respective solutions are or which more or less high annual electricity
con-sumption the two decisions lead to has no influence on the electricity consumption and
the electricity bill of the consumers themselves. Electricity consumption only takes place at
the telecommunications service provider or in the network. In this respect, consumers do not
feel any consequences of their decision, which a policy instrument could potentially link to. For
example, a presentation of costs or cost savings would not be possible. However, it would be
possible to build on the increasing awareness of the dangers of climate change and thus
achieve a willingness to act on the part of consumers. European Commission (2019a) found
for EU28 that 79% of European citizens think that climate change is a very serious problem,
an increase of five points since 2017. A share of 60% of respondents say they have personally
taken action to fight climate change in the past six months, an increase of 11 points since
2017.
In another recent survey commissioned by the European Commission (2021b) specifically on
e-communications, respondents were asked whether the environmental footprint of
communication services would have an impact on their choice of the provider or whether this
would influence their usage behaviour. 44 percent of around 27 thousand respondents from
27 member states answered that they would definitely (10%) or probably (34%) take this
information into account. 51 per cent, on the other hand, said they would definitely not (19%)
or probably not (32%) consider such information. Five percent of the respondents answered
“do not know”.
According to Egmond and Bruel (2007) policy instruments that focus on information and
promotion – like a potential energy label for telecommunication services that is introduced with
a large campaign – have a primary effect on awareness and attitudes of their target group (in

177
this case consumers). As second effect is that they also influence knowledge, subjective
norms and self-efficiency.
Decision-making environment: The decision for a specific network connection (e.g. DSL) is a
decision that is not often made by consumers. Typical occasions are a move or the arrival of
a previously unavailable network technology in the neighbourhood with a potentially higher
benefit than previously available technologies (e.g. fibre). Consumer research (Define 2017,
Hurtado and Paralera 2016) has shown that for consumers, the network connection
technology itself is not a priority in their decision for a specific tariff. Rather, the price-
performance ratio of the telecommunication providers' tariffs with the parameters price, speed,
reliability, capping, bundling of services counts. In general, consumers have a low level of
knowledge in this area and do not want to spend more time than absolutely necessary
choosing the most suitable tariff for them. Given the confusing variety of many different tariffs
with difficult to compare services and bundling, it is cumbersome for consumers to decide.
How do consumers make their decision for a broadband connection?
From two studies that could be identified on the purchase decision of consumers on
broadband (Define (2017) for UK, Hurtado and Paralera (2016) for Spain) the following
conclusions can be drawn:
• For consumers it is difficult and cumbersome to compare the different broadband offers
and to take the decision for the most beneficial offer.
• Consumers are not engaged in broadband and usually have a low knowledge level.
Consumers consider broadband as an utility that should work in the background but
should not need further attention.
• From the perspective of consumers, a broadband service should meet the needs of
consumers at the best price. Criteria that reflect the needs of consumers are reliability,
speed, data allowances and bundles (e.g. internet and TV). Price ist the most important
single criterion.
• The type of connection, e.g. fibre, seems not to be of priority for consumers decision.
• Energy efficiency, energy consumption, greenhouse gas emissions or other
environmental impacts seem not to be related to consumer’s decisions. Doubts must
be raised that consumers do connect energy consumption etc. at all to broadband.
Against this background it will not be easy to inform end-users concerning energy efficiency
for broadband. In order to communicate environmental information together with broadband
services, it will therefore be important to deliver very simple and intuitively understandable
information to consumers.
Possible approaches to communicate the environmental footprint of electronic
communications networks and services
Reporting at company level
One approach that many electronic communications network providers already follow with
their annual reports (see Task 1.2.1) is to disclose how much energy they consume in total as
a company, what is their share of renewable energies and which CO2 emissions are related
to this. For this purpose companies refer mainly to the Global Reporting Initiative (GRI),

178
Greenhouse Gas Protocol (GHGP) or the results of energy management according to ISO
14 001 or ISO 50 001 as suitable methods of accounting.
• Annual energy consumption of the company [MWh/a]
If applicable, further differentiated by energy source (e.g. electrical energy, district or
local heating, diesel, petrol, etc.) and geographical allocation of business operations
(e.g. per country).
• Share of renewable energies in annual energy consumption [%]
If applicable, further differentiated according to type of renewable energy source
(electricity from hydropower, wind power, photovoltaics, solar heat, biomass).
• Annual CO2 emissions of the company [tonnes CO2-eq/a]
If applicable, further differentiated by geographical allocation of business operations
(e.g. per country)
These figures would provide a good basis for getting to know the energy consumption of the
electronic communications networks and services sector better and for compiling central
statistics. The goal of achieving climate neutrality in this sector could then be monitored, for
example by regulatory authorities. For consumers themselves, however, these figures are not
very meaningful, as they do not allow for a comparison of companies and do not provide any
information on the efficiency or environmental friendliness of their business model (except
perhaps for the share of renewable energy).
Reporting at the level of subscribers
In order to access the internet or make telephone calls, there are several technical access
options, each of which require different amounts of energy (mobile telephony of different
generations, fixed network access with fibre optics, VDSL, broadband cable). The customer
of this service decides which provider to contract and which access technology to use. The
analysis of the energy consumption of a data transmission along the different network levels
shows that the highest energy consumption per data volume takes place in the access network
(see Figure 22 and Table 34). When a data stream is transmitted the network access unit and
the network access terminal together account for between 74 percent (FTTH) and 99 percent
(4G) of the energy consumption for the whole data transfer. To reduce the complexity of
calculating the energy consumption of data transmission, information could therefore (at first)
only be provided on the energy consumption of the access network. This would already make
it possible to distinguish between different access options (e.g. broadband cable or fibre
optics) and different providers.
Box 7: Reference units in the formation of key figures (e.g. subscribers or service units)
By using reference units, key figures can be presented in such a way that they are intuitively
understood by end-users. For example, energy consumption is easier to understand if it is
related to a single product and its use over a period of one year, rather than to a company
as a whole or to a large number of activities. In the methodology of life cycle assessment
(ISO 14040), a "functional unit" is chosen for this purpose, which describes the scope for
the environmental impacts of a product as precisely as possible. The same procedure must
be chosen for the indicators proposed here. If "per subscriber" or "per service unit" is

179
mentioned here, it must be determined in the development of methodology for the specific
key figure (which exceeds the present study) which physical quantities this respective
reference value comprises. For example, a "subscriber" could be defined on the basis of
average values of all telecommunication customers in a certain time period, describing a
certain amount of transmitted data, online times, connections and number of connected
devices. This reference functional unit must be defined uniformly and taken into account in
the same way by all ECN providers when calculating the key figures. The same procedure
is used for the reference values that refer to the service units. For example, for 1 hour of
video streaming, it must be specified which data volume is transmitted during one hour (e.g.
2 GByte/h ) or with which screen resolution is streamed (e.g. full-HD 1920 x 1080 pixel).
Even if in individual cases the service is used with less data transmission, the uniform
reference values make it possible to compare the efficiency of different services with each
other.
The simplest way to express this environmental footprint of a electronic communication
network is to disclose the average electrical power consumption of the access network. To
distinguish between different access technologies, the power consumption per customer can
be given by the provider, for example “6 Watts per subscriber” (hypothetical number) for a
VDSL-Access (more examples see Figure 26). At the level of the aggregation network and the
core network, the technology is shared between different network access technologies and
sometimes even between different providers, so it is not possible to allocate the energy
consumption directly to different customers. These shared infrastructures will have to be
allocated by a general approach, possibly by the transmitted data.
• Power consumption of access network per subscriber [W]
Differentiated by network access technology (e.g. UMTS, LTE, 5G, Satellite, VDSL,
FTTH, Cable). Calculated for example from the total power comsumption of the access
network per technology devided by the number of customers per technology
Although this "per subscriber" approach seems simple and plausible at first glance, there are
also some difficulties and concerns about whether it can really represent the efficiency of a
telecom provider well. As described in Box 7, it is important to define a suitable "functional
unit", which in the case of a “subscriber” could be an average user or a user with a defined
data volume and online times.
In order to realise an appealing presentation of these numerical values for consumers, the
respective watt values (power consumption of the service per subscriber) or other efficiency
values (e.g. energy intensity or carbon footprint of data transmission) could be put into a colour
scale, comparable to the well-known EU energy efficiency label. For example, the following
values would be possible as a distinction:

180
Figure 26: Example for energy efficiency label for access network
Energy efficiency colour scale
E.g. Power
consumption of the service per subscriber
E.g. Energy intensity of data transmission
E.g. Carbon footprint of data
transmission
< 1 Watt < 1 Wh/GByte < 1 g CO2-eq/GByte
< 2 Watt < 2 Wh/GByte < 2 g CO2-eq/GByte
< 4 Watt < 4 Wh/GByte < 4 g CO2-eq/GByte
< 8 Watt < 8 Wh/GByte < 8 g CO2-eq/GByte
< 16 Watt < 16 Wh/GByte < 16 g CO2-eq/GByte
< 32 Watt < 32 Wh/GByte < 32 g CO2-eq/GByte
≥ 32Watt ≥ 32 Wh/GByte ≥ 32 g CO2-eq/GByte
As supplementary information, this label could additionally indicate the type of access
technology, the upload and download speed and the share of renewable energy.
Reporting at the level of services
A further level of detail could be given by the information of the environmental footprint per
service unit. If one follows a data stream from the consumer to the data centre (and back
again), a number of network components are used, which in turn consume energy. Some
companies already describe their energy consumption by the so-called "energy intensity",
which represents the energy consumption per amount of data transmitted [kWh/GB]. By using
the respective service for the amount of data, this calculation is also possible at service level:
energy consumption per hour of telephony, per hour of video call or per hour of video
streaming.
Companies could therefore select from a catalogue of possible services those that they
predominantly offer and calculate the energy consumption associated with each service. If
new services are invented (e.g. the processing of voice messages through speech
recognition), the ECNs must determine the amount of data transmitted and specify the energy
consumption in the network.
• Energy consumption per service unit [Wh/Service_unit]
o Voice telephony [Wh/h]
o Video telephony [Wh/h]
o Video streaming [Wh/h]
o Data transmission [Wh/GB]
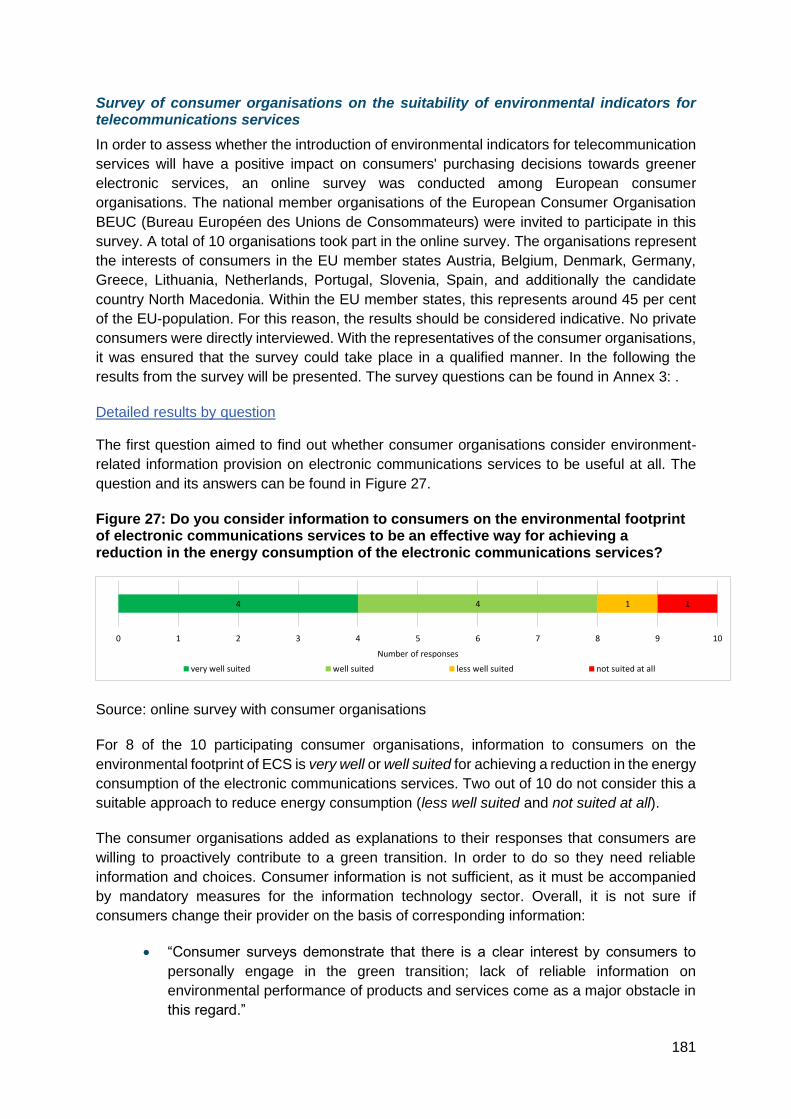
181
Survey of consumer organisations on the suitability of environmental indicators for telecommunications services
In order to assess whether the introduction of environmental indicators for telecommunication
services will have a positive impact on consumers' purchasing decisions towards greener
electronic services, an online survey was conducted among European consumer
organisations. The national member organisations of the European Consumer Organisation
BEUC (Bureau Européen des Unions de Consommateurs) were invited to participate in this
survey. A total of 10 organisations took part in the online survey. The organisations represent
the interests of consumers in the EU member states Austria, Belgium, Denmark, Germany,
Greece, Lithuania, Netherlands, Portugal, Slovenia, Spain, and additionally the candidate
country North Macedonia. Within the EU member states, this represents around 45 per cent
of the EU-population. For this reason, the results should be considered indicative. No private
consumers were directly interviewed. With the representatives of the consumer organisations,
it was ensured that the survey could take place in a qualified manner. In the following the
results from the survey will be presented. The survey questions can be found in Annex 3: .
Detailed results by question
The first question aimed to find out whether consumer organisations consider environment-
related information provision on electronic communications services to be useful at all. The
question and its answers can be found in Figure 27.
Figure 27: Do you consider information to consumers on the environmental footprint of electronic communications services to be an effective way for achieving a reduction in the energy consumption of the electronic communications services?
Source: online survey with consumer organisations
For 8 of the 10 participating consumer organisations, information to consumers on the
environmental footprint of ECS is very well or well suited for achieving a reduction in the energy
consumption of the electronic communications services. Two out of 10 do not consider this a
suitable approach to reduce energy consumption (less well suited and not suited at all).
The consumer organisations added as explanations to their responses that consumers are
willing to proactively contribute to a green transition. In order to do so they need reliable
information and choices. Consumer information is not sufficient, as it must be accompanied
by mandatory measures for the information technology sector. Overall, it is not sure if
consumers change their provider on the basis of corresponding information:
• “Consumer surveys demonstrate that there is a clear interest by consumers to
personally engage in the green transition; lack of reliable information on
environmental performance of products and services come as a major obstacle in
this regard.”
4 4 1 1
0 1 2 3 4 5 6 7 8 9 10
Number of responses
very well suited well suited less well suited not suited at all
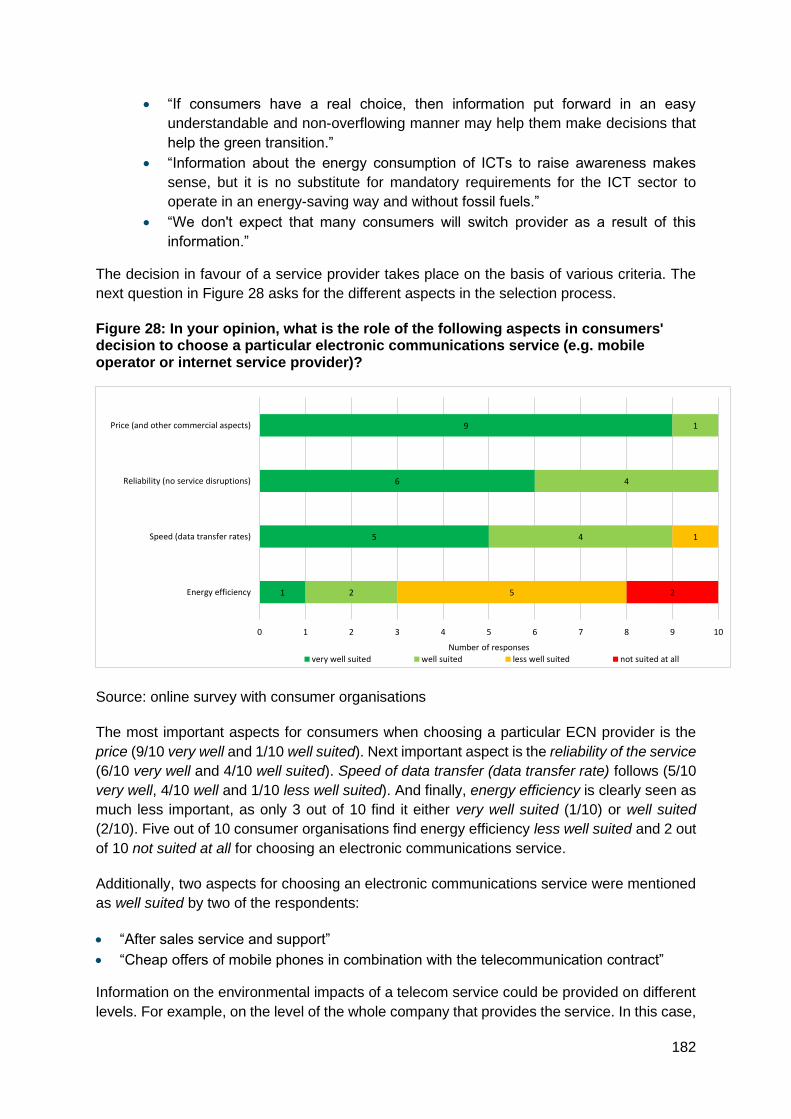
182
• “If consumers have a real choice, then information put forward in an easy
understandable and non-overflowing manner may help them make decisions that
help the green transition.”
• “Information about the energy consumption of ICTs to raise awareness makes
sense, but it is no substitute for mandatory requirements for the ICT sector to
operate in an energy-saving way and without fossil fuels.”
• “We don't expect that many consumers will switch provider as a result of this
information.”
The decision in favour of a service provider takes place on the basis of various criteria. The
next question in Figure 28 asks for the different aspects in the selection process.
Figure 28: In your opinion, what is the role of the following aspects in consumers' decision to choose a particular electronic communications service (e.g. mobile operator or internet service provider)?
Source: online survey with consumer organisations
The most important aspects for consumers when choosing a particular ECN provider is the
price (9/10 very well and 1/10 well suited). Next important aspect is the reliability of the service
(6/10 very well and 4/10 well suited). Speed of data transfer (data transfer rate) follows (5/10
very well, 4/10 well and 1/10 less well suited). And finally, energy efficiency is clearly seen as
much less important, as only 3 out of 10 find it either very well suited (1/10) or well suited
(2/10). Five out of 10 consumer organisations find energy efficiency less well suited and 2 out
of 10 not suited at all for choosing an electronic communications service.
Additionally, two aspects for choosing an electronic communications service were mentioned
as well suited by two of the respondents:
• “After sales service and support”
• “Cheap offers of mobile phones in combination with the telecommunication contract”
Information on the environmental impacts of a telecom service could be provided on different
levels. For example, on the level of the whole company that provides the service. In this case,
1
5
6
9
2
4
4
1
5
1
2
0 1 2 3 4 5 6 7 8 9 10
Energy efficiency
Speed (data transfer rates)
Reliability (no service disruptions)
Price (and other commercial aspects)
Number of responses
very well suited well suited less well suited not suited at all

183
a company can present on a corporate level what efforts it is making to reduce its
environmental impact (e.g. average values across all customers). One level below is the
presentation of the respective environmental impacts at the level of services (e.g. internet
access via fibre, mobile access via 4G). If a company offers several services, this value would
differ per service. Other reference units for the respective environmental impacts are also
conceivable (e.g. service units, such as 1 hour of use of a service). Consumer organisations
were asked at which level the environmental information should be provided (see Figure 29).
Figure 29: To which level should the information on environmental impacts refer?
Source: online survey with consumer organisations
Concerning the level of information, eight out of 10 consumer organisations indicated that it
should refer to the specific service, while four organisations tie it also to the level of the provider
or company (double mentions possible). One organisation added as options that network level
and the level of the individual internet provider should be addressed as well.
The next question was about the suitability of different indicators for consumer information so
that they can be understood by consumers (see task 1.2.3).
Figure 30: How understandable do you think the following environmental indicators on electronic communications services are for consumers?
Source: online survey with consumer organisations
4
8
0 1 2 3 4 5 6 7 8 9 10
To the provider/company level
To the level of the specific service
Number of responsesI agree
2
3
1
2
3
3
2
3
6
5
5
6
4
4
1
2
2
1
2
2
1
0 1 2 3 4 5 6 7 8 9 10
Energy intensity of data transmission [Wh/GByte]
Specific carbon footprint of data transmission [g CO2e/GByte]
Share of renewable energies of the network operator in total energyconsumption [%]
Power consumption of the network per subscriber [W/subscriber]
Annual carbon footprint per subscriber [kg CO2e/(a*subscriber)]
Annual energy consumption of the provider per subscriber[kWh/(a*subscriber)]
Number of responses
very well suited well suited less well suited not suited at all
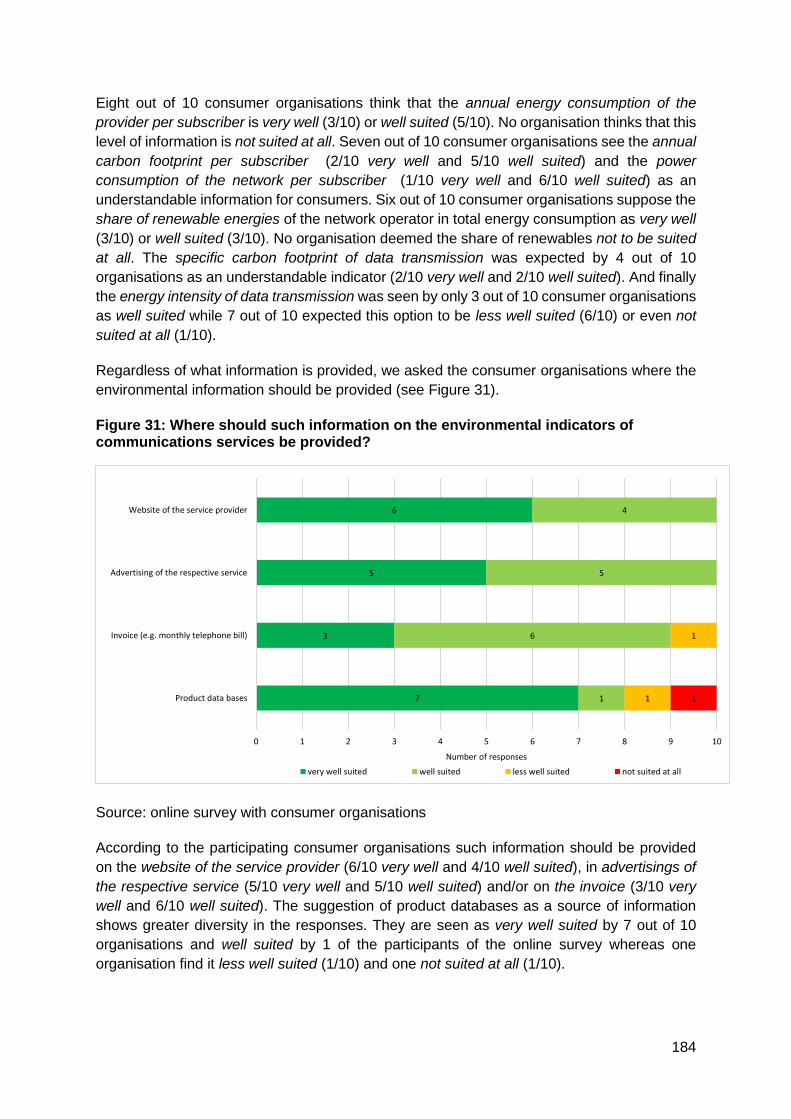
184
Eight out of 10 consumer organisations think that the annual energy consumption of the
provider per subscriber is very well (3/10) or well suited (5/10). No organisation thinks that this
level of information is not suited at all. Seven out of 10 consumer organisations see the annual
carbon footprint per subscriber (2/10 very well and 5/10 well suited) and the power
consumption of the network per subscriber (1/10 very well and 6/10 well suited) as an
understandable information for consumers. Six out of 10 consumer organisations suppose the
share of renewable energies of the network operator in total energy consumption as very well
(3/10) or well suited (3/10). No organisation deemed the share of renewables not to be suited
at all. The specific carbon footprint of data transmission was expected by 4 out of 10
organisations as an understandable indicator (2/10 very well and 2/10 well suited). And finally
the energy intensity of data transmission was seen by only 3 out of 10 consumer organisations
as well suited while 7 out of 10 expected this option to be less well suited (6/10) or even not
suited at all (1/10).
Regardless of what information is provided, we asked the consumer organisations where the
environmental information should be provided (see Figure 31).
Figure 31: Where should such information on the environmental indicators of communications services be provided?
Source: online survey with consumer organisations
According to the participating consumer organisations such information should be provided
on the website of the service provider (6/10 very well and 4/10 well suited), in advertisings of
the respective service (5/10 very well and 5/10 well suited) and/or on the invoice (3/10 very
well and 6/10 well suited). The suggestion of product databases as a source of information
shows greater diversity in the responses. They are seen as very well suited by 7 out of 10
organisations and well suited by 1 of the participants of the online survey whereas one
organisation find it less well suited (1/10) and one not suited at all (1/10).
7
3
5
6
1
6
5
4
1
1
1
0 1 2 3 4 5 6 7 8 9 10
Product data bases
Invoice (e.g. monthly telephone bill)
Advertising of the respective service
Website of the service provider
Number of responses
very well suited well suited less well suited not suited at all

185
In the area of household appliances, the presentation of the energy efficiency of products on
the basis of the EU energy label is already a well-known practice among consumers.
Particularly efficient products are labelled with an "A" and a green bar, while particularly
inefficient products are labelled with a "G" and a red bar. An example for an energy efficiency
label for access networks (equivalent to Figure 26) was shown to the participants of the online
survey as an example of a possible representation. The following question aims to find out
whether this type of consumer communication could also be transferred to
telecommunications services (Figure 32).
Figure 32: Do you think a colour coded label would help consumers to take energy efficiency into account when deciding on a specific service?
Source: online survey with consumer organisations
Nine out of 10 participating consumer organisations find that a colour coded label would be
very well (5/10) or well suited (4/10) to display the energy efficiency of fixed internet or mobile
service.
In additional remarks, consumer organisations expressed their support for the colour coding
because of following reasons:
• “A colour scale makes decision making more simple for consumers”
• “familiarity” of consumers with colour codes
• “If criteria are well defined and communicated the well-known colour scale is very suitable
tool to display energy efficiency of service providers. We only have to bear in mind future
revisions following the improvements in technology (similar to the new energy label for
household devices)”
In addition to the colour-coded energy efficiency label for telecommunication services, further
measures can possibly be taken to increase its impact. For this purpose, the question in Figure
33 was asked.
5 4 1
0 1 2 3 4 5 6 7 8 9 10
Number of responses
very well suited well suited less well suited not suited at all

186
Figure 33: What additional information or measures could enhance the effect of such colour coding?
Source: online survey with consumer organisations
The effect of such a colour coding could , in the opinion of the consumer organisations, be
enhanced by an information campaign and as well the prominent display of the colour coding
in tariff offers (each 6/10 very well and 3/10 well suited). The declaration of reference values
is also seen by 8 out of 10 consumer organisations to have an enhancing impact as they were
voted as very well suited (4/10) and well suited (4/10). The declaration of CO2 equivalent
emissions is considered to be suitable by only 5 out of 10 as very well (3/10) and well suited
(2/10) while the other half expects CO2 values to be less well suited (5/10).
In order to give the respondents the opportunity to also name the disadvantages of
environment related consumer information, a question was also asked about potential risks
(Figure 34):
Figure 34: Do you see potential disadvantages or risks for consumers if information on environmental footprint of services is introduced?
Source: online survey with consumer organisations
3
4
6
6
2
4
3
3
5
2
1
1
0 1 2 3 4 5 6 7 8 9 10
Declaration of CO2e-emissions
Declaration of reference values (e.g. with referenceto the efficiency of best available technology)
Prominent display of the colour coding in tariff offers
Information campaign on energy efficiency
Number of responses
very well suited well suited less well suited not suited at all
1
3
4
4
3
4
4
3
2
1
1
0 1 2 3 4 5 6 7 8 9 10
Consumer confusion
Too little effect
Greenwashing
Number of responses
Very applicable Applicable Less applicable Not applicable at all
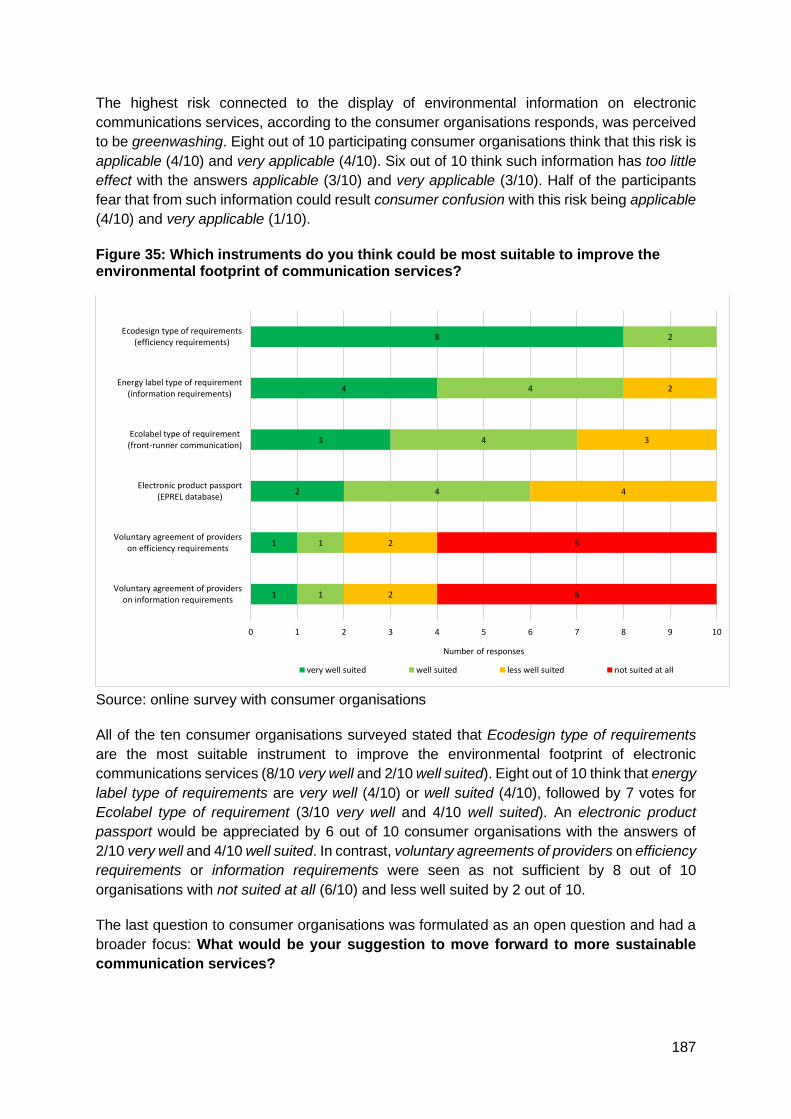
187
The highest risk connected to the display of environmental information on electronic
communications services, according to the consumer organisations responds, was perceived
to be greenwashing. Eight out of 10 participating consumer organisations think that this risk is
applicable (4/10) and very applicable (4/10). Six out of 10 think such information has too little
effect with the answers applicable (3/10) and very applicable (3/10). Half of the participants
fear that from such information could result consumer confusion with this risk being applicable
(4/10) and very applicable (1/10).
Figure 35: Which instruments do you think could be most suitable to improve the environmental footprint of communication services?
Source: online survey with consumer organisations
All of the ten consumer organisations surveyed stated that Ecodesign type of requirements
are the most suitable instrument to improve the environmental footprint of electronic
communications services (8/10 very well and 2/10 well suited). Eight out of 10 think that energy
label type of requirements are very well (4/10) or well suited (4/10), followed by 7 votes for
Ecolabel type of requirement (3/10 very well and 4/10 well suited). An electronic product
passport would be appreciated by 6 out of 10 consumer organisations with the answers of
2/10 very well and 4/10 well suited. In contrast, voluntary agreements of providers on efficiency
requirements or information requirements were seen as not sufficient by 8 out of 10
organisations with not suited at all (6/10) and less well suited by 2 out of 10.
The last question to consumer organisations was formulated as an open question and had a
broader focus: What would be your suggestion to move forward to more sustainable
communication services?
1
1
2
3
4
8
1
1
4
4
4
2
2
2
4
3
2
6
6
0 1 2 3 4 5 6 7 8 9 10
Voluntary agreement of providerson information requirements
Voluntary agreement of providerson efficiency requirements
Electronic product passport(EPREL database)
Ecolabel type of requirement(front-runner communication)
Energy label type of requirement(information requirements)
Ecodesign type of requirements(efficiency requirements)
Number of responses
very well suited well suited less well suited not suited at all

188
Several organisations mentioned the legislation as most important (“Better legislation, better
enforcement and consumers' information”, “Strict and ambitious legislation, instead of placing
the burden on consumers …”).
But also, the relevance of common standards and reliable consumer information was
mentioned. “A mix between regulatory (ecodesign ...) and informative indicators (energy label)
would be the best to achieve a proper competition among providers and communication
towards consumers.”
It was also stressed that the reduction of the environmental impacts of electronic
communications services is very important because of its increasing use. One respondent
answered: “'The current trend of digital overconsumption in the world is unsustainable in terms
of the energy and materials it requires,' writes The Shift Project in its latest report. Against this
background, we must also ask ourselves for which important applications do we need ICT and
for which unsustainable applications that are not of outstanding importance for our society
there is no infrastructure funded with taxpayers' money (or only at prices that take all external
costs into account).”
Summary and conclusions from the consumer organisations survey
The survey among consumer organisations aimed to find out whether environment-related
consumer information on electronic services is at all effective and how it should be designed
in order to better achieve the goal of environmental protection.
The answers of the consumer organisations are ambivalent. In principle, they expect that more
information on electronic communication services could reduce energy consumption (see
Figure 27). However, it is doubted that the energy efficiency of services is an essential decision
criterion for consumers (Figure 28). To set up consumer information, easy-to-understand
information is preferred: best at the level of the specific service (Figure 29) and using energy
consumption per year and subscriber (Figure 30). In addition to the pure numbers, the
graphical representation with a colour code, comparable to the energy efficiency label, is
welcomed (Figure 32). The main risk of such consumer information is that companies present
themselves as environmentally friendly without really being so ("greenwashing") (Figure 34).
In order to reduce the energy consumption of electronic communication networks, however,
the priority of politics should, in the opinion of the consumer organisations, be on obligatory
measures, such as Ecodesign, and not on information measures (Figure 35). Of the pure
information measures, an energy label is mentioned as the most promising (also Figure 35).
The survey results allow some preliminary conclusions for the present study. One is that
simply offering information is not enough to transform the market. Rather, mandatory
measures must steer the market in an environmentally friendly direction. The second is that
information measures could then serve to make the successes in reducing energy
consumption and increasing efficiency visible. A combination of Ecodesign and energy
efficiency labelling therefore seems to be a target-oriented way to introduce more energy
efficiency in electronic networks. Indicators used for ecodesign requirements usually have a
product-related focus (e.g. energy consumption of a product per year for a standard usage
cycle). For electronic communications services, a suitable reference unit should therefore also
be found that relates the environmental impacts of the product to its use. The unit "energy
consumption per year and subscriber" was preferred by consumer organisations and has the

189
necessary product focus. However, further methodological challenges have to be solved (e.g.
definition of a standard usage scenario) before this benchmark can be used.
Task 1.2.5: Criteria for the assessment of the environmental sustainability of new
electronic communications networks
Aim of this task
In this task the suitability of potential criteria for environmental sustainability is examined,
especially with regard to energy efficiency and greenhouse gas emissions, in order to
intervene in the deployment of new networks or their expansions with suitable regulations. If
no such criteria exist, suggestions are made as to how this can be achieved. With regard to
the applicability of these instruments in practice, they should be effective (ensure the
environmental sustainability of the networks that meet these criteria), neutral (objective,
proportionate, non-discriminatory and technologically neutral) and efficient (cost and effort for
verification, both for network operators and for public authorities).
Principles for the suitability of environmental criteria
The development of suitable indicators and minimum requirements for electronic
communications networks is in principle carried out according to the same rules as the
development of requirements for eco-labels (EN ISO 14024:2018) and criteria for green
procurement. These criteria are also applied ex-ante to a product before it is allowed to be
certified with an eco-label or before it is purchased as part of the procurement process.
• Criteria address the significant environmental impacts of a product or service along
its life cycle,
• criteria must be effective: the fulfilment of the criteria must offer environmental
advantages,
• requirements must be supported by verifiable indicators that confirm the fulfilment
of the criterion (e.g. verification of the criterion “energy efficiency” by measuring
energy consumption and data transmission on the network component itself)
• for the quantification of the indicators, reference must be made to test
specifications that allow independent and reproducible verification (e.g. reference
to a standard or specification of a test specification),
• the requirements must be objective so that fair competition is not distorted.
Identification of the environmental hotspots in electronic communication networks
Based on existing studies, it can be deduced in which areas of electronic communication
networks the greatest energy consumption and thus greenhouse gas emissions occur. If
criteria are applied to assess the environmental impact of new electronic communication
networks, these areas must be given special consideration as environmental hotspots.
Energy consumption in the use phase of network equipment
Life cycle assessments (LCAs) have been conducted in the past to determine the
environmental impact of electronic communication network equipment. The study from
Pino (2017) on core network equipment for mobile telecommunications concludes that
190
the use phase clearly dominates over the other life cycle phases in terms of GHG
emissions, with the use phase contributing 91.9 per cent and the manufacturing phase
only 8 per cent. Studies by CISCO (2020) also come to very similar conclusions, finding
for large chassis based routers that the use phase clearly dominates with 92.7 percent
of greenhouse gas emissions. Greenhouse gas emissions in the use phase are
predominantly related to the electricity consumption of the network equipment.
One focus of the environmental criteria that are to be suitable for reducing
greenhouse gas emissions must therefore relate to the energy consumption of the
equipment in the use phase. This includes both energy-efficient hardware but also
software-related efforts such as intelligent energy-saving functions and efficient data
routing.
Energy consumption of access networks
Task 1.2.3 presented the results of a study from Gröger and Liu (2021), which
examined the energy consumption of a data stream along the various network
components from the user to the data centre (Table 34). The energy demand of a
uniform data stream of 2.2 Mbps via different fixed network accesses (VDSL and fibre
optics) as well as via the mobile network accesses 4G and 5G was examined. The
results show that within a electronic communication network connection, the access
network has the largest share of energy consumption (74 to 99 percent of the total
power). The reason for this uneven distribution is that the network components within
the aggregation network and the core network are always well utilised due to the
number of customers (data streams) to be served. The components of the access
network, on the other hand, are only shared by a few users and must nevertheless be
designed for peak load (maximum data flow). Within the energy consumption of
electronic communication networks, a further focus can therefore be placed on access
networks and less on aggregation or core networks.
Energy consumption of mobile network infrastructure
A study conducted by ITU on greenhouse gas emissions in the information and
communication technology sector (ITU-T L-1470 2020) shows that the electricity
consumption of communication networks is dominated by mobile network
infrastructure. This is shown in Figure 23 presented within Task 1.2.3. In 2020, mobile
networks accounted for 60% of the electricity consumption of the entire network, while
fixed network connections accounted for only 40%. The expected trend is towards
more mobile access points, which are expected to consume 65% of the network
electricity in 2030.
A manufacturers study (Ericsson 2020) show the latest projection of global mobile
networks based on the technology generations. The technologies 2G (GSM/EDGE)
and 3G (WCDMA/HSPA) will be slowly phased out in the near future. Of a total of 8.8
billion mobile subscriptions worldwide in 2026 it is expected to be 4 billion 4G (LTE)
subscribscriptions (45%), 3.5 billion 5G subscriptions (40%), and only 1.3 billion of the
older standards (15%). For Western Europe the study expects in the year 2026 29%
of subscriptions to be 4G and 68% to be 5G technology and the remaining rest only
3% (Ericsson 2020). Therefore, a particular focus of the environmental assessment

191
criteria should be on the mobile network with the 4G and 5G technology
generations.
Summary of environmental hotspots of electronic communication networks
In summary, the environmental hotspots of electronic communication networks are:
• the energy consumption in the use phase of network equipment
• in particular the energy consumption of access networks
• and, due to their growing importance, especially the energy consumption of
mobile network infrastructure.
Criteria for energy-efficient telecommunication network equipment and operation
To develop criteria for energy-efficient telecommunication network equipment and operation
several studies and initiatives have been undertaken. The most important results of these
studies and initiatives are presented below.
Stobbe and Berwald (2019) conducted a study for the Green Electronics Council and TÜV
Rheinland with the aim of developing sustainability criteria for the EPEAT eco-label and the
TÜV Green Product Mark for large network equipment (LNE). The study refers to large
switches and routers used in companies and communication networks. The authors provide
recommendations for the development of sustainability criteria for large network devices for
the two eco-labels mentioned above. The criteria have meanwhile been adopted by TÜV
Rheinland and Global Electronics Council (2021).
The JRC-Study (Canfora et al. 2020) on Best Environmental Management Practices (BEMP)
in the Telecommunications and ICT Services sector describes practices to reduce the
environmental impacts when planning or renovating telecommunicaton networks.
Additionally the EU Code of Conduct on Energy Consumption of Broadband Equipment
(Bertoldi and Lejeune 2020) defines voluntary minimum requirements for highly energy-
efficient network equipment which are suitable to be adopted as criteria for the assessment of
the environmental sustainability of new electronic communications networks.
Criteria for metrics to be applied
Networks should generally be planned taking into account metrics that focus on the energy
requirements of the networks and network components. Such metrics should be based, on
existing ITU or ETSI standards:
• Network equipment: as shown in Task 1.2.3, Table 36, there are many metrics covering
different types of networks equipment which have been defined in ITU-T and ETSI
standands. The Energy efficiency rating (EER) [Mbit/s/W] based on ITU-T L.1310
“Energy efficiency metrics and measurement methods for telecommunication
equipment” is well suited for being used in common for different technologies due to
its generic approach. The core task of all network devices is to transmit data.
Therefore, all devices, regardless of whether they are access points, distribution
switches or line amplifiers, can be measured for both their data volume and their
192
energy consumption. If the ratio between the amount of data transmitted and the
electrical power consumption is calculated, different technologies can be directly
compared with each other and the energy requirements of different network nodes can
be added together. The EER therefore provides an important parameter for calculating
the overall efficiency of networks.
• If the construction of a new base station is planned, the average power consumption
of the components used can be assessed according to ETSI ES 202 706-1, where the
average power consumption of the base station is based on the measured power
consumption under static conditions. For this purpose, the manufacturer of network
components can carry out measurements for various load conditions under laboratory
conditions and publish the results in its data sheets. This enables the network
operator's planner to select energy-efficient equipment combinations before they are
installed. Calculating the expected energy consumption is even a prerequisite for being
able to correctly dimension the energy supply (e.g. uninterruptible power supply) and
the air conditioning of basstation equipment rooms.
• For fixed networks, the focus of the metrics can be on the components of the access network for the reasons mentioned above. Suitable metrics for this are, for example, ETSI EN 305 200-2-2 V1.2.1 (2018-08) “Access, Terminals, Transmission and Multiplexing (ATTM); Energy management; Operational infrastructures; Global KPIs; Part 2: Specific requirements; Sub-part 2: Fixed broadband access networks”.
Criteria for power supply units
Power supply units are used in all areas of the network. They transform the voltage from the
power grid into a low voltage that is required by the network components. The voltage
conversion is basically subject to losses, which is expressed by an efficiency of the power
supply unit. If a power supply unit has a poor efficiency, it not only requires more electrical
energy, but also generates more waste heat, which has to be dissipated again by means of
an energy-intensive cooling system. The goal must therefore be to use power supply units
with the highest possible efficiency (close to 100%). The "80 PLUS" certification system for
power supply units can serve as a benchmark here. According to Stobbe and Berwald (2019),
the "80 PLUS gold" efficiency level represents very good practice. In the meantime, however,
there are also more ambitious efficiency levels "80 PLUS platinium" and "80 PLUS titanium"
that can be considered as minimum requirements. The certification system currently awards
power supplies in a power range from 100 to 3,000 watts.147 This already covers the power
range for many network components in access networks.
Criteria for management of network sites
In the JRC-Study (Canfora et al. 2020) on Best Environmental Management Practices (BEMP)
in the Telecommunications and ICT Services sector, the authors identify various measures
that can be implemented during the operation of telecommunications networks to make them
more energy efficient. The management practices include the improving of the energy
management of existing telecommunications networks, selecting and deploying more energy-
147 80 PLUS® Certified Power Supplies and Manufacturers; https://www.clearesult.com/80plus/

193
efficient telecommunications network equipment, installing and upgrading
telecommunications networks, reducing the environmental impacts of buildings. The main
finding of the study is that networks are technical systems that are constantly evolving. It is
therefore not enough to set high standards at a single point in time (e.g. during the initial
installation), but the networks and its components must be continuously optimised and further
developed. The study cites the example of new equipment being introduced into existing
mobile radio base stations. Due to the change in energy consumption, the existing air-
conditioning systems must also be adapted to the new demand and optimised accordingly. In
addition, it must be weighed up when it is reasonable to replace outdated and inefficient
technology with new technology. Environmental and energy management can ensure that
existing systems are continuously optimised. Efficiency metrics should support the
identification and elimination of inefficiencies in operations.
Criteria for cooling equipment
The ambient temperature and humidity as well as the power consumption of the network
devices influence the power consumption of the cooling devices. The most efficient type of
cooling is when no cooling is needed at all. Base stations today can be safely operated at
temperatures above 45 °C. Locating and limiting the density of equipment within the base
station can help minimise the internal temperature. ASHRAE (American Society of Heating,
Refrigerating and Air-Conditioning Engineers) has developed a classification system that
describes the temperature and humidity levels within which ICT equipment can operate (cited
in Bertoldi and Lejeune 2020). A possible environmental criterion for new network equipment
is therefore that it must also be able to operate at temperatures that can be reached in the
respective installation location without additional air conditioning. If site cooling is required,
efficient cooling concepts (e.g. free air cooling, water cooling) should be considered in
preference.
The metric "Total network infrastructure energy efficiency definition (NIEE)" based on ITU-T
L.1332, which is defined as the ratio between the energy consumption of the ICT load and the
total energy consumption of the network, could be used to assess the energy efficiency of the
network infrastructure (see Task 1.2.3 and Annex 8: Task 1.2.3 Standards and measurement
methodologies for the monitoring of environmental footprint of electronic communications
networks and services).
In addition, thermal management needs to be optimised by ensuring that equipment with
different temperature requirements should be physically separated from each other. This is
because when different devices with different temperature requirements are installed in a
single room, the cooling temperature is set to the most sensitive devices, i.e. to a lower and
thus more energy-consuming temperature value.
The refrigerants used in cooling systems still pose a considerable environmental problem due
to their high specific greenhouse gas potential. The aim should therefore be to use refrigerants
with a low global warming potential and, at best, natural refrigerants (ammonia, propane,
butane, CO2, water). The German eco-label has set requirements for such refrigeration
systems within the framework of the Blue Angel, The German Ecolabel (2019) "Energy
Efficient Data Centre Operation (DE-UZ 161)".

194
Criteria for longevity, repair, reuse, recycling and end of life management
In order to describe entire environmentally friendly products, criteria for saving resources and
strengthening the circular economy should also be included. These are typically minimum
requirements for product durability, repairability and the provision of spare parts and software
updates. In addition, environmentally friendly products must be recyclable, i.e. the main
material components must be separable and capable of being fed into suitable recycling
cycles. Manufacturers of network components should be obliged to take back used
components after the use-phase and either refurbish and reuse them or recycle them in an
orderly manner.
Criteria to assess the overall efficiency of electronic communication networks
The previous sections have given an overview of:
• how environmental minimum requirements are basically developed;
• where the main environmental impacts of electronic communication networks lie;
• and how the planners and operators of networks can address the individual
environmental problems at the level of infrastructure components.
This section will now show how the efficiency of networks can be assessed from a higher-level
perspective. The overarching perspective must be taken when assessing which network is
more efficient than another. The energy intensity of the networks was described as a metric
for this purpose in the existing practices (Task 1.2.3):
• Energy intensity of the network [kWh/GByte]
Energy consumption in a period of time per amount of data transmitted in this period.
The energy intensity can be determined at company level by relating the company's total
network (e.g. annual) energy consumption to the amount of data transmitted. In practice,
however, a network operator often offers different access technologies (e.g. coaxial cable,
copper, fibre, mobile) that would not be differentiated by a company-wide assessment of the
total energy consumption. In addition, the provider of an access technology (e.g. a mobile
radio base station) uses shared network resources of others after the network access (e.g. as
a tenant), so the provider is not responsible for all energy consumption itself or does not know
these figures.
Therefore, a two-step calculation of the energy intensity of the networks is proposed here.
First, the energy intensity of the access network should be calculated depending on the
access technology. The access network starts outside the end-users premise (building or data
centre) and ends at the aggregation network switch.
Calculation per access technology:
• Energy intensity access network = Energy consumption access network / Data
transfer access network
The following metrics form a good basis for determining these key figures:

195
• ETSI EN 305 200-2-2 V1.2.1 (2018-08) “Access, Terminals, Transmission and
Multiplexing (ATTM); Energy management; Operational infrastructures; Global KPIs;
Part 2: Specific requirements; Sub-part 2: Fixed broadband access networks”: KPI for
task effectiveness, KPITE [bits/Wh]. This is the ratio between the data volumes (both
upstream and downstream data) and KPIEC. This metric is applied for the fixed
broadband access networks.
• ETSI EN 305 200-2-3 V1.1.1 (2018-06) “Access, Terminals, Transmission and
Multiplexing (ATTM); Energy management; Operational infrastructures; Global KPIs;
Part 2: Specific requirements; Sub-part 3: Mobile broadband access networks”: KPI for
task effectiveness, KPITE [bits/Wh]. This is the ratio between the data at base stations
and KPIEC. This metric addresses mobile broadband access networks.
• ETSI EN 303 472 V1.1.1 (2018-10) “Energy efficiency measurement methodology and
metrics for radio access network (RAN) equipment”: Capacity energy efficiency KPI
(KPIEE-capacity) [Mbits/Wh]. This is the ratio between data volume of the base stations
(BS) and the total energy consumption of the base station site including the support
infrastructure.
• ETSI TS 102 706-2 V1.5.1 (2018-11) “Metrics and measurement method for energy
efficiency of wireless Access Network Equipment; Part 2: Energy Efficiency - dynamic
measurement method”. Base Station Energy Efficiency (BSEP) [bits/Wh]. This is the
ratio between the measured data volume in bits for low, medium and busy-hour load
level and the total energy consumption of the base station which results from the
weighted energy consumption for each traffic level i.e. low, medium and busy-hour
traffic. It should be stressed that “TS” stands for Technical Specifications. This TS
covers LTE radio access technology.
Secondly, the energy intensity of the remaining network components (aggregation and
core network) must be calculated:
• Energy intensity rest of network = energy consumption rest of network / Data
transfer aggregation network
As metrics that are potentially applicable were identified for this purpose:
• ETSI ES 203 136 V1.2.1 (2017-10) “Measurement methods for energy efficiency of
router and switch equipment”: Energy Efficiency Ratio of Equipment (EEER)
[Gbps/Watt]. This is the ratio between total weighted throughput and the weighted
power for different traffic loads (low, medium and high). This metric could be applied
for fixed and mobile networks.
• ITU-T L.1332 (01/2018) “Total network infrastructure energy efficiency metrics”: Total
network infrastructure energy efficiency definition (NIEE): The ratio between ICT load
energy consumption and total energy consumption of the network. This metric
assesses the energy efficiency of network infrastructure. It is understood that this
metric could be applied either fixed network or mobile network. It should be stressed
that another metric “Site energy efficiency (SEE)” definded in ETSI ES 203 228 V1.3.1
(2020-10) (s. next bulletpoint) also assesses the energy efficiency of network
infrastructure, however, focusing on mobile network.

196
• ETSI ES 203 228 V1.3.1 (2020-10) “Assessment of mobile network energy efficiency”:
Mobile network (MN) data energy efficiency (EEMN,DV) [bit/J]: the ratio between the data
volume (DVMN) and the energy consumption (ECMN). This metric is only applied for
mobile network. The technologies involved are global system for mobile
communication (GSM), universal mobile telecommunications service (UMTS), long
term evolution (LTE) and 5G New Radio (NR). The ETSI standard provides also a
method to extrapolate the assessment of energy efficiency from sub-network to total
networks.
To calculate the energy intensity of the network, both values can then be added together and
displayed depending on the access technology:
• Energy intensity of the network = Energy intensity access network + Energy
intensity rest of network
If a network provider only operates an access network and uses external network resources
from the aggregation network onwards, he can ask the respective network provider for the
energy intensity of the external resources used and include them in his own calculation. The
same applies in the reverse case, if an operator only operates an aggregation or core network
and makes it available to others. In this case, the operator must make the specific efficiency
data for its network section available to its customers.
The energy intensity of the access network can also be calculated on the basis of a specific
site. In addition, it is possible to calculate the energy intensity already in the planning phase
of a location based on the planned technical equipment (network components, air conditioning,
other technology). For example, if public subsidies are provided to build broadband
infrastructures, an energy efficiency competition should always be conducted as well. Only
the most energy-efficient provider should receive public funding. In order to ensure that
these pure planning values were not calculated too favourably in order to manipulate the
competition, suitable verification requirements and, if necessary, contractual penalties must
also be defined.
So far, such metrics for calculating the energy intensity of networks have only been published
in individual cases and usually calculated with different system boundaries (e.g. energy
consumption including administrative properties such as offices and shops of the provider).
Therefore, the data available so far is too poor to set specific benchmarks as minimum criteria.
This will change when the disclosure of such efficiency values becomes mandatory and
network operators have to publish such figures when licensing frequencies or using public
infrastructures (e.g. shared cable ducts within the public space). In addition to the
transparency measures towards consumers (see task 1.2.4), transparency measures towards
telecommunications regulators should therefore also be implemented. In the policy options
(task 2.1), the two options ECN Energy Register and Code of Conduct on transparency
measures for telecommunication services are proposed. This will create a data basis that
can be used to define minimum requirements in the future. Based on this, it will therefore
be possible to define benchmarks that must be met before access to public infrastructure is
granted or before building permits are issued.

197
2.3. Main lessons on indicators and standards for Data Centres and Electronic Communications Services and Networks
After the detailed analyses of the definitions, market practices and metrics currently used for
DCs and ECNs, this section aims to summarize and provide an overview of the main lessons
that can be derived. In turn it will serve as a basis for elaborating potential policy options, and
for analysing the environmental, social and economic impacts. The latter will be done in the
next chapter.
With respect to the data centres an important conclusion is that there is an enormous diversity
between and within DCs implying that a particular policy option might have a different balance
between environmental and economic impacts depending on the precise business model used
and structure of the DC. In terms of existing market practices it can be observed that large
DCs tend to be more inclined towards circular economy practices than small ones, hence an
area for potential policy intervention to promote circularity practices among the small DCs.
Potential strategies to encourage the greening of DCs can be envisioned in the areas of
improving access to finance, industrial symbiosis and sharing of best practices. Evidently
adjustment of existing legislation is a potential option as well, which will be explored in the
next chapter. Concerning energy and resource efficiency measures there are already quite a
large number of different methods and metrics that focus on data centres and their individual
components. For instance the European Data Centre Standard EN 50600-4 key performance
indicators (KPIs) series are of particular interest for assessing various environmental
characteristics such as the PUE, REF, WUE. However all existing measures have a clear
focus on energy related issues. Circular economy metrics and metrics related to the leakage
of greenhouse gas emissions are barely covered.
With respect to the ECNs it can be indicated that the environmental sustainability reporting is
currently mainly focused on businesses and investors. Thereby, established and cross-
sectoral standards such as GRI, GHG protocol, CDP, ISO 14001/50001 are preferred. For the
planning of new networks the Code of Conduct for Broadband Equipment is an important guide
for purchasing equipment. ECNs have already a sufficiently specific set of metrics to determine
energy efficiency and energy consumption and to report them in a standardised form. Energy
efficiency can however substantially differ among networks due to their specific technical
characteristics (wireless vs fibre cable, old vs new technologies). From the end-users
perspective, there are currently no established labels and metrics for communicating the
environmental benefits of telecom services and for comparing different providers.
In the subsequent sections, the main lessons are presented in more detail, first for the DCs
and then for the ECNs.
2.3.1. Main lessons for Data Centres – definitions, market practices and measures
Definitions
Our research on the various definitions and categorisations of data centres currently in use,
reveals a lack of consensus between the various actors involved in the field on what definitions
and categorisations to use. This might be testimony to the complex reality behind data centres.
In other words, it is hard to define and categorise data centres as a consequence of their many
shapes and formats. In further developing and finetuning specific policy options aimed at

198
greening data centres, one should take into account this finding, namely that there is an
enormous diversity both within and between data centres.
Diversity within data centres:
Within a data centre several layers are present. These layers are: the building (the outer
layer), the support infrastructure, the IT-equipment, the applications that run on top of the
equipment and the users. Most importantly in the context of this study, energy efficiency and
circularity aspects relate to each of these layers. In designing policy measures it should always
be clear what layer(s) would be affected by the measure. Furthermore, these layers might be
owned or operated by different organisations, which in turn might affect who is able and/or
responsible to access metrics related to energy efficiency and environmentally relevant data,
communicate these, and who bears the costs associated with implementing new measures to
improve energy and resource efficiency.
Data centre layer Owned by: Operated by:
Building xxxx xxxx
Support infrastructure xxxx xxxx
IT equipment xxxx xxxx
Application layer xxxx xxxx
Diversity between data centres:
The many constellations of what can be a data centre complicates policy formulation as it can
be challenging to identify what organisations exactly needs to be targeted within a data
centre and due to potentially diverging impacts of policy options depending on the type of
data centre, especially on how economic impacts compare to environmental impacts.
With respect to the former, other ownership/purpose models of data centres imply other
organisations that bear the energy costs and have access to data and metrics:
• Enterprise data centre: Owner, operator and (main) user of data centre is the same
organisation, bearing all energy cost and having access to all relevant energy efficiency
and environmentally relevant data. In terms of total number and total floor size, enterprise
data centres constitute the largest group among all data centres (cf. Section 2.1).
• Co-hosting data centre: Both the information technology equipment and the support
infrastructure of the building are provided by the data centre operator or owner, who bears
initially all energy costs, while users pay indirectly, depending on their contracts/tariffs,
which are not directly linked to energy consumption and are often flat rates. Energy
efficiency and environmentally relevant data is available at the same organisation.
• Co-location data centre: The support infrastructure of the data centre (such as power
distribution, security and environmental control) is provided as a service by the data centre
infrastructure operator, who bears all initial energy costs. Customers pay energy costs to

199
the data centre infrastructure operator, based on their contract which include actual
energy consumption and a possible fee related to the additional energy costs such as
cooling systems, UPS and other losses. Energy efficiency and environmentally relevant
data is hence spread across different actors.
The multitude of data centres in existence implies policy design or assessment needs to take
into account potential diverging impacts of policy measures. A key element in this is how the
magnitude of potentially positive environmental impacts/impacts on circularity compare to
potentially negative economic or social impacts. This could depend on for example the size of
data centre, the type of owner/operator, the redundancy of the data centre and the business
function of the data centre. Below, we list some examples:
• Size: smaller data centres might individually have a relatively low impact on the
environment, combined however, the picture might be very different. Setting specific
energy and/or resource efficiency targets for smaller data centres might, however, imply
significant investments that are hard to justify from a business perspective. This might in
turn imply the need for financial support, rather than other types of support.
o To identify small data centres, a minimum thresholds should be agreed upon. Our
research suggest a minimum size of 6 server racks. More importantly, however,
than size, is the technology deployed and its energy/resource efficiency. In order
to identify relevant data centres to be targeted for specific policy measures, it would
therefore be paramount that related reporting mechanisms are implemented.
• Type of owner - private versus public data centres and size: the EURECA project revealed
smaller public data centres run on older server equipment inducing a large waste of
energy. Given the higher energy waste in smaller public facilities (less than 25 racks) they
should be one of the target groups of policy reform aimed at greening data centres, e.g.
by augmenting/adapting the EU GPP criteria for Data Centres, Server Rooms and Cloud
services and/or making some criteria mandatory.
• Data centres that offer a higher degree of availibility (i.e. higher tier data centres) will
typically use more redundant components which implies -ceteris paribus- a higher
consumption of energy. This emphasises the fact that there is a potential trade-off between
availability and energy consumption. When designing policy it should also be noted that
sometimes the levels of availability of data centres are too high compared to what end-
users really need. Another important factor is the occupation of the data centre. High tier
data centres that run for example two independent distribution systems but only have a
couple of smaller users, will use too much energy to keep the support infrastructure
running compared to what it is used for leading to high PUE values.
• Business supporting versus business critical data centres: when a data centre is business
critical, the incentives of the organisation operating it, might be different from those of an
organisation that uses the data centre to support its business. Large investments might be
more worthwhile from a business perspective in the former group.
Market practices
The analysis of current market practices of data centre operators reveal that large industry
stakeholders tend to incorporate circular practices more easily and structurally than small
companies. This is mainly due to the financial ressources at their disposal. While small players

200
rather incorporate short term strategies and seek out the morst efficient and often cheapest
equipment, large players deploy dedicated platforms for improving their organisations
circularity efforts in a more long term view.148 As such one could perceive this as a market
failure that warrants policy intervention in order to consider both small and big companies at
par when it comes to circularity.
Industry needs and trends
Based on industry reports and the stakeholder consultation carried out for the first part of the
present interim report, the industry is in need of further standardisation and a common
understanding on how circularity can be implemented by IT providers. IT providers are
experiencing a surge in client demand for sustainable and circular practices which have the
potential to influence future market trends.
Investors seek out data centres as investments due to their increasing demand and new mid-
sized data centres being constructed. Undoubtedly the expected growth of cloud and ICT
applications makes investing in DCs an interesting opportunity. An advertised circular practice
of data centres is the industrial symbiosis approach whereby data centres are being integrated
into local energy grids, reusing e.g. waste heat of the buildings and neighbouring factories. In
order for potential synergies to occur, the integration of existing and new data centre buildings
into the local energy infrastructure is an important consideration for circularity.
The development and production of smaller and more performing components can be
perceived as another industry trend. Rather than dealing with the end of life phase circularity
is in this case improved through design from the beginning – higher energy and resource
efficiency, lower environmental footprints (ceteris paribus). This trend feeds another one which
is the emergence of edge computing. While one would be tempted to assume that due to
concentration and scale economies edge computing would gradually disappear, stakeholders
interviewed indicated that it will be a phenomenon that remains if not increases in relative
importance in the years to come, especially in relation to IoT, AI, decentralised production
systems.
The effective use of existing infrastructure also feeds into the server utilisation rates which find
their optimum between 30% and 50%. The current rates in European data centres are below
that level and increasing them in the scope of the indicated optimum would also qualify as a
circular practice as it prevents the use of superfluous equipment for data centres. However
there the borders with security, service back-up and required functionality need to be clearly
guarded.
Potential strategies for greening: industrial symbiosis, improving access to finance, sharing
best practices
Overall and wherever possible, opportunities for establishing industrial symbioses could be
considered such as connecting data centres to local energy grids or even to on-site
manufacturing of equipment through additive manufacturing, reducing the burden of transport
148 Bashroush, R., (2020), Lawrence, A. Beyond PUE: Tackling IT’s wasted terawatts, Uptime Institute, p. 18

201
and material waste in manufacturing, although the latter may only be applicable for certain
components.
The discrepancy in financial means between small and large operators points to the potential
for improving the financing and investment framework for smaller operators and network
providers to implement circular practices in their buildings and networks. Financial incentives
are also the most sought after type of measure indicated in our survey to data centre operators
and national associations. Key questions to cover in designing such incentives would be the
eligibility criteria, which would relate to size and key elements of how the data centres are
defined which links ot the definition aspects of the present study.
An additional crucial aspect for data centre operators to be able to integrate circularity in their
strategies is that of appropriate legislation. As will be illustrated below, it could be relevant to
adapt existing legislation to the fast pace of evolving technologies allowing room for
adaptation. In conjunction with adapting existing legislation, a particular attention should be
given to the specific requirements of data centre operators. Attention should be given to
striking a balance between DC specific regulatory obligations and additional requirements in
existing or new cross-sector legislation in order not to administratively overburden data centre
operators and hinder market entrance or the the capacity to satisfy the requirements.
Sharing and identifying best practice examples of data centres that successfully integrated
circular practices, e.g. based on our findings in the first part of the study, could be useful to
provide data centres of various sizes further guidance on potential actions. This could take the
form of a platform or a live database for data centre operators to consult and obtain relevant
information. Jointly, information on partnering up with certified electronics recycling companies
for data centre roperators could be relevant. Methods for measuring energy and resource
efficiency.
Methods for measuring energy and resource efficiency
The research into methods for measuring the energy and resource efficiency of data centres
(task 1.1.3) has shown that there are already a large number of different methods and metrics
that focus on data centres and their individual components. Particularly useful are the metrics
from the European Data Centre Standard EN 50600-4 key performance indicators (KPIs)
series, some of them still under development, which very systematically describe the different
environmental characteristics of data centres and support them with measurement methods:
• EN 50600-4-1: KPIs - Overview and general requirements
• EN 50600-4-2: KPIs - Power Usage Effectiveness (PUE)
• EN 50600-4-3: KPIs - Renewable Energy Factor (REF)
• EN 50600-4-4: KPIs - IT Equipment Energy Efficiency for Servers (ITEESV)
• EN 50600-4-5: KPIs - IT Equipment Energy Utilisation for Servers (ITEUSV)
• EN 50600-4-6: KPIs - Energy Reuse Factor (ERF)
• EN 50600-4-7: KPIs - Cooling Efficiency Ratio (CER)
• EN 50600-4-8: KPIs - Carbon Usage Effectiveness (CUE)
• EN 50600-4-9: KPIs - Water Usage Effectiveness (WUE)

202
As a metric within the European Data Centre Standard that may be suitable for comparing the
efficiency of different data centres with each other and not just their sub-sectors is currently
under development:
• EN 50600-5-1: Data Centre Maturity Model (DCMM)
The key performance indicators developed from the series of the European Data Centre
Standard are suitable as a harmonised methodology for measuring energy and resource
efficiency of data centres, because they meet the following requirements:
• Goal-oriented: the indicators should describe a clear goal, i.e. resource efficiency and
energy efficiency.
• Measurable: the indicators to be proposed should be measurable with justifiable efforts
• Usability: the indicators to be proposed should be pragmatic so that they can easily be
adopted by the DCs.
• Optimizable: the indicators to be proposed enable the DCs operators to identify the
improvement of the measurement in order to improve their environmental performance
• Comparability: the indicators should be standardized to such an extent that it is
possible to compare different data centres.
The existing metrics have a clear focus on energy-related issues.
In contrast, issues related to material use, resource efficiency and e-waste generation
(together: contribution to the circular economy) are still insufficiently covered by the
metrics. With regard to climate protection, leakage quantities of refrigerants from cooling
systems and the associated greenhouse gas emissions are still insufficiently recorded.
2.3.2. Main lessons for Electronic Communications Services and Networks –
reporting, assessing, and measuring environmental sustainability
Task 1.2 of this report investigated which indicators exist to measure and report the energy
efficiency and environmental impacts of telecommunications networks. The indicators are
used by companies in practice both for their reporting (Task 1.2.1) and for the planning and
operation of energy-efficient networks (Task 1.2.2). As measurement methods and standards
(Task 1.2.3), there are a large number of technical documents that support the companies. It
was examined whether the existing reporting methods are suitable for reaching consumers
(Task 1.2.4). It was also shown which indicators and minimum requirements are suitable for
predicting the efficiency and environmental impact of networks even before they are built (Task
1.2.5). The most important findings from these investigations are summarised below.
1. Reporting: For reporting, established and cross-sectoral standards are preferred (GRI,
GHG protocol, CDP, ISO 14001/50001). The target groups for reporting are
professionals and investors. Consumer communication is only secondary, and when it
does take place, it tends to be at a general level and highlights the positive effects of
the digital transformation.
2. Assessment and Planning: For the planning of new networks and the expansion of
existing ones, the voluntary Code of Conduct for Broadband Equipment is an important
orientation for the energy efficiency of network equipment. It is used by most ECNs to
set minimum requirements when purchasing new equipment. In addition, enterprises

203
specify requirements for the service life and support time when purchasing, which
contributes to resource conservation.
3. Standards: There are a variety of methods and standards for determining the energy
consumption and efficiency of network equipment. The most important of these are
defined by the standards organisations ITU and ETSI. The ECNs thus have a
sufficiently differentiated toolbox of methods to make use of and to report in a
standardised form. Unfortunately we do hardly find examples actually used in practice
at least in the publications which the network operators use to communicate to their
end-users.
4. Consumer perspective: There are no established labels and metrics for communicating
the environmental benefits of telecom services and comparing different providers yet.
In the context of this project, proposals were developed on how information on
telecommunication services could look like, based on the energy efficiency labelling.
5. Energy-efficient networks: The energy efficiency of different electronic communication
networks differs. This is particularly due to technical reasons. Mobile networks require
more energy than wired networks. Newer technologies are more efficient than older
ones. Nevertheless, there are specific criteria that can be taken into account
(regardless of the technology) when planning new networks that will lead to
inefficiencies being reduced and networks becoming more sustainable overall.
204
3. Final Results Part 2 – Policy Options
3.1. Goal and operationalisation
3.1.1. Goal
Given the analysis of definitions of data centres (DCs) (results of Task 1.1.1), the
recommended indicators and methods (results of Task 1.1.3), and the identified pathways to
increase circularity and energy efficiency (results of Tasks 1.1.2), as well as the findings on
the indicators and standards for electronic communications services and networks (ECNs)
(results of Task 1.2), the main objective in part 2 of this study is to assess and compare the
expected environmental, social and economic impacts of i) potential policy measures and
mechanisms for greening data centres and ii) potential policy options for an EU-wide
transparency measure on the environmental footprint of ECNs focussing on energy
consumption and GHG emissions. The ultimate goal is to find measures and mechanisms that
are suitable to reach the general objective of improving energy and resource efficiency while
avoiding negative economic and social impacts.
Specifically with respect to the ECNs the study objective handled in this chapter is to propose
policy options that could be included in a transparency mechanism on the environmental
footprint of ECNs toward end-users. This would enable them to choose electronic
communications providers on the basis of information on environmental friendly options. This
chapter will also assess the potential impact of voluntary and mandatory transparency
mechanisms on the environmental footprint of ECNs and relevant stakeholders.
The following section will hightlight the operationalisation. The next sections will present the
results and findings for DCs (Task 2.1.1.) and for ECNs (Task 2.2.1.).
3.1.2. Operationalisation: a systematic funnel approach based on intervention logic
with focus on the impacts
In essence the methodology follows a funnel approach starting from the insights and results
of the previous chapter and zooming into more detail for the most promising and effective
measures in terms of impact. An intermediate version of the measures for DCs has been
discussed at an online stakeholders workshop June 4th, 2021. Certain measures were
welcomed and unilaterally validated others were qualified. The Final Report incorporates the
workshop input as to obtain a more nuanced, mature, yet independent result.
For the DCs the steps of the funnel approach are presented in Figure 36. The steps are the
following:
1. Initial assessment and overview of existing policy measures and options: a broad
brush assessment and short presentation of existing policy measures that have been
identified indicating whether the objective of the encompassing directive, regulation,
use of targets, etc. is or could be in line with the general objective of increasing the
energy efficiency and/or circular economy performance of data centres. This step
ensures only the most relevant policy measures are included for further analysis.

205
2. Comparative analysis of the intervention logic of existing policy measures: an
concise overview is made of the existing policy measures’ intervention logic in order to
better identify and select the most appropriate policy measures.
3. Potential policy options to improve the climate and environmental performance
of DCs and cloud computing: some of the proposed measures in the Terms of
Reference are straightforward in their operationalisation and can immediately be used
as a starting point for an impact assessment, while others need further elaboration.
Based on the work in Part 1 of the study we also introduce new potential policy
measures.
4. Ranking of the policy options and analysis of the main impacts: the assessment
results of the previous steps allows to indicate the most pertinent existing policy
measures and elaborate potential options for change in view of reaching better energy
efficiency and circularity practices, as well as sustainability transparency criteria for
ECNs.
Given the slightly different objective for the ECNs, a similar approach is followed yet with more
emphasis on policy options for transparency measures that could contribute to making ECNs
more energy efficient and more climate neutral.
Figure 36: Funnel approach for identifying and analysing policy measures and options
Source: IDEA Consult
To assess and compare the policy options, the different elements of the intervention logic have
been analysed using the results from chapter 2 - based on independent desk research,
interviews with stakeholders and most notably the stakeholder surveys with DC and ECN
operators as well as with consumer organisations. For the policy analysis a step-wise
Impact assessment and ranking
Formulation and
comparison policy
measures
Intervention logic
assessment
Long list potential relevant existing policies

206
approach in line with the Better Regulation Guidelines has been used in order to provide a
valuable basis for further impact assessment work by the Commission.
The next sections focus on the formulation and comparison of the policy measures that were
identified to foster the greening of DCs and to make the ECNs more energy efficient and
climate neutral.
3.2. Task 2.1.1. Policy options for Data Centres and Cloud Computing
3.2.1. Description of potential policy options
We identified a set of 12 potential policy measures that may foster the greening of DCs. A
visual overview is presented in Figure 37. One can distinguish two dimensions: policy strategy
and the nature of the impact. In terms of policy strategy one can distinguish between 1)
adjusting existing policy measures making them more fit for purpose for the data centres, and
2) introducing entirely new policy measures. The nature of the impact can be direct – with
policy measures specifically focussing on data centres, and indirect - with measures that cover
a wider set of economic activities yet which also apply to data centres.149 The policy measures
presented in this study focus particularly on the ones with a direct impact on greening DCs
while also exploring how the the policy measures with an indirect impact relate to DCs.
149 For proper interpretation it has to be indicated that the selected long-list of existing policy measures is not an exhaustive list of Directives and Regulations that apply to DCs. Based on our analysis and insights these are the most relevant ones for greening DCs.

207
Figure 37: Conceptualisation of a DC and related policies with direct and indirect impacts
Source: IDEA Consult
Notes: 1. EU Code of Conduct for Data Centre Energy Efficiency 2. Green Public Procurement 3. Ecodesign Regulation on servers and data storage products (currently under review) 4. Sustainable Finance Taxonomy 5. Self-Regulation initiative – new policy 6. European Data Centre Registry – new policy
7. Energy Efficiency Directive 8. Waste from Electrical and Electronic Equipment 9. Eco-Management and Audit Scheme 10. Corporate Sustainability Reporting 11. Energy Performance of Buildings Directive 12. Environmental Performance of Products and Businesses Initiative – substantiating claims

208
We identified six policy measures focusing explicitly on DCs, either on DCs alone as in the
CoC, Self-Regulation and EU Data Centre Registry or explicitly referring to DCs as part of a
policy focused on the wider value chain, such as the GPP, ecodesign and SFT.
A further set of six policies can be identified that do pertain to DCs, yet are not particularly
focused on them and as such exert a rather indirect impact on DCs in the sense that these
measures are targeted at a wider set of companies and sectors, which also relate to DCs. This
section discusses the main environmental, social and economic impacts that can be expected
from the proposed policy measures on the basis of independent research and insights. Each
measure is described with its own policy context and policy intervention logic. For the
measures that have a direct impact on DCs we separately document the insights, appreciation
and remarks of the stakeholders as discussed and obtained during the workshop June 4th,
2021 and in the wake of it.
In the first instance each measure is taken in isolation. Yet where possible, cross-references
and aspects of coherence and consistency with other measures are highlighted. We focus on
the measures with a direct impact on DCs first before providing a summary of the policies with
indirect impact, which reach beyond data centres and have further ecological and social
qualities to them.
Policy options with a direct impact
The EU Code of Conduct on Data Centre Energy Efficiency (CoC)
Context
The European Commission, JRC-led EU Code of Conduct on Data Centre Energy Efficiency
was established in 2008 as a response to the lack of EU regulation or industry initiatives to
address energy efficiency. The CoC is in essence a voluntary commitment of companies to
monitor their energy consumption and to achieve reduced energy consumption in a cost-
effective manner by the adoption of best practices in a defined timescale150. The CoC is
primarily addressed to data centre owners and operators that can become participant in the
CoC, and secondly to the supply chain and service providers which may become endorsers151.
The obligation to monitor energy consumption is directed at participants. Endorsers and
participants have different sets of best practices. Moreover, the CoC provides a platform for
European stakeholders. This means participants and endorsers can proactively bring their
practices and ideas to the table, discuss them and agree upon them.
Participation in the Code of Conduct and energy efficiency
At the time of the study there were 145 companies registered on the website as participant,
including well-known companies such as Facebook Ireland LTD, Google Data Centres,
150 See e.g. Bertoldi, P., Avgerinou, M., Castellazzi, L. (2017) Trends in data centre energy consumption under the European
Code of Conduct for Data Centre Energy Efficiency, EUR 28874 EN, Publications Office of the European Union, Luxembourg, 2017, ISBN 978-92-79-76445-5, doi:10.2760/358256, JRC108354
151 Endorsers could include vendors and manufacturers, consultants and engineering firms, utilities, customers of data centre services, industry associations and standards bodies (EU Code of Conduct on Data Centre Energy Efficiency. Endorser Guidelines and Registration Form. Version 3.1.0)

209
Capgemini and IBM Europe, representing a total of 326 data centres, and 261 endorsers152.
A study conducted by JRC153 shows that among CoC participants, the PUE declined year after
year which indicates the potential effectiveness of such a voluntary initiative. The average
PUE value reported was 1.64 in 2016. To determine the effectiveness of participation to the
CoC one would, however, need to compare the PUE performance of participants to a group
of companies that are similar but didn’t participate in the CoC (i.e. a control group). Therefore
we recommend to assess the possibility to perform more rigorous statistical analysis
that includes the performance of a control group to determine whether participation
yields a better PUE performance over time (e.g. in a counterfactual analysis). Furthermore,
to the best of our knowledge, the latest reported average PUE value of participants dates back
to 2016. To increase transparency on progress made and potentially a competitive
market drive, this exercise (i.e. reporting at least the average PUE) could be performed
more regularly (for example annually) and be made publicly available and easily
accessible.
Defining data centres in the Code of Conduct
The CoC takes into account the complexity of the data centre market not only by making the
distinction between participants and endorsers, but also by considering various sizes of data
centres, existing and new data centres, various participant types, several areas of
responsibility, and multiple types of best practices. The general definition the CoC applies to
describe data centres is “…all buildings, facilities and rooms which contain enterprise servers,
server communication equipment, cooling equipment and power equipment, and provide
some form of data service (e.g. large scale mission critical facilities all the way down to small
server rooms located in office buildings)”154. As the CoC is a well-known instrument used
by many organisations involved in the data centre market, it could be used as an
instrument to propagate a clear definition of what exactly constitutes a data centre. It
would be recommended to further align this definition with the one that will be used in
EN50600 to avoid further confusion. Proposed changes to the definition used in EN50600
are presented in section 2.1.
With respect to types of participants, the CoC provides five categories: operator, CoLo
provider, CoLo customer, Managed Service Provider and Managed Service Provider in
CoLo155. Although the various categories are well-explained in the CoC, consistent with
our findings in section 2.1, we recommend avoiding the use of the term managed
152 Own calculations based on publicly available data on the E3P website ( https://e3p.jrc.ec.europa.eu/communities/data-
centres-code-conduct) .
153 Bertoldi, P., Avgerinou, M., Castellazzi, L. (2017) Trends in data centre energy consumption under the European Code of Conduct for Data Centre Energy Efficiency, EUR 28874 EN, Publications Office of the European Union, Luxembourg, 2017, ISBN 978-92-79-76445-5, doi:10.2760/358256, JRC108354
154 EU Code of Conduct on Data Centre Energy Efficiency. Participant Guidelines and Registration Form. Version 3.0.0.
155 CoLo provider: operates the data centre for the primary purpose of selling space, power and cooling capacity to customers who will install and manage IT hardware. CoLo customer: owns and manages IT equipment located in a data centre in which they purchase managed space, power and cooling capacity. Managed Service Provider: owns and manages the data centre space, power, cooling, IT equipment and some level of software for the purpose of delivering IT services to customers. This would include traditional IT outsourcing.Managed Service Provider in Colo: A managed service provider which purchases space, power or cooling in this data centre.
210
service provider. Furthermore, although various types of participants are defined, the
CoC does not define data centre types in the participant or best practices guidelines.
Various data centre types are included, however, in the reporting form (excel file): traditional
enterprise, on-demand enterprise, telecom, HPCC, hosting, internet, hybrid. Along the same
line of reasoning as above, it would be beneficial for reasons of clarity and coordination
to further align these categories with the definitions that will be used in EN50600 and
add these to the participant or best practice guidelines documents.
The CoC is in line with the fact that situations arise where organisations do not control the
entire data centre. Operators or owners that are not responsible for all aspects of the data
centre can still sign as a participant but have to act as an endorser for the practices outside of
their own control. The areas of responsibility they consider are very well defined and can be
seen as an elaboration of the data centre layers we provided in section 2.1: the physical
building, mechanical and electrical plant, data floor, cabinets, IT equipment, operating
system/virtualisation, software. In contrast to our data centre layers, the CoC also includes
business practices as an area of responsibility, indicating the responsibility to determine and
communicate business requirements for the data centre. This includes the importance of
systems, reliability, availability and maintainability specifications and data management
processes.
Combining the types of participants with the areas of responsibility, the Best Practices
Guidelines provide a clear overview of which of the practices apply to participants based on
their areas of responsibility. This is in line with our suggested approach in section 2.1 to be
clear about whom exactly is targeted in which data centre layer. Furthermore, the best
practices are divided into practices for entire data centres (including existing IT, mechanical
and electrical equipment), new software, new IT equipment, new building or retrofitting and
optional practices.
Specific options to improve the Code of Conduct
Despite the fact that the CoC is already quite fit for purpose concerning greening DCs, we
have identified four ways in which it could be changed in order to foster the further greening
of DCs and cloud computing.
The introduction of quantitative energy efficiency goals
The rationale behind the introduction of quantitative energy efficiency goals next to the
obligation to monitor and report energy consumption and the implementation of best practices
is to increase, at a faster pace, the energy efficiency of data centres.
Several important challenges arise when considering this measure:
• The diversity in data centres and the various levels of responsibility makes a single energy
efficiency goal hard to justify. The same goes for minimum efficiency requirements. The
absence in the Code of Conduct on Data Centre Energy Efficiency of a minimum efficiency
requirement is a consequence of the diversity of data centres and the various levels of
responsibility. In the aforementioned JRC-study it is stated that this diversity makes it not
possible to set a minimum efficiency requirement for data centres. This is why this Code
of Conduct, as opposed to the others (e.g. on Broadband Communication Equipment or
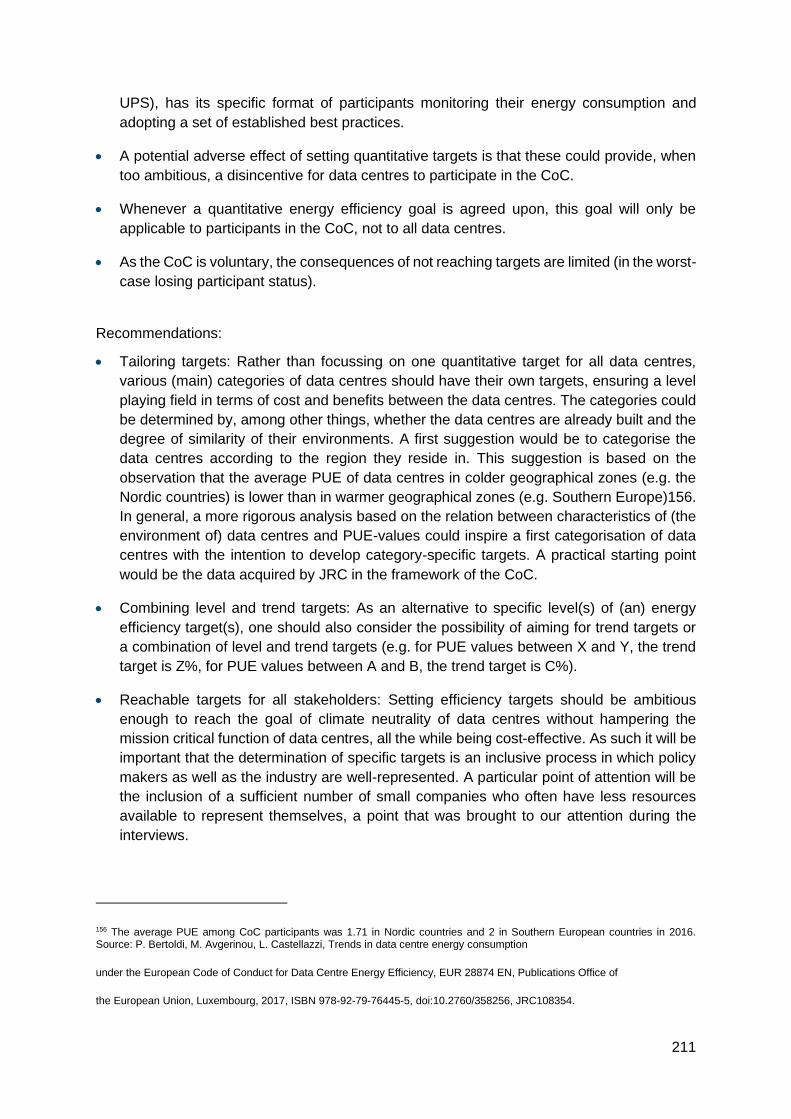
211
UPS), has its specific format of participants monitoring their energy consumption and
adopting a set of established best practices.
• A potential adverse effect of setting quantitative targets is that these could provide, when
too ambitious, a disincentive for data centres to participate in the CoC.
• Whenever a quantitative energy efficiency goal is agreed upon, this goal will only be
applicable to participants in the CoC, not to all data centres.
• As the CoC is voluntary, the consequences of not reaching targets are limited (in the worst-
case losing participant status).
Recommendations:
• Tailoring targets: Rather than focussing on one quantitative target for all data centres,
various (main) categories of data centres should have their own targets, ensuring a level
playing field in terms of cost and benefits between the data centres. The categories could
be determined by, among other things, whether the data centres are already built and the
degree of similarity of their environments. A first suggestion would be to categorise the
data centres according to the region they reside in. This suggestion is based on the
observation that the average PUE of data centres in colder geographical zones (e.g. the
Nordic countries) is lower than in warmer geographical zones (e.g. Southern Europe)156.
In general, a more rigorous analysis based on the relation between characteristics of (the
environment of) data centres and PUE-values could inspire a first categorisation of data
centres with the intention to develop category-specific targets. A practical starting point
would be the data acquired by JRC in the framework of the CoC.
• Combining level and trend targets: As an alternative to specific level(s) of (an) energy
efficiency target(s), one should also consider the possibility of aiming for trend targets or
a combination of level and trend targets (e.g. for PUE values between X and Y, the trend
target is Z%, for PUE values between A and B, the trend target is C%).
• Reachable targets for all stakeholders: Setting efficiency targets should be ambitious
enough to reach the goal of climate neutrality of data centres without hampering the
mission critical function of data centres, all the while being cost-effective. As such it will be
important that the determination of specific targets is an inclusive process in which policy
makers as well as the industry are well-represented. A particular point of attention will be
the inclusion of a sufficient number of small companies who often have less resources
available to represent themselves, a point that was brought to our attention during the
interviews.
156 The average PUE among CoC participants was 1.71 in Nordic countries and 2 in Southern European countries in 2016. Source: P. Bertoldi, M. Avgerinou, L. Castellazzi, Trends in data centre energy consumption
under the European Code of Conduct for Data Centre Energy Efficiency, EUR 28874 EN, Publications Office of
the European Union, Luxembourg, 2017, ISBN 978-92-79-76445-5, doi:10.2760/358256, JRC108354.

212
Box 8: Workshop feedback on quantitative energy efficiency goals in the CoC
Overall one may state that according to the participants, setting energy efficiency targets
for DCs across the EU within the CoC will be challenging and potentially contested for
several reasons:
i. Regional differences in climate;
ii. Differences in degrees of renewable energy supply and valorisation potential of
excess heat in industrial symbiosis applications;
iii. Differences in business operating models, redundancy levels, etc.
Nonetheless it was indicated that DC activities can be clearly defined and in terms of PUE
clear target ranges can be set potentially taking into account the differences in climate,
renewable energy access and business models. The overall sentiment was therefore to
keep the best practices approach and the voluntary nature of the CoC.
On the basis of the discussion it is clear that a “one size fits all” approach will potentially be
counter- productive from a policy perspective. The participants did not go so far as to
indicate what their strategies would be if the CoC was to include quantitative energy
efficiency targets. Yet the concern for having a level playing field in the EU was emphasised,
as well as the importance of return on investment. The sheer technical complexity of the
matter was perceived as another factor to be taken into account.
It was endorsed that the CoC contributed to the greening of DCs. From this point of view
one could propose to introduce a widely accepted quantitative energy efficiency target such
as the PUE, in combination with a range that reflects the regional differences across the
EU. A classification of data centres could help compare data centres that are within the
same classes (access to renewable energy, size, regional climate and waste heat
valorisation) and set quantitative targets for each class.
Tier-system label indicating the adoption rate of best practices and mandatory best practices
The introduction of new minimum expected levels of energy savings currently happens by
focusing on the application of new activities157 rather than specific quantitative energy savings
targets. Although a value is assigned to each of the practices, these values are not intended
to be aggregated to provide an overall ‘operator score’ and for good reasons as this would
require, so it is stated, large scale data on the effects of each practice or technology which is
not yet available. Also a complex system of scoring representing the combinational increase
or reduction of individual practice values within that specific facility is a challenge. Although
such a scoring system would be useful in terms of transparancy and competitiveness, the
process of developing it seems very costly.
157 Practices to become minimum expected in 2022 and items under consideration are listed in the 2021 Best Practice Guidelines (Version 12.1.0).

213
The introduction of new expected energy savings activities boils down to making these
practices ‘mandatory’ in the sense that participants should implement them within an agreed
time period and can lose their participant status when they are not implemented. In practice
the image is more nuanced: it is recognised in the CoC that not all operators are able to
implement all the minimum expected practices due to physical, financial and other kind of
constraints. In these cases, an explanation needs to be provided describing the type of
constraint, and if possible, recommending alternative practices as replacements aiming to
obtain the same energy savings. This nuance is important and helps explaining the fact that
in 2016 only 16 participants implemented all 81 mandatory practices. In Figure 38 an overview
is given of the frequency of best practices adopted by data centres in 2016 showing that,
among other things, the majority of data centres adopts between 26 and 50 best practices.
Figure 38: Frequency of best practices adopted by data centres participating in the CoC in 2016
Source: Bertoldi et al. (2017)
This finding suggests that adding new practices as mandatory could potentially only have a
limited effect as there is no guarantee the practices will effectively be adopted. This does of
course not mean new practices have no use. On the one hand, data centres still have to
motivate why these practices can’t be adopted and propose solutions and, more general, they
are essential in providing knowledge about measures that can be implemented to obtain a
higher level of energy efficiency.
Recommendations
• Tier-system labels: Therefore it could be considered to develop a CoC participant label
that includes an indication of how many best practices are adopted. This could provide an
incentive to data centres to adopt at a faster rate (new) expected and optional best
practices. Such a system could be indirectly based on the number of best practices

214
adopted by working with, as is standard in the field, a tier system of activities improving
energy efficiency, a suggestion that was also made by a survey respondent. To be
thrustworthy, however, a third-party monitoring and certification system should be
established (see below).
Box 9: Workshop feedback on introducing a tier-system label indicating the adoption rate of best practices in the CoC
The participants did not perceive a great value added in providing a label for the degree to
which best practices are being taken up. This is not to say that the practice doesn’t exist
already. The UK-based CEEDA does grade the CoC best practices into tier levels (bronze,
silver, gold) and includes both mandatory and optional practices. Besides the challenge of
assigning appropriate scoring and defining the thresholds, it was argued that a tier-system
label would still give no information on the overall efficiency of the DC. The Data Centre
Maturity Model, which is still under development, was considered as a potentially more
promising approach. Furthermore, as a consequence, in the light of the sector’s response,
the environmental, economic and social impact that were initially derived and that were
presented in the discussion paper have been reassessed (see below).
The establishment of a third-party monitoring obligation for participants
Currently, the number of best practices implemented and the energy consumption is self-
reported. As such, the establishment of a third-party monitoring obligation on the
implementation of best practices and energy consumption could potentially lead to more
accurate data and provide a more trustworthy state of progress on energy efficiency practices.
There is some evidence of incorrect self-reporting to be found in the 2017 study led by JRC
that clarifies that in three cases (a little more than 1% of the data points) PUE-values smaller
than 1 were reported. This is technically impossible as it implies higher IT consumption than
the overall energy consumption of the facility. More importantly, data centre operators and
owners have an incentive to overstate their real levels of energy savings to obtain (and retain)
participant status and the label associated with it which can then be used as a marketing tool
as such a label is meant to help potential data centre customers to make informed decisions.
A thrustworthy label, that could also include an indication of the number of best practices
applied (cf. supra), should therefore be based on a certification process that requires third-
party monitoring.
Establishing a fully-fledged third-party monitoring system to monitor each participant
periodically and make it obligatory would require participants to pay the providers of these
services. Especially smaller data centres might be discouraged to participating in the CoC due
to a potential imbalance between costs incurred, which are short-term, and potential benefits,
which might only incur in the longer term. However, as a side effect, it would create
employment in the organisations providing the monitoring services. The implementation of
such a system, however, would require, among other things, significant investments in the
selection, training and management of third-party monitors.

215
If the objective of establishing a monitoring obligation is mainly to acquire correct data on
energy consumption and savings activites, potentially a cost-efficient solution could be to
establish a system of random inspections of participants. This could, given a sufficiently high
probability of being inspected, encourage companies to report more carefully.
Box 10: Workshop feedback on third-party monitoring obligation for participants in the CoC
Overall third-party monitoring and certification was perceived as a valuable idea to pursue
further, although the financing could be an issue as well as obtaining the right information,
especially if it is confidential. The independence of the certifyers would be key as well as a
proper protocol as to what exactly to report, for which period (e.g. a year), confidentiality
clauses, and ways to report and display aggregated and anonymized information. Since
potential solutions can be formulated concerning the financing and confidentiality issues
raised, this seems to be a feasible improvement of the CoC.
Tools for increasing participation in the CoC
Various ways can be envisioned to increase participation in the CoC, which even without
additional changes as portrayed above would contribute to greening DCs. A number of
concrete suggestions can be made, such as:
• The development of a simple online tool instead of the excel reporting form;
• The development of a dedicated website for the CoC that is search engine optimised;
• Proactively contacting (companies with) smaller data centres that potentially lack
resources to represent themselves in the CoC;
• The development of a multichannel communication strategy to communicate about the
CoC, e.g. on the awards.
Participation can also be increased by extending the scope of the CoC to cover cloud
computing. Given our definition of cloud services in section 2.1, the current scope of the Code
of Conduct already includes cloud computing, albeit without using the term explicitly.
Organisations that offer cloud services could be currently registered as colo operator, colo
customer, managed service provider, or managed service provider in colo depending on the
services offered. If the term was to be explicitly included in the CoC, it should be defined
properly. Furthermore, it could be asked in the reporting form whether organisations see
themselves as providers of cloud services given this definition.
As the CoC is a central instrument for greening DCs, the incorporation and reference in other
pieces of legislative work may be an effective means to increase participation. Examples are
the Inclusion of the requirements in the Ecodesign Regulation on servers and data storage
products, or the reference to CoC in the Sustainable Finance Taxonomy.

216
Box 11: Workshop feedback on tools to increase participation in the CoC
This policy suggestion was very much welcomed. Reaching out to SME DCs fits within
current EU policies for digitalisation and SME policies, in order to help to bridge the gap in
comparison with large players. As one of the participants suggested this could be linked to
the EU Data Centre Registry. Additionally, this could also help in streamlining DCs for
investments and financing according to the Sustainable Finance Initiative.
Given the preference for the CoC to remain voluntary, the communication of the
advantages, both in terms of reduced environmental impact, as in terms of business and
financing potential could be emphasized more strongly. After all, energy efficiency does pay
back through cost reductions. This could in turn lead to an increased number of DCs
adopting the CoC and ultimately to a minimum critical market size of DCs that apply and
adhere to the CoC. Consequently the energy and resource efficiency of the DC sector as a
whole would improve.
In this respect the definition of DCs plays an important role and particularly the size classes.
Individually large DCs do have an important effect both environmentally as well as
economically and socially, yet combined small DCs in an edge computing setting generate
undoubtedly equally important effects.
Other suggestions included creating learning tools for improving energy efficiency and
present these on the dedicated website or platform. Additionally a dedicated discussion
forum where both stakeholders, researchers, policy makers and DC experts can share
contributions, figures and information was also perceived as having a strong value added,
especially for the small players in the field.
Overview of potential impacts
Table 37 presents an overview of the expected main environmental, economic and social
impacts as well as the cause and effect mechanisms through which the policy measures
generate impacts for the four measures of the CoC.

217
Table 37: Overview of expected main potential impacts for CoC policy options
Policy option
and suggested
changes
Environmental
impact Economic impact Social impact
Quantitative
energy
efficiency
goals,
regionally
differentiated
Imp
ac
t
Reduced energy
intensity of the
economy, reduction
of GHG emissions
Reduced energy
costs, facilitation of
introduction and
dissemination of
new technologies
- Better informed
businesses and
consumers;
- Creation of jobs
Me
ch
an
ism
Quantitative
targets, push
participants to
improve energy
efficiency
Value added
creation from
energy efficiency
investments
Jobs resulting from
energy efficiency
investments, with
emphasis on green
skills
Tier-system
label indicating
adoption rate of
best practices
Imp
ac
t
Potentially reduced
energy intensity of
the sector, and
reduction of GHG
emissions, yet
probably rather
limited effect
- Reduced energy
costs;
- Facilitation of
introduction and
dissemination of
new technologies
- Overall limited
effects
- Better informed
public (B2B, B2C);
- Creation of jobs
directly and
indirectly (upstream
of the value chain)
- Overall limited
effects
Me
ch
an
ism
Potentially more
incentives to adopt
best practices,
and/or better
knowledge on
barriers and
possible solutions,
yet uptake quite
uncertain.
- Awareness and
adoption of best
practices;
- Derived demand
for R&D&I and
knowledge creation
- yet uncertain
uptake
- Awareness and
adoption of best
practices;
- Derived demand
for R&D&I and
knowledge creation
- Yet uncertain
uptake
Third-party
monitoring (&
certification) Imp
ac
t
Reduced energy
intensity of the
economy, reduction
of GHG emissions
- Better business
and consumer
information
- Additional costs
on businesses
- Better informed
public (B2B, B2C,
B2G)
- Creation of direct
jobs
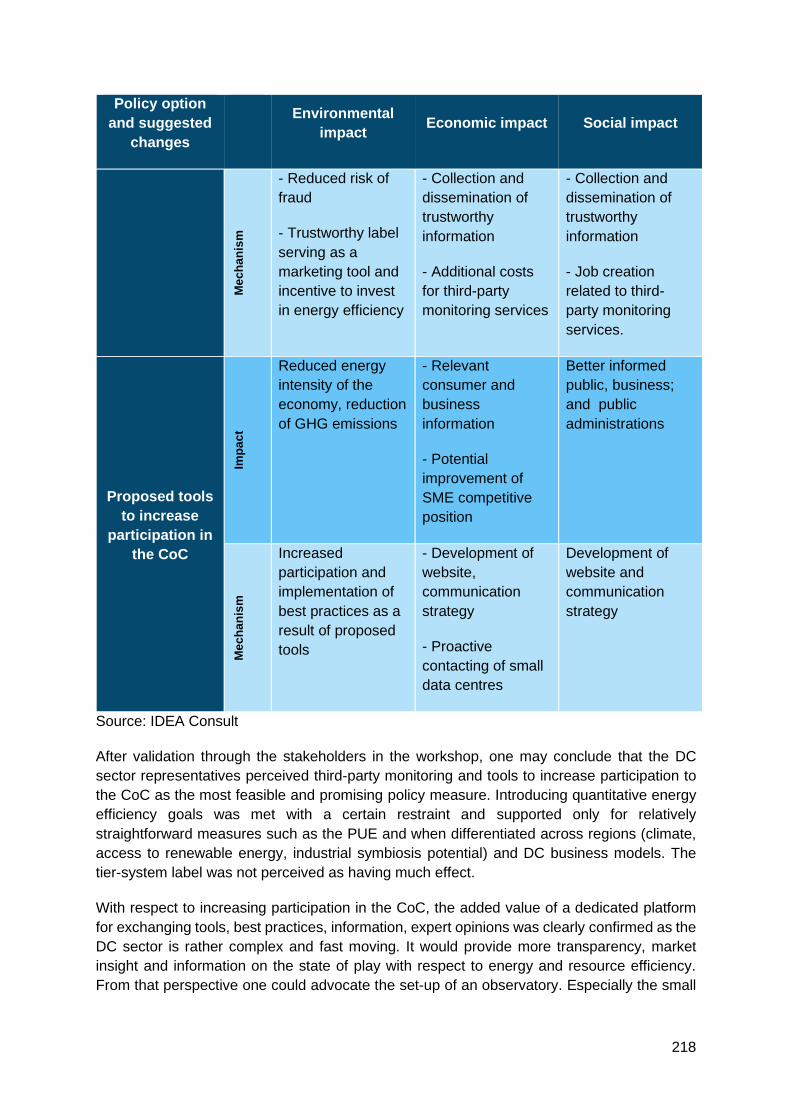
218
Policy option
and suggested
changes
Environmental
impact Economic impact Social impact
Me
ch
an
ism
- Reduced risk of
fraud
- Trustworthy label
serving as a
marketing tool and
incentive to invest
in energy efficiency
- Collection and
dissemination of
trustworthy
information
- Additional costs
for third-party
monitoring services
- Collection and
dissemination of
trustworthy
information
- Job creation
related to third-
party monitoring
services.
Proposed tools
to increase
participation in
the CoC
Imp
ac
t
Reduced energy
intensity of the
economy, reduction
of GHG emissions
- Relevant
consumer and
business
information
- Potential
improvement of
SME competitive
position
Better informed
public, business;
and public
administrations
Me
ch
an
ism
Increased
participation and
implementation of
best practices as a
result of proposed
tools
- Development of
website,
communication
strategy
- Proactive
contacting of small
data centres
Development of
website and
communication
strategy
Source: IDEA Consult
After validation through the stakeholders in the workshop, one may conclude that the DC
sector representatives perceived third-party monitoring and tools to increase participation to
the CoC as the most feasible and promising policy measure. Introducing quantitative energy
efficiency goals was met with a certain restraint and supported only for relatively
straightforward measures such as the PUE and when differentiated across regions (climate,
access to renewable energy, industrial symbiosis potential) and DC business models. The
tier-system label was not perceived as having much effect.
With respect to increasing participation in the CoC, the added value of a dedicated platform
for exchanging tools, best practices, information, expert opinions was clearly confirmed as the
DC sector is rather complex and fast moving. It would provide more transparency, market
insight and information on the state of play with respect to energy and resource efficiency.
From that perspective one could advocate the set-up of an observatory. Especially the small

219
players in the DC market would benefit from this, which in the context of future potential
developments such as edge computing is important.
Clearly the definition as to what exactly is a DC becomes important for the further roll out of
the policy measures. The definition presented in part 1 of the report – Section 2.3.1. was
perceived by the workshop participants as feasible if one were to interpret the various
thresholds for the size bands in an optional manner rather than complying at all three criteria
together. For instance a DC could be classified as small if either it has a minimum floor space
between 100 m2 and 1000 m2, or 6 to 200 racks, or a power capacity between 50kW and
1MW. Requiring to fulfil all the three criteria at the same time was perceived as not feasible
and useful. With respect to the specific thresholds used it was noted that a minimum floor
space of 100m2 might even be on the large side. The minimum number of six racks and a
power capacity of 50 kW was not contested, nor were the thresholds for the large and
hyperscale deployments.
Green Public Procurement (GPP)
Context
GPP is primarily focussed on public authorities’ purchases and as has been argued before it
can therefore provide an important lead market effect generating the crucial minimum demand
for highly energy and material efficient solutions. GPP has a wide scope, yet recently quite a
number of efforts have been made to increase the performance criteria for ICT related
purchases such as monitors, tablets, smartphones, computers, printers, imaging equipment,
as well as entire data centres, server rooms and cloud services. Table 38 provides an
overview of adjustments to EU GPP criteria in 2020 and early 2021 in the field of data centres.
According to Alfieri et al. (2019) a trend can be expected for public authorities of having DCs
on their own property to moving outside their property boundaries towards colocation DCs and
services or even to MSPs (JRC 2019 p 89). The segment of cloud computing and edge
computing might therefore be attractive. However, just as is the case with private enterprises
also government services have areas where data protection and security is paramount (e.g.
defence, international relations, medical services) and where in-house ‘enterprise type’ of data
centre services are still the preferred option158.
158 Note that in Alfieri et al (2019) the data centres owned by public authoristies are also designated as ‘Enterprise data centres’. The central differentiating aspect with respect to other types of DCs is that both white-space IT equipment and the grey space auxiliary equipment and building are all in one hand. For a wider discussion of types of DCs we refer to chapter 2, section 2.1. of this report.
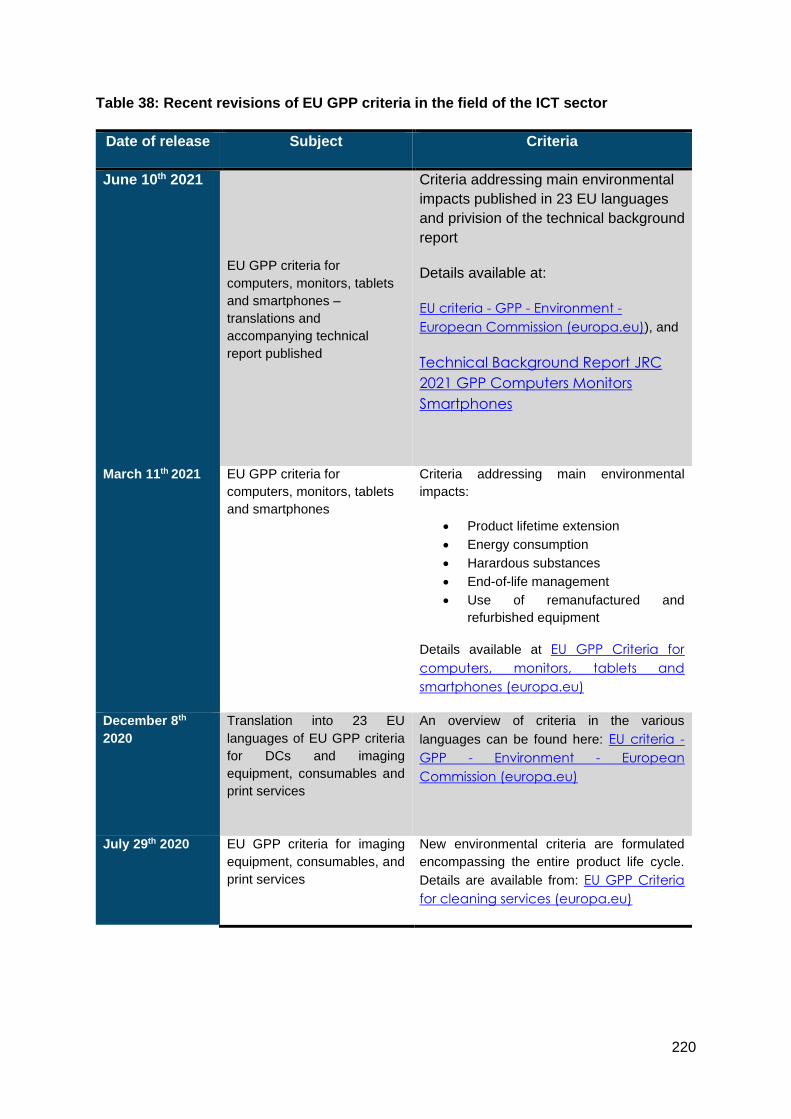
220
Table 38: Recent revisions of EU GPP criteria in the field of the ICT sector
Date of release Subject Criteria
June 10th 2021
EU GPP criteria for
computers, monitors, tablets
and smartphones –
translations and
accompanying technical
report published
Criteria addressing main environmental
impacts published in 23 EU languages
and privision of the technical background
report
Details available at:
EU criteria - GPP - Environment -
European Commission (europa.eu)), and
Technical Background Report JRC
2021 GPP Computers Monitors
Smartphones
March 11th 2021 EU GPP criteria for
computers, monitors, tablets
and smartphones
Criteria addressing main environmental
impacts:
• Product lifetime extension
• Energy consumption
• Harardous substances
• End-of-life management
• Use of remanufactured and
refurbished equipment
Details available at EU GPP Criteria for
computers, monitors, tablets and
smartphones (europa.eu)
December 8th
2020
Translation into 23 EU
languages of EU GPP criteria
for DCs and imaging
equipment, consumables and
print services
An overview of criteria in the various
languages can be found here: EU criteria -
GPP - Environment - European
Commission (europa.eu)
July 29th 2020 EU GPP criteria for imaging
equipment, consumables, and
print services
New environmental criteria are formulated
encompassing the entire product life cycle.
Details are available from: EU GPP Criteria
for cleaning services (europa.eu)

221
Date of release Subject Criteria
June 11th 2020 Publication of the technical
background report on EU GPP
criteria for DCs, server rooms
and cloud services
See: Dodd, N., Alfieri, F., Maya-Drysdale, L.,
Viegand, J., Flucker, S., Tozer, R.,
Whitehead, B., Wu, A., Brocklehurst F.,.
Develo pment of the EU Gr een Public
Procurement (GPP) Crit er ia for Data
Centres Server Rooms and Cloud Servic es ,
Final Technical Report,, EUR 30251 EN,
Publications Office of the European Union ,
Luxembourg, 2020, ISBN 978-92-76-19447-
7, doi:10.2760/964841, JRC118558
March 19th 2020 EU GPP criteria for DCs,
server rooms and cloud
services
New environmental criteria encompassing
the entire product life cycle covering various
procurement routes including buildings,
equipment, expansion, consolidation,
outsourcing and insourcing, operation and
maintenance. Details are available from EU
GPP Criteria for cleaning services
(europa.eu)
Source: IDEA Consult on the basis of information on the Commission’s website June 2021:
Green Public Procurement - Environment - European Commission (europa.eu)
Strong progress has been made towards stricter criteria in the area of energy and material
efficiency as well as a strengthening of underlying horizontal methodologies to better assess
the costs through Life Cycle Costing. However, the main issue remains that GPP is still a
voluntary exercise depending on the public authorities’ wilingness to follow the criteria, which
could be perceived as one of the sensitive points for reaching sufficient impact.
Making GPP criteria for DC related purchases mandatory
Therefore, making the EU GPP criteria mandatory for publicly procured DCs, server rooms
and cloud services could be a potential option to pursue. To this end, a number of routes can
be taken:
1. An increased replacement and depreciation of legacy DCs under the ownership of public
authorities and substitution with new, more performing equipment;
2. Continue to work with the existing legacy DCs – potentially stretching the life time, and
apply the new, more stringent EU GPP rules only for new purchases;
3. A further move to out- and insourcing of particular DC services thereby requiring to attain
to the EU GPP criteria for DCs;
4. A combination of the above.
The above options focus on a rather overall mandatory implementation. It could be possible
to focus on making only parts of the EU GPP criteria compulsory, e.g. the core EU GPP

222
criteria. The following section on the expected impacts focusses on the suggestion of making
the EU GPP mandatory in an aggregated manner.
Expected impacts
One of the latest empirical assessments on the uptake of GPP in the EU dates from 2012 –
see Renda et al. (2012). Among others it found that 26% of the contracts signed in 2009-2010
by public authorities in the EU included all surveyed EU core GPP criteria. If one makes the
assessment less stringent by using the condition of using at least one core EU GPP criterion,
the share of contracts was 55%. In other words the 50% GPP target for 2010 was not entirely
met. The study also found that an overall positive trend on GPP uptake could be found, yet
that it was highly divergent across Member States. Purchasing price was found to be the
predominant criterion to evaluate contracts.
A more recent study from Núñez Ferrer (2020) on how the EU’s public procurement framework
is contributing to achieving the climate and circular economy objectives comes to a similar
conclusion, albeit with a different methodology. Referring to the Energy Performance Buildings
Directive (2018/844/EU) and the Clean Vehicles Directive (2019/1161/EU) where specific
technical specifications were set in view of reducing carbon emissions, the author suggests
that on these fronts, substantially more successes were achieved in comparison to the
voluntary GPP measures.
In their study for the Commission on energy-efficient cloud computing technologies and
policies for an eco-friendly cloud market, Montevecchi et al. (2020) also put GPP forward as
a promising policy avenue yet at the same time observed that the uptake and implementation
of these criteria at the Member State level was still lagging behind. Particularly for GPP the
authors noticed a knowledge gap in GPP competence centres and advisory groups when it
came to energy efficient cloud computing. The authors perceive the implementation of the EU
criteria at the Member State level as a first essential step. Also (numerous) other studies
perceive GPP as a promising policy e.g. Canfora et al (2020), Dodd et al. (2020), Alfieri (2019),
yet hitherto impact assessments are to our knowledge at the moment of the study not
available159.
Lundberg et al. (2009) argue that from a welfare theory perspective it is by no means sure that
GPP is a cost efficient policy tool and whether it can promote entry into green procurement
markets or rather deter it. The authors argue that it is likely more cost efficient to use economic
tools such as taxes, subsidies, fees or emission permits. Evidently much will depend on the
practical implementation of the GPP and the authors conclude that still much research needs
to be done on the subject.
It is in the wake of this knowledge gap that it remains hard to assess what exactly the impact
of changing from voluntary to mandatory GPP criteria for DCs would generate. On the first
view public authorities would be obliged to adhere to the GPP rules and hence a larger market
for green, potentially innovative, solutions would result. Yet as argued by Núñez Ferrer (2020)
and Montevecchi et al. (2020) this still depends on the pace of transition of the EU GPP criteria
159 A similar observation was made by Montevecchi (2020) indicating that “for most of the analysed policy instruments of public and private procurement, no evaluations of their feasibily and effectiveness for energy-efficiency are available”, p. 19.

223
in national legislation, potentially creating at least temporal discrepancies in the internal EU
digital single market. Additionally it is by no means certain howthe competitive position of
current stakeholders will be affected. Will it be mainly the large established DCs that benefit
from the mandatory GPP criteria or can SME DC providers continue to access this important
market? What will be the innovative drive for both big and small? Earlier in this study reference
was made to the Circular Electronics Partnership mainly consisting of large stakeholders.
Given the widely acknowledged policy objective to correct for market imperfections in the field
of supporting R&D and SMEs these are not idle considerations. Additionally the impact might
also be co-determined by the future developments in the public DC segment. Will the main
modus operandi be the public ‘enterprise DC’ which in turn requires s a larger need for
specialised procurement knowledge, or will public authorities move towards out- and
insourcing, maybe colocation centres or edge computing? The latter modi allow for more
selectivity of criteria for specific segments. Nevertheless despite these uncertainties, from a
pragmatic, science-based, and political point of view making GPP compulsory could be
considered as a further consistent step towards climate neutrality.

224
Table 39: Overview of expected main impacts and transition mechanisms for mandatory EU GPP criteria
Policy option and
suggested
changes
Environmental
impact
Economic
impact
Social impact
Making EU GPP
criteria mandatory
Imp
ac
t
Increase in
energy and
resource
efficiency, and
reduction of GHG
(ceteris paribus)
of public data
centres
- Increased
demand for
green
technologies and
expertise (lead
market effect);
- Reduced
energy and
resource costs,
upstream value
added creation;
- Increased
public
expenditures in
the short term
- Higher demand for
green (data centre)
skills;
- Job creation direct
and indirect
Me
ch
an
ism
Green
procurement
specifications
leading to green
solutions
provided,
including
monitoring and
follow-up across
value chain
- Increased
demand for
green data
centre solutions,
generating value
added creation in
supplying
industries,
valorising R&I
- Increased
public budget
outlays in the
short term
through price
and quantity
effects. In the
longer term
potentially
increase in tax
revenues
Writing the
procurement
specifications,
providing the
solutions,
monitoring, requires
green data centre
know-how and skills,
which may feedback
on education and
training programmes
Source: IDEA Consult
225
Box 12: Workshop feedback on mandatory GPP criteria
Although the private DC market segment is considerably larger than the public one, it was
deemed feasible and desirable to make GPP rules compulsory. Also from a policy integrity
point of view mandatory GPP would be welcomed. The participants pointed to important
conditions such as:
i. An EU level playing field (all Member States need to participate);
ii. The need for an appropriate accounting method and standards;
iii. Avoiding introducing biases e.g. to size (due to economies of scale) and
iv. Giving small DC operators equal access to the public procurement market.
Ecodesign Regulation on servers and data storage products: stricter requirements
Context
The Ecodesign Regulation on servers and data storage products has been referred to earlier
in this report in the context of current market practices for improving the circularity of DC
hardware and IT equipment (Section 2.1., Task 1.1.2.), the methods for measuring energy and
resource efficiency of DCs in view of a harmonised measuring framework (section 2.1. Task
1.1.3.) and in the context of instruments to communicate the environmental benefits to
consumers for ECN services (Section 2.2., Tasks 1.2.1.a. and Task 1.2.4.). Clearly this is an
important piece of legislation that directly addresses the energy and resource efficiency of
products used in the DC value chain.
The Ecodesign Regulation on servers and data storage products from 15 March 2019160 aims
to limit the environmental impact of these products with a set of rules on energy efficiency
such as minimum efficiency of the power supply units and minimum server efficiency in active
state, maximum consumption in idle state and information on the product operating
temperature. In addition, the regulation includes circular economy aspects such as extraction
of key-components and of critical raw materials, availability of a functionality for secure data
deletion and provision of the latest available version of firmware.
At the time of the study the regulation undergoes an amendment procedure161. On February
the 1st 2021 the European Parliament Committee on the Environment, Public Health and Food
Safety recommended to raise no objections to the Commission’s amendments162. The
160 European Commission, (2019), Commission Regulation (EU) 2019/424 of 15 March 2019 laying down ecodesign requirements for servers and data storage products pursuant to Directive 2009/125/EC of the European Parliament and of the Council and
amending Commission Regulation (EU) no 617/2013, available from EUR-Lex - 32019R0424 - EN - EUR-Lex (europa.eu)
161 European Commission (2020) Draft Ecodesign Amendment, available from EC 2020 draft ecodesign amendment EN
162 European Parliament (2021) Recommendation for a decision B9-0107/2021 available from RECOMMENDATION FOR A
DECISION to raise no objections to the draft Commission regulation amending Regulations (EU) 2019/424, (EU)
2019/1781, (EU) 2019/2019, (EU) 2019/2020, (EU) 2019/2021, (EU) 2019/2022, (EU) 2019/2023 and (EU) 2019/2024 with
regard to ecodesign requirements for servers and data storage products, electric motors and variable speed drives,
refrigerating appliances, light sources and separate control gears, electronic displays, household dishwashers,

226
amendment defines a standard to measure active and idle state power in a standard manner,
namely ETSI EN 303 470163. Yet there is no discussion on stricter requirements or thresholds.
Hence the policy measure that we propose is to go a step further and introduce stricter
requirements for idle state power allowances and active state efficiency of servers and
introduce minimum thresholds on operation condition classes (allowed ranges for temperature
and humidity) for servers and storage products. Note however that the current Ecodesign
Regulation already includes an information requirement on the allowable range of
temperatures.
Expected impacts
Table 40 provides an overview of the main impacts that can be expected from introducing
stricter requirements. While the amendment can be considered as a milestone in the further
practical implementation of the Ecodesign Regulation on servers and data storage products,
in view of climate neutrality by 2050 it might be worth considering minimum requirements once
the methodology to measure active and idle state power has been accepted. The findings of
Talens Pieró et al. (2020)164 who analysed the policy making process of applying circular
economy principles for the Ecodesign Regulation for servers and data storage products,
suggest that this would not be an unsurmountable task. The authors conclude that key
conditions for a successful outcome are the inclusion of stakeholders from an early stage
onwards, and a debate supported by appropriate metrics.
Practically, the elaboration of stricter requirements would need an ecodesign preparatory
study, in which the requirements about idle and active state performance, material-relevant
requirements, and the operational conditions are formulated. Consequently even after the
adoption of the amendment, a preparatory study would be very useful to move further in the
process.
Using more resource and energy efficient products does not automatically lead to an overall
increase in efficiency and reduction of the environmental impacts. The processes and
business models in which these products are used are equally important. Yet it is fair to argue
that products that are more environmentally sustainable are a basic ingredient and even a
precondition for reaching an improved energy and resource efficiency of the DC as a whole.
In that respect synergies with the CoC can be helpful.
household washing machines and household washer-dryers and refrigerating appliances with a direct sales function
(europa.eu)
163 ETSI (2019) Final Draft ETSI EN 303 470 V1.1.0. (2019-01) Environmental Engineering (EE); Energy Efficiency measuring
methodology and metrics for servers, accessible from: EN 303 470 - V1.1.0 - Environmental Engineering (EE); Energy
Efficiency measurement methodology and metrics for servers (etsi.org)
164 Talens Pieró, L., Polverini, D., Ardente, F., Mathieux, F., (2020) Advances towards circular economy policies in the EU: The
new Ecodesign regulation of enterprise servers, in: Resources, Conservation & Recycling, vol. 154, available at: Advances
towards circular economy policies in the EU: The new Ecodesign regulation of enterprise servers - ScienceDirect

227
Table 40: Overview of expected main impacts and transition mechanisms for stricter requirements in the Ecodesign Regulation on servers and data storage products
Policy option
and suggested
changes
Environmental
impact Economic impact Social impact
Stricter
requirements
for idle and
active state and
introduction of
minimum
requirements
for operation
condition
classes
Imp
ac
t Contributing to
reduction of
environmental
impact
- Increased
demand for energy
and resource
efficient data centre
products;
- Eventually higher
investments
Increase in the
amount of jobs
(hours) for
specialised energy
efficient planning,
monitoring and
services
Me
ch
an
ism
The stock of ICT is
gradually being
replaced by more
efficient technology
Value added
creation from
energy efficiency
investments
Increased demand
for know-how,
skills, related to
production,
monitoring and
reporting
Source: IDEA Consult
Box 13: Workshop feedback on stricter requirements for servers and data storage products in the Ecodesign Regulation
This policy proposal was supported by the participants. Yet it was indicated that one should
pay attention to the entire product value chain, the context of the processes in which these
more environmentally friendly servers and data storage equipment are used and to an EU-
level playing field (EU Single Market). The scope could be broadened to cooling and heat
reuse, and more general to products in processes that are energy intensive.
The economic impact highlighted by the participants is in line with the one which was derived
independently in the preliminary assessement: increasing the standards might increase the
price of components, and may lead (ceteris paribus) to higher investments. Yet this may be
offset over time by a reduction in energy costs. The participants also pointed to the specific
needs of SMEs and the importance of proper planning and preparation of operations in
order to obtain efficiency gains for the DC as a whole.
228
The Sustainable Finance Taxonomy (SFT)
Context
The Sustainable Finance Taxonomy (SFT) or EU Taxonomy for short, is a common
classification system of sustainable economic activities using science-based critieria. Legally
it is in the form of a delegated act implemented by the Commission based on the EU Taxonomy
Regulation 2020/852, which entered into force the 12th of July 2020165. It is worth indicating
that the Taxonomy is a ‘binary tool for activities’, in other words the subject is the activity,
which can be included or excluded, and not the company, which may have activities that are
both included and excluded166. The aim is to help to direct more investments towards
sustainable projects and activities by using clear criteria and a common language for investors
and other financial market participants at large as well as for entrepreneurs and customers.
As such the ultimate goal is helping to meet the EU’s climate and energy targets for 2030 as
well as the objectives of the European Green Deal.
The EU Taxonomy is part of a wider set of policy instruments and is instrumental to the
implementation of the Corporate Sustainability Reporting Directive (CSRD) and the
Sustainable Finance Disclosure Regulation (SFDR). Within the CSRD, European
organisations subject to the Non-Financial Reporting Directive (i.e. large companies with more
than 500 employees and listed companies) will be required to disclose information on their
activities and to what extent they are environmentally sustainable. The SFT is expected to
enhance transparency and thereby also foster investor confidence regarding green
investments, counter greenwashing practices, and facilitate (cross-border) sustainable
investment by countering market fragmentation. As indicated by the Commission (2021) not
all activities that potentially have a strong contribution to reaching the EU environmental goals
are yet covered by the SFT Climate Delegated Act. The EU Taxonomy is to be perceived as
a “living document” that is expected to be updated over time167.
165 Regulation (EU) 2020/852 of the European Parliament and of the Council of 18 June 2020 on the establishment of a framework
to facilitate sustainable investment, and amending Regulation (EU) 2019/2088 , accessible from EUR-Lex - 32020R0852 - EN -
EUR-Lex (europa.eu)
166 European Commission (2021) Commission Staff Working Document, Impact Assessment Report Accompanying the document Commission Delegated Regulation (EU) …/… supplementing Regulation (EU) 2020/852 of the European Parliament and of the Council by establishing the technical screening criteria for determining the conditions under which an economic activity qualifies as contributing substantially to climate change mitigation or climate change adaptation and for determining whether that economic activity causes no significant harm to any of the other environmental objectives, Brussels, 04-06-2021, SWD(2021) 152 final, p.3.
accessible from: taxonomy-regulation-delegated-act-2021-2800-impact-assessment_en.pdf (europa.eu)
167 European Commission (2021) Communication from the Commission to the European Parliament, the Council, the European Economic and Social Committee and the Committee of the Regions: EU Taxonomy, Corporate Sustainability Reporting, Sustainability Preferences and Fiduciary Duties: Directing finance towards the European Green Deal, Brussels, 21-04-2021
COM(2021) 188 final, p. 4, accessible from: EUR-Lex - 52021DC0188 - EN - EUR-Lex (europa.eu)
229
The SFT Climate Delegated Act
The SFT Climate Delegated Act focuses on two of the six environmental objectives, namely i)
climate change mitigation and ii) climate change adaptation168. The Act contains a set of
specifications particularly focussed on sustainable investments related to DCs:
• Activities qualified as environmentally sustainable are:
o Practices listed in the CoC;
o Verified by independent third-party organisations and audited every three
years;
o If the CoC is not applicable, an explanation of the reasons, the alternatives
applied and the energy efficiency gains have to be reported;
o The global warming potential (GWP) of refrigerants used in the data centre
cooling system does not exceed the value of 675.
• Activities need to comply with the “do not significantly harm” criteria (DNSH) for
climate change adaptation, sustainable use and protection of water and marine
resources.
• For material efficiency the activity can be classified as environmentally sustainable
if:
o It complies with the Ecodesign Regulation on servers and data storage
products;
o It complies with the Hazardous substances Directive for electrical and
electronic equipment;
o It contains an adequate and documented waste management plan and
complies with the WEEE Directive
Streamlining with Important Projects of Common European Interest
Focusing on the uptake and financing of new and more energy and resource efficient
technologies for DCs, one could also envisage aligning the EU Taxonomy with the criteria to
select so-called Important Projects of Common European Interest (IPCEIs), as well as with
the guidelines on State aid for environmental protection and energy, which are currently both
under revision.
In the revision of the eligibility criteria for IPCEIs169, projects must present an important
contribution to the EU’s objectives, for example those stated in the European Green Deal, the
new Circular Economy Action Plan, the Digital Strategy, or the EU Industrial Strategy Update.
Considering that the Sustainable Finance Taxonomy incorporates all objectives stated in the
above-mentioned policy strategies and sets specific criteria for sustainable investments linked
to their objectives, we propose aligning the SFT criteria with the eligibiligy criteria for the
168 The other four objectives of the EU Taxonomy Regulation as specified in article nine are iii) sustainable use and protection of water and marine resources, iv) the transition to a circular economy, v) pollution prevention and control and vi) the protection and restoration of biodiversity and ecosystems. A second delegated act covering these four objectives is expected in 2022, (European
Commission (2021) website EU taxonomy for sustainable activities, accessible from: EU taxonomy for sustainable activities |
European Commission (europa.eu)
169 European Commission (2021), Criteria for the analysis of the compatibility with the internal market of State aid to promote the execution of important projects of common European interest, available at
https://ec.europa.eu/competition/consultations/2021_ipcei/draft_communication_en.pdf
230
selection of IPCEI projects and hence provide more leverage for financing the greening of
DCs.
In the same context it is important that sustainable investments are streamlined with the IPCEI
logic, which implies a correction for market failure for very innovative large scale (across
Member States), high TRL projects. Therefore the revision of the guidelines on State aid for
environmental protection and energy170 which aims at aligning the State aid guidelines with
the European Green Deal as well as regulations such as the SFT would be very instrumental.
In the inception impact assessment of this revision, it is considered requiring Member States
to identify, and make transparent, the contribution of State aid to environmental protection
based on the Taxonomy definitions. This revision will be an added safeguard for State aid
directed toward environmental protection, also as such efforts relate to DCs.
Expected impacts of implementing the Climate Delegated Act
The DC focssed specifications in the SFT Climate Delegated Act revolve around the
implementation of the CoC, yet at the same time they extend the scope including third-party
verification, puts a ceiling on GWP and introduces DNSH criteria for the non-climate
objectives. The Taxonomy functions as an integrating practical framework linking the CoC to
other environment focussed policies such as the Ecodesign Regulation and the WEEE
Directive. Therefore one would expect that the SFT Climate Delegated Act contributes to the
greening of DCs. Table 41 provides an overview of the main perceived impacts as
independently derived by the study team.
Early June 2021 the European Commission published the impact assessment report for the
Delegated Act on climate change mitigation and adaptation under the Taxonomy Regulation
(EU) 2020/852. Interesting for this study is the feedback from ICT-stakeholders that was given
on the draft version of the Delegated Act as of November 2020 and in the workshops and calls
for feedback from the Technical Expert Group on Sustainable Finance (TEG) and on the
inception impact assessment. The report indicates that “With 44 respondents the Information
and Communication Technologies (ICT) questions on data processing, hosting and related
activities and on data-driven solutions for GHG emissions reductions received the lowest
traction among stakeholders”171. Given the increasing importance of ICT, and data centres in
particular, this suggests that there is still a lot of policy potential for creating positive
environmental impact and value added. The report indicates that there was no unanimity on
the proposed criteria. Suggested changes included extending the boundaries of the activities
including edge computing and data centre power equipment, modifications to the DNSH
criteria and more clarity on the standards and codes of conduct used by the sector.
170 European Commission (2020), Inception impact assessment for Revision of the Guidelines on State aid for environmental
protection and energy, available at https://ec.europa.eu/info/law/better-regulation/have-your-say/initiatives/12616-
State-aid-for-environmental-protection-and-energy-revised-guidelines_en
171 European Commission (2021) Impact Assessment Report Accompanying the document Commission Delegated Regulation (EU) …/… supplementing Regulation (EU) 2020/852 of the European Parliament and of the Council by establishing the technical screening criteria for determining the conditions under which an economic activity qualifies as contributing substantially to climate change mitigation or climate change adaptation and for determining whether that economic activity causes no significant harm to
any of the other environmental objectives. Brussels, 4.6.2021, SWD(2021) 152 final p. 67, accessible from: taxonomy-
regulation-delegated-act-2021-2800-impact-assessment_en.pdf (europa.eu)
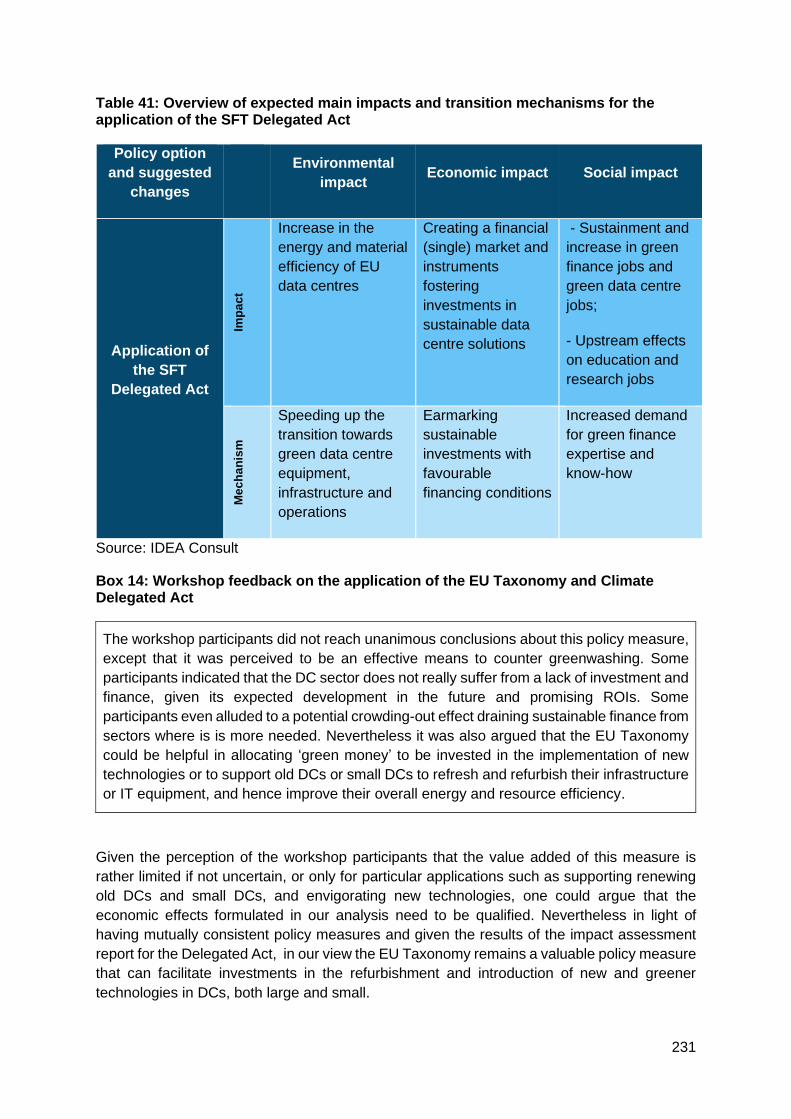
231
Table 41: Overview of expected main impacts and transition mechanisms for the application of the SFT Delegated Act
Policy option
and suggested
changes
Environmental
impact Economic impact Social impact
Application of
the SFT
Delegated Act
Imp
ac
t Increase in the
energy and material
efficiency of EU
data centres
Creating a financial
(single) market and
instruments
fostering
investments in
sustainable data
centre solutions
- Sustainment and
increase in green
finance jobs and
green data centre
jobs;
- Upstream effects
on education and
research jobs
Me
ch
an
ism
Speeding up the
transition towards
green data centre
equipment,
infrastructure and
operations
Earmarking
sustainable
investments with
favourable
financing conditions
Increased demand
for green finance
expertise and
know-how
Source: IDEA Consult
Box 14: Workshop feedback on the application of the EU Taxonomy and Climate Delegated Act
The workshop participants did not reach unanimous conclusions about this policy measure,
except that it was perceived to be an effective means to counter greenwashing. Some
participants indicated that the DC sector does not really suffer from a lack of investment and
finance, given its expected development in the future and promising ROIs. Some
participants even alluded to a potential crowding-out effect draining sustainable finance from
sectors where is is more needed. Nevertheless it was also argued that the EU Taxonomy
could be helpful in allocating ‘green money’ to be invested in the implementation of new
technologies or to support old DCs or small DCs to refresh and refurbish their infrastructure
or IT equipment, and hence improve their overall energy and resource efficiency.
Given the perception of the workshop participants that the value added of this measure is
rather limited if not uncertain, or only for particular applications such as supporting renewing
old DCs and small DCs, and envigorating new technologies, one could argue that the
economic effects formulated in our analysis need to be qualified. Nevertheless in light of
having mutually consistent policy measures and given the results of the impact assessment
report for the Delegated Act, in our view the EU Taxonomy remains a valuable policy measure
that can facilitate investments in the refurbishment and introduction of new and greener
technologies in DCs, both large and small.
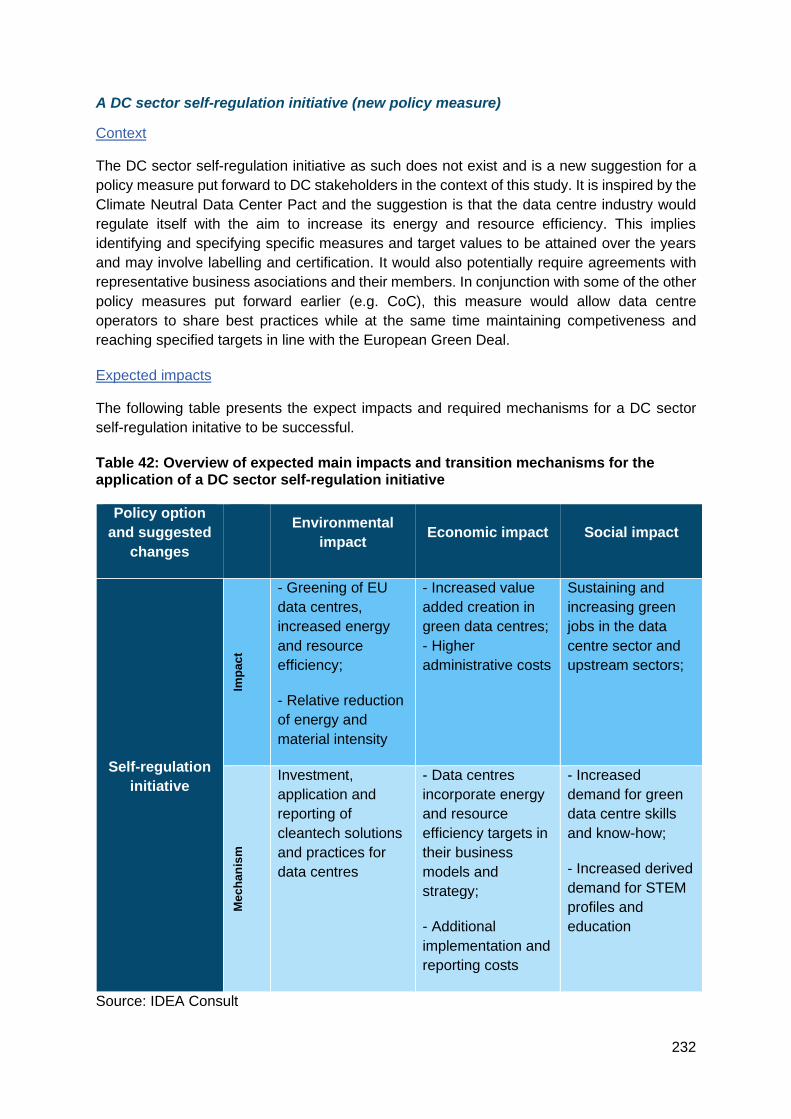
232
A DC sector self-regulation initiative (new policy measure)
Context
The DC sector self-regulation initiative as such does not exist and is a new suggestion for a
policy measure put forward to DC stakeholders in the context of this study. It is inspired by the
Climate Neutral Data Center Pact and the suggestion is that the data centre industry would
regulate itself with the aim to increase its energy and resource efficiency. This implies
identifying and specifying specific measures and target values to be attained over the years
and may involve labelling and certification. It would also potentially require agreements with
representative business asociations and their members. In conjunction with some of the other
policy measures put forward earlier (e.g. CoC), this measure would allow data centre
operators to share best practices while at the same time maintaining competiveness and
reaching specified targets in line with the European Green Deal.
Expected impacts
The following table presents the expect impacts and required mechanisms for a DC sector
self-regulation initative to be successful.
Table 42: Overview of expected main impacts and transition mechanisms for the application of a DC sector self-regulation initiative
Policy option
and suggested
changes
Environmental
impact Economic impact Social impact
Self-regulation
initiative
Imp
ac
t
- Greening of EU
data centres,
increased energy
and resource
efficiency;
- Relative reduction
of energy and
material intensity
- Increased value
added creation in
green data centres;
- Higher
administrative costs
Sustaining and
increasing green
jobs in the data
centre sector and
upstream sectors;
Me
ch
an
ism
Investment,
application and
reporting of
cleantech solutions
and practices for
data centres
- Data centres
incorporate energy
and resource
efficiency targets in
their business
models and
strategy;
- Additional
implementation and
reporting costs
- Increased
demand for green
data centre skills
and know-how;
- Increased derived
demand for STEM
profiles and
education
Source: IDEA Consult

233
Box 15: Workshop feedback on a DC sector self-regulation initiative
Self-regulation is a voluntary measure which was positively received but with a few remarks
on the eventual effects in terms of resource and energy efficiency. From a policy perspective
there is a risk that the sector will go on a sub-optimal path taking it longer to implement new
technologies for increased energy and resource efficiency. In contrast to this, one could
argue that precisely because the measure has a self-regulation nature, the targets and
ambitions put forward are feasible and have a wide support across the DC industry.
This initative could be formulated in combination with EC oversight and a compliance
framework that DC stakeholders could fall back on. Therefore, with careful monitoring (as
e.g. in the Data Centre Registry) self-regulation might be a valuable policy option fostering
the greening of DCs, if executed in cooperation with third-party control.
A European Data Centre Registry (new policy measure)
Context
This policy measure aims to establish a European Data Centre Registry in which EU DCs are
requested to register and provide information on a set of key parameters, which could be
developed into a benchmarking tool to monitor energy and resource efficiency progress. The
Registry would be accompanied by a protocol to increase trust and confidence between the
parties. More specifically we envisage the following set-up:
• The European Data Centre Registry would serve to record an inventory of data
centres within Europe. The following information could be registered for each data
centre:
o Location
o Services provided
o Energy consumption
o Share of renewable energy
o GHG emissions
o Circular economy practices
• In order to promote trust and confidence in the Registry, a mutually agreed protocol
between the organisation that does the central monitoring and the data centre
operators could be a way to bridge the two parties.
• The Registry could serve to monitor the aggregate greenhouse gas emissions of
European data centres, increase the reliability and security of supply of the digital
infrastructure and create transparency for customers and investors to give preference
to climate-friendly and resource and energy efficient data centres.
This policy option could potentially function in combination with the self-regulation initiative
proposed earlier and can build further on the current efforts that DCs already undertake on
the efficiency of their services. However, as indicated earlier in this report, the metrics currently
implemented are mainly focussed on energy efficiency, implying that additional work has to
be done as to the metrics for circularity and material efficiency. One also has to take into
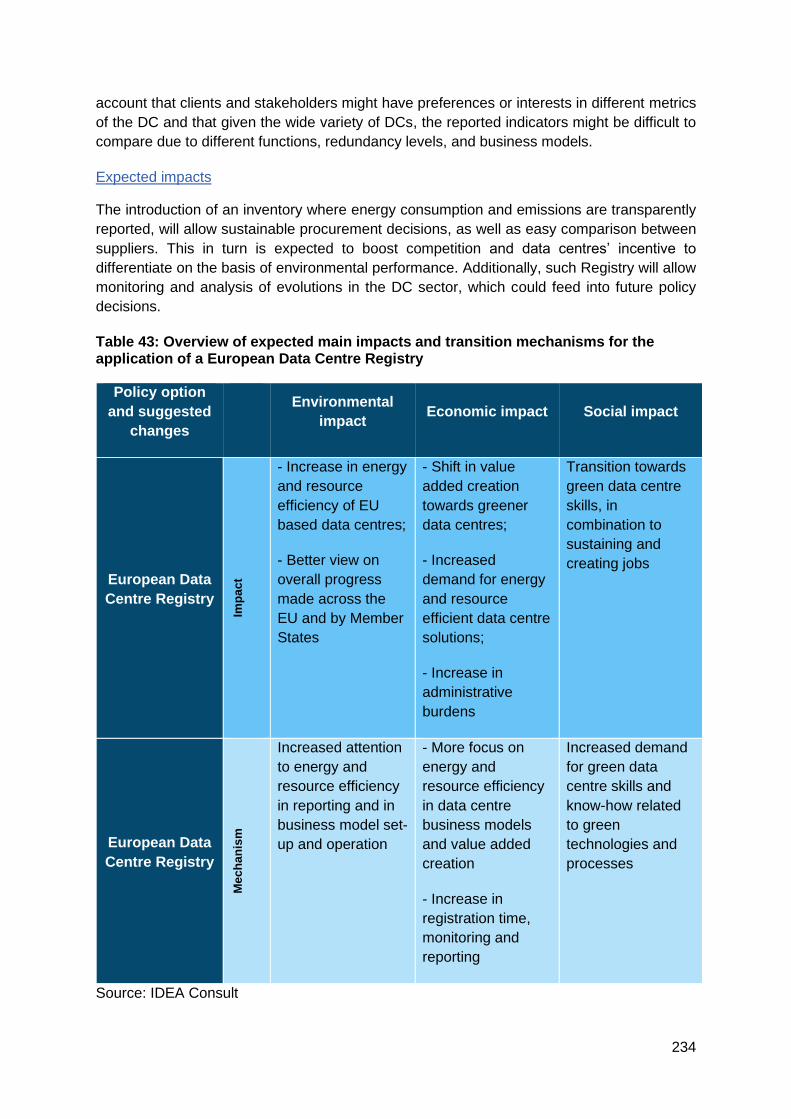
234
account that clients and stakeholders might have preferences or interests in different metrics
of the DC and that given the wide variety of DCs, the reported indicators might be difficult to
compare due to different functions, redundancy levels, and business models.
Expected impacts
The introduction of an inventory where energy consumption and emissions are transparently
reported, will allow sustainable procurement decisions, as well as easy comparison between
suppliers. This in turn is expected to boost competition and data centres’ incentive to
differentiate on the basis of environmental performance. Additionally, such Registry will allow
monitoring and analysis of evolutions in the DC sector, which could feed into future policy
decisions.
Table 43: Overview of expected main impacts and transition mechanisms for the application of a European Data Centre Registry
Policy option
and suggested
changes
Environmental
impact Economic impact Social impact
European Data
Centre Registry
Imp
ac
t
- Increase in energy
and resource
efficiency of EU
based data centres;
- Better view on
overall progress
made across the
EU and by Member
States
- Shift in value
added creation
towards greener
data centres;
- Increased
demand for energy
and resource
efficient data centre
solutions;
- Increase in
administrative
burdens
Transition towards
green data centre
skills, in
combination to
sustaining and
creating jobs
European Data
Centre Registry
Me
ch
an
ism
Increased attention
to energy and
resource efficiency
in reporting and in
business model set-
up and operation
- More focus on
energy and
resource efficiency
in data centre
business models
and value added
creation
- Increase in
registration time,
monitoring and
reporting
Increased demand
for green data
centre skills and
know-how related
to green
technologies and
processes
Source: IDEA Consult

235
Box 16: Workshop feedback on a European Data Centre Registry
The policy option of the EU Data Centre Registry overall was welcomed. The main concerns
related to more practical aspects such as business confidentiality, the detail of data to be
provided, access to the data centre, the control of its operation and the management of the
Registry.
We believe that these concerns can be tackled in a constructive manner, e.g. attributing the
management to an (existing) EU agency, setting up protocols with the DC sector, drafting
clear instructions with information that can be provided in a feasible manner and the
organisation of the registry platform. Evidently this more practical implementation is beyond
the scope of the study, and may necessitate a feasibility study about the precise parameters
and organisational options.
From our interviews with stakeholders we know that the DC associations are keen to have
an overview for monitoring and analysing the evolutions in the DC sector, both from an
environmental and economic point of view. This observation is in line with the positive
feedback we obtained in the workshop.
Policy options with an indirect impact
In parallel to adaptions of existing policy measures and new policy measures suggested
above, some existing policy measures have an indirect impact on the operation of data centres
and merit a reflection on how they could be adapted to best facilitate the uptake of circular and
energy efficiency practices in the DC industry. In the current section we summarise how these
policies affect data centres.
The Energy Efficiency Directive (EED) entails quantitative targets of energy efficiency
improvements at the EU level combined with indicative targets at national level, which may
result in further increases in targets or requirements on data centres. Normally when the size
of this energy intensity reduction exceeds the growth of the economic activities, it results in an
absolute reduction of GHG emissions. When higher targets lead to investments in energy
efficiency (development and usage of new technologies), it can result in the application of
more energy efficient technologies and a decrease in the price of these technologies.
Moreover these investments and the development of technologies can generate a boost on
the job market.
The EED includes provisions on the adoption of green procurement standards and procedures
by public authorities. Concrete steps in this drirection could tap into the large potential of the
public sector both as a large buyer and as a “leading by example” actor in the promotion of
the greener data centres and cloud computing services that are offered for leasing.
Improved monitoring helps to realise the mechanisms and impacts of the increased
quantitative targets. Moreover, when clear information is available and disseminated, this can
help inform the general public, as well as investors and consumers. Hence, possibly
generating more competition between companies in terms of energy efficiency. Monitoring

236
however should be designed in a way that the benefits exceed any additional costs for
companies. Building further on these results one could envisage:
• The obligatory disclosure of environmental performance indicators and environmental
audit results.
• Sector specific energy efficiency standards.
• Measures to stimulate the reuse of wasteheat (e.g. make the assessment of the reuse
of waste an obligatory part of the planning and permitting process, stimulate to build
large data centres on locations where waste heat can bereused).
• Public reporting mechanisms through which large companies and DCs have to
disclose standard measures on environmental performance (e.g. based on the
environmental footprint methods).
The implementation of the The Waste from Electrical and Electronic Equipment (WEEE)
Directive includes data and reporting and WEEE calculation tools. Considering its
effectivenecess, since the introduction of the WEEE Directive, significant changes occurred in
the collection and disposal of WEEE. High amounts of WEEE are now collected separately
from domestic waste, bringing economic costs but also additional revenues and jobs.172
However, a substantial part of collected WEEE remains unreported and may be subject to
improper treatment, causing environmental issues.
The classification of certain categories of products as business waste under the WEEE
Directive would avoid problems of 'dual use' waste, when business equipment very similar to
consumer equipment (like IT equipment) enters the household waste flow and its treatment is
paid for by producers of household equipment. Therefore the collection of WEEE from data
centres should be separated from the collection of household waste by categorising WEEE
from data centres as business waste, to be deposited at specialised waste collection points
that assure a proper treatment. With respect to DCs this might imply giving further attention
to:
• Waste prevention and circular models (design, reuse, remanufacturing, repair of
equipment)
• The application of the WEEE directive for materials and electronic equipment from DCs
• The valorisation of waste heat.
The last amendment to the Eco-Management and Audit Scheme (EMAS) regulation (EU
Commission Regulation EU 2018/2026) dates from january 9th, 2019. This amendment – the
EMAS Annex IV Amendment173 - includes an update of EMAS’s core indicators. The core
indicators are defined in the following key environmental areas: energy, material, water, waste,
land use with regard to biodiversity, and emissions.
172 https://eur-lex.europa.eu/legal-content/EN/TXT/PDF/?uri=CELEX:52008SC2934&from=EN
173 COMMISSION REGULATION (EU) 2018/ 2026 - of 19 December 2018 - amending Annex IV to Regulation (EC) No 1221
/ 2009 of the European Parliament and of the Council on the voluntary participation by organisations in a Community
eco-management and audit scheme (EMAS) (europa.eu)
237
The Fitness Check (EC, 2017174) indicated that more than 70 % of all EMAS organisations
surveyed found that they had improved or significantly improved performance on energy
efficiency, use of materials, water consumption and waste production. However, the limited
uptake is reducing the effectiveness of the instrument175. Beyond environmental reporting,
organisations use EMAS in general to achieve business opportunities and improve business
performance including:
• reducing costs;
• reducing risks;
• improving reputation, and
• becoming more innovative and sustainable.
Higher uptake of EMAS by producers and organisations is needed to drive the overall market
and achieve significant changes in consumption and production, resulting in significant
environmental benefits. Therefore it would be necessary to consider the following steps:
• promote EMAS to improve awareness and market recognition (organisations) as well
as recognition in public policy (public authorities);
• provide incentives and relief from other regulatory requirements (compliance and
verification cost for individual companies and organisations);
• further align / harmonize with ISO 14001, which is a globally recognised and less
demanding environmental management system;
• develop Sectoral Reference Documents for data centres.
The proposal for a Corporate Sustainability Reporting (CSR) Directive (April 21, 2021)
adjusts the existing requirements of the Non-financial Reporting Directive (NFRD) (Directive
2014/95/EU) on a number of key aspects to improve the state of sustainable investments in
the EU, and as such contribute to creating a climate neutral EU by 2050. In particular, the CSR
extends the scope of the NFRD to all large companies and listed companies, with the
exception of listed micro companies, and thus virtually multiplying the number of companies
that are subject to the CSR Directive by a factor of four in comparison to the NFRD. The
reported information under the CSRD is more extensive as well as more detailed.
While independent third-party certification was voluntary under the NFRD, it becomes
mandatory in the CSR Directive with the integration in the Auditor’s Report, the involvement
of a key audit partner and the inclusion and application of the EU Sustainable Finance
Taxonomy. The companies are expected to report primarily in a digital format (XHTML) and
include the information in the Management Report. The Directive is applicable from financial
174 European Commission (2017) Report from the Commission to the European Parliament and to the Council on the review of implementation of Regulation (EC) No 122/2009 of the European Parliament and of the Council of 25 November 2009 on voluntary participation by organisations in a Community eco-management and audit scheme (EMAS) and the Regulation (EC) No 66/2010 of the parliament and of the Council of 25 November 2009 on the EU Ecolabel, COM(2017) 355 final,
SWD_2017_252_F1_OTHER_STAFF_WORKING_PAPER_EN_V2_P1_875447 (SWD Exec summary).pdf (europa.eu)
175 For instance the uptake of EMAS is substantially lower that of the ISO140001 see European Commission (2017)

238
year 2023 onwards176. With respect to DCs it is evident that large and or listed DCs will be
subject to the CSR Directive as well.
Directive 2010/31/EU of the European Parliament and Council of 19 May 2010 on the energy
performance of buildings (EPBD) was one of the key pillars in the EU legislative framework
to enhance the energy performance of buildings. In that view, the directive has been amended
in 2018-2019 as part of the Clean Energy for all Europeans package and is currently under
further review as part of the wider European Green Deal and the Renovation Wave strategy.
At the time of the study, the Commission published an inception impact assessment, and
launched a public consultation followed by a series of workshops with stakeholders on a set
of EPBD related topics.
Since buildings are an important part of the DC infrastructure with climate regulation
technologies and heat valorisation, the EPBD revision will have its effect on the operation and
investment of new and refurbished DC building infrastructure. At the time of the study, the
consultation period had just finished. The adoption of the review has been planned for the last
quarter of 2021.
The Environmental Performance of Products and Businesses Initiative on
substantiating green claims was launched by the European Commission in response to the
Green Deal ambitions and further elaboration in the 2020 Circular Economy Action Plan. In
view of the increasing number of labels, claims and measuring methods to assess and indicate
environmental impact, without any base for proper comparison, mutually consistent definitions
and methodologies, the urge was felt to bridge this knowledge gap and introduce a single
reliable and commonly accepted method to quantify environmental impacts. In turn this
undermines the development of a Single Market for green products177. The Product and
Organisational Environmental Footprint methods (PEFs and POFs) adopted in the European
Commission Recommendation 2013/179/EU are potentially a good basis for further
application, yet they are voluntary in nature and other methods can be used. Hence the
resulting market and regulatory imperfections remain until further policy initiatives on
substantiating claims are taken. As indicated in section 2.1. Task 1.1.3., the development of
targeted measures for greening DCs can be aligned with the substantiating claims initiative.
Table 44 provides an overview of the expected impacts and transition mechanisms for the
Energy Efficiency Directive (EED), the Waste from Electrical and Electronic Equipment
(WEEE) Directive and the Eco-Management and Audit Scheme (EMAS) regulation. The
Corporate Sustainability Reporting (CSR) Directive has been analysed and discussed in
relation to the Sustainable Finance Taxonomy.
Undoubtedly, additional policies can be identified that co-determine the energy and resource
efficiency of DCs., for instance the (recast) of the Renewable Energy Directive and the Fit for
176 For more detailed information on the CSR Directive we refer to the Commission’s websit at Corporate sustainability
reporting | European Commission (europa.eu). A schematic comparison between the NFRD and the CSR Directive we refer
to KPMG (2021) Corporate Sustainability Reporting Directive - The CSRD - KPMG Ireland (home.kpmg)
177 European Commission (2021) Single Market for Green Products Initiative, website: Single Market for Green Products -
Environment - European Commission (europa.eu)

239
55 package which was adopted in July 2021. The latter is especially important in view of
promoting internal coherence between the various policy instruments.
Table 44: Overview of expected main impacts and transition mechanisms for policy measures that are indirectly related to data centres
Policy option Environmental
impact
Economic
impact Social impact
Increased
quantitative
energy
efficiency goals
(EED)
Imp
ac
t
Reduced energy
intensity of the
economy,
reduction of GHG
emissions
- Reduced energy
costs, facilitation
of introduction
and
dissemination of
new technologies
- Potentially
(temporary)
increased costs
to set up data
centres.
Better informed
businesses,
creation of jobs,
Me
ch
an
ism
More ambitious
quantitative
targets push
participants to
further improve
energy efficiency
- Resulting from
energy efficiency
investments
- More ambitious
targets/require-
ments for data
centres
Resulting from
energy efficiency
investments and
more pressure on
data centres to
operate energy
efficiently
Improved
monitoring,
common
reporting format
(EED)
Imp
ac
t
Reduced energy
intensity of the
economy as a
whole, reduction
of GHG
emissions
- Additional costs
on businesses
- Insights in own
performance may
shed light on
opportunities for
cost reduction
- Better informed
business
- Better informed
public and
customers
Me
ch
an
ism
- Increased
required
accountability of
Member States
leads to
increased
requirements for
reporting of
sectors and
individual
companies
- Increased
transparency
towards
- Collection and
dissemination of
clear information
(that can be
evaluated against
the set targets)
- Collection and
dissemination of
relevant and
thrustworthy
information

240
Policy option Environmental
impact
Economic
impact Social impact
customers can
increase
competition
between
companies to
become more
energy efficient
Stimulating re-
use of waste
heat (EED)
Imp
ac
t
Reduced energy
intensity
(compared to if
no re-use is
applied).
- New possible
synergies (incl.
incomes coming
from heat
generation);
- Extra costs to
set up data
centres;
- Introduction of
new technologies
- Businesses or
households can
use waste heat;
More awareness
with the general
public;
- Job creation and
skill development
Me
ch
an
ism
More re-use of
waste heat, e.g.
to heat buildings.
- (Large) data
centres can be
set up in areas
where the heat
can be used.
- Investments in
methods to
capture and
distribute waste
heat.
Jobs and skill
development
related to re-use
of waste heat,
e.g. to heat
buildings.
Categorise
WEEE from data
centres as
business waste Imp
ac
t
- Avoidance of
environmental
issues such as
environmental
harm caused by
the release of
harmful materials,
or dumping of
WEEE in
developing
countries;
- Better recycling
of ICT-critital
secondary
materials
Additional value
added creation
from recycling
ICT-critical
materials
- Treatment of
WEEE of data
centres is paid for
by producers of
business
equipment;
- Jobs and skills
creation both
direct and indirect

241
Policy option Environmental
impact
Economic
impact Social impact
Me
ch
an
ism
WEEE of data
centres have to
be disposed as
business waste at
the official
collection points
that take care of
the proper
treatment of
WEEE
- Stronger market
position in the
sustainable client
segment;
- Potential cost
reductions due to
more efficient use
and treatment of
materials
- Potential
rebound effects
on customer
prices, depending
on market power
Specialised skill
development
Promote the
uptake of EMAS
Imp
ac
t
- Reduction of
emission of
greenhouse
gases
- Improved
energy efficiency,
use of materials,
water
consumption and
waste production
- More
sustainable
consumption and
production
- Enhanced
transparency
about
environmental
performance of
organisations
towards public
and authorities
- Better informed
investment and
sustainable
finance decisions
- Companies
invest in new
production
methods,
technologies and
products that
have a lower
environmental
impact
- Extra
compliance and
verification cost
for companies
- Reporting and
control by public
authorities gives
higher credibility
and economic
incentive to
enhance
environmental
performance
- Specialised skill
development
Me
ch
an
ism
Companies are
stimulated to use
Sectoral
Reference
Documents, Best
Practice and
Benchmarks to
reduce their
environmental
- Companies
compile EMAS
reporting
- Companies are
stimulated to
introduce new
production
methods,
technologies and
Companies make
their
environmental
performance
publicly available

242
Policy option Environmental
impact
Economic
impact Social impact
impact in various
ways
products that
have a lower
environmental
impact
Source: IDEA Consult
3.3. Task 2.2.1. Policy options for transparency measures for Electronic Communications Services and Networks
3.3.1. Description of policy options for ECNs and ECS
The Communication on Europe’s Digital Future (European Commission 2020b) proposes the
introduction of transparency measures for telecom operators on their environmental footprint.
The following section presents various policy options that could contribute to more
transparency among suppliers. By introducing transparency measures, those suppliers who
act in a particularly efficient and environmentally conscious manner can distinguish
themselves on the market.
The specific aim of this section is to propose different options for transparency measures and
to discuss which of these options could be the most promising. The authors of this study are
aware that transparency and communication measures would require further research and
alone may not be sufficient to achieve the goal of climate neutrality. The authors are also
aware that different climatic conditions in which the technical facilities are operated mean that
the energy required for additional air conditioning varies and the efficiency is influenced by
this. The same applies to widespread networks with low utilisation, for example in rural areas.
In order to compare the efficiency of different networks and access technologies with each
other, the respective local conditions (e.g. climatic zone, distance between the network levels,
reliability of the power supply) must therefore always be taken into account and it must be
ensured that the respective technology is actually applicable on a local level.
After analysing existing instruments in Tasks 1.2.1 and 1.2.1a and considering what might be
effective from a consumer perspective in task 1.2.4, the following options for policy options
were selected by the study:
• ECN Energy Register: EU-wide register on energy consumption and greenhouse gas
emissions of telecommunications companies
• Code of Conduct on transparency measures for telecommunication services:
voluntary agreement on common metrics and information requirements to be reported to
end-users for fixed internet access and mobile services.
• Topten product database with information on particularly energy-efficient
telecommunications services

243
• Energy efficiency label for telecommunication services
• Eco-label for telecommunication services
The different policy options and their impact principles are described in the sub-sections
below.
On the grounds of the study results, there were online presentations given to interested parties
from ECN and ECS provider’s side and BEREC (Body of European Regulators for Electronic
Communication) working group on 25th June and 28th June respectively. The audience was
specifically asked to provide feedback on the feasibility of the respective policy options. The
participants of the events and also interested parties that could not attend had the chance to
provide their feedback in written form. In both events, general acceptance for the proposed
policy options and the especially the recommended ranking was high, although it must be
stated that only individual opinions of the participants can be reflected here and that no
representative survey of the sector took place. The feedback from these events is documented
below in a separate box for each option. In addition, the feedback from consumer
organisations from the online survey (task 1.2.4) is documented as feedback on the options.
Box 17: General feedback on the proposed metrics
Telecommunication services, such as internet access or mobile telephony services, can be
provided with different technologies that are inherently different in efficiency. In addition to
the energy consumption figures, it should therefore be indicated which technology is
involved. Energy consumption and the associated greenhouse gas emissions also differ
depending on the geographical location (climate zone) and the composition of the electricity
mix (renewable energies or coal-fired electricity). A comparison of different suppliers is
therefore only possible if the same local conditions exist in each case.
Another problem is seen in the fact that energy intensity (energy consumption per amount
of data transmitted) is not the only relevant parameter, as there is a baseline consumption
by the networks that also occurs when the networks are idle or in standby. Even when no
data is being transmitted, the networks consume energy. The key figures should therefore
be chosen so that they are related to typical usage patterns and not to theoretical
performance values (e.g. maximum data volume). Furthermore, the consumption-related
indicators do not take into account that the expansion of the networks is associated with
additional environmental effects (construction sites, landscape consumption, manufacturing
efforts). The upgrading of existing networks or the use of particularly durable cables is not
favoured by such indicators. Overall, the transparency measures should ensure that
innovations are not hindered and that sustainable technological options receive benefits.

244
ECN Energy Register
ECN Energy Register
Description An EU-wide central energy register for electronic communication
networks could be created, comparable to the EPREL-Database178
for energy-labelled products. Companies that offer their
telecommunication services in Europe should provide information
here (voluntarily or mandatorily) about their key environmental
parameters. The register would serve as a central data collection
and monitoring of the achievement of the goal of climate neutrality
of telecommunication networks. However, the register would be
also publicly accessible so that other interested parties (e.g.
professional purchasers or investors) can gain insight into the
environmental performance of the companies. The data would be
aggregated at the company level and can therefore not be
assigned to individual services.
Sustainabilty
Indicators
Suitable indicators that could feed into a ECN Energy Register
were identified for this purpose:
• Annual energy consumption of the ECN company [MWh/a]
If applicable, further differentiated by energy source (e.g.
electrical energy, district or local heating, diesel, petrol, etc.)
and geographical allocation of business operations (e.g. per
country).
• Energy Intensity of the network [kWh/GByte]
Expressed by the metric "energy intensity" (energy
consumption per amount of data transmitted).
• Share of renewable energies [%]
If applicable, further differentiated according to type of
renewable energy source (electricity from hydropower, wind
power, photovoltaics, solar heat, biomass) together with their
specific CO2 emission factors ([kg CO2-eq./kWh]).
• Annual green house gas emissions of the company
[tonnes CO2-eq./a]
If applicable, further differentiated by geographical allocation
of business operations (e.g. per country)
Mechanism Disclosure of energy consumption, efficiency and greenhouse gas
emissions is intended to trigger competition among companies. It
thus becomes more attractive to implement efficiency and climate
protection measures. If the reported values show that companies
178 https://ec.europa.eu/info/energy-climate-change-environment/standards-tools-and-labels/products-labelling-
rules-and-requirements/energy-label-and-ecodesign/product-database_en The difference between EPREL and the proposed ECN Energy Register is that the energy consumption of energy-related products occurs at the customers' side, whereas the energy consumption of ECNs occurs at the providers' side.
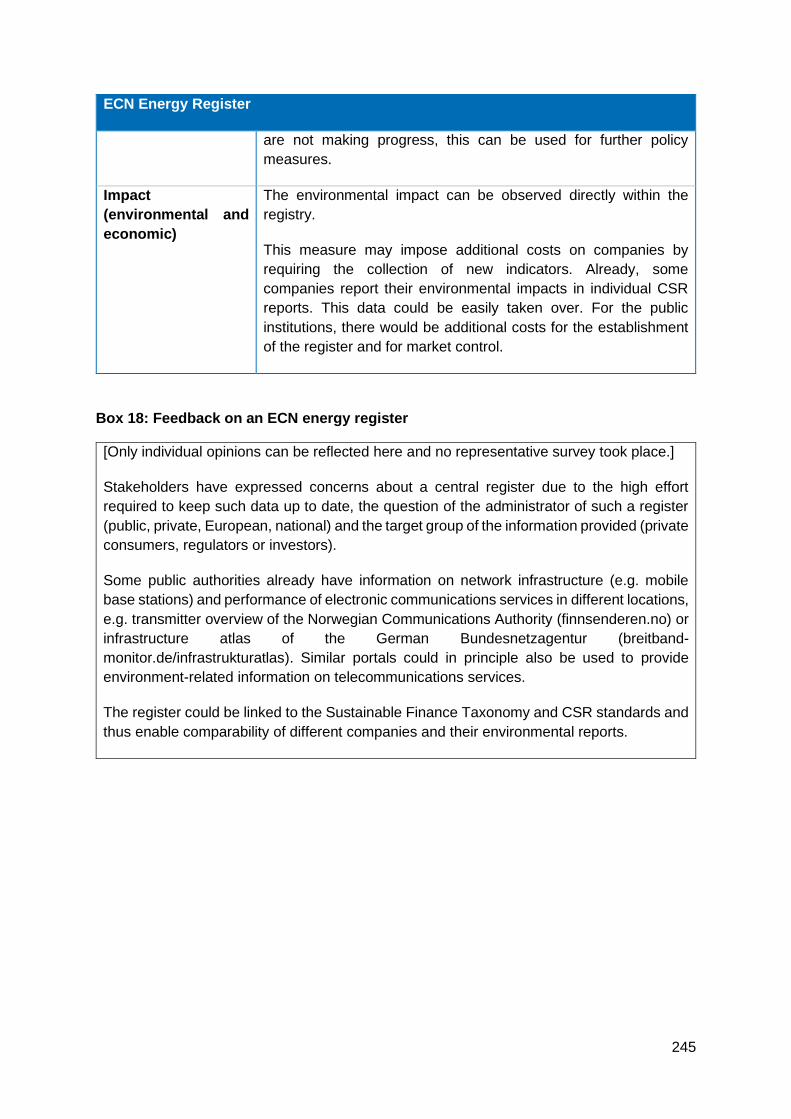
245
ECN Energy Register
are not making progress, this can be used for further policy
measures.
Impact
(environmental and
economic)
The environmental impact can be observed directly within the
registry.
This measure may impose additional costs on companies by
requiring the collection of new indicators. Already, some
companies report their environmental impacts in individual CSR
reports. This data could be easily taken over. For the public
institutions, there would be additional costs for the establishment
of the register and for market control.
Box 18: Feedback on an ECN energy register
[Only individual opinions can be reflected here and no representative survey took place.]
Stakeholders have expressed concerns about a central register due to the high effort
required to keep such data up to date, the question of the administrator of such a register
(public, private, European, national) and the target group of the information provided (private
consumers, regulators or investors).
Some public authorities already have information on network infrastructure (e.g. mobile
base stations) and performance of electronic communications services in different locations,
e.g. transmitter overview of the Norwegian Communications Authority (finnsenderen.no) or
infrastructure atlas of the German Bundesnetzagentur (breitband-
monitor.de/infrastrukturatlas). Similar portals could in principle also be used to provide
environment-related information on telecommunications services.
The register could be linked to the Sustainable Finance Taxonomy and CSR standards and
thus enable comparability of different companies and their environmental reports.

246
Code of Conduct on transparency measures for telecommunication services
Code of Conduct on transparency measures for telecommunication services
Description A Code of Conduct (CoC) would be a voluntary self-commitment
by telecommunications providers to monitor certain environmental
data in the operation of their networks, to use uniform
measurement and calculation standards and to make certain
information available to the public. The company publicly declares
that it wants to contribute to climate protection and describes with
which measures and at what speed it intends to achieve this. This
CoC thus would have a different character and visibility than the
already existing Code of Conduct for broadband equipment, which
sets minimum requirements at the product level. Within the CoC,
different ways are defined how the information on energy efficiency
and climate impact of networks can be communicated to end
users. This could include disseminating environmentally related
information to all customers, for example on the telephone bill,
reporting on the company website and in the companies'
sustainability reports, or providing the necessary data for a
voluntary ECN Energy Register at national or European level.
Sustainabilty
Indicators
The sustainability indicators are basically the same as those for
the ECN Energy Register, see above.
Mechanism By participating in the Code of Conduct, the company signals that
it is aware of its environmental impacts and intends to reduce them
voluntarily through regular monitoring and improvements. This
gives the company an advantage in terms of consumer
confidence. Those telecommunication products of the company
that are particularly environmentally friendly can thus be
specifically promoted and their market share increased.
Impact
(environmental and
economic)
The effect of the CoC would be indirect. With the introduction of a
common communication on the environmental impact of
telecommunication services, consumer awareness is raised and a
market for environmentally sound services is created. The creation
of a Code of Conducts initially involves development costs for the
industry as a whole. However, these initial investments can also
be saved when applied, since individual measurement methods or
reporting formats no longer have to be developed, but instead the
standardised CoC document can be used.
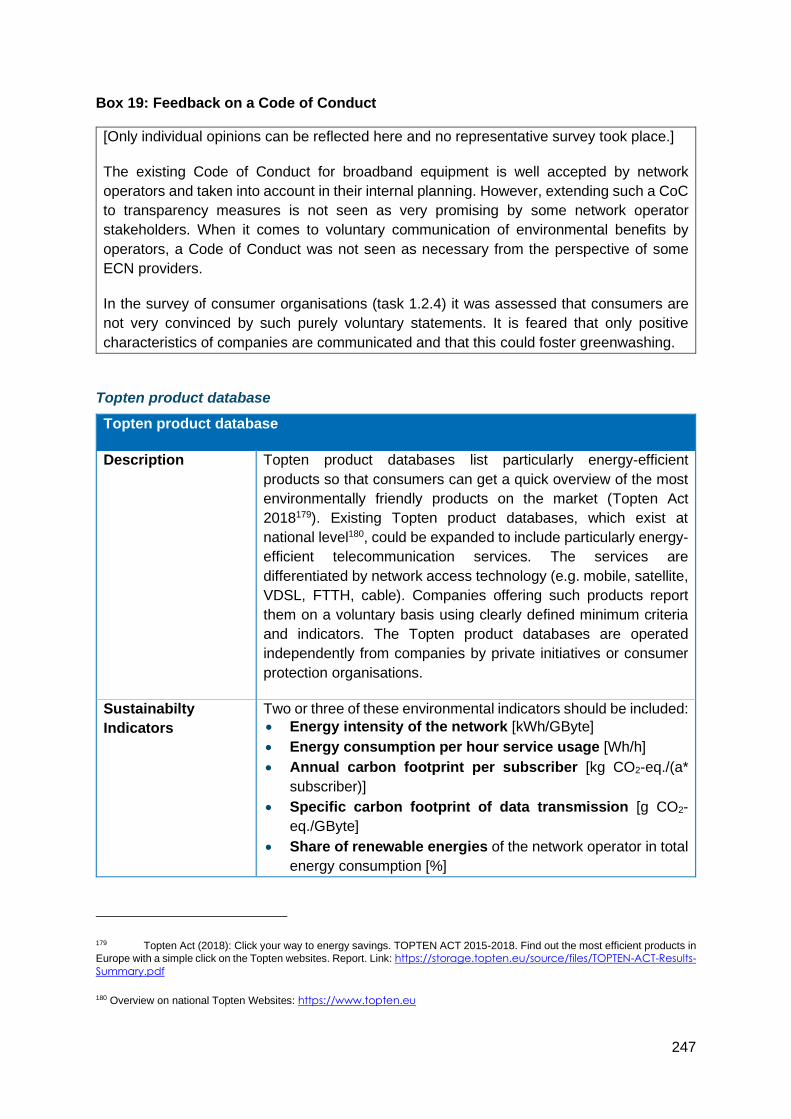
247
Box 19: Feedback on a Code of Conduct
[Only individual opinions can be reflected here and no representative survey took place.]
The existing Code of Conduct for broadband equipment is well accepted by network
operators and taken into account in their internal planning. However, extending such a CoC
to transparency measures is not seen as very promising by some network operator
stakeholders. When it comes to voluntary communication of environmental benefits by
operators, a Code of Conduct was not seen as necessary from the perspective of some
ECN providers.
In the survey of consumer organisations (task 1.2.4) it was assessed that consumers are
not very convinced by such purely voluntary statements. It is feared that only positive
characteristics of companies are communicated and that this could foster greenwashing.
Topten product database
Topten product database
Description Topten product databases list particularly energy-efficient
products so that consumers can get a quick overview of the most
environmentally friendly products on the market (Topten Act
2018179). Existing Topten product databases, which exist at
national level180, could be expanded to include particularly energy-
efficient telecommunication services. The services are
differentiated by network access technology (e.g. mobile, satellite,
VDSL, FTTH, cable). Companies offering such products report
them on a voluntary basis using clearly defined minimum criteria
and indicators. The Topten product databases are operated
independently from companies by private initiatives or consumer
protection organisations.
Sustainabilty
Indicators
Two or three of these environmental indicators should be included:
• Energy intensity of the network [kWh/GByte]
• Energy consumption per hour service usage [Wh/h]
• Annual carbon footprint per subscriber [kg CO2-eq./(a*
subscriber)]
• Specific carbon footprint of data transmission [g CO2-
eq./GByte]
• Share of renewable energies of the network operator in total
energy consumption [%]
179 Topten Act (2018): Click your way to energy savings. TOPTEN ACT 2015-2018. Find out the most efficient products in
Europe with a simple click on the Topten websites. Report. Link: https://storage.topten.eu/source/files/TOPTEN-ACT-Results-
Summary.pdf
180 Overview on national Topten Websites: https://www.topten.eu

248
Topten product database
In addition, the respective prices of the service should be indicated so that an economic comparison is also possible:
• Price per service unit e.g. [€/year)
Mechanism Topten product databases are a way to promote the market of
efficient products and increase consumer awareness. Before
signing a service contract with a telecom company, customers can
consult the database and select products that are particularly
environmentally friendly. It is expected that this would increase
competition for climate-friendly products.
Impact
(environmental and
economic)
By encouraging customers to move to energy-efficient and
climate-friendly telecommunication services, the overall energy
consumption and greenhouse gas emissions of networks could be
reduced. Particularly efficient technologies can thus be introduced
to the market more quickly. For the companies, there is an
additional financial cost for submitting their data to the database
operator. Since participation is voluntary, a company will do so if
the economic benefit from the additional advertising outweighs the
effort. For their part, the operators of the databases have a
financial cost for collecting and updating the data, which is
increased by the fact that the provision of data by the companies
is purely voluntary.
Box 20: Feedback on a topten product database
[Only individual opinions can be reflected here and no representative survey took place.]
According to the stakeholders taking part in the ECN workshop the high pace of
development could make this policy option not very feasible. Besides, the variety and
diversity of communication products can be barely manageable and confusing to
consumers.
In the consumer organisations survey (task 1.2.4) this option was not proposed. Instead of
this an electronic product passport database was part of the options that could be ranked.
This option comes in 4th place among the proposed policy options, with only 6 positive
feedbacks out of 10.
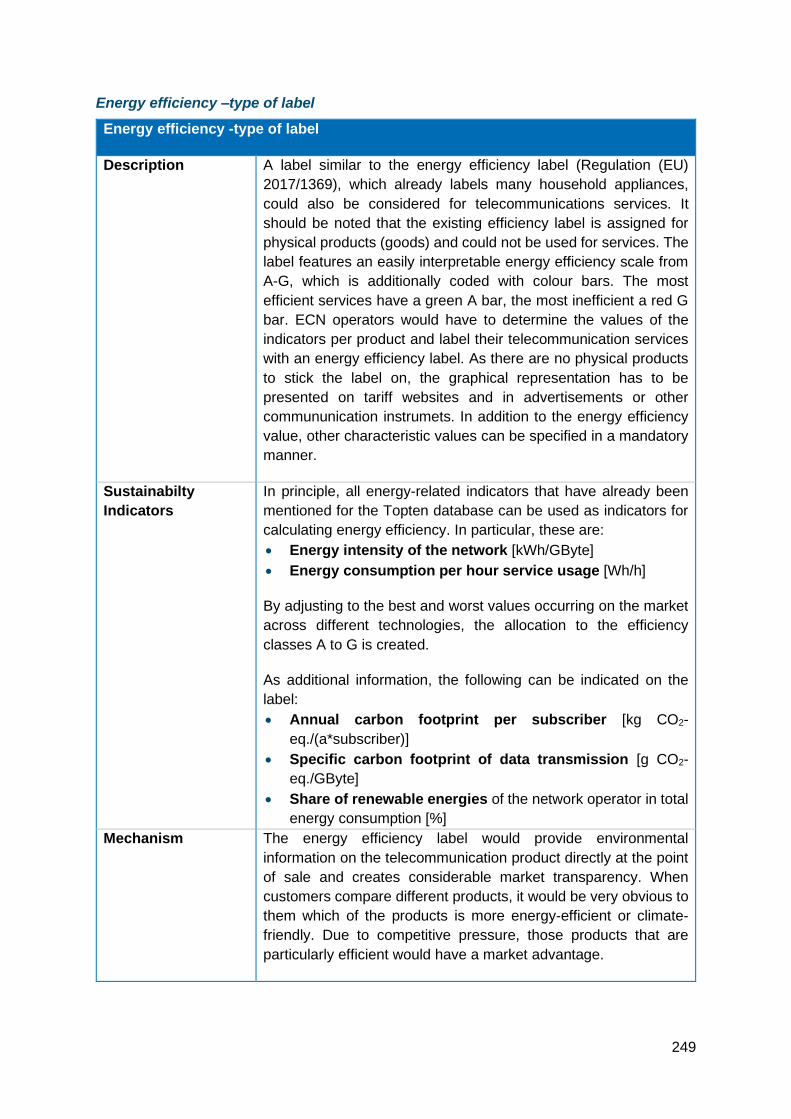
249
Energy efficiency –type of label
Energy efficiency -type of label
Description A label similar to the energy efficiency label (Regulation (EU)
2017/1369), which already labels many household appliances,
could also be considered for telecommunications services. It
should be noted that the existing efficiency label is assigned for
physical products (goods) and could not be used for services. The
label features an easily interpretable energy efficiency scale from
A-G, which is additionally coded with colour bars. The most
efficient services have a green A bar, the most inefficient a red G
bar. ECN operators would have to determine the values of the
indicators per product and label their telecommunication services
with an energy efficiency label. As there are no physical products
to stick the label on, the graphical representation has to be
presented on tariff websites and in advertisements or other
commununication instrumets. In addition to the energy efficiency
value, other characteristic values can be specified in a mandatory
manner.
Sustainabilty
Indicators
In principle, all energy-related indicators that have already been
mentioned for the Topten database can be used as indicators for
calculating energy efficiency. In particular, these are:
• Energy intensity of the network [kWh/GByte]
• Energy consumption per hour service usage [Wh/h]
By adjusting to the best and worst values occurring on the market
across different technologies, the allocation to the efficiency
classes A to G is created.
As additional information, the following can be indicated on the
label:
• Annual carbon footprint per subscriber [kg CO2-
eq./(a*subscriber)]
• Specific carbon footprint of data transmission [g CO2-
eq./GByte]
• Share of renewable energies of the network operator in total
energy consumption [%]
Mechanism The energy efficiency label would provide environmental
information on the telecommunication product directly at the point
of sale and creates considerable market transparency. When
customers compare different products, it would be very obvious to
them which of the products is more energy-efficient or climate-
friendly. Due to competitive pressure, those products that are
particularly efficient would have a market advantage.

250
Energy efficiency -type of label
Impact
(environmental and
economic)
Due to the significantly increased transparency compared to today,
a shift in favour of climate-friendly telecommunication services
would be expected. On the providers' side, costs would arise for
determining the indicators, calculating the efficiency classes and
communicating the energy efficiency label. For the companies that
benefit from this measure because they offer efficient services,
these costs could be compensated by the market advantage or
reduced advertising costs. For companies with inefficient products,
this would lead to additional costs. For national authorities, the
introduction of another mandatory energy efficiency label would
possibly lead to further efforts in market surveillance. However, as
these public structures already exist, only minor additional costs
are expected here.
Box 21: Feedback on an energy efficiency –type of label
[Only individual opinions can be reflected here and no representative survey took place.]
The energy efficiency label is seen by both some ECN providers and national regulatory
authorities as possibly an appropriate policy measure to achieve environmental
transparency. However, it must be said that these are individual opinions and not a
representative survey of the entiresector.
Already now, the energy consumption of networks is monitored internally because there is
a financial interest of the operators to keep consumption as low as possible. It therefore
seems possible to process this data in a form that is also comprehensible to consumers.
The hardware used in the network is already capable of providing many different monitoring
data, more than are evaluated at this point. The energy efficiency label could build on this
data and provide an incentive for optimising individual network components.
As consumers are overwhelmed with information, a standardised, recognisable label would
be beneficial. Therefore, comparability must be ensured through standardised metering and
the use of the same metrics across Europe. In order to also address the absolute resource
consumption and to achieve the goal of climate neutrality, the label should contain relative
and absolute figures on energy consumption (per service unit and company or network) and
could be complemented by information on greenhouse gas emissions. To make the label
easy to understand for consumers, all information should be summarised in a single (colour-
coded) point value, with additional information below. This label should be visible to the
consumer when concluding a contract. Additional information on energy efficiency could be
given on bills or user accounts.
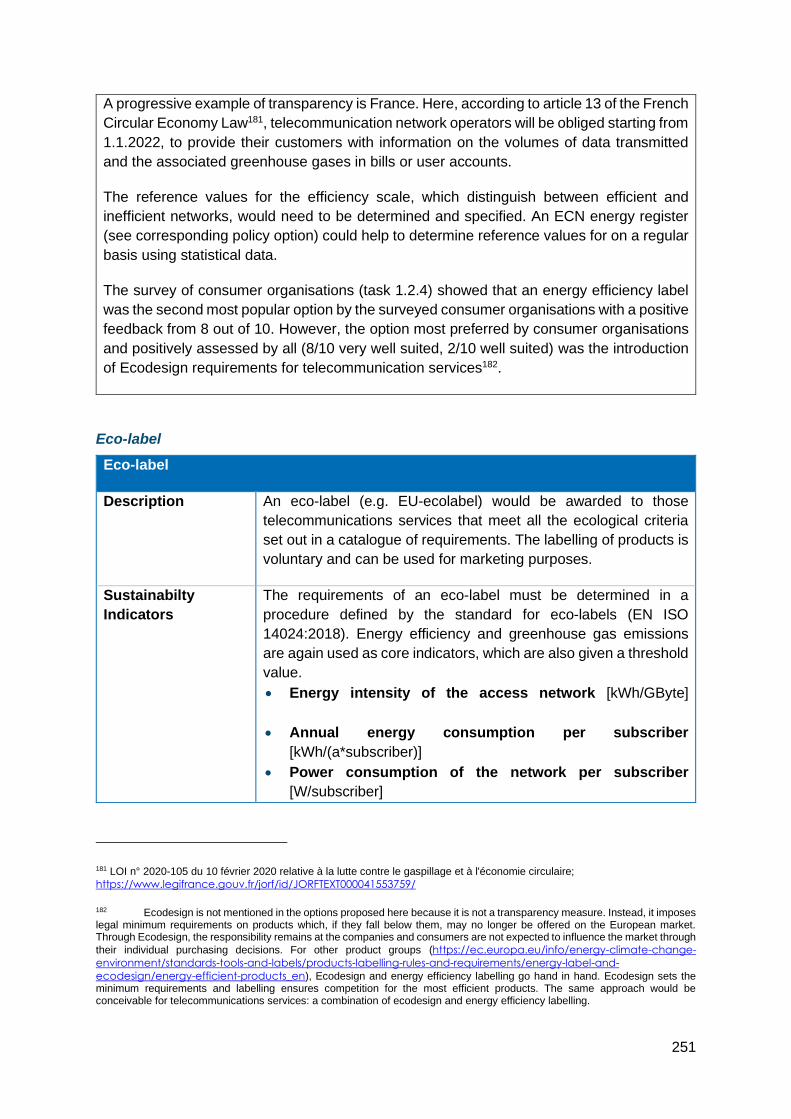
251
A progressive example of transparency is France. Here, according to article 13 of the French
Circular Economy Law181, telecommunication network operators will be obliged starting from
1.1.2022, to provide their customers with information on the volumes of data transmitted
and the associated greenhouse gases in bills or user accounts.
The reference values for the efficiency scale, which distinguish between efficient and
inefficient networks, would need to be determined and specified. An ECN energy register
(see corresponding policy option) could help to determine reference values for on a regular
basis using statistical data.
The survey of consumer organisations (task 1.2.4) showed that an energy efficiency label
was the second most popular option by the surveyed consumer organisations with a positive
feedback from 8 out of 10. However, the option most preferred by consumer organisations
and positively assessed by all (8/10 very well suited, 2/10 well suited) was the introduction
of Ecodesign requirements for telecommunication services182.
Eco-label
Eco-label
Description An eco-label (e.g. EU-ecolabel) would be awarded to those
telecommunications services that meet all the ecological criteria
set out in a catalogue of requirements. The labelling of products is
voluntary and can be used for marketing purposes.
Sustainabilty
Indicators
The requirements of an eco-label must be determined in a
procedure defined by the standard for eco-labels (EN ISO
14024:2018). Energy efficiency and greenhouse gas emissions
are again used as core indicators, which are also given a threshold
value.
• Energy intensity of the access network [kWh/GByte]
• Annual energy consumption per subscriber
[kWh/(a*subscriber)]
• Power consumption of the network per subscriber
[W/subscriber]
181 LOI n° 2020-105 du 10 février 2020 relative à la lutte contre le gaspillage et à l'économie circulaire;
https://www.legifrance.gouv.fr/jorf/id/JORFTEXT000041553759/
182 Ecodesign is not mentioned in the options proposed here because it is not a transparency measure. Instead, it imposes legal minimum requirements on products which, if they fall below them, may no longer be offered on the European market. Through Ecodesign, the responsibility remains at the companies and consumers are not expected to influence the market through
their individual purchasing decisions. For other product groups (https://ec.europa.eu/info/energy-climate-change-
environment/standards-tools-and-labels/products-labelling-rules-and-requirements/energy-label-and-
ecodesign/energy-efficient-products_en), Ecodesign and energy efficiency labelling go hand in hand. Ecodesign sets the minimum requirements and labelling ensures competition for the most efficient products. The same approach would be conceivable for telecommunications services: a combination of ecodesign and energy efficiency labelling.

252
Eco-label
• Annual carbon footprint per subscriber [kg CO2-
eq./(a*subscriber)]
• Specific carbon footprint of data transmission [g CO2-
eq./GByte]
• Share of renewable energies of the network operator in total
energy consumption [%]
Additional requirements could also be placed on material efficiency
(contribution to the circular economy):
• Reducing E-waste volumes
• Enhancing recycling
• Preventing premature replacement of end-user equipment
• Promoting the economical use of data volumes
Mechanism The eco-label acts as a so-called frontrunner instrument. A
company can voluntarily highlight those products on the market
that are particularly efficient and environmentally friendly with a
trustworthy label. In this way, the company creates market
advantages for these products. It is expected that aware
consumers will react to such market signals and thus also
encourage other suppliers to offer more eco-efficient products.
Impact
(environmental and
economic)
Eco-label requirements are used by the public sector as minimum
requirements for green public procurement and by companies
often as a benchmark for product development. Therefore, it could
be that the ambitious standard set by the eco-label would gradually
become established in the market. For companies, joining an eco-
label is associated with costs for the collection of product
indicators. Since participation is voluntary, only those companies
will incur these expenses who expect that they will nevertheless
have financial advantages as a result. In contrast, there are no
direct costs for companies with inefficient products that do not
participate. The development of eco-label criteria involves costs,
usually for the public sector.
Box 22: Feedback on an Eco-Label
[Only individual opinions can be reflected here and no representative survey took place.]
If there is one centralized label, the verification process to assert the compatibility of a
multitude of actors can be time consuming and often impossible to handle. At the opposite,
the decentralization of the verification process can create disparities in the process and a
need to control the auditors.
From the perspective of surveyed consumer protection organisations (task 1.2.4), an eco-
label is the third best option with 7 positive responses from 10 organisations. A voluntary

253
eco-label would only be applied to telecom services that are particularly environmentally
friendly and would not bring transparency to inefficient products and such services for which
providers choose not to apply for an eco-label.
3.3.2. Comparison of the different policy options
In principle, only those policy options for transparency measures have been selected in this
proposal that are considered feasible and target-oriented overall by this study. The different
policy options all have their advantages and disadvantages. The following Table 45 is intended
to provide an overview of where possible advantages and disadvantages are seen. In the
table, points (-) and (+) are assigned to give a quick overview of the ranking of the different
impacts. The rationale for this ranking is given in the following sections.
Table 45: Policy options for enhancing the efficiency of ECNs
Policy option Level of
indicators
Bindingnes
s
Environmenta
l Impact
Consumer
awareness
Remaining
research
ECN Energy Register
Company
wide
Voluntary or
mandatory
High
(+++)
Low,
professional
customers
only
(+)
Defining
efficiency
metrics
(-)
Code of Conduct on transparency measures for telecommunication services
Company
wide
Voluntary Medium
(++)
Medium
(++)
Defining
efficiency
metrics
(-)
Topten product database
Per product Voluntary Medium
(++)
Low
(+)
Defining
efficiency
metrics and
thresholds
(--)
Energy efficiency –type of label
Per product Mandatory High
(+++)
High
(+++)
Defining
efficiency
metrics
(-)
Eco-label Per product Voluntary Medium
(++)
High
(+++)
Defining
efficiency
metrics,
other
ecological
requirements
and
thresholds
(---)
Source: Oeko-Institut

254
Level of indicators
• The five policy options differ in the level at which they assess environmental impacts.
The ECN Energy Register and the CoC report at the company level and only
differentiate according to regional allocation (e.g. national state). This means that if a
company offers its services in several countries, it would need to record energy
consumption and other indicators in the region in which it is economically active. This
separation makes sense in order to enable comparability between regional suppliers
(e.g. same greenhouse gas emissions for electricity from the general electricity grid or
same climatic conditions).
• The remaining three policy options refer to the respective telecommunications
service offered (product level). A regional distinction must also be made here, for
example by allocating the product to a climate zone where it is provided or if it is
provided in an urban or a rural area. In addition, technical specifications have to be
given (access network type, fixed or mobile).
Bindingness
• A distinction is made between voluntary and obligatory policy options.
• The first option, ECN Energy Register, can be introduced both voluntarily and
obligatory. It is expected that at this aggregated level of the company there is a
willingness to fill this register with data. Other incentives could also contribute to this,
such as the fact that entry in the register is a prerequisite for participating in public
tenders or obtaining concessions for the use of public infrastructure.
• The Code of Conduct on transparency measures for telecommunication services
is defined as an voluntary instrument. It could contribute to a voluntary ECN Energy
Register.
• The two policy options Topten database and Eco-label are purely voluntary
measures. Here, a company would be interested in participating if it expects to gain
competitive advantages. Since only efficient services are included in the database or
labelled with the eco-label, there would be no reason for companies to avoid this
transparency measure.
• An energy efficiency –type of label, on the other hand, would be mandatory. Here,
services are labelled regardless of whether they are efficient or inefficient. In order to
achieve transparency for end-users, it is necessary that all ECN and ECS operators
use this label. If the energy efficiency label was voluntary, inefficient companies could
avoid this labelling and thereby possibly even achieve unjustified competitive
advantages.
Environmental Impact
• The environmental impact of policy options is particularly high if many companies are
affected and if many of their products are covered.

255
• The instruments ECN Energy Register and energy efficiency label are therefore
particularly efficient, because all market participants would be affected. Their
environmental impact is considered to be high.
• The impact of a Code of Conduct as a voluntary instrument depends on the number
of participants. It is expected that it would have a slightly lower impact than a obligatory
instrument but still a medium impact due to rising awareness of customers.
• The two information instruments on efficient products, Topten database and Eco-label,
would only refer to a smaller section of the products available on the market. Their
impact is seen primarily in their exemplary function. The environmental impact of these
instruments is rated as medium.
Consumer awareness
• The study investigated what characteristics an information tool must have in order for
end users to accept it and change their behaviour in the choice of a provider or when
using the respective service as a result. The prerequisite for this is first of all that the
tool is known and accepted as credible.
• An ECN Energy Register is primarily aimed at B2B customers and not at consumers.
As a result, its impact in promoting consumer awareness is rated low. It is expected
that the register would at most influence the choice of provider, but not the usage
behaviour in relation to individual services.
• A Code of Conduct on transparency measures for telecommunication services would
itself not have any effect on consumer awareness. However, the fact that standardised
rules for communication are laid down here leads to competition among the
telecommunications providers and to a higher credibility of the advertising statements
made by the companies. As a result, the instrument is considered to be medium
effective.
• The Topten product database is in principle a good tool for interested consumers.
However, awareness of its availability is comparatively low and there is no direct link
between the purchase decision and the search within this database. The effect on
consumer awareness is therefore rated as low.
• The energy efficiency label is very well known due to its presence in electronics
markets (on large household appliances). With a mandatory introduction, it would
therefore also be quickly understood for telecommunications services and included in
consumer decisions due to its appearance at the point of sale. Its effect on raising
awareness is therefore considered to be high. Since the energy label is directly linked
to individual services and must also be shown when these products are sold, it is also
a tool that could influence the conscious use of products, in addition to supporting the
choice of provider.
• Eco-labels also have a high level of awareness and, in addition, a high level of
credibility. If a product is labelled with an eco-label, the purchase decision of
consumers in favour of this product is comparatively easy. The effect of an eco-label
to reach the awareness of end users is therefore rated as high. The eco-label is

256
expected to contribute primarily to the selection of an energy-efficient provider. The
usage behaviour of the individual user, on the other hand, will not be influenced, as he
or she would not receive any information about the individual environmental impact of
his or her behaviour.
Remaining research
• The five policy options presented are not yet mature and would need to be developed
through further research or standardisation activities. In particular, it must be ensured
through further standardisation that the efficiency ratios of telecommunications
services are reliably determined and that the values of different services are thereby
comparable with each other. A low degree of standardisation could be an invitation to
misuse and greenwashing. The respective effort, which means both time and financial
resources, was therefore assessed at a high level. A distinction is made between low,
medium and high research effort.
• For the three options ECN Energy Register, Code of Conduct and energy efficiency
label there is a comparatively low remaining research effort. The metrics for
determining the energy efficiency of networks are mostly developed and only need to
be introduced in a binding manner.
• In contrast, there is a higher research effort for a Topten product database. Here,
suitable minimum criteria must also be developed that highlight particularly energy-
efficient products compared to inefficient products. The remaining research effort is
medium.
• The highest research effort is required for an eco-label for telecommunications
services. In addition to the minimum criteria, further environmental criteria (e.g. for
aspects of the circular economy) must be developed here in the sense of a
comprehensive assessment.
3.3.3. Ranking of policy options for transparency measures for ECNs
The comparison of the different policy options makes it possible to assign indicative points to
the individual properties. This has been done in Table 45 in the last section by assigning (+)
and (-) properties. Each plus is counted as one point, for each minus one point is deducted.
This allows a ranking of the different options.
The following order of precedence results from the scoring:
1. Energy efficiency –type of label (5 points)
2. ECN Energy Register (3 points)
3. Code of Conduct on transparency measures (3 points)
4. Eco-label (2 points)
5. Topten product database (1 point)
The preferred option on this basis is the labelling of telecommunication services with an
energy efficiency label. This option is the one with the highest environmental impact and

257
consumer attention according to the assessment of the authors of this study. Initial feedback
from individual stakeholders in the online presentations indicates that this could be an
acceptable option. As the feedback contained only a limited number of individual opinions,
further stakeholder surveys should be conducted as part of the energy efficiency label
development to examine whether the sector as a whole could work with this approach. The
surveyed consumer organisations see energy labelling as the second best option. From the
consumer organisations' point of view, more effective would be legal minimum requirements
in the form of Ecodesign regulation for telecommunication services. In practice, both
options Ecodesign and energy efficiency label could also be introduced at the same time,
which is already the case for other Ecodesign product groups.
The ECN Register represents the second priority by the indicative scoring points. Feedback
from stakeholders in the online presentations shows that this is mainly seen as a tool for
professional buyers and for regulators and less as a tool for consumer information.
The Code of Conduct on transparency measures has the same number of points as the
ECN register. Due to its voluntary character and the lower environmental impact that is
expected from this, it is ranked as the third priority. The surveyed consumer organisations
made it clear in the online survey that they consider voluntary commitments by suppliers to be
problematic and that the effect could even be negative.
The two instruments Eco-Label and Topten product database are considered by the authors
of this study lower priority. This assessment is also shared by the individual stakeholders at
the online presentations. Due to the rapid technical development, the effort to update such
consumer databases is very high and the minimum requirements for an eco-label would have
to be constantly renewed. Regardless of the practical feasibility, however, the surveyed
consumer associations consider at least the eco-label to be an easily communicable tool and
rate it as the third best solution.
3.4. Conclusions: towards more energy and resource efficient data centres and
options for a transparency mechanism for electronic communications services
and networks
The objectives of this study are:
Concerining data centres and cloud computing:
• To propose policy measures for increasing the energy and resource efficiency of data
centres and assess the environmental, social and economic impact.
• In support of that objective to perform:
o An analysis of data centre definitions and types and determine meaningful size
thresholds;
o An analysis of current market practices related to circularity and identify potential ways
to increase circularity;
o An analysis of standards, metrics, indicators, methods and methodologies that are
currently used in the field for assessing energy and resource efficiency and an
assessment of their suitability for inclusion in policy measures

258
o To identify gaps in the value chains where potential for energy efficiency and/or
circularity is lost and potential measures to bridge these gaps;
Concerning electronic communications services and networks:
• To propose policy options that could be included in a transparency mechanism on the
environmental footprint of ECNs and in view of this:
o To report practices, indicators, standards and methodologies across the industry
related to the environmental footprint of electronic communications networks and
services;
o To report on sustainability aspects of the service offered to consumers (in particular to
assess a number of possible indicators in view of end-user communication and for
analysing the impact of a voluntary and mandatory transparency mechanism on the
environmental footprint of electronic communications services and on relevant
stakeholders.
• To consider criteria for the assessment of the environmental sustainability of new
electronic communications networks.
In this chapter we present the conclusions for each of the two segments of the ICT value chain
under study: 1) data centres and cloud computing and 2) electronic communication services
and networks.
3.4.1. Data centres and cloud computing
On the basis of careful analyses, stakeholder feedback from surveys, interviews, and more
prominently from the online workshop, a number of policy measures can be proposed that are
feasible, effective and specifically targeted to data centres and cloud computing. In our view
a combination of (i) improvements to the Code of Conduct, (ii) compulsory green public
procurement criteria for publicly procured data centres, server rooms and cloud services and
(iii) the set-up of a European Data Centre Registry would be advisable. Evidently other
measures are interesting and useful as well, yet appear to be more focussed on particular
aspects of data centres and cloud computing or rather indirectly affecting their energy and
resource efficiency.
The Code of Conduct is an important instrument in greening data centres. In this study a
number of potential improvements have been assessed. Consultation with the stakeholders
indicates that it is important to maintain the best practice approach and that its voluntary nature
should be kept. Setting quantitative energy efficiency goals was perceived as challenging due
to large regional differences across the EU in terms of climate, access to renewable energy
sources and business models. An EU level playing field is key. Nevertheless in our view
introducing a widely accepted quantitative energy efficiency target such as the PUE in
combination with ranges that reflect differences in regional conditions and a classification of
data centres should be feasible. Third-party monitoring is perceived as having a value added
provided that the independence of the certifiers and confidentiality of the information can be
guaranteed. In view of the perceived benefits of an improved version of the CoC, methods for
increasing participation are valuable. Especially initiatives that reach out to SME data centres
are welcomed, both to disseminate the expertise to implement the best practices as well as
improvements in financing and business model development.

259
The change from voluntary to mandatory GPP criteria for publicly procured data centres and
cloud services would not only have an important signal function from authorities putting action
to word in their own areas of operation, but would also foster the greening of data centres and
cloud computing services overall. It has to be admitted that the private market segment is by
and far much larger. Yet in view of the increasing digitalisation of government services the
public segment can create a critical mass and lead market in the data centre and cloud
services segment. As with the CoC also with this measure an EU level playing field is
important, as well as equal access to the public data centre procurement market for small data
centres.
The third most feasible policy measure is creating a European Data Centre Registry where
energy consumption and material use are transparently reported. The registry can be
developed parallel and in consistency with the CoC improvement and mandatory GPP criteria
indicated above. Critical points to be resolved are the treatment of confidential business
information, the precise definition of indicators to be provided, and the control and
management of the Registry. These are not unsurmountable challenges which can be
adequately solved using e.g. a mutually agreed protocol between the data centre operators
and the organisation responsible for the Registry. The Registry would be instrumental in
monitoring and analysing the progress towards greening data centres, as well as in providing
valuable market information for the stakeholders.
Stricter requirements for the Ecodesign Regulation on servers and data storage products
are instrumental to greening data centres and cloud computing. Yet the ultimate contribution
to energy efficiency also depends on the entire operational process as well as the business
model used. At the time of the study the Regulation is under review. After the adoption of the
amendments which focus on a methodology to measure active and idle state power, it would
be useful issuing an ecodesign preparatory study defining the minimum requirements for
active and idle state performance, resource efficiency and operational conditions.
Although workshop participants indicated that access to finance is not a problem for DCs, the
Sustainable Finance Taxonomy Climate Delegated Act remains a valuable policy measure
that can facilitate investments in the refurbishment and introduction of new and greener
technologies in DCs. In this context the streamlining with the eligibility criteria for Important
Projects of Common European Interest, which at the time of the study are under revision, is
important.
In combination with the EU Data Centre Registry and third-party control a voluntary self-
regulation initiative might be worth considering. Yet opinions remain divided about the
ultimate effectiveness of such an initiative.
Other policy measures that are not directly targeted at data centres such as EMAS, the
EED, the WEEE Directive, the CSR Directive, the EPBD, the Green Claims, do have an effect
on greening data centres, yet rather in an indirect manner. These measures surely help
shaping a favourable regulatory environment, yet given that data centres and cloud computing
services are the prime target of this study, and the indirect nature of these measures, these
policy measures are not main candidates for greening data centres and cloud computing.
However it remains important to guard the consistency and coherence between the direct
measures, in particular the CoC and mandatory GPP, and the other measures as this would

260
reduce compliance costs, create (lead) market leverage and as such increase the energy and
resource efficiency of data centres.
Evidently policy measures need to be implemented and one of the key hindrances that need
to be overcome in this respect is the myriad of concepts and definitions of data centres and
the metrics to measure energy and resource efficiency. We analysed the various concepts
that are used at the time of the study and concluded that it is recommended to use the
definition in the CoC as a starting basis and further align it with the one of the EN50600
standard and then add these to the participant or best practice guidelines documents. At the
same we recommend avoiding the use of the term ‘managed service provider’ to prevent
confusion. More detail is provided in chapter 2.1. (Task 1.1.1.) where we among others
present a taxonomy of DCs, and chapter 3.2. (Task 2.1.) where we analyse the definition in
the context of applications for policy measures.
Concerning the methods for measuring the energy and resource efficiency of data
centres (task 1.1.3) our analyses have shown that there are already a large number of
different methods and metrics that focus on data centres and their individual components.
Particularly useful are the metrics from the European Data Centre Standard EN 50600-4 key
performance indicators (KPIs) series, some of them still under development, which very
systematically describe the different environmental characteristics of data centres and support
them with measurement methods. However the existing metrics have a clear focus on energy-
related issues, and circular economy aspects are still insufficiently covered by the metrics.
With regard to climate protection, leakage quantities of refrigerants from cooling systems and
the associated greenhouse gas emissions are still insufficiently recorded.
Despite the challenges in terms of definitions and metrics, we conclude that by pursuing the
three policy measures namely (i) improvements to the Code of Conduct, (ii) compulsory green
public procurement criteria for publicly procured data centres, server rooms and cloud services
and (iii) the set-up of a European Data Centre Registry and by simultaneously implementing
coherent specifications in other (indirect) policy measures a favourable regulatory
environment can be established that fosters greening of data centres and cloud computing,
both for large multinational data centres as well as for SMEs operating in the edge segment.
3.4.2. Electronic communications services and networks
In view of the EU Green Deal and related policy strategies at EU and Member State level, a
framework has to be established that incentives for the operators of electronic communication
networks to use communication technology that is as energy-efficient as possible and also
sustainable in other respects, and to operate existing networks in a climate-friendly manner.
With the present study, such indicative framework conditions and possible mechanisms for
ECNs were assessed, especially with regard to energy efficiency and greenhouse gas
emissions.
The study comes to the conclusion that there are currently two main areas of focus to the
ecological optimisation of telecommunications infrastructures:
• The first focus is the deployment of energy efficient network infrastructure, for
example in the construction of new mobile radio base stations or antennas, new fixed
Internet access cabinets or the deployment of broadband cables.

261
• The second focus is the provision of eco-friendly telecommunications services by
ECN operators, i.e. mobile telephony or broadband contracts, fixed telephone
connections, fixed internet connections, business-to-business data lines, cable TV or other
services that require a fixed or mobile connection to the electronic communications
network.
Deployment of new network components
For the planning of new networks, the ECN sector has developed a variety of metrics (see
tasks 1.2.3 and 1.2.5) to determine the energy efficiency of the components used already in
the planning phase and to build energy-optimised systems.
This practice could be further promoted by giving particularly energy-efficient networks a more favourable treatment, for instance in permit granting (e.g. accelerated procedures), in the use of public infrastructure (roads, cable ducts, facilities, frequencies), or in the selection procedures for state aid projects. This could be based on indicators such as the energy intensity of the network [kWh/GByte].
In addition the study proposes that telecom operators record the energy intensity of the
network in a central or national register (ECN Energy Register), similar to the register
proposed for data centres, in order to create an overview of the different providers and the
efficiency of the different network technologies. Regulators, professional buyers as well as
investors or financial institutions can get an overview of the efficiency of the respective
provider by comparing within the database. The data contained in the proposed ECN energy
register should be made available in such a transparent way that it can be further processed,
for example to generate information for end-users on the efficiency of providers.
Transparency towards customers in the delivery of telecommunication services
One of the objectives of this study was to investigate what transparency measures by ECN
providers could help to ensure that customers of telecommunication services can choose
energy-efficient offers, thus creating competition for the most environmentally friendly services
(see task 1.2.4). For this purpose, various metrics were considered as well as the opinions of
consumer protection organisations were surveyed. The most promising transparency measure
identified in this study is the introduction of an energy efficiency –type of label for
telecommunications services. The specific energy consumption of the communication
service could be shown on the label in a colour scale as well as a classification from A to G.
The label could also include information on the carbon footprint of the service and the share
of renewable energies used. When selling and advertising telecommunication services , the
energy efficiency label would need to be shown. The existing instrument is already very well
established on the market for many electrical appliances (lamps, refrigerators, washing
machines, air conditioners, etc.) and it therefore offers good conditions for it to be well
accepted by consumers. However, it should be noted that in addition to methodological
challenges, the existing efficiency label is currently assigned for physical products (goods)
and could not be used for services. In addition to private customers, the information provided
by the energy efficiency label could also be used by professional buyers and the public sector
in the context of green public procurement (GPP). As a metric on which the efficiency scale is
based, various options were discussed in the study. It is important for a suitable metric that it

262
should not be a pure performance metric that for example assumes maximum data traffic, but
that the energy demand must be related to an understandable and realistic usage unit
(e.g. per connection, per average subscriber or per hour of usage). In order to identify the best
calculation method for the efficiency indicator, more research is therefore needed in the further
design of a possible energy efficiency –type of label.
Establishing minimum efficiency requirements for deployment and Ecodesign requirements
Both proposed policy options (ECN energy register and energy efficiency label) are
information tools that are intended to promote competition for the most efficient telecom
service. So far, information on the energy efficiency of telecommunication networks and
services is still very scarce. Network operators typically do not make such information publicly
available. Therefore, it is also not possible to identify what energy consumption is appropriate
for an electronic communications network and what threshold values can be defined to
exclude particularly inefficient networks or services from the market. After an introduction of
the transparency measures mentioned above, however, this data situation would change. The
evaluation of the data in the proposed ECN energy register and the information on the energy
efficiency label per telecom service would create the basis for identifying inefficient systems
and services.
In addition to the transparency measures, two further policy instruments are therefore
proposed, establishing minimum requirements, which could be considered to introduce as
a next step in the coming years:
• When new network infrastructure components are installed, a minimum efficiency
requirement for new infrastructure could ensure that inefficient network systems are no
longer granted licences or permits for deployment. This will prevent etablishing inefficient
network infrastructures.
• With regard to telecommunication services, it could also be considered to introduce
minimum requirements through Ecodesign –type of requirements in a step following
the transparency measures. This instrument is well established under the Ecodesign
Directive (2009/125/EC). However, it should be noted that the existing instrument applies
to “energy-related products”, defined as goods, and not to services. Ecodesign
requirements define the minimum environmental characteristics that must be met before
a product (or service) can be offered on the European market. The most inefficient services
could thus be excluded from the market and telecom providers can be further motivated
to offer particularly energy-efficient and climate-friendly services. As this is a very far-
reaching instrument that intervenes strongly in the market, further studies on the
economic, social and ecological effects of this instrument would have to be carried out
beforehand.
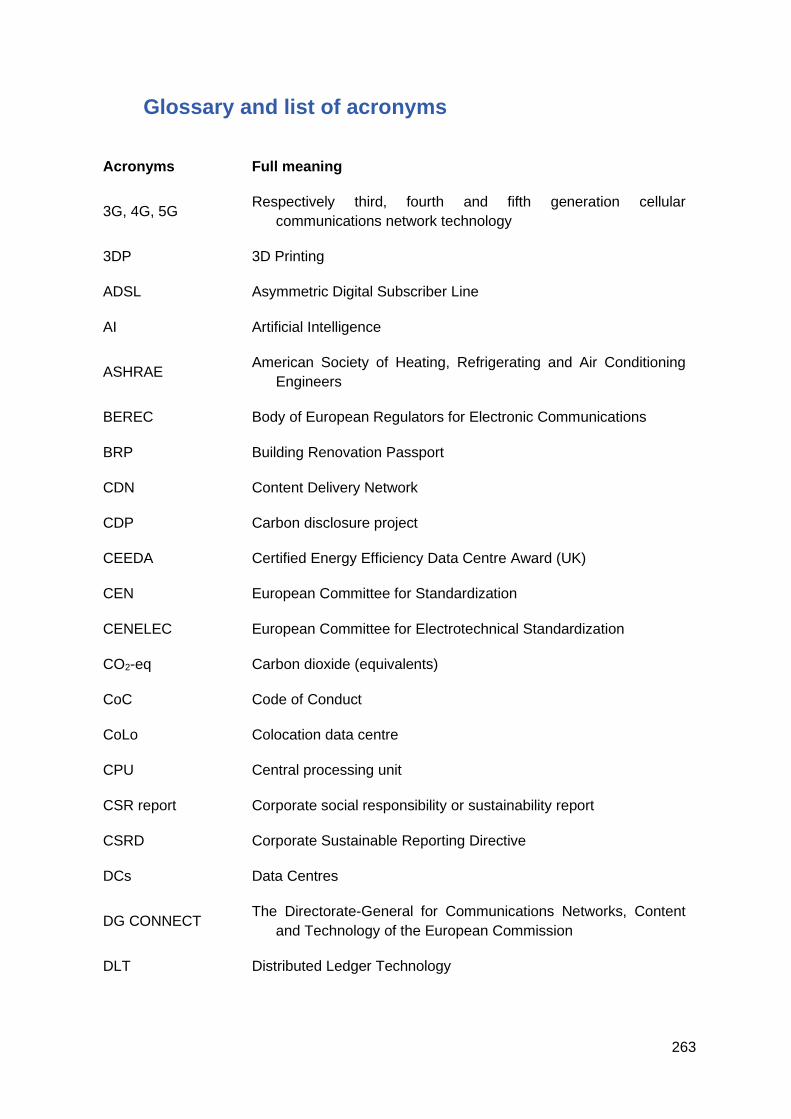
263
Glossary and list of acronyms
Acronyms Full meaning
3G, 4G, 5G Respectively third, fourth and fifth generation cellular
communications network technology
3DP 3D Printing
ADSL Asymmetric Digital Subscriber Line
AI Artificial Intelligence
ASHRAE American Society of Heating, Refrigerating and Air Conditioning
Engineers
BEREC Body of European Regulators for Electronic Communications
BRP Building Renovation Passport
CDN Content Delivery Network
CDP Carbon disclosure project
CEEDA Certified Energy Efficiency Data Centre Award (UK)
CEN European Committee for Standardization
CENELEC European Committee for Electrotechnical Standardization
CO2-eq Carbon dioxide (equivalents)
CoC Code of Conduct
CoLo Colocation data centre
CPU Central processing unit
CSR report Corporate social responsibility or sustainability report
CSRD Corporate Sustainable Reporting Directive
DCs Data Centres
DG CONNECT The Directorate-General for Communications Networks, Content
and Technology of the European Commission
DLT Distributed Ledger Technology

264
DNSH Do not significantly harm criteria
EC European Commission
ECN Electronic Communications Network
ECS Electronic Communications Service
EEA European Economic Area
EED Energy Efficiency Directive
EEE electrical and electronic equipment
EMAS Eco-Management and Audit Scheme
EMF electromagnetic field
EPBD Energy Performance of Buildings Directive
EPC Energy Performance Certificates
ESO European Standards Organisation
ETSI European Telecommunications Standards Institute (one of the
ESOs besides CEN and CENELEC)
EU European Union
FAN Fixed Asset Network
FWC Framework contract
FTTH Fiber To The Home network
GDC Green Data Centre
GHG Greenhouse gas
GRI Global Reporting initiative
Gt Giga tonnes
GWP Global warming potential
HDD Hard Disk Drive
ICCP Intergovernmental Panel on Climate Change
ICT Information and communication technologies,

265
IoT Internet of Things
IPCEI Important Projects of Common European Interest
ISAE International Standard on Assurance Engagements
ISO 14040/44, International standard for Life Cycle Assessments
JAC Joint Audit Cooperation
JRC Joint Research Centre of the European Commission
KPI Key performance indicators
LCA Life Cycle Assessments
LTE Long-Term Evolution technology
LTRS Long-term Renovation Strategies
MEPS Mandatory minimum Energy performance Standards
MS Member States
MSP Managed Service Providers
NFRD Non-financial Reporting Directive
NFV Network Functions Virtualisation technologies
NIEE Total Network Infrastructure Energy Efficiency
NZEB Nearly Zero-energy Buildings
OCP Open Compute Project (OCP)
PCF Product Carbon Footprint
PDU (data centre) Power Distribution Unit
PEF Product Environmental Footprint
PEFCR Product Environmental Footprint category rules
POP Point of Presence
PSU Power supply unit
PUE Power usage effectiveness of data centres
RAN Radio Access Network
266
ROI Return On Investment
SASB Sustainability Accounting Standards Board
SCM Standard Cost Model
SDN Software Defined Networking
SFDR Sustainable Finance Disclosure Regulation
SFT Sustainable Finance Taxonomy
SRI Smart Readiness Indicator
TCE Total Cost to the Environment
TCO Total Cost of Ownership
TEG Technical Expert Group on Sustainable Finance
ToR Terms of references
TRL Technology Readiness Level
TSSP Thematic Smart Specialisation Platform
TWh Tera-Watthours
UMTS Universal Mobile Telecommunications System
UPS Uninterruptible Power Supply
VDSL Very high-speed Digital Subscriber Line
WAN Wide Area Network
WEEE Waste Electrical and Electronic Equipment
267
References
Acton, M.; Bertoldi, P.; Booth, J. (2020): 2020 Best Practice Guidelines for the EU Code of Conduct on Data Centre Energy Efficiency. Version 11.1.0 (Final Version). European Commission, Ispra, 2020, JRC119571. Available online at https://e3p.jrc.ec.europa.eu/sites/default/files/documents/publications/jrc119571_jrc119571_2020_best_practice_guidelines_v11.1.0a_br_ma_21_jan.pdf, checked on 1/14/2021.
Alfieri, F., Dodd, N., Gama-Caldas, M., Wolf, O., Maya-Drysdale, L., Huang, B., Viegand, J., Flucjer, S., Tozer, R., Whitehead, B., Brocklehurst, F., (2019) Development of European Green Public Procurement Criteria for Data Centres – Preliminary report, JRC Technical Report, EUR 29945 EN, Publications Office of the European Union, Luxemburg, 2019, ISBN 978-92-76-10382-0, doi:10.2760/327087, JRC118550.
Alger, Douglas (2010): Grow a Grenner Data Center. Chapter 2: Measuring Green Data Centers. Available online at https://cdn.ttgtmedia.com/searchSystemsChannel/downloads/Growing_a_Green_Data_Center_9781587058134_CH02.pdf, checked on 12/29/2020.
Al-Shehri, Salman M.; Loskot, Pavel; Numanoglu, Tolga; Mert, Mehmet (n.d.): Common Metrics for Analyzing, Developing and Managing Telecommunication Networks. Available online at https://arxiv.org/ftp/arxiv/papers/1707/1707.03290.pdf, checked on 1/14/2021.
Andor, Mark; Gerster, Andreas; Sommer, Stephan (2017): Consumer Inattention, Heuristic Thinking and the Role of Energy Labels. Essen (Ruhr economic papers, 671). Available online at http://www.rwi-essen.de/media/content/pages/publikationen/ruhr-economic-papers/rep_17_671.pdf.
Andrae A.S.G. (2020) Hypotheses for primary energy use, electricity use and CO2 emissions of global computing and its shares of the total between 2020 and 2030. WSEAS TRANSACTIONS on POWER SYSTEMS DOI: 10.37394/232016.2020.15.6 https://www.wseas.org/multimedia/journals/power/2020/a125116-083.pdf
BEREC (2020): BEREC Report on the outcome of the public consultation on the draft BEREC Work Programme 2021. BEREC - Body of European Regulators for Electronic Communications. Available online at https://berec.europa.eu/eng/document_register/subject_matter/berec/download/0/9719-berec-report-on-the-outcome-of-the-publi_0.pdf, checked on 3/10/2021.
Bertoldi, P. ; Avgerinou, M.; Castellazzi, L. (2017) Trends in data centre energy consumption under the European Code of Conduct for Data Centre Energy Effificiency, EUR 28874 EN, Publications Office of the European Union, Luxembourg, 2017, ISBN 978-92-79-76445-5, doi:10.2760/358256, JRC108354
Bertoldi, P; Lejeune, A (2020): Code of Conduct on Energy Consumption of Broadband Equipment. Version 7.1. European Commission, Ispra 2020, JRC119761. Available online at https://e3p.jrc.ec.europa.eu/publications/eu-code-conduct-energy-consumption-broadband-equipment-version-71, checked on 1/23/2021.
Berwald, Anton; Faninger, Thibault; Bayramoglu, Sara; Tinetti, Benoît; Mudgal, Shailendra; Stobbe, Lutz; Nissen, Nils (2015): Ecodesign Preparatory Study on Enterprise Servers and Data Equipment. ENTR Lot 9. Edited by European Union, checked on 1/14/2021.
BfR (2010): Grenzen und Möglichkeiten der Verbraucherinformation durch Produktkennzeichnung. With assistance of W. Konrad, D. Scheer. Edited by A. Epp, S.
268
Kurzenhäuser, R. Hertel, G.-F. Böl. Bundesinstitut für Risikobewertung (BfR). Institut für ökologische Wirtschaftsforschung – IÖW.
Blackburn, Mark (2012): Data Center Storage Efficiency Metrics. The Green Grid Forum 2012. Available online at https://www.thegreengrid.org/en/resources/library-and-tools/145-2012-Forum-%E2%80%93-Data-Center-Storage-Efficiency-Metric, checked on 1/14/2021.
Blue Angel, The German Ecolabel (Ed.) (2019): Energy Efficient Data Center Operation. Blue Angel, The German Ecolabel, Basic Award Criteria Edition January 2019, Version 1. Available online at https://produktinfo.blauer-engel.de/uploads/criteriafile/en/DE-UZ%20161-201901-en%20Criteria-2019-03-21.pdf, checked on 5/31/2021.
Booth, John (2019): D8.6 Green DC Energy Efficiency Roadmap V1. CATALYST.D8.6.GIT.WP8.v1.0 (H2020-EE-2016-2017), checked on 1/5/2021.
Booth, John (2020): D8.11 Green DC Energy Efficiency Roadmap V2. CATALYST.D8.11.GIT.WP8.v1.0 (H2020-EE-2016-2017). Available online at https://project-catalyst.eu/wp-content/uploads/2020/09/CATALYST.D8.11.GIT_.WP8_.V1.0package.pdf, checked on 1/20/2021.
Brill, Kenneth G. (2007): Data center energy efficiency and productivity. The Uptime Institute. Available online at http://large.stanford.edu/courses/2017/ph240/yu2/docs/brill.pdf, checked on 12/30/2020.
Brotherton, Heather M. (2013): Datacenter Efficiency Measures, checked on 12/30/2020.
Canfora P., Gaudillat P., Antonopoulos I., Dri M., (2020) Best Environmental Management Practice in the Telecommunications and ICT Services sector, EUR 30365 EN, Publications Office of the European Union, Luxembourg, 2020, ISBN 978-92-76-21574-5, doi:10.2760/354984, JRC121781
Carbon Trust (2020): Product carbon footprint labelling. Consumer research 2020. Available online at https://prod-drupal-files.storage.googleapis.com/documents/resource/restricted/Product-carbon-footprint-labelling-report-v3.pdf.
Chinnici, M.; Capozzoli, A.; Serale, G. (2016): Measuring energy efficiency in data centers. In Ciprian Dobre, Fatos Xhafa, M. Chinnici, A. Capozzoli, G. Serale (Eds.): Pervasive computing. Next generation platforms for intelligent data collection. Amsterdam, Boston: Elsevier/AP Academic Press is an imprint of Elsevier (Intelligent data-centric systems).
CISCO (2020): 2019 Corporate Social Responsibility Report. Available online at https://www.cisco.com/c/dam/m/en_us/about/csr/csr-report/2019/_pdf/csr-report-2019.pdf.
Consumer Focus (2012): Under the influence? Consumer attitudes to buying appliances and energy labels, checked on 12/21/2015.
Define (2017): Broadband Fibre Qualitative Research. Final Report. Edited by Define research & insight. Available online at https://www.asa.org.uk/uploads/assets/uploaded/d791272c-805a-495d-8e25650af1740ab7.pdf.
Dodd, N., Alfieri, F., Maya-Drysdale, L., Viegand, J., Flucker, S., Tozer, R., Whitehead, B., Wu, A., Brocklehurst F., (2020) Development of the EU Gr een Public Procurement (GPP) Crit er ia for Data Centres Server Rooms and Cloud Servic es , Final Technical Report,, EUR 30251 EN, Publications Office of the European Union , Luxembourg, 2020, ISBN 978-92-76-19447-7, doi:10.2760/964841, JRC118558
269
EDNA (2019): Intelligent Efficiency For Data Centres & Wide Area Networks. Report Prepared for IEA-4E EDNA. Available online at https://www.iea-4e.org/document/428/intelligent-efficiency-for-data-centres-and-wide-area-networks, checked on 1/29/2021.
Egmond, C.; Bruel, R. (2007): Nothing is as practical as a good theory,. Analysis of theories and a tool for developing interventions to influence energy-related behaviour. Available online at http://www.cres.gr/behave/pdf/paper_final_draft_CE1309.pdf.
Egmond, C.; Jonkers, R.; Kok G. (2005): A strategy to encourage housing associations to invest in energy conservation. In Energy Policy (33), pp. 2374–2384. Available online at https://www.sciencedirect.com/science/article/abs/pii/S0301421504001600, checked on 7/30/2021.
EN ISO 14024:2018: Environmental labels and declarations - Type I environmental labelling - Principles and procedures (ISO 14024:2018).
Energy Star (2018): ENERGY STAR Score for Data Centers in the United States. Technical Reference. Available online at https://www.energystar.gov/sites/default/files/tools/Data_Center_August_2018_EN_508.pdf, checked on 12/30/2020.
Ericsson (2020): Ericsson Mobility Report. Available online at https://www.ericsson.com/4adc87/assets/local/mobility-report/documents/2020/november-2020-ericsson-mobility-report.pdf.
ETSI EN 303 470 V1.1.0 (2019): ETSI EN 303 470 - V1.1.0 - Environmental Engineering (EE); Energy Efficiency measurement methodology and metrics for servers, checked on 1/14/2021.
ETSI ES 203 136 v1.2.1 (2017): ES 203 136 - V1.2.1 - Environmental Engineering (EE); Measurement methods for energy efficiency of router and switch equipment, checked on 1/13/2021.
ETSI ES 203 199 V1.2.1: ES 203 199 - V1.2.1 - Environmental Engineering (EE); Methodology for environmental Life Cycle Assessment (LCA) of Information and Communication Technology (ICT) goods, networks and services, checked on 2/9/2021.
ETSI ES 205 200-2-1 (2014): ETSI ES 205 200-2-1 - V1.2.1 - Access, Terminals, Transmission and Multiplexing (ATTM); Energy management; Global KPIs; Operational infrastructures; Part 2: Specific requirements; Sub-part 1: Data centres, checked on 1/17/2021.
European Commission (2010): A Digital Agenda for Europe. Communication from the Commission to the European Parliament, the Council, the European Economic and Social Committee and the Committee of the Regions. COM(2010)245 final. Available online at https://eur-lex.europa.eu/LexUriServ/LexUriServ.do?uri=COM:2010:0245:FIN:EN:PDF, checked on 3/10/2021.
European Commission (2013): ICT footprint. Pilot testing on methodologies for energy consumption and carbon footprint of the ICT-sector. SMART-Nr 2011/0078. Ecofys; Quantis; BIO Intelligence Service. Available online at https://ec.europa.eu/newsroom/dae/document.cfm?doc_id=1710, checked on 3/10/2021.
European Commission (2014): Directive 2014/61/EU of the European Parliament and of the Council of 15 May 2014 on measures to reduce the cost of deploying high-speed electronic communications networks. Available online at https://eur-

270
lex.europa.eu/legal-content/EN/TXT/PDF/?uri=CELEX:32014L0061&from=EN, checked on 3/10/2021.
European Commission (2017): Regulation (EU) 2017/1369 of the European Parliament and of the Council of 4 July 2017 setting a framework for energy labelling and repealing Directive 2010/30/EU. Available online at https://eur-lex.europa.eu/legal-content/en/TXT/?uri=CELEX%3A32017R1369, checked on 8/16/2021.
European Commission (2018a): Assessment of different communication vehicles for providing Environmental Footprint information. Final Report. Francisco Lupiáñez-Villanueva, Pietro Tornese, Giuseppe A. Veltri and George Gaskell. Presented in consortium by LSA & Partner. European Commission. Directorate General Environment. Directorate A – Green Economy. ENV.A.1 – Eco-Innovation & Circular Economy. Available online at https://ec.europa.eu/environment/eussd/smgp/pdf/2018_pilotphase_commreport.pdf.
European Commission (2018b): Product Environmental Footprint Category Rules Guidance. Version 6.3 – May 2018. Available online at https://ec.europa.eu/environment/eussd/smgp/pdf/PEFCR_guidance_v6.3.pdf, checked on 8/6/2021.
European Commission (2018c): Report from the Commission to the European Parliament and the Council. on the implementation of Directive 2014/61/EU of the European Parliament and of the Council of 15 May 2014 on measures to reduce the cost of deploying high-speed electronic communications networks. Available online at https://eur-lex.europa.eu/legal-content/EN/TXT/?uri=COM%3A2018%3A492%3AFIN, checked on 3/10/2021.
European Commission (2019a): Special Eurobarometer 490. Climate Change. Conducted by Kantar Public at the request of Directorate-General for Climate Action. Survey coordinated by the Directorate-General for Communication (DG COMM ‘Media monitoring and Eurobarometer’ Unit). Available online at https://europa.eu/eurobarometer/api/deliverable/download/file?deliverableId=70456.
European Commission (2019b): Single Market for Green Products - The Product Environmental Footprint Pilots - Environment - European Commission. Available online at https://ec.europa.eu/environment/eussd/smgp/ef_pilots.htm, updated on 12/31/2019, checked on 8/6/2021.
European Commission (2020a): Commission Recommendation (EU) 2020/1307 of 18 September 2020 on a common Union toolbox for reducing the cost of deploying very high capacity networks and ensuring timely and investment-friendly access to 5G radio spectrum, to foster connectivity in support of economic recovery from the COVID-19 crisis in the Union. Available online at https://eur-lex.europa.eu/legal-content/EN/TXT/?uri=CELEX:32020H1307, checked on 3/10/2021.
European Commission (2020b): Shaping Europe's digital future. Luxembourg: Publications Office of the European Union. Available online at https://ec.europa.eu/info/sites/info/files/communication-shaping-europes-digital-future-feb2020_en_4.pdf, checked on 4/8/2021.
European Commission (2021a): Rules and requirements for energy labelling and ecodesign. Available online at https://ec.europa.eu/info/energy-climate-change-environment/standards-tools-and-labels/products-labelling-rules-and-requirements/energy-label-and-ecodesign/rules-and-requirements_en, updated on 3/8/2021, checked on 8/6/2021.
European Commission (2021b): Special Eurobarometer 510. E-Communications in the Single Market. Available online at https://europa.eu/eurobarometer/surveys/detail/2232, checked on 8/9/2021.

271
forsa (2009): Verständlichkeit und Einflussfaktoren für verschiedene Optionen der grafischen Neugestaltung der EU-einheitlichen Energieverbrauchskennzeichnung [Understandability and influencing factors for different options for the graphical redesign of the common EU Energy Label]. dena Deutsche Energie Agentur, checked on 12/21/2015.
Georgiadou, Vasiliki; Chenadec, Julie; Irazoqui, Cristobal (2018): D2.2 Green Data Centre Assessment Toolkit. Version 1.0. CATALYST.D2.2.GIT.WP2.v1.0 (H2020-EE-2016-2017), checked on 12/22/2020.
GHG Protocol ICT Sector Guidance (2017): ICT Sector Guidance built on the GHG Protocol Product Life Cycle Accounting and Reporting Standard. Available online at https://www.ghgprotocol.org/sites/default/files/ghgp/GHGP-ICTSG%20-%20ALL%20Chapters.pdf, checked on 2/9/2021.
Green IT Promotion Council (2012): New Data Center Energy Efficiency Evaluation Index - (DPPE) Datacenter Performance per Energy Measurement Guidelines (Ver 2.05). Available online at https://home.jeita.or.jp/greenit-pc/topics/release/pdf/dppe_e_DPPE_Measurement_Guidelines.pdf, checked on 1/20/2021.
Green, L. W.; Kreuter, M. W. (1999): Health promotion planning. An Educational and Ecological Approach. 3rd edition. Mountain View, California.
Gröger, Jens; Liu, Ran (2021): Green Cloud Computing. Lebenszyklusbasierte Datenerhebung zu Umweltwirkungen des Cloud Computing. With assistance of Lutz Stobbe, Jan Druschke, Nikolai Richter. Edited by Umweltbundesamt. Dessau-Roßlau. Available online at https://www.umweltbundesamt.de/sites/default/files/medien/5750/publikationen/2021-06-17_texte_94-2021_green-cloud-computing.pdf, checked on 8/10/2021.
Grünig et al (2010): Study on Consumer Information on Fuel Economy and CO2 Emissions of New Passenger Cars. Implementation of the Directive 1999/94/EC. Available online at https://www.europarl.europa.eu/RegData/etudes/etudes/join/2010/433455/IPOL-ENVI_ET(2010)433455_EN.pdf, checked on 8/6/2021.
Hottenroth et al (2013): Carbon Footprints für Produkte. Handbuch für die betriebliche Praxis kleiner und mittlerer Unternehmen. With assistance of Heidi Hottenroth, Bettina Joa, Mario Schmidt. Hochschule Pforzheim, Institut für Industrial Ecology. Available online at https://www.hs-pforz-heim.de/fileadmin/user_upload/uploads_redakteur/Forschung/INEC/Dokumente/Hottenroth_et_al_Carbon_Footprints_fuer_Produkte_web.pdf.
Hurtado, R.; Paralera, M. (2016): Preferences of university students on the choice of internet service provider. Available online at http://www.revistalatinacs.org/071/paper/1102/22en.html.
Ipsos MORI; London Economics; AEA (2012): Research on EU product label options. Final report, checked on 12/21/2015.
ISO (2021): Environmental labels. Available online at https://www.iso.org/publication/PUB100323.html, updated on 8/6/2021, checked on 8/6/2021.
ISO 14040 (2006): Environmental management - Life cycle assessment - Principles and framework.
ITU (2008): Telecom Network Planning for evolving Network Architectures Reference Manual. Draft version 5.1; January 2008. Document NPM/5.1. International Telecommunication Union (ITU). Geneva. Available online at https://www.itu.int/ITU-
272
D/tech/NGN/Manual/Version5/NPM_V05_January2008_PART1.pdf, checked on 3/11/2021.
ITU (2012): Review of mobile handset eco-rating schemes. Edited by International Telecommunication Union (ITU). Available online at https://www.itu.int/dms_pub/itu-t/oth/4B/01/T4B010000030001PDFE.pdf.
ITU-T L.1315 (2017): ITU-T Rec. L.1315 (05/2017) Standardization terms and trends in energy efficiency. Edited by International Telecommunication Union (ITU, checked on 1/13/2021.
ITU-T L.1410 (2014): ITU-T Rec. L.1410 (12/2014) Methodology for environmental life cycle assessments of information and communication technology goods, networks and services. Available online at https://www.itu.int/rec/T-REC-L.1410-201412-I, checked on 2/9/2021.
ITU-T L-1302 (2015): ITU-T Rec. L.1302 (11/2015) Assessment of energy efficiency on infrastructure in data centres and telecom centres. Edited by International Telecommunication Union (ITU, checked on 1/14/2021.
ITU-T L1310 (2020): ITU-T Rec. L.1310 (09/2020) Energy efficiency metrics and measurement methods for telecommunication equipment. Recommendation ITU-T L.1310. Edited by International Telecommunication Union (ITU. Available online at https://www.itu.int/rec/T-REC-L.1310-202009-I/en, checked on 1/23/2021.
ITU-T L-1320 (2014): ITU-T Rec. L.1320 (03/2014) Energy efficiency metrics and measurement for power and cooling equipment for telecommunications and data centres. Edited by International Telecommunication Union (ITU, checked on 1/13/2021.
ITU-T L-1470 (2020): ITU-T Rec. L.1470 (01/2020) Greenhouse gas emissions trajectories for the information and communication technology sector compatible with the UNFCCC Paris Agreement. Available online at https://www.itu.int/rec/T-REC-L.1470-202001-I/en, checked on 2/3/2021.
Köhler, Andreas R.; Gröger, Jens; Liu, Ran (2018): Energie- und Ressourcenverbräuche der Digitalisierung. Expertise für das WBGU-Hauptgutachten „Unsere gemeinsame digitale Zukunft“. Available online at https://www.researchgate.net/publication/335490910_Energie-_und_Ressourcenverbrauche_der_Digitalisierung_Expertise_fur_das_WBGU-Hauptgutachten_Unsere_gemeinsame_digitale_Zukunft.
Kollaras, Antonios; Tirabasso, Fabio (2014): Deliverable D2.1 Business scenarios and use case analysis. FP7-ICT-609140 – DOLFIN. Data Centres Optimization for Energy-Efficient and EnvironmentalLy Friendly INternet, checked on 1/17/2021.
LEED v4.1 (2020): LEED v4.1 Building Design and Construction. Edited by U.S. Green Building Council. Available online at https://www.usgbc.org/leed/v41, checked on 1/5/2021.
Levy, Moises; Raviv, Daniel (2017): A Novel Framework for Data Center Metrics using a Multidimensional Approach. 15th LACCEI International Multi-Conference for Engineering, Education, and Technology: “Global Partnerships for. Available online at http://www.laccei.org/LACCEI2017-BocaRaton/full_papers/FP387.pdf, checked on 12/28/2020.
Liberty Global (2019): Responsible Procurement and Supply Chain Principles. Available online at https://www.libertyglobal.com/wp-content/uploads/2019/06/Responsible-Procurement-and-Supply-Chain-Principles-2019.pdf, checked on 3/11/2021.
Liu, Ran; Gailhofer, Peter; Gensch, Carl-Otto; Köhler, Andreas; Wolff, Franziska (2019): Impacts of the digital transformation on the environment and sustainability. Issue

273
Paper under Task 3 from the “Service contract on future EU environment policy”. Available online at https://ec.europa.eu/environment/enveco/resource_efficiency/pdf/studies/issue_paper_digital_transformation_20191220_final.pdf.
London Economics (2014): Study on the impact of the energy label - and potential changes to it - on consumer understanding and on purchase decisions. ENER/C3/2013-428. Final Report. Ordered by the European Commission. Available online at https://ec.europa.eu/energy/sites/ener/files/documents/Impact%20of%20energy%20labels%20on%20consumer%20behaviour.pdf.
London Economics; IPSOS (2014): Study on the impact of the energy label – and potential changes to it – on consumer understanding and on purchase decisions ENER/C3/2013-428 Final Report, checked on 12/21/2015.
Lundberg, Sofia and Marklund, Per-Olov and Brännlund, Runar, Assessment of Green Public Procurement as a Policy Tool: Cost-Efficiency and Competition Considerations (May 8, 2009). Available at SSRN: https://ssrn.com/abstract=1831089 or http://dx.doi.org/10.2139/ssrn.1831089
Lykou, G.; Mentzelioti, D.; Gritzalis, D. (2017): A new methodology towards effectively assessing data center sustainability. DOI: 10.1016/j.cose.2017.12.008.
Molenbroek, Edith; Smith, Matthew; Groenenberg, Heleen; Waide, Paul; Attali, Sophie; Fischer, Corinna et al. (2013): Evaluation of the Energy Labelling Directive and specific aspects of the Ecodesign Directive. ENER/C3/2012-523. Background report I: Literature review.
Montevecchi, F., Stickler, T., Hintemann, R., Hinterholzer, S. (2020). Energy-efficient Cloud Computing Technologies and Policies for an Eco-friendly Cloud Market. Final Study Report on behalf of the European Commission, DG CONNECT . Vienna
Mudgal, Shailendra; Tinetti, Benoît; Faninger, Thibault; Proske, Marina; Schischke, Karsten; Prakash, Siddharth; Liu, Ran (2013): Toward an overall measurement methodology of the carbon and energy footprints of the ICT sector. FINAL REPORT (SMART 2011/0073). Available online at https://op.europa.eu/en/publication-detail/-/publication/9a79fd07-27af-4ad5-b39f-0fe11a49b9e5, checked on 2/9/2021.
Newcombe, Liam; Limbuwala, Zahl; Latham, Paul; Smith, Victor (2012): Data centre Fixed to Variable Energy Ratio metric DC-FVER. An alternative to useful work metrics which focuses operators on eliminating fixed energy consumption. Edited by BCS Data Centre Specialist Group. Available online at https://www.bcs.org/media/2917/dc_fver_metric_v10.pdf, checked on 1/12/2021.
Newmark, Rona; Isaak, Phil; Vincent, Jay (2017): Applying ICT Capacity and Utilization Metrics to Improve Data Center Efficiency. Available online at https://www.thegreengrid.org/en/resources/library-and-tools/443-Applying-ICT-Capacity-and-Utilization-Metrics-to-Improve-Data-Center-Efficiency, checked on 1/20/2021.
Omar, Emad (2019): Data Center Simulator for Sustainable Data Centers. Available online at https://elib.uni-stuttgart.de/bitstream/11682/10604/1/Masterarbeit%20-%20Data%20Center%20Simulator%20for%20Sustainable%20Data%20Centers.pdf, checked on 1/6/2021.
Pärssinen, Matti (2016): Analysis and Forming of Energy Efficiency and GreenIT Metrics Framework for Sonera Helsinki Data Center HDC. Available online at https://core.ac.uk/download/pdf/80719192.pdf, checked on 1/6/2021.
Patel, Chandrakant D.; Sharma, Ratnesh K.; Bash, Cullen E.; Beitelmal, Monem; (Keine Angabe) (2006): Energy Fow in the Information Technology Stack: Coefficient of

274
Performance of the Ensemble and its Impact on the Total Cost of Ownership. Edited by L. P. Hewlett-Packard Development Company, checked on 12/30/2020.
Patterson, Michael K; Poole, Stephen W; Hsu, Chung-Hsing; Maxwell, Don; Tschudi, William; Coles, Henry et al. (2013): TUE, a new energy-efficiency metric applied at ORNL's Jaguar. In International Supercomputing Conference ISC 2013, pp. 372–382. Available online at https://dcpro.lbl.gov/sites/all/files/isc13_tuepaper.pdf, checked on 12/30/2020.
PCFCR - UPS (2020): Product Environmental Footprint Category Rules – Uninterruptible Power Supply (UPS). Version: 5.3. Available online at https://ec.europa.eu/environment/eussd/smgp/pdf/PEFCR_UPS_Feb%202020_2.pdf, checked on 1/5/2021.
Pehlken, Alexandra; Hintemann, Ralph; Penaherrera, Fernando; Gizli, Volkan; Hurrelmann, Karsten; Hinterholzer, Simon et al. (2019): Abschlussbericht Verbundprojekt TEMPRO. Total Energy Management for Professional Data Center Ganzheitliches Energiemanagement in professionellen Rechenzentren. Edited by Bundesministerium für Wirtschaft und Technologie, 6. Energieforschungsprogramm. Available online at https://tempro-energy.de/images/pdfs/Tempro_Endbericht_final_2020_05_14.pdf, checked on 1/6/2021.
Peñaherrera, Fernando; Szczepaniak, Katharina (2018): Development and Application of Metrics for Evaluation of Cumulative Energy Efficiency for IT Devices in Data Centers. In Alexandra Pehlken, Matthias Kalverkamp, Rikka Wittstock (Eds.): Cascade Use in Technologies 2018. Berlin, Heidelberg: Springer Berlin Heidelberg, pp. 142–153.
Pino, Albena (2017): The Environmental Impacts of The Environmental Impacts of Core Networks for Mobile Telecommunications: A Study Based on the Life Cycle Assessment (LCA) of Core Network Equipment. Available online at https://pdfs.semanticscholar.org/5be6/bcba0a0b0d1d01f804bb44157b3377ff8a95.pdf.
Prakash, S.; Baron, Y.; Liu, R. (2014): Study on the practical application of the new framework methodology for measuring the environmental impact of ICT - cost/benefit analysis (SMART 2012/0064). With assistance of M. Proske, A. Schlösser. Available online at https://ec.europa.eu/newsroom/dae/document.cfm?doc_id=6917, checked on 3/10/2021.
Reddy, V. Dinesh; Setz, Brian; Rao, G.S. V.R.K.; Gangadharan, G.R.; Aiello, M. (2017): Metrics for Sustainable Data Centers (VOL. 2; NO. 3). Available online at https://ieeexplore.ieee.org/stamp/stamp.jsp?arnumber=7921551, checked on 12/21/2020.
Renda, A., Pelkmans, J., Egenhofer, C., Schrefler, L. Luchetta, G., Selçuki, C., Balesteros, J., Zirnhelt, A. (2012) The uptake of Green Public Procurement in the EU27, study on behalf of the European Commission, DG Environment, prepared by CEPS and College of Europe, Brussels, 29th of February 2012, accessible from CEPS-CoE-GPP MAIN
REPORT.pdf (europa.eu)
Rivas Calvete, Silvia; Cuniberti, Barbara; Bertoldi, Paolo (2016): Effective information measures to promote energy use reduction in EU Member States. Analysis of information, empowerment and training measures in Member States National Energy Efficiency Action Plans (EUR 27997 EN). Available online at https://publications.jrc.ec.europa.eu/repository/handle/JRC100661, checked on 7/30/2021.
Schödwell, Björn; Zarnekow, Rüdiger; Liu, Ran; Gröger, Jens; Wilkens, Marc (2018): Kennzahlen und Indikatoren für die Beurteilung der Ressourceneffizienz von Rechenzentren und Prüfung der praktischen Anwendbarkeit. Edited by Umweltbundesamt (Forschungskennzahl 3715 31 601 0). Available online at

275
https://www.umweltbundesamt.de/sites/default/files/medien/1410/publikationen/2018-02-23_texte_19-2018_ressourceneffizienz-rechenzentren.pdf, checked on 12/30/2020.
Shally; Sharma, Sanjay Kumar; Kumar, Sunil (2019): Measuring Energy Efficiency of Cloud Datacenters. In International Journal of Recent Technology and Engineering (IJRTE) (Volume-8 Issue-3). DOI: 10.35940/ijrte.B3548.098319.
Shehabi, A.; Smith, S.J.; Horner, N.; Azevedo, I.; Brown, R.; Koomey, J. et al. (2016): United States Data Center Energy Usage Report. Lawrence Berkeley National Laboratory, Berkeley, California, checked on 12/24/2020.
Smart city cluster collaboration, Task 1 (2014): Existing Data Centres energy metrics - Task 1. Edited by Seventh Framework Programme. Available online at http://www.dolfin-fp7.eu/wp-content/uploads/2014/01/Task-1-List-of-DC-Energy-Related-Metrics-Final.pdf, checked on 12/29/2020.
Smart City Cluster Collaboration, Task 4 (2015): Data Centre Integration. Energy, Environmental, and Economic Efficiency Metrics: Measurement and Verification Methodology. Edited by Seventh Framework Programme.
SNIA (2020): SNIA Emerald™ Power Efficiency Measurement Specification V4.0.0. SNIA Technical Position. Edited by SNIA Advancing storage & information technology. Available online at https://www.snia.org/tech_activities/standards/curr_standards/emerald, checked on 1/1/2021.
SPEC (2008): SPEC Power®. Edited by Standard Performance Evaluation Corporation. Available online at https://www.spec.org/power_ssj2008/, checked on 1/14/2021.
SPEC (2019): Server Efficiency Rating Tool (SERT) Design Document 2.0.3. Standard Performance Evaluation Corporation (SPEC®). Design Document, checked on 1/4/2021.
Steininger et al (2017): Evaluierung des Energieausweises. Eine empirische Studie zur Wahrnehmung der Energieeffizienz von Wohnimmobilien aus der Verbraucherperspektive. Working Papers des KVF NRW 7. With assistance of Claudia Nadler, Melanie Franke, Carolin Pommeranz. Edited by Verbraucherzentrale NRW/Kompetenzzentrum Verbraucherforschung NRW. Düsseldorf.
Stobbe, Lutz; Berwald, Anton (2019): State of sustainability research for network equipment. Large Network Equipment - Enterprise Switches and Routers - Final Report. Prepared for the Green Electronics Council and TÜV Rheinland in support of criteria development for the EPEAT and Green Product Mark ecolabels. Fraunhofer IZM. Berlin.
Talens Pieró, L., Polverini, D., Ardente, F., Mathieux, F., (2020) Advances towards circular economy policies in the EU: The new Ecodesign regulation of enterprise servers, in: Resources, Conservation & Recycling, vol. 154, available at: Advances towards
circular economy policies in the EU: The new Ecodesign regulation of enterprise servers
- ScienceDirect
The Green Grid (2007): Green Grid Metrics: Describing Datacenter Power Efficiency. Technical Committee White Paper, checked on 1/1/2021.
The Green Grid (2008): A Framework for data center energy productivity. White Paper #13, checked on 1/1/2021.
The Green Grid (2010a): ERE: A metric for measuring the benefit of reuse energy from a data center. WHITE PAPER #29. Available online at https://eehpcwg.llnl.gov/documents/infra/06_energyreuseefficiencymetric.pdf, checked on 12/29/2020.

276
The Green Grid (2010b): The Green Grid Data Center Compute Efficiency Metric: DCcE. WHITE PAPER #34, checked on 1/7/2021.
The Green Grid (2011): Water Usage Effectiveness (WUE™): A green Grid Data Center Sustainability Metric. WHITE PAPER #35, checked on 12/29/2020.
The Green Grid (2012): Electronics Disposal Efficiency (EDE): An IT recycling metric for enterprises and data centers. WHITE PAPER #53.
The Green Grid (2014a): Harmonizing Global Metrics for Data Center Energy Efficiency. Global Taskforce Reaches Agreement Regarding Data Center Productivity. Available online at https://www.thegreengrid.org/en/resources/library-and-tools/215-Harmonizing-Global-Metrics-for-Data-Center-Energy-Efficiency-%E2%80%93-March-2014, checked on 12/30/2020.
The Green Grid (2014b): The Green Grid Data Center Storage Productivity Metrics (DCsP): Application of Storage System Productivity Operational Metrics. WHITE PAPER #58, checked on 1/1/2021.
The Green Grid: Carbon Usage Effectiveness (CUE): A Green Grid Data Center Sustainability Metric. WHITE PAPER #32. Available online at https://www.netalis.fr/wp-content/uploads/2016/04/Carbon-Usage-Effectiveness-White-Paper_v3.pdf, checked on 12/29/2020.
Topten Act (2018): Click your way to energy savings. TOPTEN ACT 2015-2018. Find out the most efficient products in Europe with a simple click on the Topten websites. Available online at https://storage.topten.eu/source/files/TOPTEN-ACT-Results-Summary.pdf.
TÜV Rheinland and Global Electronics Council (Ed.) (2021): Criteria for the Sustainability Assessment of Network Equipment for the Global Electronics Council EPEAT® Ecolabel and the TÜV Rheinland Green Product Mark. Available online at https://globalelectronicscouncil.org/wp-content/uploads/EPEAT-Network-Equipment-Criteria_FINAL-April-2021.pdf, checked on 5/31/2021.
UBA (2019): Marktanalyse Ökostrom II. Available online at https://www.umweltbundesamt.de/sites/default/files/medien/1410/publikationen/2019-08-15_cc_30-2019_marktanalyse_oekostrom_ii.pdf, checked on 8/6/2021.
Vodafone (2020): Digitising Europe Pulse. Tackling Climate Change. A Survey of 13 EU Countries. Vodafone Institute for Society and Communications. Available online at https://www.vodafone-institut.de/wp-content/uploads/2020/10/VFI-DE-Pulse_Climate.pdf, checked on 3/11/2021.
Waide, Paul; Watson, Rowan (2013): The New European Energy Label: Assessing Consumer Comprehension and Effectiveness as a Market Transformation Tool. Edited by Navigant, in collaboration with The Collaborative Labeling and Appliance Standard Program (CLASP).
Wilde, Torsten (2018): Assessing the Energy Efficiency of High Performance Computing (HPC) Data Centers. Available online at https://mediatum.ub.tum.de/doc/1399734/file.pdf, checked on 1/5/2021.

277
Annex 1: Overview interviewed associations and
companies
Name of organization Type Country
Data Centres
German Data Centre
Association
National Data Centre
Association
Germany
European Data Centre
Association
EU Trade association EU
European Data Centre
Association
EU Trade association EU
Dutch Data Centre Assoication National Trade association The
Netherlands
Dutch Data Centre Assoication National Trade association The
Netherlands
Datacenter Industrien National Trade Association Denmark
Gimelec National Trade Association
filière électronumérique
France
France
EATON Company France
France Datacenter National Trade Association France
France Datacenter National Trade Association France
BITKOM National Trade Association Germany
Uptime Institute Data Center Authority Worldwide
Electronic Communications Services and Networks
Deutsche Telekom Company Germany
European Telecommunications
Network Operators’
Association (ETNO)
EU Trade association EU
FTTH Council EU Trade association EU
GigaEurope EU Trade association EU
Huawei Company Worldwide
Liberty Global Company Belgium
Telefonica Company Spain
Telia Company Company Sweden
Vodafone Company Worldwide

278
Annex 2: Distribution reports of the surveys
Survey for data centre owners and operators
Start
date
End
date
Start
page
views
Respondents Screened
out
Partial
completes
Reached
end
09-02-
2021
01-04-
2021
473 87 (18% of
start page
views)
28 49 10
Survey for communications network operators, service providers and network
equipment suppliers
Start
date
End
date
Start
page
views
Respondents Screened
out
Partial
completes
Reached
end
24-02-
2021
31-03-
2021
129 25 (19% of
start page
views)
0 9 16
Survey about consumer perspectives on potential indicators for ECNs
Start
date
End
date
Start
page
views
Respondents Screened
out
Partial
completes
Reached
end
24-05-
2021
26-06-
2021
46 12 (26% of
start page
views)
0 2 10
The following consumer organisations completed the questionnaire for the survey about
consumer perspectives on potential indicators for ECNs:
• ASUFIN
• Austrian Chamber of Labour
• Consumentenbond
• Consumers Organisation of Macedonia
• Danish Consumer Council
• DECO – Assoçião Portuguesa para a Defensa do Consomidor
• ECOS

279
• KEPKA - Consumers' Protection Center
• Stiftung Warentest
• ZPS - Zveza potrošnikov Slovenije (Slovene Consumers' Association)
The following countries are covered by these organisations:
• Austria
• Belgium
• Denmark
• Germany
• Greece
• Lithuania
• Netherlands
• North Macedonia
• Portugal
• Slovenia
• Spain

280
Annex 3: Interview questions for Data Centre
Associations related to Tasks 1.1.1., 1.1.2. and 1.1.3.
(version 19-01-2021)
Questions were prioritised to maximise response and input in case of time limitations from the
respondents: (!!) question with very high priority, (!) question with high priority.
Definition of data centres (T1.1.1.)
• (!!) There is a well-known broad definition of data centres (Structure, or group of
structures, dedicated to the centralized accommodation, interconnection and operation
of information technology and network telecommunications equipment providing data
storage, processing and transport services together with all the facilities
and infrastructures for power distribution and environmental control together with
the necessary levels of resilience and security required to provide the desired service
availability.) But during our desk research we observed that various criteria are used
to further refine this definition allowing for a categorisation of data centres. Criteria are
often based on: size (physical area, number of servers/workload capacity), physical
location, security level (cf. Uptime), business model, etc.
o How would you define a small, large or hyperscale data centre?
o What criteria do you use in your organisation to distinguish data centres and
why?
▪ What specific thresholds do you use?
o Which additional criteria are relevant (or do you know) to distinguish data
centres?
The data centre / data centre service provider market (T.1.1.1.)
• (!!) What are, according to you, the three most important trends that you observe in
the data centre sector?
o Do these trends apply to all types? (Could you indicate whether certain trends
only apply in some types of data centres)?
• (!) Who are the most important end-users of data centres (private companies, public
organisations, knowledge institutions)?
• (!) We want to estimate the market size of data centres (number of data centres, data
centre providers, operators) depending on different definitions. Are you aware of any
extensive datasets on data centres / data centre service providers (containing
number of data centres, size indicators such as floor size/number of servers,
business model, etc., contact details)? For <region> or the EU market as a whole?
Are these publicly available?
o Did you already perform such an exercise yourselves? Are the results publicly
available?
o What are your future expectations on economic indicators such as
employment, turnover, investments and number of users related to data
centres? (higher, stable, low)?
281
Methodologies and costs related to energy and environmental management
• (!!) Which indicators are used to measure energy efficiency and environmental
impacts? (e.g. PUE, Carbon Footprint, SERT2, SNIA Emerald, certain standards)
• (!!) Which performance indicators are used to measure the useful work of data centres
(e.g. server operations, server utilization, storage space, storage utilization, bandwidth,
network utilization)
• (!) What environmental information and standards (e.g. eco-labels) are requested by
data centre clients?
• What efforts are being made in data centres to enable energy monitoring and
sustainability reporting?
o Can you give an estimate of how much investment (e.g. for special
measurement technology) and personnel costs are used for this (preferably as
a percentage of total turnover)?
• What is the proportion of the investment costs of the energy measurement devices in
comparison to the total investment costs of the hardware (approximately)?
o Which energy and temperature measuring devices are used for the energy
management of data centres?
• What is the share of personnel costs for energy and environmental management in the
total personnel costs (approximately)?
• (!) Are there among your members organisations that are frontrunners in the field of
energy management and pursuing low environmental impact?
Circularity practices: (T1.1.2)
• (!!) To which degree is circularity of data centre equipment a concern for data centres?
o If so, what actions do data centres undertake in order to increase circular
practices?
▪ (Actions related to maintenance, reuse, refurbishment, remanufacturing
as well as secondary markets for data centre components and
materials)
▪ What kind of data centre equipment? (data cabinets, servers, e-waste)
• (!) Do you have an indication of the percentage of data centre hardware that is being
recycled and/or reused?
• (!) Do you have an indication of the percentage of recycled e-waste material that is
used for the manufacturing of new data centre hardware?
• What are the the most important secondary markets for data centre components and
materials?
• What metrics are currently used to measure circularity?
o Are these metrics being reported? If so, is this information publicly available?
• To what extent do you refer to the Environmental Footprint method for assessing Data
Centres’ footprint in your network?183
• (!!) What would need to happen in order for data centres to extend their hardware’s
useful life? E.g. related to policy, competition, technology.
183 https://eplca.jrc.ec.europa.eu/EnvironmentalFootprint.html
282
o Policy;
o Competition;
o Technology.
• (!!) Is the treatment/disposal of data centre hardware after decommissioning currently
of great concern ? If so, in which way ?
• (!) Are there among your members organisations that are frontrunners in the field
circular economy practices and if so, who are they?
General questions
• (!) Which information sources and literature do you find helpful to get an insight in the
outlook for the data centres for the coming years?
• (!!) Would you be willing to promote our survey, which we plan to launch early
February 2021, among your members?
• Could we contact you again during the course of our study to be involved in an
impact analysis of various policy instruments related to making data centres greener?

283
Annex 4: Questions for survey to electronic
communications network operators, service providers
and network equipment suppliers related to Task 1.2.1
and Task 1.2.2 (version 23-02-2021)
Company information
1. What is the name of your organisation?
2. What are the business areas of your company? (Multiple selections possible)
a) Operator of electronic communication networks
b) Network equipment supplier
c) Electronic communications service provider (telephone, internet, television)
d) Organisation representing operators of electronic communications networks
e) Other, please specify
3. Please name the countries in which your company operates
Environmental reporting
4. How does your company report on its environmental policies and impacts? (Multiple
selections possible)
a) With an annual report (e.g. Corporate Social Responsibility report)
b) As a sub-section of an annual corporate report
c) Publication of key figures on the company website
d) Direct customer information within invoices or customer accounts
e) Other, please specify
f) Not at all
5. Please briefly explain what objective your company is pursuing through this reporting
and why the reporting formats mentioned above have been chosen.
6. Which areas of the company's activities are included in this reporting? (Multiple
selections possible)
a) Direct environmental impacts
b) Environmental impacts from upstream value chains (e.g. energy, equipment,
etc.)

284
c) Environmental impacts from downstream value chains (e.g. energy consumption
or electronic waste at customers)
d) Other, please specify
e) None
7. Please briefly describe why these areas were chosen for reporting.
Environmental indicators and standards
8. Which indicators do you use for environmental reporting? If possible, please state the
exact name of the metrics/standards used. (Multiple selections possible)
a) Energy consumption
b) CO2 equivalent
c) Material consumption
d) Water consumption
e) E-Waste Management
f) Use of renewable energies (e.g. electr., fuel)
g) Use of renewable raw materials
h) Energy intensity of communication networks
i) Other
j) None
9. What standards do you use for company-wide reporting? (Multiple selections
possible)
a) Greenhouse Gas (GHG) Protocol
b) Global Reporting Initiative (GRI) Standards
c) Energy management system based on ISO 50 001
d) Reporting of greenhouse gas emissions based on ISO 14064
e) OEF (Organisation Environmental Footprint)
(https://ec.europa.eu/environment/eussd/smgp/dev_methods.htm)
f) International Telecommunication Union (ITU) (e.g. ITU-T L.1332)
g) European Telecommunications Standards Institute (ETSI) (e.g. ETSI ES 203
475)
h) Environmental management according to ISO 14001
i) Eco-Management and Audit Scheme (EMAS)
j) Life Cycle Assessment (LCA) based on ISO 14040/44
k) Other, please name the standard used
l) None
10. Please describe why you have chosen these standards.

285
11. Is there a further need for environmental reporting standards for electronic
communication networks that still need to be developed? What should these
standards cover?
The following questions are addressed to the providers of electronic communications services
(irrespective of whether they also operate a network)
12. Which electronic communications services do you mainly offer? (Multiple selections
possible)
a) Mobile services (voice, internet, messaging)
b) Fixed voice communications (telephony)
c) Fixed broadband internet access
d) Fixed TV
e) Other, please specify
f) None
13. What key-figures does your company communicate to consumers (e.g. advertising,
product data sheets) when reporting the environmental performance of
communications services? (Multiple selections possible)
a) Product Environmental Footprint (PEF)
(https://eplca.jrc.ec.europa.eu//EnvironmentalFootprint.html)
b) Energy intensity of the communication network (e.g. [kWh/Gbyte])
c) Energy consumption or greenhouse gas emissions per customer (e.g. CO2-
eq/subscriber)
d) Energy consumption or greenhouse gas emissions per service unit (e.g. CO2-
eq/hour video streaming)
e) Energy consumption of the router or other network equipment in the customer's
property
f) Other, please specify
g) None
14. Do you know of any methodologies beyond those mentioned above that could be
suitable for capturing the specific environmental impacts of electronic
communications services?
Procurement of network equipment / Offering network equipment
The following questions are addressed to the operators of electronic communications
networks and the suppliers of network equipment
15. Network operators: What requirements do you expect suppliers to meet when you
procure new network equipment? Network equipment suppliers: What are your
requirements when you offer network components? (Multiple selections possible)

286
a) Requirements according to EU Code of Conduct on Energy Consumption of
Broadband Equipment
b) Other energy consumption requirements (e.g. W/port in different operation
states)
c) Contractual guarantees for the minimum energy efficiency
d) Requirements for the environmental and sustainable production
e) Guarantees to provide spare parts and software updates over the expected
useful life
f) Taking back old or defective components for refurbishment
g) None of the above
16. Please list the most important environmental requirements in purchasing/sales of
network equipment that go beyond the above:
General assessment of appropriate approaches
17. How could end-users be encouraged to choose and use climate-friendly and
resource-saving electronic communications services?
18. How could electronic communications providers contribute to the European Green
Deal to achieve climate neutrality in 2050?

287
Annex 5: Questions for survey about consumer
perspectives on potential indicators for environmental
footprint of electronic communications services related
to Task 1.2.4 (version 17-05-2021)
Overall objective: Reduction of the environmental footprint of electronic communications
networks and services.
Sub-goal: Motivate consumers to choose an energy-efficient electronic communications
provider and reduce the environmental footprint of service use.
1. What is the name of your organisation?
2. Please name the country in which your organisation operates
o Austria, Belgium, Bulgaria, Croatia, Cyprus, Czech Republic, Denmark, Estonia,
Finland, France, Germany, Greece, Hungary, Iceland, Ireland, Italy, Latvia,
Lithuania, Luxembourg, Malta, Netherlands, North Macedonia, Norway,
Poland, Portugal, Romania, Slovakia, Slovenia, Spain, Sweden, Switzerland,
United Kingdom.
3. Has your organisation been involved in consumer information / tests on electronic
communications services in the past?
o yes
o no
o don’t know
4. Do you consider information to consumers on the environmental footprint of electronic
communications services to be an effective way for achieving a reduction in the
energy consumption of the electronic communications services?
o Very well suited (++), well suited (+), less well suited (-), not suited at all (--)
o Please specify why:
5. In your opinion, what is the role of the following aspects in consumers' decision to
choose a particular electronic communications service (e.g. mobile operator or
internet service provider (ISP)?
o Reliability (no service disruptions) (++ | + | - | --)
o Speed (data transfer rates) (++ | + | - | --)
o Energy efficiency (++ | + | - | --)
o Price (and other commercial aspects) (++ | + | - | --)
o Others, please specify:
288
6. To which level should the information on environmental impacts refer?
o To the provider/company level (e.g. average values across all customers)
o To the level of the specific service (e.g. internet access via fibre, mobile access
via 4G)
o Others, please specify:
7. How understandable do you think the following environmental indicators on electronic
communication services are for consumers?
o Annual energy consumption of the provider per subscriber [kWh/(a*subscriber)]
(++ | + | - | --)
o Energy intensity of data transmission [Wh/GByte] (++ | + | - | --)
o Power consumption of the network per subscriber [W/subscriber] (++ | + | - | -
-)
o Annual carbon footprint per subscriber [kg CO2-eq/(a*subscriber)] (++ | + | - |
--)
o Specific carbon footprint of data transmission [g CO2-eq/GByte] (++ | + | - | -
-)
o Share of renewable energies of the network operator in total energy
consumption [%]
(++ | + | - | --)
o Others, please specify:
8. Where should such information on the environmental indicators of communications
services be provided?
o Website of the service provider (++ | + | - | --)
o Advertising of the respective service (++ | + | - | --)
o Product data bases (++ | + | - | --)
o Invoice (e.g. monthly telephone bill) (++ | + | - | --)
o Others, please specify:
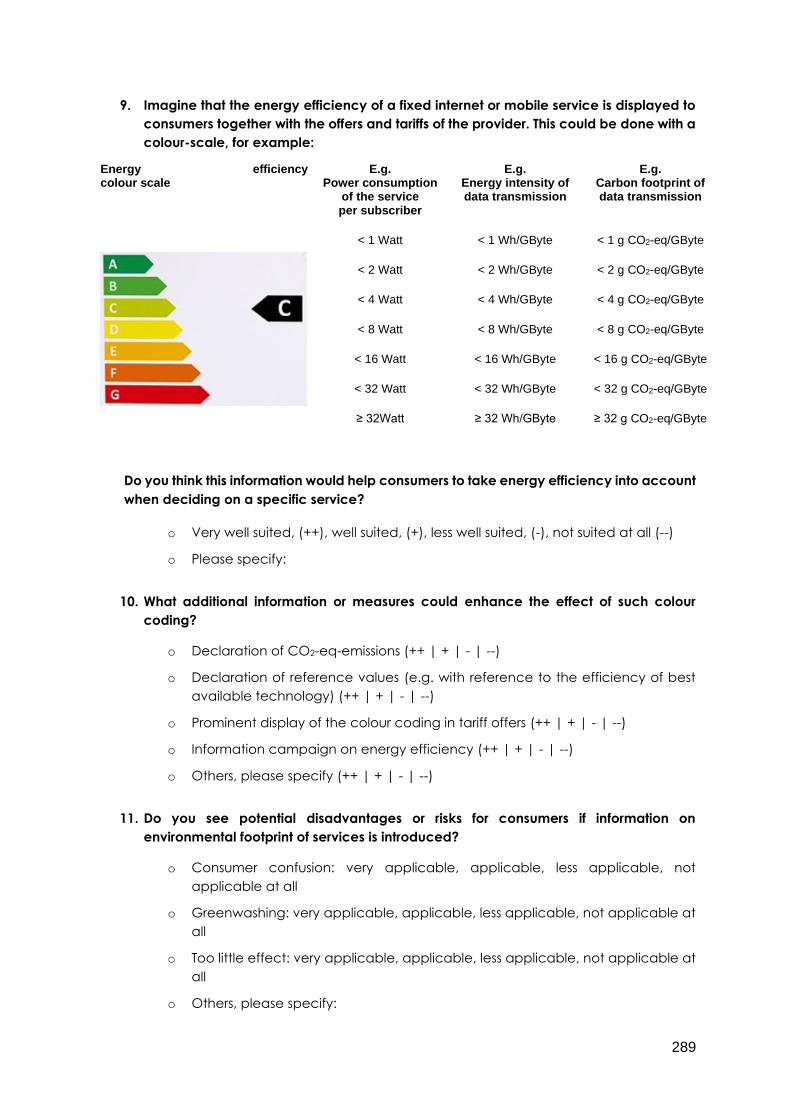
289
9. Imagine that the energy efficiency of a fixed internet or mobile service is displayed to
consumers together with the offers and tariffs of the provider. This could be done with a
colour-scale, for example:
Energy efficiency colour scale
E.g. Power consumption
of the service per subscriber
E.g. Energy intensity of data transmission
E.g. Carbon footprint of data transmission
< 1 Watt < 1 Wh/GByte < 1 g CO2-eq/GByte
< 2 Watt < 2 Wh/GByte < 2 g CO2-eq/GByte
< 4 Watt < 4 Wh/GByte < 4 g CO2-eq/GByte
< 8 Watt < 8 Wh/GByte < 8 g CO2-eq/GByte
< 16 Watt < 16 Wh/GByte < 16 g CO2-eq/GByte
< 32 Watt < 32 Wh/GByte < 32 g CO2-eq/GByte
≥ 32Watt ≥ 32 Wh/GByte ≥ 32 g CO2-eq/GByte
Do you think this information would help consumers to take energy efficiency into account
when deciding on a specific service?
o Very well suited, (++), well suited, (+), less well suited, (-), not suited at all (--)
o Please specify:
10. What additional information or measures could enhance the effect of such colour
coding?
o Declaration of CO2-eq-emissions (++ | + | - | --)
o Declaration of reference values (e.g. with reference to the efficiency of best
available technology) (++ | + | - | --)
o Prominent display of the colour coding in tariff offers (++ | + | - | --)
o Information campaign on energy efficiency (++ | + | - | --)
o Others, please specify (++ | + | - | --)
11. Do you see potential disadvantages or risks for consumers if information on
environmental footprint of services is introduced?
o Consumer confusion: very applicable, applicable, less applicable, not
applicable at all
o Greenwashing: very applicable, applicable, less applicable, not applicable at
all
o Too little effect: very applicable, applicable, less applicable, not applicable at
all
o Others, please specify:
290
12. Which instruments do you think could be most suitable to improve the environmental
footprint of communication services?
o Ecodesign type of requirements (efficiency requirements) (++ | + | - | --)
o Energy label type of requirement (information requirements) (++ | + | - | --)
o Ecolabel type of requirement (front-runner communication) (++ | + | - | --)
o Electronic product passport (EPREL database) (++ | + | - | --)
o Voluntary agreement of providers on information requirements (++ | + | - | --)
o Voluntary agreement of providers on efficiency requirements (++ | + | - | --)
o Others, please specify: (++ | + | - | --)
13. What would be your suggestion to move forward to more sustainable communication
services?
o please specify:
14. Do you have any other comments you would like to share for this study?
o please specify:
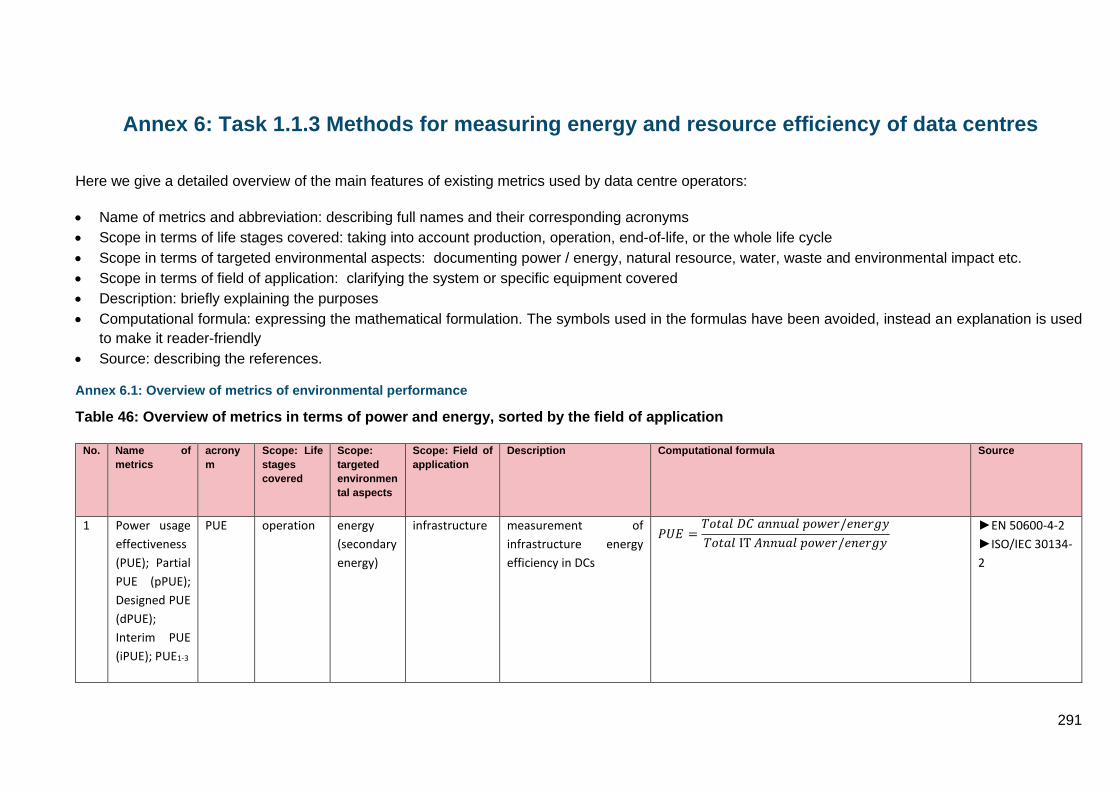
291
Annex 6: Task 1.1.3 Methods for measuring energy and resource efficiency of data centres
Here we give a detailed overview of the main features of existing metrics used by data centre operators:
• Name of metrics and abbreviation: describing full names and their corresponding acronyms
• Scope in terms of life stages covered: taking into account production, operation, end-of-life, or the whole life cycle
• Scope in terms of targeted environmental aspects: documenting power / energy, natural resource, water, waste and environmental impact etc.
• Scope in terms of field of application: clarifying the system or specific equipment covered
• Description: briefly explaining the purposes
• Computational formula: expressing the mathematical formulation. The symbols used in the formulas have been avoided, instead an explanation is used
to make it reader-friendly
• Source: describing the references.
Annex 6.1: Overview of metrics of environmental performance
Table 46: Overview of metrics in terms of power and energy, sorted by the field of application
No. Name of
metrics
acrony
m
Scope: Life
stages
covered
Scope:
targeted
environmen
tal aspects
Scope: Field of
application
Description Computational formula Source
1 Power usage
effectiveness
(PUE); Partial
PUE (pPUE);
Designed PUE
(dPUE);
Interim PUE
(iPUE); PUE1-3
PUE operation energy
(secondary
energy)
infrastructure measurement of
infrastructure energy
efficiency in DCs
𝑃𝑈𝐸 =𝑇𝑜𝑡𝑎𝑙 𝐷𝐶 𝑎𝑛𝑛𝑢𝑎𝑙 𝑝𝑜𝑤𝑒𝑟/𝑒𝑛𝑒𝑟𝑔𝑦
𝑇𝑜𝑡𝑎𝑙 IT 𝐴𝑛𝑛𝑢𝑎𝑙 𝑝𝑜𝑤𝑒𝑟/𝑒𝑛𝑒𝑟𝑔𝑦
►EN 50600-4-2
►ISO/IEC 30134-
2

292
No. Name of
metrics
acrony
m
Scope: Life
stages
covered
Scope:
targeted
environmen
tal aspects
Scope: Field of
application
Description Computational formula Source
2 Data centre
infrastructure
efficiency DCiE operation
energy
(secondary
energy) infrastructure
𝐷𝐶𝑖𝐸 =
1
𝑃𝑈𝐸
(Alger 2010;
Schödwell et al.
2018)
3
Facility
Energy
Efficiency FEE operation
energy
(secondary
energy) infrastructure
the ratio of IT load
to total power
𝐹𝐸𝐸 = 𝐷𝐶𝑖𝐸 (Alger 2010)
(Schödwell et al.
2018)
4 Site
Infrastructure
Energy
Efficiency
ratio (SI-EER) SI-EER operation
energy
(secondary
energy) infrastructure
Efficiency of DC’s
infrastructure systems
𝑆𝐼 − 𝐸𝐸𝑅 = 𝑃𝑈𝐸 Uptime institute
(Brill 2007)
5 Global Key
Performance
Indicator of
Task
Efficiency KPITE operation
energy
(secondary
energy) infrastructure
Efficiency of DC’s
infrastructure systems
𝐾𝑃𝐼𝑇𝐸
=𝑇𝑜𝑡𝑎𝑙 𝐸𝑛𝑒𝑟𝑔𝑦 𝑐𝑜𝑛𝑠𝑢𝑚𝑝𝑡𝑖𝑜𝑛 𝑏𝑦 𝑎 𝐷𝐶 𝑜𝑣𝑒𝑟 𝑎 𝑦𝑒𝑎𝑟
𝑡𝑜𝑡𝑎𝑙 𝑒𝑛𝑒𝑟𝑔𝑦 𝑐𝑜𝑛𝑠𝑢𝑚𝑝𝑡𝑖𝑛 𝑏𝑦 𝑒𝑞𝑢𝑖𝑝𝑚𝑒𝑛𝑡 𝑝𝑟𝑜𝑐𝑒𝑠𝑠𝑖𝑛𝑔 𝑑𝑎𝑡𝑎=PUE
(Kollaras and
Tirabasso 2014;
ETSI ES 205 200-
2-1 2014)
6 IT-Power
Usage
Effectiveness
(ITUE)
ITUE operation
energy
(secondary
energy) IT equipment
defined as total IT
energy divided by
computational energy
(e.g. CPU, memory, and
storage)
𝐼𝑇𝑈𝐸
=𝑇𝑜𝑡𝑎𝑙 𝐸𝑛𝑒𝑟𝑔𝑦 𝑖𝑛𝑡𝑜 𝑡ℎ𝑒 𝐼𝑇 𝐸𝑞𝑢𝑖𝑝𝑚𝑒𝑛𝑡
𝑇𝑜𝑡𝑎𝑙 e𝑛𝑒𝑟𝑔𝑦 𝑖𝑛𝑡𝑜 𝑡ℎ𝑒 𝑐𝑜𝑚𝑝𝑢𝑡𝑒 𝑐𝑜𝑚𝑝𝑜𝑛𝑒𝑛𝑡𝑠
(Patterson et al.
2013)
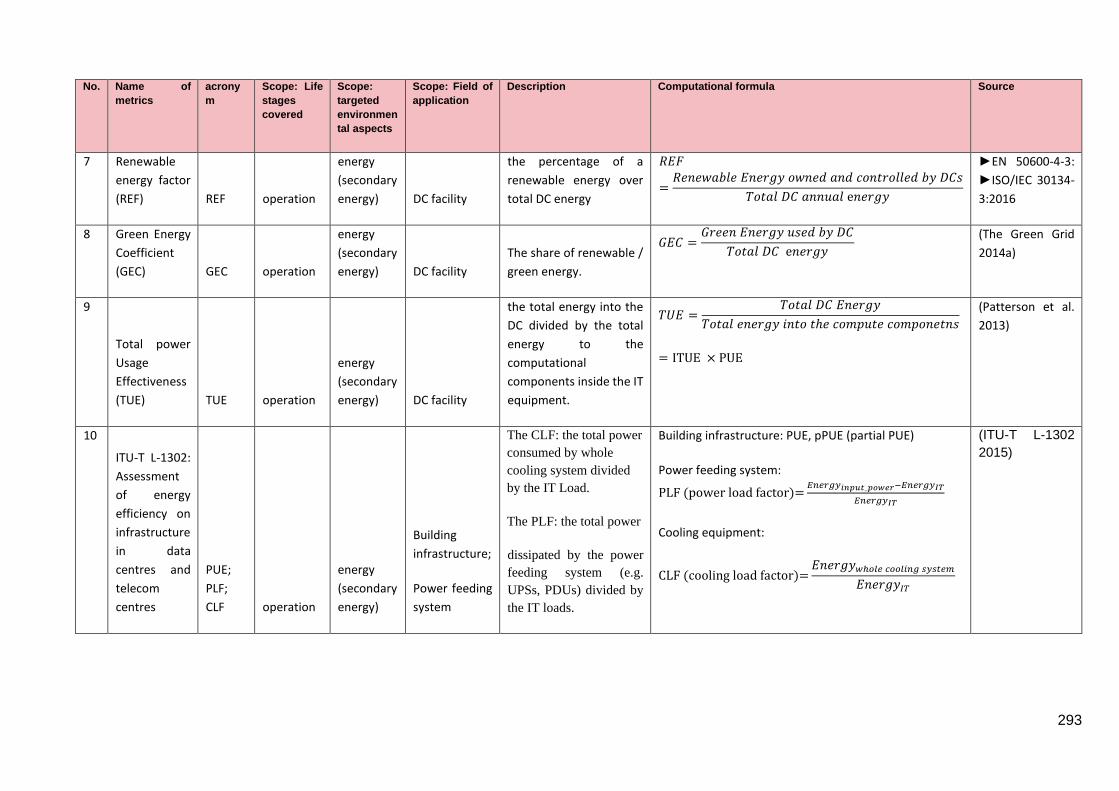
293
No. Name of
metrics
acrony
m
Scope: Life
stages
covered
Scope:
targeted
environmen
tal aspects
Scope: Field of
application
Description Computational formula Source
7 Renewable
energy factor
(REF) REF operation
energy
(secondary
energy) DC facility
the percentage of a
renewable energy over
total DC energy
𝑅𝐸𝐹
=𝑅𝑒𝑛𝑒𝑤𝑎𝑏𝑙𝑒 𝐸𝑛𝑒𝑟𝑔𝑦 𝑜𝑤𝑛𝑒𝑑 𝑎𝑛𝑑 𝑐𝑜𝑛𝑡𝑟𝑜𝑙𝑙𝑒𝑑 𝑏𝑦 𝐷𝐶𝑠
𝑇𝑜𝑡𝑎𝑙 𝐷𝐶 𝑎𝑛𝑛𝑢𝑎𝑙 e𝑛𝑒𝑟𝑔𝑦
►EN 50600-4-3:
►ISO/IEC 30134-
3:2016
8 Green Energy
Coefficient
(GEC) GEC operation
energy
(secondary
energy) DC facility
The share of renewable /
green energy.
𝐺𝐸𝐶 =𝐺𝑟𝑒𝑒𝑛 𝐸𝑛𝑒𝑟𝑔𝑦 𝑢𝑠𝑒𝑑 𝑏𝑦 𝐷𝐶
𝑇𝑜𝑡𝑎𝑙 𝐷𝐶 e𝑛𝑒𝑟𝑔𝑦
(The Green Grid
2014a)
9
Total power
Usage
Effectiveness
(TUE) TUE operation
energy
(secondary
energy) DC facility
the total energy into the
DC divided by the total
energy to the
computational
components inside the IT
equipment.
𝑇𝑈𝐸 =𝑇𝑜𝑡𝑎𝑙 𝐷𝐶 𝐸𝑛𝑒𝑟𝑔𝑦
𝑇𝑜𝑡𝑎𝑙 𝑒𝑛𝑒𝑟𝑔𝑦 𝑖𝑛𝑡𝑜 𝑡ℎ𝑒 𝑐𝑜𝑚𝑝𝑢𝑡𝑒 𝑐𝑜𝑚𝑝𝑜𝑛𝑒𝑡𝑛𝑠
= ITUE × PUE
(Patterson et al.
2013)
10
ITU-T L-1302:
Assessment
of energy
efficiency on
infrastructure
in data
centres and
telecom
centres
PUE;
PLF;
CLF operation
energy
(secondary
energy)
Building
infrastructure;
Power feeding
system
The CLF: the total power
consumed by whole
cooling system divided
by the IT Load.
The PLF: the total power
dissipated by the power
feeding system (e.g.
UPSs, PDUs) divided by
the IT loads.
Building infrastructure: PUE, pPUE (partial PUE)
Power feeding system:
PLF (power load factor)=𝐸𝑛𝑒𝑟𝑔𝑦𝑖𝑛𝑝𝑢𝑡_𝑝𝑜𝑤𝑒𝑟−𝐸𝑛𝑒𝑟𝑔𝑦𝐼𝑇
𝐸𝑛𝑒𝑟𝑔𝑦𝐼𝑇
Cooling equipment:
CLF (cooling load factor)=𝐸𝑛𝑒𝑟𝑔𝑦𝑤ℎ𝑜𝑙𝑒 𝑐𝑜𝑜𝑙𝑖𝑛𝑔 𝑠𝑦𝑠𝑡𝑒𝑚
𝐸𝑛𝑒𝑟𝑔𝑦𝐼𝑇
(ITU-T L-1302
2015)

294
No. Name of
metrics
acrony
m
Scope: Life
stages
covered
Scope:
targeted
environmen
tal aspects
Scope: Field of
application
Description Computational formula Source
11 ITU-T L-1320:
Energy
efficiency
metrics and
measurement
for power and
cooling
equipment EE ratio operation
energy
(secondary
energy)
Power feeding
equipment
and cooling
equipment
Energy efficiency metrics
and measurement
ŋ=𝑂𝑢𝑡𝑝𝑢𝑡 𝑝𝑜𝑤𝑒𝑟 (𝑤)
𝑖𝑛𝑝𝑢𝑡 𝑝𝑜𝑤𝑒𝑟 (𝑤)
(ITU-T L-1320
2014)
12 Cooling
Efficiency
Ratio (CER) CER operation
energy
(secondary
energy)
Cooling
system cooling energy
Under development ►EN 50600-4-7;
►ISO/IEC 30134-
7
13
coefficient of
performance
(COP) COP operation
energy
(secondary
energy)
Cooling
system
The ratio of total heat
load (e.g. power
delivered to IT
equipment) to the power
consumed by the cooling
infrastructure
𝐶𝑂𝑃 =𝑇𝑜𝑡𝑎𝑙 𝐻𝑒𝑎𝑡 𝐷𝑖𝑠𝑠𝑖𝑝𝑎𝑡𝑖𝑜𝑛
(𝐹𝑙𝑜𝑤 𝑊𝑜𝑟𝑘+𝑇ℎ𝑒𝑟𝑚𝑜𝑑𝑦𝑛𝑎𝑚𝑖𝑐 𝑊𝑜𝑟𝑘) 𝑜𝑓 𝑐𝑜𝑜𝑙𝑖𝑛𝑔 𝑠𝑦𝑠𝑡𝑒𝑚=
𝐻𝑒𝑎𝑡 𝑒𝑥𝑡𝑟𝑎𝑐𝑡𝑒𝑑 𝑏𝑦 𝑎𝑖𝑟 𝑐𝑜𝑛𝑑𝑖𝑡𝑖𝑜𝑛𝑒𝑟𝑠
𝑁𝑒𝑡 𝑊𝑜𝑟𝑘 𝐼𝑛𝑝𝑢𝑡
(Patel et al. 2006)
14
Energy
Efficiency /
Efficient Ratio
(EER);
Seasonal EER
(SEER) EER operation
energy
(secondary
energy)
Cooling
system
the total heat removed
from the conditioned
space (during the annual
cooling season), divided
by the total electrical
energy consumed by the
air conditioner or heat
𝐸𝐸𝑅
=𝐻𝑒𝑎𝑡 𝑟𝑒𝑚𝑜𝑣𝑒𝑑 𝑏𝑦 𝑡ℎ𝑒 𝑐𝑜𝑜𝑙𝑖𝑛𝑔 𝑠𝑦𝑠𝑡𝑒𝑚
𝐸𝑙𝑒𝑐𝑡𝑟𝑖𝑐𝑎𝑙 𝑝𝑜𝑤𝑒𝑟 𝑢𝑠𝑒𝑑 𝑏𝑦 𝑡ℎ𝑒 𝑐𝑜𝑜𝑙𝑖𝑛𝑔 𝑠𝑦𝑠𝑡𝑒𝑚
(Smart city
cluster
collaboration,
Task 1 2014)

295
No. Name of
metrics
acrony
m
Scope: Life
stages
covered
Scope:
targeted
environmen
tal aspects
Scope: Field of
application
Description Computational formula Source
pump (during the same
season)
15
ENERGY
STAR® for
UPSs version
2.0 (adopted
by PCFCR184
UPS v5.3) - operation
energy
(secondary
energy) UPS185
metrics for energy
efficiency are used for
the use stage
Loading-adjusted energy efficiency calculation of a single
mode UPS and a multimode UPS
(PCFCR - UPS
2020)
16
Adaptability
Power Curve
APC
operation
energy
(secondary
energy)
DC Flexibility:
Energy
Shifting
an evaluation of the
capability of a DC to
adapt to a pre-defined
DC energy consumption
curve.
𝐴𝑃𝐶 = 1 −∑ |𝐷𝐶 𝐸𝑛𝑒𝑟𝑔𝑦 𝑐𝑜𝑛𝑠𝑢𝑚𝑝𝑡𝑖𝑜𝑛−𝐾𝐴𝑃𝐶×𝑃𝑙𝑎𝑛𝑛𝑒𝑑 𝐸𝑛𝑒𝑟𝑔𝑦|𝑛
𝑖=1
∑ 𝐷𝐶 𝐸𝑛𝑒𝑟𝑔𝑦 𝑐𝑜𝑛𝑠𝑢𝑚𝑝𝑡𝑖𝑜𝑛 𝑛𝑖=1
KAPC: Correlative factor=
∑ 𝐷𝐶 𝐸𝑛𝑒𝑟𝑔𝑦 𝑐𝑜𝑛𝑠𝑢𝑚𝑝𝑡𝑖𝑜𝑛𝑛𝑖=1
∑ 𝑝𝑙𝑎𝑛𝑛𝑒𝑑 𝑒𝑛𝑒𝑟𝑔𝑦𝑛𝑖=1
(Smart City
Cluster
Collaboration,
Task 4 2015)
17
Adaptability
Power Curve
at Renewable
Energies APCren operation
energy
(secondary
energy)
DC Flexibility:
Energy
Shifting
an evaluation of the
capability of a DC to
adapt to the production
curve of the renewable
𝐴𝑃𝐶 = 1 −∑ |
𝐾𝐴𝑃𝐶𝑅𝑒𝑛×𝑅𝑒𝑛𝑒𝑤𝑎𝑏𝑙𝑒 𝐸𝑛𝑒𝑟𝑔𝑦 𝑝𝑟𝑜𝑑𝑢𝑐𝑡𝑖𝑜𝑛−𝐷𝐶 𝐸𝑛𝑒𝑟𝑔𝑦 𝑐𝑜𝑛𝑠𝑢𝑚𝑝𝑡𝑖𝑜𝑛
|𝑛𝑖=1
∑ 𝐷𝐶 𝐸𝑛𝑒𝑟𝑔𝑦 𝑐𝑜𝑛𝑠𝑢𝑚𝑝𝑡𝑖𝑜𝑛 𝑛𝑖=1
KAPCRen: Correlative factor=
(Smart City
Cluster
Collaboration,
Task 4 2015)
184 PEF is a Life cycle based method
185 EU Code of Conduct for AC Uninterruptible Power Systems is not considered, since the version 2.0 refers to 2011-2014 and is not further updated https://ec.europa.eu/jrc/en/energy-efficiency/code-
conduct/ups

296
No. Name of
metrics
acrony
m
Scope: Life
stages
covered
Scope:
targeted
environmen
tal aspects
Scope: Field of
application
Description Computational formula Source
energy sources available
to the DC in hand
∑ 𝐷𝐶 𝐸𝑛𝑒𝑟𝑔𝑦 𝑐𝑜𝑛𝑠𝑢𝑚𝑝𝑡𝑖𝑜𝑛𝑛𝑖=1
∑ 𝑟𝑒𝑛𝑒𝑤𝑎𝑏𝑙𝑒 𝑒𝑛𝑒𝑟𝑔𝑦 𝑝𝑟𝑜𝑑𝑢𝑐𝑡𝑖𝑜𝑛𝑛𝑖=1
18
Data Centre
Adapt
DCA operation
energy
(secondary
energy)
DC Flexibility:
Energy
Shifting
an evaluation of the
capability of a DC to
change its energy
consumption behaviour,
compared to its
respective behaviour
before the application of
a certain set of
optimisation actions
𝐷𝐶𝐴 = 1 −∑ |
𝐾𝐷𝐶𝐴×𝐷𝐶’𝑠 𝑟𝑒𝑎𝑙 𝑒𝑛𝑒𝑟𝑔𝑦 𝑐𝑜𝑛𝑠𝑢𝑚𝑝𝑡𝑖𝑜𝑛−
𝐷𝐶′𝑠 𝑏𝑎𝑠𝑒𝑙𝑖𝑛𝑒 𝐸𝑛𝑒𝑟𝑔𝑦 𝑐𝑜𝑛𝑠𝑢𝑚𝑝𝑡𝑖𝑜𝑛|𝑛
𝑖=1
∑ 𝐷𝐶′𝑠 𝑏𝑎𝑠𝑒𝑙𝑖𝑛𝑒 𝐸𝑛𝑒𝑟𝑔𝑦 𝑐𝑜𝑛𝑠𝑢𝑚𝑝𝑡𝑖𝑜𝑛 𝑛𝑖=1
KDCA: scaling factor=
∑ 𝐷𝐶′𝑠 𝑏𝑎𝑠𝑒𝑙𝑖𝑛𝑒 𝑒𝑛𝑒𝑟𝑔𝑦 𝑐𝑜𝑛𝑠𝑢𝑚𝑝𝑡𝑖𝑜𝑛𝑛𝑖=1
∑ 𝐷𝐶′𝑠 𝑟𝑒𝑎𝑙 𝑒𝑛𝑒𝑟𝑔𝑦 𝑐𝑜𝑚𝑠𝑢𝑝𝑡𝑖𝑜𝑛𝑛𝑖=1
(Smart City
Cluster
Collaboration,
Task 4 2015)
19
Global Key
Performance
Indicator of
energy
management KPIEM operation
energy
(secondary
energy) DC facility
𝐾𝑃𝐼𝐸𝑀 = 𝐾𝑃𝐼𝐸𝐶 × 𝐾𝑃𝐼𝑇𝐸 × (1
− (𝐾𝑃𝐼𝑅𝐸𝑁 × 𝑊𝑅𝐸𝑁)) × (1
− (𝐾𝑃𝐼𝑅𝐸𝑈𝑆𝐸 × 𝑊𝑅𝐸𝑈𝑆𝐸))
KPIEC: energy consumption
KPITE: task efficiency
KPIREN: renewable energy use
KPIReuse: energy re-use
W: weighting factor
(ETSI ES 205 200-
2-1 2014)
Source: Oeko-Institut
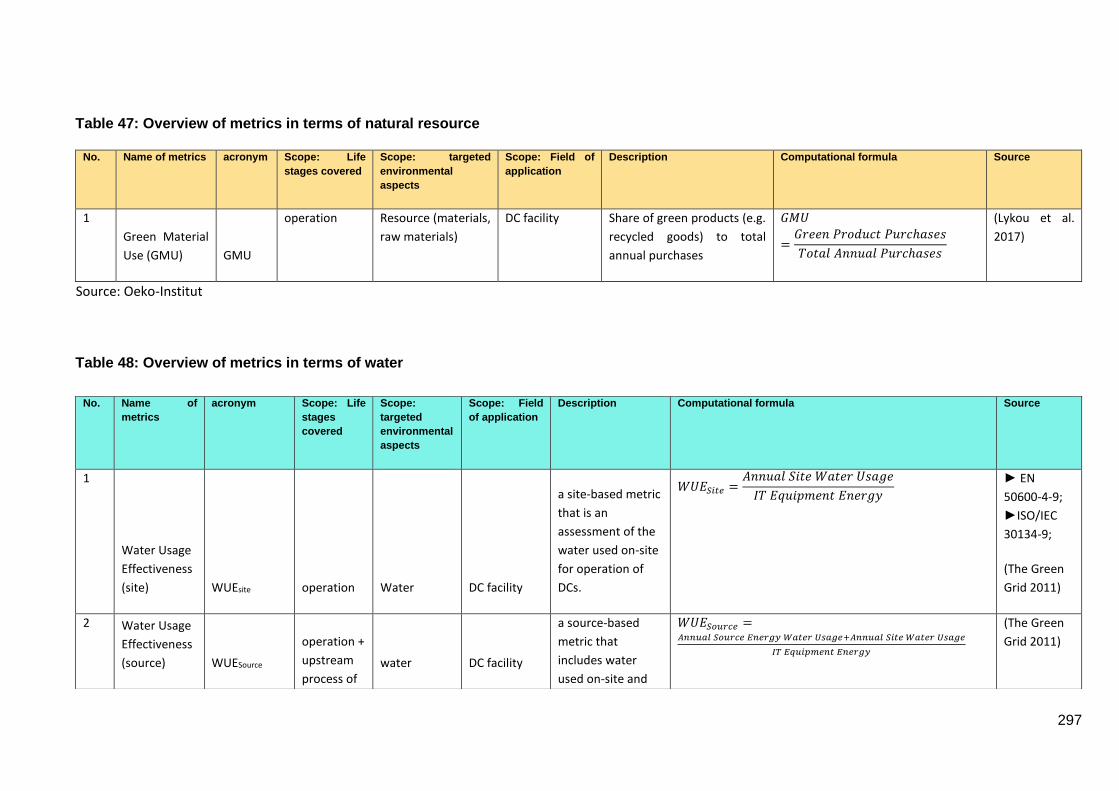
297
Table 47: Overview of metrics in terms of natural resource
No. Name of metrics acronym Scope: Life
stages covered
Scope: targeted
environmental
aspects
Scope: Field of
application
Description Computational formula Source
1
Green Material
Use (GMU) GMU
operation Resource (materials,
raw materials)
DC facility Share of green products (e.g.
recycled goods) to total
annual purchases
𝐺𝑀𝑈
=𝐺𝑟𝑒𝑒𝑛 𝑃𝑟𝑜𝑑𝑢𝑐𝑡 𝑃𝑢𝑟𝑐ℎ𝑎𝑠𝑒𝑠
𝑇𝑜𝑡𝑎𝑙 𝐴𝑛𝑛𝑢𝑎𝑙 𝑃𝑢𝑟𝑐ℎ𝑎𝑠𝑒𝑠
(Lykou et al.
2017)
Source: Oeko-Institut
Table 48: Overview of metrics in terms of water
No. Name of
metrics
acronym Scope: Life
stages
covered
Scope:
targeted
environmental
aspects
Scope: Field
of application
Description Computational formula Source
1
Water Usage
Effectiveness
(site) WUEsite operation Water DC facility
a site-based metric
that is an
assessment of the
water used on-site
for operation of
DCs.
𝑊𝑈𝐸𝑆𝑖𝑡𝑒 =𝐴𝑛𝑛𝑢𝑎𝑙 𝑆𝑖𝑡𝑒 𝑊𝑎𝑡𝑒𝑟 𝑈𝑠𝑎𝑔𝑒
𝐼𝑇 𝐸𝑞𝑢𝑖𝑝𝑚𝑒𝑛𝑡 𝐸𝑛𝑒𝑟𝑔𝑦
► EN
50600-4-9;
►ISO/IEC
30134-9;
(The Green
Grid 2011)
2 Water Usage
Effectiveness
(source) WUESource
operation +
upstream
process of water DC facility
a source-based
metric that
includes water
used on-site and
𝑊𝑈𝐸𝑆𝑜𝑢𝑟𝑐𝑒 =𝐴𝑛𝑛𝑢𝑎𝑙 𝑆𝑜𝑢𝑟𝑐𝑒 𝐸𝑛𝑒𝑟𝑔𝑦 𝑊𝑎𝑡𝑒𝑟 𝑈𝑠𝑎𝑔𝑒+𝐴𝑛𝑛𝑢𝑎𝑙 𝑆𝑖𝑡𝑒 𝑊𝑎𝑡𝑒𝑟 𝑈𝑠𝑎𝑔𝑒
𝐼𝑇 𝐸𝑞𝑢𝑖𝑝𝑚𝑒𝑛𝑡 𝐸𝑛𝑒𝑟𝑔𝑦
(The Green
Grid 2011)

298
Source: Oeko-Institut
Table 49: Overview of metrics in terms of wastes (e.g. e-waste, waste heat), sorted by the field of application
electricity
generation
water used off-site
in the
production of the
energy used on-
site.
= 𝑊𝑈𝐸𝑠𝑖𝑡𝑒 + 𝐴𝑛𝑛𝑢𝑎𝑙 𝑆𝑜𝑢𝑟𝑐𝑒 𝐸𝑛𝑒𝑟𝑔𝑦 𝑊𝑎𝑡𝑒𝑟 𝑈𝑠𝑎𝑔𝑒
𝐼𝑇 𝐸𝑞𝑢𝑖𝑝𝑚𝑒𝑛𝑡 𝐸𝑛𝑒𝑟𝑔𝑦
No Name of
metrics
acro
nym
Scope: Life
stages
covered
Scope:
targeted
environmenta
l aspects
Scope:
Field of
application
Description Computational formula Source
1 Energy
reuse
effectivene
ss (ERE) ERE operation
energy
(secondary
energy) DC facility
measuring the benefit of reuse
energy
𝐸𝑅𝐸 = (1 − 𝐸𝑅𝐹) × 𝑃𝑈𝐸
=𝐶𝑜𝑜𝑙𝑖𝑛𝑔 + 𝑃𝑜𝑤𝑒𝑟 + 𝐿𝑖𝑔ℎ𝑡𝑖𝑛𝑔 + 𝐼𝑇 − 𝑅𝑒𝑢𝑠𝑒
𝐼𝑇
(The Green Grid
2010a)
2
Energy
Reuse
Factor
(ERF) ERF operation
energy
(secondary
energy) DC facility
energy from the DC (annual)
that is used outside of the DC
and which substitutes
partly or totally energy needed
outside the DC boundary
(annual)
𝐸𝑅𝐹 =𝐸𝑛𝑒𝑟𝑔𝑦𝑟𝑒𝑢𝑠𝑒 𝑜𝑢𝑡𝑠𝑖𝑑𝑒 𝑜𝑓 𝐷𝐶
𝑇𝑜𝑡𝑎𝑙 𝐷𝐶 𝐸𝑛𝑒𝑟𝑔𝑦
►EN 50600-4-6;
►ISO/IEC 30134-6;
►(The Green Grid
2010a)
3
In-house
Reuse IRF operation
energy
(secondary
energy) DC facility
the ratio of recovered energy
over the total DC energy
consumption
𝐼𝑅𝐹 =𝐸𝑛𝑒𝑟𝑔𝑦 𝑟𝑒𝑐𝑜𝑣𝑒𝑟𝑒𝑑 𝑤𝑖𝑡ℎ𝑖𝑛 𝐷𝐶
𝑇𝑜𝑡𝑎𝑙 𝐷𝐶 𝐸𝑛𝑒𝑟𝑔𝑦
research study:
CATALYST Toolkit

299
Source: Oeko-Institut
Factor
(IRF)
(Georgiadou et al. 2018)
4
Sustainabl
e Heat
Exploitatio
n (SHE) SHE operation
energy
(secondary
energy) DC facility
an indicator related to the
efficiency of the waste heat
recovering equipment. It
reflects the increase
(worsening) in the energy
demand of the DC in order to
enable residual heat reuse in
comparison to a baseline
scenario where the heat is not
exploited (before residual heat
recovery)
𝑆𝐻𝐸 =𝑒𝑙𝑒𝑐𝑡𝑟𝑖𝑐𝑖𝑡𝑦 𝑓𝑒𝑒𝑑𝑖𝑛𝑔 𝑡ℎ𝑒 ℎ𝑒𝑎𝑡 𝑟𝑒𝑐𝑜𝑣𝑒𝑟𝑦 𝑠𝑦𝑠𝑡𝑒𝑚
𝑇𝑜𝑡𝑎𝑙 𝐷𝐶 𝐸𝑛𝑒𝑟𝑔𝑦 (𝑏𝑒𝑓𝑜𝑟𝑒 𝑤𝑎𝑠𝑡𝑒 ℎ𝑒𝑎𝑡 𝑟𝑒𝑐𝑜𝑣𝑒𝑟𝑦)
research study:
CATALYST Toolkit
(Georgiadou et al. 2018)
5 Heat
Usage
Effectivene
ss HUE operation
energy
(secondary
energy) DC facility Effectiveness of heat recovered
𝐻𝑈𝐸 =𝐻𝑒𝑎𝑡 𝑟𝑒𝑐𝑜𝑣𝑒𝑟𝑒𝑑
𝑆𝐻𝐸
research study:
CATALYST Toolkit
(Georgiadou et al. 2018)
6
Electronics
Disposal
Efficiency
(EDE) EDE end-of-life
e-waste
disposal
IT and
telecomm
unications
equipment
-to increase industry awareness
regarding the responsible
disposal of IT assets.
-not as an instrument to
compare itself with others
𝐸𝐷𝐸 =𝑊𝑒𝑖𝑔ℎ𝑡"𝑅𝑒𝑠𝑝𝑜𝑛𝑠𝑖𝑏𝑙𝑦 𝐷𝑖𝑠𝑝𝑜𝑠𝑒𝑑"
𝑇𝑜𝑡𝑎𝑙 𝑊𝑒𝑖𝑔ℎ𝑡"𝐷𝑖𝑠𝑝𝑜𝑠𝑒𝑑"
(The Green Grid 2012)

300
Table 50: Overview of metrics in terms of environmental impacts (in this case: CO2-eq), sorted by the field of application
No. Name of
metrics acronym
Scope: Life
stages
covered
Scope:
targeted
environmental
aspects
Scope:
Field of
application
Description Computational formula Source
1
Carbon
Usage
Effectiveness
(CUE)
CUE operation CO2-eq
emissions DC facility
CO2-eq
associated with
energy
consumption in
DCs
𝐶𝑈𝐸 =𝑇𝑜𝑡𝑎𝑙 𝐶𝑂2 𝑐𝑎𝑢𝑠𝑒𝑑 𝑏𝑦 𝑡ℎ𝑒 𝑡𝑜𝑎𝑙 𝐷𝐶 𝐸𝑛𝑒𝑟𝑔𝑦
𝐼𝑇 𝐸𝑞𝑢𝑖𝑝𝑚𝑒𝑛𝑡 𝐸𝑛𝑒𝑟𝑔𝑦
= 𝑃𝑈𝐸
× 𝐶𝐸𝐹 (𝑐𝑎𝑟𝑏𝑜𝑛 𝑒𝑚𝑖𝑠𝑠𝑖𝑜𝑛 𝑓𝑎𝑐𝑡𝑜𝑟)
►EN 50600-4-8;
►ISO/IEC 30134-8;
►(The Green Grid)
2
Technology
Carbon
Efficiency
(TCE)
TCE=CUE operation CO2-eq
emissions DC facility
Combining that
emissions factor
with energy
consumption
𝑇𝐶𝐸
=𝑇𝑜𝑡𝑎𝑙 𝐹𝑎𝑐𝑖𝑙𝑖𝑡𝑦 𝑃𝑜𝑤𝑒𝑟
𝐼𝑇 𝐸𝑞𝑢𝑖𝑝𝑚𝑒𝑛𝑡 𝑃𝑜𝑤𝑒𝑟𝑥 𝐸𝑙𝑒𝑐𝑡𝑟𝑖𝑐𝑖𝑡𝑦 𝑐𝑎𝑟𝑏𝑜𝑛 𝑒𝑚𝑖𝑠𝑠𝑖𝑜𝑛
= 𝑃𝑈𝐸 × 𝐶𝐸𝐹(𝑐𝑎𝑟𝑏𝑜𝑛 𝑒𝑚𝑖𝑠𝑠𝑖𝑜𝑛 𝑓𝑎𝑐𝑡𝑜𝑟)
(Alger 2010) was
introduced in 2007 by CS
Technology
3
ENERGY
STAR Score
for DC
ENERGY
STAR
Score
operation
+
upstream
process of
electricity
generation
energy
(primary
energy)
DC facility
identify the
score from the
lookup table
using the
energy
efficiency ratio
𝐸𝑛𝑒𝑟𝑔𝑦 𝐸𝑓𝑓𝑖𝑐𝑖𝑒𝑛𝑐𝑦 𝑅𝑎𝑡𝑖𝑜 =𝐴𝑐𝑡𝑢𝑎𝑙 𝑃𝑈𝐸
𝑃𝑟𝑒𝑑𝑖𝑐𝑡𝑒𝑑 𝑃𝑈𝐸
(Energy Star 2018)
4
Primary
Energy (PE)
Savings
PE Savings
operation
+
upstream
process of
electricity
generation
energy
savings
(primary
energy)
DC facility
The percentage
of savings in
terms of
primary energy
consumed by a
DC, once
improvements
𝑃𝐸 𝑆𝑎𝑣𝑖𝑛𝑔𝑠 = (1 −
𝑡𝑜𝑡𝑎𝑙 𝑃𝐸 𝑚𝑒𝑎𝑠𝑢𝑟𝑒𝑑
𝑡𝑜𝑡𝑎𝑙 𝑃𝐸 𝑡ℎ𝑎𝑡 𝑤𝑜𝑢𝑙𝑑 ℎ𝑎𝑣𝑒 𝑏𝑒𝑒𝑛 𝑐𝑜𝑛𝑠𝑢𝑚𝑒𝑑) × 100
(Smart City Cluster
Collaboration, Task 4
2015)

301
No. Name of
metrics acronym
Scope: Life
stages
covered
Scope:
targeted
environmental
aspects
Scope:
Field of
application
Description Computational formula Source
have taken
place
5
CO2 Avoided
Emissions
CO2
Savings
operation
CO2-eq
avoided
emissions
DC facility
The percentage
of savings in
terms of CO2
emissions
generated by a
data centre,
once
improvements
have taken
place
𝐶𝑂2 𝑆𝑎𝑣𝑖𝑛𝑔𝑠 = (1 −
𝑡𝑜𝑡𝑎𝑙 𝐶𝑂2 𝑒𝑚𝑖𝑠𝑠𝑖𝑜𝑛𝑠 𝑟𝑒𝑙𝑒𝑎𝑠𝑒𝑑
𝑡ℎ𝑒 𝑡𝑜𝑡𝑎𝑙 𝐶𝑂2 𝑒𝑚𝑖𝑠𝑠𝑖𝑜𝑛𝑠 𝑡ℎ𝑎𝑡 𝑤𝑜𝑢𝑙𝑑 ℎ𝑎𝑣𝑒 𝑏𝑒𝑒𝑛 𝑟𝑒𝑙𝑒𝑎𝑠𝑒𝑑) × 100
(Smart City Cluster
Collaboration, Task 4
2015)
Source: Oeko-Institut
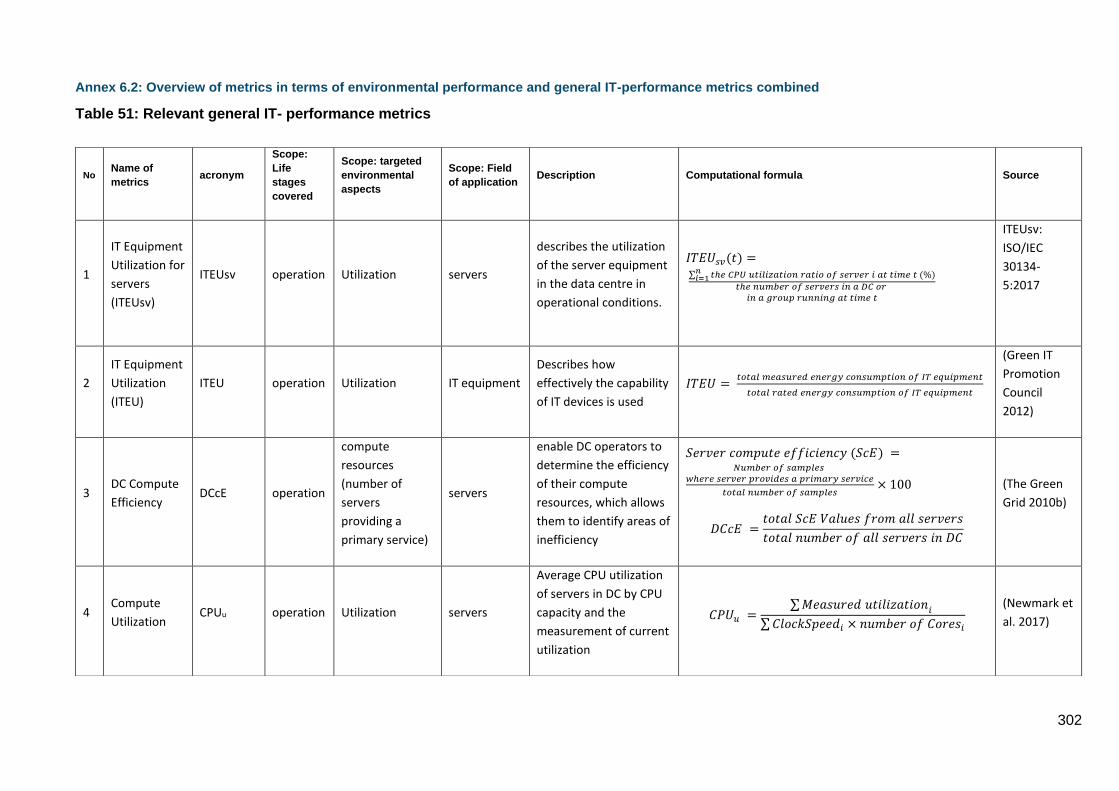
302
Annex 6.2: Overview of metrics in terms of environmental performance and general IT-performance metrics combined
Table 51: Relevant general IT- performance metrics
No Name of
metrics acronym
Scope:
Life
stages
covered
Scope: targeted
environmental
aspects
Scope: Field
of application Description Computational formula Source
1
IT Equipment
Utilization for
servers
(ITEUsv)
ITEUsv operation Utilization servers
describes the utilization
of the server equipment
in the data centre in
operational conditions.
𝐼𝑇𝐸𝑈𝑠𝑣(𝑡) =
∑ 𝑡ℎ𝑒 𝐶𝑃𝑈 𝑢𝑡𝑖𝑙𝑖𝑧𝑎𝑡𝑖𝑜𝑛 𝑟𝑎𝑡𝑖𝑜 𝑜𝑓 𝑠𝑒𝑟𝑣𝑒𝑟 𝑖 𝑎𝑡 𝑡𝑖𝑚𝑒 𝑡 (%)𝑛
𝑖=1𝑡ℎ𝑒 𝑛𝑢𝑚𝑏𝑒𝑟 𝑜𝑓 𝑠𝑒𝑟𝑣𝑒𝑟𝑠 𝑖𝑛 𝑎 𝐷𝐶 𝑜𝑟
𝑖𝑛 𝑎 𝑔𝑟𝑜𝑢𝑝 𝑟𝑢𝑛𝑛𝑖𝑛𝑔 𝑎𝑡 𝑡𝑖𝑚𝑒 𝑡
ITEUsv:
ISO/IEC
30134-
5:2017
2
IT Equipment
Utilization
(ITEU)
ITEU operation Utilization IT equipment
Describes how
effectively the capability
of IT devices is used
𝐼𝑇𝐸𝑈 = 𝑡𝑜𝑡𝑎𝑙 𝑚𝑒𝑎𝑠𝑢𝑟𝑒𝑑 𝑒𝑛𝑒𝑟𝑔𝑦 𝑐𝑜𝑛𝑠𝑢𝑚𝑝𝑡𝑖𝑜𝑛 𝑜𝑓 𝐼𝑇 𝑒𝑞𝑢𝑖𝑝𝑚𝑒𝑛𝑡
𝑡𝑜𝑡𝑎𝑙 𝑟𝑎𝑡𝑒𝑑 𝑒𝑛𝑒𝑟𝑔𝑦 𝑐𝑜𝑛𝑠𝑢𝑚𝑝𝑡𝑖𝑜𝑛 𝑜𝑓 𝐼𝑇 𝑒𝑞𝑢𝑖𝑝𝑚𝑒𝑛𝑡
(Green IT
Promotion
Council
2012)
3 DC Compute
Efficiency DCcE operation
compute
resources
(number of
servers
providing a
primary service)
servers
enable DC operators to
determine the efficiency
of their compute
resources, which allows
them to identify areas of
inefficiency
𝑆𝑒𝑟𝑣𝑒𝑟 𝑐𝑜𝑚𝑝𝑢𝑡𝑒 𝑒𝑓𝑓𝑖𝑐𝑖𝑒𝑛𝑐𝑦 (𝑆𝑐𝐸) =𝑁𝑢𝑚𝑏𝑒𝑟 𝑜𝑓 𝑠𝑎𝑚𝑝𝑙𝑒𝑠
𝑤ℎ𝑒𝑟𝑒 𝑠𝑒𝑟𝑣𝑒𝑟 𝑝𝑟𝑜𝑣𝑖𝑑𝑒𝑠 𝑎 𝑝𝑟𝑖𝑚𝑎𝑟𝑦 𝑠𝑒𝑟𝑣𝑖𝑐𝑒
𝑡𝑜𝑡𝑎𝑙 𝑛𝑢𝑚𝑏𝑒𝑟 𝑜𝑓 𝑠𝑎𝑚𝑝𝑙𝑒𝑠× 100
𝐷𝐶𝑐𝐸 =𝑡𝑜𝑡𝑎𝑙 𝑆𝑐𝐸 𝑉𝑎𝑙𝑢𝑒𝑠 𝑓𝑟𝑜𝑚 𝑎𝑙𝑙 𝑠𝑒𝑟𝑣𝑒𝑟𝑠
𝑡𝑜𝑡𝑎𝑙 𝑛𝑢𝑚𝑏𝑒𝑟 𝑜𝑓 𝑎𝑙𝑙 𝑠𝑒𝑟𝑣𝑒𝑟𝑠 𝑖𝑛 𝐷𝐶
(The Green
Grid 2010b)
4 Compute
Utilization CPUu operation Utilization servers
Average CPU utilization
of servers in DC by CPU
capacity and the
measurement of current
utilization
𝐶𝑃𝑈𝑢 =∑ 𝑀𝑒𝑎𝑠𝑢𝑟𝑒𝑑 𝑢𝑡𝑖𝑙𝑖𝑧𝑎𝑡𝑖𝑜𝑛𝑖
∑ 𝐶𝑙𝑜𝑐𝑘𝑆𝑝𝑒𝑒𝑑𝑖 × 𝑛𝑢𝑚𝑏𝑒𝑟 𝑜𝑓 𝐶𝑜𝑟𝑒𝑠𝑖
(Newmark et
al. 2017)

303
Source: Oeko-Institut
Table 52: Overview of metrics in terms of environmental performance and general IT-performance metrics combined
5 Memory
Utilization MEMu operation Utilization servers
Average memory
utilization of servers in
DC by capacity and used
memory capacity
𝑀𝐸𝑀𝑢 =∑ 𝑀𝑒𝑎𝑠𝑢𝑟𝑒𝑑 𝑢𝑡𝑖𝑙𝑖𝑧𝑎𝑡𝑖𝑜𝑛 𝑜𝑓 𝑡ℎ𝑒 𝐷𝐼𝑀𝑀𝑠
𝑖
∑ 𝑆𝑢𝑚 𝑜𝑓 𝐷𝐼𝑀𝑀𝑠𝑖
(Newmark et
al. 2017)
6 Storage
Utilization STORu operation Utilization storage
Average memory
utilization of servers in
DC by total addressable
capacity and storage in
use
𝑆𝑇𝑂𝑅𝑢 =∑ 𝑎𝑙𝑙 𝑐𝑎𝑝𝑎𝑐𝑖𝑡𝑦 𝑖𝑛 𝑢𝑠𝑒
𝑖
∑ 𝑆𝑢𝑚 𝑜𝑓 𝑎𝑑𝑑𝑟𝑒𝑠𝑠𝑎𝑏𝑙𝑒 𝑐𝑎𝑝𝑎𝑐𝑖𝑡𝑦𝑖
(Newmark et
al. 2017)
7 Network
Utilization NETu operation Utilization network
Average Network
Utilization at the edge
and access tier.
𝑁𝐸𝑇𝑢 =
∑ 𝑚𝑒𝑎𝑠𝑢𝑟𝑒𝑑 𝑎𝑐𝑢𝑡𝑎𝑙 𝑏𝑎𝑛𝑑𝑤𝑖𝑑𝑡ℎ 𝑐𝑜𝑛𝑠𝑢𝑚𝑒𝑑
𝑁𝑒𝑡𝑤𝑜𝑟𝑘 𝑐𝑎𝑝𝑎𝑐𝑖𝑡𝑦
𝑁𝑒𝑡𝑤𝑜𝑟𝑘 𝑐𝑎𝑝𝑎𝑐𝑖𝑡𝑦 = ∑ 𝑏𝑎𝑛𝑑𝑤𝑖𝑑𝑡ℎ 𝑖𝑛𝑡𝑜 𝑎𝑛𝑑 𝑜𝑢𝑡 𝑜𝑓 𝐷𝐶 +
∑ 𝑏𝑎𝑛𝑑𝑤𝑖𝑑𝑡ℎ 𝑏𝑒𝑡𝑤𝑒𝑒𝑛 𝑑𝑒𝑣𝑖𝑐𝑒𝑠 𝑎𝑛𝑑 𝑛𝑒𝑡𝑤𝑜𝑟𝑘 𝑎𝑔𝑔𝑟𝑒𝑔𝑎𝑡𝑒
(Newmark et
al. 2017)
No Name of
metrics
acronym Scope:
Life
stages
covered
Scope: targeted
environmental
aspects
Scope: Field
of application
Description Computational formula Source
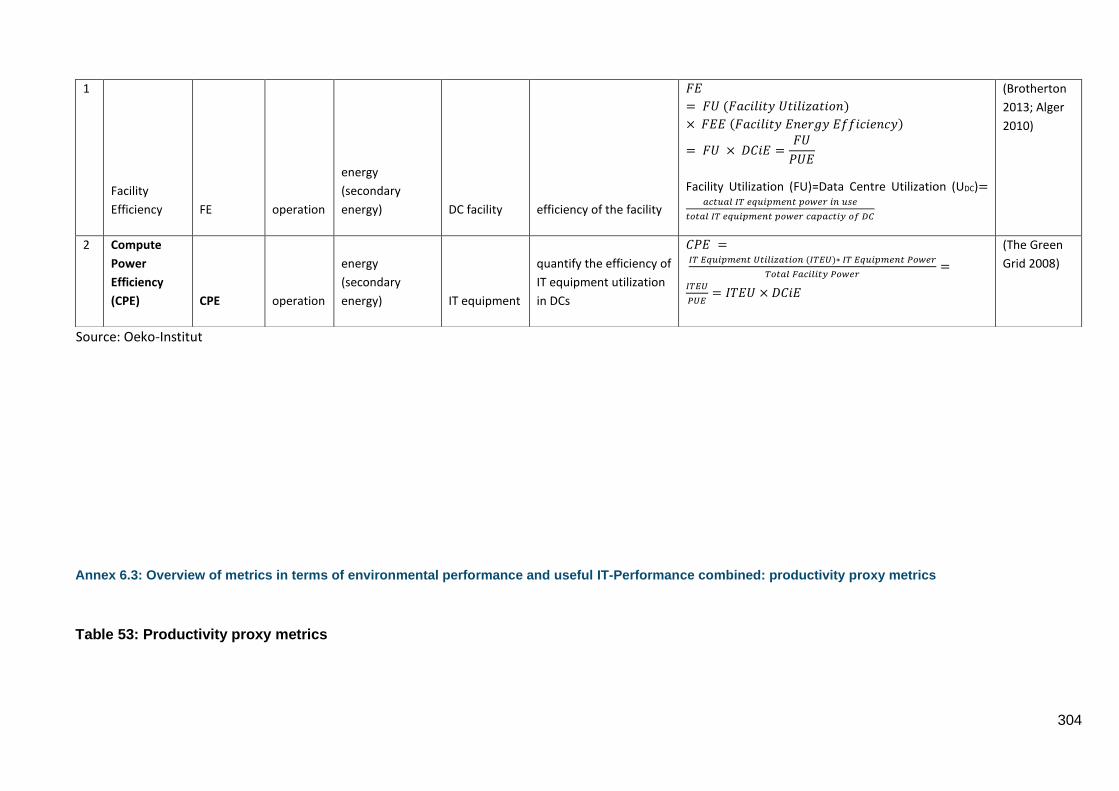
304
Source: Oeko-Institut
Annex 6.3: Overview of metrics in terms of environmental performance and useful IT-Performance combined: productivity proxy metrics
Table 53: Productivity proxy metrics
1
Facility
Efficiency FE operation
energy
(secondary
energy) DC facility efficiency of the facility
𝐹𝐸
= 𝐹𝑈 (𝐹𝑎𝑐𝑖𝑙𝑖𝑡𝑦 𝑈𝑡𝑖𝑙𝑖𝑧𝑎𝑡𝑖𝑜𝑛)
× 𝐹𝐸𝐸 (𝐹𝑎𝑐𝑖𝑙𝑖𝑡𝑦 𝐸𝑛𝑒𝑟𝑔𝑦 𝐸𝑓𝑓𝑖𝑐𝑖𝑒𝑛𝑐𝑦)
= 𝐹𝑈 × 𝐷𝐶𝑖𝐸 =𝐹𝑈
𝑃𝑈𝐸
Facility Utilization (FU)=Data Centre Utilization (UDC)=𝑎𝑐𝑡𝑢𝑎𝑙 𝐼𝑇 𝑒𝑞𝑢𝑖𝑝𝑚𝑒𝑛𝑡 𝑝𝑜𝑤𝑒𝑟 𝑖𝑛 𝑢𝑠𝑒
𝑡𝑜𝑡𝑎𝑙 𝐼𝑇 𝑒𝑞𝑢𝑖𝑝𝑚𝑒𝑛𝑡 𝑝𝑜𝑤𝑒𝑟 𝑐𝑎𝑝𝑎𝑐𝑡𝑖𝑦 𝑜𝑓 𝐷𝐶
(Brotherton
2013; Alger
2010)
2 Compute
Power
Efficiency
(CPE) CPE operation
energy
(secondary
energy) IT equipment
quantify the efficiency of
IT equipment utilization
in DCs
𝐶𝑃𝐸 =
𝐼𝑇 𝐸𝑞𝑢𝑖𝑝𝑚𝑒𝑛𝑡 𝑈𝑡𝑖𝑙𝑖𝑧𝑎𝑡𝑖𝑜𝑛 (𝐼𝑇𝐸𝑈)∗ 𝐼𝑇 𝐸𝑞𝑢𝑖𝑝𝑚𝑒𝑛𝑡 𝑃𝑜𝑤𝑒𝑟
𝑇𝑜𝑡𝑎𝑙 𝐹𝑎𝑐𝑖𝑙𝑖𝑡𝑦 𝑃𝑜𝑤𝑒𝑟=
𝐼𝑇𝐸𝑈
𝑃𝑈𝐸= 𝐼𝑇𝐸𝑈 × 𝐷𝐶𝑖𝐸
(The Green
Grid 2008)

305
No Name of
metrics
acrony
m
Scope: Life
stages covered
Scope:
targeted
environmenta
l aspects
Scope: Field
of application
Description Computational formula Source
1
Cumulated
Performance
Efficiency
(CPE) CPE
operation +
upstream
process of
electricity
generation
energy
(primary
energy) IT equipment
the total performance to
the cumulated energy
demand (CED) during its
lifecycle
𝐶𝑃𝐸 = 𝑂𝑝𝑒𝑟𝑎𝑡𝑖𝑜𝑛𝑠
𝐶𝐸𝐷
(Peñaherrera
and
Szczepaniak
2018)
2 IT
Productivity
per
Embedded
Watt (IT-
PEW) IT-PEW operation
energy
(secondary
energy) IT equipment
Measures the IT energy
productivity, work
defined as network
transaction, storage
or computing cycles
𝐼𝑇 − 𝑃𝐸𝑊
= 𝑈𝑠𝑒𝑓𝑢𝑙 𝑤𝑜𝑟𝑘 (𝑇𝑟𝑎𝑛𝑠𝑎𝑐𝑡𝑖𝑜𝑛𝑠/𝐼𝑂/𝐶𝑦𝑐𝑙𝑒𝑠)
𝐼𝑇 𝐸𝑛𝑒𝑟𝑔𝑦 𝑐𝑜𝑛𝑠𝑢𝑚𝑒𝑑
Uptime
institute
(Brill 2007;
Schödwell et
al. 2018)
3 IT energy
Productivity /
(ITeP)
Equipment
Energy
Productivity
(EEP)
ITeP=E
EP operation
energy
(secondary
energy) IT Equipment
the completed tasks
relative to IT energy use
𝐼𝑇𝑒𝑃 = 𝑈𝑠𝑒𝑓𝑢𝑙 𝑤𝑜𝑟𝑘 𝑝𝑟𝑜𝑑𝑢𝑐𝑒𝑑
𝐼𝑇 𝐸𝑛𝑒𝑟𝑔𝑦 𝑐𝑜𝑛𝑠𝑢𝑚𝑒𝑑 𝑝𝑟𝑜𝑑𝑢𝑐𝑖𝑛𝑔 𝑡ℎ𝑖𝑠 𝑤𝑜𝑟𝑘
(Schödwell
et al. 2018)
(Chinnici et
al. 2016)
4
Cumulative
Energy
Efficiency
(CEE) CEE
operation +
upstream
porcess of
electrcitiy
generation
energy
(primary
energy) server
a metric to evaluate the
energy efficiency of a DC
device by relating the
useful work during its
operational phase to the
cumulated energy
𝐶𝐸𝐸 = 𝑢𝑠𝑒𝑓𝑢𝑙 𝑤𝑜𝑟𝑘
𝐶𝐸𝐷
(Peñaherrera
and
Szczepaniak
2018)

306
demand (CED) during its
lifetime
5
IT Equipment
Efficiency
(ITEE); ITEE
for servers
ITEE;
ITEEsv operation
energy
(secondary
energy) server
maximum performance
per kW (measured
based on SERT and
SPECpower_ssj2008) of
all servers or a group of
servers in a data centre.
𝐼𝑇𝐸𝐸𝑠𝑣 =
∑ 𝑚𝑎𝑥𝑖𝑚𝑢𝑚 𝑜𝑟 𝑝𝑒𝑎𝑘 𝑝𝑒𝑟𝑓𝑜𝑟𝑚𝑎𝑛𝑐𝑒 𝑜𝑓 𝑎 𝑠𝑒𝑟𝑣𝑒𝑟 𝑖𝑛
𝑖=1
∑ 𝑚𝑎𝑥𝑖𝑚𝑢𝑚 𝑝𝑜𝑤𝑒𝑟 𝑐𝑜𝑛𝑠𝑢𝑚𝑝𝑡𝑖𝑜𝑛 𝑜𝑓 𝑎 𝑠𝑒𝑟𝑣𝑒𝑟 𝑖 𝑖𝑛 𝑘𝑊𝑛𝑖=1
ITEEsv:
ISO/IEC
30134-
4:2017
6
IT Asset
Efficiency
(ITAE) ITAE operation
energy
(secondary
energy) server
Indicates the energy
productivity and
utilization of the IT
systems
𝐼𝑇𝐴𝐸 = 𝐼𝑇𝐸𝐸 × 𝐼𝑇𝐸𝑈 (Brotherton
2013; Alger
2010)
Standard
Performance
Evaluation
Corporation
(SPEC®)
Power
SPECpo
wer_ssj
2008 operation
energy
(secondary
energy) server
measure the energy-
efficiency of workloads
at multiple load levels
The predecessor to the SPEC SERT. SPEC Power focuses
on transactional server-side Java (SSJ) workloads
𝑆𝑃𝐸𝐶𝑝𝑜𝑤𝑒𝑟 =
∑ 𝑝𝑒𝑟𝑓𝑜𝑟𝑚𝑎𝑛𝑐𝑒 𝑚𝑒𝑎𝑠𝑢𝑟𝑒𝑑 𝑎𝑡 𝑒𝑎𝑐ℎ 𝑙𝑜𝑎𝑑 𝑙𝑒𝑣𝑒𝑙 (𝑠𝑠𝑗_𝑜𝑝𝑠)
∑ 𝑎𝑣𝑒𝑟𝑎𝑔𝑒 𝑝𝑜𝑤𝑒𝑟 𝑎𝑡 𝑒𝑎𝑐ℎ 𝑡𝑎𝑟𝑔𝑒𝑡 𝑙𝑜𝑎𝑑 (𝑤)
(SPEC 2008)
7
Standard
Performance
Evaluation
Corporation
(SPEC®) SERT:
Server
Efficiency
Rating Tool
SERTTM
2 operation
energy
(secondary
energy) server
indicates the overall
energy effectiveness of a
server. The SERTv2 test
method consists of four
components which shall
be used to accurately
obtain a SERTv2 result.
These are SERT,
PTDaemon, the Client
Configuration XML file,
𝑆𝐸𝑅𝑇 2 𝐸𝑓𝑓𝑖𝑐𝑖𝑒𝑛𝑐𝑦 𝑆𝑐𝑜𝑟𝑒 = exp(0.65 ×
ln(EffCPU) + 0.3 × ln(EffMemory) + 0.05 ×
ln(EffStorage))
The effectiveness of worklets for a given workload:
— the CPU workload has seven worklets (Compress,
CryptoAES, LU, SHA256, SOR, Sort, and SSJ)
— the Memory workload has two worklets (Flood3 and
Capacity3);
(SPEC 2019)

307
and the SPEC SERT Run
and Reporting Rules.
— the Storage workload has two worklets (Random and
Sequential)
8 ETSI EN 303
470: Energy
Efficiency
measuremen
t
methodology
and metrics
for servers
SERTTM
2 operation
energy
(secondary
energy) server
Energy Efficiency
measurement
methodology and
metrics
Based on the SERT metrics (ETSI EN 303
470 V1.1.0
2019)
9
Server
energy
effectiveness
metric
(SEEM) SEEM operation
energy
(secondary
energy) server
The SEEM metric(s)
is/are an active state
and optional idle state
numeric result(s) that
quantifies a server’s
energy effectiveness.
the active state portion of SEEM shall be equal to the
numeric overall result of SPEC SERTv2. SEEM allows
implementers to select test methods for servers where
SERTV2 is not applicable.
ISO/IEC
21836: 2020
10 Space, Watts
and
Performance
SWaP operation
energy
(secondary
energy) server
measure server
efficiency
𝑆𝑊𝑎𝑃 = 𝑃𝑒𝑟𝑓𝑜𝑟𝑚𝑎𝑛𝑐𝑒
𝑆𝑝𝑎𝑐𝑒 × 𝑃𝑜𝑤𝑒𝑟 𝐶𝑜𝑛𝑠𝑢𝑚𝑝𝑡𝑖𝑜𝑛
Performance is measured by industry standard
benchmarks, e.g. SPEC; Space addresses the height of
the server in rack units.
(Levy and
Raviv 2017)
11
DC storage
productivity - DCsPcap operation
energy
(secondary
energy) storage
DCsPcap represents total
addressable storage
capacity productivity at
ready-idle.
𝐷𝐶𝑠𝑃𝑐𝑎𝑝 = 𝑆𝑡𝑜𝑟𝑎𝑔𝑒 𝑆𝑦𝑠𝑡𝑒𝑚 𝑇𝑜𝑡𝑎𝑙 𝐶𝑎𝑝𝑎𝑐𝑖𝑡𝑦
𝑆𝑡𝑜𝑟𝑎𝑔𝑒 𝑆𝑦𝑠𝑡𝑒𝑚 𝐸𝑛𝑒𝑟𝑔𝑦 𝐶𝑜𝑛𝑠𝑢𝑚𝑝𝑡𝑖𝑜𝑛
(The Green
Grid 2014b)

308
187 Another publication by the Green Grid Blackburn 2012describes 3 DC storage Efficiency (DCsE) sub-metrics based on capacity, the number of I/O operations per second and Transfer Throughput. It is assumed that DCsE metrics are the same as DCsP metrics due to the computational formula.
capacity186
(DCsPcap)
12 DC storage
productivity -
Streaming
(DCsPmb) DCsPmb operation
energy
(secondary
energy) storage
DCsPmb represents
streaming productivity
for a specific workload
or mix of workloads.
𝐷𝐶𝑠𝑃𝑚𝑏 = 𝑆𝑡𝑜𝑟𝑎𝑔𝑒 𝑆𝑦𝑠𝑡𝑒𝑚 𝑆𝑡𝑟𝑒𝑎𝑚𝑖𝑛𝑔
𝑆𝑡𝑜𝑟𝑎𝑔𝑒 𝑆𝑦𝑠𝑡𝑒𝑚 𝐸𝑛𝑒𝑟𝑔𝑦 𝐶𝑜𝑛𝑠𝑢𝑚𝑝𝑡𝑖𝑜𝑛
(The Green
Grid 2014b)
13 DC storage
productivity
–
Transactional
(DCsPio) DCsPio operation
energy
(secondary
energy) storage
DCsPio represents
transactional
productivity for a
specific IO workload or
mix of IO workloads.
𝐷𝐶𝑠𝑃𝑖𝑜 = 𝑆𝑡𝑜𝑟𝑎𝑔𝑒 𝑆𝑦𝑠𝑡𝑒𝑚 𝑇𝑟𝑎𝑛𝑠𝑎𝑐𝑡𝑖𝑜𝑛𝑠
𝑆𝑡𝑜𝑟𝑎𝑔𝑒 𝑆𝑦𝑠𝑡𝑒𝑚 𝐸𝑛𝑒𝑟𝑔𝑦 𝐶𝑜𝑛𝑠𝑢𝑚𝑝𝑡𝑖𝑜𝑛
(The Green
Grid 2014b)
14
SNIA
Emerald™
Power
Efficiency
SNIA
Emeral
d™ operation
energy
(secondary
energy) storage
a set of metrics for the
evaluation of the related
performance and energy
consumption of storage
products in specific
active and idle states
the power efficiency metrics for 3 sets:
• Disk set: Online, Near-Online
• RVML (removable & virtual media library) set:
Removable Media Library, Virtual Media Library
• NVSS (non-volatile solid state) set: Disk Access
Products in different sets are generally not comparable in
performance or power efficiency characteristics.
(SNIA 2020)
15
Energy
Consumption
Rating ECR operation
energy
(secondary
energy) network
reflects the energy
efficiency in correlation
to the highest
performance capacity of
the device
𝐸𝐶𝑅 =𝑃𝑒𝑎𝑘 𝑝𝑜𝑤𝑒𝑟 (𝑖𝑛 𝑤𝑎𝑡𝑡)
𝑚𝑎𝑥𝑖𝑚𝑢𝑚 𝑡ℎ𝑟𝑜𝑢𝑔ℎ𝑝𝑢𝑡 ( 𝑖𝑛 𝑏𝑖𝑡𝑠 𝑝𝑒𝑟 𝑠𝑒𝑐𝑜𝑛𝑑)
(Berwald et
al. 2015)187

309
16
Energy
Consumption
Rating
Variable Load ECR-VL operation
energy
(secondary
energy) network
a variable load metric
and intended to
differentiate energy
efficiency under various
workload conditions.
energy consumption under 0%, 10%,30%,
50%,100% load
(Berwald et
al. 2015)
17
Telecommuni
cations
Energy
Efficiency
Ratio (TEER) TEER operation
energy
(secondary
energy)
Network:
router &
switch
to calculate the energy
efficiency of individual
network equipment by
considering three
different data utilisation
(0%, 50%, and 100%)
with associated power
consumption
𝑇𝐸𝐸𝑅 =𝑢𝑠𝑒𝑓𝑢𝑙 𝑤𝑜𝑟𝑘
𝑚𝑒𝑎𝑠𝑢𝑟𝑒𝑑 𝑃𝑜𝑤𝑒𝑟
measured power consumption (W) at 3 data traffic
utilization, namely 0%, 50% and 100%
useful work is defined as total data rate (bps) based on
ITU-T L. 1310
Alliance for
Telecommun
ications
Industry
Solutions
(ATIS) ((ITU-T
L-1310 2014;
ITU-T L1310
2020)
18 Energy
Efficiency
Ratio of
Equipment
(EEER) EEER operation
energy
(secondary
energy)
Network:
router &
switch
Energy Efficiency of
Equipment routers &
switches
𝐸𝐸𝐸𝑅 =𝑇𝑜𝑡𝑎𝑙 𝑐𝑎𝑝𝑎𝑐𝑖𝑡𝑦 𝑜𝑓 𝑡ℎ𝑒 𝑖𝑛𝑡𝑒𝑟𝑓𝑎𝑐𝑒𝑠 𝑓𝑜𝑟 𝑎 𝑓𝑖𝑥𝑒𝑑 𝑐𝑜𝑛𝑓𝑢𝑔𝑟𝑎𝑡𝑖𝑜𝑛 𝑚𝑜𝑑𝑒𝑙
(𝑡ℎ𝑒 𝑠𝑢𝑚 𝑜𝑓 𝑖𝑛𝑡𝑒𝑟𝑓𝑎𝑐𝑒 𝑏𝑎𝑛𝑑𝑤𝑖𝑑𝑡ℎ)
𝑤𝑒𝑖𝑔ℎ𝑡𝑒𝑑 𝑚𝑒𝑎𝑠𝑢𝑟𝑒𝑑 𝑃𝑜𝑤𝑒𝑟 𝑜𝑓 3 𝑑𝑖𝑓𝑓𝑒𝑟𝑒𝑛𝑡 𝑡𝑟𝑎𝑓𝑓𝑖𝑐 𝑙𝑜𝑎𝑑𝑠
different traffic loads are defined depending on core
equipment or edge/access equipment
(ETSI ES 203
136 v1.2.1
2017)
19
Key
Performance
Indicators for
DC Efficiency
KPI4DC
E
whole life
cycle
The research
study
investigated
abiotic
resource
depletion
Server,
storage,
network
equipment,
Research study by
German federal
Environment Agency:
development, testing
and dissemination of a
practical KPI system for
𝑆𝑒𝑣𝑒𝑟 =𝑆𝑃𝐸𝐶𝑖𝑛𝑡_𝑟𝑎𝑡𝑒_𝑂𝑃𝑆𝑠𝑒𝑟𝑣𝑒𝑟
𝐺𝑊𝑃𝑠𝑒𝑟𝑣𝑒𝑟
𝑆𝑡𝑜𝑟𝑎𝑔𝑒 =𝑢𝑠𝑒𝑑 𝑠𝑡𝑜𝑟𝑎𝑔𝑒 𝑠𝑝𝑎𝑐𝑒𝑠𝑡𝑜𝑟𝑎𝑔𝑒
𝐺𝑊𝑃𝑠𝑡𝑜𝑟𝑎𝑔𝑒
(Schödwell
et al. 2018)

310
(ADP),
cumulative
energy
demand
(CED), GWP
and Water.
infrastructur
e
the reliable assessment
of the ecological
efficiency of DCs
𝑁𝑒𝑡𝑤𝑜𝑟𝑘 𝑒𝑞𝑢𝑖𝑝𝑚𝑒𝑛𝑡 =𝑇𝑟𝑎𝑛𝑠𝑓𝑒𝑟 𝑟𝑎𝑡𝑒𝑛𝑒𝑡𝑤𝑜𝑟𝑘 𝑒𝑞𝑢𝑖𝑝𝑚𝑒𝑛𝑡
𝐺𝑊𝑃𝑛𝑒𝑡𝑤𝑜𝑟𝑘 𝑒𝑞𝑢𝑖𝑝𝑚𝑒𝑛𝑡
𝐼𝑛𝑓𝑟𝑎𝑠𝑡𝑟𝑢𝑐𝑡𝑢𝑟𝑒 =𝐺𝑊𝑃𝐼𝑇
𝐺𝑊𝑃𝐼𝑇+𝐺𝑊𝑃𝐼𝑛𝑓𝑟𝑎𝑠𝑡𝑟𝑢𝑐𝑡𝑢𝑟𝑒
20
Corporate
Average DC
Efficiency CADE operation
energy
(secondary
energy) DC facility
A combination of the
utilization and efficiency
of the IT equipment and
of the facility. CADE
scores are then rated on
a five-tier system.
𝐶𝐴𝐷𝐸 = 𝐼𝑇 𝐴𝑠𝑠𝑒𝑡 𝐸𝑓𝑓𝑖𝑐𝑖𝑒𝑛𝑐𝑦 (𝐼𝑇 𝐴𝐸) ×
𝐹𝑎𝑐𝑖𝑙𝑖𝑡𝑦 𝐸𝑓𝑓𝑖𝑐𝑖𝑒𝑛𝑐𝑦 (𝐹𝐸)
𝐼𝑇 𝐴𝐸 = 𝐼𝑇 𝑒𝑛𝑒𝑟𝑔𝑦 𝑒𝑓𝑓𝑖𝑐𝑖𝑒𝑛𝑐𝑦 × 𝐼𝑇 𝑢𝑡𝑖𝑙𝑖𝑧𝑎𝑡𝑖𝑜𝑛
𝐹𝐸 = 𝐹𝑎𝑐𝑖𝑙𝑖𝑡𝑦 𝑒𝑛𝑒𝑟𝑔𝑦 𝑒𝑓𝑓𝑖𝑐𝑖𝑒𝑛𝑐𝑦 (𝐹𝐸𝐸) ×
𝐹𝑎𝑐𝑖𝑙𝑖𝑡𝑦 𝑢𝑡𝑖𝑙𝑖𝑧𝑎𝑡𝑖𝑜𝑛(𝐹𝑈)
(Brotherton
2013; Alger
2010)
21
DC Energy
Productivity* DCeP operation
energy
(secondary
energy) DC facility
quantifies useful work
that a DC produces
based on the amount of
energy it consumes.
𝐷𝐶𝑒𝑃
= 𝑈𝑠𝑒𝑓𝑢𝑙 𝑤𝑜𝑟𝑘 𝑝𝑟𝑜𝑑𝑢𝑐𝑒𝑑
𝑇𝑜𝑡𝑎𝑙 𝐷𝐶 𝐸𝑛𝑒𝑟𝑔𝑦 𝑐𝑜𝑛𝑠𝑢𝑚𝑒𝑑 𝑝𝑟𝑜𝑑𝑢𝑐𝑖𝑛𝑔 𝑡ℎ𝑖𝑠 𝑤𝑜𝑟𝑘
(The Green
Grid 2008;
Schödwell et
al. 2018)
22
DC energy
efficiency
and
productivity
(DC-EEP) DC-EEP operation
energy
(secondary
energy) DC facility
The delivered IT
Productivity “out” to
information users per
Watt of site
infrastructure energy
“in”.
𝐷𝐶 − 𝐸𝐸𝑃 = 𝑆𝐼 − 𝐸𝐸𝑅 × 𝐼𝑇 − 𝑃𝐸𝑊
𝐼𝑇 − 𝑃𝐸𝑊
= 𝑈𝑠𝑒𝑓𝑢𝑙 𝑤𝑜𝑟𝑘 (𝑇𝑟𝑎𝑛𝑠𝑎𝑐𝑡𝑖𝑜𝑛𝑠/𝐼𝑂/𝐶𝑦𝑐𝑙𝑒𝑠)
𝐼𝑇 𝐸𝑛𝑒𝑟𝑔𝑦 𝑐𝑜𝑛𝑠𝑢𝑚𝑒𝑑
𝑆𝐼 − 𝐸𝐸𝑅 = 𝑃𝑈𝐸
Uptime
institute
(Brill 2007)
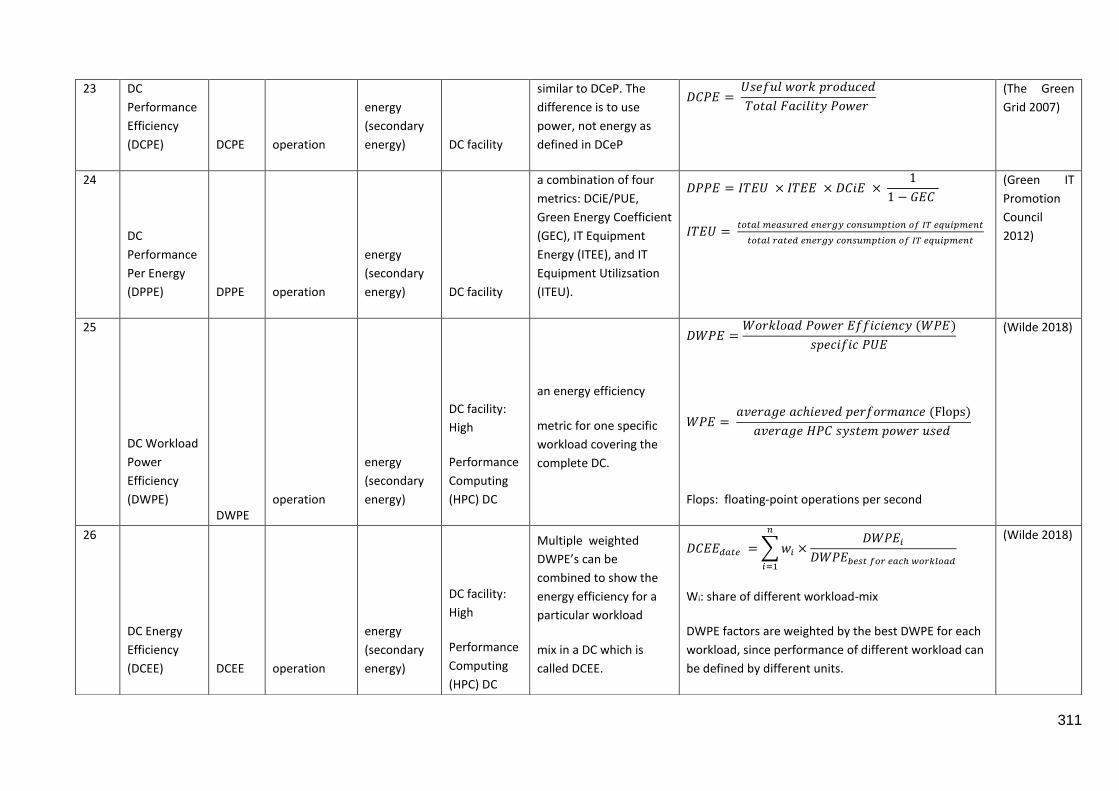
311
23 DC
Performance
Efficiency
(DCPE) DCPE operation
energy
(secondary
energy) DC facility
similar to DCeP. The
difference is to use
power, not energy as
defined in DCeP
𝐷𝐶𝑃𝐸 = 𝑈𝑠𝑒𝑓𝑢𝑙 𝑤𝑜𝑟𝑘 𝑝𝑟𝑜𝑑𝑢𝑐𝑒𝑑
𝑇𝑜𝑡𝑎𝑙 𝐹𝑎𝑐𝑖𝑙𝑖𝑡𝑦 𝑃𝑜𝑤𝑒𝑟
(The Green
Grid 2007)
24
DC
Performance
Per Energy
(DPPE) DPPE operation
energy
(secondary
energy) DC facility
a combination of four
metrics: DCiE/PUE,
Green Energy Coefficient
(GEC), IT Equipment
Energy (ITEE), and IT
Equipment Utilizsation
(ITEU).
𝐷𝑃𝑃𝐸 = 𝐼𝑇𝐸𝑈 × 𝐼𝑇𝐸𝐸 × 𝐷𝐶𝑖𝐸 × 1
1 − 𝐺𝐸𝐶
𝐼𝑇𝐸𝑈 = 𝑡𝑜𝑡𝑎𝑙 𝑚𝑒𝑎𝑠𝑢𝑟𝑒𝑑 𝑒𝑛𝑒𝑟𝑔𝑦 𝑐𝑜𝑛𝑠𝑢𝑚𝑝𝑡𝑖𝑜𝑛 𝑜𝑓 𝐼𝑇 𝑒𝑞𝑢𝑖𝑝𝑚𝑒𝑛𝑡
𝑡𝑜𝑡𝑎𝑙 𝑟𝑎𝑡𝑒𝑑 𝑒𝑛𝑒𝑟𝑔𝑦 𝑐𝑜𝑛𝑠𝑢𝑚𝑝𝑡𝑖𝑜𝑛 𝑜𝑓 𝐼𝑇 𝑒𝑞𝑢𝑖𝑝𝑚𝑒𝑛𝑡
(Green IT
Promotion
Council
2012)
25
DC Workload
Power
Efficiency
(DWPE) DWPE
operation
energy
(secondary
energy)
DC facility:
High
Performance
Computing
(HPC) DC
an energy efficiency
metric for one specific
workload covering the
complete DC.
𝐷𝑊𝑃𝐸 =𝑊𝑜𝑟𝑘𝑙𝑜𝑎𝑑 𝑃𝑜𝑤𝑒𝑟 𝐸𝑓𝑓𝑖𝑐𝑖𝑒𝑛𝑐𝑦 (𝑊𝑃𝐸)
𝑠𝑝𝑒𝑐𝑖𝑓𝑖𝑐 𝑃𝑈𝐸
𝑊𝑃𝐸 = 𝑎𝑣𝑒𝑟𝑎𝑔𝑒 𝑎𝑐ℎ𝑖𝑒𝑣𝑒𝑑 𝑝𝑒𝑟𝑓𝑜𝑟𝑚𝑎𝑛𝑐𝑒 (Flops)
𝑎𝑣𝑒𝑟𝑎𝑔𝑒 𝐻𝑃𝐶 𝑠𝑦𝑠𝑡𝑒𝑚 𝑝𝑜𝑤𝑒𝑟 𝑢𝑠𝑒𝑑
Flops: floating-point operations per second
(Wilde 2018)
26
DC Energy
Efficiency
(DCEE) DCEE operation
energy
(secondary
energy)
DC facility:
High
Performance
Computing
(HPC) DC
Multiple weighted
DWPE’s can be
combined to show the
energy efficiency for a
particular workload
mix in a DC which is
called DCEE.
𝐷𝐶𝐸𝐸𝑑𝑎𝑡𝑒 = ∑ 𝑤𝑖 ×𝐷𝑊𝑃𝐸𝑖
𝐷𝑊𝑃𝐸𝑏𝑒𝑠𝑡 𝑓𝑜𝑟 𝑒𝑎𝑐ℎ 𝑤𝑜𝑟𝑘𝑙𝑜𝑎𝑑
𝑛
𝑖=1
Wi: share of different workload-mix
DWPE factors are weighted by the best DWPE for each
workload, since performance of different workload can
be defined by different units.
(Wilde 2018)
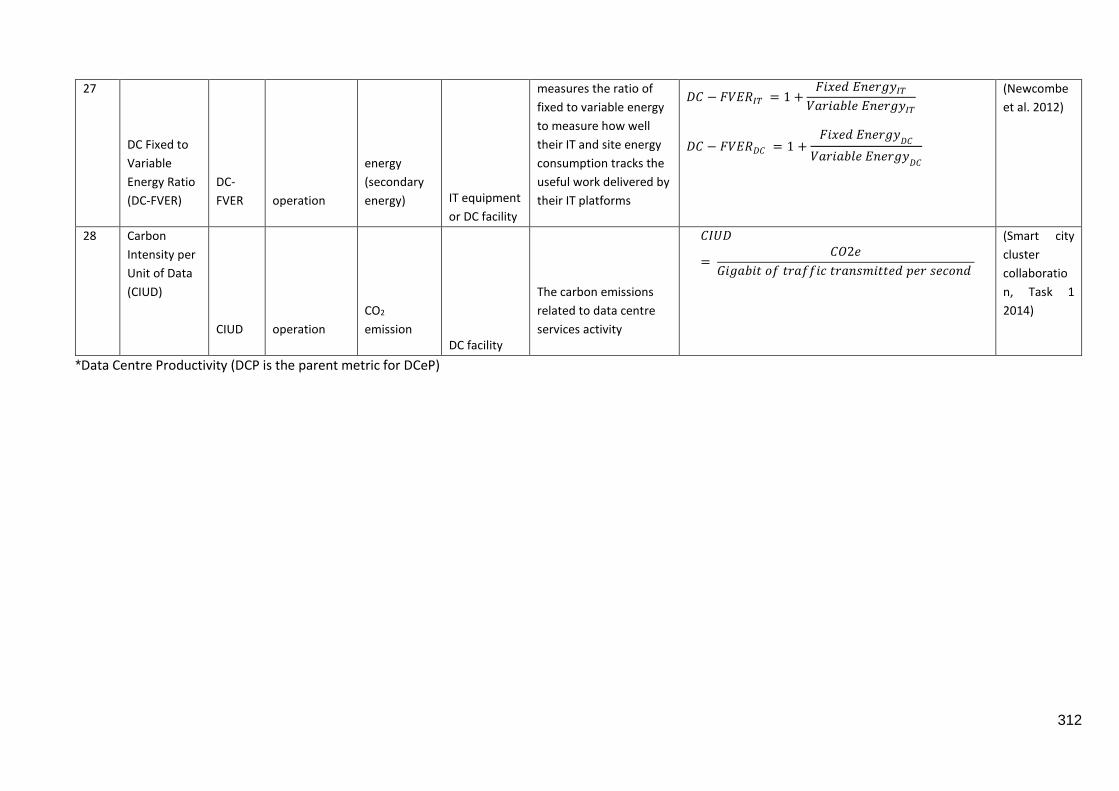
312
*Data Centre Productivity (DCP is the parent metric for DCeP)
27
DC Fixed to
Variable
Energy Ratio
(DC-FVER)
DC-
FVER operation
energy
(secondary
energy) IT equipment
or DC facility
measures the ratio of
fixed to variable energy
to measure how well
their IT and site energy
consumption tracks the
useful work delivered by
their IT platforms
𝐷𝐶 − 𝐹𝑉𝐸𝑅𝐼𝑇 = 1 +𝐹𝑖𝑥𝑒𝑑 𝐸𝑛𝑒𝑟𝑔𝑦𝐼𝑇
𝑉𝑎𝑟𝑖𝑎𝑏𝑙𝑒 𝐸𝑛𝑒𝑟𝑔𝑦𝐼𝑇
𝐷𝐶 − 𝐹𝑉𝐸𝑅𝐷𝐶 = 1 +𝐹𝑖𝑥𝑒𝑑 𝐸𝑛𝑒𝑟𝑔𝑦
𝐷𝐶
𝑉𝑎𝑟𝑖𝑎𝑏𝑙𝑒 𝐸𝑛𝑒𝑟𝑔𝑦𝐷𝐶
(Newcombe
et al. 2012)
28 Carbon
Intensity per
Unit of Data
(CIUD)
CIUD operation
CO2
emission DC facility
The carbon emissions
related to data centre
services activity
𝐶𝐼𝑈𝐷
= 𝐶𝑂2𝑒
𝐺𝑖𝑔𝑎𝑏𝑖𝑡 𝑜𝑓 𝑡𝑟𝑎𝑓𝑓𝑖𝑐 𝑡𝑟𝑎𝑛𝑠𝑚𝑖𝑡𝑡𝑒𝑑 𝑝𝑒𝑟 𝑠𝑒𝑐𝑜𝑛𝑑
(Smart city
cluster
collaboratio
n, Task 1
2014)
Annex 7: Task 1.2.1 References to telecom operators'
online public communication of green claims
BT Group (UK)
• https://www.bt.com/bt-plc/assets/documents/digital-impact-and-sustainability/our-
report/report-archive/2020/2020-dis-report.pdf
Deutsche Telekom AG (Germany)
• https://www.telekom.com/en/corporate-responsibility/climate-and-environment
• https://www.cr-bericht.telekom.com/site20/steuerung-fakten/strategie/cr-strategie-
steuerung#atn-16423-132
KPN (Netherlands)
• https://www.jaarverslag2020.kpn/downloads/Environmental-figures.pdf
• https://www.jaarverslag2019.kpn/downloads/Integrated-Annual-Report-2019-Single-
navigation1.pdf
Orange S.A. (France)
• https://www.orange.com/en/oranges-commitment-environment
• https://rai2019.orange.com/wp-
content/uploads/sites/38/2020/05/rai_orange2019_en_accessible.pdf
Swisscom AG (Switzerland)
• https://reports.swisscom.ch/de/2020/report/nachhaltigkeitsbericht/nachhaltigkeitsstrat
egie/ziele-tabelle
Telecom Italia S.p.A (Italy)
• https://www.gruppotim.it/content/dam/telecomitalia/en/archive/documents/sustainabilit
y/sustainability_reports/2019/NFS-TIM-2019.pdf
• https://www.gruppotim.it/content/dam/gt/sostenibilit%C3%A0/doc-obiettivi-e-
performance/2020/Environment-Domestic-BU-2019.pdf
Telefónica S.A. (Spain)
• https://www.telefonica.com/documents/153952/13347920/2019-Telefonica-
Consolidated-Management-Report.pdf
Telenor Group (Norway)
• https://www.telenor.com/wp-content/uploads/2020/06/Telenor-Sustainability-Report-
2019.pdf

Telia Company AB (Sweden)
• https://www.teliacompany.com/en/sustainability/
• http://annualreports.teliacompany.com/globalassets/2019/2019en/telia-company--
annual-and-sustainability-report-2019.pdf
Vodafone Group (UK)
• https://www.vodafone.com/our-purpose/planet/reducing-emissions-in-our-operations

Annex 8: Task 1.2.3 Standards and measurement
methodologies for the monitoring of environmental
footprint of electronic communications networks and
services Table 54: List of ECN-relevant standards and methodologies from the ITU and ETSI
considered
No. Titel Level network
Segment
covered
Equipment/System covered Environmental
aspects covered
1 ITU-T L.1310
(09/2020): Energy
efficiency metrics and
measurement
methods for
telecommunication
equipment
at the
equipme
nt and
system
levels
fixed and
mobile
networks
• DSLAM, MSAM GPON GEPON
equipment
• Wireless access technologies
• Routers, Ethernet switches
• WDM/TDM/OTN transport
MUXes/switches
• Converged packet optical equipment
operational energy
/ power
2 ITU-T L.1330
(03/2015): Energy
efficiency
measurement and
metrics for
telecommunication
networks
at the
network
level
mobile network •Within the scope of this
Recommendation are the radio access
parts of the mobile network, namely:
radio base stations, backhauling
systems, radio controllers and other
infrastructure radio site equipment.
The technologies covered are: global
system for mobile communications
(GSM), universal mobile
telecommunications communications
(UMTS) and long-term evolution (LTE)
(including LTE advanced (LTE-A)).
•Extrapolation for overall networks
operational energy
/ power
3 •ITU-T L.1331
(09/2020):
Assessment of
mobile network
energy efficiency
•ETSI ES 203 228
V1.3.1 (2020-10):
Assessment of
mobile network
energy efficiency
at the
network
level
mobile network •The analysis includes radio base
stations, backhauling systems, radio
controllers (RCs) and other
infrastructure radio site equipment.
The technologies involved are global
system for mobile communication
(GSM), universal mobile
telecommunications service (UMTS),
long term evolution (LTE) and 5G New
Radio (NR).
•Extrapolation for overall networks
operational energy
/ power
4 ITU-T L.1332
(01/2018): Total
network infrastructure
energy efficiency
metrics
at the
network
level
Network
infrastructure
• all telecommunication
(TLC)/information and
communications technology (ICT)
equipment in the network;
• all facilities equipment (e.g., cooling
systems, site monitoring systems, fire
protection and lighting systems;
• energy losses in DC power station or
AC UPS and in the power distribution;
• maintenance activities and site-visit
energy used for transportation (e.g.,
by car);
•operational
energy / power
•energy associated
with maintenance
activities

• diesel generators used for
emergency purposes.
5 ITU-T L.1350
(10/2016): Energy
efficiency metrics of a
base station site
at the
equipme
nt and
system
levels
mobile network:
Base station
Site
a base station site that normally
includes the following types of
equipment:
•Telecommunication equipment.
•Site equipment (e.g., air conditioners,
rectifiers, batteries, safety and
monitoring equipment).
operational energy
/ power
6 •ITU-T L.1361
(11/2018):
Measurement
method for energy
efficiency of network
functions
virtualization
•ETSI ES 203 539 -
V1.1.1 -
Environmental
Engineering (EE);
Measurement
method for energy
efficiency of Network
Functions
Virtualisation (NFV)
in laboratory
environment
at the
equipme
nt and
system
levels
virtualized
network
functions and
infrastructure
•The virtualized network functions
(VNFs) are the software
implementations of network functions
which run over the NFV infrastructure
(NFVI).
• NFVI includes any physical and
virtualized resources for supporting
the execution of the VNFs.
•operational
energy / power
•useful output of
VNFs depending
on the different
types of VNFs, e.g.
throughput (e.g.
bps) for a data
plante VNF, or
capacity (e.g.
number of
subscribers) for a
control plane VNF
7 ETSI EN 303 215
V1.3.1 (2015-04):
Measurement
methods and limits
for power
consumption in
broadband
telecommunication
networks equipment
at the
equipme
nt and
system
levels
fixed network The European Standard (EN)
considers DSLAM DSL, MSAN, GPON
OLT and Point to Point OLT
equipment.
operational energy
/ power
8 ETSI EN 303 472
V1.1.1 (2018-10):
Energy Efficiency
measurement
methodology and
metrics for RAN
equipment
at the
equipme
nt and
system
levels
radio access
network
only applicable to BS sites supporting
a single operator network.
operational energy
/ power
9 ETSI EN 305 200-2-2
V1.2.1 (2018-08):
Access, Terminals,
Transmission and
Multiplexing (ATTM);
Energy management;
Operational
infrastructures;
Global KPIs; Part 2:
Specific
requirements; Sub-
part 2: Fixed
at the
network
level
Fixed
broadband
access
networks
the energy consumption of NTE
(Network Telecommunications
Equipment) dedicated to each FAN
service at each OS (Operator Site), at
each NDN (Network Distribution Node)
and at each LOC (Last Operator
Connection point).
• energy
consumption;
• task
effectiveness;
• renewable
energy.
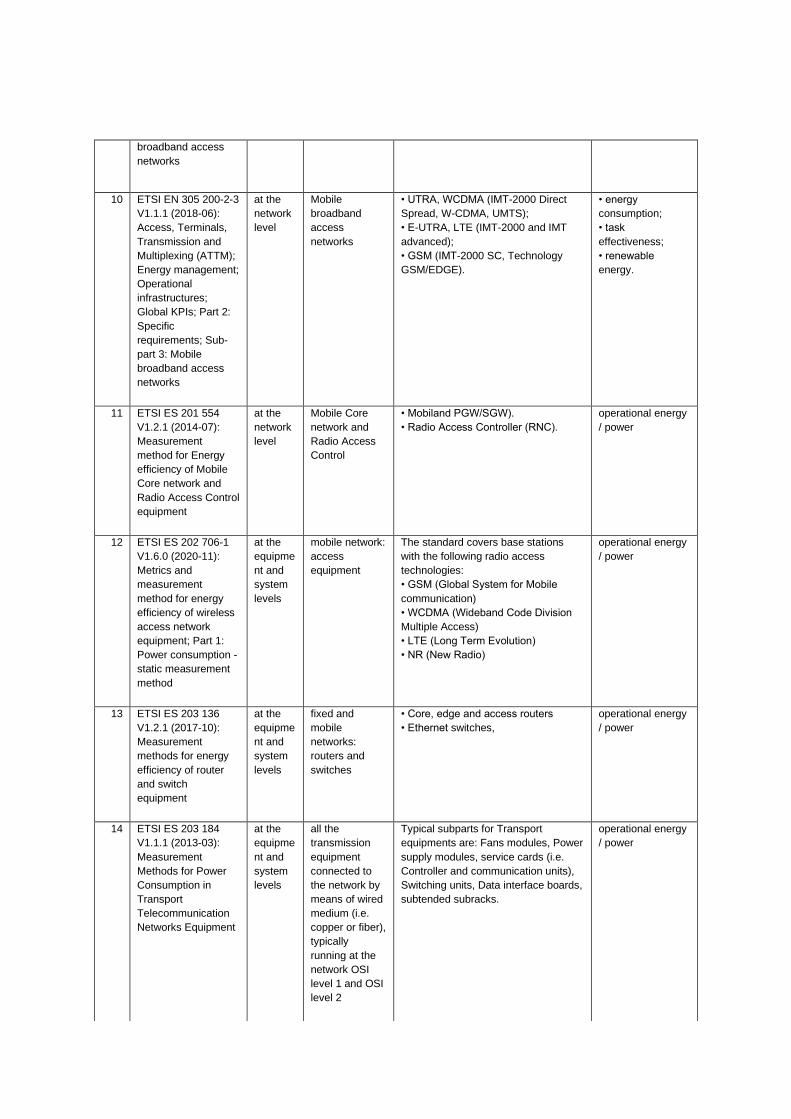
broadband access
networks
10 ETSI EN 305 200-2-3
V1.1.1 (2018-06):
Access, Terminals,
Transmission and
Multiplexing (ATTM);
Energy management;
Operational
infrastructures;
Global KPIs; Part 2:
Specific
requirements; Sub-
part 3: Mobile
broadband access
networks
at the
network
level
Mobile
broadband
access
networks
• UTRA, WCDMA (IMT-2000 Direct
Spread, W-CDMA, UMTS);
• E-UTRA, LTE (IMT-2000 and IMT
advanced);
• GSM (IMT-2000 SC, Technology
GSM/EDGE).
• energy
consumption;
• task
effectiveness;
• renewable
energy.
11 ETSI ES 201 554
V1.2.1 (2014-07):
Measurement
method for Energy
efficiency of Mobile
Core network and
Radio Access Control
equipment
at the
network
level
Mobile Core
network and
Radio Access
Control
• Mobiland PGW/SGW).
• Radio Access Controller (RNC).
operational energy
/ power
12 ETSI ES 202 706-1
V1.6.0 (2020-11):
Metrics and
measurement
method for energy
efficiency of wireless
access network
equipment; Part 1:
Power consumption -
static measurement
method
at the
equipme
nt and
system
levels
mobile network:
access
equipment
The standard covers base stations
with the following radio access
technologies:
• GSM (Global System for Mobile
communication)
• WCDMA (Wideband Code Division
Multiple Access)
• LTE (Long Term Evolution)
• NR (New Radio)
operational energy
/ power
13 ETSI ES 203 136
V1.2.1 (2017-10):
Measurement
methods for energy
efficiency of router
and switch
equipment
at the
equipme
nt and
system
levels
fixed and
mobile
networks:
routers and
switches
• Core, edge and access routers
• Ethernet switches,
operational energy
/ power
14 ETSI ES 203 184
V1.1.1 (2013-03):
Measurement
Methods for Power
Consumption in
Transport
Telecommunication
Networks Equipment
at the
equipme
nt and
system
levels
all the
transmission
equipment
connected to
the network by
means of wired
medium (i.e.
copper or fiber),
typically
running at the
network OSI
level 1 and OSI
level 2
Typical subparts for Transport
equipments are: Fans modules, Power
supply modules, service cards (i.e.
Controller and communication units),
Switching units, Data interface boards,
subtended subracks.
operational energy
/ power

15 ETSI TS 102 706-2
V1.5.1 (2018-11):
Metrics and
Measurement
Method for Energy
Efficiency of Wireless
Access Network
Equipment; Part 2:
Energy Efficiency -
dynamic
measurement
method
at the
equipme
nt and
system
levels
mobile network:
access
equipment
This TS covers LTE radio access
technology.
The total energy consumption of the
base station will be the sum of
weighted energy consumption for each
traffic level i.e. low, medium and busy-
hour traffic.
operational energy
/ power
16 ETSI EN 305 174-8
V1.1.1 (2018-01):
Access, Terminals,
Transmission and
Multiplexing (ATTM);
Broadband
Deployment and
Lifecycle Resource
Management;
Part 8: Management
of end of life of ICT
equipment (ICT
waste/end of life)
at the
equipme
nt and
system
levels
general ICT
equipment
WEEE within ICT sites, core and
access networks
Management of
WEEE
calculation of
recycling and
recovery rates
ITU-T L.1310 (09/2020): Energy efficiency metrics and measurement methods for
telecommunication equipment
Name of Initiative/
Methodology Recommendation ITU-T L.1310 (ITU-T L1310 2020)
Link https://www.itu.int/rec/T-REC-L.1310-202009-I/en
Region/ Country of
implementation International
Developed by
Government Industry Association
National National
Multi-national Multi-national
Others (Specify)
Compliance Mandatory Voluntary
Verification Self-Declaration Third Party Verification
Scope Manufacturing Use End-of-Life
Environmental Focus GWP
Other environmental impacts
Energy consumption
General Description Energy efficiency metrics and measurement methods are defined for
telecommunication network equipment and small networking equipment. These
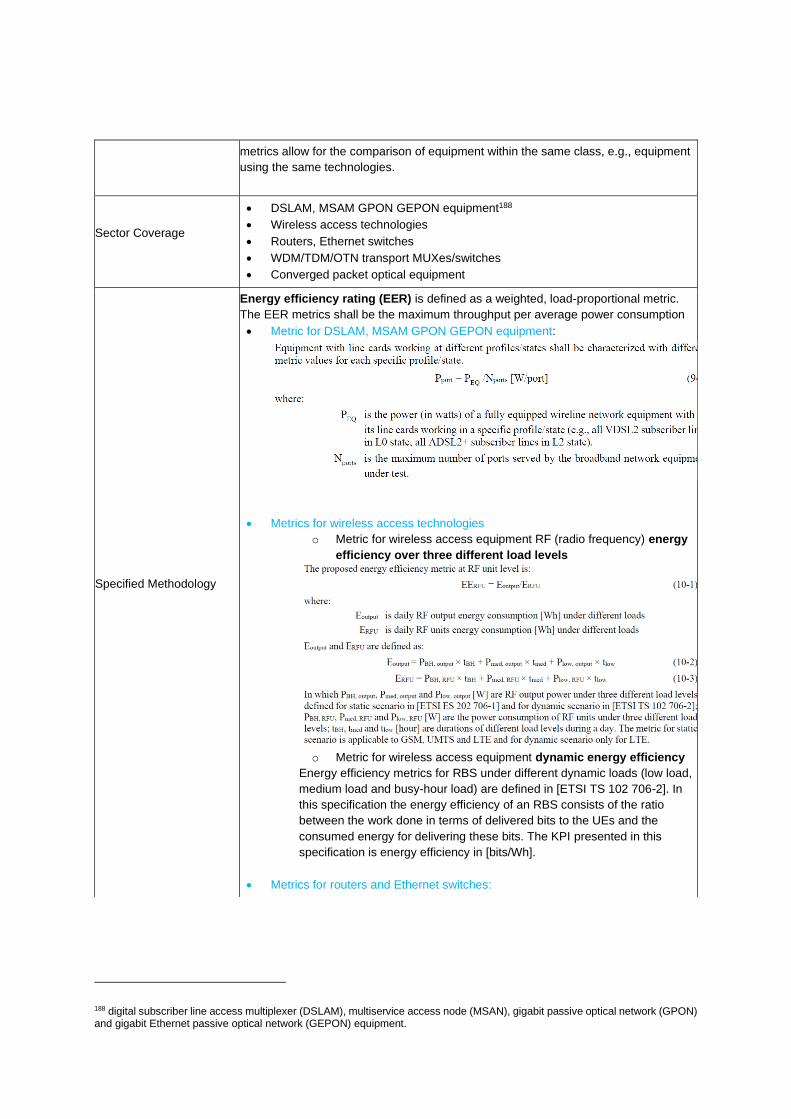
188 digital subscriber line access multiplexer (DSLAM), multiservice access node (MSAN), gigabit passive optical network (GPON) and gigabit Ethernet passive optical network (GEPON) equipment.
metrics allow for the comparison of equipment within the same class, e.g., equipment
using the same technologies.
Sector Coverage
• DSLAM, MSAM GPON GEPON equipment188
• Wireless access technologies
• Routers, Ethernet switches
• WDM/TDM/OTN transport MUXes/switches
• Converged packet optical equipment
Specified Methodology
Energy efficiency rating (EER) is defined as a weighted, load-proportional metric.
The EER metrics shall be the maximum throughput per average power consumption
• Metric for DSLAM, MSAM GPON GEPON equipment:
• Metrics for wireless access technologies
o Metric for wireless access equipment RF (radio frequency) energy
efficiency over three different load levels
o Metric for wireless access equipment dynamic energy efficiency
Energy efficiency metrics for RBS under different dynamic loads (low load,
medium load and busy-hour load) are defined in [ETSI TS 102 706-2]. In
this specification the energy efficiency of an RBS consists of the ratio
between the work done in terms of delivered bits to the UEs and the
consumed energy for delivering these bits. The KPI presented in this
specification is energy efficiency in [bits/Wh].
• Metrics for routers and Ethernet switches:
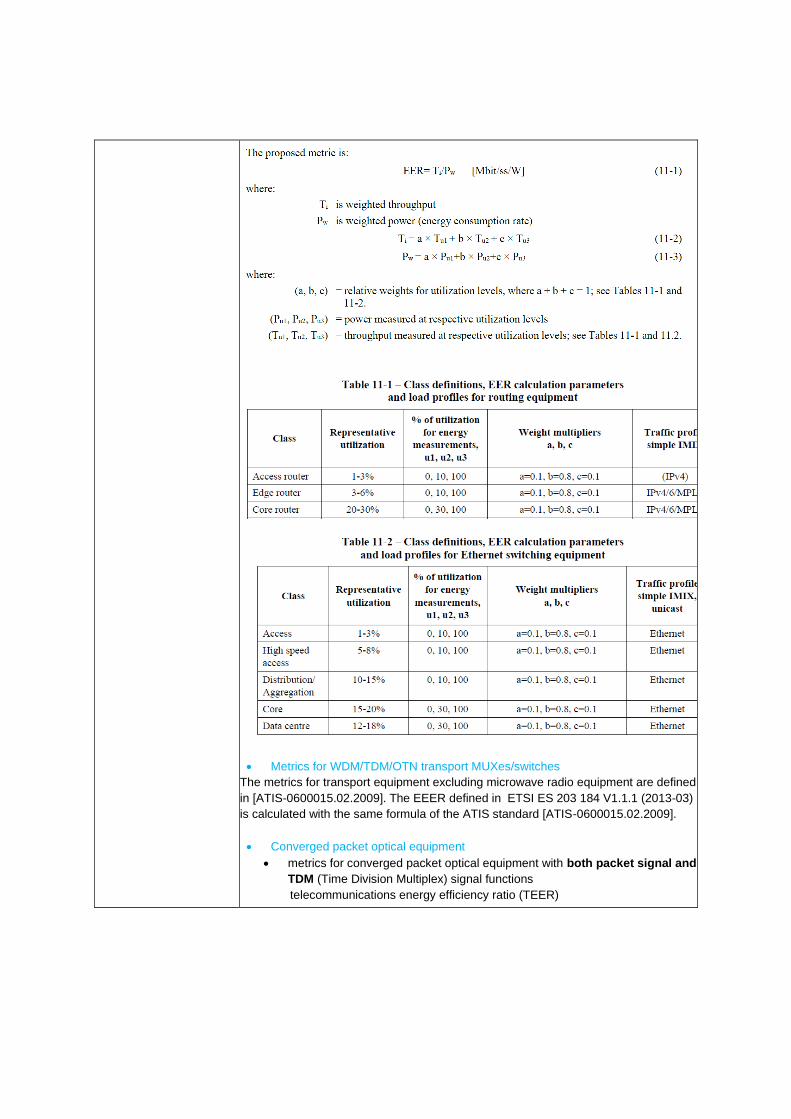
• Metrics for WDM/TDM/OTN transport MUXes/switches
The metrics for transport equipment excluding microwave radio equipment are defined
in [ATIS-0600015.02.2009]. The EEER defined in ETSI ES 203 184 V1.1.1 (2013-03)
is calculated with the same formula of the ATIS standard [ATIS-0600015.02.2009].
• Converged packet optical equipment
• metrics for converged packet optical equipment with both packet signal and
TDM (Time Division Multiplex) signal functions
telecommunications energy efficiency ratio (TEER)

• metrics for converged packet optical equipment with packet signal, TDM
signal and wavelength division multiplexing (WDM) signal
Interaction with other
methodologies
• Metrics for RBS under different dynamic loads (low load, medium load and
busy-hour load) are defined in [ETSI TS 102 706-2].
• Power consumption metrics for GSM, UMTS and LTE RBS at static load are
defined in [ETSI ES 202 706-1].
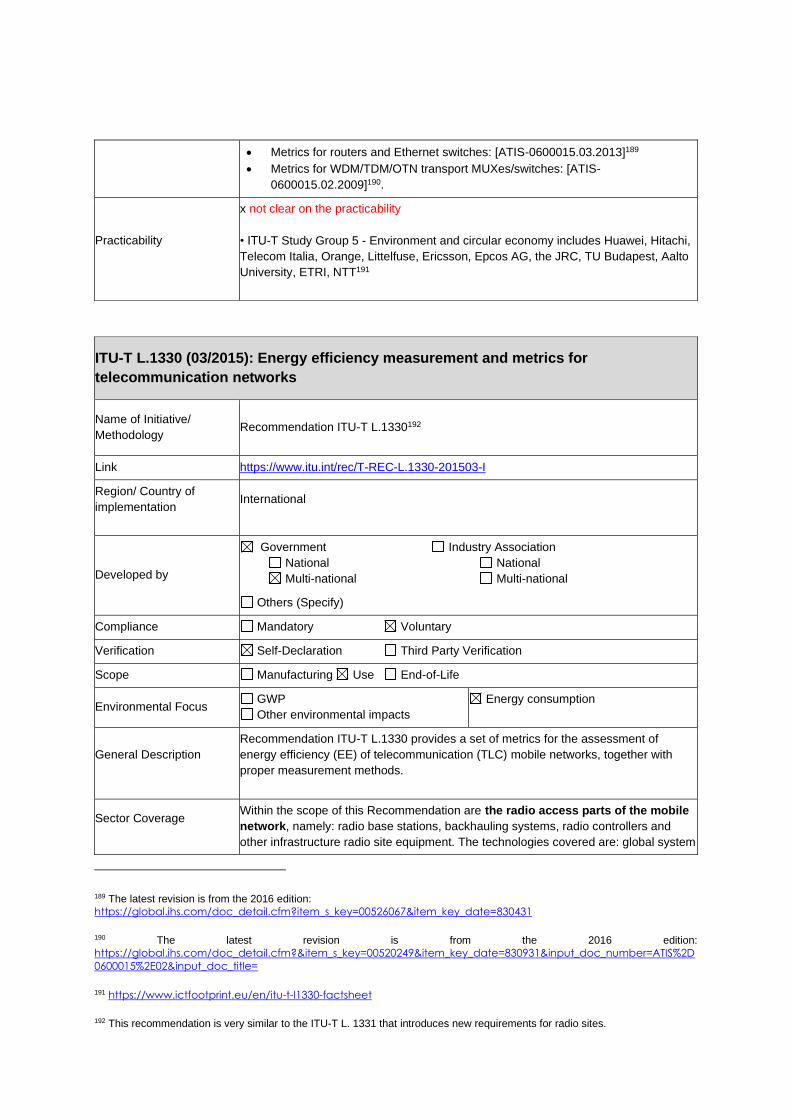
189 The latest revision is from the 2016 edition:
https://global.ihs.com/doc_detail.cfm?item_s_key=00526067&item_key_date=830431
190 The latest revision is from the 2016 edition:
https://global.ihs.com/doc_detail.cfm?&item_s_key=00520249&item_key_date=830931&input_doc_number=ATIS%2D
0600015%2E02&input_doc_title=
191 https://www.ictfootprint.eu/en/itu-t-l1330-factsheet
192 This recommendation is very similar to the ITU-T L. 1331 that introduces new requirements for radio sites.
• Metrics for routers and Ethernet switches: [ATIS-0600015.03.2013]189
• Metrics for WDM/TDM/OTN transport MUXes/switches: [ATIS-
0600015.02.2009]190.
Practicability
x not clear on the practicability
• ITU-T Study Group 5 - Environment and circular economy includes Huawei, Hitachi,
Telecom Italia, Orange, Littelfuse, Ericsson, Epcos AG, the JRC, TU Budapest, Aalto
University, ETRI, NTT191
ITU-T L.1330 (03/2015): Energy efficiency measurement and metrics for
telecommunication networks
Name of Initiative/
Methodology Recommendation ITU-T L.1330192
Link https://www.itu.int/rec/T-REC-L.1330-201503-I
Region/ Country of
implementation International
Developed by
Government Industry Association
National National
Multi-national Multi-national
Others (Specify)
Compliance Mandatory Voluntary
Verification Self-Declaration Third Party Verification
Scope Manufacturing Use End-of-Life
Environmental Focus GWP
Other environmental impacts
Energy consumption
General Description
Recommendation ITU-T L.1330 provides a set of metrics for the assessment of
energy efficiency (EE) of telecommunication (TLC) mobile networks, together with
proper measurement methods.
Sector Coverage Within the scope of this Recommendation are the radio access parts of the mobile
network, namely: radio base stations, backhauling systems, radio controllers and
other infrastructure radio site equipment. The technologies covered are: global system
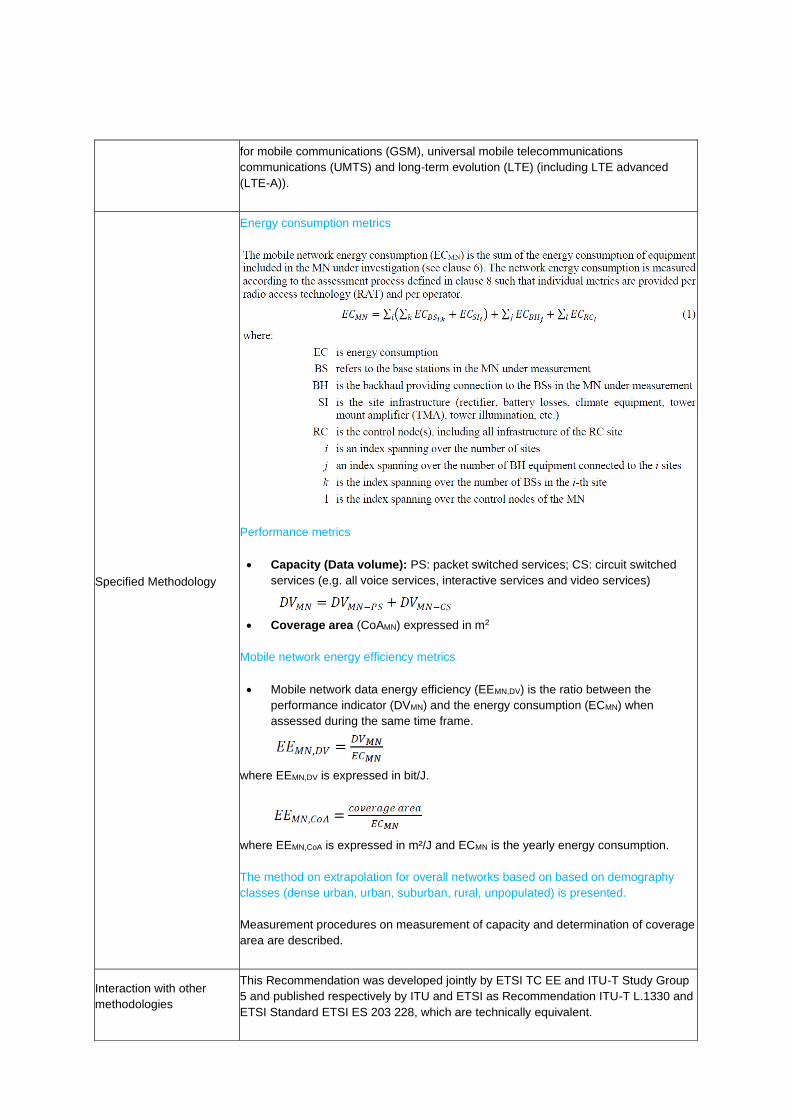
for mobile communications (GSM), universal mobile telecommunications
communications (UMTS) and long-term evolution (LTE) (including LTE advanced
(LTE-A)).
Specified Methodology
Energy consumption metrics
Performance metrics
• Capacity (Data volume): PS: packet switched services; CS: circuit switched
services (e.g. all voice services, interactive services and video services)
• Coverage area (CoAMN) expressed in m2
Mobile network energy efficiency metrics
• Mobile network data energy efficiency (EEMN,DV) is the ratio between the
performance indicator (DVMN) and the energy consumption (ECMN) when
assessed during the same time frame.
where EEMN,DV is expressed in bit/J.
where EEMN,CoA is expressed in m²/J and ECMN is the yearly energy consumption.
The method on extrapolation for overall networks based on based on demography
classes (dense urban, urban, suburban, rural, unpopulated) is presented.
Measurement procedures on measurement of capacity and determination of coverage
area are described.
Interaction with other
methodologies
This Recommendation was developed jointly by ETSI TC EE and ITU-T Study Group
5 and published respectively by ITU and ETSI as Recommendation ITU-T L.1330 and
ETSI Standard ETSI ES 203 228, which are technically equivalent.

DVMN can be derived from standard counters defined in [ETSI TS 132 425] and
[ETSI TS 132 412] for LTE or equivalent used for 2G and 3G, multiplying by the
measurement duration T.
Practicability x not clear on the practicability
ITU-T L.1331 (09/2020): Assessment of mobile network energy efficiency
ETSI ES 203 228 V1.3.1 (2020-10): Assessment of mobile network energy efficiency
Name of Initiative/
Methodology
Recommendation ITU-T L.1331 and ETSI ES 230 228 V1.3.1 are technically
equivalent.
Link
https://www.itu.int/rec/T-REC-L.1331/en
https://www.etsi.org/deliver/etsi_es/203200_203299/203228/01.03.01_60/es_203228v
010301p.pdf
Region/ Country of
implementation International
Developed by
Government Industry Association
National National
Multi-national Multi-national
Others (Specify)
Compliance Mandatory Voluntary
Verification Self-Declaration Third Party Verification
Scope Manufacturing Use End-of-Life
Environmental Focus GWP
Other environmental impacts
Energy consumption
General Description
ITU-T L.1331 considers the definition of metrics and methods used to measure energy
performance of mobile radio access networks and adopts an approach based on the
measurement of such performance on small networks, for feasibility and simplicity
purposes.
ITU-T L.1331 also provides a method to extrapolate the assessment of energy
efficiency to wider networks ( (i.e. the network in a geographic area, the network in a
whole country, the network of a MNO (mobile network operator), etc.).
Sector Coverage
The analysis includes radio base stations, backhauling systems, radio controllers
(RCs) and other infrastructure radio site equipment. The technologies involved are
global system for mobile communication (GSM), universal mobile telecommunications
service (UMTS), long term evolution (LTE) and 5G New Radio (NR).
Equipment to be included in the Mobile Network under investigation:
• Base Stations (Wide area BS, Medium range BS, Local Area BS)
• Site equipment (air conditioners, rectifiers/batteries, fixed network equipment,
etc.).
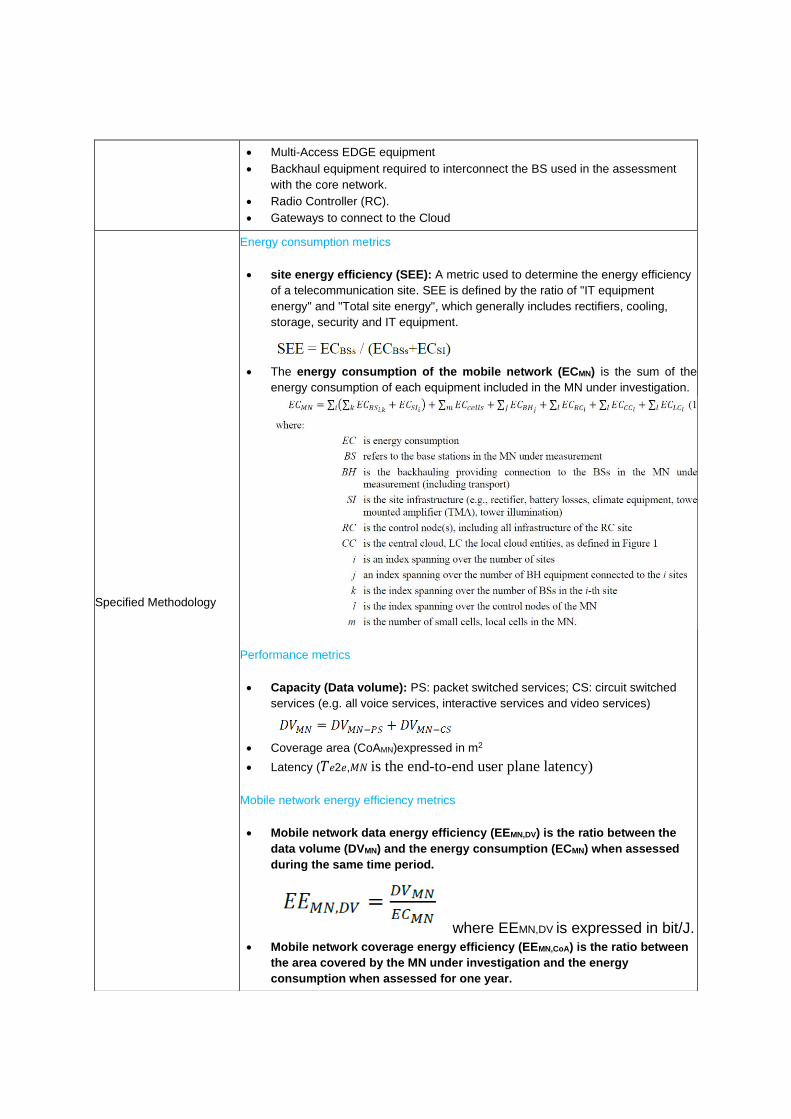
• Multi-Access EDGE equipment
• Backhaul equipment required to interconnect the BS used in the assessment
with the core network.
• Radio Controller (RC).
• Gateways to connect to the Cloud
Specified Methodology
Energy consumption metrics
• site energy efficiency (SEE): A metric used to determine the energy efficiency
of a telecommunication site. SEE is defined by the ratio of "IT equipment
energy" and "Total site energy", which generally includes rectifiers, cooling,
storage, security and IT equipment.
• The energy consumption of the mobile network (ECMN) is the sum of the
energy consumption of each equipment included in the MN under investigation.
Performance metrics
• Capacity (Data volume): PS: packet switched services; CS: circuit switched
services (e.g. all voice services, interactive services and video services)
• Coverage area (CoAMN)expressed in m2
• Latency (𝑇𝑒2𝑒,𝑀𝑁 is the end-to-end user plane latency)
Mobile network energy efficiency metrics
• Mobile network data energy efficiency (EEMN,DV) is the ratio between the
data volume (DVMN) and the energy consumption (ECMN) when assessed
during the same time period.
where EEMN,DV is expressed in bit/J. • Mobile network coverage energy efficiency (EEMN,CoA) is the ratio between
the area covered by the MN under investigation and the energy
consumption when assessed for one year.

where EEMN,CoA is expressed
in m²/J
• Latency based metric is the inverse ratio of the end-to-end user plane
latency and the energy consumed by the MN.
where 𝐸𝐸𝑀𝑁,𝐿 is expressed in
ms-1/J.
Extrapolation for overall networks
The sub-network data is extrapolated to overall/total networks according to
demography (5 classes: dense urban, urban, suburban, rural, unpopulated),
topography (3 classes: Flat, Rolling, Mountainous) and climate classifications (5
classes: Tropical, dry, temperate, cold, polar). The extrapolation is done according to
statistical information that indicates how recurrent the sub-network is within the total
network to be addressed.
Interaction with other
methodologies
Recommendation ITU-T L.1331 was developed jointly by ETSI TC EE and ITU-T
Study Group 5 and published by ITU and ETSI as Recommendation ITU-T L.1331
and ETSI Standard ETSI ES 203 228 respectively, which are technically equivalent.
DVMN can be derived from standard counters defined in [ETSI TS 132 425] and
[ETSI TS 132 412] for LTE or equivalent used for 2G and 3G, multiplying by the
measurement duration T. The counters (in [ETSI TS 132 425] and [ETSI TS 132 412])
also account for the quality of service (QoS) being reported in the QoS class identifier
(QCI) basis (see [ETSI TS 123 203]). For 5G non virtualized environments, the DV
can be derived from [b-ETSI TS 128 552].
The measurements in testing laboratories of the efficiency of the Base Stations is the
topic treated in ETSI ES 202 706
Practicability Huawei calculated and published SIEE according to ETSI ES 203 228
https://www.huawei.com/minisite/icteef2016/en/topics2.html

ITU-T L.1332 (01/2018): Total network infrastructure energy efficiency metrics
Name of Initiative/
Methodology Recommendation ITU-T L.1332
Link https://www.itu.int/rec/T-REC-L.1332-201801-I
Region/ Country of
implementation International
Developed by
Government Industry Association
National National
Multi-national Multi-national
Others (Specify)
Compliance Mandatory Voluntary
Verification Self-Declaration Third Party Verification
Scope Manufacturing Use including maintenance activities (site-visit) End-of-
Life
Environmental Focus GWP
Other environmental impacts
Energy consumption
General Description
This Recommendation specifies principles and concepts of energy efficiency metrics
and measurement methods to evaluate the energy efficiency of an entire network
consisting of telecommunication equipment and infrastructure equipment.
Sector Coverage
Recommendation ITU-T L.1332 contains the basic definition of energy efficiency
metrics and measurement methods required to evaluate the energy efficiency of a
total network, including the energy consumption for:
• all telecommunication (TLC)/information and communications technology (ICT)
equipment in the network;
• all facilities equipment (e.g., cooling systems, site monitoring systems, fire
protection and lighting systems;
• energy losses in DC power station or AC UPS and in the power distribution;
• maintenance activities and site-visit energy used for transportation (e.g., by car);
• diesel generators used for emergency purposes.
Specified Methodology Total network infrastructure energy efficiency definition (NIEE)

ICT Load energy consumption
the energy consumption of AC load (EloadAC) and the energy consumption of DC load
(EloadDC)
Total network energy consumption
Global indicator relationship

ITU-T L.1350 (10/2016): Energy efficiency metrics of a base station site
Name of Initiative/
Methodology Recommendation ITU-T L.1350
Link https://www.itu.int/rec/T-REC-L.1350-201610-I
Region/ Country of
implementation International
Developed by
Government Industry Association
National National
Multi-national Multi-national
Others (Specify)
Compliance Mandatory Voluntary
Verification Self-Declaration Third Party Verification
Scope Manufacturing Use End-of-Life
Environmental Focus GWP
Other environmental impacts
Energy consumption
General Description
This Recommendation specifies principles and concepts of energy efficiency metrics
used to evaluate the energy efficiency of a base station site considering the energy
consumption for:
• the telecom equipment inside the base station site e.g., backhaul and base station
equipment;
• the entire infrastructure, including cooling systems, monitoring systems (for power
consumption, equipment running status, environment parameters, etc.), fire
protection and lighting systems for all the sites;
• energy losses due to AC/DC rectifiers, generators and cable losses.
Sector Coverage
The metrics developed in this Recommendation consider a base station site that
normally includes the following types of equipment:
• Telecommunication equipment.
• Site equipment (e.g., air conditioners, rectifiers, batteries, safety and monitoring
equipment).
Interaction with other
methodologies
• ICT energy consumption shall be directly measured or reported by using the
measurement defined in [b-ETSI ES 202 336-12].
• The term Σ𝑇𝑠/Σ𝐸𝑇𝑠 is the network telecom energy efficiency indicator and can be
obtained using the methodology defined in [ITU-T L.1330].
Practicability x not clear on the practicability
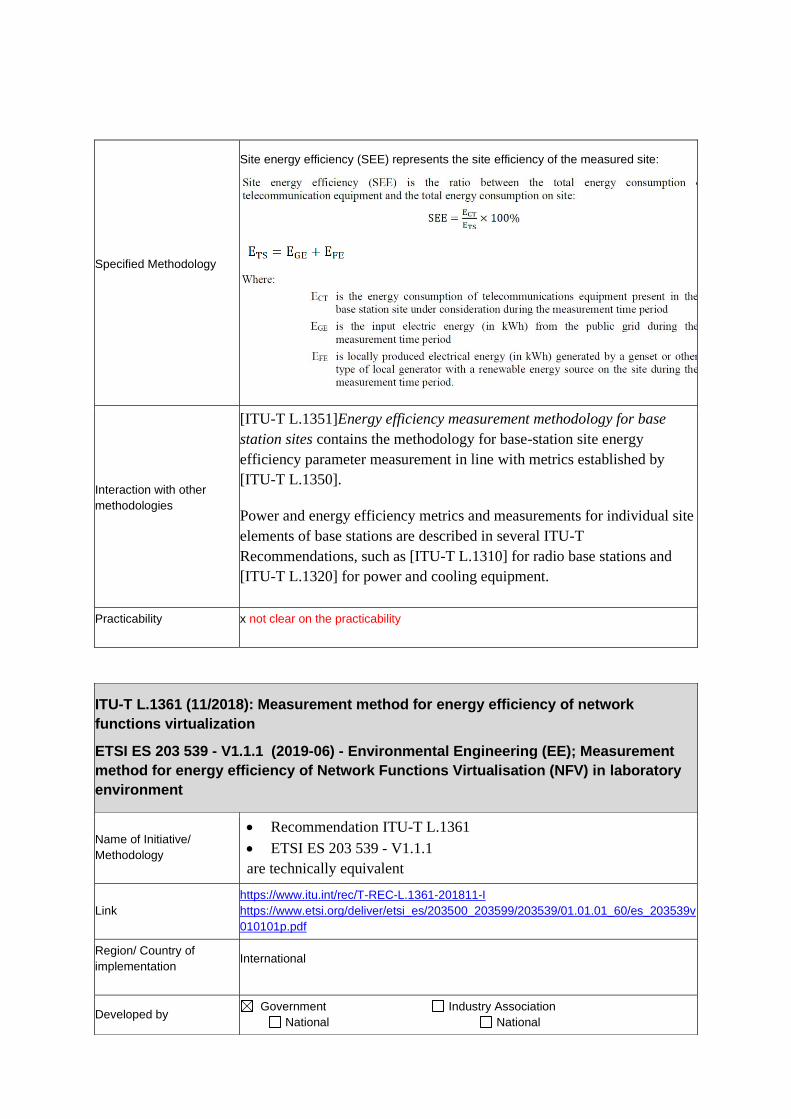
Specified Methodology
Site energy efficiency (SEE) represents the site efficiency of the measured site:
Interaction with other
methodologies
[ITU-T L.1351]Energy efficiency measurement methodology for base
station sites contains the methodology for base-station site energy
efficiency parameter measurement in line with metrics established by
[ITU-T L.1350].
Power and energy efficiency metrics and measurements for individual site
elements of base stations are described in several ITU-T
Recommendations, such as [ITU-T L.1310] for radio base stations and
[ITU-T L.1320] for power and cooling equipment.
Practicability x not clear on the practicability
ITU-T L.1361 (11/2018): Measurement method for energy efficiency of network
functions virtualization
ETSI ES 203 539 - V1.1.1 (2019-06) - Environmental Engineering (EE); Measurement
method for energy efficiency of Network Functions Virtualisation (NFV) in laboratory
environment
Name of Initiative/
Methodology
• Recommendation ITU-T L.1361
• ETSI ES 203 539 - V1.1.1
are technically equivalent
Link
https://www.itu.int/rec/T-REC-L.1361-201811-I
https://www.etsi.org/deliver/etsi_es/203500_203599/203539/01.01.01_60/es_203539v
010101p.pdf
Region/ Country of
implementation International
Developed by Government Industry Association
National National

Multi-national Multi-national
Others (Specify)
Compliance Mandatory Voluntary
Verification Self-Declaration Third Party Verification
Scope Manufacturing Use End-of-Life
Environmental Focus GWP
Other environmental impacts
Energy consumption
General Description
Network functions virtualization (NFV) changes the traditional telecom
network architecture by replacing physical equipment with network
functions running on a standard server platform. Three main domains are
identified in high-level NFV architecture.
• The virtualized network functions (VNFs) are the software
implementations of network functions which run over the NFV
infrastructure (NFVI).
• NFVI includes any physical and virtualized resources for supporting
the execution of the VNFs.
• NFV management and orchestration (MANO) covers the orchestration
and lifecycle management of physical and/or software resources that
support the infrastructure virtualization and the lifecycle management
of VNF itself.
The three decoupled elements, connected through standardized and open
interfaces, can be provided by different vendors. VNFs and NFVI are the
dominant parts from an energy consumption point of view.
Sector Coverage
This Recommendation defines the metrics and measurement methods for
the evaluation of the energy efficiency of functional components of a
network functions virtualization (NFV) environment. The
Recommendation is not try to cover all different types of VNFs
(Virtualized Network Functions) (e.g., firewall, gateway, etc.), but it does
provide the basis to make an extensible definition.
Specified Methodology
There are two methods to indirectly measure energy consumption of a
VNF:
• Measure the energy consumption of NFVI which only deploys a VNF
under test.
• Measure the resource consumption of a VNF under test which runs
solely on a NFVI platform.
Energy efficiency of NFVI can be expressed as the service capacity of
reference VNFs running on it with the amount of energy consumption.

Metrics for VNF energy efficiency
The VNF's energy efficiency ratio (EER) metric is defined as:
Metrics for VNF resource efficiency
The VNF's resource efficiency ratio (RER) metric can be defined as:
Metrics for NFVI energy efficiency
The NFVI's energy efficiency ratio (EER) metric is defined as:

ETSI EN 303 215 V1.3.1 (2015-04): Measurement methods and limits for power
consumption in broadband telecommunication networks equipment
Name of Initiative/
Methodology
Measurement methods and limits for power consumption in broadband
telecommunication networks equipment
Link https://www.etsi.org/deliver/etsi_en/303200_303299/303215/01.03.01_60/en_303215
v010301p.pdf
Region/ Country of
implementation International
Developed by
Government Industry Association
National National
Multi-national Multi-national
Others (Specify)
Interaction with other
methodologies
𝑅𝑐𝑝𝑢 is calculated as average CPU utilization, see clause 6.6 of [ETSI GS
NFV-TST 008], multiplied by clock speed in megahertz (MHz) of CPU
and number of cores.
𝑅𝑚𝑒𝑚𝑜𝑟𝑦 is total memory used by VNF, which is derived from other
memory metrics, see clause 8.6 of [ETSI GS NFV-TST 008].
𝑅𝑠𝑡𝑜𝑟𝑎𝑔𝑒 is the amount of disk occupied by VNF on the host machine, see
Annex A in [ETSI GS NFV-IFA 027]. As the methods of measurement
for storage systems vary widely and depend on the implementation,
storage metrics are not defined in [ETSI GS NFV-TST 008].
𝑅𝑛𝑒𝑡𝑤𝑜𝑟𝑘 is the average network throughput of bytes transmitted and
received per second by VNF external connection point, see clause 7.2 of
[ETSI GS NFV-TST 008].
Practicability x not clear on the practicability
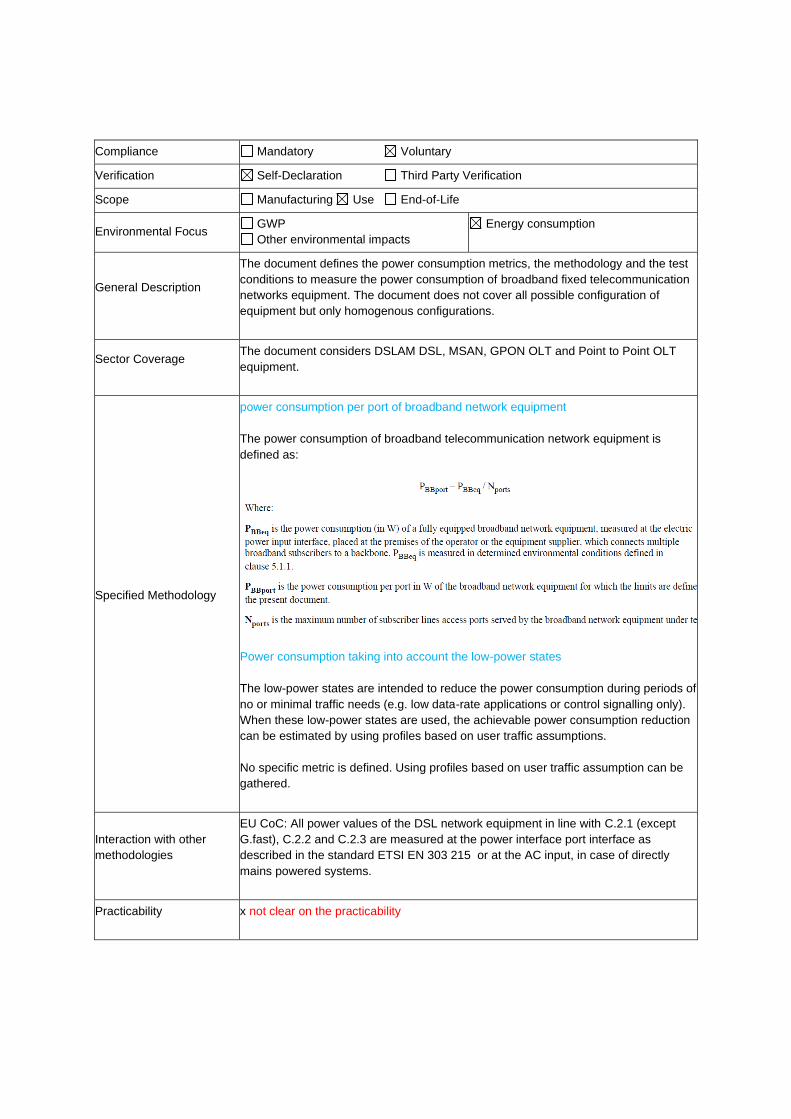
Compliance Mandatory Voluntary
Verification Self-Declaration Third Party Verification
Scope Manufacturing Use End-of-Life
Environmental Focus GWP
Other environmental impacts
Energy consumption
General Description
The document defines the power consumption metrics, the methodology and the test
conditions to measure the power consumption of broadband fixed telecommunication
networks equipment. The document does not cover all possible configuration of
equipment but only homogenous configurations.
Sector Coverage The document considers DSLAM DSL, MSAN, GPON OLT and Point to Point OLT
equipment.
Specified Methodology
power consumption per port of broadband network equipment
The power consumption of broadband telecommunication network equipment is
defined as:
Power consumption taking into account the low-power states
The low-power states are intended to reduce the power consumption during periods of
no or minimal traffic needs (e.g. low data-rate applications or control signalling only).
When these low-power states are used, the achievable power consumption reduction
can be estimated by using profiles based on user traffic assumptions.
No specific metric is defined. Using profiles based on user traffic assumption can be
gathered.
Interaction with other
methodologies
EU CoC: All power values of the DSL network equipment in line with C.2.1 (except
G.fast), C.2.2 and C.2.3 are measured at the power interface port interface as
described in the standard ETSI EN 303 215 or at the AC input, in case of directly
mains powered systems.
Practicability x not clear on the practicability
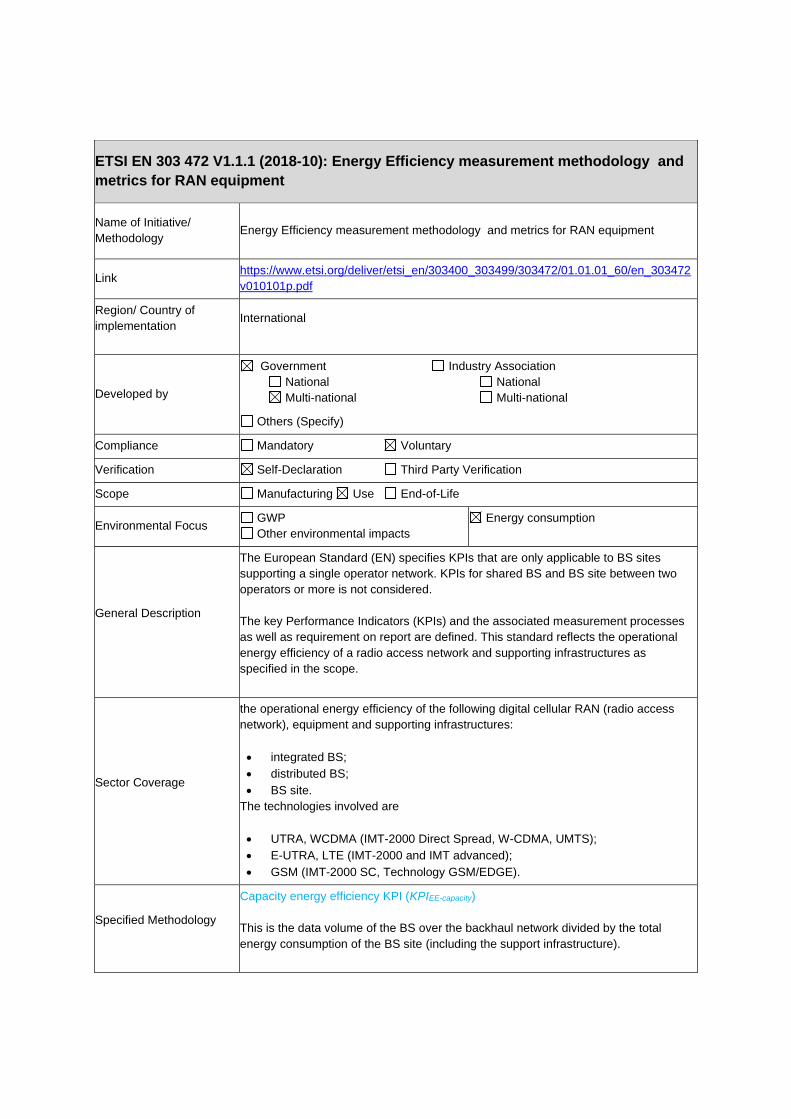
ETSI EN 303 472 V1.1.1 (2018-10): Energy Efficiency measurement methodology and
metrics for RAN equipment
Name of Initiative/
Methodology Energy Efficiency measurement methodology and metrics for RAN equipment
Link https://www.etsi.org/deliver/etsi_en/303400_303499/303472/01.01.01_60/en_303472
v010101p.pdf
Region/ Country of
implementation International
Developed by
Government Industry Association
National National
Multi-national Multi-national
Others (Specify)
Compliance Mandatory Voluntary
Verification Self-Declaration Third Party Verification
Scope Manufacturing Use End-of-Life
Environmental Focus GWP
Other environmental impacts
Energy consumption
General Description
The European Standard (EN) specifies KPIs that are only applicable to BS sites
supporting a single operator network. KPIs for shared BS and BS site between two
operators or more is not considered.
The key Performance Indicators (KPIs) and the associated measurement processes
as well as requirement on report are defined. This standard reflects the operational
energy efficiency of a radio access network and supporting infrastructures as
specified in the scope.
Sector Coverage
the operational energy efficiency of the following digital cellular RAN (radio access
network), equipment and supporting infrastructures:
• integrated BS;
• distributed BS;
• BS site.
The technologies involved are
• UTRA, WCDMA (IMT-2000 Direct Spread, W-CDMA, UMTS);
• E-UTRA, LTE (IMT-2000 and IMT advanced);
• GSM (IMT-2000 SC, Technology GSM/EDGE).
Specified Methodology
Capacity energy efficiency KPI (KPIEE-capacity)
This is the data volume of the BS over the backhaul network divided by the total
energy consumption of the BS site (including the support infrastructure).

Coverage energy efficiency KPI (KPIEE-coverage)
This is the coverage area of the BS divided by the total energy consumption of the BS
site (including the support infrastructure).
Site energy efficiency KPI (KPIEE-site)
The KPIEE-site of the BS site is calculated as the total energy consumption of all the BS
equipment at the site divided by the total energy consumption of the BS site during the
measurement period.
Extended BS total renewable energy KPI (KPIREN-tot)
Extended BS on-site renewable energy KPI (KPIREN-onsite)
Interaction with other
methodologies Site energy efficiency KPI (KPIEE-site) is consistent with Recommendation ITU-T L.1350 [i.6].
Practicability x not clear on the practicability

ETSI EN 305 200-2-2 V1.2.1 (2018-08): Access, Terminals, Transmission and
Multiplexing (ATTM); Energy management; Operational infrastructures; Global KPIs;
Part 2: Specific requirements; Sub-part 2: Fixed broadband access networks
Name of Initiative/
Methodology Fixed broadband access networks
Link https://www.etsi.org/deliver/etsi_en/305200_305299/3052000202/01.02.01_60/en_30
52000202v010201p.pdf
Region/ Country of
implementation International
Developed by
Government Industry Association
National National
Multi-national Multi-national
Others (Specify)
Compliance Mandatory Voluntary
Verification Self-Declaration Third Party Verification
Scope Manufacturing Use End-of-Life
Environmental Focus GWP
Other environmental impacts
Energy consumption
General Description
Energy management of fixed access networks comprises a number of independent
layers. The document addresses performance of infrastructures that supports the
normal function of hosted ICT equipment within the fixed access network (e.g. power
distribution, environmental control, security and safety).
Sector Coverage
The totality of a FAN (Fixed access networks) under the governance of a given
operator takes into account all NTE (Network Telecommunications Equipment) in
terms of energy consumption (both non-renewable and renewable) and task
effectiveness.
Specified Methodology
KPIEM for FANs separately describes the task effectiveness and the renewable energy
performance of an entire FAN for a specific service or a collection of services.
KPIEM is a combination of two separate KPIs as follows:
1) the Objective KPI for task effectiveness, a measure of the data volumes (both upstream and
downstream data (bits)) as a function of the energy consumption (Wh). expressed as KPITE;
KPITE is expressed with units of bits/Wh
2) the Objective KPI for renewable energy contribution expressed as KPIREN; share of
renewable energy by fixed access network site (OS (Operator Site), NDN (Network
Distribution Node) sites, Last Operator Connection point (LOC) sites).
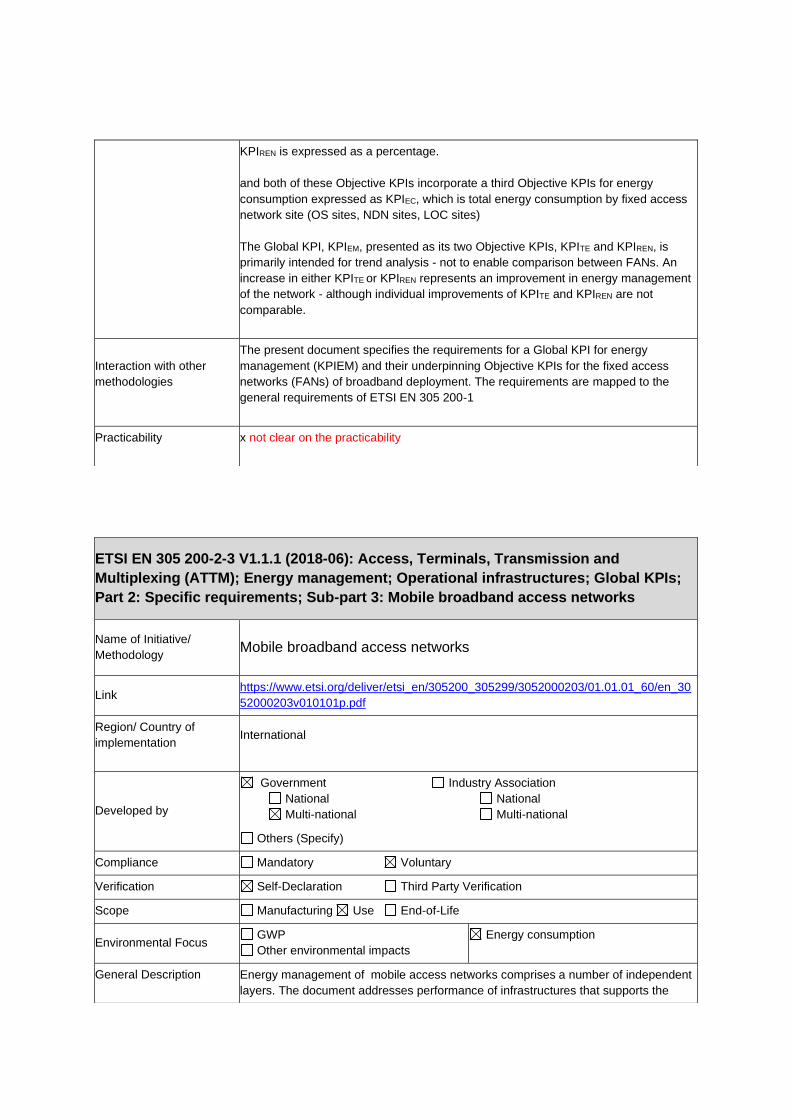
KPIREN is expressed as a percentage.
and both of these Objective KPIs incorporate a third Objective KPIs for energy
consumption expressed as KPIEC, which is total energy consumption by fixed access
network site (OS sites, NDN sites, LOC sites)
The Global KPI, KPIEM, presented as its two Objective KPIs, KPITE and KPIREN, is
primarily intended for trend analysis - not to enable comparison between FANs. An
increase in either KPITE or KPIREN represents an improvement in energy management
of the network - although individual improvements of KPITE and KPIREN are not
comparable.
Interaction with other
methodologies
The present document specifies the requirements for a Global KPI for energy
management (KPIEM) and their underpinning Objective KPIs for the fixed access
networks (FANs) of broadband deployment. The requirements are mapped to the
general requirements of ETSI EN 305 200-1
Practicability x not clear on the practicability
ETSI EN 305 200-2-3 V1.1.1 (2018-06): Access, Terminals, Transmission and
Multiplexing (ATTM); Energy management; Operational infrastructures; Global KPIs;
Part 2: Specific requirements; Sub-part 3: Mobile broadband access networks
Name of Initiative/
Methodology Mobile broadband access networks
Link https://www.etsi.org/deliver/etsi_en/305200_305299/3052000203/01.01.01_60/en_30
52000203v010101p.pdf
Region/ Country of
implementation International
Developed by
Government Industry Association
National National
Multi-national Multi-national
Others (Specify)
Compliance Mandatory Voluntary
Verification Self-Declaration Third Party Verification
Scope Manufacturing Use End-of-Life
Environmental Focus GWP
Other environmental impacts
Energy consumption
General Description Energy management of mobile access networks comprises a number of independent
layers. The document addresses performance of infrastructures that supports the

normal function of hosted ICT equipment within the mobile access network (e.g.
power distribution, environmental control, security and safety).
Sector Coverage
The document addresses energy management in mobile access networks using, but
not restricted to, the following technologies:
• UTRA, WCDMA (IMT-2000 Direct Spread, W-CDMA, UMTS);
• E-UTRA, LTE (IMT-2000 and IMT advanced);
• GSM (IMT-2000 SC, Technology GSM/EDGE).
Specified Methodology
KPIEM for mobile access networks separately describes the task effectiveness and the
renewable energy performance of an entire mobile access network for a specific
service or a collection of services.
KPIEM is a combination of two separate KPIs as follows:
1) the Objective KPI for task effectiveness, a measure of the data volumes (both upstream and
downstream data (bits)) as a function of the energy consumption (Wh). expressed as KPITE;
KPITE is expressed with units of bits/Wh
2) the Objective KPI for renewable energy contribution expressed as KPIREN; share of
renewable energy by mobile access network site (OS (Operator Site), NDN (Network
Distribution Node) sites).
KPIREN is expressed as a percentage. And both of these Objective KPIs incorporate a
third Objective KPIs for energy consumption expressed as KPIEC, which is total energy
consumption by mobile access network site (OS sites, NDN sites)
The Global KPI, KPIEM, presented as its two Objective KPIs, KPITE and KPIREN, is
primarily intended for trend analysis - not to enable comparison between mobile
access networks. An increase in either KPITE or KPIREN represents an improvement in
energy management of the network - although individual improvements of KPITE and
KPIREN are not comparable.
Interaction with other
methodologies
Total volume of data and energy consumption for all base stations of the mobile
access network as defined in ETSI EN 303 472
Practicability x not clear on the practicability

ETSI ES 201 554 V1.2.1 (2014-07): Measurement method for Energy efficiency of
Mobile Core network and Radio Access Control equipment
Name of Initiative/
Methodology
Measurement method for Energy efficiency of Mobile Core network and Radio Access
Control equipment
Link https://www.etsi.org/deliver/etsi_es/201500_201599/201554/01.02.01_60/es_201554v
010201p.pdf
Region/ Country of
implementation International
Developed by
Government Industry Association
National National
Multi-national Multi-national
Others (Specify)
Compliance Mandatory Voluntary
Verification Self-Declaration Third Party Verification
Scope Manufacturing Use End-of-Life
Environmental Focus GWP
Other environmental impacts
Energy consumption
General Description
The ETSI Standard defines energy efficiency metrics and measurement methods for
mobile core equipment.
The document promotes energy saving features as the traffic profile is a
representation of the expected behaviour of the equipment in operation, i.e. the power
consumption is measured at different load levels when processing traffic mimicking a
typical usage of the equipment. The defined metrics can be used for comparing
energy efficiency of different implementations (Hardware and Software) of the same
function only.
Sector Coverage
The document defines metrics and measurement methods applicable for the following
systems and nodes defined in TS 123 002:
• Mobile core functions (GGSN, HLR, MGW, MME, MSC, SGSN and PGW/SGW).
• Radio Access Controller (RNC).
Later revisions will include Base Station Controller (BSC) and IMS core functions
(BGCF, CSCF, HSS, IBCF, MRFC, MRFP, SLF and LRF).
Energy consumption at site including also climate units, losses, auxiliary equipment,
etc. are not observed in this Standard.
The system under test is seen as a "black box", i.e. only the total power consumed by
the device or shelf/shelves is/are measured and not different parts of the device or
shelf/shelves. A "black box" can be viewed solely in terms of its input,
output and transfer characteristics without any knowledge of its internal workings.

Specified Methodology
Average power consumption
Where α, β, and γ are weight coefficients selected such as (α + β + γ) = 1.
The power consumption levels associated with the above load levels are defined as:
• High load level: PH = average power consumption [W] measured at TH
• Mid load level: PM = average power consumption [W] measured at TM
• Low load level: PL = average power consumption [W] measured at TL
Three normalized traffic profiles are provided:
Energy Efficiency Ratio (EER)
The Energy Efficiency Ratio metric, the comparable performance indicator, for Core
networks is defined as:
By using the defined traffic models, Useful Output can be translated to Subscribers
(Sub) or Simultaneously Attached Users (SAU) also for functions which normally have
the maximum capacity expressed in Erlang (Erl) or Packets/s (PPS).
Interaction with other
methodologies not clear
Practicability x not clear on the practicability
ETSI ES 202 706-1 V1.6.0 (2020-11): Metrics and measurement method for energy
efficiency of wireless access network equipment; Part 1: Power consumption - static
measurement method
Name of Initiative/
Methodology
Metrics and measurement method for energy efficiency of wireless access network
equipment; Part 1: Power consumption - static measurement method
Link https://www.etsi.org/deliver/etsi_es/202700_202799/20270601/01.06.00_50/es_20270
601v010600m.pdf
Region/ Country of
implementation International
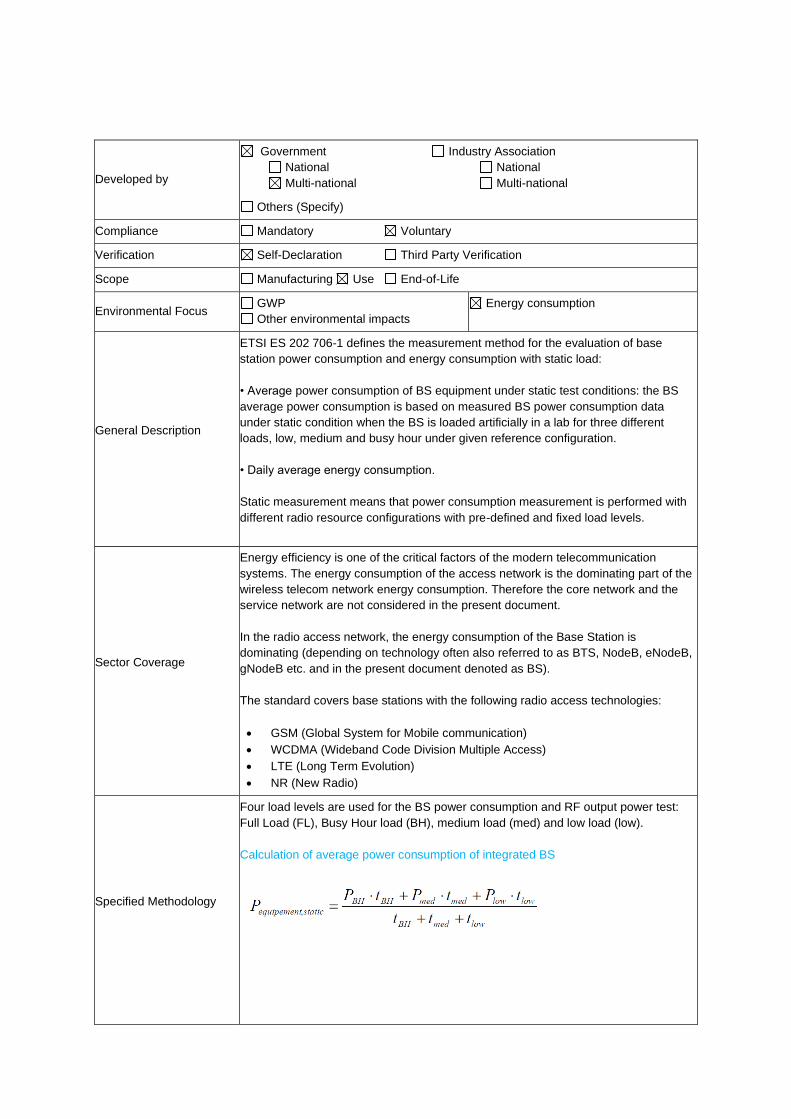
Developed by
Government Industry Association
National National
Multi-national Multi-national
Others (Specify)
Compliance Mandatory Voluntary
Verification Self-Declaration Third Party Verification
Scope Manufacturing Use End-of-Life
Environmental Focus GWP
Other environmental impacts
Energy consumption
General Description
ETSI ES 202 706-1 defines the measurement method for the evaluation of base
station power consumption and energy consumption with static load:
• Average power consumption of BS equipment under static test conditions: the BS
average power consumption is based on measured BS power consumption data
under static condition when the BS is loaded artificially in a lab for three different
loads, low, medium and busy hour under given reference configuration.
• Daily average energy consumption.
Static measurement means that power consumption measurement is performed with
different radio resource configurations with pre-defined and fixed load levels.
Sector Coverage
Energy efficiency is one of the critical factors of the modern telecommunication
systems. The energy consumption of the access network is the dominating part of the
wireless telecom network energy consumption. Therefore the core network and the
service network are not considered in the present document.
In the radio access network, the energy consumption of the Base Station is
dominating (depending on technology often also referred to as BTS, NodeB, eNodeB,
gNodeB etc. and in the present document denoted as BS).
The standard covers base stations with the following radio access technologies:
• GSM (Global System for Mobile communication)
• WCDMA (Wideband Code Division Multiple Access)
• LTE (Long Term Evolution)
• NR (New Radio)
Specified Methodology
Four load levels are used for the BS power consumption and RF output power test:
Full Load (FL), Busy Hour load (BH), medium load (med) and low load (low).
Calculation of average power consumption of integrated BS
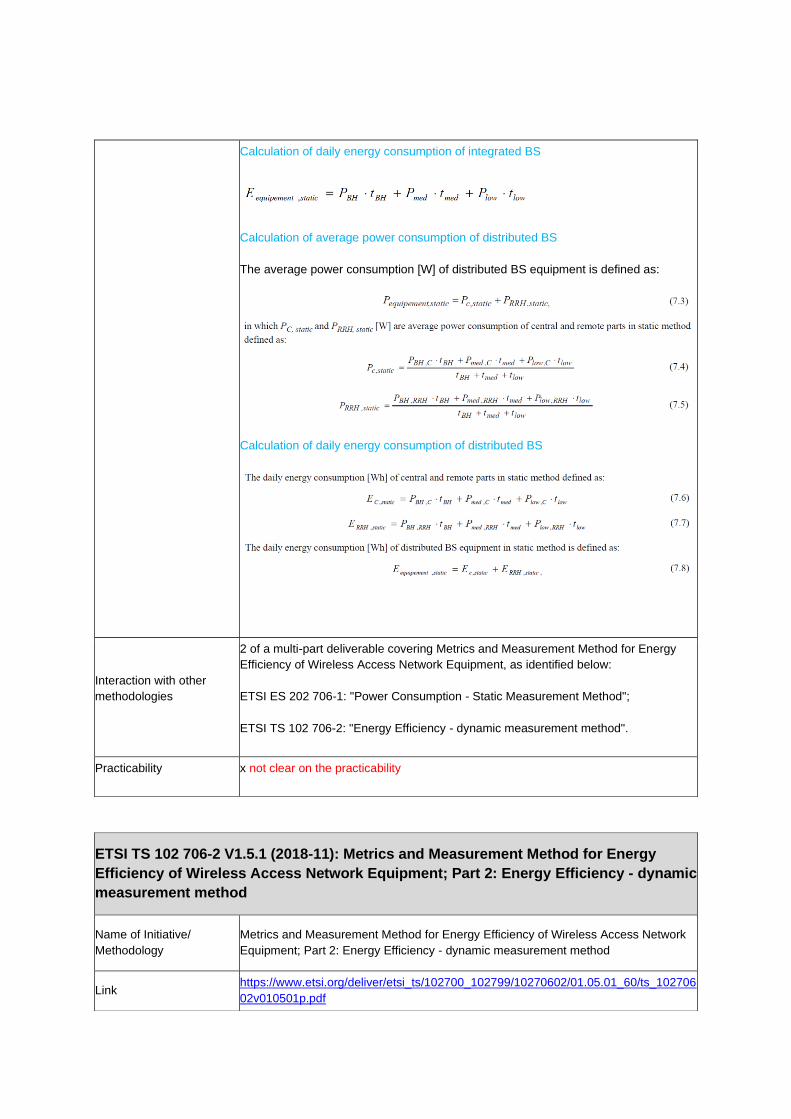
Calculation of daily energy consumption of integrated BS
Calculation of average power consumption of distributed BS
The average power consumption [W] of distributed BS equipment is defined as:
Calculation of daily energy consumption of distributed BS
Interaction with other
methodologies
2 of a multi-part deliverable covering Metrics and Measurement Method for Energy
Efficiency of Wireless Access Network Equipment, as identified below:
ETSI ES 202 706-1: "Power Consumption - Static Measurement Method";
ETSI TS 102 706-2: "Energy Efficiency - dynamic measurement method".
Practicability x not clear on the practicability
ETSI TS 102 706-2 V1.5.1 (2018-11): Metrics and Measurement Method for Energy
Efficiency of Wireless Access Network Equipment; Part 2: Energy Efficiency - dynamic
measurement method
Name of Initiative/
Methodology
Metrics and Measurement Method for Energy Efficiency of Wireless Access Network
Equipment; Part 2: Energy Efficiency - dynamic measurement method
Link https://www.etsi.org/deliver/etsi_ts/102700_102799/10270602/01.05.01_60/ts_102706
02v010501p.pdf

Region/ Country of
implementation International
Developed by
Government Industry Association
National National
Multi-national Multi-national
Others (Specify)
Compliance Mandatory Voluntary
Verification Self-Declaration Third Party Verification
Scope Manufacturing Use End-of-Life
Environmental Focus GWP
Other environmental impacts
Energy consumption
General Description
The assessment method is covering the BS equipment dynamic efficiency for which
the technical specification (TS) defines reference BS equipment configurations and
reference load levels to be used when measuring BS efficiency.
The total energy consumption of the base station will be the sum of weighted energy
consumption for each traffic level i.e. low, medium and busy-hour traffic.
Sector Coverage This TS covers LTE radio access technology.
Specified Methodology
Total data volume for 24-hours period
The measured data volume in bits for low load level is denoted as DVmeasured-low.
The measured data volume in bits for medium load level is denoted as DVmeasured-
medium.
The measured data volume in bits for busy-hour load level is denoted as
DVmeasured-busy-hour.
The total data volume for 24-hours period is calculated as following:
These weighting factors are applied: Wlow for low traffic, Wmedium for medium traffic
and Wbusy-hour for busy-hour traffic level.
DVtotal is the total delivered bits during the measurement for all three traffic levels.
Energy Consumption for the integrated BS
The total energy consumption of the base station will be the sum of weighted energy
consumption for each traffic level i.e. low, medium and busy-hour traffic.

Energy Consumption for the distributed BS
EC, equipment and ERRH, equipment [Wh] are the energy consumption of the central
and the remote parts in the dynamic method defined as:
Base Station Energy Efficiency (BSEP)
The base station energy efficiency KPI is an indicator for showing how a base station
in a energy efficient way is doing work in terms of delivering useful bits to the UEs
served by the base station.
is the total consumed energy during the measurement period for delivering
DVtotal
Interaction with other
methodologies
2 of a multi-part deliverable covering Metrics and Measurement Method for Energy
Efficiency of Wireless Access Network Equipment, as identified below:
ETSI ES 202 706-1: "Power Consumption - Static Measurement Method";
ETSI TS 102 706-2: "Energy Efficiency - dynamic measurement method".
Practicability x not clear on the practicability

ETSI ES 203 136 V1.2.1 (2017-10): Measurement methods for energy efficiency
of router and switch equipment
Name of Initiative/
Methodology Measurement methods for energy efficiency of router and switch equipment
Link https://www.etsi.org/deliver/etsi_es/203100_203199/203136/01.02.01_60/es_203136v
010201p.pdf
Region/ Country of
implementation International
Developed by
Government Industry Association
National National
Multi-national Multi-national
Others (Specify)
Compliance Mandatory Voluntary
Verification Self-Declaration Third Party Verification
Scope Manufacturing Use End-of-Life
Environmental Focus GWP
Other environmental impacts
Energy consumption
General Description The Standard defines the methodology and the test conditions to measure the power
consumption of router and switch equipment.
Sector Coverage
The document is applicable to Core, edge and access routers. Ethernet switch is
widely used because of fast development of Ethernet technologies and its low costs,
therefore, switches in the present document refer to Ethernet switches.
Home gateways are not included in the Standard.
Specified Methodology
Energy Efficiency Ratio of Equipment (EEER) is defined as the throughput
forwarded by 1 watt, unit: Gbps/Watt. A higher EEER corresponds to a better the
energy efficiency.
• Bj: Weight multipliers for different traffic level, see table 1; the summation of B1
to B3 equal to 1.
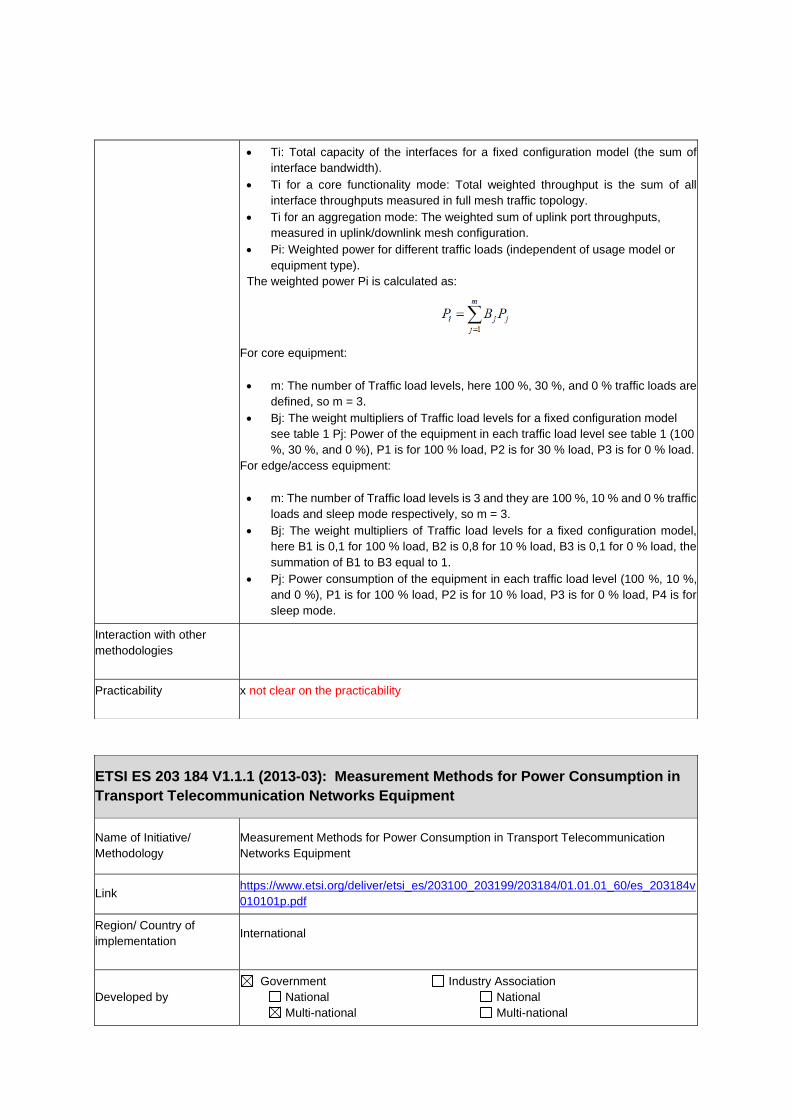
• Ti: Total capacity of the interfaces for a fixed configuration model (the sum of
interface bandwidth).
• Ti for a core functionality mode: Total weighted throughput is the sum of all
interface throughputs measured in full mesh traffic topology.
• Ti for an aggregation mode: The weighted sum of uplink port throughputs,
measured in uplink/downlink mesh configuration.
• Pi: Weighted power for different traffic loads (independent of usage model or
equipment type).
The weighted power Pi is calculated as:
For core equipment:
• m: The number of Traffic load levels, here 100 %, 30 %, and 0 % traffic loads are
defined, so m = 3.
• Bj: The weight multipliers of Traffic load levels for a fixed configuration model
see table 1 Pj: Power of the equipment in each traffic load level see table 1 (100
%, 30 %, and 0 %), P1 is for 100 % load, P2 is for 30 % load, P3 is for 0 % load.
For edge/access equipment:
• m: The number of Traffic load levels is 3 and they are 100 %, 10 % and 0 % traffic
loads and sleep mode respectively, so m = 3.
• Bj: The weight multipliers of Traffic load levels for a fixed configuration model,
here B1 is 0,1 for 100 % load, B2 is 0,8 for 10 % load, B3 is 0,1 for 0 % load, the
summation of B1 to B3 equal to 1.
• Pj: Power consumption of the equipment in each traffic load level (100 %, 10 %,
and 0 %), P1 is for 100 % load, P2 is for 10 % load, P3 is for 0 % load, P4 is for
sleep mode.
Interaction with other
methodologies
Practicability x not clear on the practicability
ETSI ES 203 184 V1.1.1 (2013-03): Measurement Methods for Power Consumption in
Transport Telecommunication Networks Equipment
Name of Initiative/
Methodology
Measurement Methods for Power Consumption in Transport Telecommunication
Networks Equipment
Link https://www.etsi.org/deliver/etsi_es/203100_203199/203184/01.01.01_60/es_203184v
010101p.pdf
Region/ Country of
implementation International
Developed by
Government Industry Association
National National
Multi-national Multi-national

Others (Specify)
Compliance Mandatory Voluntary
Verification Self-Declaration Third Party Verification
Scope Manufacturing Use End-of-Life
Environmental Focus GWP
Other environmental impacts
Energy consumption
General Description
This ETSI Standard (ES) defines the metric, methodology and the test conditions to
evaluate the Equipment Energy Efficiency Ratio (EEER) of Transport equipments. The
EEER is calculated with the same formula of the ATIS standard (ATIS-
0600015.02.2009) but with the measurement conditions defined in the present
document. The EEER is evaluated for a given fixed or flexible configuration. The
Fixed configuration method requires that the power consumption measurement is
performed on the overall system. The Flexible configuration method is applicable
when the System Configuration is composed by a set of subparts whose power
consumptions is previously measured and separately known. Typical subparts for
Transport equipments are: Fans modules, Power supply modules, service cards (i.e.
Controller and communication units), Switching units, Data interface boards,
subtended subracks.
Sector Coverage
Three Transport system categories are defined:
• Category A: terminal and signal conditioning equipment
This category is characterized by two sides (Input and Output) as regards
signal handling. The signals may be uni- or bi- directionally handled on each of
the two sides of the equipment.
o line OA;
o power equalizer;
o WDM terminal (mux/demux)
• Category B: switch and ADM without tributary add/drop ports
This category is characterized by switching or add/drop multiplexing
functionalities and all the ports are used for network interconnection (none of the
ports is used for tributary add/drop function). Equipment belonging to this
category plays the role of pure transit equipment in a network.
o SDH switch or ADM;
o OTN switch or ADM;
o WDM ROADM;
o PT switch.
• Category C: switch and ADM with tributary add/drop ports
This category is characterized by switching or add/drop multiplexing
functionalities and the ports are used both for network interconnection and for
tributary add/drop function. Equipment belonging to this category plays the role of
node in a network where part of the switched traffic is terminated towards network
clients.
A list of examples of equipment for category C is the same as the one provided
for category B, but in case of category C the equipment includes also tributary
ports.
Transport equipments that exploit radio or wireless interfaces (e.g. free space optics
and point to point wireless/microwave transport) are out of the scope of the document.

Specified Methodology
Transport Equipment Energy Efficiency Ratio (EEER) is defined as:
For measurement of Power consumption P, a methodology is provided to take into
account equipments with both Constant Bit Rate and Variable Bit Rate (VBR)
interfaces. In case of
Variable Bit Rate (VBR) the power consumption could depend on the traffic load.
In case of transport equipment that can be configured with optical amplifiers with
different gain, the following EEER can be used:
In the case that Optical amplifier is not present then G = 1. In case of equipment with
multiple amplifiers with different gains, the average gain will apply (e.g. G1 = 100 dB,
G2 = 10 dB, then G average = 55 dB).
Interaction with other
methodologies
The above defined EEER is in line with the equivalent TEER defined in ATIS standard
for transport equipment.
Practicability x not clear on the practicability
ETSI EN 305 174-8 V1.1.1 (2018-01): Access, Terminals, Transmission and Multiplexing
(ATTM); Broadband Deployment and Lifecycle Resource Management; Part 8:
Management of end of life of ICT equipment (ICT waste/end of life)
Name of Initiative/
Methodology ICT waste/end of life
Link https://www.etsi.org/deliver/etsi_en/305100_305199/30517408/01.01.01_60/en_3051
7408v010101p.pdf
Region/ Country of
implementation International
Developed by Government Industry Association
National National

Multi-national Multi-national
Others (Specify)
Compliance Mandatory Voluntary
Verification Self-Declaration Third Party Verification
Scope Manufacturing Use End-of-Life
Environmental Focus GWP
Other environmental impacts
Energy consumption
General Description
The treatment of obsolete ICT equipment is an important aspect of overall
environmental viability of broadband
deployment because:
• the production of electronics devices requires the use of scarce and expensive
resources;
• waste ICT equipment is a complex mixture of materials and components that,
because of their hazardous content, can cause major environmental and health
problems if not properly managed.
The improvement of collection, treatment and recycling of electronics at the End-of-
Life (EoL) improves the environmental management of WEEE, contributes to a
circular economy and enhances resource management.
Sector Coverage WEEE within ICT sites, core and access networks
Specified Methodology
A set of Requirements on management of WEEE concerning supply chain, Internal
organization, Extended Producer Responsibility, training, WEEE in companies
network transformation, Collection Scheme and partners, Subscriber equipment,
Rare resources and valorisation, Second-hand and re-use of equipment.
The following formulas are used to calculate recycling and recovery rates:
The calculation of the targets is calculated, for each category, by dividing the weight of
the WEEE that enters the recovery or recycling/preparing for re-use facility, after
proper treatment in accordance with Article 8(2) of WEEE 2012/19/EU Directive with
regard to recovery or recycling, by the weight of all separately collected WEEE for
each category, expressed as a percentage.
Interaction with other
methodologies Not applicable
Practicability x not clear on the practicability
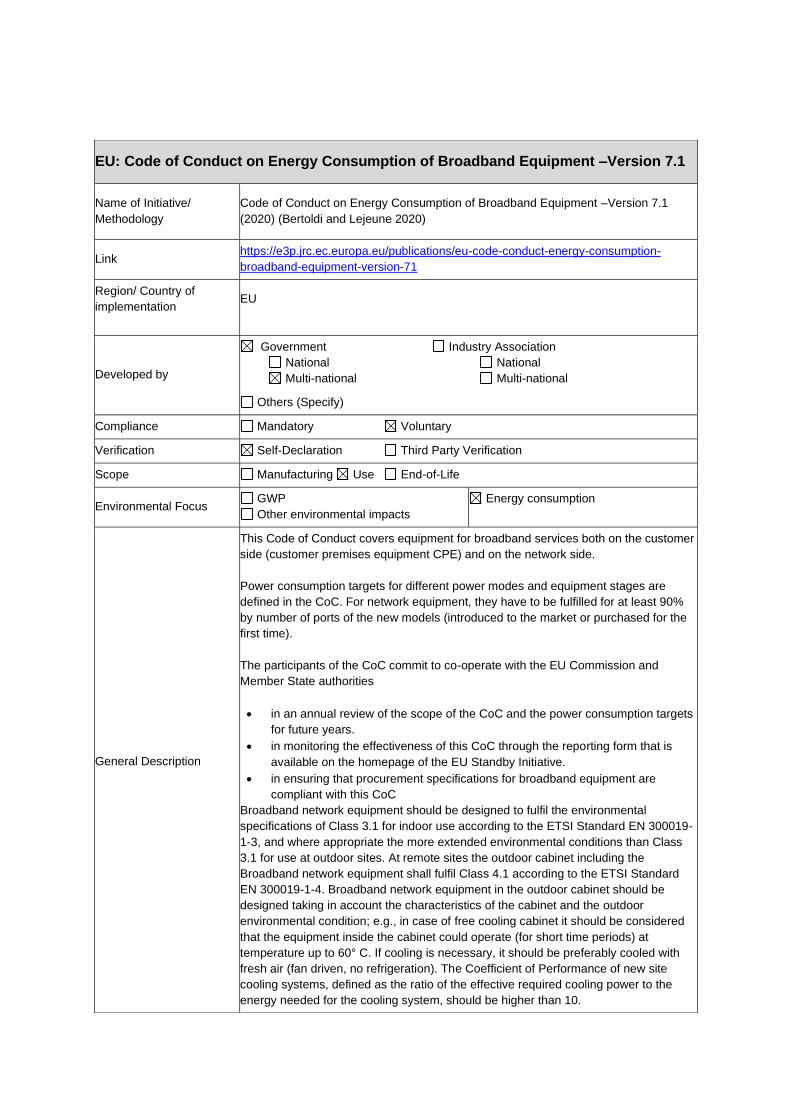
EU: Code of Conduct on Energy Consumption of Broadband Equipment –Version 7.1
Name of Initiative/
Methodology
Code of Conduct on Energy Consumption of Broadband Equipment –Version 7.1
(2020) (Bertoldi and Lejeune 2020)
Link https://e3p.jrc.ec.europa.eu/publications/eu-code-conduct-energy-consumption-
broadband-equipment-version-71
Region/ Country of
implementation EU
Developed by
Government Industry Association
National National
Multi-national Multi-national
Others (Specify)
Compliance Mandatory Voluntary
Verification Self-Declaration Third Party Verification
Scope Manufacturing Use End-of-Life
Environmental Focus GWP
Other environmental impacts
Energy consumption
General Description
This Code of Conduct covers equipment for broadband services both on the customer
side (customer premises equipment CPE) and on the network side.
Power consumption targets for different power modes and equipment stages are
defined in the CoC. For network equipment, they have to be fulfilled for at least 90%
by number of ports of the new models (introduced to the market or purchased for the
first time).
The participants of the CoC commit to co-operate with the EU Commission and
Member State authorities
• in an annual review of the scope of the CoC and the power consumption targets
for future years.
• in monitoring the effectiveness of this CoC through the reporting form that is
available on the homepage of the EU Standby Initiative.
• in ensuring that procurement specifications for broadband equipment are
compliant with this CoC
Broadband network equipment should be designed to fulfil the environmental
specifications of Class 3.1 for indoor use according to the ETSI Standard EN 300019-
1-3, and where appropriate the more extended environmental conditions than Class
3.1 for use at outdoor sites. At remote sites the outdoor cabinet including the
Broadband network equipment shall fulfil Class 4.1 according to the ETSI Standard
EN 300019-1-4. Broadband network equipment in the outdoor cabinet should be
designed taking in account the characteristics of the cabinet and the outdoor
environmental condition; e.g., in case of free cooling cabinet it should be considered
that the equipment inside the cabinet could operate (for short time periods) at
temperature up to 60° C. If cooling is necessary, it should be preferably cooled with
fresh air (fan driven, no refrigeration). The Coefficient of Performance of new site
cooling systems, defined as the ratio of the effective required cooling power to the
energy needed for the cooling system, should be higher than 10.

193 https://e3p.jrc.ec.europa.eu/communities/ict-code-conduct-energy-consumption-broadband-communication-
equipment (access on 22.01.2021)
Sector Coverage
Specified Methodology
Network equipment
Power consumption targets per port for different power modes and equipment stages
are defined in the CoC. For Cable Network Equipment, power consumption per
Service Group and Power Consumption per Throughput shall be determined with the
metric specified in SCTE 232 2019, “Key Performance Metrics: Energy Efficiency &
Functional Density of CMTS, CCAP, and Time Server Equipment”.
Interaction with other
methodologies
• Systems powered by DC Voltage shall comply with the standard ETSI EN 300
132-2 "Environmental Engineering (EE); Power supply interface at the input to
telecommunications equipment; Part 2: Operated by direct current (dc)”.
• The method of power measurement of equipment in line with point C.2.1, C.2.2
and C.2.3 for PON and PtP networks) shall comply with the Technical
Specification ETSI ES 303 215 "Environmental Engineering (EE); Measurement
Methods and limits for Power Consumption in Broadband Telecommunication
Networks Equipment".
• The method of power measurement for equipment in line with point C.2.4 shall
comply with the Technical Specification ETSI TS 202 706-1 v1.5.1
“Environmental Engineering (EE);Metrics and measurement method for energy
efficiency of wireless access network equipment Part 1: Power Consumption -
Static Measurement Method”
Practicability
The list of participants is published at the JRC website193:
• Cisco Systems Inc.
• Deutsche Telekom AG
• France Telecom Group
• HUAWEI Technologies CO., LTD
• KPN
• Nokia
• OTE S.A.
• Portugal Telecom, SA
• Proximus
• Telecom Italia
• Telefonaktiebolaget LM Ericsson
• Telia Company
• TDC Services
• Technicolor
• Telefonica SA

194 https://e3p.jrc.ec.europa.eu/node/214 (access 22.01.2021)
• ZTE corporation
• TELENOR Group
Reports are published how many of the participants meet the requirements of the CoC
for Broadband Equipment and measured values by participants are presented as
percentage of the target values (last published report for 2009/2010194, no update
since then).
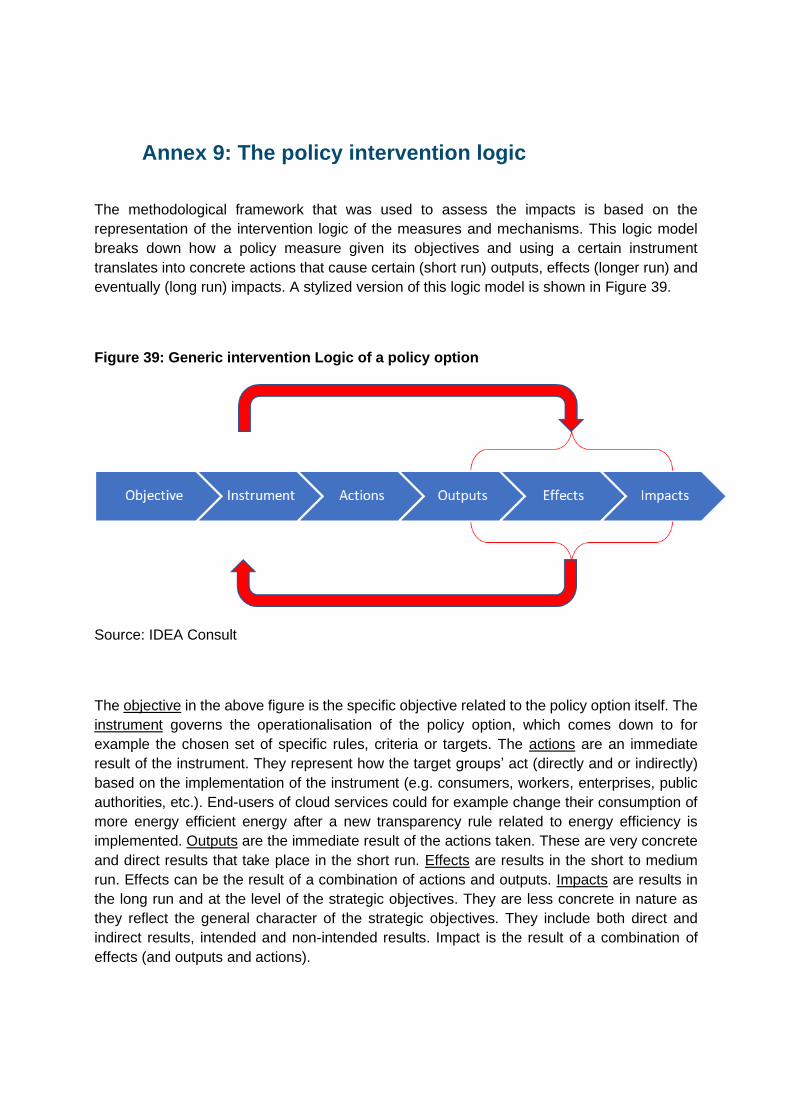
Annex 9: The policy intervention logic
The methodological framework that was used to assess the impacts is based on the
representation of the intervention logic of the measures and mechanisms. This logic model
breaks down how a policy measure given its objectives and using a certain instrument
translates into concrete actions that cause certain (short run) outputs, effects (longer run) and
eventually (long run) impacts. A stylized version of this logic model is shown in Figure 39.
Figure 39: Generic intervention Logic of a policy option
Source: IDEA Consult
The objective in the above figure is the specific objective related to the policy option itself. The
instrument governs the operationalisation of the policy option, which comes down to for
example the chosen set of specific rules, criteria or targets. The actions are an immediate
result of the instrument. They represent how the target groups’ act (directly and or indirectly)
based on the implementation of the instrument (e.g. consumers, workers, enterprises, public
authorities, etc.). End-users of cloud services could for example change their consumption of
more energy efficient energy after a new transparency rule related to energy efficiency is
implemented. Outputs are the immediate result of the actions taken. These are very concrete
and direct results that take place in the short run. Effects are results in the short to medium
run. Effects can be the result of a combination of actions and outputs. Impacts are results in
the long run and at the level of the strategic objectives. They are less concrete in nature as
they reflect the general character of the strategic objectives. They include both direct and
indirect results, intended and non-intended results. Impact is the result of a combination of
effects (and outputs and actions).

GETTING IN TOUCH WITH THE EU
In person
All over the European Union there are hundreds of Europe Direct information centres. You can find the
address of the centre nearest you at: https://europa.eu/european-union/contact_en
On the phone or by email
Europe Direct is a service that answers your questions about the European Union. You can contact this service:
– by freephone: 00 800 6 7 8 9 10 11 (certain operators may charge for these calls),
– at the following standard number: +32 22999696 or
– by email via: https://europa.eu/european-union/contact_en
FINDING INFORMATION ABOUT THE EU
Online
Information about the European Union in all the official languages of the EU is available on the Europa
website at: https://europa.eu/european-union/index_en
EU publications
You can download or order free and priced EU publications at:
https://publications.europa.eu/en/publications. Multiple copies of free publications may be obtained by contacting Europe Direct or your local information centre (see
https://europa.eu/european-union/contact_en).
EU law and related documents
For access to legal information from the EU, including all EU law since 1952 in all the official language
versions, go to EUR-Lex at: http://eur-lex.europa.eu
Open data from the EU
The EU Open Data Portal (http://data.europa.eu/euodp/en) provides access to datasets from the EU. Data can be downloaded and reused for free, for both commercial and non-commercial purposes.

doi:10.2759/116715 ISBN 978-92-76-46887-5
KK-0
6-2
2-0
43-E
N-N