111111
Student learning outcomes from a gender perspective
What do international assessments tell us?
Organisation for Economic Cooperation and Development (OECD)
Washington, 2 October 2007
Andreas SchleicherHead, Indicators and Analysis Division
OECD Directorate for Education
4444
How gender patterns in education have changed in the industrialised
world
A story of rapid progress

555555
%
1. Excluding ISCED 3C short programmes 2. Year of reference 20043. Including some ISCED 3C short programmes 3. Year of reference 2003.
Growth in baseline qualificationsA world of change
Approximated by percentage of persons with high school or equivalent qualfications in the age groups 55-64, 45-55, 45-44 und 25-34 years
13
1
1
27
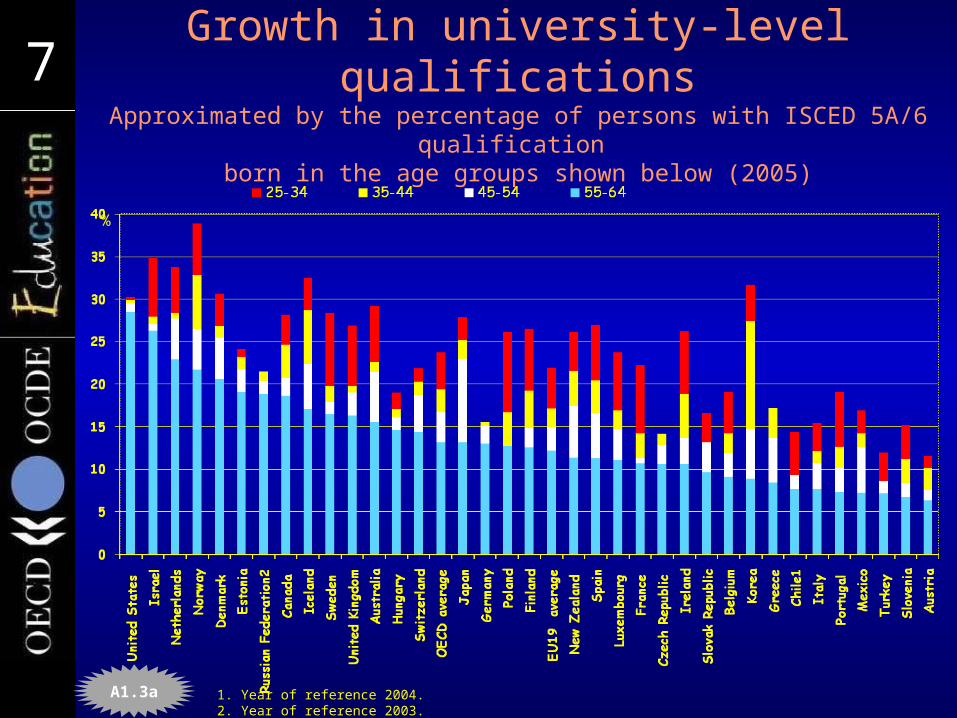
777777 Growth in university-level qualificationsApproximated by the percentage of persons with ISCED 5A/6
qualification born in the age groups shown below (2005)
%
A1.3a 1. Year of reference 2004.2. Year of reference 2003.
888888
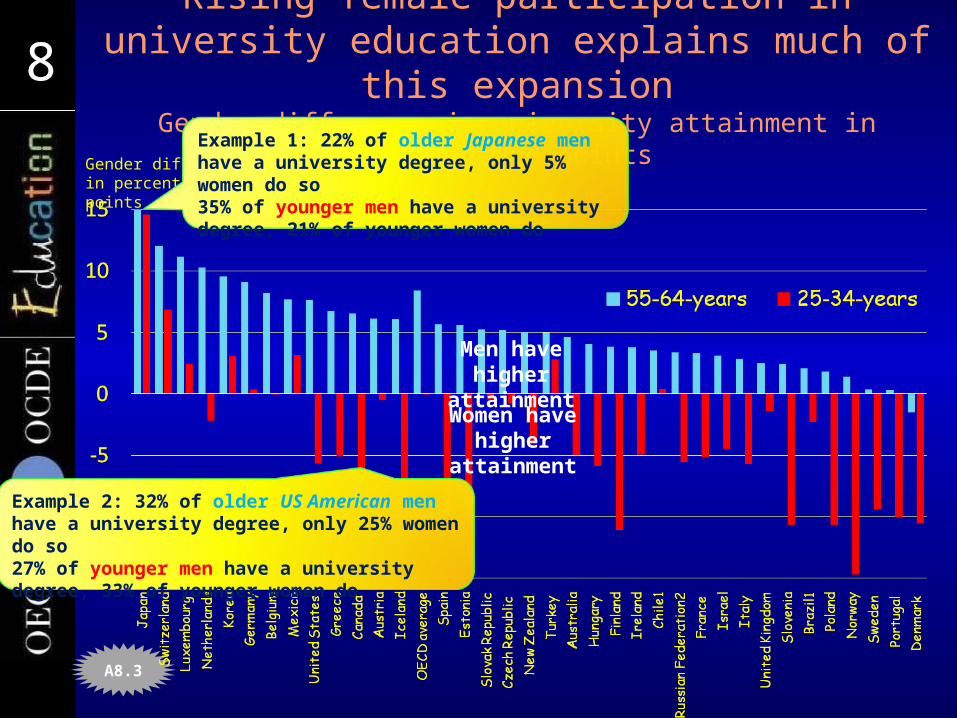
Gender difference in percentage points
A8.3
Rising female participation in university education explains much of this expansion
Gender difference in university attainment in percentage points
Men have higher
attainmentWomen have
higher attainment
Example 1: 22% of older Japanese men have a university degree, only 5% women do so35% of younger men have a university degree, 21% of younger women do
Example 2: 32% of older US American men have a university degree, only 25% women do so27% of younger men have a university degree, 33% of younger women do
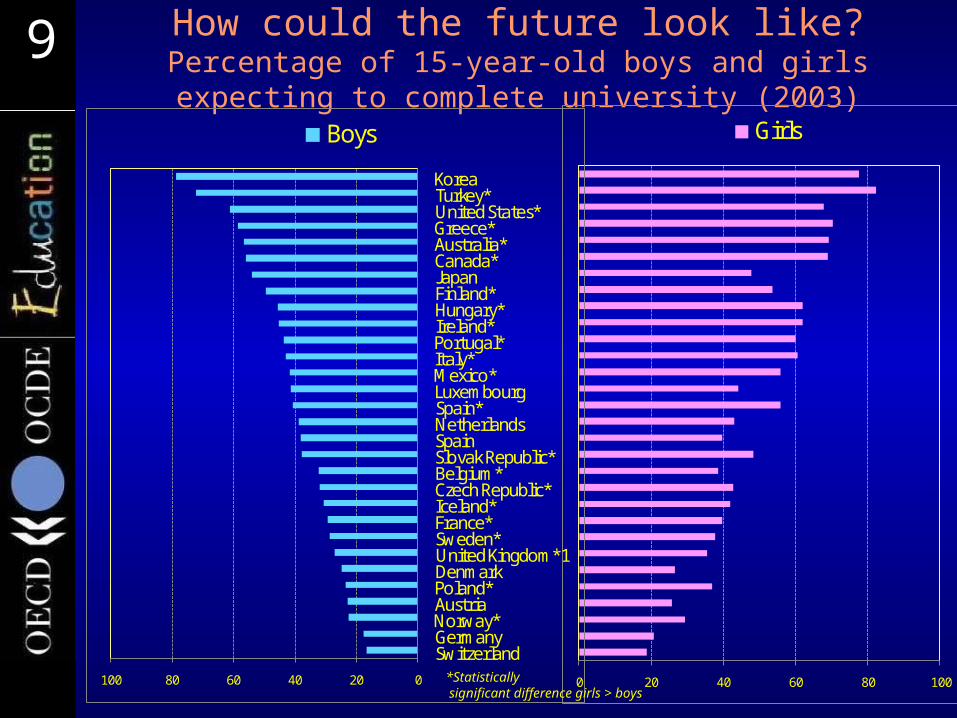
999999 How could the future look like?Percentage of 15-year-old boys and girls expecting to
complete university (2003)
0 20 40 60 80 100
Girls
020406080100
SwitzerlandGermanyNorway*AustriaPoland*DenmarkUnited Kingdom*1Sweden*France*Iceland*Czech Republic*Belgium*Slovak Republic*SpainNetherlandsSpain*LuxembourgMexico*Italy*Portugal*Ireland*Hungary*Finland*JapanCanada*Australia*Greece*United States*Turkey*Korea
Boys
*Statistically significant difference girls > boys
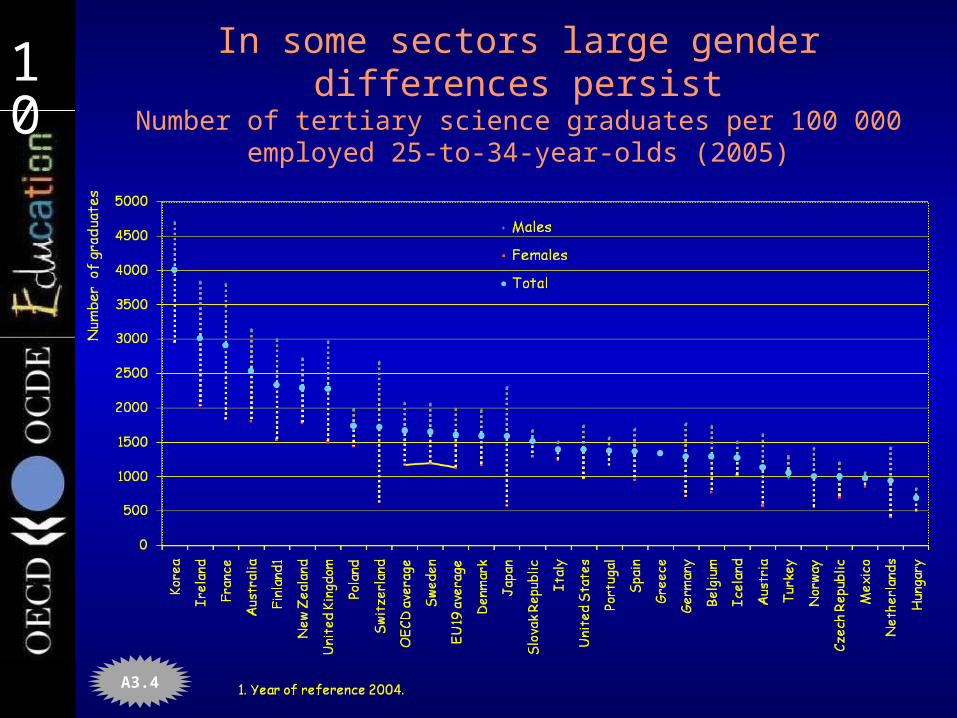
101010101010 In some sectors large gender differences persist
Number of tertiary science graduates per 100 000 employed 25-to-34-year-olds (2005)
A3.4
11111111
Where we are - and where we can be
A review of gender differences in performance and student attitudes in today’s schools around the world
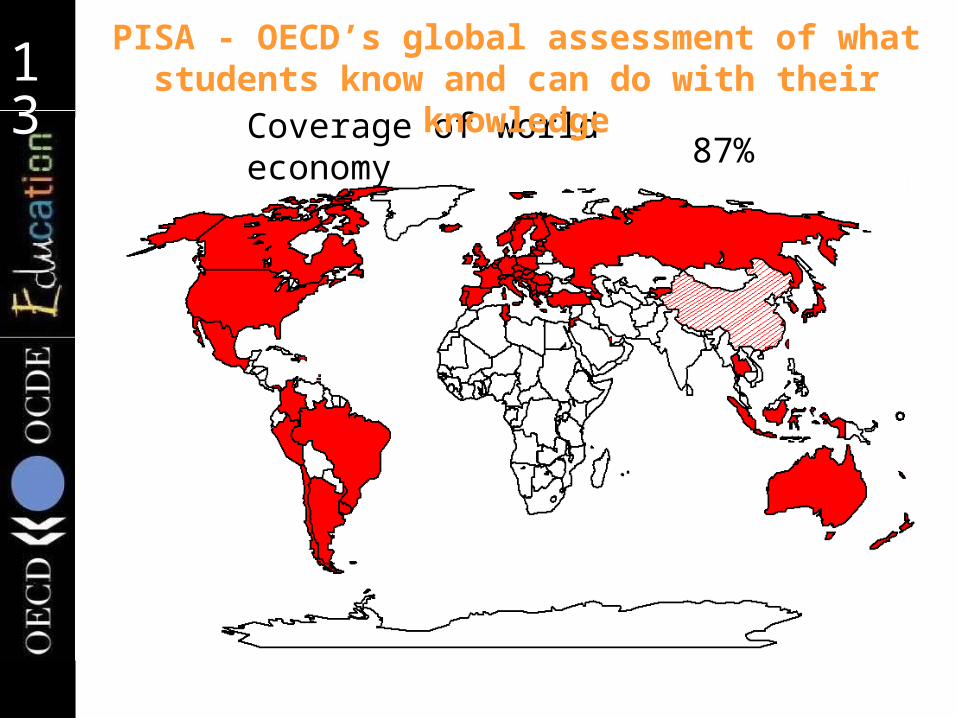
13131313Coverage of world economy 77%81%83%85%86%87%
PISA - OECD’s global assessment of what students know and can do with their
knowledge

14141414Deciding what to assess...
looking back at what students were expected to have learned
…or…
looking ahead to how well they can extrapolate from what they have
learned and apply their knowledge and skills in novel settings.
For PISA, the OECD countries chose the latter.
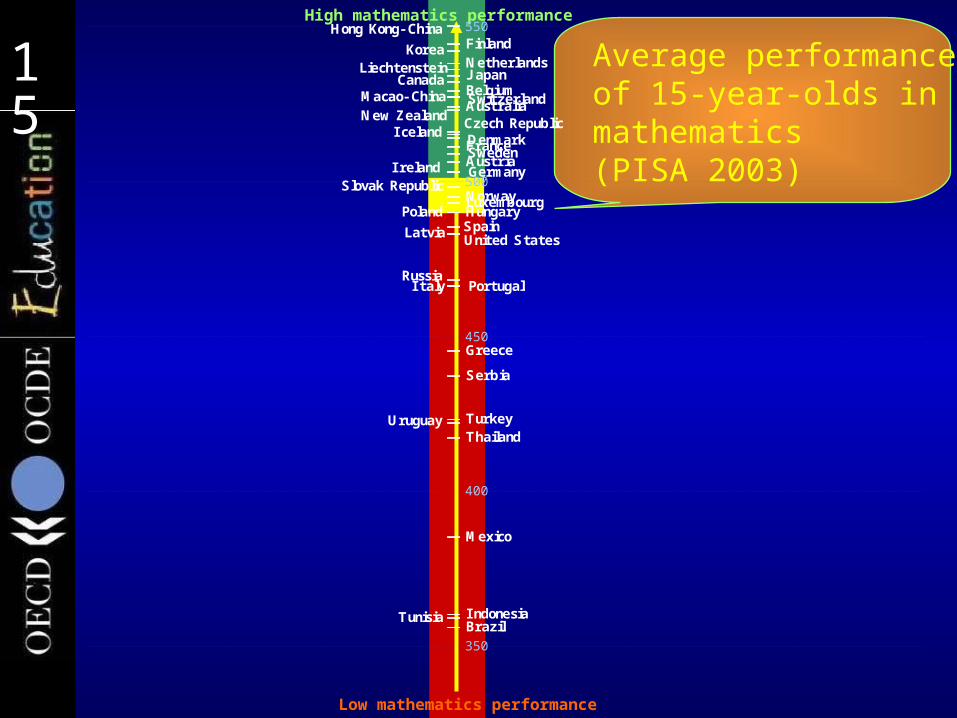
15151515 Average performanceof 15-year-olds in mathematics (PISA 2003)
High mathematics performance
Low mathematics performance
TurkeyUruguay
I ndonesia
I taly Portugal
Latvia United StatesSpain
NorwayHungaryPolandLuxembourg
Slovak Republic
AustriaGermanyI reland
DenmarkFranceSweden
Czech RepublicI celand
Australia
J apanBelgium
New ZealandSwitzerlandMacao- China
CanadaNetherlandsFinland
Hong Kong- China
KoreaLiechtenstein
Russia
Greece
Serbia
Thailand
Mexico
BrazilTunisia
350
400
450
500
550

16161616 Average performanceof 15-year-olds in mathematics
Low average performance
Large socio-economic disparities
High average performance
Large socio-economic disparities
Low average performance
High social equity
High average performance
High social equity
Strong socio-economic impact
on student performance
Socially equitable distribution of
learning opportunities
TurkeyUruguay
I ndonesia
I taly Portugal
Latvia United StatesSpain
NorwayHungaryPolandLuxembourg
Slovak Republic
AustriaGermanyI reland
DenmarkFranceSweden
Czech RepublicI celand
Australia
J apanBelgium
New ZealandSwitzerlandMacao- China
CanadaNetherlandsFinland
Hong Kong- China
KoreaLiechtenstein
Russia
Greece
Serbia
Thailand
Mexico
BrazilTunisia
350
400
450
500
550High mathematics performance
Low mathematics performance

17171717
Low average performance
Large socio-economic disparities
High average performance
Large socio-economic disparities
Low average performance
High social equity
High average performance
High social equity
Strong socio-economic impact
on student performance
Socially equitable distribution of
learning opportunities
High mathematics performance
Low mathematics performance
Turkey Uruguay
I ndonesia
I talyPortugal
LatviaUnited States Spain
NorwayHungary Poland
LuxembourgSlovak Republic
AustriaGermany I reland
DenmarkFrance Sweden
Czech RepublicI celand
Australia
J apanBelgium
New ZealandSwitzerland Macao- China
CanadaNetherlands
FinlandHong Kong- China
KoreaLiechtenstein
Russia
Greece
Serbia
Thailand
Mexico
BrazilTunisia
350
400
450
500
550
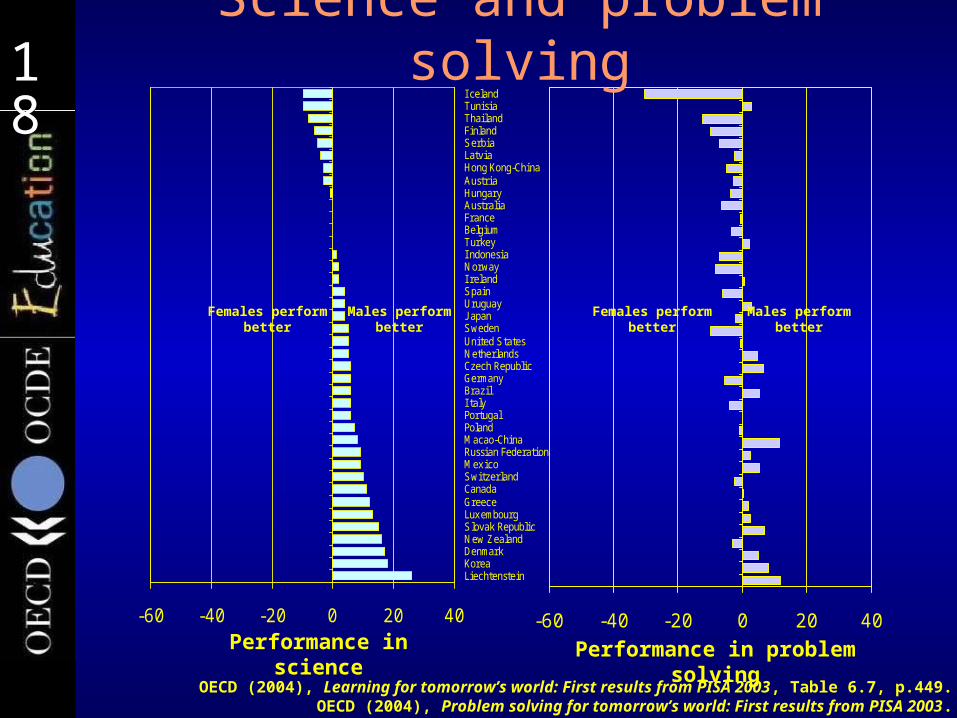
181818181818
-60 -40 -20 0 20 40
LiechtensteinKoreaDenmarkNew ZealandSlovak RepublicLuxembourgGreeceCanadaSwitzerlandMexicoRussian FederationMacao-ChinaPolandPortugalI talyBrazilGermanyCzech RepublicNetherlandsUnited StatesSwedenJ apanUruguaySpainI relandNorwayI ndonesiaTurkeyBelgiumFranceAustraliaHungaryAustriaHong Kong-ChinaLatviaSerbiaFinlandThailandTunisiaI celand
Performance in science
Females perform better
Males perform better
-60 -40 -20 0 20 40
Performance in problem solving
Females perform better
Males perform better
OECD (2004), Learning for tomorrow’s world: First results from PISA 2003, Table 6.7, p.449.OECD (2004), Problem solving for tomorrow’s world: First results from PISA 2003.
Science and problem solving

191919191919
-60 -40 -20 0 20 40
I celandThailandSerbiaLatviaI ndonesiaHong Kong-ChinaNetherlandsAustraliaPolandNorwayUnited StatesSwedenFinlandBelgiumAustriaHungaryJ apanFranceSpainGermanyRussian FederationMexicoCanadaUruguayTunisiaPortugalNew ZealandI relandCzech RepublicTurkeyBrazilDenmarkSwitzerlandLuxembourgI talySlovak RepublicGreeceMacao-ChinaKoreaLiechtenstein
Performance in mathematics
Females perform better
Males perform better
-60 -40 -20 0 20 40Performance in reading
Females perform better
Males perform better
Mathematics and reading

202020202020Low performing boys and girlsPercentage of students at or below PISA level 1
%
0
10
20
30
40
50
60
70
80Fin
land
Korea
Netherla
nds
Canada
Denm
ark
Sw
itzerla
nd
Japan
New
Zeala
nd
Australia
Irela
nd
Czech R
epublic
Sw
eden
France
Belg
ium
Slo
vak R
epublic
Icela
nd
Austria
Luxem
bourg
Norw
ay
Germ
any
Hungary
Spain
Pola
nd
Unit
ed S
tates
Portugal
Italy
Greece
Turkey
Mexic
o
Males Females
Performance in mathematics
0
10
20
30
40
50
60
70
80
Performance in reading
OECD (2004), Learning for tomorrow’s world: First results from PISA 2003, Tables 2.5b, 6.5, pp.355, 447.

212121212121 Gender differences in student performanceSome observations
In reading, girls are far ahead In all countries, girls significantly outperform boys in reading
In mathematics, boys tend to be somewhat ahead In most countries, boys outperform girls
… but mostly by modest amounts…… and mainly because boys are overrepresented
among top-performers while boys and girls tend to be equally represented in the “at risk” group
– Within classrooms and schools, the gender gap is often larger Strong problem-solving performance for girls suggests…
… that it is not the cognitive processes underlying mathematics that give boys an advantage…
… but the context in which mathematics appears in school
Why is the mathematics performance difference in PISA smaller than in other assessments?
Girls better on open-ended tasks (which dominate PISA) Boys tend to do better on multiple-choice tasks (which
dominate other assessments)

222222222222Motivational patterns and math
performance
-0.8
-0.6
-0.4
-0.2
0 0.2
0.4
0.6
0.8
LI EKORMACGRCSVKLUXI TADENI RLCHECZETUNNZLTURPRT
MEXCANURYRUSESPFRAFI NDEUJ PNHUNAUT
SWEBEL
NORUSAPOLAUSNLDI NDHKGLATYUGTHAI SL
Performance in
mathematics
Higher FemalesHigher Males
-0.8
-0.6
-0.4
-0.2
0 0.2 0.4 0.6 0.8 -0.8
-0.6
-0.4
-0.2
0 0.2 0.4 0.6 0.8
Interest in mathematics
-0.8
-0.6
-0.4
-0.2
0 0.2 0.4 0.6 0.8
Instrumental motivation
Higher FemalesHigher Males Higher FemalesHigher Males Higher FemalesHigher Males
Anxiety in mathematics

262626262626Do attitudes matter?
Gender difference in interest in math among 15-year-oldsand gender differences in math/computer university graduates
Gender difference (M-F) in iinstrumental motivation in mathematics at 15 years-old (2003)
A3.51. Percentage of females graduated in mathematics and computing for tertiary-type A and
advanced programmes.2. The greater the gender difference, the less females are motivated compared to males.
R2=0.35
15-year-old boys show higher math interest
15-year-old boys and girls show equal math interest
Equal proportions of male and female math/computer graduates

272727272727 Gender differences in attitudesSome observations
In mathematics, attitudinal differences are far more pronounced than performance differences
Girls report much lower interest in mathematics, less self-belief as mathematics learners, less motivation to use mathematics in the future and much greater anxiety when learning mathematics
Boys perform slightly better than girls in mathematics, but are much more confident and less anxious learning mathematics…
Attitudinal patterns of school children are closely matched by current study and career choices, much more closely than performance patterns
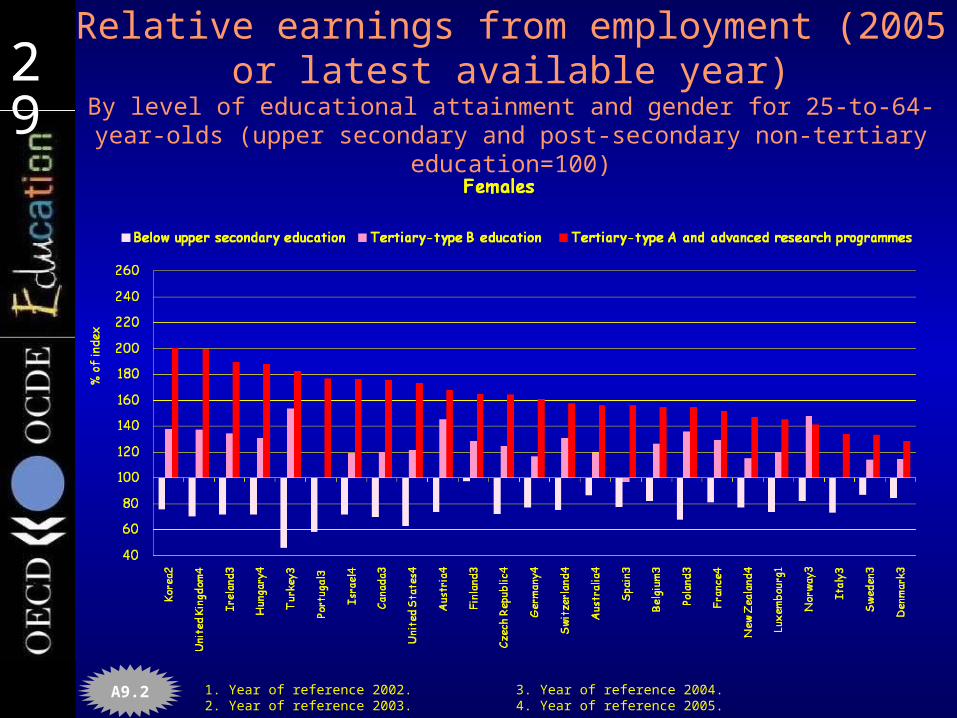
292929292929
A9.2
Relative earnings from employment (2005 or latest available year)
By level of educational attainment and gender for 25-to-64-year-olds (upper secondary and post-secondary non-tertiary education=100)
1. Year of reference 2002. 3. Year of reference 2004.2. Year of reference 2003. 4. Year of reference 2005.
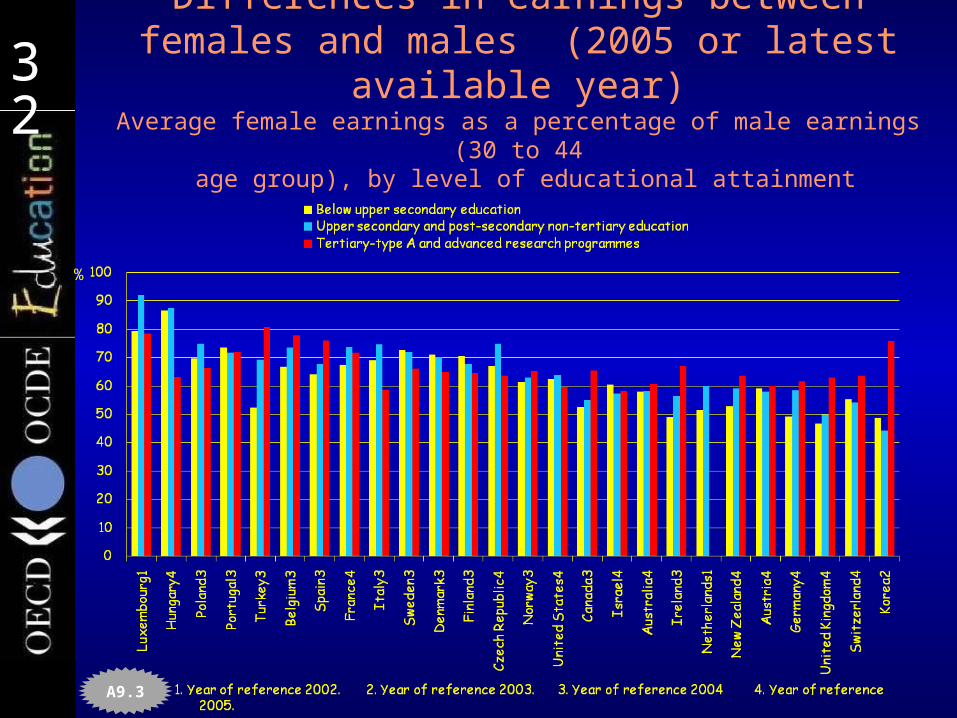
323232323232
%
A9.3
Differences in earnings between females and males (2005 or latest available year)
Average female earnings as a percentage of male earnings (30 to 44 age group), by level of educational attainment

33333333Gender differences – policy levers
National educ., social and economic context
Structures, resource alloc.
and policies
Social & economic
outcomes of education
Community and school
characteristics
Student learning, teacher working
conditions
Socio-economic background of
learners
Antecedentscontextualise or
constrain ed policy
The learning environment at
school
Teaching, learning
practices and classroom
climate
Individ attitudes, engagement and
behaviour
Output and performance of
institutions
Quality of instructional
delivery
Quality and distribution of knowledge &
skills
Policy Leversshape educational
outcomes
Outputs and Outcomes
impact of learning
Individual learner
LevelA
Instructional settings
LevelB
Schools, other institutions
LevelC
Country or system
LevelD
Domain 3Domain 2Domain 1

34343434
Thank you !Thank you !
www.pisa.oecd.org– All national and international publications– The complete micro-level database
email: [email protected]
…and remember:
Without data, you are just another person with an opinion
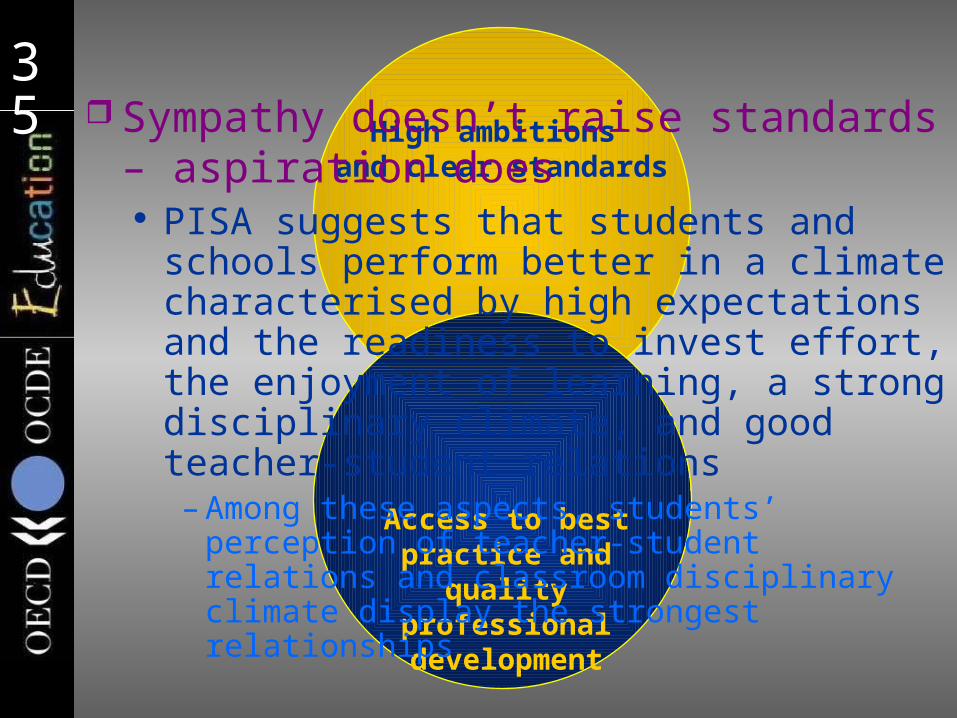
35353535High ambitions
and clear standards
Access to best practice and quality
professional development
Sympathy doesn’t raise standards – aspiration does PISA suggests that students and schools
perform better in a climate characterised by high expectations and the readiness to invest effort, the enjoyment of learning, a strong disciplinary climate, and good teacher-student relations– Among these aspects, students’ perception of
teacher-student relations and classroom disciplinary climate display the strongest relationships
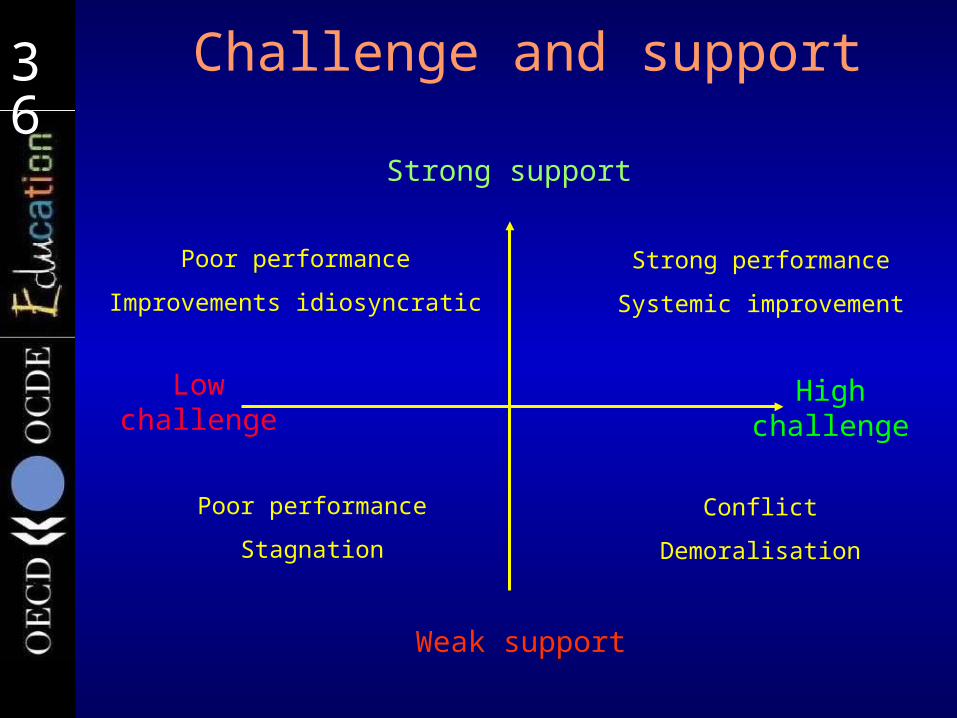
36363636 Challenge and support
Weak support
Strong support
Lowchallenge
Highchallenge
Strong performance
Systemic improvement
Poor performance
Improvements idiosyncratic
Conflict
Demoralisation
Poor performance
Stagnation
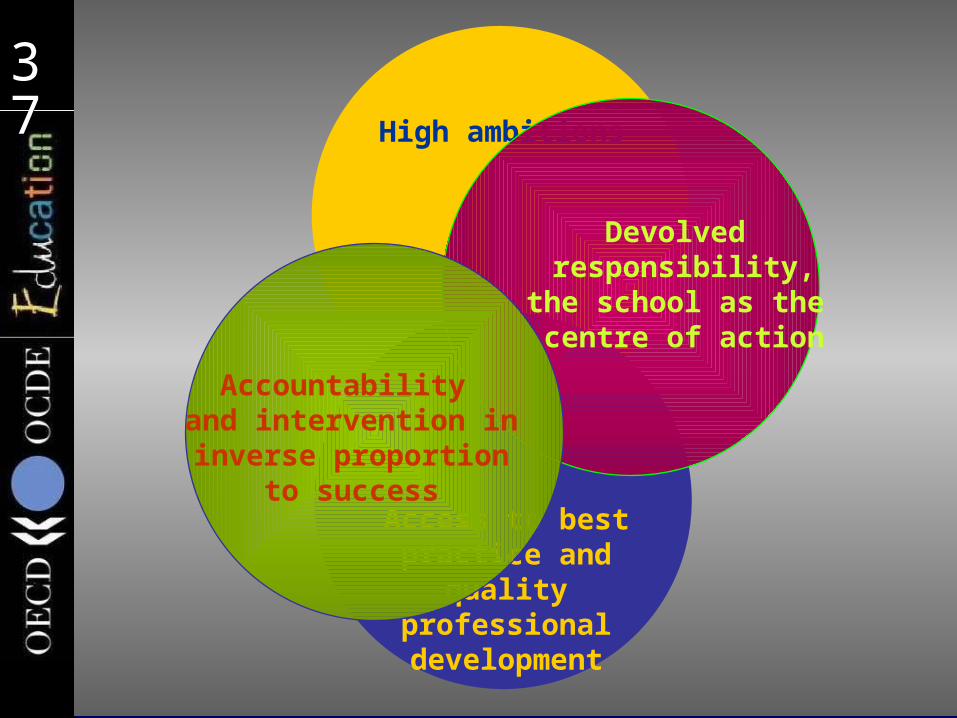
37373737High ambitions
Access to best practice and quality
professional development
Accountability and intervention in inverse proportion
to success
Devolved responsibility,
the school as the centre of action
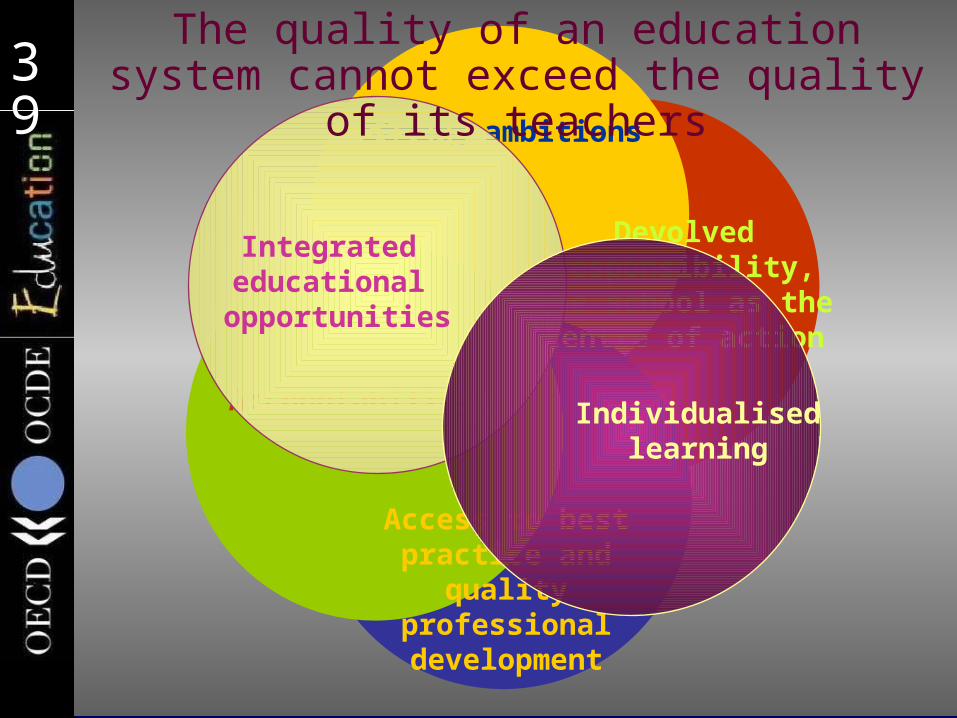
39393939Strong ambitions
Access to best practice and quality
professional development
Accountability
Devolvedresponsibility,
the school as the centre of action
Integrated educational opportunities
Individualisedlearning
The quality of an education system cannot exceed the quality of its
teachers

40404040High ambitions
Access to best practice and quality
professional development
Accountabilityand intervention in inverse proportion
to success
Individualisedlearning
Devolved responsibility,
the school as the centre of action
Integrated educational opportunities