W&M ScholarWorks W&M ScholarWorks
Dissertations, Theses, and Masters Projects Theses, Dissertations, & Master Projects
2005
Student athletes' collegial engagement and its effect on academic Student athletes' collegial engagement and its effect on academic
development: A study of Division I student athletes at a Midwest development: A study of Division I student athletes at a Midwest
research university research university
Susan Beth Hathaway William & Mary - School of Education
Follow this and additional works at: https://scholarworks.wm.edu/etd
Part of the Higher Education Commons
Recommended Citation Recommended Citation Hathaway, Susan Beth, "Student athletes' collegial engagement and its effect on academic development: A study of Division I student athletes at a Midwest research university" (2005). Dissertations, Theses, and Masters Projects. Paper 1550154086. https://dx.doi.org/doi:10.25774/w4-krp5-w574
This Dissertation is brought to you for free and open access by the Theses, Dissertations, & Master Projects at W&M ScholarWorks. It has been accepted for inclusion in Dissertations, Theses, and Masters Projects by an authorized administrator of W&M ScholarWorks. For more information, please contact [email protected].

STUDENT ATHLETES’ COLLEGIAL ENGAGEMENT AND ITS EFFECT ON
ACADEMIC DEVELOPMENT: A STUDY OF DIVISION I STUDENT
ATHLETES AT A MIDWEST RESEARCH UNIVERSITY
A dissertation
Presented to
The Faculty of the School of Education
The College of William and Mary in Virginia
In Partial Fulfillment
of the Requirements for the Degree
Doctor of Philosophy
by
Susan Beth Hathaway
May 2005
Reproduced with permission of the copyright owner. Further reproduction prohibited without permission.

STUDENT ATHLETES’ COLLEGIAL ENGAGEMENT AND ITS EFFECT ON
ACADEMIC DEVELOPMENT: A STUDY OF DIVISION I STUDENT
ATHLETES AT A MIDWEST RESEARCH UNIVERSITY
by
Susan Beth Hathaway
Approved May 19, 2005
n Pt . n ODorothy E. Finnegan, Ph.D. Chairperson of Doctoral Committee
David W. Leslie, Ed.D.
J. Douglas Toma, J.D., Ph.D.
ii
Reproduced with permission of the copyright owner. Further reproduction prohibited without permission.

Dedicated to the loves o f my life — Steve, Aidan and Anna.
iii
Reproduced with permission of the copyright owner. Further reproduction prohibited without permission.

TABLE OF CONTENTS
ACKNOWLEDGMENTS...............................................................................................................vi
LIST OF TABLES...........................................................................................................................vii
ABSTRACT................................................................................................................................... viii
CHAPTER 1........................................................................................................................................2Introduction............................................................................................................................2The Problem...........................................................................................................................3The Purpose........................................................................................................................... 5Limitations and Delimitations..............................................................................................6
CHAPTER II.......................................................................................................................................9Culture of NCAA Division 1................................................................................................ 9Academic Development......................................................................................................15
CHAPTER III............................................................................................................................25Research Questions.............................................................................................................27Research Design................................................................................................................. 29Data Collection................................................................................................................... 34Data Analysis.......................................................................................................................34Conclusion...........................................................................................................................35
CHAPTER IV...................................................................................................................................36Sample Demographics........................................................................................................36Outcomes for Hypotheses.................................................................................................. 38Multiple Regressions..........................................................................................................57Summary of Results...........................................................................................................63
CHAPTER V ................................................................................................................................... 65Discussion of the Results................................................................................................... 65Transferability of Study..................................................................................................... 77Future Research.................................................................................................................. 76Conclusions..........................................................................................................................76
APPENDIX A: Institutional Access..............................................................................................79
APPENDIX B: Human Subjects Permission...............................................................................80
APPENDIX C: Permission for Use of NSSE survey.................................................................. 87
APPENDIX D: Communication to Athletic Director.................................................................88
APPENDIX E: Email to Coaches................................................................................................. 89
iv
Reproduced with permission of the copyright owner. Further reproduction prohibited without permission.

APPENDIX F: Communication to Student-Athletes.................................................................90
APPENDIX G: Consent for Participation in Research Study...................................................91
APPENDIX H: 2004 National Survey of Student Engagement................................................93
APPENDIX I: 2004 NSSE Code B ook ...................................................................................... 97
APPENDIX J: Benchmark Questions.........................................................................................116
APPEMDIX K: Additional Demographics of School and Samples....................................... 118
REFERENCES.............................................................................................................................. 119
VITA...............................................................................................................................................125
v
Reproduced with permission of the copyright owner. Further reproduction prohibited without permission.

ACKNOWLEDGEMENTS
I would like to express my sincere gratitude to my doctoral committee for their support and inspiration throughout this long process. Dr. Dorothy Finnegan and Dr. David Leslie have been my advisors since the beginning of my doctoral work and Dr. J. Douglas Toma was there for me even before that as my master’s degree advisor. They are the three hardest working academics I know and are amazingly generous with their talents.
There are dozens of people at both the School of Education at William & Mary and the UMKC Conservatory of Music where I currently work that deserve the greatest of thanks Special thanks to my W&M classmates who crossed the line well ahead of me and promptly turned around to cheer me to the finish. I miss you all. Of special note are Carlane Pittman and Anita Friedman who helped me stay in touch with the goal across the many miles. To my friends at UMKC, you have been such a support.
To my siblings; Anne, Theresa, and Michael and their families, thank you for your encouragement and love. My parents, Pat and Nelson Itterly, have been a source of support in so many ways to me and my family through this process for which you are greatly appreciated.
Finally to the people that keep me going on a daily basis. My beautiful children are such an inspiration. Aidan is so smart and loving and Anna reminds me constantly that little girls (even ones my age) can accomplish anything. Finally I thank my husband, Steve, without whom none of this would matter, thank you for helping me along, following me to Virginia, and giving me the freedom to see this through. I love you.
vi
Reproduced with permission of the copyright owner. Further reproduction prohibited without permission.

LIST OF TABLES
4.1 Sex and Race o f the Two Samples.......................................................................................................374.21 Reliability Ratings...................................................................................................................................384.22 Benchmark Means and T-test for Equality o f Means......................................................................394.23 Academic Challenge Item Means and T-test for Equality o f Means........................................... 414.24 Active and Collaborative Learning Item Means and T-test for Equality o f Means.................434.25 Student-Faculty Interaction Item Means and T-test for Equality o f Means...............................444.26 Enriching Educational Activities Item Means and T-test for Equality o f Means.....................464.31 GPA and ACT Means and T-test for Equality o f Means...............................................................484.32 Correlation o f ACT Scores to Grade Point Average.......................................................................494.41 Correlation o f Benchmark Scores to GPA.........................................................................................504.42 Correlation o f Items o f Academic Challenge to GPA.....................................................................514.43 Correlation o f Items o f Active and Collaborative Learning to GPA........................................... 524 .44 Correlation o f Items o f Student-Faculty Interaction to GPA.........................................................544.45 Correlation o f Items o f Enriching Educational Activities t o ........................................................ 554.46 Time Spent on Non-School Activities................................................................................................ 564.51 Coefficients o f Regression for Athletes for Demographics and Benchmark Means............... 574.52 Coefficients o f Regression for Non-Athletes for Demographics and Benchmark M eans....574.53 Coefficients o f Regression for Athletes for Demographics and Benchmark Items..................584.54 Coefficients o f Regression for Non-Athletes for Demographics and Benchmark Items........594.55 Coefficients o f Regression for All Students for Demographics, Benchmark Items,
and Athletic Status................................................................................................................................. 604.61 Academic Majors o f the Two Samples...............................................................................................634.62 Academic Major Types o f the Two Samples.................................................................................... 64
vii
Reproduced with permission of the copyright owner. Further reproduction prohibited without permission.

STUDENT ATHLETES’ COLLEGIAL ENGAGEMENT AND ITS EFFECT ON
ACADEMIC DEVELOPMENT: A STUDY OF DIVISION I STUDENT
ATHLETES AT A MIDWEST RESEARCH UNIVERSITY
ABSTRACT
This study examined athletes and non-athletes at a Midwest research
university with Division I NCAA state. Both groups took the 2004 National Survey
of Student Engagement. Analysis of the results examined differences in the
benchmark scores for athletes and non athletes in the areas of “academic challenge,”
“active and collaborative learning,” “student and faculty interaction,” and “engaging
educational experiences.” Levels of engagement were measured and interaction
between engagement and academic success as measured by grade point average were
investigated. Non-athletes, who work outside the home and spend more time as
caregivers, are more engaged with their university academically. They take harder
courses, study more, engage in more critical thinking, and carry the concepts they
learn in their courses into discussions with other students once they leave the
classroom. Athletes, on the other hand, are more engaged with the non-academic
experiences at the university with an insular focus towards the world of athletics and
less time spent communicating with other students inside or outside of class. The
two populations appear to be most different in two critical pre-collegiate variables,
their collegiate aptitude as measured by their incoming ACT scores and their
selection of majors. Ultimately, the level of engagement has little correlation to their
academic success. Further more the mere fact that one is an athlete, does not predict
positively or negatively, one’s academic success.
viii
Reproduced with permission of the copyright owner. Further reproduction prohibited without permission.

STUDENT ATHLETES’ COLLEGIAL ENGAGEMENT AND ITS EFFECT ON
ACADEMIC DEVELOPMENT: A STUDY OF DIVISION I STUDENT
ATHLETES AT A MIDWEST RESEARCH UNIVERSITY
Reproduced with permission of the copyright owner. Further reproduction prohibited without permission.
CHAPTER I
INTRODUCTION TO THE STUDY
The relationship between intercollegiate athletics and the university has varied
throughout history. In the beginning of their relationship, sports were marginalized, with
university officials seeing athletics as frivolous and incidental to the purpose of education.
By the late 19th and early 20th century, sports had become an accepted part o f the university
experience by most involved in higher education (Rudolph, 1962; Veysey, 1965). Athletics
became associated with one important mission of higher education, the moral development of
students. Athletic programs progressed from the edge of the university experience to the
core. Throughout the rest of the 20th century the popularity and importance of intercollegiate
athletics has continued to grow exponentially at most universities across the country with
major milestones including the building of stadiums in 1910s and 1920s, the addition of radio
in 1930s and television in the 1950s. The emergent relationship with the national
professional sports associations also increased the stakes for all involved in college athletics
(Toma, 2003). Although athletics continued to increase in popularity, the connection
between athletics and the primary purpose of the university began to stretch. As the need for
athletic departments to be more commercial, to become self-supporting, as well as the
emotional relationship between alumni and sports, has forced colleges to pull athletics even
further from the center of its mission. The result is an environment very different from other
departments on campus that have not evolved in the same way.
For instance, few other units on campus connect so emotionally with alumni; draw on
the commercialism available to athletic departments (Rudolph, 1962; Sack & Staurowsky,
1998; Shulman & Bowen, 2001; Toma & Cross, 2000); appear so regularly in the media
Reproduced with permission of the copyright owner. Further reproduction prohibited without permission.
(Chu, 1989); are so controlled by rules and regulations (Suggs, July 1999); and recruit
individual students as heavily as do athletic departments (Bowen & Levin, 2003). These
factors, and many more, point to college athletics as having a unique position within
colleges’ environments. Does this atmosphere translate to a distinctive experience for
athletes? Do athletes lead atypical collegiate lives, separated from their non-athlete
counterparts or are they integrated in campus life to the same extent as the average
undergraduate student at the same school? Do they experience levels of active and
collaborative learning equal to non-athletes? Are their relationships with faculty and staff the
same? Do they have the same types of educational experiences as other students?
If athletes do have different experiences than other students, do these differences
impact their ability to succeed academically? Although student success can be defined in a
number of ways, this study examined students’ grades as a reflection of how well they
perform in their academic studies.
The Problem
This study was designed first to assess the degree of engagement of college athletes at
a Division I school versus non-athlete students. Second, since student engagement,
particularly that which is tied to academic subjects, has been shown to be related positively to
academic success (Pace, 1982; Astin, 1993; and Anaya, 1996), this study examined if a
correlation existed between the level of engagement of student athletes and academic success
as demonstrated by grade point average. Confounding variables, like race, gender, and pre-
collegiate preparation, as exhibited by ACT have also been considered.
This study addressed several groups of research questions. These questions are
prompted by factors engagement researchers have found to correlate to student academic
Reproduced with permission of the copyright owner. Further reproduction prohibited without permission.

success. The first set of questions was designed to inquire into the level of academic
challenge experienced by students. Do athletes take classes with the same academic rigor as
non-athletes? How do classes taken by both groups compare in the number of assignments,
textbooks, papers, and required study time. Does the work involve analysis, synthesis, the
drawing of conclusions and the application of theory?
The second set of questions inquired into the active and collaborative learning that
exists in a student’s college experience. Do athletes ask questions in class, make
presentations, work with students on group projects, work together on community projects
outside of the classroom, tutor other students, or discuss class-related subjects outside of
class time?
The third set of questions points to the level of interaction between students and
faculty. Do athletes discuss grades, their careers or class subject matter with their professors
outside of the regular course time? Do they work with professors on research or community
based projects? Are the levels the same for athletes and non-athletes?
The fourth cluster o f questions deals with whether athletes are as engaged in their
college experience as non-athletes. How do athletes compare to non-athletes in their
participation of enriching activities like extracurricular activities, practica or internships,
community service or volunteerism, and interaction with individuals of diverse backgrounds?
Each of these sets of questions was investigated with the 2004 National Survey of Student
Engagement and resulted in a composite score that was then tested for a correlation with
academic success as exhibited by GPA.
Reproduced with permission of the copyright owner. Further reproduction prohibited without permission.

5
The Purpose
This study and the questions described in the problem section explore an unexamined
connection between involvement theory and student-athlete success in Division I athletics.
Each of the four benchmarks mentioned provide insight to those factors that appear as
detrimental to academic development. Benchmark one, “level of academic challenge”
provided needed research in an area difficult to study, the rigor of coursework taken by
athletes. The practice of athletes clustering in majors perceived by students to be “easier”
appears frequently in the literature but it is unclear in many studies whether the course work
is actually less challenging (Adler & Adler, 1985; Bowen & Levin, 2003; Pascarella, Bohr,
Mora, & Terenzini, 1995; Sack, 1987). This research established whether classes taken by
athletes are as rigorous as those taken by non-athletes.
The second benchmark, “active and collaborative learning” informed research on the
kinds of student-to-student relationships experienced by athletes and non-athletes and
whether they have the same level of interactions. These relationships have been shown by
Pascarella (1985) as well as Astin (1993), Feldman & Newcomb (1969), and Pascarella &
Terenzini (1991) to affect student development positively. This research confirmed whether
this relationship is as important to academic development in athletes as it is in the general
population.
The third benchmark, “student-faculty interaction” adds to the already solid body of
knowledge about the importance of student-faculty interactions which indicates that strong
relationships with faculty are beneficial to students’ academic development. (Chickering &
Reisser, 1993; Kuh, Schuh, Whitt, Andreas, Lyons, Strange, Krehbiel, & Mackay., 1991;
Pascarella & Terenzini, 1991; Stark & Lattuca, 1993). The extent to which athletes
Reproduced with permission of the copyright owner. Further reproduction prohibited without permission.

experience these relationships and the effect that they have on their academic development
are an important addition to the literature.
Finally the final benchmark, “enriching educational experiences” addressed the need
to understand the affect of a student’s involvement in learning-centered extracurricular
activities on their academic development. Research by Astin (1993) and Feldman and
Newcomb (1969) show this involvement as being significant. This research determined
whether athletes experience the same levels of involvement as other students and if these
experiences impact their academic development.
Overall this research uncovered the level of engagement of student athletes as it
compares to non-athletes and supplements known research about engagement as it impacts
athletes’ academic development. Finally, it is important to constantly add to the general body
of knowledge about athletes in general. Some of the most thorough research on athletics is
aging. It is important for institutions to understand how athletes’ experiences have changed
since this research was conducted. This information further provides athletic administrators
with the tools to foster the most positive environment possible. Information about possible
reasons for student-athletes academic success is needed to create policies, practices and
attitudes to encourage student athlete success.
Limitations and Delimitations
This study has its limits. First, the study was designed to determine if correlations
exist between student engagement and academic development; it cannot definitively speak to
cause and effect. The small sampling of athletes in this group requires the 2004 survey be
administered to all of the 2004-2005 academic year athletes. The original administration of
the survey tool to the general population of students was administered to freshman and
Reproduced with permission of the copyright owner. Further reproduction prohibited without permission.

7
seniors only. The small number of athletes available to complete the survey required the
researcher to rely on data from sophomores and juniors as well. Small differences exist
between the responses of freshmen and seniors but it is the hope that sophomore and junior
responses will fall along the spectrum between freshmen and seniors.
Third, the study is limited to undergraduate students because most athletes participate
during their undergraduate years. Although students occasionally enroll in graduate school
prior to using all of their athletic eligibility, the inclusion of data from graduate students
would introduce a variety of factors that would confound the study. Graduate students, as
well as graduate work, are quantitatively different than undergraduates and their experiences.
Graduate students are older, more likely to be employed off campus while in school and less
likely to be involved in campus life (Pascarella & Terenzini, 1991). The fact that they are
pursuing an advanced degree implies a greater commitment to academic development than
the undergraduate student who may not continue their formal education. As athletic
programs are overwhelmingly oriented toward undergraduate students, the data collection
was restricted to undergraduate students.
Finally this study is limited to a single university with Division I athletics. NCAA
Division I consists of institutions of great variance, both as institutions and as athletic
programs. In addition to the differences in selectivity and size of the institution, the athletic
programs differ in the sports they offer and their commitment to football. The diversity of
institutions within Division I necessarily limits the ability to generalize these results to all
Division I institutions but provides results that are helpful to those with similar profiles as the
Midwest City University, a Division I-AAA school with basketball teams but no football.
Eighty-eight other institutions or 27 percent of all NCAA institutions fall into this category of
Reproduced with permission of the copyright owner. Further reproduction prohibited without permission.

8
Division I (NCAA website, 2004). “Big-Time” football schools make up 36 percent
(Division I-A) and another 37 percent have small football programs (Division I-AA). The
results of this study are useful to those schools with small or no football programs whose
relative size and selectivity is comparable to Midwest City University (National Collegiate
Athletic Association website, 2004).
Reproduced with permission of the copyright owner. Further reproduction prohibited without permission.
9
CHAPTER II
LITERATURE REVIEW
A study of this nature requires an understanding of athletic culture and the academic
development of athletes. First, this review briefly explains the major characteristics of
athletic culture. Second, it examines what is known about the academic development of
athletes. The athletic experience may contribute to and enhance the student development or
detract from the gains believed to be associated with college attendance. How are these
effects moderated by pre-collegiate preparation, student athlete characteristics and program
specific? The existing literature in these areas is explored. Before academic development of
athletes can be approached, however, athletic culture must be understood.
Culture o f NCAA Division I
Most scholarship on intercollegiate athletics describes the most heterogeneous of the
three NCAA divisions, Division I. It is subdivided into three categories based on the
individual institution’s commitment to football. With the exception of schools who maintain
substantial basketball and no football, the term, “big time” athletics, refers to Division IA.
The characteristics of big-time athletic culture revolve around the key elements of finance,
rules and regulations, and authority and power.
Finance. With few exceptions, Division I schools are large public institutions that
have at one point or another dealt with the issue of state funding. For the most part, these
institutions do not rely on state funding for athletics but instead turn to external
constituencies for financial support (Toma & Cross, 2000; Toma, 2003). The influence
external constituencies wield has driven much of the development of big-time sports
(Shulman & Bowen, 2001). One NCAA vice president stated that Division I athletic
Reproduced with permission of the copyright owner. Further reproduction prohibited without permission.

10
programs serve the basic function of providing opportunities for the institution to affiliate and
create ties with external constituencies (NCAA, 2000). These relationships are difficult to
create through other university departments. Relationship building, and the money that
follows, is therefore a primary goal for the athletic program (Toma, 2003).
Another financial consideration for athletic departments is revenue generation.
Institution’s decision making about athletic programs frequently comes down to the
economic impact the program has on its corresponding institution. Several years ago, the
Notre Dame football television contract, for instance, was worth $45 million to that
University (Eitzen, 1999). Similarly, CBS signed a multi-year, $215.6 million contract for
the television rights to the NCAA men’s Division I basketball tournament that same year. In
2005, the College Sports Television (or cstv.com) negotiated with the NCAA and CBS for
the streaming video rights for the NCAA Division I mens’ basketball tournament for a multi
year contract (NCAA, 2005). Financial considerations extend beyond decisions made by
singular institutions. Much of the money in big time athletics is filtered down to NCAA’s
member institutions through conference affiliation. In 1998, $140 million was paid to the
conferences that participated in bowl games (Suggs, August 6, 1999). The NCAA has
additionally sold the naming rights for 28 bowl games for the 2005-2006 season (NCAA,
2005). The financial payoff, however, is not just from network deals. A 1998 season ticket
to the Nebraska Huskers football games started at $1,000. A suite at a football stadium or
basketball arena can bring in as much as $200,000 over a ten year period (Suggs, April 23,
1999). Institutions also gain revenue from corporate sponsorships (of everything from
uniforms to arenas and stadiums), franchising university logos and lucrative licensing
Reproduced with permission of the copyright owner. Further reproduction prohibited without permission.

11
agreements. With these kinds of incomes at stake, Division I universities strive for high
profile, winning programs to maximize their gains.
However, sports programs and particularly football teams are extremely expensive
and very few programs— only 6.2 percent of institutions in all the divisions—make any profit
(Eitzen, 1999). The kind of revenues mentioned above is reserved for the most elite
programs. The result is a “ratcheting” effect where large (but less competitive) programs
aspire to hit big time status where they can recoup some of their losses by increasing their
athletic budgets. This phenomenon is what Gary Roberts called the “athletic arms race”
(Eitzen) and greatly worried current NCAA president Myles Brand (NCAA, 2005).
Being big, though, does not ensure profit. Although some programs enjoy program
profits, others with large sources of revenue have problems balancing their books. A 2005
survey by the National Collegiate Athletic Association showed athletic budgets “grew at a
double-digit rate between 2001 and 2003.” More and more of the budget was subsidized by
university funds and student fee (NCAA, 2005) The University of Wisconsin received $1.1
million from its winning participation at the 1998 Rose Bowl, but spent $1,386,700 taking
832 people to Pasadena for the game (Suggs, November 12, 1999). Michigan, a school
enjoying some of the largest revenues described above, still lost 2.8 million on athletics
(Shulman & W.G. Bowen, 2001). Of course the accounting of the athletic department books
does not show the entire fiscal picture. In addition to the profits or losses of the athletic
department, the institution must consider the other benefits or costs to the university such as
free publicity, increased enrollment and athletic-related donations. Other hidden costs
include the construction and maintenance of athletic facilities, which are frequently paid for
by bonds (Suggs, November 12, 1999). The NCAA reported the average Division I schools
Reproduced with permission of the copyright owner. Further reproduction prohibited without permission.

12
spends $9.4 million each year on capital costs. $1.1 million is spent by Division II and $2.3
million is spent by Division III (NCAA, 2005). Like many facilities on campus, athletic
buildings have had their maintenance deferred. At the University o f Wisconsin, it required at
least $59.5 million to bring their facilities to the level needed to ensure competitive play
(Suggs, November 12, 1999). One conclusion drawn from this discussion is that both the
necessity for universities to connect with external constituencies and the emotional power
that sports bring to institutions, can overshadow the need for big time athletics to be fiscally
sound.
Authority and power. A confounding variable in understanding athletic culture is the
employment norms of the athletic director. Athletic directors across all levels of competition,
report directly to the president of the university and are paid by the university. Division I
athletic directors, however, may also receive a large part of their salary from an independent
athletic foundation or a contract from a shoe company (Toma & Cross, 2000). Thus another
constituency demands yet more attention from the athletic program. Shoe companies want to
be promoted by teams who win. The pressure to win is increased. This pressure often in turn
influences administrative decisions that lead to the creation of a hierarchy within the athletic
culture. Although ideally the athletic director treats all teams and all athletes fairly, in reality,
financial considerations often drive many decisions (NCAA, 2000). Thus, the most
successful and revenue-generating teams may be given weight room privileges at more
convenient times than those teams that are not as successful. The football team may fly to a
competition while the soccer team rides a bus. Within the allocation of limited resources, a
hierarchy emerges that becomes clear to academic personnel and athletes alike. This
Reproduced with permission of the copyright owner. Further reproduction prohibited without permission.

13
hierarchy is further reinforced when external constituencies place further pressure on the
athletic director to commit to one priority over another.
Reform. Reform in intercollegiate athletics has been an issue since 1929 when the
Carnegie Foundation for the Advancement of Teaching published the first report on the issue
(cite?). Since then reform has been mentioned repeatedly as it related to academic issues. In
March 1991, the John S. and James L. Knight Foundation issued a report that prompted the
NCAA to move the power within the divisions from athletic administrators to the presidents
of the university (Knight Foundation, 2005). By the 10th anniversary, the Knight Foundation
feared that things hadn’t improved much and issues another report entitled, “A Call to
Action: Reconnecting College Sports and Higher Education” (Knight Foundation). In
January of this year, Division I recommended new policies using an Academic Performance
Rate (APR and a Graduation Success Rate (GSR) as indicators. By April discussions had
already begun about loosening the APR policies to accommodate athletes that leave college
early for a career in professional sports (NCAA, 2005). Reform extends beyond “big time”
athletics. In April, the Division III president’s council recommended “amending the Division
III philosophy statement to specify an expectation that student athletes’ academic progress
should be, at a minimum, consistent with the general student body (NCAA, 2005). They also
considered an examination of the consistency of admission standards between athletes and
non-athletes and using “best practices” to encourage the involvement of student-athletes in
campus life (NCAA).
Rules and regulations. Financial gain combined with the priority given to a wide
range of external constituencies, place pressure on institutions to have successful teams.
Some programs resort to or permit the violation of both NCAA regulations and school
Reproduced with permission of the copyright owner. Further reproduction prohibited without permission.

14
policies to ensure this success. Hazing, academic fraud, recruiting violations, and the cover-
up of athletes’ violations of school regulations and local, state and national laws, are
significant problems for institutions (Adler & Adler, 1985; Coakley, 1998; Eitzen, 1999;
Sack & Staurowsky, 1999; Sage, 1998; Shulman & Bowen, 2001; Thelin, 1994; Toma &
Cross, 2000).
As the stakes increase, so do the number of priorities to be balanced. The attention to
winning takes precedent over other goals of the program and in some cases becomes the
solitary focus. Consequently, conscientious attention to student development takes a back
seat to the other goals of intercollegiate athletics (Adler & Adler, 1985; Coakley, 1998;
Eitzen, 1999; Sack & Staurowsky, 1999; Sage, 1998; Shulman & Bowen, 2001; Thelin,
1994; Toma & Cross, 2000). The athletic department appears to emphasize its business
enterprises rather than being an extracurricular experience for students. None-the-less, some
Division I schools do focus attention on academic achievement, while others struggle to do so
(NCAA, 2000). When athletes spend the majority of their time as part of the business
enterprise of athletics and a minimal amount on the scholastic experience of college,
academic development suffers. Given the pressures to win in Division I, it is easy to see why
45 percent of student athletes in the division feel forced to be an athlete first and a student
second (Sack, 1997).
Given the pressure asserted on Division I athletes, particularly in revenue-generating
sports, Division I could be the most difficult environment for student athletes to be treated
like other “normal” students. Their athletic success has broader implications for the
University than does their academic success or the success of most other students of the
university. It is not difficult to understand, therefore, how policies and practices have
Reproduced with permission of the copyright owner. Further reproduction prohibited without permission.

15
emerged that direct athletes towards the goals of athletic success rather than a more
“balanced” student experience. Whether for these reasons or others, Division I athletes have
the largest gaps in academic success compared to their non-athlete counterparts. The
specifics of athlete academic development in Division I as well as at other schools are
outlined below.
Academic Development
What effect does athletic participation have on academic development? Answering
this question requires an understanding and appreciation for the complexity of college
development and athletic culture. The literature on academic development of student
athletes involves three bodies of work: graduation rates, grades and cognitive development.
Conflicting research in these areas is evident and methodological inconsistencies within
much of the research further exacerbate the confusion.
Limitations o f Research Design. In addition to the literature on Division I athletics
there is also research on Division II and Division III athletics. The schools in these divisions
have different policies and attract different student athletes than do Division I schools.
Therefore, athletic culture in general is complex and heterogeneous, a fact that poses design
problems for researchers. The idiosyncrasies of institutions of higher education and sports
programs across the country make generalization difficult regardless of the method.
If researchers choose a study of breadth, the basic problem is one of aggregation,
across institutions and within them, and between individuals of different race, gender, and
socioeconomic status. Research that clusters together institutions like the University of
Michigan (NCAA, Division I), Grand Valley State University (NCAA, Division II), and
Aquinas College (NAIA)—three institutions in Michigan—might miss significant factors
Reproduced with permission of the copyright owner. Further reproduction prohibited without permission.

16
specific to institutional culture and level of competition. Even when researchers utilize the
National Collegiate Athletic Association (NCAA) and the National Association for
Intercollegiate Athletics (NAIA) classifications to group schools together, great variance
exists within each level of competition and within the cultures of the individual institutions.
Further complicating the researcher’s job are the differences between sports at a
single institution. Each sport has its own sub-culture that is affected by its history and role as
a revenue or non-revenue generating sport. Much of the literature that separated revenue and
non-revenue sports, show differences in the two groups’ academic development (Bowen &
Levin, 2003; Hood, Craig & Ferguson, 1992; Maloney & McCormick, 1993). Bowen and
Levin further distinguish athletes as “recruited” or “walk-ons”, finding differences in pre-
collegiate preparation, grades, and underperformance (the relationship between SAT scores
and class rank) between the two groups. The participants within each sport can also vary in
race, gender, and socio-economic status, factors that have all been shown to affect student
outcomes (Pascarella & Terenzini, 1991).
When comparing athletes to non-athletes, researchers experience another set of
problems. Nationally, the pre-college characteristics of athletes are often different from those
of the general student body (Snyder, 1996). High school GPA and standardized admissions
tests scores for student athletes are frequently lower than those of non-athletes. These
differences hold true whether level of competition or school selectivity is inspected (Bowen
& Levin, 2003; Hood, Craig & Ferguson, 1992; Siegel, 1994; Stuart, 1985). A strong
correlation does exist between college preparedness and success in college (Cross & Koball,
1991; Sedlacek & Adams-Gaston, 1992), although some authors dispute the validity of these
standards as predictors of success (Jacobson, 2001). Standardized tests are particularly
Reproduced with permission of the copyright owner. Further reproduction prohibited without permission.

17
suspect in their ability to predict academic achievement for African Americans (Petrie, 1993;
Sellers, 1992; and Young & Sowa, 1992). Given the collective socioeconomic and
educational disadvantages often experienced by this group, differences in outcomes not
surprisingly appear if these characteristics are not statistically or methodologically controlled.
Although race is incorporated into the more complete studies on athletics, socioeconomic
status is less often considered.
Thus, methodological difficulties have sometimes resulted in an incomplete picture of
athletes and their academic outcomes. Current definitions of academic achievement and the
data available on athletes’ academic success focus on one or more of the following: the rate
at which student athletes graduate (used frequently), the grades they receive (used
occasionally) and the learning that actually occurs while in college (rarely considered).
While this last attribute appears to be the worthiest to know, it is the most elusive data to
collect.
Graduation rates. Graduation rates are used frequently in studies on student
development in general because they are relatively easy to obtain. The Integrated
Postsecondary Education Data System (IPEDS) and the NCAA standardized the collection of
graduation data in 1996. Since then, graduation rates for student athletes have been readily
available for both research as well as policymaking. Graduation rates, however, can often be
misinterpreted if they are not examined in a desegregated manner. The 2003 NCAA
Graduation Rate Summary reported the rate of degree completion for the entering freshman
class of 1996. Sixty-two percent of Division I freshman athletes at NCAA institutions in
1996 had graduated by 2002 with 52 percent of Division II and 54 percent of Division III
freshmen graduating by 2002. This percentage is just slightly higher than that of all freshmen
Reproduced with permission of the copyright owner. Further reproduction prohibited without permission.
18
59 percent for Division I and 45 percent for Division II and slightly lower for Division III
with 62 percent of all freshmen graduating by 2002 (NCAA website, 2003). It should be
noted that data were only collected for those athletes who received athletically-related
scholarships or financial aid, making it a less accurate reflection of Division II and Division
III whose have fewer athletes on athletic scholarship.
The numbers for Division I, however, are more complete and might imply that
intercollegiate athletics has a minimal effect on the graduation rate of students. When the
data are desegregated by race and gender, however, stronger conclusions can be drawn from
certain subsets of athletes. African American male athletes are more likely to graduate than
their non-athlete African American peers by thirteen percentage points (48 percent vs. 35
percent) while Caucasian male athletes barely edged out the general male student body 59
percent to 57 percent. Caucasian female athletes have the highest rate of graduation, after a
relatively small number of Asian American female athletes, with 72 percent completing a
degree in six years compared to 64 percent of their Caucasian female counterparts. African
American female student athletes show the greatest advantage over their peers (62 percent vs.
46 percent). While persistence to graduation is increased for African American athletes,
African American students (athletes and non-athletes) have a much lower graduation rate
than Caucasian students. Thirty-five percent of African Americans graduate after six years
compared to almost 59 percent of Caucasian students (NCAA website, 2003).
Consequently, athletes as an aggregate graduate less frequently than the general collegiate
student population because of the disproportionate number of African Americans in athletic
programs. Nationally, African Americans compose 10.4 percent of the student population, a
large portion of which is concentrated in historically black colleges and universities
Reproduced with permission of the copyright owner. Further reproduction prohibited without permission.

19
(Chronicle of Higher Education Almanac, 1999-2000). In contrast, over 50 percent of
Division I football and basketball athletes are African American (Lapchick, 1987).
Therefore, the generally poorer graduation rates of African Americans are positively modified
by athletic participation, but not enough to compensate for the disproportionality o f African
Americans in sport (Siegel, 1994).
Why are higher graduation rates linked to athletic participation? Is there something
inherent in sport that promotes academic commitment? One factor could be motivation.
Athletic participation has been positively correlated with students’ motivation to finish their
degrees (Pascarella & Smart, 1991; Ryan, 1989). Persistence, as defined in these studies,
however, may have more to do with four characteristics of student athletes than athletic
participation itself. First, student athletes are required to attend college full-time. The
general student body, however, consists of 33.7 percent part-time students (Chronicle of
Higher Education Almanac, 1999-2000). Part-time students are less likely to persist to
graduation (Astin, 1993), thus graduation rates are skewed in favor o f athletes. Second,
athletes are more likely to be of traditional age while 39.2 percent of students enrolled in
1997 were over the age of 25 (Chronicle of Higher Education, 1999-2000). Athletes reside on
campus in larger numbers than the general population because of the previous two
characteristics. On-campus residency increases persistence according to Astin. Finally,
financial hardship, one reason that some students leave school, is more likely to affect the
general student body than athletes, the majority of whom (in Division I and II) receive full or
partial scholarships. Although some athletes must stay in college beyond the term of their
scholarships, the NCAA Foundation annually awards over $950,000 to assist athletes in the
Reproduced with permission of the copyright owner. Further reproduction prohibited without permission.

20
completion of their degrees (NCAA website, 2000). Athletes from lower socio economic can
also make use of federal assistance when their athletic eligibility is over.
Grades. Graduation rates are not the only indicator used to measure academic
success. Grades have also been used to determine if athletes are developing academically. It
is possible that athletes graduate at higher rates than non-athletes but with less success in
their individual courses, making GPA an important measurement to monitor.
Hood, Craig, and Ferguson (1992) studied 2000 athletes and non-athletes, matched
for backgrounds and abilities, at a Division I school. Football players received significantly
lower grades than did non-athletes with similar academic preparation. Yet, two other studies
found no differences between athletes, including football players and non-athletes. In one
case, although athletes entered a large Midwestern state university with lower academic
preparation, no significant difference in the mean GPA existed between athletes and non
athletes for the first two years of college (Stuart, 1985). This study statistically controlled
many of the most important variables ignored by other researchers, but was conducted on a
cohort of athletes from 1977-1980. The question should be asked if this group of students
represents today’s student athletes or has the athletic culture changed enough to alter student
outcomes over the past 20 years. A more recent study by Richards and Aries (1999) found
athlete and non-athlete seniors to have similar grade point averages at a Division III college,
however, football players spent less time in class than other athletes and non-athletes alike.
Maloney and McCormick (1993) presented the most comprehensive research on
athletes and their grades. They analyzed all of the undergraduate student grades at Clemson
University, a Division I school of 12,000 students. Controlling for pre-collegiate
characteristics, institutional profile, ease of course, and student course load, they found
Reproduced with permission of the copyright owner. Further reproduction prohibited without permission.

21
significantly lower grades for football and basketball players that could not be accounted for
by their pre-collegiate variables. Lower grades were earned despite the fact that these
athletes took easier classes as determined by the average grade per class by all students.
These results imply that the negative effects of football and basketball participation are
moderated somewhat by course selection. Further, poor grades among football and
basketball players have been statistically linked to the season during which the athletes
compete and practice. “Football players receive a letter grade lower than [equally prepared]
non-athletes in approximately half of their courses during the semester of participation”
(Maloney & McCormick, 1993, p. 566). In this study and the Hood, Craig, and Ferguson
(1992) study, no significant difference was found between non-athletes and those athletes in
non-revenue generating sports. Bowen and Levin (2003), studied Ivy League schools and
select schools in Division I and argue that recruited athletes across all sports are more likely
to “under perform” than non-athletes and walk-on athletes. An athletes’ performance was
derived from an analysis of their grades, as shown by class rank, in relation to their SAT
scores. After controlling for race and field of study, recruited athletes were ranked 25.8
percentile points lower than a comparable non-athlete with the same SAT.
A factor that modifies both graduation rates and grades is a students’ course load.
Students across all NCAA divisions, reportedly take fewer credits than non-athletes (Sack,
1987). In Division I, where teams compete in a national limelight, half the students select
fewer credit hours whereas the proportion is less in Division II (41 percent) and Division III
(29 percent) (NCAA, 2004). However the low proportion of students with fewer hours in
Division III may be related to individual institution. In localized research, Stuart (1985)
found no evidence of lighter loads at a Division III college.
Reproduced with permission of the copyright owner. Further reproduction prohibited without permission.
22
With the exception of the Brown and Levin study, four other studies on athletes’
grades were conducted at individual institutions and produced different results, suggesting
that the type of institution may be an issue. Bowen and Levin studied schools belonging to
the Ivy League, University Athletic Association, the New England Small College Athletic
Conference, and a cohort of women’s colleges. Although they found consistency across
schools within each group, the results varied greatly between conferences. The environments
created by the institutions in each of these conferences for athletic subgroups may be
instrumental in the athletes’ ability to succeed, the implication being that some athletic
programs or institutions may be more academically supportive than others. This premise is
supported by the fact that twice as many Division I athletes compared to athletes from less
competitive levels thought that sports participation was affecting their college work (Curry,
1991).
Actual learnings The third measurement of academic achievement examines actual
learning and is the most difficult to assess. Students can receive good grades and graduate,
yet fail to learn or develop cognitively. Even though the stereotype of the “dumb jock” that
enrolls in courses like “underwater basket weaving” is an exaggeration in the extreme,
athletes do choose less rigorous academic majors (Adler & Adler, 1985). Despite high
personal expectations of academic success, only a quarter o f male basketball players at a
medium-sized private institution who had originally been enrolled in pre-professional
programs, continued with these majors through graduation. The remaining athletes chose
more “manageable” majors. Likewise, 39 percent of male and 20 percent of female Division
I student athletes felt that the demands of participation in competitive sports had forced them
Reproduced with permission of the copyright owner. Further reproduction prohibited without permission.

23
to take “less demanding majors” (Sack, 1987). With less demanding majors, the enrollment
in less demanding courses can be inferred.
Athletes also appear to “cluster” in the easier majors, a phenomenon in which at least
25 percent of a team enrolls in a major that is otherwise selected by only 5 percent of the
general student body (Bowen & Levin, 2003; Pascarella et al, 1995; Sack, 1987). This
implies that athletes can become isolated from the individuals in the general student
population at least in their coursework. With large numbers of athletes pursuing the same
academic major, comes less interaction with a more diverse set of individuals. Clustering
more likely occurs in majors where the professors are sympathetic to the athletes’ schedules
and less rigorous in their demands. Both of these issues are discussed later.
Using a national database of freshman, Pascarella, Bohr, Nora, and Terenzini (1995)
statistically controlled college aptitude, motivation, age, ethnicity, place of residence, social
origin, course load, school reputation, and NCAA divisional status to determine the cognitive
impact of athletics on students. Disaggregating by sport and gender they found that football
and male basketball players actually regressed on standardized reading and math tests after
their freshman year. This regression comes at a point in college when students, in general, are
making their greatest cognitive gains (Pascarella & Terenzini, 1991). One possible
explanation is that football and basketball players enroll in more applied and professional
majors that do not emphasize reading and math cognition. Female athletes and male athletes
in non-revenue sports had smaller positive cognitive gains than did non-athletes but did not
regress like the football and male basketball players. Although the previous research
involving academic achievement of football and basketball players indicates that the type of
institution plays a major role in the success of the student, this study shows learning being
Reproduced with permission of the copyright owner. Further reproduction prohibited without permission.

24
affected across all types of colleges and universities. The composite of these findings implies
that something inherent in the culture of the sport—as opposed to the institution—may
inhibit academic development.
Overall, research indicates some variance in the effect of athletic participation on
students’ academic development. While participation does increase persistence to a degree
for almost all groups, some student athletes struggle with other aspects of academic success.
Particularly at Division I programs, grades are somewhat lower. The most critical concern,
however, is for male athletes who compete in football and basketball. These two groups
graduate the fewest number of students because of the lower preparation levels of those who
participate. Consequently they have poorer grades than other athletes and non-athletes,
choose easier majors, and show a regression in their cognitive development. As can be seen
a number of factors relate to academic development of athletes, level of competition, team
sport, academic background, gender and race all impact this development.
From the literature on athletic culture and student development of athletes, one can
see that the academic development of student athletes is different than that of the non-athlete.
Furthermore, the type of institution and athletic program play into athletes’ student
development. Few, if any, of these studies draw a correlation o the involvement or
engagement of the student athlete with their campus environment. This study was designed
to further the knowledge of student athletics by specifically examining how engaged athletes
are at an urban Division I and if this engagement is linked to their academic success.
Reproduced with permission of the copyright owner. Further reproduction prohibited without permission.
CHAPTER III
RESEARCH METHODOLOGY
The literature on the academic development of the student-athlete has
provided some insight into the experience of those participating in intercollegiate athletics.
To be sure, the picture is incomplete. This study contributes to what is known about student-
athletes’ academic development by connecting student athlete success to concepts of student
engagement and quantitatively examining two questions. Are student athletes engaged in
their college environment the same way as non-athletes? Do student athletes’ levels of
commitment correlate with their student success as evidenced by GPA? The conceptual
framework for this study is found in student development literature, a large body of which
points to the premise that student achievement can be linked to the extent to which students
become involved with their collegiate environment. Astin (1993) and Pace (1987) suggest
that the more invested a student is in the learning process and the activities of his or her
campus more successful he or she is in persisting to graduation. Studies by Pace, Astin, and
Anaya (1996) suggest that student learning is enhanced by the quality of one’s efforts at
college-related activities. An ever-growing body of knowledge, likewise, has broken down
these college-related activities and studied their individual correlation to student
achievement. Each of these issues was addressed in the literature review on athletics but
needs further examining. Correlations have been found between a lack of rigor of academic
study and college athletics (Pascarella & Terenzini, 1991). For instance, Maloney and
McCormick (1993) found football players at a Division I school of 12,000 to have taken
easier courses than other athletes and non-athletes. With whom a student associates has a
large impact on academic success (Chickering & Reisser, 1993; Feldman & Newcomb, 1969;
Reproduced with permission of the copyright owner. Further reproduction prohibited without permission.

26
Kuh et al., 1991; Whitt, Nora, Edison, Pascarella & Terenzini, 1991 & 1999; Stark &
Lattuca, 1993).
There is also research about the relationships that athletes have with other students.
Although this could be considered an issue of social development, interactions between
students are considered in engagement theory and are one element of active and collaborative
learning (Chickering & Gamson, 1987; Kuh et al., 1991). Socially, athletes may develop
strong relationships with other athletes yet lack the skills necessary to relate with a more
diverse set of individuals. The large amount of time spent involved in the participation of
athletics contributes to some isolation. Clustering further reduces the variety of individuals
in the students’ classes. What little remaining time for social engagement is also spent with
other athletes. Football players at a Division III college were more likely to pick athletes as
their friends than non-athletes (Richards & Aries, 1999). Division I Black male athletes were
even less likely to choose a non-athlete or a studious person as their roommate than White
athletes (Snyder, 1996).
Another crucial relationship linked with growth in college is that o f the relationship of
the student with the faculty. The more interaction these groups have, in and outside of the
classroom, the greater the development (Pascarella & Terenzini, 1991). Some athletic
programs reduce the communication between the students and faculty by offering in-house
advising and taking care of some of the responsibilities traditionally assigned to students, for
example scheduling a make-up exam. The variety of faculty is also limited by the
enrollment of athletes in courses that are less rigorous and more oriented towards their
athletic participation (Maloney & McCormick, 1993). Although, mainstream faculty who are
sport enthusiasts might have increased interplay with the student athlete as a result of their
Reproduced with permission of the copyright owner. Further reproduction prohibited without permission.

27
athletic participation, these exchanges are more likely to focus on the student as “athlete”
than on their psycho-social development. In at least one study, the isolation of athletes from
faculty does not appear to be as great for women, since women more frequently seek the
advice of personnel outside of the athletic department (Meyer, 1990).
Finally, the activities in which one is involved impacts academic development (Astin,
1993; Bliming, 1989; Feldman & Newcomb, 1969; Pascarella & Terenzini, 1991; Pugh &
Chamberlin, 1976). Athletic participation is very time consuming and may reduce the
number of number of activities in which an athlete can participate.
Research Questions
Three sets of research questions comprise this study: 1) the degree to which student
athletes are engaged compared to the general population; 2) the success of athletes versus
non-athletes in GPA; and 3) the correlation of student engagement to academic development.
The degree of student engagement is determined by measuring the level of academic
challenge, active and collaborative learning, student interactions with faculty members, and
enriching educational experiences. These factors compose four of five benchmarks from the
National Survey of Student Engagement (NSSE). The fifth benchmark of this survey
addresses each individual institution’s ability to support the engagement mentioned above. It
does not provide information about the students’ engagement itself but rather is used as a tool
by the institution to improve its practice. Thus, the fifth benchmark is not related to the
research questions in this study and was not used. The benchmarks mentioned above inform
the three sets of questions that draw comparisons between athletes and their non-athlete
counterparts to determine if students are equally engaged, succeed equally and if this
engagement equally correlates to athletes’ and non-athletes’ academic development.
Reproduced with permission of the copyright owner. Further reproduction prohibited without permission.

28
Set I: Level o f student engagement.
Hypothesis 1-1 - No significant difference exists between athletes and non-athletes in their
levels of academic challenge.
Hypothesis 1-2 - No significant difference exists between athletes and non-athletes in their
levels of active and collaborative learning.
Hypothesis 1-3 - No significant difference exists between athletes and non-athletes in the
levels of their interaction with faculty members.
Hypothesis 1-4 - No significant difference exists between athletes and non-athletes in the
levels of enriching educational experiences in which they participate.
Set II-A cadem ic Development
Hypothesis II - No significant difference exists between athletes and non-athletes in GPA
Set I I I - Correlation o f student engagement to academic development.
Hypothesis III-l - No significant difference exists between athletes and non-athletes in the
correlation between GPA and their levels of academic challenge.
Hypothesis III-2 - No significant difference exists between athletes and non-athletes in the
correlation between GPA and their levels of active and collaborative learning.
Hypothesis III-3 - No significant difference exists between athletes and non-athletes in the
correlation between GPA and the levels of their interaction with faculty members.
Hypothesis III-4 - No significant difference exists between athletes and non-athletes in the
correlation between GPA and the levels of enriching educational experiences in which they
participate.
Reproduced with permission of the copyright owner. Further reproduction prohibited without permission.

29
Research Design
This study is quantitative in nature and uses a single institution’s students for data
collection. Data includes the data set of 771 responses from freshmen and seniors at Midwest
City University for the 2004 National Survey of Student Engagement as well as a new data
set resulting from the administration of the NSSE 2004 survey to 101 student-athletes
enrolled during 2004-2005. Student GPAs were also acquired for all athletes and non
athletes from the Registrar’s Office for the study. ACT scores were acquired for 77 student-
athletes. The remaining 24 athletes did not have ACT scores in their records, possibly
because they transferred from another institution.
Subject institution and access. The institution selected for this study was a Division I,
Research II institution in the Midwest. Midwest City University (MCU) has a student
population of approximately 14,000 with over 6,000 undergraduate students. The athletic
department sponsors 12 teams that involve approximately 164 student athletes. Like many
Division I schools, this institution does not have a football team but uses basketball as its
marquee sport. In this way, MCU is similar to 27% of Division I institutions.
Prior to any research, permission to conduct the study was gained from the President
of the institution, through a letter summarizing the proposal (see Appendix A). Permission
from the Institutional Research Board at The College of William and Mary as well as from
the IRB at MCU was also obtained (see Appendix B). MCU’s permission was required to
protect its students as human subjects. MCU was assured that no published report of the
study will contain the name of the institution and all student data will remain anonymous.
Once the permissions were obtained, additional assistance was sought from the Office of
Institutional Research, the official collector and repository of the NSSE data for MCU. The
Reproduced with permission of the copyright owner. Further reproduction prohibited without permission.

30
Office of Institutional Research worked with the Registrar’s Office to add GPA and ACT
scores to the data. The GPAs and ACT scores were then merged with the NSSE file. The
data set was delivered in an Excel file. Written permission was also obtained from the Center
for Postsecondary Research Policy and Planning at Indiana University to administer
additional copies of the 2004 NSSE survey to the student athletes (see Appendix C). One
hundred eighty hard copies of the 2004 survey were provided by the University of Indiana.
The Athletic Department was approached to determine the best time and place to meet with
the student athletes to collect the data (see Appendix D and E).
Student athletes were asked through a letter to participate in the study as well as to
release their academic information (see appendix F). All students were assured anonymity in
the use of their student information with a release form (see appendix G). Students were
informed that their responses would be presented only in the aggregate and that they had the
right to refrain from participation without discrimination and to withdrawal at any time
without penalty. The administration of the survey to student athletes was conducted in group
settings convenient to the athletes such as team meetings or at the beginning of practices. A
few student-athletes completed their surveys during study hall. Athletes not wishing to
complete the survey were given a crossword puzzle option so they did not feel awkward
doing nothing while others filled out the survey. Some students chose not to participate and
some were absent from meetings and practices when the data was collected. One hundred
one students from eight teams completed the surveys.
Data instrument. The National Survey of Student Engagement or NSSE (see
appendix G) is a product of the Center for Postsecondary Research, Policy, and Planning at
Indiana University, which has been collecting information on an annual basis since 2000.
Reproduced with permission of the copyright owner. Further reproduction prohibited without permission.
31
NSSE contains 45 questions with over 85 content items, most of which are measurements of
student engagement with several items address demographic issues as well. The survey
utilizes a five-point Likert scale, ranging from “very often”, “often”, “sometimes” and
“never” for five of the questions containing 49 of the content items. Other questions ask the
student to quantify the number of times they were engaged in certain types of activity. All
questions have multiple choice answers with the exception of two demographic questions
related to major.
To date, the NSSE survey, which evolves each year, has been used by 731 different
colleges and universities. Midwest City University collected information from 771 freshmen
and seniors in the spring semester of 2004. The number of reported respondents was
selected by NSSE and was weighted by the size of the overall institution. This allowed
NSSE to keep its aggregate data representative of the entire student population represented by
the member schools.
From the submitted 771 responses, NSSE reported composite scores for Midwest City
University students for each of the four benchmarks examined in this study. For level of
academic challenge, MCU’s students had composite scores in the 53rd percentile (first-year
students) and 54.2nd percentile (seniors). This composite score was compared to the 53.6th
percentile and the 57.6th percentile respectively for students nation-wide. MCU’s scores,
however, are very similar to other urban universities and just slightly lower than other
doctoral institutions. For the measurement of active and collaborative learning, MCU
students scored in the 41.4th percentile (first-year) and the 45.7th percentile (senior)
compared to national scores of the 42.3rd percentile and the 51.4th percentile respectively. In
this category, MCU first-time students were slightly more engaged than other urban
Reproduced with permission of the copyright owner. Further reproduction prohibited without permission.

32
university students and less engaged in the case of seniors at other doctoral institutions.
First-year freshman were on par with the national average for composite score measuring
student-faculty interaction with a score of the 32.1st percentile. Seniors, however, lagged
behind the national average with only the 37.7th percentile compared to the 44th percentile
national score. MCU scores were higher than other urban schools but lower again than
seniors at other doctoral institutions. Finally, first-year students’ composite score for
enriching educational experienced at the 28.5th percentile compared to a the 26.7th percentile
for the national average, the 23.9th percentile for the urban institution average and 25.7th
percent doctoral institution average. Seniors scored a 36.3rd percentile compared to the 40th
percentile (national), the 32.7th percentile (urban institution) and the 37.4th percentile
(doctoral institutions) (Institutional Benchmark Report, National Survey of Student
Engagement, 2004).
Needing to manipulate the disaggregated raw data, I worked with the institution’s
complete data set of 771 rather than the data summary provided by NSSE in its 2004
Institutional Benchmark Report. Within the data set, 39 identified themselves as athletes.
These students were eliminated from the data set that I employed to avoid duplication.
Another 242 students did not have reported ACT scores and were also excluded. Finally 12
students did not have GPA’s and were also removed. Four hundred and seventy-eight (478)
sets of responses comprised the data set for this study. From that data set a random sample of
149 students was selected for comparison.
NSSE examines five benchmarks derived from The Seven Principles o f Good
Practice in Undergraduate Education by Chickering and Gamson (1987) viewing good
practice as: 1) encouraging student-faculty contact, 2) encouraging cooperation among
Reproduced with permission of the copyright owner. Further reproduction prohibited without permission.

33
students, 3) encouraging active learning, 4) giving prompt feedback, 5) emphasizing time on
task, 6) communicating high expectations, and 7) respecting diverse talents and ways of
learning. The questions on the survey are directly linked to these practices and are divided to
create composite scores for five benchmarks. These include 1) level of academic challenge;
2) active and collaborative learning; 3) student-faculty interactions; 4) enriching educational
experiences; and 5) supportive campus environment.
This study focused on benchmarks one through four because they deal directly with
the experiences of students. Benchmark five inquires about the performance of the institution
in providing an environment that fosters the seven principles of good practice and does not
inform either of the two sets of research questions. Benchmark one, “level of academic
challenge examines the rigor of students’ courses by questioning the number of assignments,
papers, textbooks and the level of inquiring that takes place in the course. Do students
merely learn theories and facts or are they engaged in the analysis synthesis and organization
of concepts? The benchmark also gathers data about student judgment and applications of
concepts covered during a class.
Benchmark two, “active and collaborative learning,” specifically asks about a
student’s interaction with other students through class presentations, group projects, out-of
class collaboration, tutoring and community-based service. Benchmark three, “student
faculty interaction,” deals with a student’s conversations with a teacher about grades, career
plans, coursework, research projects as well as interaction with a teacher outside of the
context of coursework. Benchmark four, “enriching educational experiences,” surveys a
student’s involvement in co-curricular activities, internships, volunteer work, self-directed
study, ethnically and culturally diverse activities and use of electronic technology to complete
Reproduced with permission of the copyright owner. Further reproduction prohibited without permission.

34
an assignment. Because the NSSE survey deals with all of the elements discussed in the
engagement theory literature, it is a particularly useful tool for this study. It looks at a variety
of types of engagement and groups them into benchmarks which can be manipulated for
analysis. It asks students about their classes, their relationships with other teachers and
students, how they spent their time and how they feel about their institution. Not all
questions on the survey were relevant to this study. A complete set o f questions considered
in each benchmark score is included in Appendix I.
Data collection.
I administered the survey to student athletes in group settings convenient to the
athletes such as team meetings or the beginning of practices. In all but one case, the meeting
was previously scheduled. Athletic department officials and team management left the area
when I conducted the survey so athletes would not feel pressure to participate. Athletes not
wishing to complete the survey were given a crossword puzzle option so they did not feel
awkward doing nothing while others filled out the survey. One hundred one athletes
completed the survey while 63 athletes either abstained from the survey or were not present at
the meeting where the survey was administered.
Data analysis
Data for the non-athletes and athletes were obtained in separate but parallel Excel
spreadsheets. Each file was then loaded into SPSS for analysis. Each group was
independently run through SPSS for outliers and non-athletes without GPA or ACT scores
were removed. From the remaining non-athletes, a computer generated random sample of
149 students was selected to make the two groups comparable in size. A reliability test for
each benchmark for each group was then run to verily that all questions’ responses
Reproduced with permission of the copyright owner. Further reproduction prohibited without permission.
35
adequately informed the benchmark. T-tests for independent samples were conducted for
grade point average and each of the benchmark scores and a Pearson correlation was
conducted for each cluster with GPA for both groups to check for significance. A
regression analysis controlling for certain variables was performed with each of the groups
separately to determine the weight of each benchmarks correlation on grade point average.
Further regression analyses were preformed on items within each benchmark to determine if
detailed items from each area were important. Finally a regression factoring for whether the
student was an athlete was performed to see if this variable was significant once all other
factors were considered.
Conclusion
Random sample of non-athletes results collected in 2004 and the new results from
student-athletes collected in 2005,1 was able to determine if a significant difference was
evident between the experiences of athletes and non-athletes. The results are presented in
chapter four and add to what is known about student athletes and their level of engagement
during their college years. Finally the inclusion of academic record information in the study
contributes to the understanding of the correlation of student engagement and academic
development for both athletes and non-athletes. The correlations of grade point average and
ACT will provide a clearer picture of how these two populations differ.
Reproduced with permission of the copyright owner. Further reproduction prohibited without permission.

36
CHAPTER IV
DATA ANALYSIS
The purpose of this study was to detect a possible difference between athletes and
non-athletes at a Division I urban institution with regard to their levels of student engagement
and its effect on their academic development as demonstrated by their GPA. The NSSE
survey used for this study was specifically chosen because of its focus on four benchmarks:
level of academic challenge, active and collaborative learning, student-faculty interaction,
and enriching educational experiences.
Sample Demographics
One hundred one athletes from nine teams completed the 2004 NSSE survey and
constituted one of the two groups. The comparison group of non-athletes consisted of 149
randomly selected students from the institution’s pool of 770 responses given last spring.
The two groups were similar in some demographics and different in others. The average age
of the student athletes was 20.62 with 20.59 being the average age for non-athletes (see table
4.1). The non-athletes were comprised of a larger percentage of females (63.3 percent)
compared with 55.4 percent female for the athlete sample. This probably reflects the fact that
Metropolitan City University’s undergraduate student population is 59 percent female while
the entire student athlete population is only 46 percent female. The racial composition of the
athletes and non-athletes vary in some ethnicities but are similar in African American
composition with 14.9 percent and 14.7 percent respectively. The Caucasian population is
larger in the athlete population (74.3 percent and 63.3 percent), in part because the
Asian/Asian American population is smaller than in the non-athlete population (10.7 percent
and 1 percent). The athlete population also has a greater percentage of students identifying
Reproduced with permission of the copyright owner. Further reproduction prohibited without permission.

37
themselves as American Indians with 3 percent versus less than 1 percent for the non-athlete
sample. Table 4.1 indicates the distributions by gender and race for each group.
Table 4.1Sex and Race o f the Two Samples________________________________________
Athletes Non-Athletes
N_______ percent__________ N________percent
Sex
Female 56 55.4 95 63.3
Male 45 44.6 54 36.0
Race
African American 15 14.9 22 14.7
Caucasian 75 74.3 95 63.3
Asian American 1 1 16 10.7
Hispanic American 7 6.9 12 8
Native American 3 3 1 0.7
Unreported 0 0 2 1.3
Data for both the athletes and non-athletes were entered into SPSS and a reliability
rating was run on all of the items in each benchmark area with the reliability ratings being
fairly similar for athlete’s and non-athlete’s responses. A Cronbach’s Alpha score was
generated based on standardized items as some of the questions had four options and some
had five or eight. Although some of the a scores fall below the ideal .700 cut off, none of
Reproduced with permission of the copyright owner. Further reproduction prohibited without permission.

38
them would have increased significantly if any of the specific items were removed from the
category. The scores are indicated below in table 4.21.
Table 4.21Reliability Ratings:_____________________________________________________________
Athletes Non-Athletes BothA A a
Benchmark 1 Items - Academic Challenge .722 .743 .733
Benchmark 2 Items -Active & Collaborative Learning .662 .605 .624
Benchmark 3 Items - Faculty Interaction .656 .691 .677
Benchmark 4 Items - Enriching Experiences .644 .656 .629Note. Cronbach’s alpha based on standardized items
Outcomes fo r Hypotheses
The data were then examined to prove the hypotheses that dealt with the levels of
engagement, the academic success and the correlations of the two.
Levels o f academic challenge. Hypothesis 1-1 stated there would be no significant
difference between athletes and non-athletes in their level of academic challenge. This null
hypothesis was rejected. The mean for Benchmark 1 for student athletes was 50.39 compared
to a 54.40 mean for non-athletes. An independent samples t-test was run on the two means to
determine significance. With a two-tailed p - .023 (7=2.281, SE = 1.75476), these benchmark
means have a significant difference at the p < .05 level. The means for this Benchmark and
the other four are detailed in table 4.22 below.
Reproduced with permission of the copyright owner. Further reproduction prohibited without permission.

39
Table 4.22Benchmark Means and T-testfor Equality o f Means
N on-Athletes Athleten= l 01 n=149 t-test for Equality o f Means
M M t95% confidence interval
p SE o f the differenceBenchmark 1 - Academ ic Challenge
50.39 54.40 2.281 .023* 1.75476 .54668 7.45909
Benchmark 2 - A ctive & Collaborative Learning
42.40 43.62 .583 .560 2.12367 -2.94423 5.4212
Benchmark 3 - Faculty Interaction
35.37 34.22 -.515 .607 2.21430 -5.50158 3.22088
Benchmark 4 - Enriching Experiences
33.33 32.50 -.432 .674 1.95886 -4.68211 3.03412
Note. N o significant differences with the L evene’s test for equality o f variance so equal variances are assumed. *p < .05.
A deeper analysis of each item in the benchmark reveals that athletes seem to take
courses that are less demanding than non-athletes. Athletes had significantly lower means at
the p < .05 level in the frequency with which their classes required them to synthesize and
organize information as well as the making of judgments about the value of information,
arguments or methods. The mean for athletes for the synthesis of ideas was 2.72 while non
athletes had a mean of 2.99 on a four point scale (t - 2.326, p = .021, SE = . 115). The
construct making of judgments about the value of information was similarly lower for
athletes ( M - 2.77) than non-athletes (M= 3.01, t = 2.072, p = .039, SE = .115). Athletes
also had significantly lower means at the p < .05 level for the number of assigned text books,
and the number of reports written between 5 - 1 9 pages. Conversely, athletes were more
likely to write reports of 20 pages or more with a mean of 1.43 versus 1.25 for non-athletes (t
= -2.070,/? = .039, SE = .090). The strongest differences in academic challenge between the
two groups fell in the number of hours spent preparing for class and the perception that the
Reproduced with permission of the copyright owner. Further reproduction prohibited without permission.

40
institution emphasizes that students (or student-athletes) spend significant amounts of time
on academic work. The first issue is addressed with a question asking students to indicate the
number of hours spent studying student-athletes had eight choices. A choice with the value
of three indicates 6-10 hours of work and a selection of four means 11-15 hours of work.
Student athletes had a mean of 3.21 and non-athletes had a mean of 4.14. Thus, non-athletes
spend two to three times more on academics than athletes. This is a significance of p < .001 (t
= 4.325, SE = .215). The second significant difference mentioned above refers to how, on a
four point scale, student rated their institution’s emphasis on spending time on academics.
Athletes had a mean of 2.96 while non-athletes had a mean of 3.21. These data are
significant at the p < .01 level (t = 2.675, p = .008, SE - .095). Therefore, student athletes are
not only spending less time preparing for class but think the institution does not emphasize
that they do. Four other items in this benchmark showed no significant differences between
the two groups. The statistics on all of the items are listed below in table 4.23. All of these
factors and their correlations to academic success will be discussed later in this chapter.
Reproduced with permission of the copyright owner. Further reproduction prohibited without permission.

41
Table 4.23Academic Challenge Item Means and T-testfor Equality o f Means
Athletes Non-Athletes t-test for Equality of Meansn M n M t P SE
Working harder than you thought you could to meet an instructor’s standards or expectations.
101 2.57 149 2.63 .566 .572 .100
Analyzing the basic elements o f an idea, experience or theory, and considering its components.
100 2 .99 148 3.20 1.923 .056 .107
Synthesizing and organizing ideas, information, or experiences.
100 2 .72 149 2.99 2 .326 .021* .115
Making judgments about the value o f information, arguments, or methods
99 2.77 149 3.01 2 .072 .039* .115
Applying theories or concepts to practical problems or in new situations.
100 3.09 149 3.15 .574 .566 .112
Number o f assigned textbooks, or book length packs o f course readings.
99 3.07 149 3 .34 2 .044 .042* .130
Number o f written papers or reports 20 pages o f more.
99 1.43 149 1.25 -2 .070 .039* .090
Number o f written papers or reports between 5 - 1 9 pages.
99 2.56 149 2 .28 -2 .307 .022* .122
Number o f written papers or reports less than 5 pages.
99 3.03 149 3.04 .071 .944 .141
Hours per 7-day week spent preparing for class
100 3.21 149 4 .14 4 .325 < .001** .215
Institution encourages spending significant amounts o f time studying and on academic work.
101 2 .96 149 3.21 2.675 .008** .095
Note. No significant differences with the Levine’s test for equality o f variance so equal variances are assumed. *p < .05, **p < .01.
Reproduced with permission of the copyright owner. Further reproduction prohibited without permission.

42
Levels o f active and collaborative learning. Hypothesis 1-2 predicted no significant
difference between athletes and non-athletes in the levels of active and collaborative learning.
The data failed to reject this hypothesis after an independent sample t-test was performed.
The mean for non-athletes fell at 43.62, only slightly higher that the mean for student-athletes
(M = 42.40, p = .560, SE = 2.12367). A t-test of each of the items within the benchmark
revealed no significant difference in means of both groups reflecting their contributions made
to class discussions, the number of class presentations made, the working on class projects
with other students either inside or outside of class or whether the student was a tutor or not.
However, surprisingly, a significant difference was found between the two groups at the p <
.05 level in the likelihood of participating in a community-based project as part of a course.
As busy with their sports participation as they might be, student-athletes were more likely to
have had a service learning experience (M = 1.91) than non-athletes (M = 1.65, t - -2.256, p
= .025, SE = .115). Yet, student-athletes were significantly less likely than non-athletes to
discuss ideas from readings or classes with others outside of class at significance of/? < .01.
Student-athletes had a mean of 2.35 while non-athletes had a mean 2.74 (t = 3.422,/? = .001,
SE = .144). The complete set of statistics on these benchmark items are in table 4.24.
Reproduced with permission of the copyright owner. Further reproduction prohibited without permission.

43
Table 4.24Active and Collaborative Learning Item Means and T-test for Equality o f Means
Athletes Non-Athletes t-test for Equality of Meansn M N M t P SE
Asked questions in class or contributed to class discussions.
101 2 .62 149 2.77 1.319 .188 .112
Made a class presentation. 101 2.31 149 2.36 .484 .629 .101
Worked with other students on projects during class.
101 2 .57 149 2.43 -1 .286 .200 .113
Worked with classmates outside o f class to prepare class assignments.
101 2.43 149 2 .36 -.581 .562 .109
Tutored or taught other students (paid or voluntary).
101 1.71 149 1.85 1.172 .242 .119
Participated in a community- based project as part o f a regular course.
101 1.91 149 1.65 -2 .256 .025* .115
Discussed ideas from your readings or classes with others outside o f class.
101 2.35 149 2 .74 3 .422 .001** .114
Note. No significant differences with the Levine’s test for equality o f variance so equal variances are assumed. *p < .05, **p < .01.
Levels o f student-faculty interaction. Hypothesis 1-3, similar to that dealing with
active and collaborative learning was correct with no significance in the independent samples
t-test of means for faculty interaction between athletes (M = 35.37) and non-athletes (M =
34.22, t = 2.21430, p = .607, SE = 2.21430). An analysis of this set of items showed only one
significant different at the p < .05 level. For the question on discussing grades or
assignments with an instructor, athletes had a mean of 2.85 while non-athletes had a lower
mean of 2.62 (t = -2.132,;? = .034, ££ = .110). All other items for benchmark three showed
no significant relationship. These items included discussing career plans or ideas from class
with a faculty member or advisor, receiving prompt feedback from a faculty member or
Reproduced with permission of the copyright owner. Further reproduction prohibited without permission.

44
working on non-academic activities or research with a faculty member. The full complement
of statistics on benchmark three items is shown below in table 4.25 and further discussion is
provided in chapter five.
Table 4.25Student-Facuity Interaction Item Means and T-test for Equality o f Means
Athletes Non-Athletes t-test for Equality of Means
n M n M t P SEDiscussed grades or assignments with an instructor.
101 2.85 149 2 .62 -2 .132 .034* .110
Talked about career plans with a faculty member or advisor.
101 2.30 149 2.21 -.781 .435 .114
Discussed ideas from your readings or classes with faculty members outside o f class.
101 1.85 149 1.81 -.445 .657 .104
Received prompt feedback from faculty on your academic performance.
101 2.63 149 2.68 -.414 .679 .107
Worked with faculty members on activities other than coursework.
101 1.55 149 1.55 -.040 .968 .103
Worked on a research project with a faculty member outside o f course o f program requirements.
101 2.12 149 2.12 .188 .851 .116
Note. No significant differences with the Levine’s test for equality o f variance so equal variances are assumed. *p < .05, **p < .01.
Levels o f enriching educational experiences. Finally Hypothesis 1-4 was a null
hypothesis predicting no significant difference between athletes and non-athletes in the
benchmark score for enriching educational experiences. This null hypothesis was not
rejected by the independent samples t-test. Athletes had a mean score of 33.33 while non-
Reproduced with permission of the copyright owner. Further reproduction prohibited without permission.
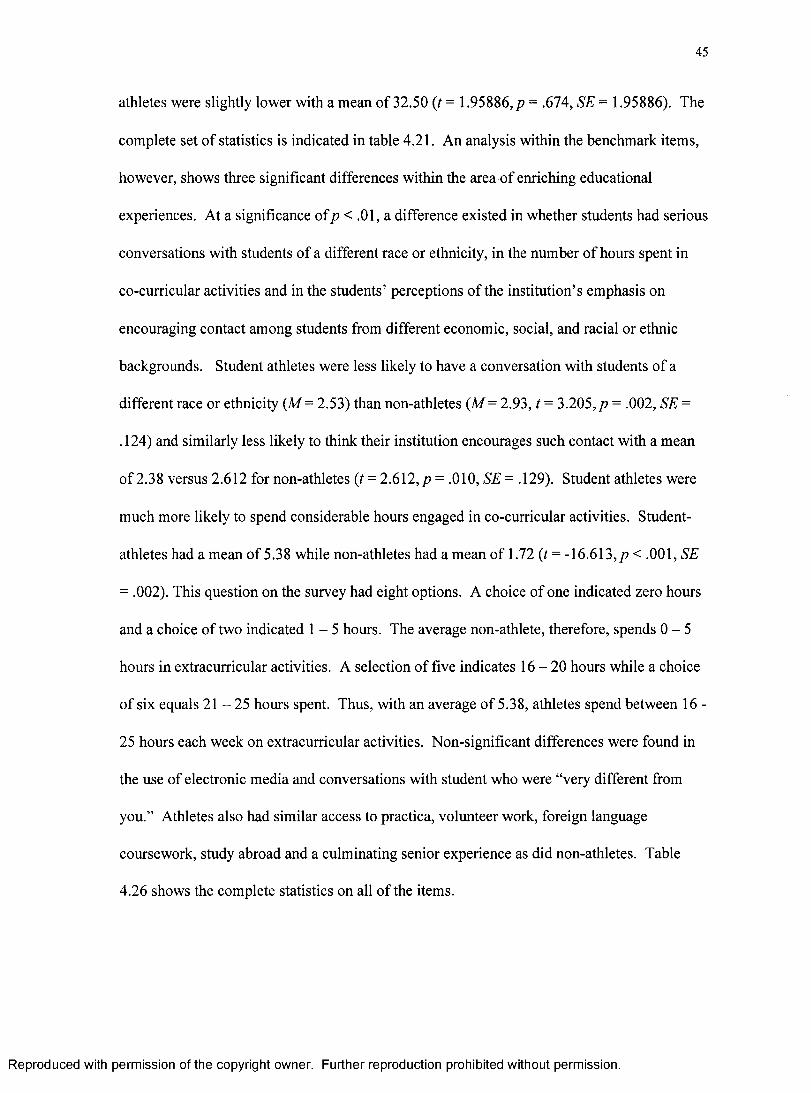
athletes were slightly lower with a mean of 32.50 (/ = 1.95886, p = .674, SE - 1.95886). The
complete set of statistics is indicated in table 4.21. An analysis within the benchmark items,
however, shows three significant differences within the area of enriching educational
experiences. At a significance o fp < .01, a difference existed in whether students had serious
conversations with students of a different race or ethnicity, in the number of hours spent in
co-curricular activities and in the students’ perceptions of the institution’s emphasis on
encouraging contact among students from different economic, social, and racial or ethnic
backgrounds. Student athletes were less likely to have a conversation with students of a
different race or ethnicity (M = 2.53) than non-athletes (M = 2.93, t = 3.205,/? = .002, SE =
. 124) and similarly less likely to think their institution encourages such contact with a mean
of 2.38 versus 2.612 for non-athletes (t = 2.612, p = .010, SE = .129). Student athletes were
much more likely to spend considerable hours engaged in co-curricular activities. Student-
athletes had a mean of 5.38 while non-athletes had a mean of 1.72 (t = -16.613,p < .001, SE
= .002). This question on the survey had eight options. A choice of one indicated zero hours
and a choice of two indicated 1 - 5 hours. The average non-athlete, therefore, spends 0 - 5
hours in extracurricular activities. A selection of five indicates 1 6 - 2 0 hours while a choice
of six equals 2 1 - 2 5 hours spent. Thus, with an average of 5.38, athletes spend between 16 -
25 hours each week on extracurricular activities. Non-significant differences were found in
the use of electronic media and conversations with student who were “very different from
you.” Athletes also had similar access to practica, volunteer work, foreign language
coursework, study abroad and a culminating senior experience as did non-athletes. Table
4.26 shows the complete statistics on all of the items.
Reproduced with permission of the copyright owner. Further reproduction prohibited without permission.
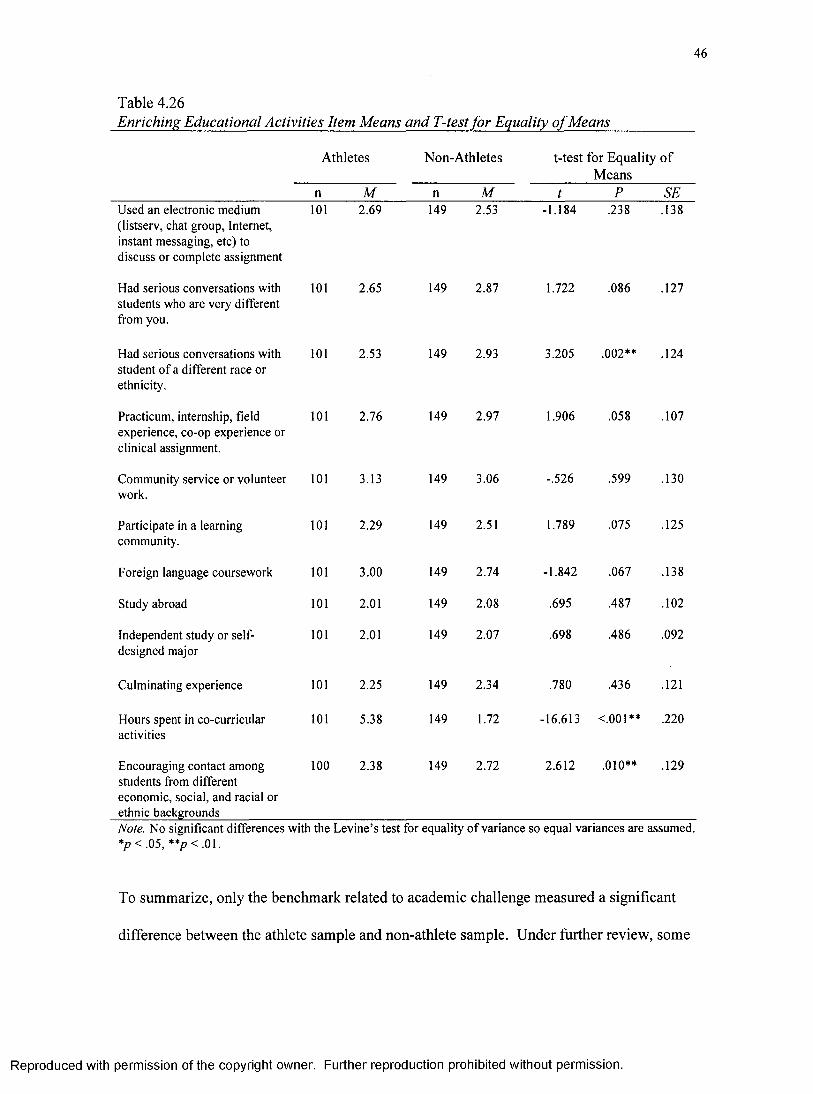
46
Table 4.26Enriching Educational Activities Item Means and T-test for Equality o f Means
Athletes Non-Athletes t-test for Equality o f Means
n M n M t P SEUsed an electronic medium (listserv, chat group, Internet, instant messaging, etc) to discuss or complete assignment
101 2.69 149 2.53 -1.184 .238 .138
Had serious conversations with students who are very different from you.
101 2.65 149 2.87 1.722 .086 .127
Had serious conversations with student o f a different race or ethnicity.
101 2.53 149 2.93 3.205 .002** .124
Practicum, internship, field experience, co-op experience or clinical assignment.
101 2.76 149 2.97 1.906 .058 .107
Community service or volunteer work.
101 3.13 149 3.06 -.526 .599 .130
Participate in a learning community.
101 2.29 149 2.51 1.789 .075 .125
Foreign language coursework 101 3.00 149 2.74 -1.842 .067 .138
Study abroad 101 2.01 149 2.08 .695 .487 .102
Independent study or selfdesigned major
101 2.01 149 2.07 .698 .486 .092
Culminating experience 101 2.25 149 2.34 .780 .436 .121
Hours spent in co-curricular activities
101 5.38 149 1.72 -16.613 <.001** .220
Encouraging contact among students from different economic, social, and racial or ethnic backgrounds
100 2.38 149 2.72 2.612 .010** .129
Note. No significant differences with the Levine’s test for equality o f variance so equal variances are assumed. *p < .05, **p < .01.
To summarize, only the benchmark related to academic challenge measured a significant
difference between the athlete sample and non-athlete sample. Under further review, some
Reproduced with permission of the copyright owner. Further reproduction prohibited without permission.

individual benchmark items showed differences between the two groups especially in the area
of academic challenge. Specifically they varied in the amount to which the were required to
synthesize, and organize information; make judgments about the value of information,
arguments and methods; the number of books read and papers written, the number of hours
spent studying each week and the students’ perceptions about the institutions emphasis on
academic work. Items in other benchmarks that showed differences between the two groups
included the participation in a community based project as part of a regular course, the
discussing of academic ideas with students outside of class, the frequency with which
students talked to their professors about grades or an assignment, the hours spent on co-
curricular activities and the extent to which student felt their institution encouraged contact
among students from different economic, social, and racial or ethnic backgrounds.
Academic success. The first set of hypotheses dealt with the student-athletes and non
athletes experiences on campus and how they differ. The next hypothesis addresses the grade
point averages of athletes and non-athletes and predicted no significant difference. An
independent samples t-test on the data rejected this null hypothesis finding a significant
difference (p = .001, SE .0758). The mean for athletes was 2.95 while the mean for non
athletes was 3.19 (see table 4.31). As combined ACT scores (English, math, reading, and
scientific reasoning) have been previously correlated with GPA, and some studies have
shown athletes to enter college with lower average ACT scores, I ran a similar independent
samples t-test on the ACT scores for athletes and non-athletes. Because transfer students do
not always have ACT scores, only 77 of the 101 student-athletes had ACT scores. All of the
non-athletes have recorded ACT scores because of the large pool from which the students
were randomly selected. The subset o f athletes with ACT scores received significantly lower
Reproduced with permission of the copyright owner. Further reproduction prohibited without permission.

marks on that entrance exam than the non-athletes at the level of/? < .01. Table 4.31 shows
the means of athletes at 22.05 while non-athletes have a mean ACT score of 24.72 (/ = 3.212,
p < .001, SE = .561). To place this in context, the national average for freshmen in the
United States is 21, while the state average where MCU is located is 22. The average ACT
score for all freshmen is 24 which is slightly less than the sample studied here. A possible
explanation of the differences between athlete and non-athlete ACT scores will be addressed
in chapter five.
Table 4.31GPA & ACT Means and T-test for Equality o f Means_________________________________
A thletes N on-A th letes t-test for Equality o f M eansn M n M t P S E
C um ulative G PA 101 2.95 149 3.19 3 .212 .001** .0758
A C T score 77 22.05 149 24 .72 4 .763 <.001** .561Note. No significant differences with the Levine’s test for equality of variance so equal variances are assumed. *p < .05.
A further statistical procedure was performed to see if the grade point averages and
ACT scores correlate with the two samples as they have in other educational research. A
Pearson correlation was completed on the data to find r = .374 (p = .001) for the correlation
of cumulative grade point average to ACT scores for student-athletes and an r = .479 (p <
.001) for non-athletes. Both populations show a significant correlation at the p < .01 level
but the correlation for non-athletes is stronger than for athletes (see table 4.32).
Reproduced with permission of the copyright owner. Further reproduction prohibited without permission.

49
Table 4.32Correlation o f ACT Scores to Grade Point Average
Athletes Non-Athletes Bothr P r P r P
GPA and ACT .374** .001 .479** <.001 .479** <.001
Note.
Correlation o f benchmark scores to grade point average. The final set of hypotheses
was designed to compare the correlation of each of the benchmark scores to grade point
averages for each group. Table 4.41 addresses these correlations. Only two benchmark
scores correlated to grade point average for either of the two groups. The data for athletes
showed no significant correlation for any of the benchmarks. Hypothesis III -1 predicted no
significant difference between athletes and non-athletes in the correlation between GPA and
their levels of academic challenge. As the correlations for both groups are non-significant, it
is impossible to compare the two. The same is the case for hypothesis III - 2 which predicted
no significant difference between athletes and non-athletes in the correlation of grade point
average and the level of active and collaborative learning. Significance at a p < .05 level was
found for non-athletes responses to student-faculty interaction (r = .170, p = .038) rejecting
the null hypothesis III - 3, which predicted no difference in the correlation between the two
groups in their relationships with faculty. The issue of enriching educational experiences
correlated even more significantly at ap < .01 level for non-athletes (r - .270, p = .001)
showing a difference in the correlations between benchmark four and grade point average
between the two groups. Athletes’ data did not correlate enriching educational activities to
grade point average.
Reproduced with permission of the copyright owner. Further reproduction prohibited without permission.

50
Table 4.41Correlation o f Benchmark Scores to GPA
Athletes Non-Athletes Bothr P r P r P
Benchmark 1 - Academic Challenge .135 .179 .155 .058 .168** .008
Benchmark 2 - Active & Collaborative Learning .088 .383 .087 .289 .091 .152
Benchmark 3 - Faculty Interaction -.164 .101 .170* .038 .049 .444
Benchmark 4 - Enriching Experiences .134 .182 .270** .001 .214** .001Note. *p < .05, ** p < .01.
Academic challenge and grade point average. Despite the fact that benchmark means
as a whole for academic challenge showed no correlation to GPA for either group, one of the
benchmark items was correlated for both groups. Grade point average was linked with the
number of hours spent in academic work for athletes (r = .342, p - .000) and non-athletes (r
= .239, p = .003). Both of these correlations meet significance criteria at the p < .01 level.
The implications of this strong relation will be explored further. The rest of the items
exploring academic challenge are presented below in table 4.42 and showed no significant
correlation to grade point average.
Reproduced with permission of the copyright owner. Further reproduction prohibited without permission.

51
Table 4.42Correlation o f Items o f Academic Challenge to Grade Point Average
Athletes Non-Athletes Bothr P r P r P
Working harder than you thought you could to meet an instructor’s standards or expectations.
.155 .122 .056 .497 .109 .085
Analyzing the basic elements o f an idea, experience or theory, and considering its components.
.156 .121 -.033 .689 .077 .225
Synthesizing and organizing ideas, information, or experiences.
.148 .142 .050 .541 .126* .047
Making judgments about the value o f information, arguments, or methods
.126 .215 .044 .598 .112 .079
Applying theories or concepts to practical problems or in new situations.
.091 .370 .022 .787 .071 .264
Number o f assigned textbooks, or book length packs o f course readings.
-.117 .149 .079 .341 .049 .441
Number o f written papers or reports 20 pages o f more.
-.156 .123 -.004 .964 -.093 .144
Number o f written papers or reports between 5 - 1 9 pages.
-.050 .624 -.037 .651 -.058 .365
Number o f written papers or reports less than 5 pages.
.008 .937 .101 .220 .078 .218
Hours per 7-day week spent preparing for class
.342 .000** .239 .003** .319** 000
Spending significant amounts o f time studying and on academic work.
.016 .872 .100 .225 .118 .062
Note. **p<SS\ .
Active and collaborative learning and grade point average. Similar to Benchmark 1,
Benchmark 2 showed significance in a couple items that were not reflected in the overall
benchmark means for active and collaborative learning. Both asking questions in class and
Reproduced with permission of the copyright owner. Further reproduction prohibited without permission.

working with other students on projects during class showed a significant correlation to grade
point average at the p < .01 level for non-athletes. Asking questions in class correlated with r
= .236 (p = .004) and working with other students negatively correlated with r = -.254 ip =
.002) with grade point average. Neither of these items correlated to GPA for student-athletes.
The act of being a tutor had a positive correlation to grade point average for both groups but a
stronger relationship for non-athletes than athletes. Athletes showed a n r = .250 correlation
ip - .012) while non-athletes had a correlation of r = .245 ip = .003). None of the other items
as seen in table 4.43 showed a relationship to grade point average.
Table 4.43Correlation o f Items ofActive and Collaborative Learning to Grade Point Average______
Athletes Non-Athletes Bothr P r P r P
Asked questions in class or contributed to class discussions.
-.060 .554 .236** .004 .155* .014
Made a class presentation. .144 .257 -.061 .459 .020 .756
Worked with other students on projects during class.
.005 .962 -.254** .002 -.152* .016
Worked with classmates outside o f class to prepare class assignments.
.127 .206 -.077 .353 -.001 .981
Tutored or taught other students (paid or voluntary).
.250* .012 .245** .003 .260** .000
Participated in a community-based project as part o f a regular course.
-.070 .486 .019 .820 -.037 .562
Discussed ideas from your readings or classes with others outside o f class.
.022 .826 .066 .421 .102 .107
Note. *p< .05 ,** p < .01.
Reproduced with permission of the copyright owner. Further reproduction prohibited without permission.

53
Student faculty interaction and grade point average. Despite the fact that the overall
benchmark scores for student-faculty interaction correlated to grade point average for non
athletes, none of the individual items showed a significant relationship to GPA on their own.
None of the specific items correlated for athletes either. Working on a research paper with a
faculty member comes close to correlating for non-athletes at a p = .057. At first glance it
appeared that there may have been a significant difference between the correlation
coefficients for the two groups as athletes had negative correlations and non-athletes had
positive correlations, but a statistical test proved the relationship to non-significant. All of
the other factors appear to have no correlation and are outlined further in table 4.44.
Reproduced with permission of the copyright owner. Further reproduction prohibited without permission.

54
Table 4.44Correlation o f Items o f Student-Facuity Interaction to Grade Point Average
Athletes Non-Athletes Bothr P r P r P
Discussed grades or assignments with an instructor.
-.060 .554 .083 .312 .019 .770
Talked about career plans with a faculty member or advisor.
-.123 .221 .140 .089 .048 .453
Discussed ideas from your readings or classes with faculty members outside o f class.
-.113 .261 .092 .263 .015 .810
Received prompt feedback from faculty on your academic performance (written or oral).
-.099 .322 .043 .603 .014 .827
Worked with faculty members on activities other than coursework (committees, orientation, student life activities, etc.).
-.045 .652 .096 .245 .052 .409
Worked on a research project with a faculty member outside o f course o f program requirements.
-.064 .525 .156 .057 .079 .211
Note. *p < .05, ** p <.01.
Enriching educational activities and grade point average. Hypothesis III-4 predicted
no significant difference between athletes and non-athletes in the correlation between GPA
and the levels of enriching educational experiences in which they participate and was
rejected. Only one of the benchmark items, however correlated individually with GPA. The
studying of a foreign language had a positive correlation to grade point average for student
athletes at thep < .05 level (r = A 92,p = .019). A few items correlated significantly for a
data set of both athletes and non-athletes. Having serious conversations with students of a
different race (r = .131, p = .038), participating in a practicum, internship, field experience or
clinical or co-op experience (r = .\6 9 ,p = .007), and doing foreign language coursework (r =
Reproduced with permission of the copyright owner. Further reproduction prohibited without permission.
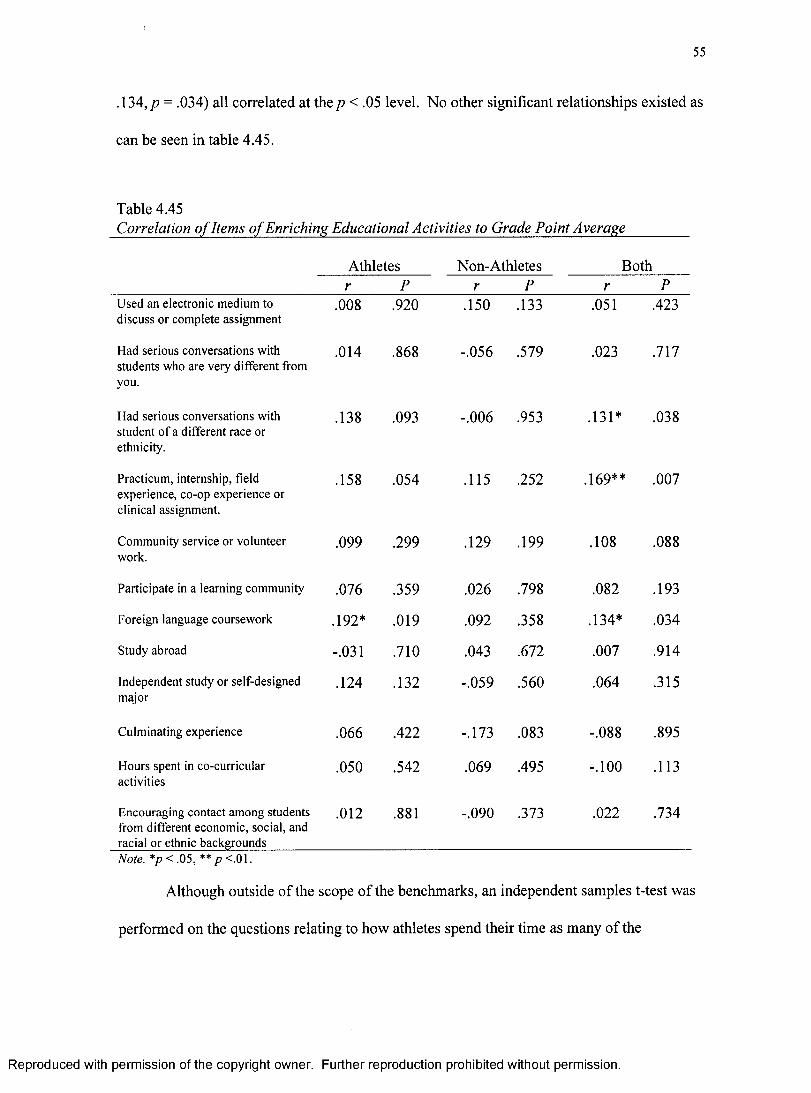
55
A34,p = .034) all correlated at thep < .05 level. No other significant relationships existed as
can be seen in table 4.45.
Table 4.45Correlation o f Items o f Enriching Educational Activities to Grade Point Average
Athletes Non-Athletes Bothr P r P r P
Used an electronic medium to discuss or complete assignment
.008 .920 .150 .133 .051 .423
Had serious conversations with students who are very different from you.
.014 .868 -.056 .579 .023 .717
Had serious conversations with student o f a different race or ethnicity.
.138 .093 -.006 .953 .131* .038
Practicum, internship, field experience, co-op experience or clinical assignment.
.158 .054 .115 .252 .169** .007
Community service or volunteer work.
.099 .299 .129 .199 .108 .088
Participate in a learning community .076 .359 .026 .798 .082 .193
Foreign language coursework .192* .019 .092 .358 .134* .034
Study abroad -.031 .710 .043 .672 .007 .914
Independent study or self-designed major
.124 .132 -.059 .560 .064 .315
Culminating experience .066 .422 -.173 .083 -.088 .895
Hours spent in co-curricular activities
.050 .542 .069 .495 -.100 .113
Encouraging contact among students from different economic, social, and racial or ethnic backgrounds
.012 .881 -.090 .373 .022 .734
Note. *p < .05, ** p <.01.
Although outside of the scope of the benchmarks, an independent samples t-test was
performed on the questions relating to how athletes spend their time as many of the
Reproduced with permission of the copyright owner. Further reproduction prohibited without permission.
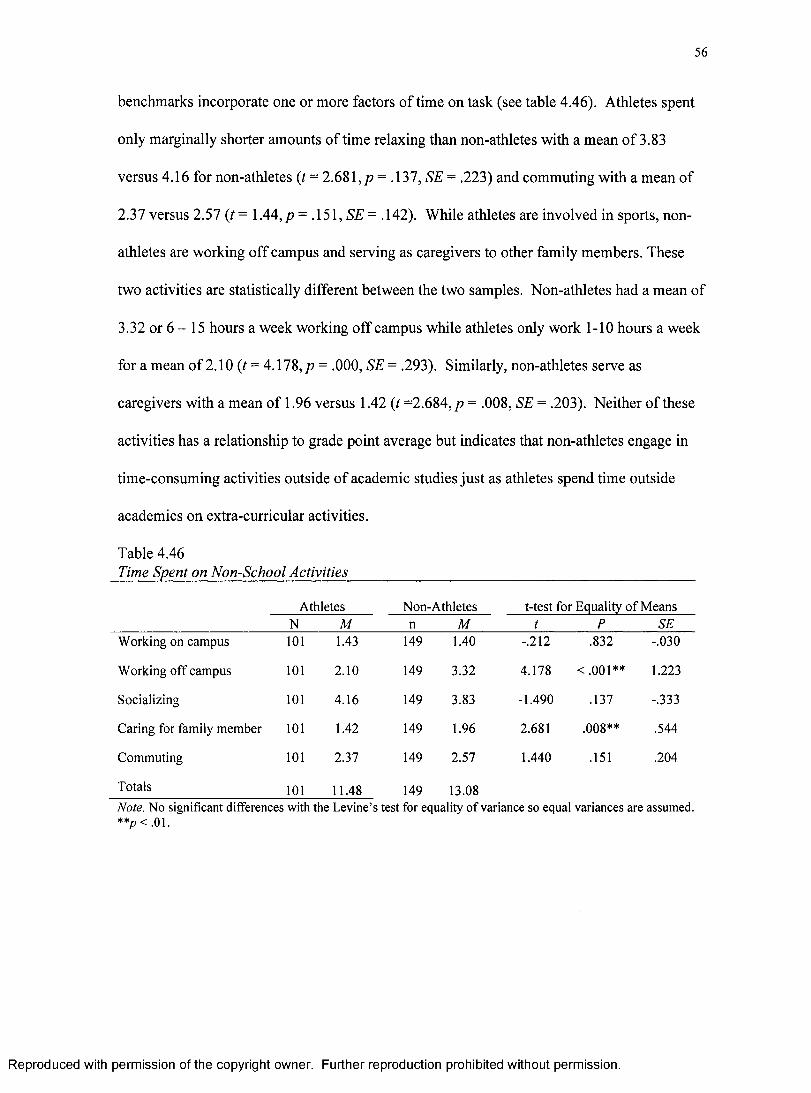
56
benchmarks incorporate one or more factors of time on task (see table 4.46). Athletes spent
only marginally shorter amounts of time relaxing than non-athletes with a mean of 3.83
versus 4.16 for non-athletes (t = 2.681 ,p = .137, SE - .223) and commuting with a mean of
2.37 versus 2.57 (t = 1.44,/? = .151, SE = .142). While athletes are involved in sports, non
athletes are working off campus and serving as caregivers to other family members. These
two activities are statistically different between the two samples. Non-athletes had a mean of
3.32 or 6 - 15 hours a week working off campus while athletes only work 1-10 hours a week
for a mean of 2.10 (t = 4.178,p = .000, SE = .293). Similarly, non-athletes serve as
caregivers with a mean of 1.96 versus 1.42 (t =2.684, p = .008, SE = .203). Neither of these
activities has a relationship to grade point average but indicates that non-athletes engage in
time-consuming activities outside of academic studies just as athletes spend time outside
academics on extra-curricular activities.
Table 4.46Time Spent on Non-School Activities_______________________________________________
Athletes Non-Athletes t-test for Equality o f MeansN M n M t P SE
Working on campus 101 1.43 149 1.40 -.212 .832 -.030
Working o ff campus 101 2.10 149 3.32 4.178 < .001** 1.223
Socializing 101 4.16 149 3.83 -1.490 .137 -.333
Caring for family member 101 1.42 149 1.96 2.681 .008** .544
Commuting 101 2.37 149 2.57 1.440 .151 .204
Totals 101 11.48 149 13.08Note. No significant differences with the Levine’s test for equality o f variance so equal variances are assumed.**p< .01.
Reproduced with permission of the copyright owner. Further reproduction prohibited without permission.
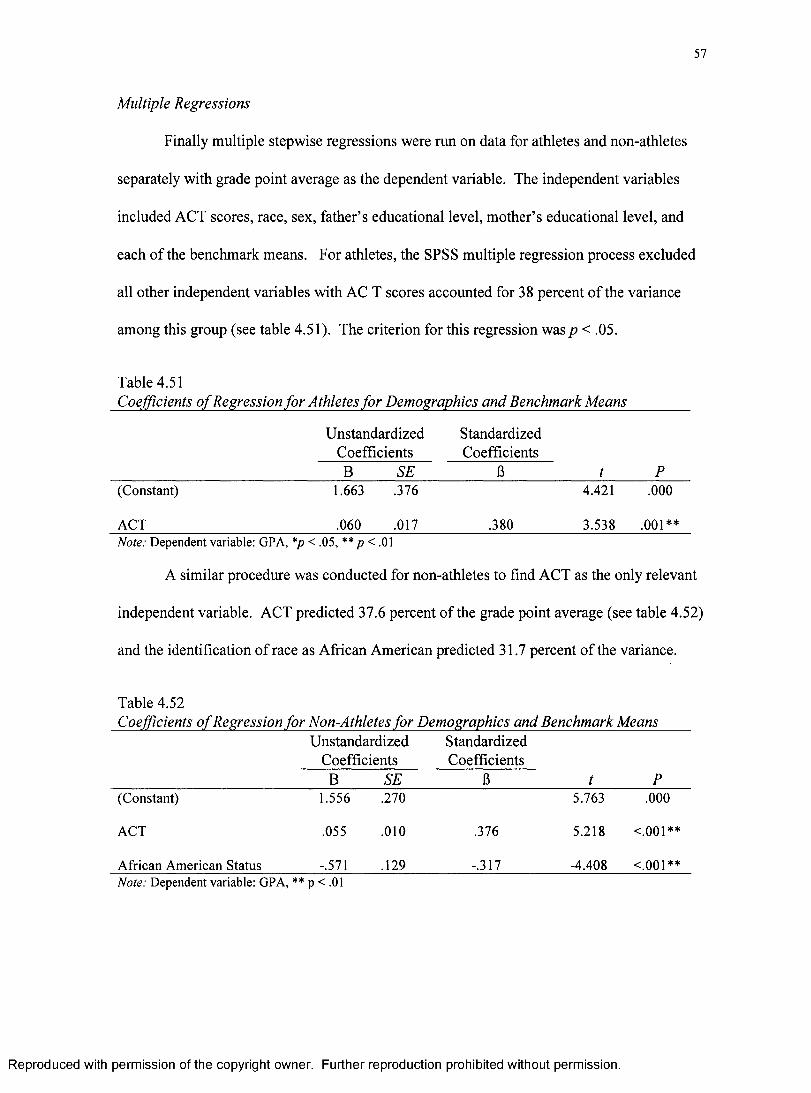
57
Multiple Regressions
Finally multiple stepwise regressions were run on data for athletes and non-athletes
separately with grade point average as the dependent variable. The independent variables
included ACT scores, race, sex, father’s educational level, mother’s educational level, and
each of the benchmark means. For athletes, the SPSS multiple regression process excluded
all other independent variables with AC T scores accounted for 38 percent of the variance
among this group (see table 4.51). The criterion for this regression wasp < .05.
Table 4.51Coefficients o f Regression for Athletes for Demographics and Benchmark Means
UnstandardizedCoefficients
StandardizedCoefficients
B SE B t P(Constant) 1.663 .376 4.421 .000
ACT .060 .017 .380 3.538 .001**Note: Dependent variable: GPA, *p < .05, ** p < .01
A similar procedure was conducted for non-athletes to find ACT as the only relevant
independent variable. ACT predicted 37.6 percent o f the grade point average (see table 4.52)
and the identification of race as African American predicted 31.7 percent of the variance.
Table 4.52Coefficients o f Regression for Non-Athletes for Demographics and Benchmark Means
UnstandardizedCoefficients
StandardizedCoefficients
B SE B t P(Constant) 1.556 .270 5.763 .000
ACT .055 .010 .376 5.218 <ooi**
African American Status -.571 .129 -.317 -4.408 <ooi**Note: Dependent variable: GPA, ** p < .01
Reproduced with permission of the copyright owner. Further reproduction prohibited without permission.

58
Because some of the benchmark items showed as significant in earlier computations
even when the benchmark means did not, separate stepwise regressions were conducted to
determine how these individual benchmark items predicted academic success. Independent
variables entered into the regression included the demographic characteristics of ACT, race,
sex, father’s education, mother’s education, as well as benchmark items including number of
hours spent in academic preparation, classes that require synthesis of information, classes that
require evaluation of information and methods, asking questions in class and participating in
group projects in class. For athletes, only ACT and the number of hours spent in academic
preparation had significant predictive value for grade point average. ACT accounted for 34.2
percent of the prediction and time spent on academics had a coefficient of 32.5 percent (see
table 4.53).
Table 4.53Coefficients o f Regression for Athletes fo r Demographics and Benchmark Items
UnstandardizedCoefficients
StandardizedCoefficients
B SE 13 t P(Constant) 1.377 .369 3.735 .000
ACT .054 .016 .342 3.325 .001**
Time spent on academic preparation
.129 .041 .325 3.164 .002**
Note: Dependent variable: GPA, ** p < .01
For non-athletes, the same independent variable produced different results. The
success of these students was still predicted by ACT (34.4 percent) but class preparation was
no longer a significant factor. Status as an African American accounted for 27.9 percent of
Reproduced with permission of the copyright owner. Further reproduction prohibited without permission.

59
the variance, while participation in groups inversely predicted success 20.4 percent of the
time. Finally, asking questions in class predicted 15.3 percent of the variance (see table 4.54).
Table 4.54Coefficients o f Regression for Non-Athletes for Demographics and Benchmark Items
UnstandardizedCoefficients
StandardizedC oefficients
B SE B t P(Constant) 2.101 .324 6.479 .000
ACT .050 .011 .344 4.713 <001**
African American Status -.507 .128 -.279 -3.978 <.000**
Doing a group project in class -.143 .048 -.204 -2.951 .004**
Asking questions in class .104 .046 .153 2.254 .026*Note: Dependent variable: GPA, * p < .05, ** p < .01
Lastly a regression was run with both groups together using the same variable as
above but adding athletic status as an independent variable. Athletic status did not emerge as
a relevant variable for this regression (see table 4.55). As was seen in the regressions for the
two separate groups, ACT score was the dominant predictor with 36.6 percent of the
variance. Time spent preparing for class and status as an African American accounted for
18.3 percent and 18.5 percent of the variance respectively. Lastly, having enriching
educational experiences emerged with 15.4 percent of the variance among the combined
groups.
Reproduced with permission of the copyright owner. Further reproduction prohibited without permission.

60
Table 4.55Coefficients o f Regression fo r All Students fo r Demographics, Benchmark Items and Athletic Status
UnstandardizedCoefficients
StandardizedC oefficients
B SE 13 t P(Constant) 1.484 .215 6.4900 .000
ACT .052 .009 .366 6.056 <001**
Time spent on academic preparation
.063 .020 .183 3.203 .002**
African American Status -.325 .103 -.185 -3.147 .002**
Enriching Educational Experiences
.006 .002 .154 2.733 .007**
Note: Dependent variable: GPA, * p < .05, ** p < .01
Student Major
While college major was not a factor originally discussed in any of the hypothesis, the
data related to major deserves examination. Student-athletes enroll in different majors than
non-athletes at Metropolitan University. Table 4.61 displays the majors for both groups of
individuals. Athletes are clustered in several majors; specifically business, communications,
and psychology and at a far greater percentage than the non-athletes. These three majors
enroll 42 percent o f the athletes but only 12 percent of the non-athletes. Conversely, none of
the student-athletes in the study identified themselves in the majors of medicine (a combined
B.A./M.D. program), pharmacy, computer science, biology, or music, the schools to which
MCU attracts the most highly competitive students. ACT scores for these schools average
29, 28, 25, 24, and 24 respectively. The non-athlete population has 17.3 percent of the
sample enrolled in medicine, 8 percent enrolled in pharmacy, 4.7 percent in computer
Reproduced with permission of the copyright owner. Further reproduction prohibited without permission.
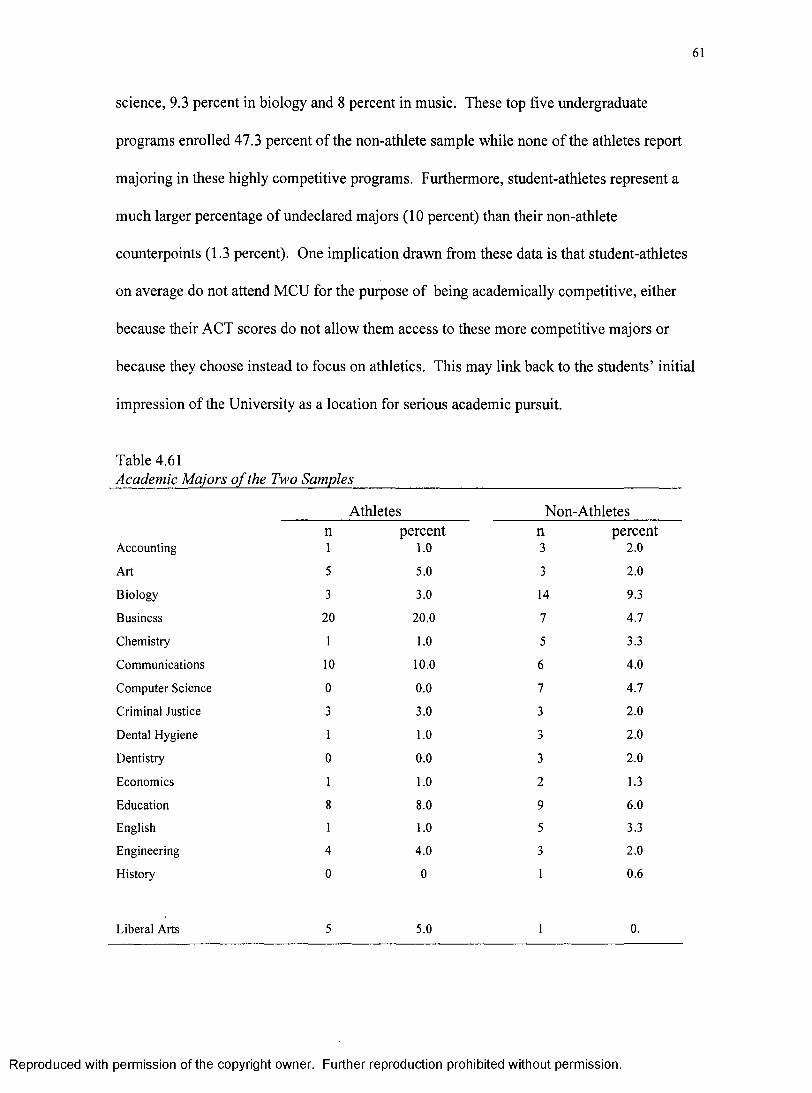
61
science, 9.3 percent in biology and 8 percent in music. These top five undergraduate
programs enrolled 47.3 percent of the non-athlete sample while none of the athletes report
majoring in these highly competitive programs. Furthermore, student-athletes represent a
much larger percentage of undeclared majors (10 percent) than their non-athlete
counterpoints (1.3 percent). One implication drawn from these data is that student-athletes
on average do not attend MCU for the purpose of being academically competitive, either
because their ACT scores do not allow them access to these more competitive majors or
because they choose instead to focus on athletics. This may link back to the students’ initial
impression of the University as a location for serious academic pursuit.
Table 4.61Academic Majors o f the Two Samples
Athletes Non-Athletesn percent n percent
Accounting 1 1.0 3 2.0
Art 5 5.0 3 2.0
Biology 3 3.0 14 9.3
Business 20 20.0 7 4.7
Chemistry 1 1.0 5 3.3
Communications 10 10.0 6 4.0
Computer Science 0 0.0 7 4.7
Criminal Justice 3 3.0 3 2.0
Dental Hygiene 1 1.0 3 2.0
Dentistry 0 0.0 3 2.0
Economics 1 1.0 2 1.3
Education 8 8.0 9 6.0
English 1 1.0 5 3.3
Engineering 4 4.0 3 2.0
History 0 0 1 0.6
Liberal Arts 5.0 0.
Reproduced with permission of the copyright owner. Further reproduction prohibited without permission.

62
Medicine 0 0.0 26 17.3
Music 0 0.0 12 8.0
Nursing 8 8.0 3 2.0
Pre-Health 1 1.0 6 4.0
Pharmacy 2 2.0 12 8.0
Psychology 12 12.0 5 3.3
Philosophy 1 1.0 0 0.0
Political Science 2 2.0 1 0.6
Sociology 1 1.0 0 0.0
Theatre 0 0.0 1 0.6
Urban Affairs 1 1.0 3 2.0
Undeclared 10 10.0 2 1.3
Total 101 100 146 100
By collapsing these majors into broader category, it is clear that it is not just specific
majors that athletes are drawn to or avoid. Table 4.62 collapses the majors into larger fields
of study. Athletes are more likely to be found in professional studies than in science or
liberal arts. Over 50 percent of the sample can be found in majors that are professional or
pre-professional compared to only 20.8 percent in the non-athlete sample. These numbers are
reversed in the field of science where over 55 percent of the non-athletes are science majors
compared to only 19.8% in the health sciences, engineering, computer science and chemistry.
Reproduced with permission of the copyright owner. Further reproduction prohibited without permission.
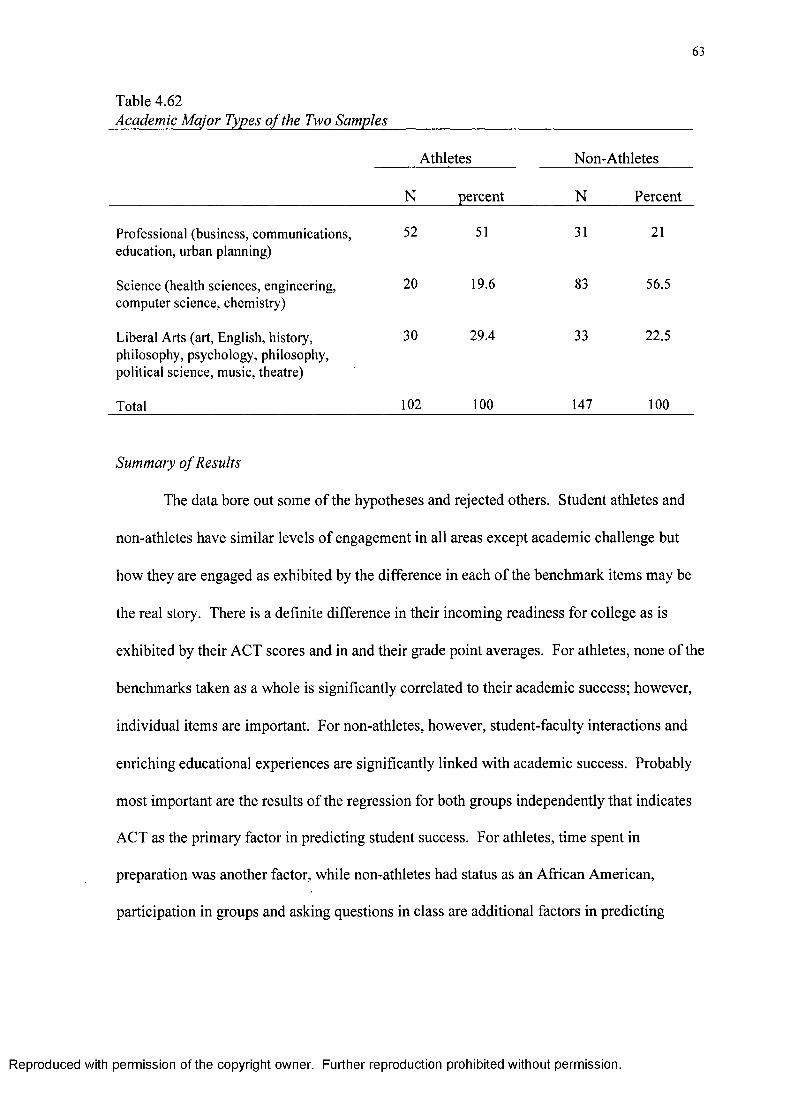
63
Table 4.62Academic Major Types o f the Two Samples_____________________________________
Athletes Non-Athletes
N percent_________ N______ Percent
Professional (business, communications, education, urban planning)
52 51 31 21
Science (health sciences, engineering, computer science, chemistry)
20 19.6 83 56.5
Liberal Arts (art, English, history, philosophy, psychology, philosophy, political science, music, theatre)
30 29.4 33 22.5
Total 102 100 147 100
Summary o f Results
The data bore out some of the hypotheses and rejected others. Student athletes and
non-athletes have similar levels of engagement in all areas except academic challenge but
how they are engaged as exhibited by the difference in each of the benchmark items may be
the real story. There is a definite difference in their incoming readiness for college as is
exhibited by their ACT scores and in and their grade point averages. For athletes, none of the
benchmarks taken as a whole is significantly correlated to their academic success; however,
individual items are important. For non-athletes, however, student-faculty interactions and
enriching educational experiences are significantly linked with academic success. Probably
most important are the results of the regression for both groups independently that indicates
ACT as the primary factor in predicting student success. For athletes, time spent in
preparation was another factor, while non-athletes had status as an African American,
participation in groups and asking questions in class are additional factors in predicting
Reproduced with permission of the copyright owner. Further reproduction prohibited without permission.

student success. The final regression shows that despite some differences between athletes
and non-athletes, status as an athlete was not a significant factor once all other variables were
considered. The complex set of factors discovered here are pulled together in the discussion
in chapter five.
Reproduced with permission of the copyright owner. Further reproduction prohibited without permission.

CHAPTER V
SUMMARY AND DISCUSSION
Summary
As has been discussed before, the landscape of college athletics is complicated. So
too is the data that surrounds student-athletes. While definitive answers cannot be drawn,
some strong implications are shown in this study.
Academic success. One of the purposes was to determine if athletes and non-athletes
succeed equally at MCU. In this case athletes’ grade point averages were .24 lower than non
athletes, a significant difference (p = .001). Some of the variance can be explained by the
level to which athletes and non-athletes come prepared for university work. As has been seen
in other research, the athletes at Metropolitan City University come to college less prepared
than their non-student counterparts. The ACT data bears this out with strong statistical
significance. Non-athletes averaged an ACT score of 24.0 while athletes only had a 22.05 ip
< .001). None-the-less, athletes still averaged ACT of 22.05, which is higher than the
national average of 21 and the state average of 22. It falls short, however, of the MCU
freshman average of 24. The strong correlation between standardized tests and grade point
average found by other researchers (Bowen & Levin, 2003; Hood, Craig & Ferguson, 1992;
Siegel, 1994; Snyder, 1996; Stuart, 1985) would predict lower grade point averages for
athletes. Indeed, this is the case with this population with 34.2 percent of the GPA predicted
by ACT scores.
Another strong predictor of ACT scores for non-athletes and for both groups
combined was whether or not the student was African American. In regression analysis of
grade point average with non-athletes and with both groups combined, the identification of
Reproduced with permission of the copyright owner. Further reproduction prohibited without permission.

66
one as an African American predicted negatively 27% and 18% of the GPA respectively.
Being an African American did not appear to predict GPA for athletes, possibly because the
sample size was smaller. It may also be that the athletic department does a better job of
meeting the needs of African American students than can the University as a whole.
Academic challenge. Less preparedness prior to college is not the only difference
between student athletes and their counterparts. Another relevant piece of the equation is that
athletes spend much less time preparing for their coursework than their counterparts. As the
number of hours spent preparing for class is very highly correlated to academic success both
in a Pearson correlation and the multiple regression in this study, students who dedicate the
time in college work through homework, read assignments, and study, are in a better position
to do well academically. Athletes, however, are not dedicating nearly as much time to these
critical activities. Non-athletes spend 80% more time on their academic studies outside of
class than non-athletes. Not only do athletes allocate less time for academics but they feel
that their institution does not emphasize spending the time on coursework as is shown in one
of the benchmark questions related to academic challenge. Whether this perception comes
from the expectations presented in their courses or by the culture of the athletic department is
unclear. Either way, Table 4.23 in the last chapter shows athletes are receiving a message
about the importance of academics that is significantly different from that perceived by non
athletes and the resulting time spent on academics is heavily correlated to academic success
(Table 4.42). It is how student-athletes react to this perception that is ultimately important.
One implication is that some student-athletes feel that academic are not stressed by
the institution but spend the required time to make the grade regardless. The extent to which
students see MCU as a serious academic institution may factor into the type of majors
Reproduced with permission of the copyright owner. Further reproduction prohibited without permission.
67
athletes choose to enroll in. If the student perceived from the time of their recruitment that
academics were less important than athletics, he or she may have been more inclined to
choose majors that would allow them to focus on their athletic pursuits.
Rigor o f coursework. While it is dangerous to assert that some fields of study are
easier than other, it does appear that the coursework that athletes taken by some is less
demanding as can be seen in the benchmark related to academic challenge. Athletes had
significantly lower means in this area than non-athletes. Their classes were less likely to
synthesize or organize ideas or make judgments about information, arguments or methods.
The classes enrolled in by athletes required fewer textbooks and a smaller number of papers
written in the 5 - 19 page range.
Despite lower levels of these academically demanding concepts, non-athletes were no
more likely to assert that their courses had pushed them to work harder than they thought they
could. Thus, student athletes are enrolled in classes in line with their preparedness and their
expectations. A student with a greater level of preparedness and higher expectations
(because they have enrolled in a competitive program) equally felt that they are up to the task
of their courses and respond similarly to the question.
Active and collaborative learning. No overall differences existed between athletes
and non-athletes in the benchmark of active and collaborative learning. Further examination
of the specific concepts showed subtle difference between the groups, in some cases
reflecting varying levels of collaboration and in other instances showing differences in the
activity’s significance to academic development. This latter situation occurs with both the
act of tutoring and the participation in group projects. Student-athletes and non-athletes both
benefit from the act of tutoring. The correlations between tutoring and grade point average
Reproduced with permission of the copyright owner. Further reproduction prohibited without permission.

68
were statistically significant for both groups but the relationship was stronger for non
athletes. This may again be a result of the rigor of the two groups’ coursework. In highly
demanding and competitive programs, the fact that a student served as a tutor would indicate
that he or she has a good handle on a difficult subject, something that may separate an
otherwise tight pack of achievers.
Similarly, student athletes and non-athletes were alike in the frequency with which
they were required to work in groups both during and outside of class. For non-athletes,
however, working on group projects in class had a negative correlation to grade point
average. This is a surprising as it seems intuitive that collaboration would assist students in
achieving good grades. However, as more non-athletes are enrolled in competitive majors,
competition may be the norm in those programs rather than collaboration. When the act of
engaging others was not required, student-athletes opted out o f collaborative learning. They
were less likely to interact with classmates outside of class to discuss readings or academic
ideas. This fact may relate back to the apparent focus that athletes have on physical
endeavors rather than academic ones. They may also be or feel isolated from non-athletes in
their classes because of frequent absences due to travel.
The diversity of individuals that athletes’ come in contact with on a daily basis
experience is also narrower than that of non-athletes. Student-athletes are less likely to have
a conversation with a student of a different race or ethnicity than non-students. This may
again be a phenomenon of the focus on athletics experienced by athletes. If athletes are less
likely to interact outside of class with classmates, they are probably spending more time with
each other.
Reproduced with permission of the copyright owner. Further reproduction prohibited without permission.

69
Although athletic teams at some institutions are more diverse than the general
academic population, that is not the case with these two samples. Similar in Caucasian and
African American percentages, the athletic sample was less diverse in Asian and Hispanic
representation. Although contact with students of diverse ethnicities was not significant for
either of the two samples independent of one another, when they were combined, the
significance ofp = .038 (r = .131) shows that access to diversity is desirable as a general
concept even if it did not bear itself out as significant with the two smaller samples. Student-
athletes also felt less encouraged by the institution to make contact with individuals from
different background, perhaps because they spend so much of their time with the same
individuals within the athletic department. This isolation or perceived isolation could explain
why they do not interact as much with individuals from other economic, social, racial or
ethnic backgrounds.
Student-faculty interactions. In addition to having different relationships with peers,
student-athletes also have slightly different relationships with their teachers and classmates.
They are more likely than non-athletes to have a conversation with their instructor about a
grade or assignment, possibly as a result of the frequency with which athletes are forced to
miss class because of travel to competitions. When they are absent from class, by necessity,
athletes must communicate with their professors about what they missed. This fact does not
have a correlation to grade point average, however. In a related issue, student athletes were
just as likely to ask questions in class as non-athletes but the significance of this kind of class
participation was only relevant to grade point average for non-athletes. The fact that non
athletes participation in class has a correlation to grade point average can possibly be
explained by again looking at the rigor of the coursework. More demanding classes may
Reproduced with permission of the copyright owner. Further reproduction prohibited without permission.

70
require students to seek clarification to understand course concepts while less demanding
courses may present information that is more straightforward requiring less class
participation to comprehend.
Educationally-enriching experiences. The enriching educational experience
benchmark items also revealed differences in the collegiate lives of athletes and non-athletes.
In some of these items, the significance of the activity could only be seen when the statistical
procedure was performed on both athletes and non-athletes together. This was the
phenomenon occurring with access to foreign language work and a practicum, internship,
field experience, co-op assignment or clinical assignment.
Although neither item had a statistical significance to grade point average for the two
samples independently, there was significance for both populations combined. Having a
practicum, internship, field experience, or similar experience had a .169 Pearson correlation
to grade point average (p = .007). Non-athletes had greater access to these experiences but
statistically fell just short of significance with a p = .058. Similarly, foreign language work
had a .134 Pearson correlation (p = .034) to GPA for both populations. In this case, the
athlete population has more experiences in this area with a mean of 3.0 versus 2.74 for non
athletes. The significance at;? = .067 fell short or the p <.05 level but might have had more
significance with a greater sample of athletes. The two differences in experiences may again
be explained by looking at majors. Scientific fields rely heavily on clinical experiences as a
teaching tool and are less likely to require a foreign language while liberal arts are the
opposite.
Finally the benchmark item for which there was the greatest difference dealt with how
students in both samples spent their times. The number of hours spent in co-curricular
Reproduced with permission of the copyright owner. Further reproduction prohibited without permission.
71
activities (which included athletics) was much higher for athletes than those spent by non
athletes. Although this question on the survey covered several types of activities, including
student government, Greek life, and major-specific organizations, the majority of the time
spent on this category by student-athletes is most likely given to athletics. As the athletes
took the survey, they would talk out loud and that question always prompted someone to ask
out loud, “how much time do I spend on [this sport]?”
Despite the fact that there was such a difference in time spent on extra-curricular
activities between the two groups, there was no correlation negative or positive between the
number of hours (or amount o f time) spent in these activities and grade point average.
Ironically, it is not the time spent on athletics that appears to impact grade point average for
athletes but rather the amount of time that they do not spend studying. Besides studying less
and engaged in athletics more, how else do athletes’ daily activities differ from the average
student in the non-athlete sample?
Not only do athletes and non-athletes have qualitatively different experiences in how
they spend their days, but the athletes’ time appears to be spent with a much narrower focus,
specifically engaged in extracurricular activities. This tight focus, presumably on athletics, is
clearly a different kind of engagement than that experienced by the rest of the undergraduate
population. Furthermore, the students’ lives outside of school are different between the two
groups. With so much focus in their daily live on athletics, it is not surprising that some
student-athletes have a harder time succeeding in their academic world.
Multiple regressions. While much of what is presented above indicates differences in
athletes and non-athletes engagement and its relationship to academic development, it is the
connection of all these things together that shows the real picture. Several step-wise
Reproduced with permission of the copyright owner. Further reproduction prohibited without permission.

72
regressions were performed in this study to try to get a clearer snapshot of the engagement
factors that really impact grade point average. The first regression was designed to determine
if any of the engagement benchmarks had a real relation to athletes after several important
factors were statistically controlled. ACT has already been discussed in this chapter as an
influencing factor in grade point average. Other studies show women athletes performing
better in their academic pursuits than men (Burton-Nelson, 1994; Meyer, 1990; Pascarella &
Terenzini, 1991). Academic development research implies that the level of parental
education can correlate to success (Pascarella & Terenzini). Finally, race can be a
confounding factor in analyzing the weight of a correlation.
ACT, gender, race, and parental education level were all loaded into the regression
equation with the four benchmark scores. For athletes, the only variable that was important
to grade point average was ACT scores. When the benchmark items with any significant
correlation (from the Pearson correlations) were added to the equation, ACT remained the
most important predictor followed by the amount of time spent on academic coursework.
Gender and race were excluded from the equation as insignificant factors as were items
related to tutoring, synthesizing or evaluating material or asking questions in class. The
implication here is that the single most important activity that an athlete can do to increase
his or her chances at academic success is to spend more time on coursework. The concern
for MCU is that the students are not having the importance of this task reinforced for them by
the institution.
For non-athletes, the regression produced different results. With the same pre-
collegiate variables entered with the benchmark means, non-athletes had two significant
factors emerge from the equation. The most important factor for non-athletes was ACT, just
Reproduced with permission of the copyright owner. Further reproduction prohibited without permission.
73
like athletes, but another variable emerged for non-athletes as, namely status as an African
American. After ACT, this variable predicted 31.7 percent of the variance in grade point
averages. It is unclear why this variable predicts for non-athletes and non-athletes, but again
it may have to do with the sample size or possibly the athletic department’s ability to
neutralize issues experienced by African Americans that negatively impact race.
When the individual benchmark items are added into the equation for non-athletes,
ACT (34.2 percent) and amount of time spent on coursework (32.5 percent) are the two
factors that have any significance. For non-athletes, however, more items were relevant.
ACT again had the greatest contribution to the grade point average with 34.4 percent of the
GPA predicted by ACT. Status as an African American predicted 27.9 percent and asking
questions in class had a 15.3 percent contribution to the grade point average. Working in a
group predicted 20.4 percent of the GPA but had an inverse relationship to grade point
average. As has been proposed before, non-athletes appear to be more invested in their
academic development and are in more competitive programs. The participation in class
either affords advanced students the extra clarity they need to understand the coursework or
perhaps smarter students participate in class discussions because they understand the
concepts being presented.
Most importantly, a regression was run on both groups combined with all of the
factors mentioned above plus status as an athlete as an independent variable. Athletic status
did not significantly predict GPA.
Implications fo r Practice
The research has some interesting findings that can assist the athletic department at
MCU. Overall the news is good for this particular university. Athletes at MCU arrive with
Reproduced with permission of the copyright owner. Further reproduction prohibited without permission.

ACT scores that are higher than the state and national average. They also graduate at rates
that are higher than some of the non-athlete counterparts. Forty-one percent of MCU
freshman graduated in 2004 from the cohort o f 1997-1998 while 43 percent of student-
athletes graduated in the same year from the same cohort (NCAA Graduation Survey, 2004).
Graduation rates for transfer students were unavailable for the general population at MCU but
the NCAA shows the athletic department graduated 60 percent of it transfer students in 2004.
Additionally, the fact that athletes and non-athletes both responded similarly to questions
about working hard to meet instructor’s standards may indicate that MCU has done a good
job of meeting the needs and expectations of student athletes. Athletes have taken less
challenging academic routes than non-athletes, but this factor in and of itself does not
indicate a fault in the school’s athletic program.
Administrators could find ways to encourage student-athletes to put more time into
their academic subjects while investigating why student-athletes do not perceive MCU to
place importance on their coursework. The perception of the emphasis of the institution on
coursework is an important one for school administrators to investigate. Raising the
academic expectations for athletes could result in attracting more prepared and more
academically successful students to the institution. It could also result in student-athletes,
similar to those in this study, spending more attention to schoolwork, and thereby raising
their grades. None-the-less, athletes are succeeding at MCU as measured by their graduation
rates if not by their grades. Most importantly, being an athlete at MCU is not a moderating
factor for one’s grade point average.
The nurturing of relationships between athletes and non-athletes would assist in
breaking athletes out of their isolation, whether real or perceived. Regular conversations with
Reproduced with permission of the copyright owner. Further reproduction prohibited without permission.

75
non-athletes might change athletes’ perceptions about the importance of academics as well as
expose student-athletes with a broader range of individuals. Athletes would not just benefit
from these relationships socially, but possibly in their grade point averages because of the
correlation found in this study between GPA and having serious conversations with diverse
individuals.
Outside of the athletic department, MCU needs to further evaluate how to remove
barriers to African Americans in the general student population. O f all of the variables
measured in the NSSE survey, being an African American was the second largest predictor of
student success: in this case a negative predictor. This issue should be a serious concern for
the University’s administration.
Transferability o f This Study
Much can still be learned about the experiences of athletes and how institutions can
better help them succeed. This study has looked at a small slice of athletes and compared
them to their non-athlete counterparts at a specific institution in the Midwest. Some of the
lessons learned here are transferable and answer questions about a larger section of athletes.
While the individual demographics of the students and institution may differ from other
situations across the country, there are many athletic programs in Division I, II and III that
struggle with balancing academic goals with athletic success. Many institutions, particularly
those without football, from all of the divisions deal with a range of academic programs of
varying academic challenge. They too probably have student-athletes who are attracted to
their institution for reasons that differ from those of the general population. They too
probably have students that self-select into less difficult classes and majors. The daily
Reproduced with permission of the copyright owner. Further reproduction prohibited without permission.

76
experiences and division of time are also likely to be common experiences across the
different schools, conferences and divisions.
This study with its use of the National Survey of Student Engagement could be used
as a model to test the experiences of athletic departments. By examining the benchmark
means and items as they relate to athletes and non-athletes, institutions can determine how
these two populations are different, if they are at all, and how these differences need to be
managed to ensure success of all students. Consideration o f pre-collegiate factors and an
examination o f GPA and even graduation rates, should give an institution a guide to how well
they are serving their student-athlete population. The wide spread use of the NSSE survey,
makes this a manageable study for all types of institutions to undertake.
Future Research
Many questions still remain and will certainly be explored. On a micro level, data at
MCU could be analyzed by team to differentiate between those teams whose student athletes
are successfully engaging with the campus and those that are not. This type of analysis could
also be done across many institutions to see if data reflected at one institution is also similar
at another within a given sport. Other studies have shown basketball and football athletes to
have wider gaps in academic achievement with non-athletes than students engaged in other
sports (Hood, Craig, Ferguson, 1992; Richards & Aries, 1999). A study analyzing
engagement in specific sports could add to this literature. Bowen and Levin (2003) suggest
that the real divide in college athletes fall between student-athletes on scholarship and those
who are walk-ons or receive no aid. Studying how these two different set of athletes engage
with their institutions may show how athletic programs impact student development by
offering (or not-offering) scholarships to student-athletes.
Reproduced with permission of the copyright owner. Further reproduction prohibited without permission.
77
An examination of different divisions within the NCAA could show how certain
elements of the student experience differ depending on the cultures of the various divisions.
Similarly, analysis could be drawn between conferences within divisions to see if each really
has a distinct culture that affects academic development. If the survey was administered both
during season and out-of-season for athletes, a comparison by term could determine whether
students are able to focus more on academics when they are not constantly involved in active
athletic competition. A large student between male and female student-athletes could also be
very interesting.
MCU plans to continue to use the NSSE survey with their student population and has
discussed increasing the number of athletes who participate in the survey. If they are
successful in getting good representation from student athletes, a longitudinal study of MCU
student athletes would be possible and worthwhile.
Finally, an examination of the fifth benchmark might illuminate important
information. This last benchmark measures how well the institution itself fosters items in the
first four benchmarks. To what degree do the students’ perceptions of the support of the
institution for academics correlate with the students’ academic success? This relationship is
alluded to in some of the questions included in the first four benchmarks and could highlight
best (and worst) practices for institutions.
Conclusions
By now it is clear that athletes and non-athletes are differently engaged with their
universities. Non-athletes, who work outside the home and spend more time as caregivers,
are more engaged with their university academically. They take harder courses, study more,
engage in more critical thinking, and carry the concepts they learn in their courses into
Reproduced with permission of the copyright owner. Further reproduction prohibited without permission.

78
discussions with other students once they leave the classroom. They feel their institution
encourages academic development as well as their increased interaction with people of
different backgrounds.
Athletes, on the other hand, are more engaged with the non-academic experiences at
the university. They spend more time in extracurricular activities than in studying or
spending time as caregivers. Their focus appears to be very insular to the world of athletics
with less time spent communicating with other students inside or outside of class. They are
exposed to a less diverse population of students and feel the University does little to
encourage them to do otherwise.
Beyond their differences in engagement once they are on campus, the two populations
appear to be most different in two critical pre-collegiate variables, their collegiate aptitude as
measured by their incoming ACT scores and their selection of majors. It is unclear whether
athletes choose majors that complement their athletic pursuits or if they are genuinely
interested in more applied fields. None-the-less the implication of all of these factors is that
they are at the university to play sports. Ultimately, the level of engagement has little
correlation to their academic success. Further more the mere fact that one is an athlete, does
not predict positively or negatively, one’s academic success. Much of it has to do with the
type of student they are and how much they are willing to apply themselves to their academic
studies. The challenge for institutions is to develop programs to meet the expectations and
needs of all types of students regardless of their status as an athlete and to help each student
fulfill his or her potential.
Reproduced with permission of the copyright owner. Further reproduction prohibited without permission.
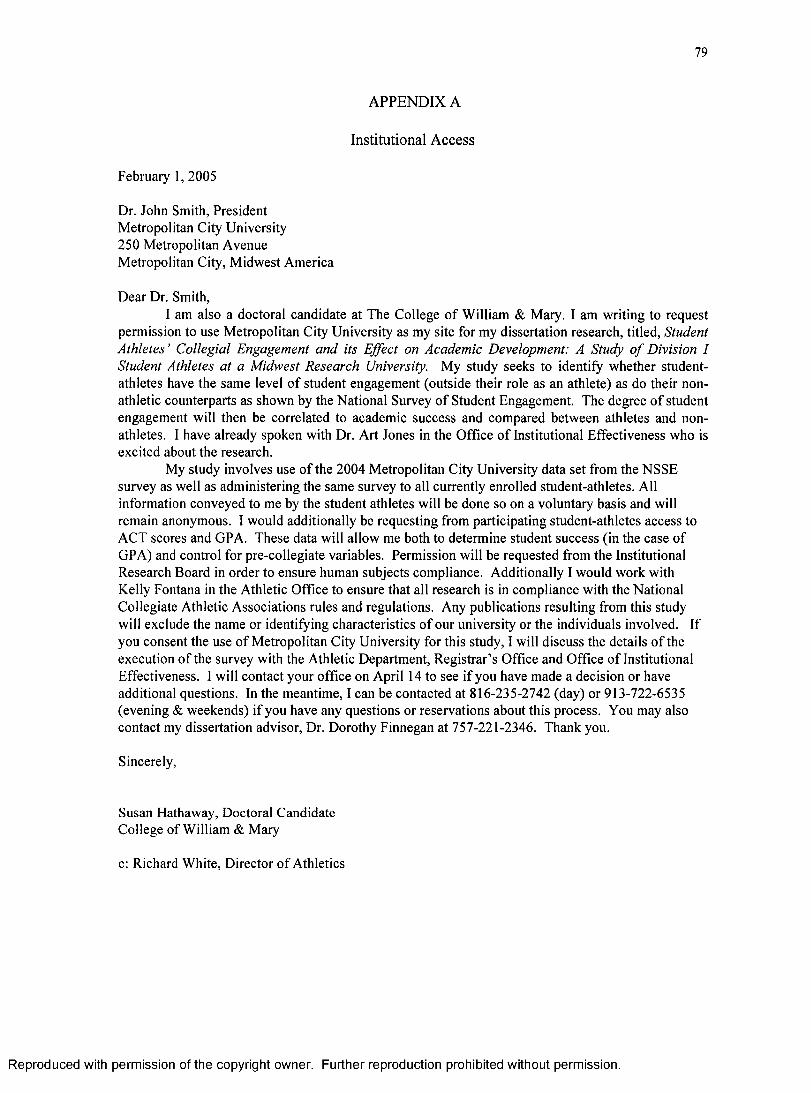
79
APPENDIX A
Institutional Access
February 1, 2005
Dr. John Smith, President Metropolitan City University 250 Metropolitan Avenue Metropolitan City, Midwest America
Dear Dr. Smith,I am also a doctoral candidate at The College of William & Mary. I am writing to request
permission to use Metropolitan City University as my site for my dissertation research, titled, Student Athletes ’ Collegial Engagement and its Effect on Academic Development: A Study o f Division I Student Athletes at a Midwest Research University. My study seeks to identify whether student- athletes have the same level of student engagement (outside their role as an athlete) as do their non- athletic counterparts as shown by the National Survey of Student Engagement. The degree of student engagement will then be correlated to academic success and compared between athletes and nonathletes. I have already spoken with Dr. Art Jones in the Office of Institutional Effectiveness who is excited about the research.
My study involves use of the 2004 Metropolitan City University data set from the NSSE survey as well as administering the same survey to all currently enrolled student-athletes. All information conveyed to me by the student athletes will be done so on a voluntary basis and will remain anonymous. I would additionally be requesting from participating student-athletes access to ACT scores and GPA. These data will allow me both to determine student success (in the case of GPA) and control for pre-collegiate variables. Permission will be requested from the Institutional Research Board in order to ensure human subjects compliance. Additionally I would work with Kelly Fontana in the Athletic Office to ensure that all research is in compliance with the National Collegiate Athletic Associations rules and regulations. Any publications resulting from this study will exclude the name or identifying characteristics of our university or the individuals involved. If you consent the use of Metropolitan City University for this study, I will discuss the details of the execution of the survey with the Athletic Department, Registrar’s Office and Office of Institutional Effectiveness. I will contact your office on April 14 to see if you have made a decision or have additional questions. In the meantime, I can be contacted at 816-235-2742 (day) or 913-722-6535 (evening & weekends) if you have any questions or reservations about this process. You may also contact my dissertation advisor, Dr. Dorothy Finnegan at 757-221-2346. Thank you.
Sincerely,
Susan Hathaway, Doctoral Candidate College of William & Mary
c: Richard White, Director of Athletics
Reproduced with permission of the copyright owner. Further reproduction prohibited without permission.
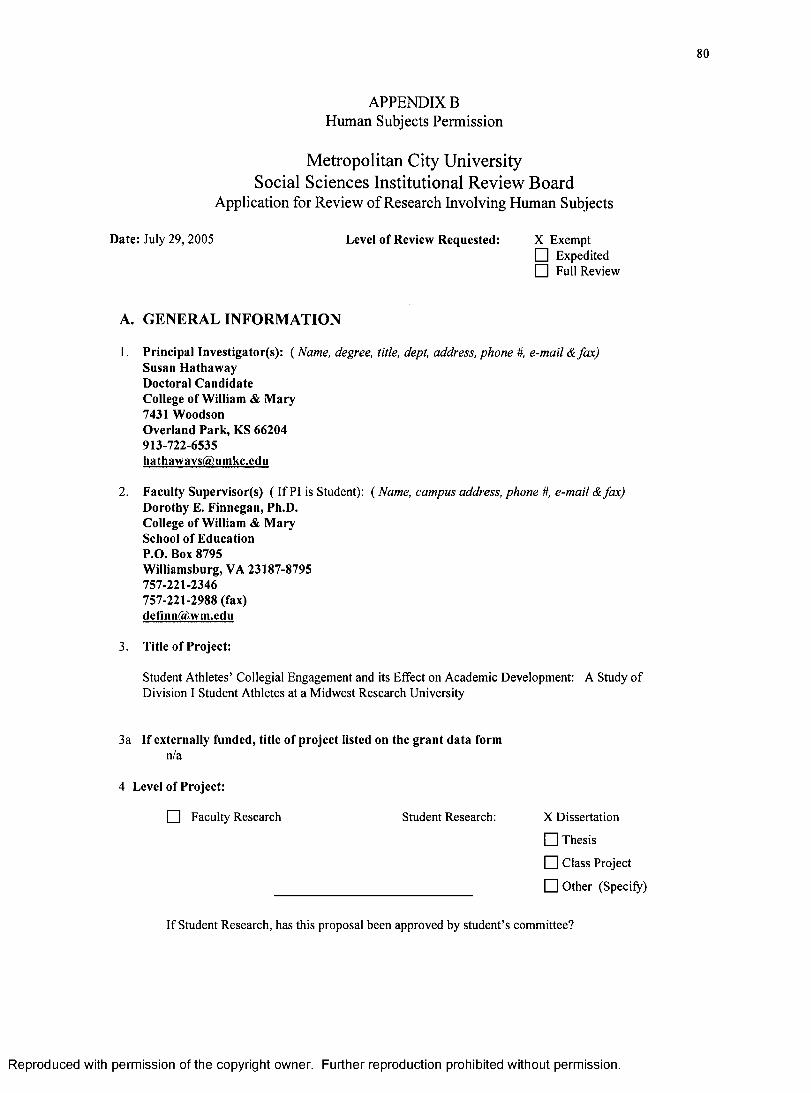
80
APPENDIX B Human Subjects Permission
Metropolitan City University Social Sciences Institutional Review Board
Application for Review of Research Involving Human Subjects
Date: July 29, 2005 Level o f Review Requested: X ExemptI I Expedited I~1 Full Review
A. GENERAL INFORMATION
1. Principal Investigator(s): ( Name, degree, title, dept, address, ph on e #, e-m ail & fax )Susan HathawayDoctoral Candidate College o f W illiam & Mary 7431 W oodson Overland Park, KS 66204 913-722-6535 hathawavs@ umkc.edu
2. Faculty Supervisor(s) ( If PI is Student): ( Name, cam pus address, phone #, e -m ail & fax) Dorothy E. Finnegan, Ph.D.College o f W illiam & M ary School o f Education P.O. Box 8795W illiamsburg, VA 23187-8795 757-221-2346 757-221-2988 (fax) definn@ wm.edu
3. Title o f Project:
Student Athletes’ Collegial Engagement and its Effect on Academic Development: A Study o f Division I Student Athletes at a Midwest Research University
3a If externally funded, title o f project listed on the grant data formn/a
4 Level o f Project:
□ Faculty Research Student Research: X Dissertation
l~l Thesis
I I Class Project
I I Other (Specify)
If Student Research, has this proposal been approved by student’s committee?
Reproduced with permission of the copyright owner. Further reproduction prohibited without permission.
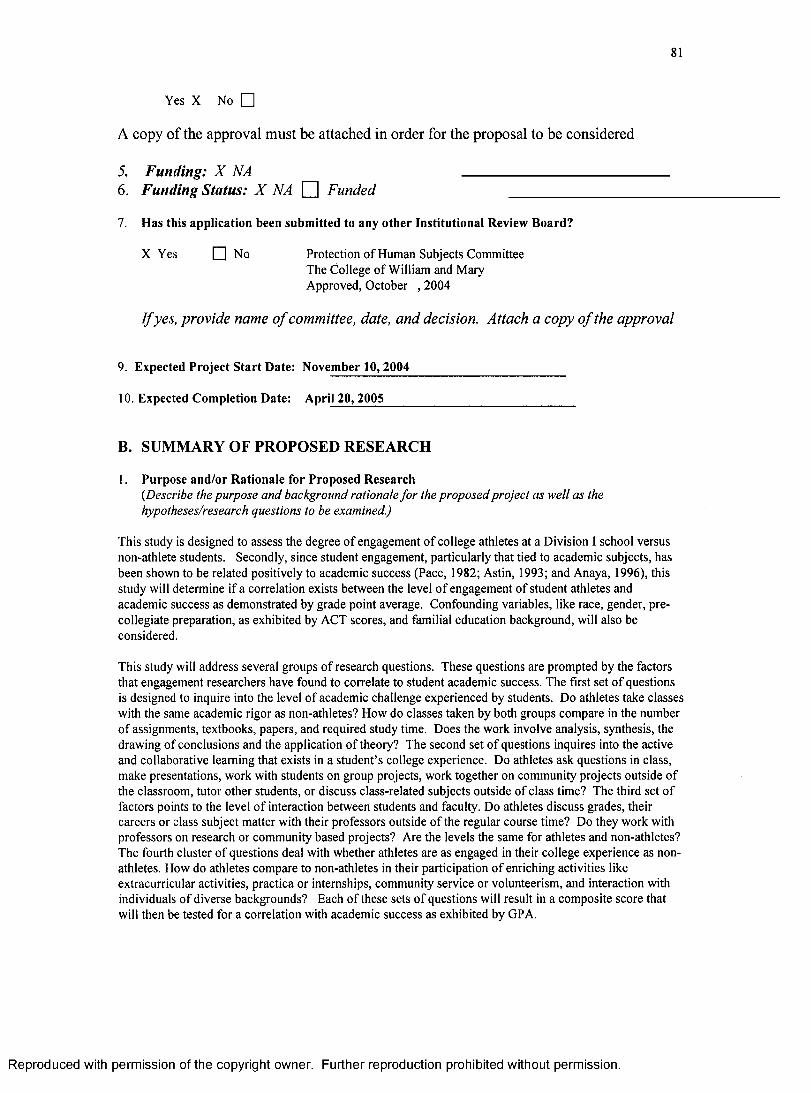
81
Yes X No □
A copy of the approval must be attached in order for the proposal to be considered
5. Funding: X NA ____________________________6. Funding Status: X NA Q Funded ______________________
7. Has this application been submitted to any other Institutional Review Board?
X Yes n No Protection o f Human Subjects CommitteeThe (jollege o f William and Mary Approved, October , 2004
I f yes, provide name o f committee, date, and decision. Attach a copy o f the approval
9. Expected Project Start Date: Novem ber 10 ,2004
10. Expected Completion Date: April 20, 2005
B. SUMMARY OF PROPOSED RESEARCH
1. Purpose and/or Rationale for Proposed Research(D escribe the pu rpose an d background rationale fo r the p ro p o sed p ro jec t as w e ll a s thehypotheses/research questions to be examined.)
This study is designed to assess the degree o f engagement o f college athletes at a Division I school versus non-athlete students. Secondly, since student engagement, particularly that tied to academic subjects, has been shown to be related positively to academic success (Pace, 1982; Astin, 1993; and Anaya, 1996), this study will determine if a correlation exists between the level o f engagement o f student athletes and academic success as demonstrated by grade point average. Confounding variables, like race, gender, pre- collegiate preparation, as exhibited by ACT scores, and familial education background, will also be considered.
This study will address several groups o f research questions. These questions are prompted by the factors that engagement researchers have found to correlate to student academic success. The first set o f questions is designed to inquire into the level o f academic challenge experienced by students. Do athletes take classes with the same academic rigor as non-athletes? How do classes taken by both groups compare in the number o f assignments, textbooks, papers, and required study time. Does the work involve analysis, synthesis, the drawing o f conclusions and the application o f theory? The second set o f questions inquires into the active and collaborative learning that exists in a student’s college experience. Do athletes ask questions in class, make presentations, work with students on group projects, work together on community projects outside o f the classroom, tutor other students, or discuss class-related subjects outside o f class time? The third set o f factors points to the level o f interaction between students and faculty. Do athletes discuss grades, their careers or class subject matter with their professors outside o f the regular course time? Do they work with professors on research or community based projects? Are the levels the same for athletes and non-athletes? The fourth cluster o f questions deal with whether athletes are as engaged in their college experience as nonathletes. How do athletes compare to non-athletes in their participation o f enriching activities like extracurricular activities, practica or internships, community service or volunteerism, and interaction with individuals o f diverse backgrounds? Each o f these sets o f questions will result in a composite score that will then be tested for a correlation with academic success as exhibited by GPA.
Reproduced with permission of the copyright owner. Further reproduction prohibited without permission.

82
2. M ethodology/Procedures( D escribe sequen tia lly an d in detail, a ll procedu res in which the research partic ipan ts w ill be involved, e.g., p a p e r an d p en c il tasks, interviews, surveys, questionnaires, p h ysica l assessm ents, tim e requirem ents, etc.)
This study will be quantitative in nature and use a single institution’s students for data collection. Data will include the entire data set o f 692 responses from MCU for the 2003 National Survey o f Student Engagement as well as a new data set resulting from a paper and pencil administration o f the NSSE 2003 to the full complement o f the 2004-05 student athletes. Student GPA and ACT scores will also be acquired for all athletes and non-athletes from the Registrar’s Office for the study. Three sets o f research questions exist for this study examining 1) the degree to which student athletes are engaged compared to the general population; 2) the success o f athletes versus non-athletes in GPA; and 3) the correlation o f this student engagement to academic development. The degree o f student engagement will be determined by measuring the level o f academic challenge, active and collaborative learning, student interactions with faculty members and enriching educational experiences through the National Survey o f Student Engagement. The NSSE survey will produce a composite score for each o f these clusters. A step-wise regression analysis will be run on each cluster as well as each item within the cluster. The target o f the step-wise regression will be GPA and will be first with the five cluster scores, for the separate groups: athletes and non-athletes. Where the clusters do predict, separate regression analyses for individual items within those clusters will be run. Each cluster has between 6 and 10 survey items, but some o f the survey items have multiple responses.
Prior to any research, permission to conduct the study will be sought from President___________ . She willbe approached through a letter summarizing the proposal. Student athletes will be asked through a letter to participate in the study by taking the survey as well as releasing their academic information to me. All students will be assured confidentiality in the use o f their student information. Responses will be used only in the aggregate. Student will also be informed o f their right to refrain from participation without discrimination as well as the ability to withdrawal at any time. The administration o f the survey to student athletes will be in group settings convenient to the athletes such as team meetings or the beginning o f practices. Athletes not wishing to complete the survey will be given a crossword puzzle option so they do not feel awkward doing nothing while others are filling out the survey. The meetings will be conducted in a way consistent with the rules and regulations o f the National Collegiate Athletic Association.
3. Participants Involved in the Study( D escribe in d e ta il the sam ple to be recru ited including num ber o f participan ts, gender, age range an d any specia l characteristics.)
Participants will include undergraduate male and female student athletes from the UMKC Athletic Department.
4. Recruitment Process(D escribe how an dfrom w hat source the partic ipan ts w ill be recruited. Indicate w here the study w ill take place. A ttach a copy o f any poster(s) a d vertisem en ts) o r letter(s) or so licita tion scrip ts to be used fo r recruitm ent).
Assistance will be sought from the Athletic Department to administer the survey during convenient team meetings. In addition to the survey, students will be given the following letter:
Dear student-athlete,
My name is Susan Hathaway. I am a doctoral student at the College o f William & Mary. I am conducting research for my dissertation on student engagement and athletics and I am seeking your help. If you choose to participate you will be asked to complete a short survey that should take no more than 10-15 minutes to complete. You may choose not to participate.
Your individual answers are completely anonymous and will only be used in combination with other
Reproduced with permission of the copyright owner. Further reproduction prohibited without permission.
83
students’ answers. Your individual name and the name o f this institution will not be connected with any publication summarizing this survey. You will need to include your social security number at the bottom o f the last page. By filling out the survey and including your social security number, you are granting me permission to access information from your student record. Again, none o f your student information will be used in connection with your name or will identify you as an individual in any way.
It is important for you to know that your participation is voluntary and you have the right to refuse to participate in any part o f the study. Your standing on your team will not be affected by choosing to participate or not. You may also withdraw your consent at any time without penalty.
Thank you for your assistance.
Susan Hathaway
Reproduced with permission of the copyright owner. Further reproduction prohibited without permission.

84
5. Compensation of Participants
Will participants receive compensation for participation? Yes Q N o XI f yes, p lea se p ro v id e details:
C. POTENTIAL BENEFITS FROM THE STUDY(D iscuss any po ten tia l d irec t benefits to partic ipan ts fro m their involvem ent in the p ro je c t and/or the po ten tia l benefits to socie ty that w ou ld ju s tify involvem ent o fpartic ipan ts in this study.)
The questions described above will be answered through the investigation proposed below and serve several functions by addressing an unexplored connection between involvement theory and student- athlete success in Division I athletics. Each o f the four clusters mentioned above will provide insight to those factors that appear as detrimental to academic development. Cluster one, “level o f academic challenge” will provide needed research in an area difficult to study. Specifically, the rigor o f coursework taken by athletes is difficult to examine. The practice o f athletes clustering in majors perceived by students to be “easier” appears frequently in the literature (Adler & Adler, 1985; Bowen & Levin, 2003; Pascarella, Bohr, Mora, & Terenzini., 1995; Sack, 1987). This research will establish whether classes taken by athletes are as rigorous as those taken by non athletes. The second cluster, “active and collaborative learning” will inform research on the kinds o f student-to-student relationships experienced by athletes and non-athletes and whether they have the same level o f interactions. These relationships have been shown by Pascarella (1985) as well as Astin (1993), Fieldman & Newcomb (1969), and Pascarella & Terenzini (1991) to affect student development. This research will confirm whether this relationship is as important to academic development in athletes as it is in the general population. The third cluster, “student-faculty interaction” will add to the already solid body o f knowledge about the importance o f student-faculty interactions (Chickering & Reisser, 1993; Kuh et al., 1991; Pascarella & Terenzini, 1991; Stark & Lattuca, 1993). The extent to which athletes experience these relationships and the effect that they have on their academic development will be an important addition to the literature. Finally the final cluster, “enriching educational experiences” addresses the need to understand the affect o f a student’s involvement in learning-centered extracurricular activities on their academic development. Research by Astin, and Feldman, and Newcomb show this involvement as being significant. This research will show if athletes experience the same levels o f involvement as other students and if these experiences impact their academic development. Overall this research will uncover the level o f engagement o f student athletes as it compares to non-athletes and will supplement known research about engagement as it impacts athletes’ academic development. Finally it is important to constantly add to the general body o f knowledge about athletes in general. Some o f the most thorough research on athletics is aging. It is important for institutions to understand how athletes have changed since this research was conducted. This information will further provide athletic administrators with the tools to foster the most positive environment possible. Information about possible reasons for student-athletes academic success is needed to create policies, practices and attitudes to encourage student athlete success.
D. POTENTIAL RISKS FROM THE STUDY
1. (D iscuss the known an d an tic ipa ted risks, i f any, o f the p ro p o sed research. Specify the particu lar risks(s) a sso c ia ted w ith each p rocedu re o r test. C onsider both ph ysica l an d psych o logica l/em otion al risks.)
None
2. {D escribe the procedu res or safeguards in p la c e to p ro tec t the ph ysica l an d p sych o log ica l health o f the partic ipan ts, [e.g. referra l to p sych o log ica l counseling resources])
The confidentiality o f all information will be guaranteed.
Reproduced with permission of the copyright owner. Further reproduction prohibited without permission.

85
E. CONSENT
1. Informed Consent ( if applicable):{D escribe the p rocedu res used to obtain consent an d attach a consent fo r m )Students will sign the following concert form attached to the survey; I will maintain these signed forms in my files.
1 , ____ (name)____________ with the Social Security Number o f (SSN)_________ , consent to the use mygrade point average and demographic student data for the purposes o f this study. I understand that my name will not be associated with any o f the results. I also understand that participation is voluntary and that I have the right to refuse to participate in any part o f the study. My standing on my team will not be affected by choosing to participate or not. I also understand that I may choose to withdraw my consent at any time without penalty.
2. Information Script:{I f w ritten consent w ill not/cannot be ob ta in ed or is con sidered inadvisable, ju s tify this an d outline the process to be used to otherw ise fu lly inform partic ipan ts.)
N/A
F or research in vo lv in g m inors, or others w ho are no t com peten t to g ive lega lly va lid consent, describe the p rocess to be used to obtain perm ission o fp a ren t or guardian. A ttach a copy o f an inform ation-perm ission le tter to be used.
N/A
F. ASSENT{For person s who are not lega lly com peten t to g iver consent but are reasonably com peten t to decide whether to pa rtic ip a te or not p le a se d describe the p rocedu re yo u w ou ld use to ga in assen t an d a ttach the form .)
N/A
G. CONFIDENTIALITY{D escribe the procedu res to be used to ensure anonym ity o fp a rtic ip a n ts a n d confidentiality o f da ta both during the conduct o f the research an d in the release o f its findings. Explain how w ritten records, video/audio tapes, questionnaires w ill be secu red an d p ro v id e deta ils o f their f in ia l disposal. I f da ta are not in tended to be confidential, note how consent fo rm fu lly d iscloses this to pa rtic ip a n ts .)
Data received from the Registrar’s Office will not contain names. Once the GPA and ACT scores are merged with the survey results, the social security numbers will be removed.
H. DECEPTION (if applicable):{D escribe an d ju s tify the n eed fo r deception. Explain the debriefing procedu res to be used an d attach a copy o f the w ritten debriefing.)
N/A
Reproduced with permission of the copyright owner. Further reproduction prohibited without permission.
86
Principal Investigator Statement of Assurance
The proposed investigation involves the use of human subjects. I am submitting
the form with a description of my project prepared in accordance with the MCU policies
for the protection of human subjects participating in research. I understand the
University’s policies concerning research involving human subjects and agree to the
following:
1. Should I wish to make changes in the approved protocol for this project, I will submit them for review PRIOR to initiating the changes.
2. If any problems involving human subjects occur, I will immediately notify the chair o f the SSIRB.
3. I will cooperate with the SSIRB by submitting progress reports in a timely manner.
Signature o f Principal Investigator Date
Signature o f Faculty Advisor ( if any) Date
Reproduced with permission of the copyright owner. Further reproduction prohibited without permission.
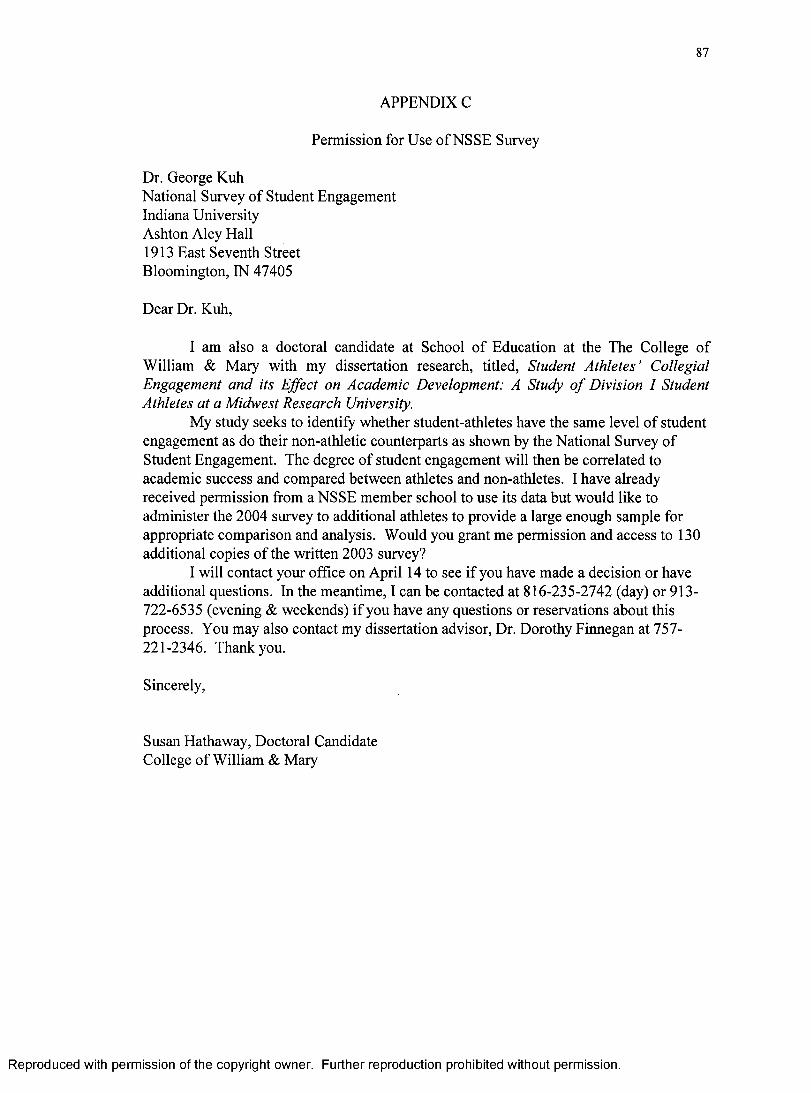
87
APPENDIX C
Permission for Use of NSSE Survey
Dr. George KuhNational Survey of Student EngagementIndiana UniversityAshton Aley Hall1913 East Seventh StreetBloomington, IN 47405
Dear Dr. Kuh,
I am also a doctoral candidate at School of Education at the The College of William & Mary with my dissertation research, titled, Student Athletes’ Collegial Engagement and its Effect on Academic Development: A Study o f Division I Student Athletes at a Midwest Research University.
My study seeks to identify whether student-athletes have the same level of student engagement as do their non-athletic counterparts as shown by the National Survey of Student Engagement. The degree of student engagement will then be correlated to academic success and compared between athletes and non-athletes. I have already received permission from a NSSE member school to use its data but would like to administer the 2004 survey to additional athletes to provide a large enough sample for appropriate comparison and analysis. Would you grant me permission and access to 130 additional copies of the written 2003 survey?
I will contact your office on April 14 to see if you have made a decision or have additional questions. In the meantime, I can be contacted at 816-235-2742 (day) or 913- 722-6535 (evening & weekends) if you have any questions or reservations about this process. You may also contact my dissertation advisor, Dr. Dorothy Finnegan at 757- 221-2346. Thank you.
Sincerely,
Susan Hathaway, Doctoral Candidate College of William & Mary
Reproduced with permission of the copyright owner. Further reproduction prohibited without permission.
88
APPENDIX D
Communication to Athletic Director
Mr. Richard White Director of Athletics Metropolitan City University
Dear Mr. White:
I am a doctoral candidate at The College of William & Mary and have received permission from Dr. John Smith to use Metropolitan City University as my site for my dissertation research, titled, Student Athletes ’ Collegial Engagement and its Effect on Academic Development: A Study o f Division I Student Athletes at a Midwest Research University.
My study seeks to identify whether student-athletes have the same level of student engagement (outside their role as an athlete) as do their non-athletic counterparts as shown by the National Survey of Student Engagement. The degree of student engagement will then be correlated to academic success and compared between athletes and non-athletes.
My study involves use of the 2004 Metropolitan City University data set from the NSSE survey as well as administering the same survey to all currently enrolled student- athletes. All information conveyed to me by the student athletes will be done so on a voluntary basis and will remain anonymous. I would additionally be requesting from participating student-athletes access to ACT scores and GPA. These data will allow me both to determine student success (in the case of GPA) and control for pre-collegiate variables.
I write to seek your support in the administration of this survey during team rehearsals or meetings. This will allow me to personally handout and collect the surveys which will yield a higher return rate for this research. The survey should take no more than 10 minutes. If you agree with this method of collecting data, I will work directly with the team coaches and assistant coaches to schedule times convenient to them and their student-athletes. Any publications resulting from this study will exclude the name or identifying characteristics of our university or the individuals involved. I will contact your office on Monday, March 22 to see if you have made a decision or have additional questions. In the meantime, I can be contacted at 816-235-2742 (day) or 913-722-6535 (evening & weekends) if you have any questions or reservations about this process. You may also contact my dissertation advisor, Dr. Dorothy Finnegan at 757-221-2346. Thank you.
Susan Hathaway, Doctoral Candidate College of William & Mary
Reproduced with permission of the copyright owner. Further reproduction prohibited without permission.

89
APPENDIX E
Email communication for Team coaches
Dear Coach_______________:
I am a doctoral candidate at The College of William & Mary and have received permission from Dr. John Smith to use Metropolitan City University as my site for my dissertation research, titled, Student Athletes ’ Collegial Engagement and its Effect on Academic Development: A Study o f Division I Student Athletes at a Midwest Research University.
Richard White has agreed to allow me to request team meeting or practice time to administer this 10-15 minute survey. This will allow me to personally handout and collect the surveys which will yield a higher return rate for this research. All information conveyed to me by the student athletes will be done so on a voluntary basis and will remain anonymous. Any publications resulting from this study will exclude the name or identifying characteristics of our university or the individuals involved.
Please let me know if there are times during the period of March 22-25 , when I might be able to interact with your student-athletes.
In the meantime, I can be contacted at 816-235-2742 (day) or 913-722-6535 (evening & weekends) if you have any questions or reservations about this process. You may also contact my dissertation advisor, Dr. Dorothy Finnegan at 757-221-2346. Thank you.
Susan Hathaway, Doctoral Candidate College of William & Mary
Reproduced with permission of the copyright owner. Further reproduction prohibited without permission.

90
APPENDIX F
Communication to Students-Athletes
Dear student-athlete,
My name is Susan Hathaway. I am a doctoral student at the College of William & Mary.I am conducting research for my dissertation on student engagement and athletics and I am seeking your help. If you choose to participate you will be asked to complete a short survey that should take no more than 10-15 minutes to complete. You may choose not to participate.
Your individual answers are completely anonymous and will only be used in combination with other students’ answers. Your individual name and the name of this institution will not be connected with any publication summarizing this survey. By filling out the survey and signing the attached consent form with your social security number, you are granting me permission to access your GPA and ACT information from your student record. Again, none of your student information will be used in connection with your name or will identity you as an individual in any way.
It is important for you to know that your participation is voluntary and you have the right to refuse to participate in any part of the study. Your standing on your team will not be affected by choosing to participate or not. You may also withdraw your consent at any time without penalty.
Thank you for your assistance.
Susan Hathaway
Reproduced with permission of the copyright owner. Further reproduction prohibited without permission.

91
APPENDIX G
Consent for Participation in a Research StudyStudent Athletes ’ Collegial Engagement and its Effect on Academic Development:
A Study o f Division I Student Athletes at a Midwest Research University.Susan H athaw ay
Invitation to ParticipateYou are in vited to pa rtic ip a te in a research study
Who will ParticipateA ll Student-athletes a t M etropolitan C ity U niversity are bein g asked to partic ipa te
PurposeThe survey is the N ation al Survey o f S tudent Engagement. Som e o f yo u m ay have taken a survey sim ilar to this as a freshm an last year. This research dea ls specifica lly w ith athletes.
Description o f ProceduresThe survey w ill take betw een 10 - 15 minutes. There are no p en a lties fo r not participating.
Voluntary ParticipationP articipation in this study is voluntary a t a ll times. You m ay choose to not p a rtic ip a te or to w ithdraw yo u r partic ipa tion a t any time. D ecid in g not to p a rtic ip a te o r choosing to leave the study w ill not resu lt in any penalty. I f yo u decide to leave the study the information yo u have a lready p ro v id e d w ill be destro yed i f yo u ask it to be.
Fees and ExpensesThere are no fe e s a ssoc ia ted with partic ipa tion in this study.
CompensationThere is no com pensation fo r partic ipa tion in this study.
Alternatives to Study ParticipationI f yo u choose not to partic ipa te , yo u can w ork on the crossw ord pu zzle on the back o f this fo rm w hile yo u r p eers com plete their survey.
AnonymityYour information w ill rem ain anonym ous an d w ill not be used in any w ay that w ou ld identify yo u individually. While every effort w ill be m ade to keep confidential a ll o f the information yo u com plete an d share, it cannot be absolu tely guaranteed. Individuals fro m the M etropolitan C ity U niversity Institu tional R eview B o a rd ( a com m ittee that review s an d approves research s tu d ie s ), R esearch P rotections Program , a n d F edera l regu la tory agencies m ay look a t records re la ted to this study f o r quality im provem ent an d regu latory functions.
In Case o f InjuryThe M etropolitan C ity U niversity apprecia tes the partic ipa tion o fp eo p le w ho help it carry out its function o f develop ing know ledge through research. I f yo u have any questions about the stu dy that yo u are partic ipa tin g in yo u are en couraged to ca ll Susan H athaway, the investigator, a t 913-722-6535. Although it is not the U niversity's p o lic y to com pensate or p ro v id e m edica l treatm ent f o r person s w ho pa rtic ip a te in studies, i f yo u think yo u have been in jured as a resu lt o fp a r tic ip a tin g in this study, p lea se ca ll H olly B lack o f M etropolitan C ity U n iversity’s S ocia l Sciences Institu tional R eview Board, a t 555-555-1234.
Questions
Reproduced with permission of the copyright owner. Further reproduction prohibited without permission.

92
In case o f questions, please contact Susan Hathaway at 913-722-6535 or D orothy F innegan a t 757-221- 2346
AuthorizationBy signing below, you authorize Susan Hathaway to use your NSSE survey for her research as well as your GPA and ACT scores as provided by the Registrar’s Office.
Printer Name Signature
Social Security Number Date
Reproduced with permission of the copyright owner. Further reproduction prohibited without permission.

APPENDIX H
The College Student Report 2004National Survey of Student Engagement
D In your experience a t your institution during the current school year, about how often have you done each of th e following? Mark your answers in the boxes. Examples: 0 o r H
Very Some-often Often tim es Never
▼ ▼ ▼ ▼r. Worked harder than you thought
you could to meet an instructor's standards or expectations □ □ □ Q
Very Some- often Often tim es Never
▼ ▼ ▼ ▼a. Asked questions in class or
contributed to class discussions □ □ □ □
b. Made a dass presentation □ □ □ □
c Prepared two or more drafts of a paper or assignment before turning it in □ □ □ □
d. Worked on a paper or project that required integrating ideas or information from various sources LJ □ □ □
e. Included diverse perspectives (different races, religions, genders,
discussions or writing assignments Q □ □ □f . Come to class without completing
readings or assignments □ □ □ □g. Worked with other students on
projects during dass □ □ □ □h. Worked with classmates
outside o f d a ss to prepare dass assignments □ □ □ □
i. Put together ideas or concepts from different courses when completing assignments or during class discussions □ □ □ □
j. Tutored or taught other students (paid or voluntary) □ □ □ □
k. Participated in a community-based project (e.g., service learning) as part of a regular course
1
□ □ □ □1. Used an electronic medium
(listserv, chat group, Internet, instant messaging, etc) to discuss or complete an assignment □ □ □ □
m. Used e-mail to communicate with an instructor □ □ □ □
n. Discussed grades or assignments with an instructor □ □ □ □
o. Talked about career plans with a faculty member or advisor □ □ □ □
p. Discussed ideas from your readings or dasses with faculty members outside of dass □ □ □ □
q. Received prompt feedback from faculty on your academic performance (written or oral) □ □ □ □
s. Worked with faculty members on activities other than coursework (committees, orientation, student life activities, etc.) U
t Discussed ideas from your readings or classes with others outside of class (students, family members, co-workers, e tc) □
U. Had serious conversations with students of a different race or ethnicity than your own
V. Had serious conversations with students who are very different from you in terms of their religious beliefs, political opinions, or personal values
□ □ □
□ □ □
□ □ □ □
□ □ □ □H During th e current school year, how much has
your coursew ork em phasized th e following mental activities?
Very Quite Very much a bit Some little
a. Memorizing facts, ideas, or methods from your courses and readings so you can repeat them in pretty much the same form □ □ □ □
b. Analyzing the basic elements of an idea, experience, or theory, such as examining a particular case or situation in depth and considering its components D □ □ □
C Synthesizing and organizing ideas, information, or experiences into new, more complexinterpretations and relationships □ U O D
d. Making judgm ents about the value of information, arguments, or methods, such as examining how others gathered andinterpreted data and assessing _ _ _the soundness of their conclusions L J □ U U
e. Applying theories or concepts topractical problems or in new _ __situations □ □ □ □
Reproduced with permission of the copyright owner. Further reproduction prohibited without permission.

H Mark the box th a t best represents the extent to which your examinations during the current school year challenged you to do your best work.
Very muchVery little ▼□ □1 2 3 4 5 6 7
E l n n rin n th e cu rre n t school ____ More than 20vear. a b o u t h o w m uch I Between 11 and 20read in g a n d w ritin g I Between 5 and 10h av e y o u d o n e ? | Between 1 and 4
| None
a. Number of assigned textbooks, books, or book-length packs of course readings □ □ □ □ □
b. Number of books read on your own (not assigned) for personal enjoyment or academic enrichment □ □ □ □ □
C Number of written papers or reports of 20 pages o r m ore □ □ □ □ □
d. Number of written papers or reports betw een 5 and 19 pages □ □ □ □ □
e. Number of written papers or reports of few er than 5 pages □ □ □ □ □
H In a typical week, how many homework problem sets do you complete?
a. Number of problem sets that take you more thanan hour to complete LJ LJ
b. Number of problem sets that take you less thanan hour to complete LJ l_l
B in your experience a t your institution during the current school year, about how often have you done each of the following?
3-4 5-6More
than 6▼ ▼ ▼
□ □ □
□ □ □
Very Some- often Often tim es
▼ ▼ ▼Never
▼a. Attended an art exhibit
gallery, play, dance, or other theater performance □ □ □ □
b. Exercised or partldpated in physical fitness activities □ □ □ □
c. Participated in activities to enhance your spirituality (worship, meditation, prayer, etc.) □ □ □ □
1 9 Which of the following have you done or do you plan to do before you graduate from your institution? Do not Have
Plan plan not Done to do to do decided
a. Practicum, internship,field experience, co-op experience, or dinical assignment □ □ □ □
b. Community service or volunteer work □ □ □ □
c. Partiapate in a learning community or some other formal program where groups of students take two or more classes together □ □ □ □
d. Work on a research project with a faculty member outside of course or program requirements □ □ □ □
e. Foreign language coursework □ □ □ □
f. Study abroad □ □ □ □g. Independent study or
self-designed major □ □ □ □
h. Culminating seniorexperience (comprehensive exam, capstone course, thesis, project, etc) □ □ □ □
B Mark the box tha t best represents the quality of your relationships w ith people a t your institution.
Relationships with:
a. O therStudents
b. Faculty Members
c. Administrative Personnel and
.OfficesFriendly,
Supportive, Sense of
Belonging
Available,Helpful,
Sympathetic
Helpful,Considerate,
Flexible
▼ ▼ ▼
7 □ 7 D 7 D
6 D 6 0 6 D
SD 5 D 5 D
4 D 4 D 4 D
3 D 3 D 3 D
2 0 2 D . 2 D
1 □ 1 □ I D▲ ▲ ▲
Unfriendly, Unsupportlve,
Sense of Alienation
Unavailable,Unhelpful,
Unsympathetic
Unhelpful,Inconsiderate,
Rigid
Reproduced with permission of the copyright owner. Further reproduction prohibited without permission.

E l About how many hours do you spend in a typical 7-day
| More than 30| 26-30
week doing each of the 21-25following? 16-20
# o f h o u rs 11-15o e r w e e k 1 6-10
1 1-51 0
a. Preparing for dass (studying, reading, writing, doing homework or lab work, analyzing data, rehearsing, and other academic activities) □ □ □ □ □ □ □ □
b. Working for pay on campus □ □ □ □ □ □ □ □
C. Working for pay off campus □ □ □ □ □ □ □ □
d. Participating in co-curricular activities (organizations, campus publications, student government social fraternity or sorority, intercollegiate or intramural sports, etc.) □ □ □ □ □ □ □ □
e. Relaxing and socializing (watching TV, partying, exercising, etc) □ □ □ □ □ □ □ □
f. Providing care for dependents living with you (parents, children, spouse, etc) □ □ □ □ □ □ □ □
g. Commuting to class (driving walking etc) □ □ □ □ □ □ □ □
m To w hat extent does your institution emphasize each of the following?
Very Quite Verymuch a bit Some little
▼ ▼ ▼ ▼a. Spending significant amounts of
time studying and on academic work □ □ □ □
b. Providing the support you need□ □to help you succeed academically □ □
C Encouraging contact amongstudents from differenteconomic social, and racial
□ □ □ □or ethnic backgroundsd. Helping you cope with your
non-academic responsibilities□ □ □ □(work, family, etc)
e. Providing the support you need□
r—1□ □to thrive sodally □
f. Attending campus events andactivities (special speakers, cultural
□ □ □performances, athletic events, etc) Ug. Using computers in academic work □ □ □ □
KD To w hat extent has your experience a t thisinstitution contributed to your knowledge, skills, and personal development in the following areas?
Verymuch
Quite a bit Some
Verylittle
▼ ▼ ▼ ▼a. Acquiring a broad general
education □ □ □ □
b. Acquiring job or work-related knowledge and skills □ □ □ □
c Writing dearly and effectively □ □ □ □
d. Speaking clearly and effectively □ □ □ □e. Thinking critically and analytically □ □ □ □
f. Analyzing quantitative problems □ □ □ □
g. Using computing and information technology □ □ □ □
h. Working effectively with others □ □ □ □
i. Voting in local, state, or national elections □ □ □ □
j. Learning effectively on your own □ □ □ □
k. Understanding yourself □ □ □ □1. Understanding people of other
racial and ethnic backgrounds □ □ □ □
m. Solving complex real-world problems □ □ □ □
n. Developing a personal code of values and ethics □ □ □ □
o. Contributing to the welfare of your community □ □ □ □
p. Developing a deepened sense of spirituality □ □ □ □
I Q Overall, how would you evaluate the quality of academic advising you have received a t your institution?□ Excellent□ Good□ Fair□ Poor
m How would you evaluate your entire educational experience a t this institution?□ Excellent□ Good□ Fair□ Poor
KQ If you could start over again, would you go to the same institution you are now attending?□ Definitely yes□ Probably yes□ Probably no n IVfinltph/ no
Reproduced with permission of the copyright owner. Further reproduction prohibited without permission.

1 9EE3 Write in your year of birth:
I Q Your sexl~1 Male CD Female
KQ Are you an international student or foreign national?CD Yes CD No
KQ Are you of Hispanic, latino, or Spanish origin?□ Yes □ No
K B What is your racial or ethnic identification? (Mark all tha t apply.)
CD American Indian or other Native American
CD Aslan American or Pacific Islander
□ Black or African American
CD WhiteCD Other,
specify:
m What is your current classification in college?□ Freshman/first-year CD Senior
CD Sophomore CD Unclassified
CD Junior
ED Did you begin college a t your current institution or elsewhere?□ Started here □ Started elsewhere
m Since high school, which of the following types of schools have you attended other than the one you are attending now?(Mark all tha t apply.)
CD Vocational or technical school
CD Community or junior college
CD 4-year college other than this one
l~l None
□ Other, specify:
m Thinking about this current academic term, how would you characterize your enrollment?□ Full-time CD Less than full-time
m Are you a member of a social fraternity or sorority?CD Yes CD No
m Are you a student-athlete on a team sponsored by your institution's athletics department?□ Yes CD No (go to question 26)
IOn w hat team(s) are you an athlete (e.g., football, swimming)? Please answer below:
m What have most of your grades been up to now at this institution?□ a CDb CDc□ a - CDb- □ C- or lower□ B+ □ C+
m Which of the following best describes where you are living now while attending college?CD Dormitory or other campus housing (not fraternity/
sorority house)CD Residence (house, apartm ent etc.) within walking
distance of the institution CD Residence (house, apartm ent etc.) within driving
distance CD Fraternity or sorority house
m What is the highest level of education that your parent(s) completed? (Mark one box per column.)Father Mother ▼ ▼□ □ Did not finish high school
□ □ Graduated from high schoolCD CD Attended college but did not complete
degreel~l CD Completed an associate's degree (A.A.,
AS., etc.)CD CD Completed a bachelor's degree (BA,
B.5., etc)CD CD Completed a master's degree (M A ,
M.S., etc)□ □ Completed a doctoral degree (Ph.D.,
J.D., M.D„ etc.)
ED Please print your primary major or your expected primary major.
ID If applicable, please print your second major or your expected second major (not minor, concentration, etc.).
THANKS FOR SHARING YOUR VIEWS!After completing 77te Report, please put it in the enclosed postage-paid envelope and deposit It in any U.S. Postal Service mailbox. Questions or comments? Contact the National Survey of Student Engagement, Indiana University, 1900 East Tenth Street Eigenmann Hall Suite 419, Bloomington IN 47406-7512 or nsseOindiana.edu or www.iub.edu/msse. Copyright 0 2003 Indiana University.N n « n c s a a m i m k u h N o M i n U j j c
410253
Reproduced with permission of the copyright owner. Further reproduction prohibited without permission.
Reproduced
with perm
ission of the
copyright owner.
Further reproduction prohibited
without perm
ission
National Survey of Student Engagement
National Survey of Student Engagement The College Student Report
2004 Codebook
Please note the following for the NSSE dataset and codebook:• Invalid and nonresponses are coded as missing in the dataset• Slight differences exist among the versions o f The College Student Report from year to year.
For information regarding modifications, please refer to the NSSE website: (http://www.indiana.edu/--nsse/html/codebook.htnil).• An asterisk (*) denotes a new item fust used in the 2004 version of The College Student Report.• A superscript "a” (*) denotes an item in die 2004 version o f The College Student Report with slightly different wording from the 2003 version.
|
APPENDIX I

Reproduced
with perm
ission of the
copyright owner.
Further reproduction prohibited
without perm
ission.
National Survey of Student Engagement2004 Codebook
Question 1. In four experience at your Initltntiaii during the current school your, about bow often ta w you done each of Die fallowing?
Is. CLQUEST Asked questions in class or contributed to class discussions 1-Never2-Sometimes 3=Often 4=Very often
lb. CLPRESEN Made a class presentation 1-Never2-Sometimes 3=Often4—Vety often
lc. REWROPAP Prepared two or more drafts of a paper or assignment before turning it in 1-Never2-Sometimes3-Often4-Very often
Id. INTEGRAT Worked on a paper or project that required integrating ideas or information from various sources
1-Never2—Sometimes3-Often4—Very often
le. DIVCLASS Included diverse perspectives (different races, religions, genders, political beliefs, etc.) in class discussions or writing assignments
1-Never2-Sometimes3-Often4-Very often
If. CLUNPREP Come to class without completing readings or assignments 1-Never2-Sometimes3-Often4-Vety often
!*• CLASSGRP Worked with other students on projects during dass 1-Never2-Sometimes3-Often4-Very often
Ih. OCCGRP Worked with classmates outside of dass to prepare dass assignments 1-Never2-Sometimes3-Often4-Very often

Reproduced
with perm
ission of the
copyright owner.
Further reproduction prohibited
without perm
ission.
AI National Survey of Student Engagement2004 Codebook
11 INTTDEAS Put together ideas or concepts from different courses when completing assignments or during dass discussions
1-Never2-Sometimes3-Often 4=Very often
Jj TUTOR Tutored or taught otber students (paid or voluntary) l=Never2-Sometinves3-Often4=Very often
lk. COMMPROJ Participated in a community-based project (e.g., service learning) as part of a regular course
1-Never2-Sometimes3-Often4-Very often
1L ITACADEM Used an electronic medium (listaerv, chat group. Internet, Instant messaging, etc.) to discuss or complete sn assignment
1-Never2-Sometimes3-Often4-Very often
In. EMAIL Used e-mail to communicate with an instructor 1-Never2-Sometimes3-Often 4=Very often
In. FACGRADE Discussed grades or assignments with an instructor 1-Never2-Sometimes3-Often4-Very often
to. FACPLANS Talked about career plans with a faculty member or advisor 1-Never2-Sometimes3-Often4-Very often
Ip. FACIDEAS Discussed ideas from your readings or classes with faculty members outside of 1-Neverclass 2-Sometimes
3-Often4-Very often
iq- FACFEED Received prompt feedback from faculty on your academic performance (written or oral)
1-Never2-Sometimes3-Often4-Very often
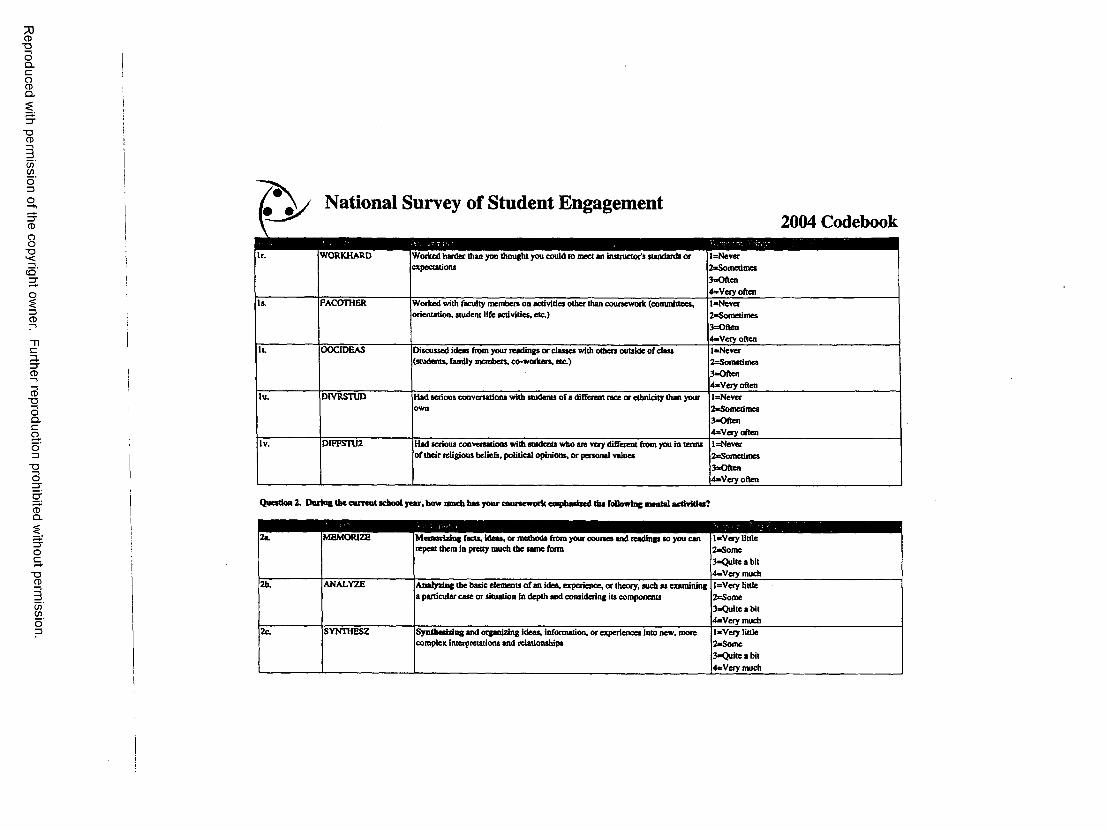
Reproduced
with perm
ission of the
copyright owner.
Further reproduction prohibited
without perm
ission
National Survey of Student Engagement2004 Codebook
lr. WORKHARD Worked harder than you thought you could to meet an instructor’s standards or expectations
1-Never2-Sometimes3-Often4=Very often
Is. FACOTHER Worked with faculty members on activities ocher than coursework (committees, orientation* student life activities, etc)
1-Ncver2-Sometimes 3=Often 4-Very often
I t OOC1DEAS Discussed ideas from your readings or classes with others outside of class (students, family members, co-workers, etc.)
1-Never2-Sometimes3-Often4-Very often
llL DIVRSTUD Had serious conversations with students of a different race or ethnicity than your own
1-Never2-Somedmes3-Often4-Very often
lv. DIFFSTU2 Had serious conversations with students who are very different from you in terms of their religious beliefs, political opinions, or personal values
1-Never2-Sometimes3-Often4-Very often
Question 2. During the current school year, bow much has your coursework emphasized the foUowtng nmtul actiritiei?
2a. MEMORIZE Memorizing facts, ideas, or methods from your courses and readings so you can repeat them in pretty much the same form
1-Very little2-Some3-Quite a bit4-Very much
2b. ANALYZE Analyzing the basic elements of an idea, experience, or theory, such as examining l=Very littlea particular case or situation in depth and considering its components 2-Some
3-Quite a bit4-Very much
2c. SYNTHESZ Synthesizing and organizing ideas, information, or experiences into new, more 1-Very littlecomplex interpretations and relationships 2-Some
3*Quite a bit4-Very much

Reproduced
with perm
ission of the
copyright ow
ner. Further reproduction
prohibited w
ithout permission.
National Survey of Student Engagement2004 Codebook
2d. EVALUATE Making judgments about tbe value of Information, arguments, or methods, such as examining how others gathered and interpreted data and assessing the soundness of their conclusions
lsVery little 2=Some 3=sQuite a bit 4=Very much
2e. APPLYING Applying theories or concepts to practical problems or in new situations lsVery little2=Somc3sQuite a bit4=Very much
3. EXAMS Mark the box that best represents the extent to which yoor examinations !«Very littleduring the current school year challenged yon to do yoor best work. 2*=
4=5-6-7*Very much
Question 4. During the current school year, about bow much reading and writing have you done?
4a. READASGN Number of assigned textbooks, books, or book-lcngth packs of course readings l=None2=Between 1 and 4 3-Bet ween 5 and 10 4sBetween 11 and 20 5*More than 20
4b. READOWN Number of books read on your own (not assigned) for personal enjoyment or academic enrichment
l^None2=Between 1 and 4 3=Between 5 and 10 4«Between 11 and 20 5=More than 20
4c. WRITEMOR Number of written papers or reports of 20 pages or more l=None2=Between I and 4 3-Between 5 and 10 4=Between 11 and 20 5*More than 20
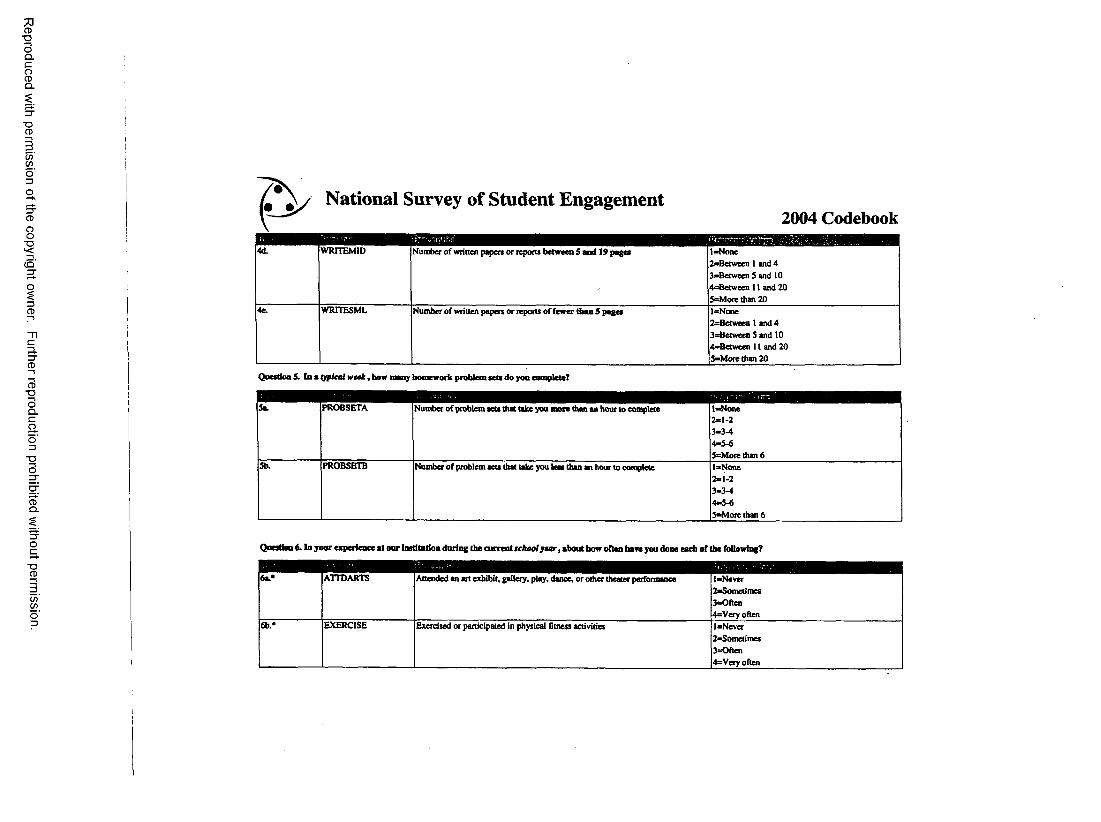
Reproduced
with perm
ission of the
copyright owner.
Further reproduction prohibited
without perm
ission.
National Survey of Student Engagement2004 Codebook
4d. WRITEMID Number of written papers or reports between 5 and 19 pages l=None2~Between 1 and 4 3=Between 5 and 10 4=Between 11 and 20 5=More than 20
4c. WRITESML Number of written papers or reports of fewer than 5 pages l=None2=Between 1 and 4 3=Bctwcen 5 and 10 4=Between 11 and 20 5=More than 20
Questions. Ina typical wtek, bow many homework problem sets do you complete?
5a. PROBSETA Number of problem sets that take you more than an hour to complete l=None2=1-23=3-44=5-65=More than 6
5b. PROBSETB Number of problem sets that take you less than an hour to complete l=None2=1-23=3-44=5-65=More than 6
Question 6. In yoor experience at our institution daring the current school year, about bow often have you done each of the following?
6a.* ATTDARTS Attended an art exhibit, gallery, play, dance, or other theater performance l=Never 2=Sornetimes 3=Often 4=Very often
6b.* EXERCISE Exercised or participated in physical fitness activities 1 *Never2=Sometimes3=Often4=Very often

Reproduced
with perm
ission of the
copyright owner.
Further reproduction prohibited
without perm
ission.
National Survey of Student Engagement2004 Codebook
6c* WORSHIP Participated in activities to enhance your spirituality (worship, meditation, prayer. l=Neveretc.) 2=Somedmes
3*Often4=Very often
Question 7. Which of the following have yon done or do yon plan to do before you graduate from your institution?
7a.* INTERN Practicum, internship, field experience, co-op experience, or dinical assignment 1-Have not decided 2=Donotplan todo 3=P!an to do 4»Done
7b.* VOLUNTER Community service or volunteer work l*Have not decided 2*Do not plan to do 3** PI an to do 4* Done
7c.* LEARNCOM Participate in a learning community or some other formal program where groups of students take two or more classes together
IsHave not decided 2=Do not plan to do 3sPlantodo 4=Done
7<L* RESEARCH Work on a research project with a faculty member outside of course or program requirements
IsHave not decided 2-Do not plan to do 3=P1antodo 4=Done
7c.* FORLANG Foreign language coursework IsHave not decided 2»Do not plan to do 3sPIan to do 4s Done
7f.* STUDYABR Study abroad IsHave not decided2-Do not plan to do3-Plan to do4-Done
V INDSTUDY Independent study or self-designed major . 1-Have not decided2-Do not plan to do3-Plan to do 4= Done

Reproduced
with perm
ission of the
copyright owner.
Further reproduction prohibited
without perm
ission.
(-National Survey of Student Engagement
2004 Codebook
7b.’ SENIORX Culminating senior experience (comprehensive exam, capstone course, thesis. l=Have not decidedproject, etc.) 2=Do not plan to do
3—PIanto do4=Done
Question 8. Mark the box that best represents tbe quality of your relationships with people st your institution.
8a. ENVSTU Relationships with: Other Students l=Unfnendly, Unsupportive Sense of Alienation 2=3«4s5-6=7=Friendly, Supportive Sense of Belonging
8b. ENVFAC Relatiooshlps with: Faculty Members l=Una variable, Unhelpful, Unsympathetic 2- 3-4s5=6=7*A variable Helpful, Sympathetic
8c ENVADM Relationships with: Administrative Personnel and Offices l=Unhelpful, Inconsiderate Rigid2s3=4s3s6s7«Helpful, Considerate, Flexible

Reproduced
with perm
ission of the
copyright owner.
Further reproduction prohibited
without perm
ission.
National Survey of Student Engagement2004 Codebook
Question 9. About how many boon do yon spend in ■ typical 7-day week doing each at the following? (# of hours per week)
9a. ACADPR01 Preparing for class (studying. reading, writing, doing homework or lab work, analyzing data, rehearsing, and other academic activities)
1=0 hours 2—1-5 hours 3=6-10 hours 4=11-15 hours 5=16-20 hours 6=21-25 hours 7=26-30 hours 8=Mote than 30 hours
9b. WORKONOl Working for pay on campus 1=0 hours 2=1-5 hours 3=6-10 hours 4=11-15 hours 5=16-20 hours 6=21-25 hours 7=26-30 hours 8=Mote than 30 hours
9c. WORKOPOl Working for pay off campus 1=0 hours 2=1-5 hours 3=6-10 hours 4=11-15 hours 5=16-20 hours 6=21-25 hours 7=26-30 hours 8=More than 30 hours
9d COCURROl Participating in co-curricular activities (organizations, campus publications, student government, social fraternity or sorority, intercollegiate or intramural sports, etc.)
1=0 hours 2=1-5 hours 3=6-10 hours 4=11-15 hours 5=16-20 hours 6=21-25 hours 7=26-30 hours 8=Mote than 30 hours

Reproduced
with perm
ission of the
copyright ow
ner. Further reproduction
prohibited w
ithout permission.
National Survey of Student Engagement2004 Codebook
9e. SOCIALOl Relaxing and socializing (watching TV. partying, exercising, etc.) 1=0 hours 2=1 -5 hours 3=6-10 hours 4=11-15 hours 5=16-20 hours 6=21-25 hours 7=26-30 hours 8=More than 30 hours
9f. CAREDEOI Providing care for dependents living with you (parents, children, spouse, etc.) 1=0 hours 2=1-5 hours 3=6-10 hours 4=11-15 hours 5=16-20 bouts 6=21-25 hours 7=26-30 hours 8=More than 30 hours
»*• COMMUTE Commuting to class (driving, walking, etc.) 1=0 hours 2=1-5 hours 3=6-10 hours 4=11-15 hours 5=16-20 hours 6=21-25 hours 7=26-30 hours 8=More than 30 hours
Queatton 10. To what extent docs your institution emphasize each of the following?
10a. ENVSCHOL Spending significant amounts of time studying and on academic work t=Very little 2=Some 3=Quite a bit 4=Very much
10b. ENVSUPRT Providing the support you need to help you succeed academically l=Vety little2=Some3=Quiteabit4=Very much
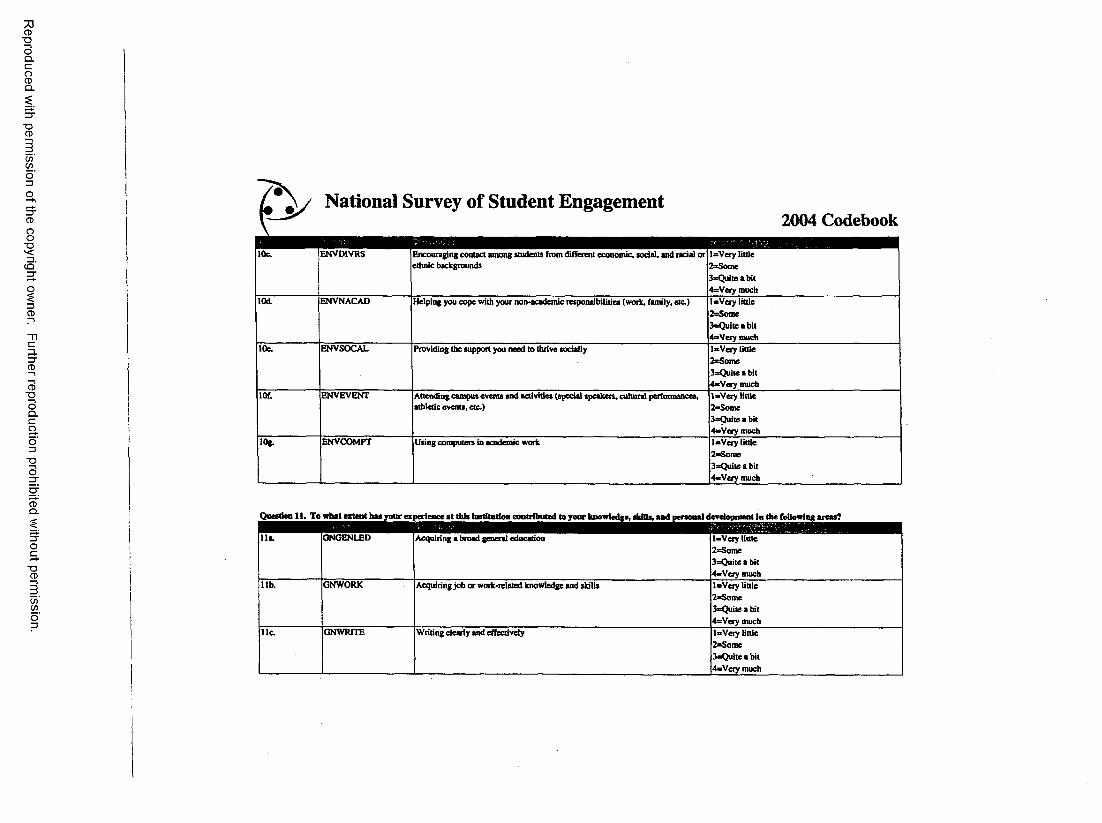
Reproduced
with perm
ission of the
copyright owner.
Further reproduction prohibited
without perm
ission.
National Survey of Student Engagement2004 Codebook
10c. ENVDIVRS Encouraging contact among students from different economic, social, and racial or ethnic backgrounds
l=Very little 2*Some 3«Quiteabit 4sVery much
10d. ENVNACAD Helping you cope with your non-academic responsibilities (work, family, etc.) I*Very little 2=Some 3=Quite a bit 4aVery much
10c. ENVSOCAL Providing the support you need to thrive socially l*Very little 2sSome 3=Quite a bit 4«Very much
101 ENVEVENT Attending campus events and activities (special speakers, cultural performances, athletic events, etc.)
l*Very little 2*=Some 3aQuiu a bit 4s=Very much
10g. ENVCOMPT Using computers in academic work UVery little 2>Some BaQuite a bit 4sVery much
Question 11« To what extort has your experience at this Institution contributed to your knowledge, AflU, and personal dwtopnert in the following areas?
Ua. ONGENLED Acquiring a broad general education 1-Vcry tittle 2*Some 3=Quite a bit 4»Very much
lib. GNWORK Acquiring job or work-related knowledge and skills l«Veiy little 2=Soroc 3*Quite a bit 4=Very much
l ie GNWRITE Writing clearly and effectively 1«Very little 2sSome 3=Quite a bit 4* Very much

Reproduced
with perm
ission of the
copyright owner.
Further reproduction prohibited
without perm
ission.
National Survey of Student Engagement2004 Codebook
lid. GNSPEAK Speaking clearly and effectively 1-Very little2-Some3-Quite a bit 4a Very much
lie. GNANALY Thinking critically and analytically 1-Very little2-Some3-Quite a bit4-Very much
l i t GNQUANT Analyzing quantitative problems 1-Very little2-Some3-Quite a bit4-Very much
llg. GNCMPTS Using computing and information technology 1-Very liule2-Some 3^2nite a bit 4-Very much
llh. GNOTHERS Working effectively with others 1-Very little2-Some3-Quite a bit4-Very much
Hi. GNCIT1ZN Voting in local, stale, or national elections 1-Very little2-Some3-Quite a bit4-Very much
llj. GNINQ Learning effectively on yoor own 1-Very little2-Some3-Quite a bit4-Very much
Ilk. GNSELF Understanding yourself 1-Very little2-Some3-Quite a bit 4=V ery much
111. GNDIVERS Understanding people of other racial and ethnic backgrounds l«Very little2-Some3-Quite a bit4-Very much

Reproduced
with perm
ission of the
copyright owner.
Further reproduction prohibited
without perm
ission.
National Survey of Student Engagement2004 Codebook
Urn. GNPROBSV Solving complex real-worid problems laVery little 2=Somc 3-Quite a bit 4=Very much
lid. GNETHICS Developing a personal code of values and ethics t=Very little 2-Some 3=Quite a bit 4=Very much
Ho. GNCOMMUN Contributing to the welfare of yoor community l=Very little 2=Some3-Quite a bit4—Very much
lip* GNSPIRIT Developing a deepened sense of spirituality 1* Very little 2=Some 3-Quite a bit 4a Very much
12. ADVISE Overall, how would you evaluate the quality of academic advising you have received at your institution?
1-Poor2=Fair3=Good4-Excellent
13. ENTIREXP How would you evaluate your entire educational experience at this institution? 1-Poor2=Fair3-Good4-Excellent
14. SAMECOLL If you could start over again, would you go to the same irutuulion you are now attending?
1-Definilely no2-Probably no3-Probably yes4-Definitely yes
| BIRTH YR |Write in your year of blith i
16. SEX Your sex 1-Male2=Female
17. INTERNAT Are you an international student or foreign national? l=No2=Yes

Reproduced
with perm
ission of the
copyright owner.
Further reproduction prohibited
without perm
ission.
National Survey of Student Engagement2004 C o d e b o o k
Question It. Are yon of Hispanic, Latino, or Spanish origin?Question 19. What Is your racial or ethnic Identification? (Mark aO that apply.)
NOTFS- 1 responses to questions 18 and 19 were recoded into the new variable RACE using the categories below. All original responses may be found on die data file CD (RELATINO, REAMIND, REASIAN, REAFRAM, REWHITE, REOTHR1, REOTHR2).2. In the creation of the variable RACE, students who wrote in responses for “Other** iacesfathnicities (REOTHR2) were coded to existing categories (African American/Black, American Indian/Alaska Native, Asian/Pacific Islander, Caucasian/White, Hispanic) using die U.S. r>tnm« Bureau's 2000 American Community Survey codes as a guide. In where students' responses did not fit with the guide, were either coded as other (e.g., “American”), multi-racial (e.g ̂“bi-racial"), oras missing (e.g., “This question doesn't matter**)- In addition, students* who checked more than one race/ethnicity were coded as multi-racial. For further details, please contact NSSE at (812) 856-5824.
RACE NSSE recoded race/ethnicity variable
Is*African American / Black2sAmerican Indian / Native American3**Asian/Pacific Islander4-CaucasiaD/White5=Hispanic/Latino/Spanish Origin6=Other7-Muhi-iacial
20. CLASS What is your current classification in college?
1 sFreshman/first-y ear2-Sophomore3-Junior 4 “Senior 5-Unclassified
21. ENTER Did you begin college at your current institution or elsewhere? 1 “Started here2=Started elsewhere
Question 22. Since high school, which of the following types of schools have you attended other than the one yon are attending now?This question asks students to select all options that apply. To permit multiple responses, the question Is represented in this codebook by Jive separate items that the student either checks or does not check
VOCTECH Vocational or t-ebme«l school 1 KnockedCOMMCOLL Community or junior college 1-Checked
22. FOURYEAR 4-year college other than this one 1-CheckedNONE None 1-CheckedOTHRCOLI Other 1-CheckedOTHRCOL2 Specify: (Write in)
23. ENRLMENT Thinking about this current academic term, bow would you characterize your enrollment?
1 =Less than full-time 2-Full-time

Reproduced
with perm
ission of the
copyright owner.
Further reproduction prohibited
without perm
ission.
A National Survey of Student Engagement2 0 0 4 C o d e b o o k
24. FRATSORO Arc you a member of a social fraternity or sorority? 1-No2=Yes
25a. ATHLETE A n you a student-athlete on a team sponsored by your hutitutian’s athletics department?
1-No2-Yes
23b.* ATHTEAM On what team(i) are you an athlete (e-g., football, swimming)? (Write-in)
25c.* TEAM CODE Created by recoding (ATHTEAM)
1-Baseball2-BeskctbaU3-Bowhng4-Cross Country5-Fencing6-Field Hockey7-Football8-Golf9-Gymnsstici10-Ics Hockey11-Tcsck A Field12-Lacrosse
13-Ride14-Rowing15-Skiing16-Soccer17-Softball18-Swinuaieg A Diving19-Tcnnii20-VotteybaU21-WwsrPolo22-Wrestling23-Other
1-C-, or lower2-C3-C+
26. GRADES04 What have most of your grades been up to now at this institution? 4—B-5-B6—B+7—A-8—A
27. UVENOW Which of die following best describes when you a n living now while sttondmg college?
1-Dormitory or other campus bousing (not fiatemity/sorority house)2-Residence (house, apartment, etc.) within walking distance of the institution2-Residcace (house, apartment, etc.) within walking distance of the institution 4-Fratemity or sorority house
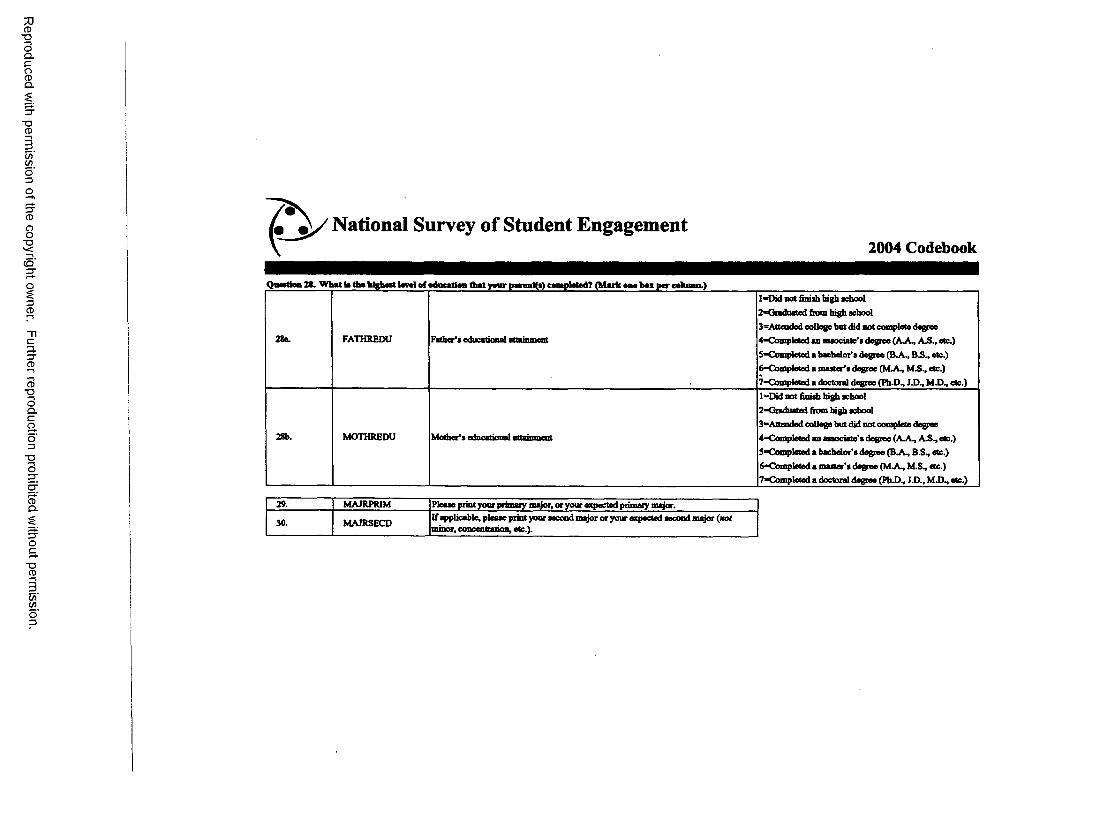
Reproduced
with perm
ission of the
copyright owner.
Further reproduction prohibited
without perm
ission.
National Survey of Student Engagement2004 Codebook
Q nw tioa 28. W hat fai the highest k v ri of cducitioa th at your parent(») com peted? (M ark w b a r per cehimn.)
28a. FATHREDU Father’s educational attainment
l _Did not finish high school 2*<3radusted from high school 3=A!tendod college but did not complete degree 4Klompleted an associate’s degree (A-A-, AJS., etc.)5̂ Completed a bachelor’s degree (B.A., B.S., etc.) 6K)ompleled a master’s degree (MA, M.S., etc.)7-Completed a doctoral degree (Ph.D., J.D., M.D., etc.)
28b. MOTHREDU Mother's ednenfienal attainment
l=Did not finish high school2K3raduated fiom high school3*=Attended college but did not complete degree4=Completed an associate's degree (A.A., AjS^ etc.)5-Completed a bachelor's degree (B.A^ B.S, etc.)6=Completed a master’s degree (M A, M.S., etc.)7-CompIeted a doctoral degree (Ph-D., I.D., M.D., etc.)
29. MAJRPR1M Please print your primary major, or your expected primary major.
30. MAJRSECD If applicable, please print your second major or your expected second major (nor minor, concentration, etc.).

Reproduced
with perm
ission of the
copyright owner.
Further reproduction prohibited
without perm
ission.
National Survey of Student Engagement20 0 4 C o d e b o o k
The Variables MAJRPCOD and MAJRSCOD were created by NSSE staff; MAJRPRTM and MAJRSECD were recoded into one of the 85 majors below. Whenever possible, we used the CIP 2000 major categorization to guide the recodings. Any questions should be directed to NSSE at 8J2-856-5824. _______________________________
A m M dH nM iU M •byekalSdaaee“Art, fiat tad apptiad 42-Ataoaocay[-EagOtfc (hagutye tad tificntun 43-Abnotptebc adtaee (iadudiag mcttorology1 iDatary M-Ctemiatiy4-feMTa>Baa 4$-Eartb acicacc (inrteflag geology3-Ltaguagt tad litaatm (txeepl BagUtb' 46-MiiteiB»tka6-Muaic 47-Phyaica7-fWo*opfcy 41-Sutteicat-9pwch 49-Otter pbyticaltchace9-TkMttrordrvm Pref—b a il10-Tteolo*y or laligfea SO-Aichhcctuie11-Otter ana Jtbun»ath i St *Uibu ? lu a b tMriaglraHrtaarw 52-H ettt tecteology (medical, deteal. laboratory11-Biobfy (geaanT, 53<*w13“Bleetemtery or biopbyria 54-Lib rary/trcbvti tcictctU-Bottay SS-Medidae
54 -Deteiatry16-Mtdac (Ktyacwocc 57-VaCtriaariaa17 Microbiology artecttriology 54-Nuteag11-Zoology S9-Ptennecy
MAJRPCOD19-Otter bMogital adroe* 60-ABkd teato/otter mediea
MAJRSCOD20“Aeoaoatia|
61-Ttenpy (occmwtioaal, pfepieal, yeccb;62-Otter probaaioaa]
31. Created by recoding Created by recoding second 22-FiatacaSerial * b f « 43-Aatbropoloo
prim ary w rite-in m ajor write-in major 23-towaarioBtl bnaiaaai 64-Eeooeroice(MAJRPRIM) (MAJRSECD) 24-Mattetiag
25-Malaga m et26-Otter b w aca T t e r t i a27-Budaa*a«ducalio« H-BtMartaiytaiddk acbeol whwHoi2 H M e < r< R id H a te 30 ftffakiladufttioaorwciaaiica31-Saceadaiy adMoadea32-Sptdal adueatioa33-Otter aducarioe f a a la ia b a34-Al«P-/Mtou—utiiil aagisaaib*35-<3vil eagbwriai36-Oamicil «agtaaaria|1?-Pltrtriral or ■lartmbr aaglnaariin
65-Ettek ttudtaa (H 3cog i|ity67-PeUtical edenea (including gowataoeat, interatticoal rabrioaaW-Piyctelogy60-Social wotfc70-Sodoloiv71-K3—daratudict72-Otter aodtlackoca O tter73-Ajtdcukui*74-CeaanudcatieaB75-Coruputtredtact 74-Faiafly Stodbe77—Natural raaowcat aadcoaaanratiooTt-KioeaMogy79-Cruniaal jueticc
39-MatedtkugiaMiiaf t l -Parte, recraatiOB, leiauie ecudfee, apoite aaaageaMte40-Mactealea! taguttcuaf C-Pubiic iHitenteCntiocJ1 ~*lt nanl'ntbir m iaiirin t 13-TecteicaVveeaiieaal
*4- Otter Rdd tS-Uedaddad

Reproduced
with perm
ission of the
copyright owner.
Further reproduction prohibited
without perm
ission.
National Survey of Student Engagement2 0 0 4 C o d e b o o k
MAJRPCOL MAJRSCOL 1-Arts and humanities 6-Physical scienceCrated by recoding Created by recoding second 2s Biological science 7-Professional
32, pnmary write-in major write-in major 3=Business 8=Social science(MAJRPRIM) into one (MAJRSECD) into one of 90 therof ten major fields ten major fields 5-Engizieering 10-Undecided
Data PravUcd by Your Imtitntion
GENDER Gender 1-Male2-Fonale
ETHNICIT Ethnicity
1-African American/Black2-American IMian/Alaaka Native3-Asian/Pacific Islander4-Caucasian/Wliite 5=Hispanic 6=Other 7-Muhi-racial g-Foreign9—Unknown
CLASSRAN Class rank
1 -Freshman/First-year student2-Sophomoie3-Junior4-Senior S illie r
STUDID Student IDSATT SAT Total score
SATM SAT Math score
SATV SAT Verbal score
ACTT ACT Total score
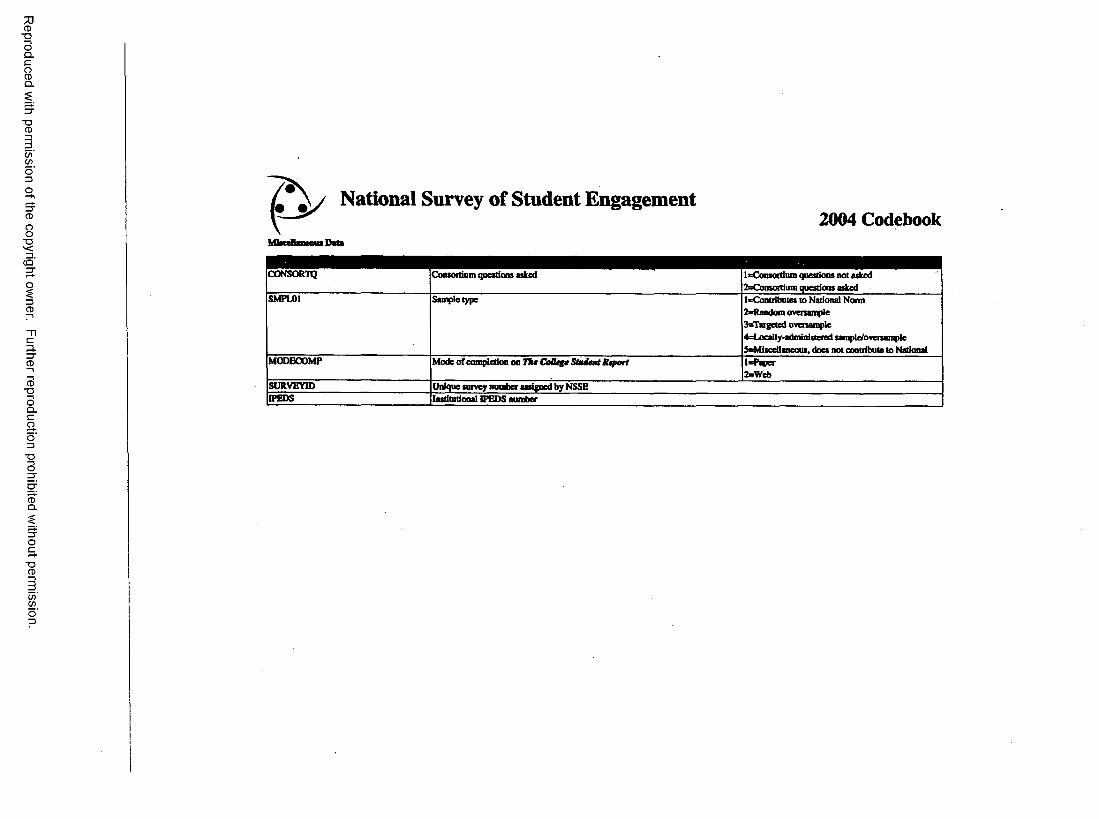
Reproduced
with perm
ission of the
copyright owner.
Further reproduction prohibited
without perm
ission.
A National Survey of Student Engagement2004 Codebook
M ifrilan em uD itt
CONSORTQ Consortium questions asked l*Consortium questions not asked 2=Consortium questions asked
SMPL01 Sample type l=Contributes to National Norm 2aRandom oversample 3aTargetcd oversample 4=Locally-administefed sample/ovetsampie S«Miscellaneous, does not contribute to National
MODECOMP Mode of completion on Ttu ColUft Student Ktport l=Paper2»Web
SURVEYID Unique survey number assigned by NSSEIPEDS Institutional IPEDS number

116
APPENDIX J
Benchmark Questions
The following survey items fall into the benchmark of “Level of Academic Challenge”
lr. Working harder than you thought you could to meet an instructor’s standards or
expectations.
2b. Coursework: Analyzing the basic elements of an idea, experience or theory, and
considering its components.
2c. Coursework: Synthesizing and organizing ideas, information, or experiences.
2d. Coursework: Making judgments about the value of information, arguments, or
methods
2e. Coursework: Applying theories or concepts to practical problems or in new
situations.
4a. Number of assigned textbooks, or book length packs of course readings.
4c. Number of written papers or reports 20 pages of more.
4d. Number of written papers or reports between 5 - 1 9 pages.
4e. Number of written papers or reports less than 5 pages.
9a. Hours per 7-day week spent preparing for class (studying, reading, writing, doing
homework or labwork, analyzing data, rehearsing and other academic activities.
10a. Institutional: Spending significant amounts of time studying and on academic work.
The following survey items fall into the benchmark of “Active and Collaborative
Learning”
la. Asked questions in class or contributed to class discussions,
lb. Made a class presentation.
lg. Worked with other students on projects during class.
lh. Worked with classmates outside of class to prepare class assignments.
lj. Tutored or taught other students (paid or voluntary).
Ik. Participated in a community-based project (e.g. service learning) as part of a regular
course.
Ip. Discussed ideas from your readings or classes with others outside of class.
Reproduced with permission of the copyright owner. Further reproduction prohibited without permission.

117
The following survey items fall into the benchmark of “Student-Facuity Interaction”
in. Discussed grades or assignments with an instructor.
10. Talked about career plans with a faculty member or advisor.
Ip. Discussed ideas from your readings or classes with faculty members outside of class,
lq. Received prompt feedback from faculty on your academic performance (written or
oral).
Is. Worked with faculty members on activities other than coursework (committees,
orientation, student life activities, etc.).
7d. Worked on a research project with a faculty member outside of course of program
requirements.
The following survey items fall into the benchmark of Enriching Educational
Experiences
11. Used an electronic medium (listserv, chat group, Internet, instant messaging, etc) to
discuss or complete assignment
lu. Had serious conversations with students who are very different from you.
lv. Had serious conversations with student of a different race or ethnicity.
7a. Practicum, internship, field experience, co-op experience or clinical assignment.
7b. Community service or volunteer work.
7c. Participate in a learning community
7e. Foreign language coursework
7f. Study abroad
7g. Independent study or self-designed major
7h. Culminating experience
9d. Hours spent in co-curricular activities
10c. Encouraging contact among students from different economic, social, and racial or
ehnic backgrounds.
Reproduced with permission of the copyright owner. Further reproduction prohibited without permission.

118
APPENDIX K
Additional Demographics of School and Samples
Distribution by Class________________________________________________________Athletes Non-Athletes
N percent_________ N______ percent
Freshman 41 40.2 79 53
Sophomore 23 22.5 7 4.7
Junior 26 25.5 3 2
Senior 12 11.8 57 38.3
Unclassified 0 0 3 2
Total 102 100 147 100
Response by SportCompleted
surveyNumber on Team
Percent of Team
Percent of Response
Men’s Basketball 8 14 57 7.8
Women’s Basketball 7 9 78 6.9
Track/Cross Country* 39 56 70 38.2
Men’s Golf 0 8 0 0
Women’s Golf** 5 9 56 4.9
Rifle 0 6 0 0
Men’s Soccer 15 24 63 14.7
Softball 13 14 93 12.4
Men’s Tennis 4 8 50 3.9
Women’s Tennis 0 6 0 0
Volleyball 11 11 100 10.8
Total 102 164 62 99.6* all cross country student are on the track team; ** one go lf student is also on the basketball team
Reproduced with permission of the copyright owner. Further reproduction prohibited without permission.

119
REFERENCES
Adler, P. & Adler, P.A. (1985). From idealism to pragmatic detachment: The academic
performance of college athletes. Sociology o f Education, 58, 241-250.
Anaya, G. (1996). College experiences and student learning: The influence of active
learning, college environments and co-curricular activities. Journal o f College
Student Development. 37 (6), 611-622.
Astin, A.W. (1993) What matters in college: Four critical years revisited. San
Francisco: Jossey- Bass.
Berry, B. & Smith, E. (2000). Race, sport, and crime: The misrepresentation of African
Americans in team sports and crime. Sociology o f Sport Journal, 17, 171-197.
Bowen, W. g!, & Levine, S. A. (2003). Reclaiming the game: College sports and
educational values. Princeton: Princeton University Press.
Burton-Nelson, M. (1994). The stronger women get, the more men love football.
Chickering, A.W. & Gamson, Z.F. (1987). Seven principles for good practice in
undergraduate education. AAHE Bulletin, 39(7), 3-7.
Chickering, A. W., & Reisser, L. (1993). Education and identity (2nd ed.). San Francisco:
Jossey-Bass.
Chronicle of Higher Education Almanac, (1999-2000).
Chu, D. (1989). The character o f American higher education and intercollegiate sport.
Albany, NY: State University of New York Press.
Reproduced with permission of the copyright owner. Further reproduction prohibited without permission.
120
Coakley, J.J. (1998). Sport in society: Issues and controversies. Boston: WCB McGraw
Hill.
Cross, L.H. & Koball, E.G. (1991). Public opinion and the NCAA proposal 42. Journal
of Negro Education. 60(2).
Curry. T.J. (1991). Fraternal bonding in the locker room: A pro-feminist analysis of talk
about competition and women. Sociology o f Sport, 8(2), 119-135.
Eitzen, D.S. (1999). Fair and foul: Beyond the myths and paradoxes o f sport. Lanham,
MD: Rowman & Littlefield Press, Inc.
Feldman, K. A., & Newcomb, T. M. (1969). The impact o f college on students. San
Francisco, CA: Jossey-Bass.
Hood, A.B., Craig, A.F. & Ferguson, B.W. (September 1992). The impact of athletics,
part-time employment and other activities on academic achievement. The Journal
o f College Student Development, 33.
Jacobson, J. (May 11, 2001). College board efforts seek to bolster itself and the SAT.
Chronicle o f Higher Education, A45.
Kuh, G.D., Schuh, J.H., Whitt, E.J., Andreasd, R.E., Lyons, J.W., Strange, C.S.,
Krehbiel, L.E., & Mackay, K.A. (1991). Involving Colleges. San Francisco, CA:
Jossey-Bass.
Lapchick, R.E. (1987). The high school athlete as the future college student athlete.
Journal o f Sport & Social Issues, 11(\&2), 105-118.
Maloney, M.T. & McCromick, R.E. (Summer 1993). An examination of the role that
intercollegiate athletic participation plays in academic achievement. Journal o f
Human Resources, 28(3), 555-570.
Reproduced with permission of the copyright owner. Further reproduction prohibited without permission.
121
Meyer, B.B. (1990). From idealism to actualization: The academic performance of
female collegiate athletes. Sociology of Sport Journal. 7. 44-57.
National Collegiate Athletic Association website (2000). www.ncaa.ors.
National Collegiate Athletic Association website (2003). www.ncaa.ors.
National Collegiate Athletic Association website (2004). www.ncaa.ors.
Pace, C. R. (1982). Achievement and the quality o f student effort. Los Angeles, CA:
Higher Education Research Institute.
Pascarella, E.T. (1985). College environmental influences on learning and cognitive
development: A critical review and synthesis. In J. Smart (Ed.), Higher
education: Handbook o f theory and research (Vol. 1). New York: Agathon.
Pascarella, E.T., Bohr, L., Nora, A., & Terenzini, P.T. (July/August 1995).
Intercollegiate athletic participation and freshman-year cognitive outcomes. The
Journal o f Higher Education, 66(4), 369-387.
Pascarella, E. T. & Smart, J.C. (March 1991). Impact of intercollegiate participation for
African American and Caucasian men: Some further evidence. Journal o f
College Student Development, 32(2) 123-130.
Pascarella, E.T. & Terenzini, P.T. (1991). How college affects students. San Francisco:
Jossey-Bass.
Pascarella, E.T., Truckenmiller, R., Nora, A., Terenzini, P.T., Edicson, M. & Hagedom,
L.S. (January 1999). Cognitive impacts of intercollegiate athletic participation.
The Journal o f Higher Education, 70(1), 1-26.
Petrie, T.A. (November 1993). Racial differences in the prediction of college football
players academic performances. Journal o f College Student Development, 34.
Reproduced with permission of the copyright owner. Further reproduction prohibited without permission.

122
Pugh, R. C., & Chamberlain, P. C. (1976). Undergraduate residence: An assessment of
academic achievement in a predominantly university community. Journal o f
College Student Personnel, 17(2), 138-141.
Richards, S. & Aries, E. (1999). The division III student athlete: Academic performance,
campus involvement and growth. Journal o f College Student Development.
Rudolph, F. (1962). The American college and university: A history. Athens, Georgia:
University of Georgia Press.
Ryan, F.J. (March 1989). Participation in intercollegiate athletics: Affective outcomes.
Journal o f College Student Development, 30.
Sack, A.L. (1987). College sport and the student athlete. Journal o f Sport & Social
Issues, 77(1&2), 31-49.
Sack, A.L. & Staurowsky, E.S. (1998). College athletes fo r hire: The evolution and
legacy o f the NCAA’s amateur myth. Westport, CN: Praeger.
Sage, G.H. (1998). Power and ideology in American sport: A critical perspective (2nd
ed.). Champaigne, IL. Human Kinetics Publishers, Inc.
Sedlacek, W.E. & Adams-Gaston, J. (July/August 1992). Predicting the academic
success of student athletes using SAT and non-cognitive variables. Journal o f
Counseling and Development, 70.
Sellers, R.M. (1992). Racial differences in the predictors for academic achievement of
student athletes in Division I revenue-producing sports. Sociology o f Sport
Journal, 9, 48-59.
Shulman, J.L. & Bowen, W.G. (2001). The game o f life: College sports and educational
values. Princeton, NJ: Princeton University Press.
Reproduced with permission of the copyright owner. Further reproduction prohibited without permission.

123
Siegel, D. (August 1994). Higher education and the plight o f the black male athlete.
Journal o f Sport & Social Issues, 18(3), 207-223.
Snyder, P.L. (July 1996). Comparative levels of expressed motivation among Anglo and
African American university student-athletes. Journal o f Black Studies, 26(6),
651-667.
Stark, J.S. & Lattuca, L.R. (1997). Shaping the college curriculum: Academic plans in
action. Needham Heights, MA: Allyn 8c Bacon.
Stuart, D.L. (March 1985). Academic preparation and subsequent performance of
intercollegiate football players. Journal o f College Student Personnel, 26, 124-
129.
Suggs, W. (1999, April 23). IRS challenges deductions for suites at college stadiums.
Chronicle o f Higher Education.
Suggs, W. (1999, August 6). Can $3-billion persuade colleges to create a playoff for
football? Chronicle o f Higher Education.
Suggs, W. (1999, November 12). Faculty study at Amhearst question academic
qualifications of some athletes. Chronicle o f Higher Education, A58-A58.
Suggs, W. (1999, July 23). Minnesota coaches did not interfere with probes of athletes’
conduct, report says. Chronicle of Higher Education, A53.
Thelin, J.R. (1994). Games colleges play: Scandal and reform in intercollegiate
athletics. Baltimore, MD: Johns Hopkins University Press.
Toma, J. D. (2003). Football U.: Spectator sports in the life o f the American university.
Ann Arbor, Michigan: University of Michigan Press.
Reproduced with permission of the copyright owner. Further reproduction prohibited without permission.

Toma, J. D. and Cross, M. (January, 2000). Contesting values in American higher
education: The playing field of intercollegiate athletics. In J. Smart, ed., Higher
Education: Handbook o f Theory and Research, 1 5 ,406-55. New York: Agathon
Press.
Veysey, L.R. (1965). The emergence o f the American university. Chicago: University of
Chicago Press.
Whitt, E. J., Nora, A., Edison, M., Terenzini, P. T., & Pascarella. E. T.(1999) Interactions
with peers and objective and self-reported cognitive outcomes across 3 years of
college. Journal o f College Student Development, 40 (1), 61-78.
Young, B.D. & Sowa, C.J. (July 1992). Predictors of academic success for black student
athletes. Journal o f College Student Development, 33.
Reproduced with permission of the copyright owner. Further reproduction prohibited without permission.
125
Birthdate:
Birthplace:
Education:
VITA
Susan Beth Hathaway
November 24, 1968
St. Charles, Missouri
1998-2005 College of William and MaryWilliamsburg, Virginia Doctor of Philosophy
1993-1997 University of Missouri-Kansas CityKansas City, Missouri Master of Arts in Education
1987-1990 University o f Missouri-Kansas CityKansas City, Missouri Bachelor of Arts
Reproduced with permission of the copyright owner. Further reproduction prohibited without permission.