


†
∗ • ∗∗ • ∗∗∗
Stress Measurement of Coarse Grains Using Double Exposure Method
by
Kenji SUZUKI∗, Takahisa SHOBU∗∗ and Ayumi SHIRO∗∗∗
The double exposure method (DEM) is proposed herein as a new X-ray stress measurement method for coarsegrain materials. A diffraction angle can be obtained from an incident and a spotty diffracted beam. Each X-ray beamis measured by an area detector on a linear motion stage on the 2 θ-arm in the DEM. To examine the validity of theDEM, the residual stress of the plastically bent specimen was measured. In addition, the residual stress distribution ofthe indentation specimen was measured. The result by the DEM was similar to the result simulated by the finite elementmethod. As a result, the DEM is useful for the X-ray stress measurement method for coarse grain material.
Key words:X-Ray stress measurement, Coarse grain, Double exposure method, Hard syn-chrotron X-ray, Residual stress
1
1)
2)
2
2 X
cosα 3) 2D 4) 5)
2
(DSTM)6) 2
DSTM
1)7) 2)
1)
2)
2
22 ·1
Fig. 1
O1,
O2 ℓ1 P1, P2 ℓ2
ℓ1, ℓ2 2 θ PC
O1, O2
2 P1 P2
Fig. 1 The principle of DEM (double exposure method).
† 30 8 24 Received Aug. 24, 2018. c⃝2019 The Society of Materials Science, Japan∗ 950-2181∗ Faculty of Education, Niigata University, Nishi-ku, Niigata, 950-2181.∗∗ 679-5148∗∗ Material Sciences Research Center, Japan Atomic Energy Agency, Sayo-gun, Hyogo, 679-5148.∗∗∗ 679-5148∗∗∗ Synchrotron Radiation Research Center, National Institutes for Quantum and Radiological Science and Technology, Sayo-gun, Hyogo, 679-5148.
2θ PC
Fig. 1
2 θ
2 2
O1 O2
2 θ P1, P2
4
2 θ
PC (DEM:
double exposure method)
2 ·2y
3 Fig. 2
P 1, P 2
P 1 = (x1, y1, z1), P 2 = (x2, y2, z2) . (1)
P1, P2 r1, r2 Fig. 2
r1 =√
x21 + z21 , r2 =
√x22 + z22 . (2)
2 θ
2θ = arctan
(r2 − r1y2 − y1
)(3)
ℓy O y
ℓy t
ℓy = (0, t, 0) (4)
ℓ P 1, P 2
ℓ = P 1 + t (P 2 − P 1) (5)
Fig. 3 ℓy ℓ
e =(x2 − x1, y2 − y1, z2 − z1)
∥LD∥ , eX = (0, 1, 0) (6)
PC
OX
0
Fig. 2 Geometry for DEM with hard synchrotron X-ray.
Fig. 3 Intersection of X-ray beam ℓx and diffracted beam ℓ.
e · −−−−→OXPC = e · (PC −OX) = 0 (7)
eX · −−−−→OXPC = eX · (PC −OX) = 0 (8)
Fig. 3 PC , OX
PC = P 1 − ℓ1 e , OX = ℓ0 eX (9)
(7), (8) ℓ0, ℓ1PC, OX
ℓ0 =eX · P 1 −
(e · P 1
)(e · eX)
1− (e · eX)2(10)
ℓ1 =e · P 1 −
(eX · P 1
)(e · eX)
1− (e · eX)2(11)
ℓ1 =cos 2θ
L sin2 2θ
[(x2 − x1)x1 + (z2 − z1) z1
](12)
ℓ0 = y1 −cot2 2θ
L
[(x2 − x1)x1 + (z2 − z1) z1
](13)
PC = (xC , yC , zC) (9), (12)
xC = x1 −cot2 2θ
L2
[(x2 − x1)x1
+(z2 − z1) z1](x2 − x1) (14)
yC = y1 −cot2 2θ
L
[(x2 − x1)x1
+(z2 − z1) z1]
(15)
zC = z1 −cot2 2θ
L2
[(x2 − x1)x1
+(z2 − z1) z1](z2 − z1) (16)
3DXRD8),9)
2
DEM
DEM
2 ·3DEM
SPring-8
BL22XU
2 θ 800 mm
「材料」 (Journal of the Society of Materials Science, Japan), Vol. 68, No. 4, pp. 312-317, Apr. 2019
論 文
01-2018-0107-(p.312-317).indd 312 2019/03/27 10:56:50

†
∗ • ∗∗ • ∗∗∗
Stress Measurement of Coarse Grains Using Double Exposure Method
by
Kenji SUZUKI∗, Takahisa SHOBU∗∗ and Ayumi SHIRO∗∗∗
The double exposure method (DEM) is proposed herein as a new X-ray stress measurement method for coarsegrain materials. A diffraction angle can be obtained from an incident and a spotty diffracted beam. Each X-ray beamis measured by an area detector on a linear motion stage on the 2 θ-arm in the DEM. To examine the validity of theDEM, the residual stress of the plastically bent specimen was measured. In addition, the residual stress distribution ofthe indentation specimen was measured. The result by the DEM was similar to the result simulated by the finite elementmethod. As a result, the DEM is useful for the X-ray stress measurement method for coarse grain material.
Key words:X-Ray stress measurement, Coarse grain, Double exposure method, Hard syn-chrotron X-ray, Residual stress
1
1)
2)
2
2 X
cosα 3) 2D 4) 5)
2
(DSTM)6) 2
DSTM
1)7) 2)
1)
2)
2
22 ·1
Fig. 1
O1,
O2 ℓ1 P1, P2 ℓ2
ℓ1, ℓ2 2 θ PC
O1, O2
2 P1 P2
Fig. 1 The principle of DEM (double exposure method).
† 30 8 24 Received Aug. 24, 2018. c⃝2019 The Society of Materials Science, Japan∗ 950-2181∗ Faculty of Education, Niigata University, Nishi-ku, Niigata, 950-2181.∗∗ 679-5148∗∗ Material Sciences Research Center, Japan Atomic Energy Agency, Sayo-gun, Hyogo, 679-5148.∗∗∗ 679-5148∗∗∗ Synchrotron Radiation Research Center, National Institutes for Quantum and Radiological Science and Technology, Sayo-gun, Hyogo, 679-5148.
2θ PC
Fig. 1
2 θ
2 2
O1 O2
2 θ P1, P2
4
2 θ
PC (DEM:
double exposure method)
2 ·2y
3 Fig. 2
P 1, P 2
P 1 = (x1, y1, z1), P 2 = (x2, y2, z2) . (1)
P1, P2 r1, r2 Fig. 2
r1 =√
x21 + z21 , r2 =
√x22 + z22 . (2)
2 θ
2θ = arctan
(r2 − r1y2 − y1
)(3)
ℓy O y
ℓy t
ℓy = (0, t, 0) (4)
ℓ P 1, P 2
ℓ = P 1 + t (P 2 − P 1) (5)
Fig. 3 ℓy ℓ
e =(x2 − x1, y2 − y1, z2 − z1)
∥LD∥ , eX = (0, 1, 0) (6)
PC
OX
0
Fig. 2 Geometry for DEM with hard synchrotron X-ray.
Fig. 3 Intersection of X-ray beam ℓx and diffracted beam ℓ.
e · −−−−→OXPC = e · (PC −OX) = 0 (7)
eX · −−−−→OXPC = eX · (PC −OX) = 0 (8)
Fig. 3 PC , OX
PC = P 1 − ℓ1 e , OX = ℓ0 eX (9)
(7), (8) ℓ0, ℓ1PC, OX
ℓ0 =eX · P 1 −
(e · P 1
)(e · eX)
1− (e · eX)2(10)
ℓ1 =e · P 1 −
(eX · P 1
)(e · eX)
1− (e · eX)2(11)
ℓ1 =cos 2θ
L sin2 2θ
[(x2 − x1)x1 + (z2 − z1) z1
](12)
ℓ0 = y1 −cot2 2θ
L
[(x2 − x1)x1 + (z2 − z1) z1
](13)
PC = (xC , yC , zC) (9), (12)
xC = x1 −cot2 2θ
L2
[(x2 − x1)x1
+(z2 − z1) z1](x2 − x1) (14)
yC = y1 −cot2 2θ
L
[(x2 − x1)x1
+(z2 − z1) z1]
(15)
zC = z1 −cot2 2θ
L2
[(x2 − x1)x1
+(z2 − z1) z1](z2 − z1) (16)
3DXRD8),9)
2
DEM
DEM
2 ·3DEM
SPring-8
BL22XU
2 θ 800 mm
P1,P2
313二重露光法による粗大粒材の応力測定
01-2018-0107-(p.312-317).indd 313 2019/03/27 10:56:50

Fig. 4 Experiment for DEM.
2 PILATUS-300K
(Fig. 4) 2 θ
0◦ O1 = (0, y1, 0),
O2 = (0, y2, 0) Aℓ 331
2 θ 26◦
LD (= 791.889 mm) P1 P2
L0 = 707.989
mm L = 711.746 mm
30.034 keV (0.4127988A)
0.2×0.2mm2 PILATUS-300K
83.8 × 106.5 mm2 487 × 619
pixel 172 µm/pixel
4.75 mm 3 mm
(A5052)
623 K 1
27 µm Aℓ
331
331
2 θ0 = 25.62767◦ (= 93.06326 pm)
cij10) c11 =
106.78 GPa, c12 = 60.74 GPa, c44 = 28.21 GPa
Kroner 331
E = 71.39 GPa,
ν = 0.344
EM = 70.07 GPa νM = 0.347
33 ·1 DEM
Fig 5 DEM P1, P2
(a) P1
(b) P2
PLIATUS-300K 3
Fig 5
DEM P1 P2
(x1, z1) (x2, z2)
(a) P1 (b) P2
Fig. 5 Diffraction images measured by DEM. The box inthe figure (a) indicates the detected area at P2.
(a) P1 (b) P2
Fig. 6 Diffraction spot centers determined by the Demsys,which is matching program. Each diffraction centeris indicated with the cross mark.
Fig. 5
P1 P2
P1 P2
2 θ
PC(xC , yC , zC)
(Demsys) Fig. 6 P1
P2
2 θ
PC(xC , yC , zC)
Demsys
3 ·2DEM
Fig. 7
4.7 mm
3 mm
Fig. 7 Plastically bent specimen.
25.60
25.61
25.62
25.63
25.64
25.65
25.66
25.67
0 1 2 3 4 5
=0
=90
Diffr
action a
ngle
2, deg
Distance from tesile side x, mm
Bent specimen (#AM1, A5052)30.034keV, DEM, Al (331)
20=25.62767deg
Fig. 8 Results of plastically bent specimen measured byDEM.
0.1 mm 0.5 mm 9
1 mm 3
27 χ = 0◦
( ) χ = 90◦ ( ) 2
Fig. 8 2θ
2 θ χ = 0◦
χ = 90◦ εχ=0, εχ=90
εχ=0, εχ=90 ε1
ε2
ε1 ε2
Fig. 9 σ1
DEM
DEM
-80
-60
-40
-20
0
20
40
60
80
0 1 2 3 4 5
1
2
Re
sid
ul str
ess
R,
MP
a
Distance from tensile edge x, mm
Bent specimen (#AM1, A5052)30.034keV, DEM, Al (331)
Fig. 9 Distributions of residual stresses of plastically bentspecimen measured by DEM.
-3
-2
-1
0
1
2
3
0 1 2 3 4 5
Thic
kness p
ositio
n y
, m
m
Distance from tensile side x, mm
Bent specimen (#AM1, A5052)30.034keV, DEM, Al (331)
Plastic zone Plastic zoneElastic zone
Fig. 10 Diffraction positions of plastically bent specimen deter-mined by DEM. The rectangle drawn with a broken lineindicates the cross section of the plastically bent speci-men. The vertical broken lines indicate the X-ray beams.
DEM
DEM
PC
(z ) (xC , yC) Fig. 10
PC
Fig. 10
PC
xC , yCzC
(h = 0.2 mm)
zC
Fig.5
Fig.5
314 鈴木 賢治,菖蒲 敬久,城 鮎美
01-2018-0107-(p.312-317).indd 314 2019/03/27 10:56:51
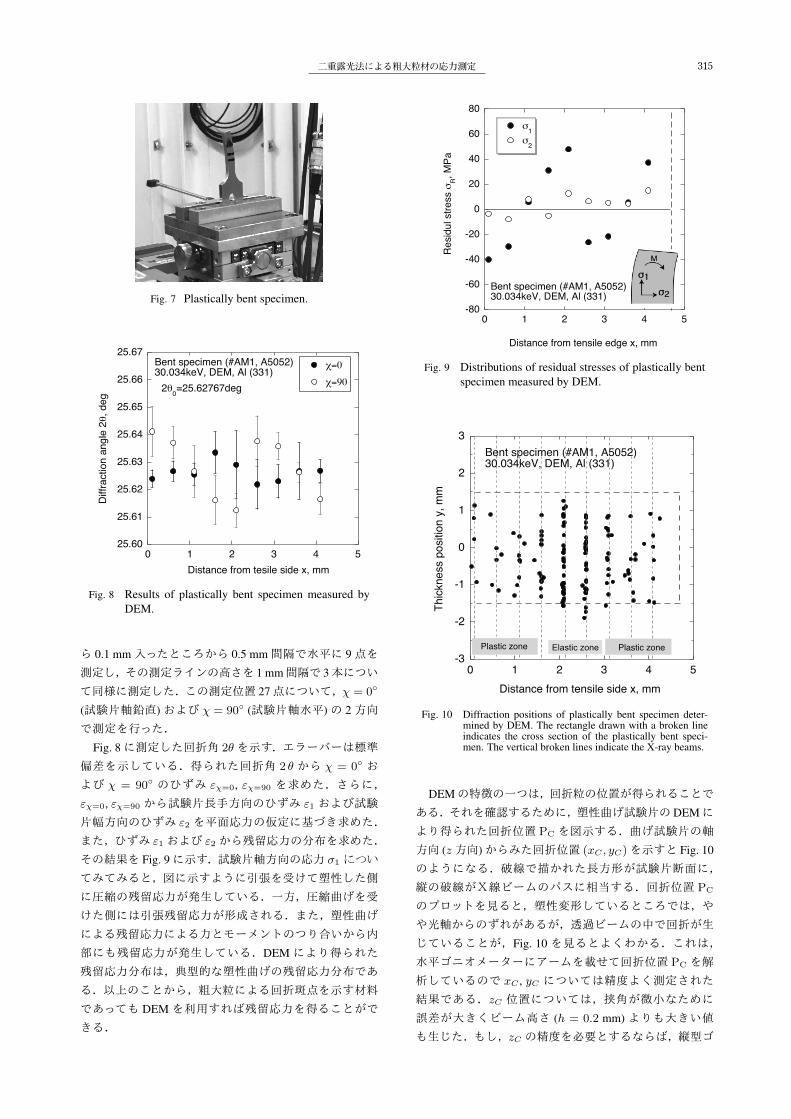
Fig. 4 Experiment for DEM.
2 PILATUS-300K
(Fig. 4) 2 θ
0◦ O1 = (0, y1, 0),
O2 = (0, y2, 0) Aℓ 331
2 θ 26◦
LD (= 791.889 mm) P1 P2
L0 = 707.989
mm L = 711.746 mm
30.034 keV (0.4127988A)
0.2×0.2mm2 PILATUS-300K
83.8 × 106.5 mm2 487 × 619
pixel 172 µm/pixel
4.75 mm 3 mm
(A5052)
623 K 1
27 µm Aℓ
331
331
2 θ0 = 25.62767◦ (= 93.06326 pm)
cij10) c11 =
106.78 GPa, c12 = 60.74 GPa, c44 = 28.21 GPa
Kroner 331
E = 71.39 GPa,
ν = 0.344
EM = 70.07 GPa νM = 0.347
33 ·1 DEM
Fig 5 DEM P1, P2
(a) P1
(b) P2
PLIATUS-300K 3
Fig 5
DEM P1 P2
(x1, z1) (x2, z2)
(a) P1 (b) P2
Fig. 5 Diffraction images measured by DEM. The box inthe figure (a) indicates the detected area at P2.
(a) P1 (b) P2
Fig. 6 Diffraction spot centers determined by the Demsys,which is matching program. Each diffraction centeris indicated with the cross mark.
Fig. 5
P1 P2
P1 P2
2 θ
PC(xC , yC , zC)
(Demsys) Fig. 6 P1
P2
2 θ
PC(xC , yC , zC)
Demsys
3 ·2DEM
Fig. 7
4.7 mm
3 mm
Fig. 7 Plastically bent specimen.
25.60
25.61
25.62
25.63
25.64
25.65
25.66
25.67
0 1 2 3 4 5
=0
=90
Diffr
action a
ngle
2, deg
Distance from tesile side x, mm
Bent specimen (#AM1, A5052)30.034keV, DEM, Al (331)
20=25.62767deg
Fig. 8 Results of plastically bent specimen measured byDEM.
0.1 mm 0.5 mm 9
1 mm 3
27 χ = 0◦
( ) χ = 90◦ ( ) 2
Fig. 8 2θ
2 θ χ = 0◦
χ = 90◦ εχ=0, εχ=90
εχ=0, εχ=90 ε1
ε2
ε1 ε2
Fig. 9 σ1
DEM
DEM
-80
-60
-40
-20
0
20
40
60
80
0 1 2 3 4 5
1
2
Re
sid
ul str
ess
R,
MP
a
Distance from tensile edge x, mm
Bent specimen (#AM1, A5052)30.034keV, DEM, Al (331)
Fig. 9 Distributions of residual stresses of plastically bentspecimen measured by DEM.
-3
-2
-1
0
1
2
3
0 1 2 3 4 5
Thic
kness p
ositio
n y
, m
m
Distance from tensile side x, mm
Bent specimen (#AM1, A5052)30.034keV, DEM, Al (331)
Plastic zone Plastic zoneElastic zone
Fig. 10 Diffraction positions of plastically bent specimen deter-mined by DEM. The rectangle drawn with a broken lineindicates the cross section of the plastically bent speci-men. The vertical broken lines indicate the X-ray beams.
DEM
DEM
PC
(z ) (xC , yC) Fig. 10
PC
Fig. 10
PC
xC , yCzC
(h = 0.2 mm)
zC
につい
315二重露光法による粗大粒材の応力測定
01-2018-0107-(p.312-317).indd 315 2019/03/27 10:56:51

3 ·3DEM
623 K 1
A5052 4.75×3 mm2
Fig. 11 (a) 2
1 2
Fig.
Spcimen
Indenter
Amvil
1st impact
2nd impact
Fig. 11 Indentation specimen.
Indentation
Indentation 600
400
200
0
-200
-400
-600
ε1
ε2
Strain, με
Fig. 12 Residual strain maps of indentation specimen using DEM.
σ1
σ2
Stress, MPa
100
50
0
-50
-100
Indentation
Indentation
Fig. 13 Residual stress maps of indentation specimen using DEM.
11 (b)
DEM 3 mm
0.2
mm χ
0◦ 90◦ 2 Aℓ 331
ε1 ε2
Fig. 12 ε1
ε2
45
ε1 ε2
σ1 σ2
Fig. 13 σ1
σ2
DEM
1 0.25 mm
4 1701
1600
σ1
σ2
-5 0 5
-5 0 5
Stress, MPa
100
50
0
-50
-100
Fig. 14 Residual stress map of indented specimen by FEM simu-lation.
Impact 11) Impact
E = 70.07 GPa, ρ = 2.68 g/cm3,
ν = 0.3466, σy = 100 MPa, p = 0.350
2
Fig. 14 σ1
σ1
2 DEM
σ2
DEM
45◦
σ2
DEM
Fig. 13
DEM
42
(DEM) DEM
2 2
Aℓ (A5052)
DEM
DEM
DEM
DEM
DEM
29
(C) 17K06046
(2017A-E10)
1) Standard method for X-ray stress measurement ,JSMS-SD-10-05 (2005), The Society of Materials Sci-ence, Japan.http://x-ray.jsms.jp/standard/sample English.pdf(Feb. 24, 2018)
2) P.J. Withers, Use of synchrotron X-ray radiation forstress measurement , in: Analysis of Residual Stressby Diffraction using Neutron and Synchrotron Radi-ation, ed. by M.E. Fitzpatrick and A. Lodini, pp. 170-189 (2003), Taylor & Francis.
3) S. Taira and K. Tanaka, Local residual stress nearfatigue crack tip , Transactions of the Iron and SteelInstitute of Japan, Vol. 19, pp. 411-418 (1979).
4) B.B. He and K.L. Smith, A new method for resid-ual stress measurement using an area detector ,in: Proceedings of The 5th International Conferenceon Residual Stresses (ICRS-5), ed. by T. Ericsson,M. Oden, A. Andersson, Linkoping, Sweden, pp. 634-639 (1997).
5) K. Suzuki, Proposal for a direct-method for stressmeasurement using an X-ray area detector , NDTand E International, Vol. 92, pp. 104-110 (2017).
6) K. Suzuki, T. Shobu, A. Shiro and S. Zhang, Inter-nal stress measurement of weld part using diffractionspot trace method , Material Science Forum, Vol. 777,pp. 155-160 (2014).
7) K. Suzuki, X-ray study on strain measurement ofcoarse-grain material using area detector , Proc. the50th Symposium on X-Ray Studies on Mechanical Be-haviour of Materials, pp. 105-108 (2016), The Societyof Materials Science, Japan.
8) D. Naragani, M.D. Sangid, P.A. Shade, J.C. Schuren,H. Sharma, J-S. Park, P. Kenesei, J.V. Bernier,T.J. Turner and I. Parr, Investigation of fatigue crackinitiation from a non-metallic inclusion via high en-ergy x-ray diffraction microscopy , Acta Materialia137, pp. 71-84 (2017).
9) Y. Hayashi, Y. Yoshiharu, D. Setoyama and Y. Seno,Orientation and stress mapping in polycrystalline
materials by the scanning 3DXRD method , Journalof the Japanese Society for Synchrotron Radiation Re-search, Vol. 31 No. 4, pp. 257-265 (2018).
10) G.N. Kamm and G.A. Alers, Low-temperature elas-tic moduli of aluminum , Journal of Applied Physics,Vol. 35, pp. 327-330 (1964).
11) https://sourceforge.net/projects/impact/
316 鈴木 賢治,菖蒲 敬久,城 鮎美
01-2018-0107-(p.312-317).indd 316 2019/03/27 10:57:00

3 ·3DEM
623 K 1
A5052 4.75×3 mm2
Fig. 11 (a) 2
1 2
Fig.
Spcimen
Indenter
Amvil
1st impact
2nd impact
Fig. 11 Indentation specimen.
Indentation
Indentation 600
400
200
0
-200
-400
-600
ε1
ε2
Strain, με
Fig. 12 Residual strain maps of indentation specimen using DEM.
σ1
σ2
Stress, MPa
100
50
0
-50
-100
Indentation
Indentation
Fig. 13 Residual stress maps of indentation specimen using DEM.
11 (b)
DEM 3 mm
0.2
mm χ
0◦ 90◦ 2 Aℓ 331
ε1 ε2
Fig. 12 ε1
ε2
45
ε1 ε2
σ1 σ2
Fig. 13 σ1
σ2
DEM
1 0.25 mm
4 1701
1600
σ1
σ2
-5 0 5
-5 0 5
Stress, MPa
100
50
0
-50
-100
Fig. 14 Residual stress map of indented specimen by FEM simu-lation.
Impact 11) Impact
E = 70.07 GPa, ρ = 2.68 g/cm3,
ν = 0.3466, σy = 100 MPa, p = 0.350
2
Fig. 14 σ1
σ1
2 DEM
σ2
DEM
45◦
σ2
DEM
Fig. 13
DEM
42
(DEM) DEM
2 2
Aℓ (A5052)
DEM
DEM
DEM
DEM
DEM
29
(C) 17K06046
(2017A-E10)
1) Standard method for X-ray stress measurement ,JSMS-SD-10-05 (2005), The Society of Materials Sci-ence, Japan.http://x-ray.jsms.jp/standard/sample English.pdf(Feb. 24, 2018)
2) P.J. Withers, Use of synchrotron X-ray radiation forstress measurement , in: Analysis of Residual Stressby Diffraction using Neutron and Synchrotron Radi-ation, ed. by M.E. Fitzpatrick and A. Lodini, pp. 170-189 (2003), Taylor & Francis.
3) S. Taira and K. Tanaka, Local residual stress nearfatigue crack tip , Transactions of the Iron and SteelInstitute of Japan, Vol. 19, pp. 411-418 (1979).
4) B.B. He and K.L. Smith, A new method for resid-ual stress measurement using an area detector ,in: Proceedings of The 5th International Conferenceon Residual Stresses (ICRS-5), ed. by T. Ericsson,M. Oden, A. Andersson, Linkoping, Sweden, pp. 634-639 (1997).
5) K. Suzuki, Proposal for a direct-method for stressmeasurement using an X-ray area detector , NDTand E International, Vol. 92, pp. 104-110 (2017).
6) K. Suzuki, T. Shobu, A. Shiro and S. Zhang, Inter-nal stress measurement of weld part using diffractionspot trace method , Material Science Forum, Vol. 777,pp. 155-160 (2014).
7) K. Suzuki, X-ray study on strain measurement ofcoarse-grain material using area detector , Proc. the50th Symposium on X-Ray Studies on Mechanical Be-haviour of Materials, pp. 105-108 (2016), The Societyof Materials Science, Japan.
8) D. Naragani, M.D. Sangid, P.A. Shade, J.C. Schuren,H. Sharma, J-S. Park, P. Kenesei, J.V. Bernier,T.J. Turner and I. Parr, Investigation of fatigue crackinitiation from a non-metallic inclusion via high en-ergy x-ray diffraction microscopy , Acta Materialia137, pp. 71-84 (2017).
9) Y. Hayashi, Y. Yoshiharu, D. Setoyama and Y. Seno,Orientation and stress mapping in polycrystalline
materials by the scanning 3DXRD method , Journalof the Japanese Society for Synchrotron Radiation Re-search, Vol. 31 No. 4, pp. 257-265 (2018).
10) G.N. Kamm and G.A. Alers, Low-temperature elas-tic moduli of aluminum , Journal of Applied Physics,Vol. 35, pp. 327-330 (1964).
11) https://sourceforge.net/projects/impact/
による
317二重露光法による粗大粒材の応力測定
01-2018-0107-(p.312-317).indd 317 2019/03/27 10:57:06


![Second International Planetary Dunes Workshop (2010) 2011 · pice dunes [7], the coppice dunes at Sunset Crater are primarily formed of sand-size grains. Finally, there is a coarse](https://static.cupdf.com/doc/110x72/5f41e2b3ba2f5a5fa06b4c47/second-international-planetary-dunes-workshop-2010-2011-pice-dunes-7-the-coppice.jpg)


