A P P L I E D B I 0 L'0 6 Y, I N C. AB-610
I'LORIDAPOWER & LIGHT COMPANY
ST. LUCIE UNIT 2ANNUALENVIRONMENTALOPERATING REPORT
VOLUME I
1990
I2968 A NORTH DECATUR ROAD
9105070294 910025PDR ADOCK 05000389R PDR
~ ATLANTA, GEORGIA 30033 ~ 404-296-3900
AB-610
FLORIDA POWER & LIGHTCOMPANY
ST. LUCIE UNIT2
ANNUALENVIRONMENTAL
OPERATING REPORT
1990
VOLUME 1
APRIL 1991
FLORIDA POWER & LIGHTCOMPANY
JUNO BEACH, FLORIDA
APPLIED BIOLOGY, INC.
ATLANTA,GEORGIA
I
I
IIII

ENVIRONMENTALOPERATING REPORT
TABLE OF CONTENTS
TABLEOF CONVERSION FACTORS FOR METRIC UNITS
EXECUTIVE SUMMARY
Introduction
Turtle Nesting Survey
Intake Canal Monitoring
Other Related Activities
INTRODUCTION
Background
Area Description
Plant Description
TURTLES
Introduction
Materials and Methods
Nesting Survey
Intake Canal Monitoring
Studies to Evaluate and/or Mitigate Intake Entrapment
Results and Discussion
Nesting Survey
Distribution of Loggerhead Nests Along Hutchinson Island
Estimates of Total Loggerhead Nesting on Hutchinson Island
Temporal Loggerhead Nesting Patterns
Predation on Loggerhead Turtle Nests
Green and Leatherback Turtle Nesting
Intake Canal Monitoring
Relative Abundance and Temporal Distribution
Size-Class Distributions
Sex Ratios
Capture Efficiencies
Relative Condition
Mortalities
Recapture Incidents
Summary
LITERATURE CITED
FIGURES
TABLES
IV
IV
10
10
14
15
15
15
18
19
20
21
23
23
26
. 28
. 30
31
33
34
36
40
48
70
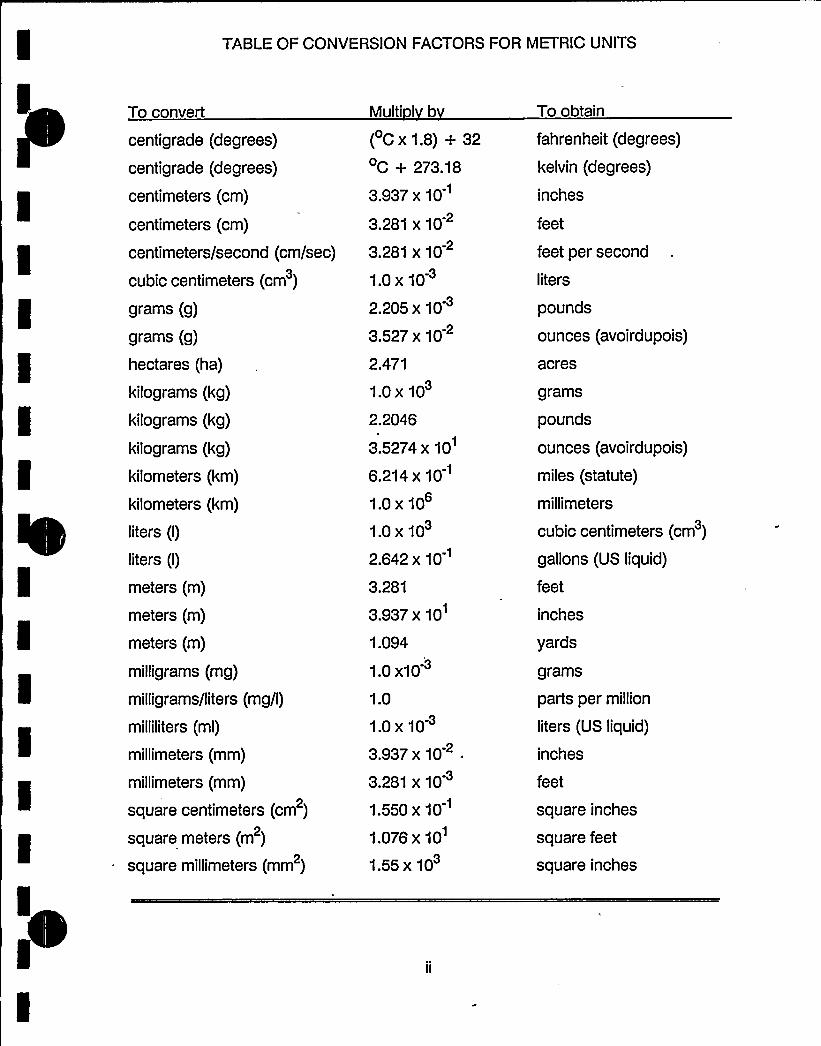
TABLE OF CONVERSION FACTORS FOR METRIC UNITS
To convert
centigrade (degrees)
centigrade (degrees)
centimeters (cm)
centimeters (cm)
centimeters/second (cm/sec)
cubic centimeters (cm )
grams (g)
grams (g)
hectares (ha)
kilograms (kg)
kilograms (kg)
kilograms (kg)
kilometers (km)
kilometers (km)
liters (I)
liters (I)
meters (m)
meters (m)
meters (m)
milligrams (mg)
milligrams/liters (mg/I)
milliliters (ml)
millimeters (mm)
millimeters (mm)
square centimeters (cm )
square meters (m )
square millimeters (mm )
Multi I b
( C x 1.8) + 32
C + 273.18
3.937 x 10
3.281 x 10
3.281 x10
1.0 x 10
2.205 x 10
3.527 x 10
2.471
1.0 x 10
2.2046
3.5274 x 10
6.214 x 10
1.0 x 10
1.0 x 10
2.642 x 10
3.281
3.937 x 10
1.094
1.0 x10
1.0
1.0 x 10
3.937 x 10
3.281 x 10
1.550 x 10
1.076 x 10
1.55 x 10
To obtain
fahrenheit (degrees)
kelvin (degrees)
inches
feet
feet per second
liters
pounds
ounces (avoirdupois)
acres
grams
pounds
ounces (avoirdupois)
miles (statute)
millimetc rs
cubic centimeters (cm )
gallons (US liquid)
feet
inches
JJards
grams
parts per million
liters (US liquid)
inches
feet
square inches
square feet
square inches

I
I
IrI
e,t
EXECUTlVE SUMMARY
INTRODUCTION
The St. Lucie Plant is an electric generating station on Hutchinson Island in St. Lucie
County, Florida. The plant consists of two nuclear-fueled 850-MW units; Unit 1 was
placed on-line in March 1976 and Unit2 in May 1983. This document has been prepared
to satisfy. the requirements contained in the United States Nuclear Regulatory
Commission's Appendix B Environmental Protection Plan (EPP) to St. Lucie Unit 2
Facility Operating License No. NPF-16. This report discusses environmental protection
activities related to sea turtles as required by Subsection 4.2 of the EPP. Other routine
annual reporting requirements are addressed in Volume 2, also entitled "St. Lucie Unit
2 Annual Environmental Operating Report".
TURTLE NESTING SURVEY
There have been considerable year-to-year fluctuations in sea turtle nesting activity
on Hutchinson Island since monitoring began in 1971. Low nesting activity in 1975 and
1981 -1983 in the vicinityof the power plant was attributed to construction of plant in-
take and discharge structures. Nesting returned to normal or above normal levels fol-
lowing both periods of construction. Power plant operation exclusive of construction
has had no significant effect on nesting near the plant. Data collected through 1990
have shown no long-term reductions in total nesting, total emergences or nesting suc-
cess on the island. Formal requirements to conduct this program expired in 1986 but
were voluntarily continued in 1990 with agreement from federal and state agencies.
INTAKECANALMONITORING
Since plant operation began in 1976, 2,193 sea turtles (including 100 recaptures)
representing five different species have been removed from the intake canal. Eighty-
four percent of these were loggerheads. Differences in the numbers of turtles found
during different months and years were attributed to natural variation in the occurren-
ces of turtles in the vicinity of the plant, rather than to any influence of the plant itself.
The majority of turtles removed from the intake canal (about 93 percent) were captured
alive and released back into the ocean. Turtles confined between the A1A barrier net
and intake headwalls usually resided in the canal for a relatively short period of time,
and most were in good to excellent condition when caught.
OTHER RELATED ACTIVITIES
Studies to evaluate various intake deterrent systems, as required by the NRC's Unit
2 Environmental Protection Plan, were conducted during 1982 and 1983. Results and
evaluations of those studies were presented to regulatory agencies during 1984, and
the requirement is now considered completed.
INTRODUCTION
BACKGROUND
This document has been prepared to satisfy the requirements contained in the
United States Nuclear Regulatory Commission's (NRC) Appendix B Environmental
Protection Plan to St. Lucie Unit 2 Facility Operating License No. NPF-16.
In 1970, Florida Power 8 Light Company (FPL) was issued Permit No. CPPR-74 by
the United States Atomic Energy Commission, now the Nuclear Regulatory Commis-
sion, that allowed construction of Unit 1 of the St. Lucie Plant, an 850-MW nuclear-
powered electric generating station on Hutchinson Island in St. Lucie County, Florida.
St Lucie Plant Unit 1 was placed on-line in March 1976. In May 1977, FPL was issued
Permit No. CPPR-144 by the NRC for the construction of a second 850-MW nuclear-
powered unit. Unit 2 was placed on-line in May 1983 and began commercial operation
in August of that year.
St. Lucie Plant Units 1 and 2 use the Atlantic Ocean as a source of water for once-
through condenser cooling. Since 1971, the potential environmental effects resulting
from the intake and discharge of this water have been the subject of FPL-sponsored
biotic studies at the site.
Baseline environmental studies of the marine environment adjacent to the St. Lucie
Plant were described in a series of reports published by the Florida Department of
Natural Resources (Camp et al., 1977; Futch and Dwinell, 1977; Gallagher, 1977; Gal-
lagher and Hollinger, 1977; Worth and Hollinger, 1977; Moffler and Van Breedveld,
1979; Tester and Steidinger, 1979; Walker, 1979; Walker et al., 1979; Walker and
Steidinger, 1979; Lyons, 1989). The results of Unit 1 operational and Unit 2 preopera-
tional biotic monitoring at the St. Lucie Plant were presented in six annual reports (ABI,
1977, 1978, 1979, 1980a, 1981b, 1982). In January 1982, a National Pollutant Discharge
Elimination System (NPDES) permit was issued to FPL by the US Environmental Protec-
tion Agency (EPA). The EPA guidelines for the St. Lucie site biological studies were
based on the document entitled "Proposed St. Lucie Plant Preoperational and Opera-
tional Biological Monitoring Program - August 1981" (ABI, 1981 c). Findings from these
studies were reported in three annual reports (ABI, 1983, 1984a, 1985a). The EPA biotic
monitoring requirements were deleted from the NPDES permit in 1985.
Jurisdiction for sea turtle studies is with the NRC, which is considered to be the lead
federal agency relative to consultation under the Endangered Species Act. Previous
results dealing exclusively with sea turtle studies are contained in seven environmen-
tal operating reports (ABI, 1984b, 1985b, 1986, 1987, 1988, 1989, 1990). This report
describes the 1990 environmental protection activities related to sea turtles, as required
by Subsection 4.2 of the St. Lucie Plant Unit 2 Environmental Protection Plan.
AREA DESCRIPTION
The St. Lucie Plant is located on a 457-ha site on Hutchinson Island on Florida's
east coast (Figures 1 and 2). The plant is approximately midway between the Ft. Pierce
and St. Lucie Inlets. It is bounded on its east side by the Atlantic Ocean and on its west
side by the Indian River Lagoon.

I
II
II
Hutchinson Island is a barrier island that extends 36 km between inlets and obtains
its maximum width of 2 km at the plant site. Elevations approach 5 m atop dunes bor-
dering the beach and decrease to sea level in the marigrove swamps that are common
on much of the western side. Island vegetation is typical of southeastern Florida coas-
tal areas; dense stands of Australian pine, palmetto, sea grape and Spanish bayonet
are present at the higher elevations, and mangroves abound at the lower elevations.
Large stands of black mangroves, including some on the plant site, have been killed
by flooding for mosquito control over past decades.
The Atlantic shoreline of Hutchinson Island is composed of sand and shell hash with
intermittent rocky promontories protruding through the beach face along the southern
end of the island. Submerged coquinoid rock formations parallel much of the island off
the ocean beaches. The ocean bottom immediately offshore from the plant site con-
sists primarily of sand and shell sediments. The unstable substrate limits the estab-
lishment of rooted macrophytes.
The Florida Current, which flows parallel to the continental shelf margin, begins to
diverge from the coastline at West Palm Beach. At Hutchinson Island, the current is
approximately 33 km offshore. Oceanic water associated with the western boundary
of the current periodically meanders over the inner shelf, especially during summer
months.
PLANT DESCRIPTION
The St. Lucie Plant consists of two 850-MW nuclear-fueled electric generating units
that use nearshore ocean waters for the plant's once-through condenser cooling water

system. Water for the plant enters through three submerged intake structures located
about 365 m offshore (Figure 2). Each ofthe intake structures is equipped with a velocity
cap to minimize fish entrainment. Horizontal intake velocities are less than 30 cm/sec.
From the intake structures, the water passes through submerged pipes (two 3.7 m and
one 4.9 m in diameter) under the beach and dunes that lead to a 1,500-m long intake
canal. This canal transports the water to the plant. After passing through the plant, the
heated water is discharged into a 670-m long canal that leads to two buried discharge
pipelines. These pass underneath the dunes and beach and along the ocean floor to
the submerged discharges, the first of which is approximately 365 m offshore and 730
m north of the intake.
Heated water leaves the first discharge line from a Y-shaped nozzle (diffuser) at a
design velocity of 396 cm/sec. This high-momentum jet entrains ambient water, result-
ing in rapid heat dissipation. The ocean depth in the area of the first discharge is about
6 m. Heated water leaves the second discharge line through a series of 48 equally
spaced high velocity jets along a 323-m manifold (multiport diffuser). This diffuser starts
168 m beyond the first discharge and terminates 856 m from shore. The ocean depth
at discharge along this diffuser is from about 10 to 12 m. As with the first diffuser, the
purpose of the second diffuser is to entrain ambient water and rapidly dissipate heat.
From the points of discharge at both diffusers, the warmer water rises to the surface
and forms a surface plume of heated water. The plume then spreads out on the sur-
face of the ocean under the influence of wind and currents and the heat dissipates to
the atmosphere.
> t
I
III
II
TURTLES
The NRC's St. Lucie Unit 2 Appendix B Environmental Protection Plan issued April
1983 contains the following technical specifications:
4.2 Terrestrial A uatic Issues
Issues on endangered or threatened sea turtles raised in the Unit 2FES-OL [NRC, 1982) and in the Endangered Species Biological As-sessment (March 1982) [Bellmund et al., 1982] will be addressedby programs as follows:
Beach nesting surveys for all species of sea turtles willbe conductedon a yearly basis for the period of 1982 through 1986. These sur-veys will be conducted during the nesting season from ap-proximately mid-April through August.
The Hutchinson Island beach will be divided into 36 one-km-longsurvey areas. In addition, the nine 1.25-km-long survey areas usedin previous studies (1971-1979) will be maintained for comparisonpurposes. Survey areas willbe marked with numbered wooden pla-ques and/or existing landmarks.
The entire beach willbe surveyed seven days a week. AIInew nestsand false crawls will be counted and recorded in each area. Aftercounting, all crawl tracks will be obliterated to avoid recounting.Predation on nests by raccoons or other predators willbe recordedas it occurs. Records willbe kept of any seasonal changes in beachtopography that may affect the suitability of the beach for nesting.
4.2.2
A program that employs light and/or sound to deter turtles from theintake structure will be conducted. The study will determine withlaboratory and field experiments ifsound and/or light willresult in areduction of total turtle entrapment rate.

The study shall be implemented no later than after the final removalfrom the ocean of equipment and structures associated with con-struction of the third intake structure and the experiments shall ter-minate 18 months later. Four months after the conclusion of theexperimental period, a report on the results of the study willbe sub-mitted to NRC, EPA, National Marine Fisheries Service (NMFS), andthe US Fish and Wildlife Service (USFWS) for their evaluation. If astatistically significant reduction in annual total turtle entrapmentrate of 80 percent or greater can be demonstrated, using thedeveloped technology and upon FPL receiving written concurrenceby NRC, EPA, NMFS, and USFWS then permanent installation ofthe deterrent system shall be completed and functioning no laterthan 18 months after the agencies'oncurrence. The design of thisstudy needs to take into account the significant annual variation inturtle entrapment observed in the past.
If an 80 percent reduction of turtle entrapment cannot be projectedto all three intake structures, then an interagency task force com-posed of NRC, EPA, NMFS,'USFWS, and FPL shall convene 18months after completion of the third intake and determine if othercourses of action to mitigate and/or reduce turtle entrapment arewarranted (such as physical barrier, emergence of new technologyor methods to deter turtles).
4.2.3
Alternative methods or procedures for the capture of sea turtlesentrapped in the intake canal will be evaluated. If a method or pro-cedure is considered feasible and cost effective and may reducecapture mortality rates, it will be field tested in the intake canal.
4.2.5 Ca ture and Release Pro ram
Sea turtle removal from the intake canal willbe conducted on a con-tinuing basis. The turtles will be captured with large mesh nets, orother suitable nondestructive device(s), if deemed appropriate. Aformalized daily inspection, from the shoreline, of the captul'Bdevice(s) will be made by a qualified individual when the device(s)are deployed. The turtles will be identified to species, measured,weighed (ifappropriate), tagged and released back into the ocean.Records ofwounds, fresh or old, and a subjective judgement on thecondition of the turtle (e.g., barnacle coverage, underweight) willbemaintained. Methods of obtaining additional biological/physiologi-cal data, such as blood analyses and parasite loads, from captured
I
I
IIII
sea turtles will be pursued. Dead sea turtles will be subjected to agross necropsy, if found in fresh condition.
INTRODUCTION
Hutchinson Island, Florida, is an important rookery for the loggerhead turtle, Caret-
ta caretta and also supports some nesting of the green turtle, Chelonia ~mdas and
th I th 5 kt tl .~OI I I 19 15 II t 1.,1959;5 t,1995;9 I-
lagher et al., 1972; Worth and Smith, 1976; Williams-Walls et al., 1983). Allthree species
are protected by state and federal statutes. The federal government classified the log-
gerhead turtle as a threatened species. The leatherback turtle and the Florida nesting
population of the green turtle are listed by the federal government as endangered
species. Because of reductions in world populations of marine turtles resulting from
coastal development and fishing pressure (NMFS, 1978), maintaining the vitalityof the
Hutchinson Island rookery is important.
It has been a prime concern of FPL that the construction and subsequent opera-
tion of the St. Lucie Plant would not adversely affect the Hutchinson Island rookery.
Because of this concern, FPL has sponsored monitoring of marine turtle nesting ac-
tivity on the island since 1971.
Daytime surveys to quantify nesting, as well as nighttime turtle tagging programs, „
were conducted in odd numbered years from 1971 through 1979. During daytime nest-
ing surveys, nine 1.25-km-long survey areas were monitored five days per week (Figure
3). The St. Lucie Plant began operation in 1976; therefore, the first three survey years
(1971, 1973 and 1975) were preoperational. Though the power plant was not operat-
ing during 1975, St. Lucie Plant Unit No. 1 ocean intake and discharge structures were

I
I
IIII
installed during that year. Installation of these structures included construction activities
conducted offshore from and perpendicular to the beach. Construction had been com-
pleted and the plant was in full operation during the 1977 and 1979 surveys.
A modified daytime nesting survey was conducted in 1980 during the preliminary
construction of the ocean discharge structure for St. Lucie Plant Unit 2. During this
study, four of the previously established 1.25-km-long survey areas were monitored.
Additionally, eggs from turtle nests potentially endangered by construction activities
were relocated.
Every year from 1981 through 1990, 36 1-km-long survey areas comprising the en-
tire island were monitored seven days a week during the nesting season (Figure 3).
The St. Lucie Plant Unit 2 discharge structure was installed during the 1981 nesting
season. Offshore and beach construction of the Unit 2 intake structure proceeded
throughout the 1982 nesting season and was completed near the end of the 1983l
season. Construction activities associated with installation of both structures were
similar to those conducted when Unit 1 intake and discharge structures were installed.
Eggs from turtle nests potentially endangered by construction activities were relocated
during all three years.
Requirement 4.2.1 of the NRC's St. Lucie Unit 2 Appendix B Environmental Protec-
tion Plan was completed with submission of the 1986 nesting survey data (ABI, 1987).
The nesting survey was continued voluntarily through 1990 with agreement from federal
and state agencies. Results are presented in this report and discussed in relation to
previous findings.

I
~ p
III
IIII
,)
Cl
II
In addition to monitoring sea turtle nesting activities and relocating nests away from
plant construction areas, removal of turtles from the intake canal has been an integral
part of the St. Lucie Plant environmental monitoring program. Turtles entering the ocean
intake structures are entrained with cooling water and rapidly transported through the
intake pipes into an enclosed canal system where they must be manually captured and
returned to the ocean. Since the plant became operational in 1976, turtles entrapped
in the intake canal have been systematically captured, measured, weighed, tagged and
released.
Previous publications and technical reports have presented findings of the nesting
surveys, nest relocation activities and canal capture program (Gallagher et al., 1972;
Worth and Smith, 1976; ABI, 1978, 1980a, 1981a, 1982, 1983, 1984b, 1985b, 1986,
1987, 1988, 1989, 1990; Williams-Walls et al., 1983; Proffitt et al., 1986; Ernest et al.,
1988, 1989; Martin et al., 1989a, 1989b). Results of studies to assess the effects of ther-
mal discharges on hatchling swimming speed have also been reported (ABI, 1978;
O'ara, 1980). The purpose of this report is to 1) present 1990 sea turtle nesting sur-
vey data and summarize observed spatial and temporal nesting patterns since 1971,
2) document and summarize predation on turtle nests since 1971, and 3) present 1990
canal capture data and summarize comparable data collected since 1976.
II
I
I
I
I
I
MATERIALSAND METHODS
Nestin Surve
Methodologies used during previous turtle nesting surveys on Hutchinson Island
were described by Gallagher et al. (1972), Worth and Smith (1976) and ABI (1978,
1981 a, 1982, 1987, 1988, 1989). Methods used during the 1990 survey were designed
to allow comparisons with these previous studies.
On 11 and 13 April 1990, preliminary nest surveys were conducted along Hutchin-
son Island from the Ft. Pierce Inlet south to the St. Lucie Inlet. From 16 April through
7 September, nest surveys were conducted on a daily basis. After7 September, several
additional surveys were conducted to confirm that nesting had ceased, the last survey
being conducted on 14 September. Biologists used small off-road motorcycles to sur-
vey the island each morning. New nests, non-nesting emergences (false crawls), and
nests destroyed by predators were recorded for each of the 361-km-long survey areas
comprising the entire island (Figure 3). The nine 1.25-km-long survey areas established
by Gallagher et al. (1972) also were monitored so comparisons could be made with
previous studies.
During the daily nest monitoring, any major changes in topography that may have
affected the beach's suitability for nesting were recorded. In addition, each of the 36
1-km-long survey areas has been systematically analyzed and categorized based on
beach slope (steep, moderate, etc.), width from high tide line to the dune, presence of
benches (areas of abrupt vertical relief) and miscellaneous characteristics (packed
10
'l
I
sand, scattered rock, vegetation on the beach, exposed roots on the primary dune,
etc.).
In a cooperative effort, data from stranded turtles found during beach surveys were
routinely provided to the National Maiine Fisheries Service (NMFS) through the Sea
Turtle Stranding and Salvage Network.
Intake Canal Monitorin
Most turtles entrapped in the St. Lucie Plant intake canal were removed by means
of large-mesh tangle nets fished between the intake headwalls and a barrier net located
at the Highway A1A bridge (Figure 2). Nets used during 1990 were from 30 to 40 m in
length, 3 to 4 m deep and composed of 40 cm stretch mesh nylon twine. Large floats
were attached to the surface, and unweighted lines used along the bottom. Turtles en-
tangled in the nets generally remained at the water's surface until removed.
Since its inception in 1976, ABI's canal capture program has been under continual
review and refinement in an attempt to minimize both entrapment times and in-
juries/mortalities to entrapped sea turtles. Prior to April 1990, turtle nets were usually
deployed on Monday mornings and retrieved on Friday afternoons. During periods of
deployment, the nets were inspected for captures by ABI personnel at least twice each
day (mornings and afternoons). Additionally, St. Lucie Plant personnel checked the
nets periodically, and ABI was notified immediately if a capture was observed. ABI's
sea turtle specialists were on call 24 hours a day to retrieve captured turtles from the
plant.
11

I
Beginning April 1990, after consultation with NMFS, net deployment was scaled
back to daylight hours only. Concurrently, surveillance of the intake canal was in-
creased and ABI personnel remained on site for the duration of each day's netting ac-
tivities. This measure decreased response time for removal of entangled turtles from
nets and provided an opportunity to improve daily assessments of turtle levels within
the canal. Records of daily canal observations were compared with capture data to as-
sess capture efficiencies.
The A1A barrier net is used to confine turtles to the easternmost section of the in-
take canal, where capture techniques have been most effective. This net is constructed
of large diameter polypropylene rope and has a mesh size of 30.5 cm x 30.5 cm. A
cable and series of large floats are used to keep the top of the net above the water'
surface, and the bottom is anchored by a series of heavy blocks. The net is inclined at
a slope of 3:1, with the bottom positioned upstream of the surface cable. This reduces
bowing in the center and minimizes the risk of a weak or injured turtle being pinned un-
derwater by strong currents.
In the past, the integrity of the barrier net was occassionally compromised, and
turtles were able to move west of A1A. These turtles were further constrained
downstream by an underwater intrusion detection system (UIDS) consisting, in part,
of a large barrier positioned perpendicular to the north-south arm of the canal (Figure
2). The UIDS security barrier also consists of 30.5 cm x 30.5 cm mesh, but the net is
constructed of heavy chain links rather than rope.
12
I
I
I
Prior to completion of the UIDS in December 1986, turtles uncontained by the A1A
barrier net were usually removed from the canal at the intake wells of Units 1 and 2
(Figure 2). There they were retrieved by means of large mechanical rakes or specially
designed nets. Following construction of the UIDS barrier, individuals with carapace
widths larger than 30.5 cm were unable to reach the intake wells. Thus, as required,
tangle nets were also deployed west of A1A. Improvements made to the A1A barrier
net during 1990 should prove effective in confining all turtles larger than 30.5 cm to the
eastern end of the canal.
Formal daily inspections of the intake canal were made to determine the numbers,
locations and species of turtles present. Surface observations were augmented with
periodic underwater inspections using SCUBA, particularly in and around the A1A bar-
rier net and UIDS barrier. Because of the reduction in total netting hours during 1990,
increased effort was directed toward hand capture of turtles. This was accomplished
by diving and use of dip nets, and it proved very effective when good water clarity con-
ditions prevailed.
Regardless of capture method, all turtles removed from the canal were identified to
species, measured, weighed, tagged, and examined for overall condition (wounds,
abnormalities, parasites, etc.). Healthy turtles were released into the ocean the same
day of capture. Sick or injured turtles were treated and occasionally held for observa-
tion prior to release. When treatment was warranted, injections of antibiotics and
vitamins were administered by a local veterinarian. Resuscitation techniques were used
if a turtle was found that appeared to have died recently. Beginning in 1982, necrop-
13

I
li~
l
sies were conducted on dead turtles found in fresh condition; one necropsy was per-
formed during 1990.
Since 1982, blood samples have been collected and analyzed to determine the sex
of immature turtles. Blood was removed from the paired dorsal cervical sinuses of sub-
ject turtles using the technique described by Owens and Ruiz (1980). The samples
were maintained on ice and later centrifuged for 15 minutes to separate cells and serum.
Sex determinations were subsequently made by researchers at Texas A 8 M Univer-
sity using radioimmunoassay for serum testosterone (Owens et al., 1978).
Florida Power 8 Light Company and Applied Biology, Inc. continued to assist other
sea turtle researchers in 1990. Data, specimens and/or assistance have been given to
the Florida Department of Natural Resources, National Marine Fisheries Service, US
Fish and WildlifeService, US Army Corps of Engineers, Smithsonian Institution; South
Carolina Wildlife and Marine Resources Division, Center for Sea Turtle Research
(University of Florida), Texas A & M University, University of Rhode Island, University
of South Carolina, University of Illinois, University of Central Florida, University of Geor-
gia, Virginia Institute of Marine Science and the Western Atlantic Turtle Symposium.
Studies to Evaluate and or Miti ate Intake Entra ment
A program that assessed the feasibility of using light and/or sound to deter turtles
from entering the St. Lucie Plant intake structures was conducted in 1982 and 1983
and completed in January 1984. As required, test results and evaluations were written
up and a presentation was made to the NRC, National Marine Fisheries Service and
the Florida Department of Natural Resources on 11 April 1984. Requirement 4.2.2 of
I
l
1
l
I
the NRC's St. Lucie Unit 2 Appendix B Environmental Protection Plan is considered
completed with submission of deterrent study findings.
RESULTS AND DISCUSSION
Nestin Surve
Distribution of Lo erhead Nests Alon Hutchinson Island
When sea turtle nesting surveys began on Hutchinson Island, nine 1.25-km-long
survey areas were used to estimate loggerhead nesting activity for the entire island.
Since 1981, all 36 1-km-long segments comprising the island's coastline have been
surveyed. Regardless of technique, loggerhead nest densities have shown con-
siderable annual variation within individual survey areas (Figures 4 and 5). Yet, the
annual spatial distribution of those nests among survey areas has produced a rather
uniform gradient, nest densities consistently increasing from north to south (ABI, 1987).
The gradient appears to be linear when only the nine 1.25-km-long survey areas are
used (Figure 4), but becomes non-linear when all 36 1-km-long survey areas are in-
cluded in the analysis (Figure 5). During 1990 the distribution of loggerhead nests along
the island was characterized by record high nesting along the northern and central por-
tions of the island (Figure 5).
In the past, the pronounced gradient observed on the northern end of the island
was occasionally influenced by physical processes occurring there; periods of heavy
accretion reduced the gradient, while periods of erosion accentuated it (Worth and
Smith, 1976; Williams-Walls et al., 1983). However, during recent years no consistent

I
Il
I

relationship was apparent when field observations of beach widths were compared to
the spatial distribution of nests along the island (ABI, 1987). Thus, even though beach
dynamics may sometimes affect the selection of nesting sites by loggerhead turtles,
other factors must also contribute to the selection process. Offshore bottom contours,
spatial distribution of nearshore reefs, type and extent of dune vegetation, and degree
of human activity on the beach at night have been identified as some of the factors af-
fecting nesting (Caldwell, 1962; Hendrickson and Balasingam, 1966; Bustard, 1968;
Bustard and Greenham, 1968; Hughes, 1974; Davis and Whiting, 1977; Mortimer,
1982). Relationships between spatial nesting patterns and specific environmental con-
ditions are often difficultto establish because of the interrelationship of the factors in-
volved.
Not all ventures onto the beach by a female turtle culminate in successful nests.
These "false crawls" (non-nesting emergences) may occur for many reasons and are
commonly encountered at other rookeries (Baldwin and Lofton, 1959; Schulz, 1975;
Davis and Whiting, 1977; Talbert et al., 1980; Raymond, 1984). Davis and Whiting
(1977) suggested that relatively high percentages of false crawls may reflect disturban-
ces or unsatisfactory nesting beach characteristics. Therefore, certain factors may af-
fect a turtle's preference to emerge on a beach, while other factors may affect a turtle'
tendency to nest after it has emerged. An index which relates the number of nests to
the number of false crawls in an area is. useful in estimating the post-emergence
suitability of a beach for nesting. In the present study this index is termed "nesting suc-
cess" and is defined as the percentage of total emergences that result in nests.
lo Historically, the pattern of loggerhead emergences on the island has generally paral-
leled the distribution of nests (ABI, 1987, 1988), and this same trend was apparent in
1990 (Figure 6). In contrast, nesting success by loggerheads along the island has typi-P
cally lacked gradients (Figure 7). Thus, the relatively high numbers of loggerhead nests
observed in certain areas are usually a result of more turtles coming ashore in those
areas rather than of more preferable nesting conditions being encountered by the
turtles after they emerged.
Loggerhead nesting densities during 1990 were generally high when compared with
previously recorded values (Figures 4 and 5). Record high nesting was recorded in 21
of the 36 one-kilometer-long survey areas and was most notable on the northern half
of the island. There were no apparent changes in the physical characteristics of the
beach that would account for this increase in nesting. In general, record high nesting
was due to record high emergence rates, and this may reflect an increase in the num-
ber of nesting females in the Hutchinson Island area.
Nesting surveys on Hutchinson Island were initiated in response to concerns that
the operation of the St. Lucie Plant might negatively impact the local sea turtle rookery.
Previous analysis, using log-likelihood tests of independence (G-test; Sokal and Rohlf,
1981) demonstrated that the construction of the plant's offshore intake and discharge
structures significantly reduced nesting at the plant site during construction years—
1975, 1981, 1982 and 1983 (Proffitt et al., 1986; ABI, 1987). However, nesting at the
plant consistently returned to levels similar to or greater than those at a control site in
years following construction. This trend continued during 1990 (Figure 8). Thus, power

plant operation exclusive of intake/discharge construction has had no apparent effect
on nesting.
Data collected through 1990 have shown no long-term reduction in loggerhead nest
densities, total emergences or nesting success in either the nine 1.25-km-long survey
areas or the 36 1-km-long survey areas (Table 1; Figure 9).
EstimatesofTotaILo erheadNestin onHutchinsonlsland
Various methods were used during surveys prior to 1981 to estimate the total num-
ber of loggerhead nests on Hutchinson Island based on the number of nests found in
the nine 1.25-km-long survey areas (Gallagher et al., 1972; Worth and Smith, 1976;
ABI, 1980a). Each of these methods were subsequently found to consistently overes-
timate island totals (ABI, 1987). Since whole-island surveys began in 1981, it has been
possible to determine the actual proportion of total nests deposited in the nine areas.
This has then allowed extrapolation from the nine survey areas to the entire island for
years prior to 1981.
From 1981 through 1990 the total number of nests in the nine areas varied from
32.5 to 35.6 percent of the total number of nests on the island (Table 1). This is slight-
ly higher than the 31.3 percent which would be expected based strictly on the propor-
tion of linear coastline comprised by the nine areas. Using the ten-year mean of 33.8
percent, estimates of the total number of nests on Hutchinson Island can be calculated
by multiplying the number of nests in the nine areas by 2.96. This technique, when ap-
plied to the nine survey areas during the ten years in which the entire island was sur-
veyed, produced whole-island estimates within 5.3 percent of the actual number of
18
I
Il

nests counted. Because the proportion of nests recorded in the nine survey areas
remained relatively constant over the last ten years, this extrapolation procedure should
provide a fairly accurate estimate of total loggerhead nesting for years prior to 1981.
It is clear that loggerhead nesting activity on Hutchinson Island fluctuates con-
siderably from year to year (Table 1). Annual variations in nest densities also are com-
mon at other rookeries (Hughes, 1976; Davis and Whiting, 1977; Ehrhart, 1980) and
may result from the overlapping of non-annual breeding populations. Nonetheless,
data collected through 1990 suggest an overall increase in nesting on Hutchinson Is-
land since surveys began in 1971. Total nesting activity was greatest during 1990 when
6,700 loggerhead nests were recorded. No relationships between total nesting activity
and power plant operation or intake/discharge construction were indicated by year-to-
year variations in total nesting on Hutchinson Island.
Tem oral Lo erhead Nestin Patterns
The loggerhead turtle nesting season usually begins between mid-April and early
May, attains a maximum during June or July, and ends by late August or early Sep-
tember (ABI, 1987). Nesting activity during 1990 followed this same pattern (Figure 10).
Cool water intrusions frequently occur over the continental shelf of southeast Florida
during the summer (Taylor and Stewart, 1958; Smith, 1982). Worth and Smith (1976),
Williams-Walls et al. (1983) and ABI (1982, 1983, 1984b, 1985b, 1986, 1987, 1988, 1989,
1990) suggested that these intrusions may have been responsible for the temporary
declines in loggerhead turtle nesting activity previously observed on Hutchinson Is-
19
I
I
II
II
land. Similarly, a substantial decrease in nesting during mid-July 1990 was apparently
due to an intrusion of cool water (Figure 10).
Though natural fluctuations in temperature have been shown to affect temporal nest-
ing patterns on Hutchinson Island, there has been no indication that power plant opera-
tion has affected these temporal patterns (ABI, 1988) ~
Predation on Lo erhead Turtle Nests
Since nest surveys began in 1971, raccoon predation probably has been the major
cause of turtle nest destruction on Hutchinson Island. Researchers at other locations
have reported raccoon predation levels as high as 70 to nearly 100 percent (Davis and
Whiting, 1977; Ehrhart, 1979; Hopkins et al., 1979; Talbert et al., 1980). Raccoon preda-
tion of loggerhead turtle nests on Hutchinson Island has not approached this level
during any study year, though levels for individual 1.25-km-long areas have been as
high as 80 percent. Overall predation rates for survey years 1971 through 1977 were
between 21 and 44 percent, with a high of 44 percent recorded in 1973. A pronounced
decrease in raccoon predation occurred after 1977, and overall predation rates for the
nine areas have not exceeded 10 percent since 1979. A decline in predation rates on
Hutchinson Island has been variously attributed to trapping programs, construction
activities, habitat loss and disease (Williams-Walls et al., 1983; ABI, 1987).
During 1990, six percent (406) of the loggerhead nests (n =6,700) on the island
were depredated by raccoons. As in previous years (ABI, 1989), predation of turtle
nests was primarily restricted to the most undeveloped portion of the island (i.e., Areas
E through S; Figure 11).
20
I
I
I
II
II
Ghost crabs have been reported by numerous researchers as important predators
of sea turtle nests (Baldwin and Lofton, 1959; Schulz, 1975; Diamond, 1976; Fowler,
1979; Hopkins et al ~, 1979; Stancyk, 1982). Though turtle nests on Hutchinson Island
probably have been depredated by ghost crabs since nesting surveys began in 1971,
this source of nest destruction did not become apparent until 1983. Quantification of
ghost crab predation was initiated the same year.
Overall predation rates by ghost crabs have varied from 0.1 to 2.1 percent from
1983 - 1989 (ABI, 1990). During 1990, 0.4 percent (27) of the loggerhead nests
(n =6,700) on the island were destroyed by ghost crabs (Figure 11). Nests destroyed
by a combination of raccoon and ghost crab predation have been included as raccoon
predations in previous discussions. When these combination predations are included
as crab predations, the overall predation rates by ghost crabs range from 0.4 to 3.2
percent. During 1990, 1.4 percent (96 nests) were destroyed by either ghost crabs or
a combination of ghost crabs and raccoons.
Green and Leatherback Turtle Nestin
Gl'een and leatherback turtles also nest on Hutchinson Island, but in fewer numbers
than loggerhead turtles. Prior to 1981, both survey (nine 1.25-km-long sections) and
inter-survey areas were monitored for the presence of green and leatherback nests.
Thirty-one kilometers of beach from Area 1 south to the St. Lucie Inlet were included
in that effort. During whole-island surveys from 1981 through 1990, only two of 182
Ieatherback nests and only seven of 601 green nests were recorded on the five
kilometers of beach north of Area 1. Therefore, previous counts of green and leather-
21
I
II
back nests within the 31 kilometers surveyed were probably not appreciably different
from total densities for the entire island. Based on this assumption, green and leather-
back nest densities may be compared among all survey years, except 1980, when less
than 15 kilometers of beach were surveyed.
Prior to 1990, the number of nests observed on the island ranged from 5 to 74 for
green turtles and from 1 to 36 for leatherbacks (Figure 12). During the 1990 survey,
132 green turtle and 12 leatherback turtle nests were recorded on Hutchinson Island.
Temporal nesting patterns for these species differ from the pattern for loggerhead
turtles. Green turtles typically nest on Hutchinson Island from mid-June through the
first or second week of September. During 1990, green turtles nested from 28 May
through 11 September. Leatherback'turtles usually nest on the island from mid-April
through early to mid-July. During 1990 this species nested from 10 Aprilthrough 3 July.
Considerable fluctuations in green turtle nesting on the island have occurred among
survey years (Figure 12). This is not unusual since there are drastic year-to-year fluc-
tuations in the numbers of green turtles nesting at other breeding grounds (Carr et al.,
1982). Despite these fluctuations, data collected through 1990 suggest an overall in-
crease in nesting since 1971 and may reflect an increase in the number of nesting
females in the Hutchinson Island area. During 1990, green turtles nestedmost frequent-
ly along the southern half of the island. This is consistent with results of previous sur-
veys.
Leatherback turtle nest densities have remained low on Hutchinson Island; however,
increased nesting during recent years (Figure 12) may reflect an overall increase in the
22
number of nesting females in the Hutchinson Island area. During 1990, leatherback
turtles primarily nested on the southern half of the island.
Intake Canal Monitorin
Entrainment of sea turtles at the St. Lucie Plant has been attributed to the presumed
physical attractiveness of the offshore structures housing the intake pipes rather than
to plant operating characteristics (ABI, 1980b and 1986). Even when both units are
operating at full capacity, turtles must actively swim into the mouth of one of the intake
pipes before they encounter current velocities sufficiently strong to effect entrainment.
Consequently, a turtle's entrapment relates primarily to the probability that it willdetect
and subsequently enter one of the intake structures. Assuming that detection distan-
ces do not vary appreciably over time and that all turtles (or a constant proportion) are
equally attracted to the structures, capture rates willvary proportionally to the number
of turtles occurring in the vicinity of the structures. If this assumption is true, data from
the canal capture program should reflect natural variability in the structure ofthe popula-
tion being sampled.
Relative Abundance and Tem oral Distribution
During 1990, 132 sea turtle captures took place in the intake canal of the St. Lucie
Plant (Table 2). Of the five species of sea turtles inhabiting coastal waters of the
southeastern United States, only two were represented in this year's catches: 112 log-
gerheads and 20 green turtles. Since intake canal monitoring began in May 1976, 1,853
loggerhead (including 99 recaptures), 306 green (including 1 recapture), 9 leatherback,
8 hawksbill and 17 Kemp's ridley captures have taken place at the St. Lucie Plant.
23
Annual catches of loggerheads increased steadily from a low of 33 in 1976 (partial
year of plant operation and monitoring) to 172 in 1979 (Figure 13). After declining be-
tween 1979 and 1981, yearly catches of loggerheads again rose steadily, reaching a
high of 195 during 1986. Captures have been in decline since 1986, decreasing more
than 40 percent over the last four years.
Two offshore intake structures were in place prior to Unit 1 start-up in 1976; the third
and largest structure was installed during 1982-1983. Even though all three structures
are in relatively close proximity, the addition of another pipe may have increased the
probability of a turtle being entrained. Because this change cannot be quantified, data
collected prior to 1982 may not be comparable with that collected after 1983. Addition-
ally, the influence of the construction itself on sea turtle entrainment during 1982 and
1983 is unknown. With these considerations in mind, neither a long-term increase nor
decrease in the number of loggerheads captured at the St. Lucie Plant can be inferred
from the data.
During 1990, the monthly catch of loggerheads ranged from 1 (November) to 25
(June), with a monthly mean of 9.3 (+7.0; Table 3). The number of captures during
May, June and July were considerably above average, while captures throughout theI
remainder of the year were moderately to considerably lower than average (Figure 14).
Over the entire monitoring period, monthly catches have ranged from 0 to 39; the
greatest number of captures occurred during January 1983.
When data from all fullyears of monitoring (1977-1990) were combined, the highest
number of loggerhead captures occurred in January (11.8 percent); fewest captures
24

I
l
I
l
II
were recorded in November and December (Table 3). However, monthly catches have
shown considerable annual variability. Months having relatively low catches one year
often have had relatively high catches in another.
Catches of green turtles also have varied widely among years, ranging from 0 in
1976 (partial year of sampling) to 69 in 1984 (Table 4). During 1990, 20 individuals were
captured. The average annual catch of green turtles, excluding 1976, was 21.9 (+18.0).
Although highly variable, annual capture data for green turtles suggest a long-term in-
crease in the number of individuals inhabiting the nearshore coastal area adjacent to
the plant (Figure 13). Again, however, the influence of the addition of a third intake pipe
during 1982-1983 on these data is not known.
Green turtles have been caught during every month of the year, with average month-
ly catches for all years combined ranging from 0.3 in September to 7.1 in January (Table
4). Seasonal abundance patterns of greens are much more pronounced than for log-
gerheads, nearly 60 percent of all captures occurring during the three month period
between January and March. During 1990, the largest number of greens (6) were cap-
tured in January. The most greens ever caught in one month was 37 in January 1984.
Catches of leatherbacks, hawksbills and Kemp's ridleys have been infrequent and
scattered throughout the 15 year study period (Table 2). Each species has shown
rather pronounced seasonal occurrences; all but two of the nine leatherbacks were
collected between February and May, seven of the Bight hawksbills were collected
between June and September, and all but two of the 17 Kemp's ridleys were caught
between November and April.
25
Size- lass Distrib tion
Although several straight-line and curved measurements were recorded for turtles
removed from the intake canal, only one straight-line measurement has been used in
analyses presented here. Straight-line carapace length (SLCL) was measured from the
precentral scute to the notch between the postcentral scutes (minimum carapace
length of Pritchard et al., 1983). To date, loggerheads removed from the intake canal
have ranged in length (SLCL) from 40.2 to 112.0 cm (x = 66.8 + 13.7 cm) and in
weight from 10.7 kg to 169.6 kg (x = 49.2 + 31.0 kg; Figures 15 and 16).
A carapace length of 70 cm approximates the smallest size of nesting loggerhead
females observed along the Atlantic east coast (Hirth, 1980). However, adults can only
be reliably sexed on external morphological characteristics (e.g., relative tail length)
after obtaining a length of about 85 cm. Previously, 80.0 cm was used as the lower limit
for adult turtles. However, recent data suggest that some males may not mature, and
thus might not be distinguishable from females, until they attain a slightly larger size.
Based on these divisions, data were segregated into three groups: juveniles (< 70 cm),
adults (>85 cm) and transitional (71-85 cm). The latter group probably includes some
mature and some immature individuals.
Of the 1,744 captures between 1977 and 1990 for which length data were collected,
69 percent were juveniles, the majority of these measuring between 50 and 70 cm SLCL
(Table 5). Adults accounted for about 15 percent of all captures, with the remaining
16 percent comprised of animals in the transitional size class. Similar size-frequency
distributions, indicating a preponderance of juveniles, have been reported for the
26
I
I
I
I
Mosquito/Indian River Lagoon (Mendonca and Ehrhart, 1982), the Canaveral ship
channel (Henwood, 1987), and Georgia and South Carolina (Hillestad et al., 1982).
These data suggest that coastal waters of the southeastern United States constitute
an important developmental habitat for Caretta caretta.
Seasonal patterns of abundance for various size classes indicated that juvenile log-
gerheads were slightly more abundant during the winter than at other times of the year
(Table 5). About 45 percent of the juveniles were captured between January and April.
Abundances decreased in spring and remained relatively constant during the summer
and early fall before decreasing again to lowest levels in November and December.
The seasonal distribution of adult loggerheads was much more pronounced, 76 per-
cent of all captures occurring between May and August, This represents the major pro-
tion of the nesting season on Hutchinson Island.
Green turtles removed from the intake canal over the entire study period ranged in
size from 20.0 to 108.0 cm SLCL (x = 35.8 + 14.3 cm) and 0.9 kg to 177.8 kg (x =
9.4 + 20.2 kg; Figures 17 and 18) ~ Nearly all (96 percent) were juveniles. About 80 per-
cent were 40 cm or less in length, and 66 percent weighed 5 kilograms or less. These
immature turtles exhibited distinct winter pulses suggesting migratory behavior (Table
4). However, some immature green turtles were present throughout the year. To date,
only eight adult green turtles (SLCL >83 cm; Witherington and Ehrhart, 1989) have
been removed from the canal; ail were captured during or shortly after the nesting
season.
27
I
Il
The eight hawksbills removed from the canal ranged in size from 34.0 to 70.0 cm
SLCL (x = 46.2+ 12.9 cm) and in weight from 6.4 to 52.2 kg (x = 17.3 + 16.6 kg).
All but one were juveniles (SLCL <63 cm; Witzell, 1983). Similarly, all but one of the 17
Kemp's ridleys captured at the St. Lucie Plant were juveniles (SLCL <60.0 cm; Hirth,
1980). Carapace lengths for the ridleys ranged from 27.0 to 62.0 cm SLCL (x = 36.1
+ 9.7 cm) and weights from 3.1 to 31.8 kg (x = 8.0 + 8.1 kg). The nine leatherbacks
removed from the canal ranged in length from 112.5 to 150.0 cm, and at least seven
were adults (SLCL >121 cm; Hirth, 1980). The largest leatherback for which an ac-
curate weight was obtained, a female with a curved carapace length of 158.5 cm,
weighed 334.8 kg.
~Sx Ratios
Since intake canal monitoring began in 1976, 255 adult loggerheads (SLCL > 85.0
cm) have been sexed. Females predominated males by a ratio of 5.4:1.0, which sig-
nificantly departs from a 1:1 ratio (X, P < 0.05). Consequently, temporal patterns in the
number of adult loggerhead captures were heavily influenced by the numbers of
females present. When sexes were separated, it is evident that males were relatively
evenly distributed among months, whereas 90 percent of the females were taken during
the nesting season (May through September; Figure 19).
The number of adult female loggerheads captured at the St. Lucie Plant has in-
creased steadily over the last seven years. From 1977 through 1983, an average of 4.4
adult females (+ 3.2; range = 1-10) were entrapped each year, whereas since then,
an average of 26.3 females per year (+ 6.7; range = 16-35) were captured. This in-
28
crease corresponds to a general rise in loggerhead nesting activity near the plant
(Figure 20). Increased nearshore movement associated with nesting increases the
probability of a turtle detecting one of the intake structures and hence the probability
of entrainment. Although the addition of the third offshore intake structure may have
accounted for some of the increase in the number of adults entrained since 1983, the
continued rise over the last seven years suggests a genuine increase in the number of
females occurring in the vicinity of the plant.
Between September 1982 and December 1986, 267 individual juvenile and sub-adult
loggerhead turtles captured in the canal were sexed by Texas A 8 M University re-
searchers using a bioimmunoassay technique for blood serum testosterone. As pre-
viously reported, females outnumbered males by a ratio of 2.3:1.0 (ABI, 1989). These
findings are consistent with those reported for samples taken from the Cape Canaveral
ship channel (1.7:1.0) and the Indian River Lagoon (1.4:1.0), where sex ratios are also
significantly skewed in favor of females (Wibbels et al., 1984). Blood samples collected
since 1986 are currently being analyzed and these results will provide a valuable tool
for assessing temporal variability in the sex ratios of the local loggerhead population.
Of the eight adult green turtles captured since monitoring began, six were males
and two were females. Six immature green turtles have been sexed through blood work;
all have been females. Of the six adult leatherback turtles for which sex was recorded,
three were females and three were males. The adult hawksbill and Kemp's ridley were
both females. No sex information exists for juveniles of these species.
29
Ca ture Efficiencies
Capture methodologies have been under continual review and refinement as net
materials, configurations and placement were varied in an effort to minimize sea turtle
entrapment times. Concurrently, alternative capture techniques were evaluated and
potential deterrent systems tested in the laboratory. During this period, capture efficien-
cies varied in relation to netting effort and the effectiveness of the systems deployed.
A capture/recapture study conducted in the intake canal between October 1980
and January 1981 indicated that most turtles confined between the A1Abridge and the
intake headwalls were captured within two weeks of their entrainment (ABI, 1983) ~
Based on more recent formal daily inspections, it appears that capture efficiencies have
further improved. Nearly 50 percent of the turtles entering the canal are now caught
within 24 hours of first sighting, and almost 90 percent are captured during their first
week of entrapment (Figure 21). Average capture efficiency, expressed as elapsed
days between first sighting and capture, during the period from April through Decem-
ber 1990 was 3.9 days (+ 6.8 days; range = 1-50 days). Better utilization of currents
and eddies, adjustments to tethering lines, multi-net deployments and increased ef-
forts to hand capture turtles have contributed to reduced entrapment times.
Entrapment times may be extended for turtles swimming past the A1A barrier net
(ABI, 1987). Occasionally, the top of the net has been submerged or the anchor cable
pulled free from the bottom, allowing larger turtles to pass; turtles with carapace widths
less than about 30.5 cm can swim through the large mesh. Because capture efforts
west of the A1A bridge have generally been less effective than those near the intake
30
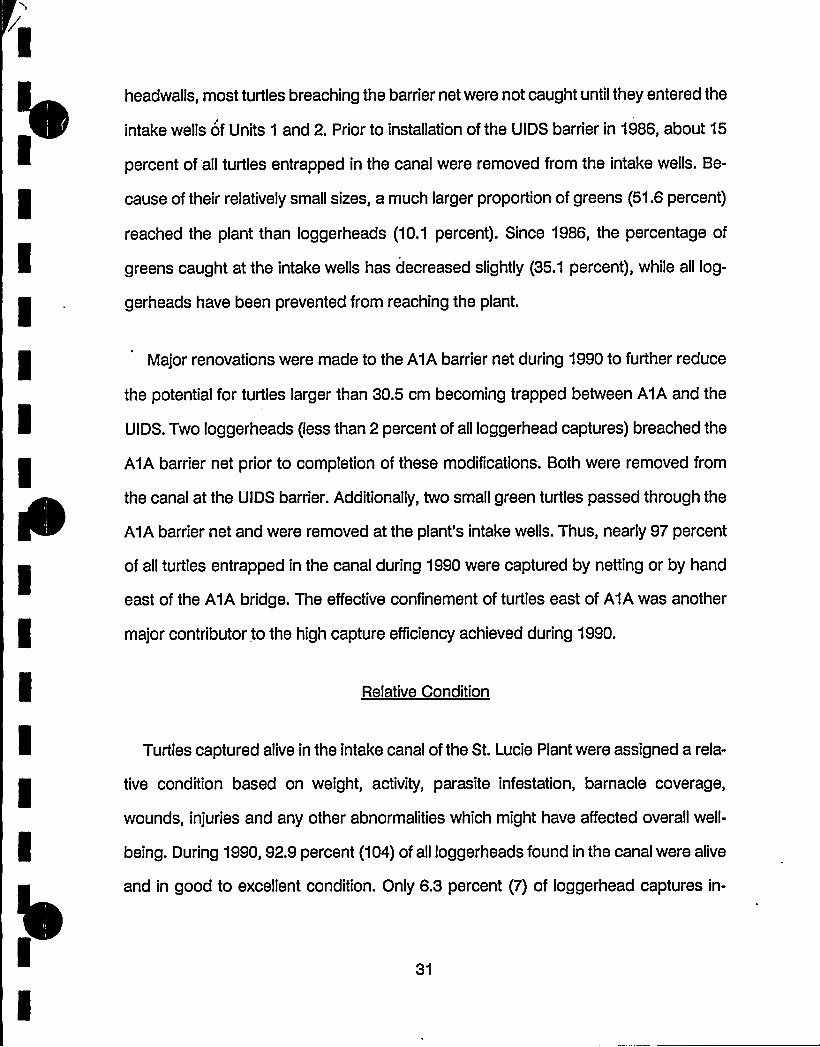
headwalls, most turtles breaching the barrier net were not caught until they entered the
intake wells of Units 1 and 2. Prior to installation of the UIDS barrier in 1986, about 15
percent of all turtles entrapped in the canal were removed from the intake wells. Be-
cause of their relatively small sizes, a much larger proportion of greens (51.6 percent)
reached the plant than loggerheads (10.1 pel'cent). Since 1986, the percentage of
greens caught at the intake wells has decreased slightly (35.1 percent), while all log-
gerheads have been prevented from reaching the plant.
Major renovations were made to the A1A barrier net during 1990 to further reduce
the potential for turtles larger than 30.5 cm becoming trapped between A1A and the
UIDS. Two loggerheads (less than 2 percent of all loggerhead captures) breached the
A1A barrier net prior to completion of these modifications. Both were removed from
the canal at the UIDS barrier. Additionally, two small green turtles passed through the
A1A barrier net and were removed at the plant's intake wells. Thus, nearly 97 percent
of all turtles entrapped in the canal during 1990 were captured by netting or by hand
east of the A1A bridge. The effective confinement of turtles east of A1A was another
major contributor to the high capture efficiency achieved during 1990.
Relative Condition
Turtles captured alive in the intake canal of the St. Lucie Plant were assigned a rela-
tive condition based on weight, activity, parasite infestation, barnacle coverage,
wounds, injuries and any other abnormalities which might have affected overall well-
being. During 1990, 92.9 percent (104) of all loggerheads found in the canal were alive
and in good to excellent condition. Only 6.3 percent (7) of loggerhead captures in-
31
I
III
I
volved individuals in fair or poor condition; one loggerhead was dead when removed
from the canal. Of the 20 green turtles removed from the intake canal during 1990, 16
were in good to excellent condition, two were in fair condition and two were dead.
Over the entire monitoring period, about 76 and 78 percent, respectively, of all log-
gerhead and green captures have involved turtles in good to excellent condition (Table
6). Captures of individuals in fair to poor condition have occurred about 16 percent of
the time for loggerheads and 14 percent of the time for greens. All of the hawksbills
and leatherbacks have been removed from the canal in good to excellent condition,
while about half of the Kemp's ridleys have fallen into these categories.
Relative condition ratings can be influenced by a number of factors, some related
and others unrelated to entrainment and/or entrapment in the intake canal. Ratings of
good to excellent indicate that turtles have not been negatively impacted by their entrap-
ment in the canal, at least as evidenced by physical appearance. Although ratings of
fair or poor imply reduced vitality, the extent to which entrainment/entrapment is
responsible is often indeterminable. In some instances, conditions responsible for
lower ratings, such as injuries, obviously were sustained prior to entrainment.
During 1990, about nine percent (10) of all loggerhead captures involved individuals
with noticeable injuries, such as missing appendages, broken or missing pieces of
carapace and deep lacerations. Most of these were old, well-healed wounds, and none
were serious enough to require medical attention. None of the green turtles captured
during 1990 had major injuries.
32

I
I
II
I
I
II
~Mrtalitie
Mortalities have been closely monitored throughout the life of the canal capture
program in an attempt to assign probable causes and take appropriate remedial ac-
tion to minimize future occurrences. Previous analyses ofcapture data identified drown-
ing in nets (A1A barrier net, UIDS barrier, and tangle nets), drowning in the intake pipes
during periods of reduced intake flow, injuries sustained from dredging operations and
injuries sustained from the mechanical rakes used in the intake wells as probable mor-
tality factors (ABI, 1987). Although difficultto quantify, the entrapment and subsequent
demise of injured or sick turtles has probably accounted for a portion of observed mor-
talities.
Over the entire 15 year monitoring period, 127 (6.9 percent) of the 1,853 logger-
heads and 21 (6.9 percent) of the 306 green turtles entrapped in the canal were found
dead (Table 6). Mortalities spanned the range of size classes for loggerheads (SLCL
= 47.5-103 cm), while all green turtle mortalities involved juveniles less than 42 cm in
length. The four Kemp's ridley mortalities documented at the plant during 1987 and
1988 wel'e the only deaths for this species to date; no leatherback or hawksbill mor-
talities have occurred at the St. Lucie Plant.
Modifications to capture procedures, improvements to the A1A barrier net and vir-
tual elimination of low flow conditions within the canal have resulted in a substantial
reduction in sea turtle mortalities over the life of the canal capture program. Mortality
rates, expressed as the percentage of total captures involving dead animals, declined
42 percent between the first (1976-1983) and second (1984-1990) halves of the
33

I
IIII
I
I
I
II
program. During 1990, only three mortalities (2.3 percent of total captures) were
recorded, one loggerhead and two green turtles. This represents the fewest annual
mortalities since the canal capture program began in 1976.
Previous observations suggest that sick or injured turtles may be susceptible to
drowning at the UIDS barrier. The loggerhead mortality recorded during 1990 occurred
at this location. Even though the carcass was too decomposed to assess its physical
condition or determine cause of death, drowning is suspected. Additional improve-
ments to the A1Abarrier net during the later part of 1990 should prevent future logger-
head movements west of A1A and thereby eliminate the UIDS barrier as a potential
mortality source.
The two green turtle mortalities during 1990 resulted from drowning in ABI's tangle
nets. One of these was resuscitated, but it later succumbed while under observation.
A necropsy was performed to determine if it was in poor health at the time of capture;
results of tissue analyses have not yet been completed. To eliminate the potential for
future net drownings, ABI has begun continual monitoring of its tangle nets during
periods of deployment.
Reca ture Incident
Since the St. Lucie Plant capture program began, most turtles removed alive from
the intake canal have been tagged and released into the ocean at various locations
along Hutchinson Island. Consequently, individual turtles can be identified as long as
they retain their tags. Over the 15 year history of turtle entrapment at the St. Lucie Plant,
61 individuals (60 loggerheads and 1 green) have been removed from the canal more
34
than once. Several other turtles with tag scars have also been recovered, indicating
that the actual number of recaptures may be higher.
Of the 60 individual loggerheads known to have been caught more than once, 42
were caught twice, 9 were caught three times, 5 were caught four times, 2 were cap-
tured six times, 1 was caught seven times and 1 was caught on nine separate oc-
casions, yielding a total of 99 recapture incidents. Release site did not appear to have
any effect on a turtle's probability of being recaptured. Turtles released both north and
south of the plant returned. Recaptures also did not appear to be related to size, as
both juveniles and adults were captured more than once (range of SLCL = 47-89 cm).
However, the majority of recapture incidents involved juveniles (SLCL < 70 cm).
Recapture intervals for loggerheads ranged from four to 858 days, with a mean of
157 days (+174.0 days). The only green turtle caught more than once was captured
on two occasions, returning to the canal 59 days after first being released into the
ocean. About 56 percent of all loggerhead recapture incidents occurred within 90 days
of previous capture and 89 percent within one year (Figure 22). The average interval
between first and last capture was 262 days (+329.7 days). The longest period be-
tween first and last capture was 5.3 years. These data suggest that residency times of
loggerheads within the nearshore habitat adjacent to the St. Lucie Plant are relatively
short. Similar findings have been reported for loggerheads inhabiting the Mosquito/In-
dian River Lagoons of east-central Florida (Mendonca and Ehrhart, 1982).
35
SUMMARY
A gradient of increasing loggerhead turtle nest densities from north to south along
the northern half of Hutchinson Island has been shown during most survey years. This
gradient may result from variations in beach topography, offshore depth contours, dis-
tribution of nearshore reefs, onshore artificial lighting and human activity on the beach
at night. Low nesting activity in the vicinity of the power plant during 1975 and from
1981 through 1983 was attributed to construction of power plant intake and discharge
systems. Nesting returned to normal or above normal levels following both periods of
construction. Power plant operation, exclusive of intake/discharge construction, has
had no significant effect on nest densities.
There have been considerable year-to-year fluctuations in loggerhead nesting ac-
tivityon Hutchinson Island from 1971 through 1990. Fluctuations are common at other
rookeries and may result from overlapping of non-annual breeding populations.
Despite these fluctuations, loggerhead nesting activity has remained high during recent
years and may reflect an overall increase in the number of nesting females in the
Hutchinson Island area. No relationship between total nesting on the island and power
plant operation or intake/discharge construction was indicated.
Temporary declines in loggerhead nesting activity have been attributed to cool water
intrusions that frequently occur over the continental shelf of southeast Florida. Though
temporal nesting patterns of the Hutchinson Island population may be influenced by
natural fluctuations in water temperature, no significant effects due to power plant
operation have been indicated.
36
Since nesting surveys began in 1971, raccoon predation was considered the major
cause of turtle nest destruction on Hutchinson Island. From 1971 through 1977, over-
all predation rates in the nine survey areas were between 21 and 44 percent. However,
a pronounced decrease in raccoon predation occurred after 1977, and overall preda-
tion rates in the nine survey areas have not exceeded ten percent since 1979.
Decreased predation by raccoons probably reflects a decline in the raccoon popula-
tion.
During 1990, 132 green turtle and 12 leatherback turtle nests were recorded on
Hutchinson Island. Nesting activity by these two species exhibited considerable annual
fluctuations, as has been recorded at other rookeries, but has remained relatively high
during recent years. This may reflect an overall increase in the number of nesting green
and leatherback turtles in the Hutchinson Island area.
During 1990, 112 loggerheads and 20 green turtles were removed from the St. Lucie
Plant intake canal. Since monitoring began in May 1976, 1,843 loggerhead, 306 green,
9 leatherback, 8 hawksbill and 17 Kemp's ridley turtles have been captured. Over the
life of the monitoring program, annual catches for loggerhead turtles have ranged from
33 in 1976 (partial year of plant operation and monitoring) to a high of 195 in 1986.
Yearly catches of green turtles have ranged from 0 in 1976 to 69 in 1984. Differences
in the number of turtles entrapped during different years and months are attributed to
natural variation in the occurrence of turtles in the vicinity of the offshore intake struc-
tures, rather than to any influence of the plant itself.
37

I
I
II
Size-class distributions of loggerhead turtles removed each year from the canal have
consistently been predominated by juveniles between 50 and 70 cm in straight line
carapace length. Most green turtles entrapped in the canal (about 80 percent) were
juveniles 40 cm or less in length. For both species, the largest number of captures for
all years combined occurred during the winter, but these seasonal peaks were much
more pronounced for green turtles. Sex ratios of both adult and immature loggerheads
caught in the canal continued to be biased towards females.
During 1990, about 93 and 80 percent, respectively, of all loggerheads and green
turtles removed from the canal were categorized by physical appearance as being in
good to excellent condition. Over the entire 15 year monitoring period, 76 and 78 per-
cent, respectively, of all loggerhead and green turtle captures have involved individuals
in these categories; 16 percent of the loggerheads and 14 percent of the green turtles
removed from the canal have been in fair or poor condition.
About nine percent of the turtles removed from the intake canal during 1990 had
substantial injuries. However, most of these injuries were sustained prior to entrap-
ment. Once in the canal, turtles confined east of A1A usually had very brief residency
times and thus the relative condition of most turtles was not affected by their entrap-
ment.
During 1990, one loggerhead and two green turtle mortalities occurred in the intake
canal. These deaths probably resulted from drowning: two in ABI tangle nets, one at
the UIDS barrier. Program modifications to permit continual surveillance of tangle nets
38

I
I
II
during periods of deployment and improvements to the A1A barrier net were initiated
to further reduce the potential for similar mortalities in the future.
Since intake canal monitoring began in 1976, 6.9 percent of the loggerheads and a
similar percentage of green turtles removed from the canal were dead. The four Kemp's
ridley mortalities in 1987 and 1988 were the only deaths recorded for this species since
monitoring began. Allof the leatherbacks and hawksbills entrapped in the intake canal
at the St. Lucie Plant have been captured alive and released into the ocean. Modifica-
tions to capture procedures, improvements to the A1A barrier net and virtual elimina-
tion of low flow conditions in the canal has resulted in a 42 percent reduction in sea
turtle mortality rates over the life of the canal capture program.
39
I
II
I
III
LITERATURE CITED
ABI (Applied Biology, Inc). 1977. Ecological monitoring at the Florida Power & Light Co. St.Lucie Plant, annual report 1976. Volumes I and II. AB-44. Prepared by Applied Biology,Inc. for Florida Power 8 Light Co., Miami.
. 1978. Ecological monitoring at the Florida Power 8 Light Co. St. Lucie Plant,annual report 1977. Volumes I and II. AB-101. Prepared by Applied Biology, Inc. forFlorida Power & Light Co., Miami.
. 1979. Florida Power 8 Light Company, St. Lucie Plant annual non-radiologi-cal environmental monitoring report 1978. Volumes II and III, Biotic monitoring. AB-177. Prepared by Applied Biology, Inc. for Florida Power 8 Light Co., Miami.
. 1980a. Florida Power 8 LightCompany, St. Lucie Plant annual non-radiologi-cal environmental monitoring report 1979. Volumes II and III, Biotic monitoring. AB-244. Prepared by Applied Biology, Inc. for Florida Power 8 Light Co., Miami.
. 1980b. Turtle entrainment deterrent study. AB-290. Prepared by AppliedBiology, Inc. for Florida Power 8 Light Co., Miami.
. 1981a. Successful relocation of sea turtle nests near the St. Lucie Plant,Hutchinson Island, Florida. AB-317. Prepared by Applied Biology, Inc. for Florida Power8 Light Co., Miami.
. 1981b. Florida Power 8 LightCompany, St. Lucie Plant annual non-radiologi-cal environmental monitoring report 1980. Volumes II and III, Biotic monitoring. AB-324. Prepared by Applied Biology, Inc. for Florida Power 8 Light Co., Miami.
. 1981 c. Proposed St. Lucie Plant preoperational and operational biologicalmonitoring program - August 1981. AB-358. Prepared by Applied Biology, Inc. forFlorida Power 8 Light Co., Miami.
. 1982. Florida Power 8 Light Company, St. Lucie Plant annual non-radiologi-cal environmental monitoring report 1981. Volumes II and III, Biotic monitoring. AB-379. Prepared by Applied Biology, Inc. for Florida Power 8 Light Co., Miami.
. 1983. Florida Power 8 Light Company, St. Lucie Plant annual non-radiologi-cal aquatic monitoring report 1982. Volumes I and II. AB-442. Prepared by Applied Biol-ogy, Inc. for Florida Power 8 Light Co., Miami.
40

I
I
II
ABI (Applied Biology, Inc.). 1984a. Florida Power 8 Light Company, St. Lucie Plant annualnon-radiological environmental monitoring report 1983. Volumes I and II. AB-530.Prepared by Applied Biology, Inc. for Florida Power 8 Light Co., Miami.
. 1984b. Florida Power & Light Company, St. Lucie Unit 2 annual environ-mental operating report 1983. AB-533. Prepared by Applied Biology, Inc. for FloridaPower & Light Co., Miami.
. 1985a. Florida Power & Light Company, St. Lucie Plant annual non-radiologi-cal environmental monitoring report 1984. AB-553. Prepared by Applied Biology, Inc.for Florida Power 8 Light Co., Juno Beach.
. 1985b. Florida Power & Light Company, St. Lucie Unit 2 annual environ-mental operating report 1984. AB-555. Prepared by Applied Biology, Inc. for FloridaPower & Light Co., Juno Beach.
. 1986. Florida Power & Light Company, St. Lucie Unit 2 annual environmen-tal operating report 1985. AB-563. Prepared by Applied Biology, Inc. for Florida Power8 Light Co., Juno Beach.
. 1987. Florida Power & Light Company, St. Lucie Unit 2 annual environmen-tal operating report 1986. AB-579. Prepared by Applied Biology, Inc. for Florida Power& Light Co., Juno Beach.
. 1988. Florida Power 8 Light Company, St. Lucie Unit 2 annual environmen-tal operating report 1987. AB-595. Prepared by Applied Biology, Inc. for Florida Power& Light Co., Juno Beach.
. 1989. Florida Power & Light Company, St. Lucie Unit 2 annual environmen-tal operating report 1988. AB-596. Prepared by Applied Biology, Inc. for Florida Power&. Light Co., Juno Beach.
. 1990. Florida Power 8 Light Company, St. Lucie Unit 2 annual environmen-tal operating report 1989. AB-603. Prepared by Applied, Biology, Inc. for Florida Power& Light Co., Juno Beach.
Baldwin, W.P., Jr. and J.P. Lofton, Jr. 1959. The loggerhead turtles of Cape Romain, SouthCarolina. Previously unpublished manuscript abridged and annotated by D.K. Caldwell,without the authors. In D.K. Caldwell and A. Carr, coordinators, The Atlantic logger-head eea turtle, Caretta caretta ~carett (L.), in America. Bulletin of the Florida StateMuseum, Biological Sciences, 4(10):319-348.
41

I
I
II
Bellmund, S., M.T. Masnik and G. LaRoche. 1982. Assessment of the impacts of the St. Lucie2 Nuclear Station on threatened or endangered species. US Nuclear Regulatory Com-mission, Office of Nuclear Reactor Regulation.
Bustard, H.R. 1968. Protection for a rookery: Bundaberg sea turtles. Wildlifein Australia 5:43-44
Bustard, H.R. and P. Greenham. 1968. Physical and chemical factors affecting hatching in the=-
green aea turtle, Chelonia ~mdaa (L.). Ecology 49(2):269-276.
Caldwell, D.K. 1962. Comments on the nesting behavior of Atlantic loggerhead sea turtles,based primarily on tagging returns. Quarterly Journal of the Florida Academy of Scien-ces 25(4):287-302.
Caldwell, D.K., A. Carr and L.H. Ogren. 1959. Nesting and migration of the Atlantic logger-head turtle. In D.K. Caldwell and A. Carr, coordinators, The Atlantic loggerhead seaturtle Caretta caretta caretta (L.), in America. Bulletin of the Florida State Museum,Biological Sciences, 4(10):295-308.
Camp, D.K., N.W. Whiting and R.E. Martin. 1977. Nearshore marine ecology at HutchinsonIsland, Florida: 1971-1974. V. Arthropods. Florida Marine Research Publications 25:1-63.
Carr, A., A. Meylan, J. Mortimer, K. Bjorndal and T. Carr. 1982. Surveys of sea turtle popula-tions and habitats in the Western Atlantic. NOAATechnical Memorandum NMFS-SEFC-91:1-82.
Davis, G.E., and M.C. Whiting. 1977. Loggerhead sea turtle nesting in Everglades NationalPark, Florida, U.S.A. Herpetologica 33:18-28.
dt d AW tdtg 9 dt gtt I gt d tt IH tttllt ~I,~WA I
imbricata L., on Cousin Island, Seychelles. Biological Conservation 9:199-215.
Ehrhart, L.M. 1979. Reproductive characteristics and management potential of the sea turtlerookery at Canaveral National Seashore, Florida. Pages 397-399 in Linn, R.M., ed.Proceedings of the First Conference on Scientific Research in the National Parks, 9-1 2November, 1976, New Orleans, La. NPS Trans. and Proc. Ser. No. 5.
Ehrhart, L.M. 1980. Threatened and endangered species of the Kennedy Space Center:marine turtle studies. In A continuation of baseline studies for environmentally monitor-ing space transportation systems (STS) at John F. Kennedy Space Center. ContractNo. NAS-10-8986. Vol. IV, NASA Report 163122. September 1980.
42
Ernest, R.G., R.E. Martin, B.D. Peery, D.G. Strom, J.R. Wilcox and N.W. Walls. 1988. Sea turtleentrapment at a coastal power plant. Pages 270-301 in Mahadevan, K., R.K. Evans, P.
Behrens, T. Biffarand L. Olsen, eds. Proceedings, Southeastern Workshop on AquaticEcological Effects of Power Generation. Report No. 124, Mote Marine Laboratory,Sarasota, Florida.
Ernest, R.G., R.E. Martin, N.W. Walls and J.R. Wilcox. 1989. Population dynamics ofsea turtlesutilizing shallow coastal waters off Hutchinson Island, Florida. Pages 57-59 in Eckert,S.A., K.L. Eckert and T.H. Richardson, compilers. Proceedings of the Ninth AnnualWorkshop on Sea Turtle Conservation and Biology. NOAA Technical MemorandumNMFS-SEFC-232.
Fowler, L.E. 1979. Hatching success and nest predation in the green sea turtle, Chelonia~mdas at Tortuguero, Costa Rica. Ecology 60(5):945-955.
Futch, C.R. and S.E. Dwinell. 1977. Nearshore marine ecology at Hutchinson Island, Florida:1971-1974. IV. Lancelets and Fishes. Florida Marine Research Publications 24: 1-23.
Gallagher, R.M. 1977. Nearshore marine ecology at Hutchinson Island, Florida: 1971-1974.II. Sediments. Florida Marine Research Publications 23: 6-24.
Gallagher, R.M. and M.L. Hollinger. 1977. Nearshore marine ecology at Hutchinson Island,Florida: 1971-1974. I. Introduction and rationale. Florida Marine Research Publications23: 1-5.
Gallagher, R.M., M.L. Hollinger, R.M. Ingle and C.R. Futch. 1972. Marine turtle nesting onHutchinson Island, Florida in 1971. Florida Department of Natural Resources, SpecialScientific Report 37:1-11.
Hendrickson, J.R. and E. Balasingam. 1966. Nesting beach preferences of Malayan seaturtles. Bulletin of the National Museum Singapore 33(10):69-76.
Henwood, T.A. 1987. Movements and seasonal changes in loggerhead turtle, Caretta caret-ta aggregations in the vicinity of Cape Canaveral, Florida (1978-84). Biological Con-servation 40:191-202.
Hillestad, H.O., J.I ~ Richardson, C. McVea, Jr. and J.M. Watson, Jr. 1982. Worldwide inciden-tal capture of sea turtles. Pages 489-496 in Bjorndal, K.A., ed. Biology and conserva-tion of sea turtles. Smithsonian Institution Press, Washington, D.C.
Hirth, H.F. 1980. Some aspects of the nesting behavior and reproductive biology of sea turtles.American Zoologist 20:507-523.
43

I
I
I
Hopkins, S.R., T.M. Murphy, Jr., K.B. Stansell and P.M. Wilkinson. 1979. Biotic and abioticfactors affecting nest mortality in the Atlantic loggerhead turtle. Proceedings AnnualConference of Southeastern Fish and WildlifeAgencies 32:213-223.
Hughes, G.R. 1974. The sea turtles of southeast Africa, 1. Status, morphology and distribu-tions. South African Association for Marine Biological Research, OceanographicResearch Institute, Investigational Report No. 35:1-144.
. 1976. Irregular reproductive cycles in the Tongaland loggerhead sea turtle, Carettacaretta (L.) (Cryptodira: Chelonidae). Zoologica Africana 11(2):285-291.
Lyons, W.G. 1989. Nearshore marine ecology at Hutchinson Island, Florida: 1971-1974. PartXI. Mollusks. Florida Marine Research Publication 47:1-131.
Martin, R.E., R.G. Ernest, N.W. Walls and J.R. Wilcox. 1989a. Size distribution and seasonalabundance of loggerhead and green turtles in nearshore waters off Hutchinson Island,Florida. Pages 334-335 in Ogren, L., F. Berry, K. Bjorndal, H. Kumpf, R. Mast, G.Medina, H. Reichart and R. Witham, editors. Proceedings of the Second Western At-lantic Turtle Symposium. Mayaguez, Puerto Rico, 12-16 October 1987. NOAATechni-cal Memorandum NMFS-SEFC-226.
. 1989b. Long-term trends in sea turtle nesting on Hutchin-son Island, Florida. Pages 111-113 in Eckert, S.A., K.L. Eckert and T.H. Richardson,compilers. Proceedings of the Ninth Annual Workshop on Sea Turtle Conservation andBiology. NOAATechnical Memorandum NMFS-SEFC-232.
Mendonca, M.T. and L.M. Ehrhart. 1982. Activity, population size and structure of the imma-ture Chelonia~mdas and Caretta caretta in Mosquito Lagoon, Florida. Copeia 1982:(1)161-167.
Moffler, M.D. and J.F. Van Breedveld. 1979. Nearshore marine ecology at Hutchinson Island,Florida: 1971-1974.X. Benthic algae species list. Florida Marine Research Publications34: 118-122.
Mortimer, J.A. 1982. Factors influencing beach selection by nesting sea turtles. Pages 45-51in Bjorndal, K.A., ed. Biology and Conservation of Sea Turtles. Smithsonian InstitutionPress. Washington, D.C.
NMFS (National Marine Fisheries Service). 1978. Final EIS listing and protecting the green seaturtle (Chelonia~mdas, loggerhead sea turtle (CGar tta~cretta and the Pacific Ridley
tttid 3ptt ~li d I 3 d 9 dgp I 9 t 11913.3 ttal Marine Fisheries Service, Dept. of Commerce, Washington, D.C.

II
I
I
NRC (US Nuclear Regulatory Commission). 1982. Final environmental statement related tothe operation of St. Lucie Plant Unit 2. Docket No. 50-389.
O'ara, J. 1980. Thermal influences on the swimming speed of loggerhead turtle hatchlings.Copeia 1980(4):773-780.
Owens, D.W., J.R. Hendrickson, V. Lance and I.P. Callard. 1978. A technique for determin-ing sex of immature Chelonia ~md~a using a radioimmunoassay. Herpetologica34:270-273.
Owens, D.W. and G.J. Ruiz. 1980. New methods of obtaining blood and cerebrospinal fluidfrom marine turtles. Herpetologica 36:17-20.
Pritchard, P.C., P.R. Bacon, F.H. Berry, A.F. Carr, J. Fletemeyer, R.M. Gallagher, S.R. Hop-kins, R.R. Lankford, R. Marques M., L.H. Ogren, W.G. Pringle, Jr., H.A. Reichart andR. Witham. 1983. Manual of sea turtle research and conservation techniques. Preparedfor the Western Atlantic Turtle Symposium, San Jose, Costa Rica, July 1983. 126 pp.
Proffitt, C.E., R.E. Martin, R.G. Ernest, B.J. Graunke, S.E. LeCroy, K.A. Muldoon, B.D. Peery,J.R. Wilcoxand N. Williams-Walls. 1986. Effects of power plant construction and opera-tion on the nesting of the loggerhead sea turtle (Caretta ~caretta:t97t-t984. Copeia1986(3): 813-816.
Raymond, P.W. 1984. The effects of beach restoration on marine turtles nesting in southBrevard County, Florida. M.S. thesis, University of Central Florida.
Routa, R.A. 1968. Sea turtle nest survey of Hutchinson Island, Florida. Quarterly JournalFlorida Academy of Sciences 30(4):287-294.
Schulz, J.P. 1975. Sea turtles nesting in Surinam. Zoologische Verhandelingen, uitgegevendoor het Rijksmuseum van Natuurlijke Historic te Leiden, No. 143:1-144.
Smith, N.P. 1982. Upwelling in Atlantic shelf waters of south Florida. Florida Scientist 45(2):125-138.
Sokal, R.R. and F.J. Rohlf. 1981. Biometry. The principles and practice of statistics in biologi-cal research. W.H. Freeman and Company, San Francisco. 859 pp.
Stancyk, S.E. 1982. Non-human predators of sea turtles and their control. Pages 139-152 inBjorndal, K.A., ed. Biology and Conservation of Sea Turtles. Smithsonian InstitutionPress. Washington, D.C.

I
III
II
I
Talbert, O.R., S.E. Stancyk, J.M. Dean and J.M. Will. 1980. Nesting activity of the loggerheadturtle (Caretta ~caretta in South Carolina. I: A rookery in transition. Copeia 1950:(4)709-718.
Taylor, C.B., and H.B. Stewart. 1958. Summer upwelling along the east coast of Florida. Jour-nal of Geophysical Research 64(1):33-40.
Tester, L.A. and K.A. Steidinger. 1979. Nearshore marine ecology at Hutchinson Island,Florida: 1971-1974. Vll. Phytoplankton, 1971-1973. Florida Marine Research Publica-tions 34: 16-61 ~
Walker, L.M. 1979. Nearshore marine ecology at Hutchinson Island, Florida: 1971-1974. IX.Diel plankton, 1973-1974. Florida Marine Research Publications 34: 99-117.
Walker, L.M., B.M. Glass and B.S. Roberts. 1979. Nearshore marine ecology at HutchinsonIsland, Florida: 1971-1974. Vill. Zooplankton, 1971-1973. Florida Marine ResearchPublications 34: 62-98.
Walker, L.M. and K.A. Steidinger. 1979. Nearshore marine ecology at Hutchinson Island,Florida: 1971-1974. Vl. Plankton dynamics, 1971-1973. Florida Marine ResearchPublications 34: 1-15.
Wibbels, T., D. Owens, Y. Morris and M. Amoss. 1984. Sex ratios of immature loggerhead seaturtles captured along the Atlantic coast of the United States. Final Report to the Na-tional Marine Fisheries Service. Contract No. NA81-GA-C-0039. 47 pp.
Williams-Walls, N., J. O'ara, R.M. Gallagher, D.F. Worth, B.D. Peery and J.R. Wilcox. 1983.Spatial and temporal trends of sea turtle nesting on Hutchinson Island, Florida, 1971-1979. Bulletin of Marine Science 33(1):55-66.
Witherington, B.E. and L.M. Ehrhart. 1989. Status and reproductive characteristics of greenturtles (Chelonia ~mdas nesting in Florida. Pages 351-352 in Ogren, L., F. Berry, K.Bjorndal, H. Kumpf, R. Mast, G. Medina, H. Reichart and R. Witham, editors. Proceed-ings of the Second Western Atlantic Turtle Symposium. Mayaguez, Puerto Rico, 12-16October 1987. NOAATechnical Memorandum NMFS-SEFC-226.
Wi* II,WN.'l983.98 3 I Idi I pi Id I 8 3 till ~ I ~ ~Eh I
(Linnaeus, 1766). FAO Fisheries Synopsis, 137:1-78.
Worth, D.F. and M.L. Hollinger. 1977. Nearshore marine ecology at Hutchinson Island, Florida:1971-1974. III. Physical and chemical environment. Florida Marine Research Publica-tions 23: 25-85.
46

Worth, D.F., and J.B. Smith. 1976. Marine turtle nesting on Hutchinson Island, Florida, in 1973.Florida Marine Research Publications 18:1-17.
47
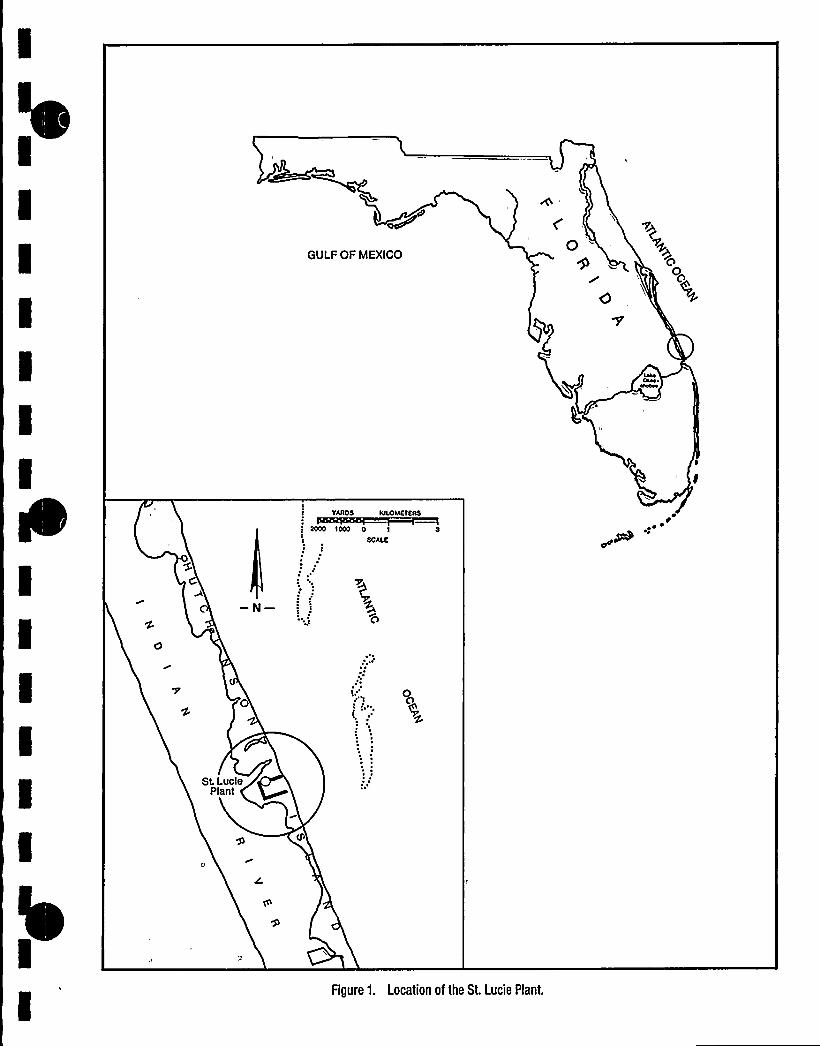
GULF OF MEXICO0
0
YAROS KILOMETERS
SCALE
r~ ~
St LuciaPlant
Figure 1. Location of the St. Lucie Plant.

I
IIII
I
I
II
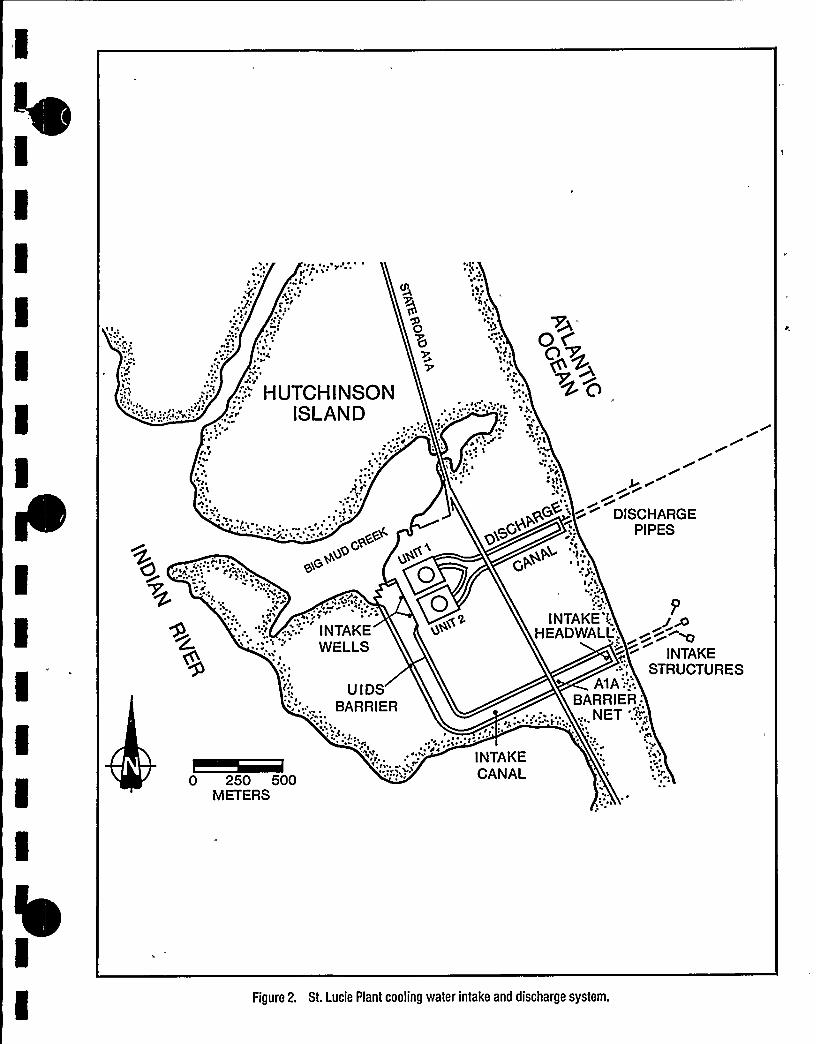
V
~ g ~ t'
~gW
.:,:: HUTCHINSONISLAND
~o
0'F
~ ~
IJ
i7.~ iS'~
Oc
2 G
'5 ~
.L-....i~
0
0 250 500METERS
~ ~
tr
~ 5pp ,>r~
DISCHARGE~gG+ '.. PIPES
0 G„" oi ~ gAv' ~'l"r2 VQ
9INTAKE'<:.
:.c „,".'NTAKE HEADWALL';4~ ':-,.'„. 'ELLS
~ '.", STRUCTURES
UIDS A1A'-'.:.
BARRIER BARRIER:.,, NET;.~;
~ b
~ ',,'1 'a'84 'NTAKE
CANAL
Figure 2. St. Lucie Plant cooling water intake and discharge system.

I
I
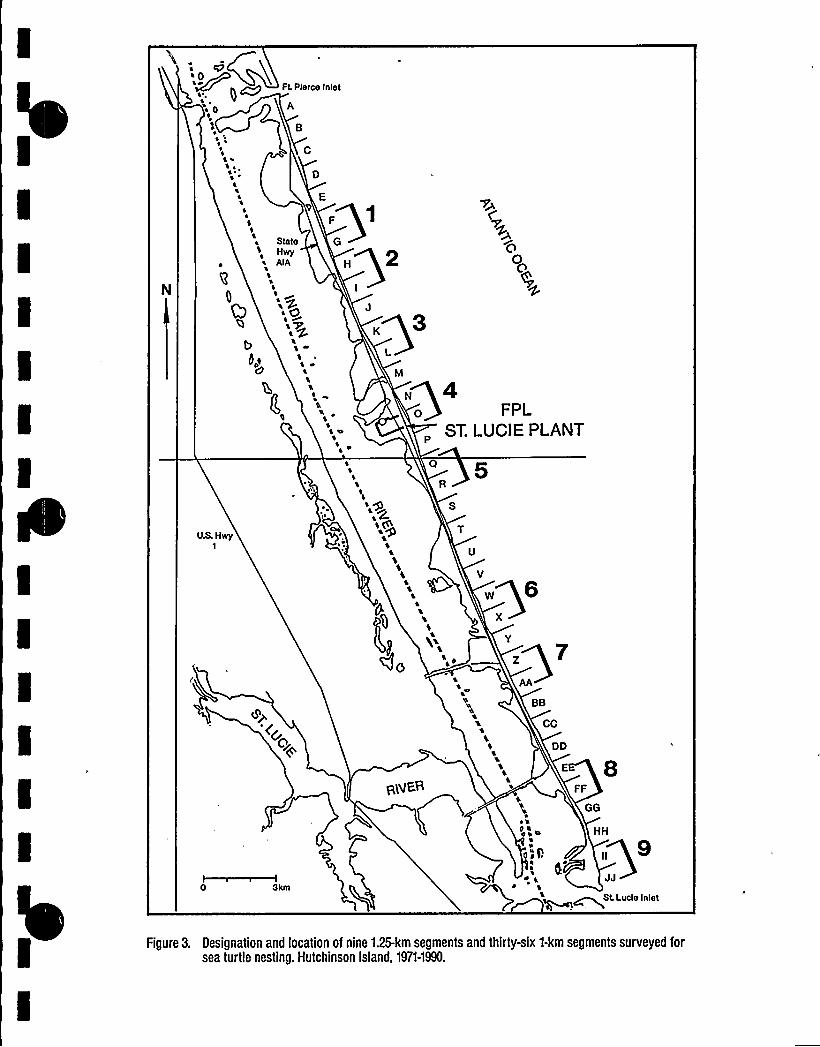
FL Pierce Inlet1
0 A
\ ~~ '
a
Fa
State GHwy
A
0a 7~
't ~a
ea
a
AI
g0
Q0
bb,o
O
alo
H 2
V+
F+
3
N 40 FPL
ST. LUCIE P
U.S. HwyI
d
0 Skm
RtV6.R
V
w 6
AA4
BB
CC
DD
E
FF
GG
da + HH
OdQ u
SL Ludo Inlet
Figure 3. Designation and location of nine 1.25-km segments and thirty-six 1-km segments surveyed forsea turtle nesting. Hutchinson Island, 1971-1990.
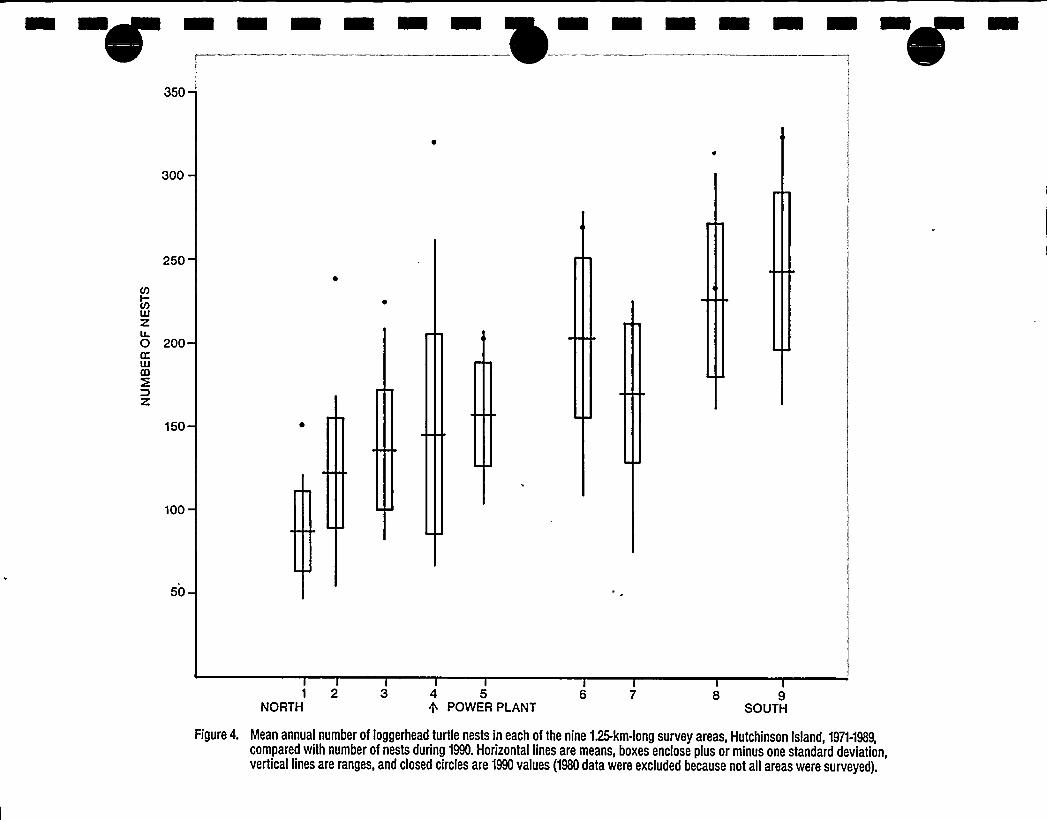
350
300
250
z0 200
Dz150
100
50
1 2NORTH
3 4 5 6 7 8 9POWER PLANT SOUTH
Figure 4. Mean annual number of loggerhead turtle nests in each of the nine1.25-km-long survey areas, Hutchinson Island, 1971-1989,compared with number of nests during 1990. Horizontal lines are means, boxes enclose plus or minus one standard deviation,vertical lines are ranges, and closed circles are 1990 values (1980 data were excluded because not all areas were surveyed).

I
IIII
I
IIII
II
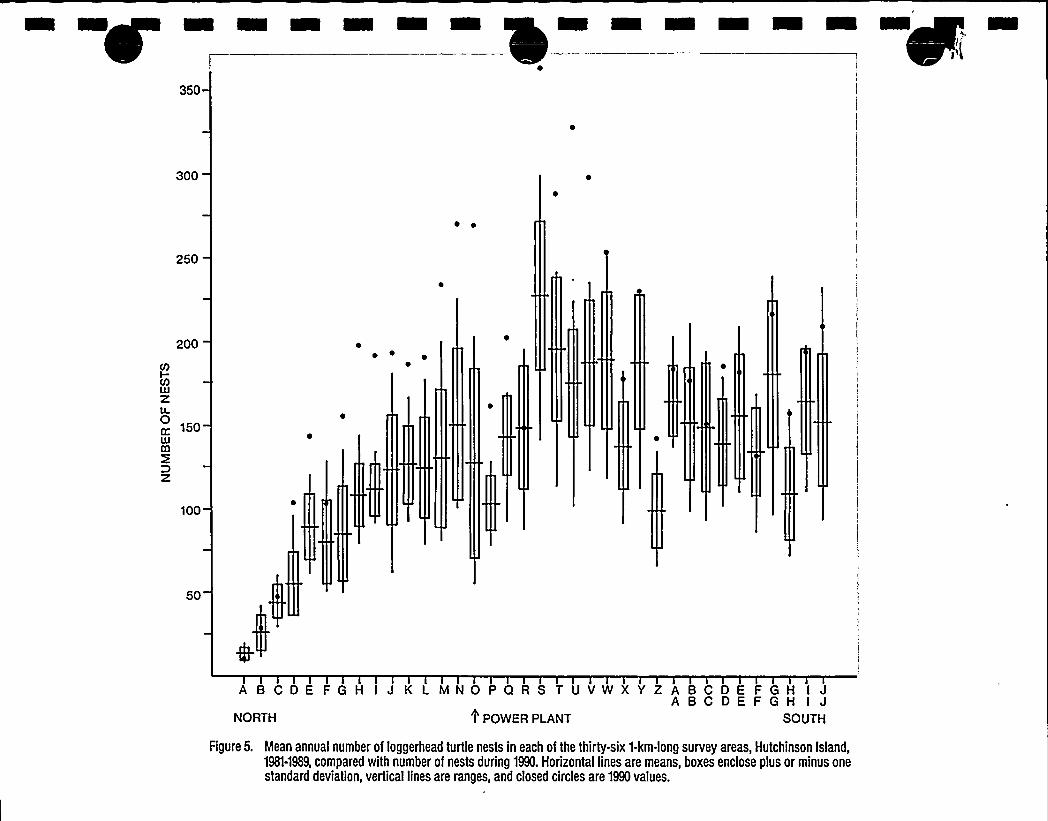
350
300
~ ~
250
200
(0I-V)
z
150
Dz
~ ~ ~
100
50
A BCDE FGH I J K L MNOPQRS TUVWXYZABCDEFGH I JABCDEFGH I JNORTH 1'OWER PLANT SOUTH
Figure 5. Mean annual number of loggerhead turtle nests in each of the thirty-six 1-km-long survey areas, Hutchinson Island,1981-1989, compared with number of nests during 1990. Horizontal lines are means, boxes enclose plus or minus onestandard deviation, vertical lines are ranges, and closed circles are 1990 values.

I
I
I
III
I
II
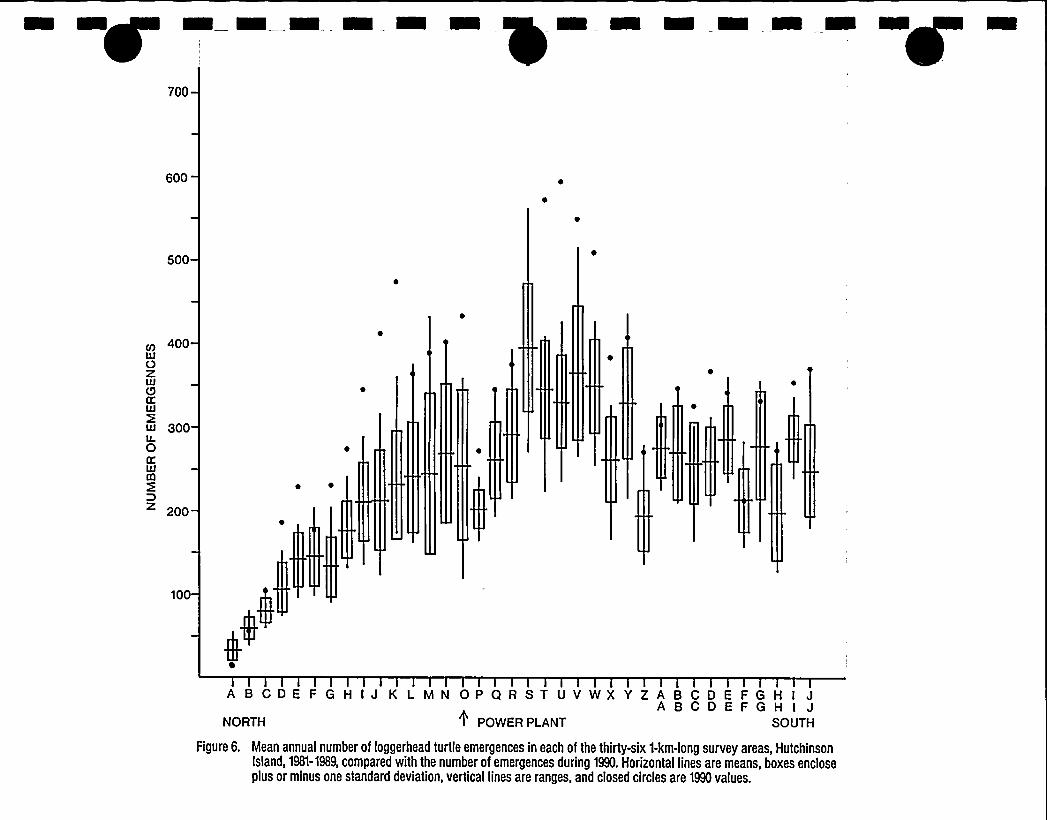
700
600
500
400
Oz
300
D200
~ ~
100
ABCDEFGHIJKLMNOPQRSTUVWXYZABCDEFGHIJABCDEFGH I JNORTH POWER PLANT SOUTH
Figure 6. Mean annual number of loggerhead turtle emergences in each of the thirty-six 1-km-long survey areas, HutchinsonIsland, 1981-1989, compared with the number of emergences during 1990. Horizontal lines are means, boxes encloseplus or minus one standard deviation, vertical lines are ranges, and closed circles are 1990 values.

I
I
I
I
I
II
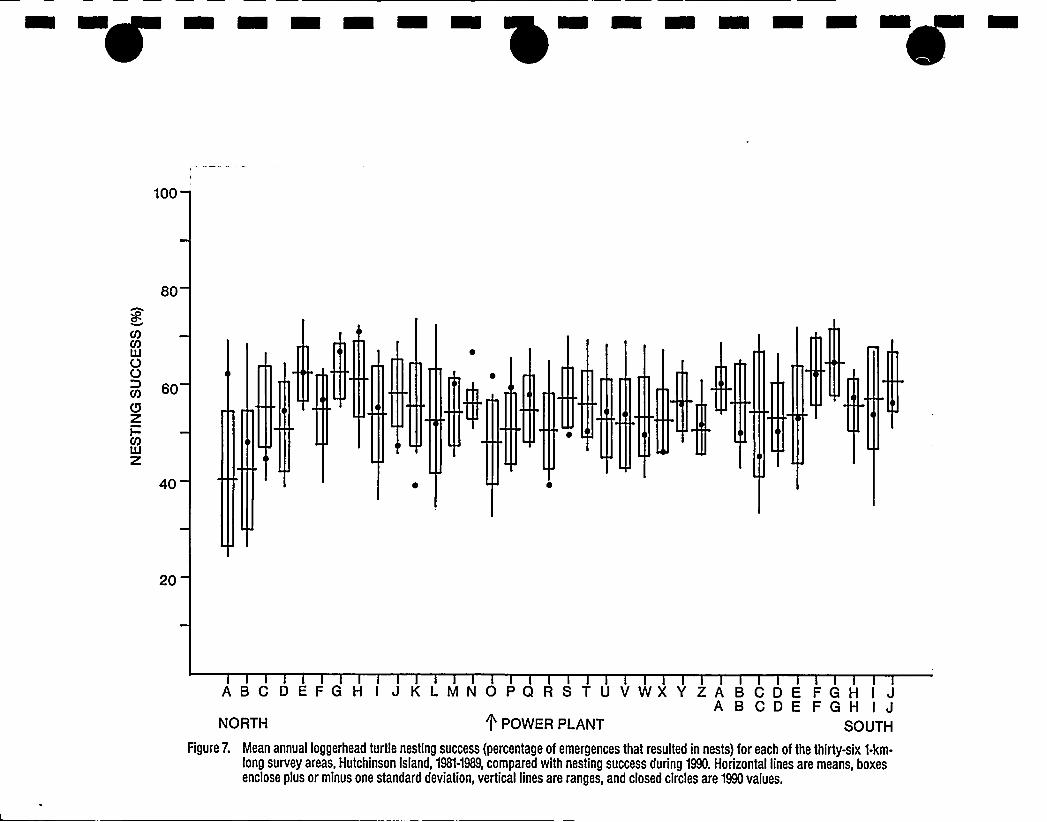
100
80
gM(0LIJOOP) 60(9ZI-0)ILJZ
40
20
ABC DEFGH I JKLMNOPQRSTUVWXYZABCDEFGH I JA B CDE FGH I J
NORTH 0 POWER PLANT SOUTH
Figure 7. Mean annual loggerhead turtle nesting success (percentage of emergences that resulted in nests) for each of the thirty-six 1-km-long survey areas, Hutchinson Island, 1981-1989, compared with nesting success during 1990. Horizontal lines are means, boxesenclose plus or minus one standard deviation, vertical lines are ranges, and closed circles are 1990 values.
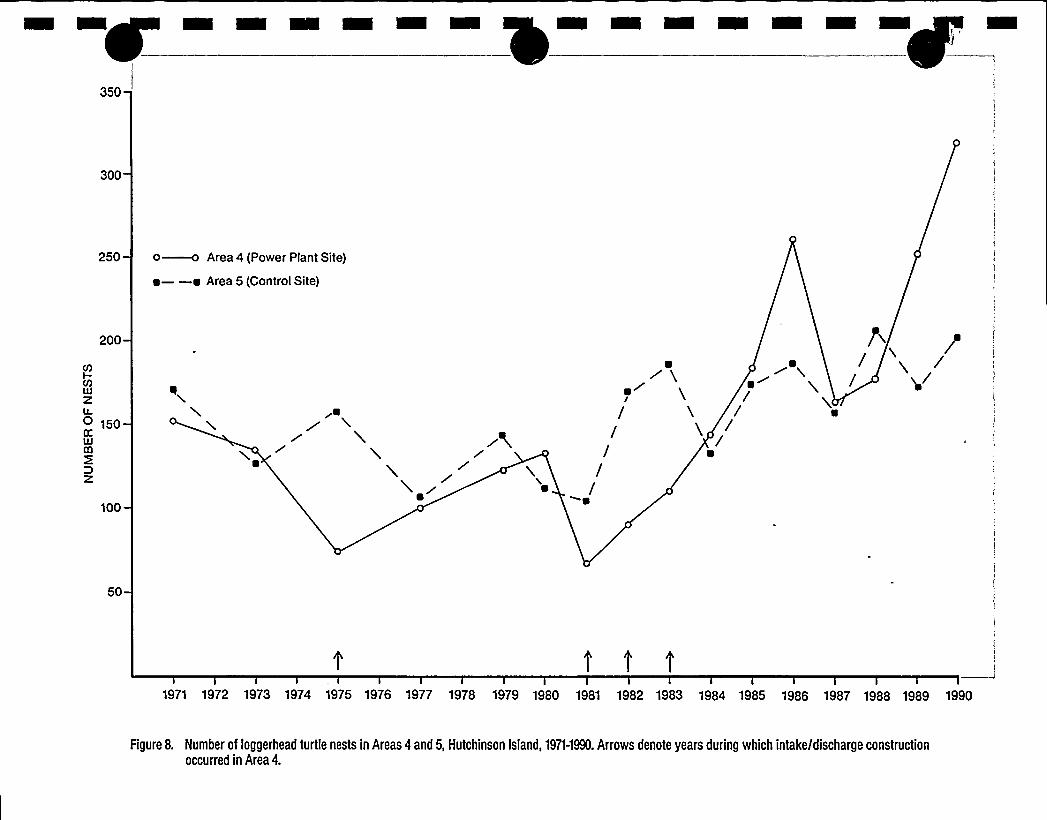
300
250 o—o Area 4 (Power Plant Site)
e ——~ Area 5 (Control Site)
200
V)I-
Z0 150
Dz
100
~O
r%rr
/ //
/ // /
//
50
T T T
1971 1972 1973 1974 1975 1976 1977 1978 1979 1980 1981 1982 1983 1984 1985 1986 1987 1988 1989 1990
Figure 8. Number of ioggerhead turtle nests in Areas 4 and 5, Hutchinson Isiand, 1971-1990. Arrows denote years during which intake/discharge constructionoccurred in Area 4.

I
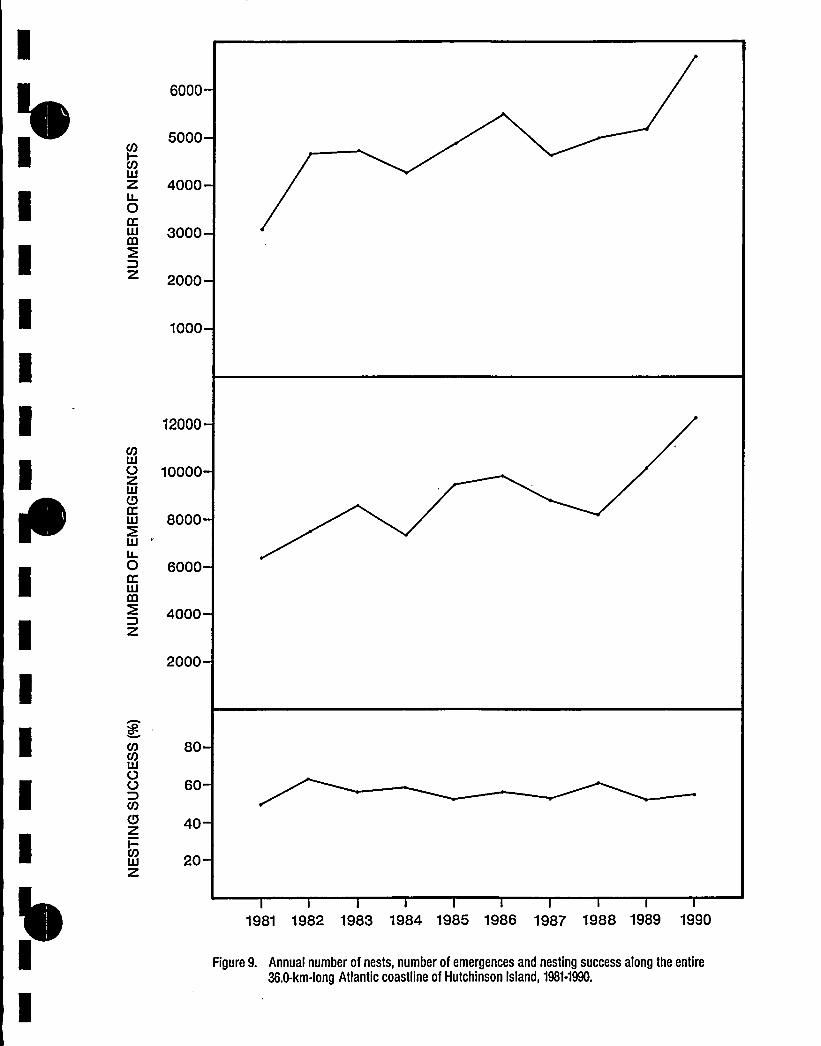
6000
CD
(DI-
z
Dz
5000
4000
3000
2000
1000
CD
Oz
0CC
Dz
12000
10000
8000
6000
4000
2000
gCDCOLIJOO(0(9zCDUJ
80
60
40
20
1981 1982 1983 1984 1985 1986 1987 1988 1989 1990
Figure 9. Annual number of nests, number of emergences and nesting success along the entire36.0-km-long Atlantic coastline of Hutchinson Island, 198t-1990.
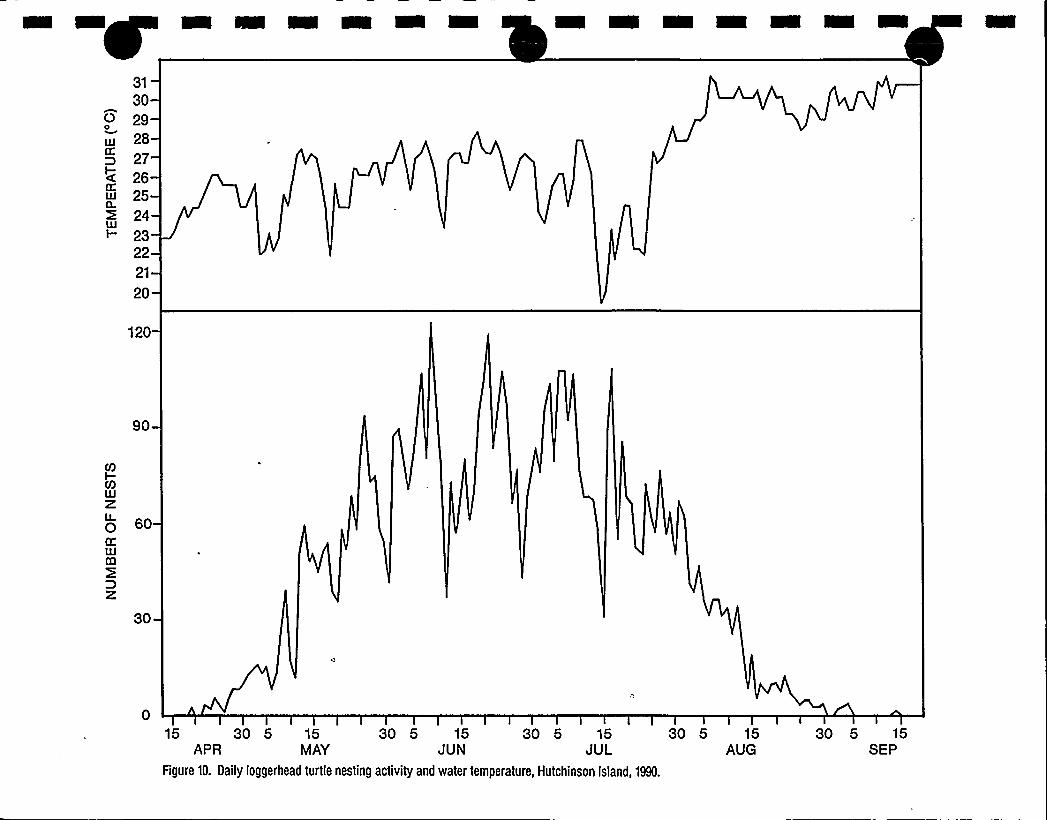
31
30O 29
28
5 272625
Q.24
2322
21
20
120
90
(0
z0 60
z30
30 5 15 30 5 15 30 5 15APR MAY JUN JUL
Figure 10. Daily loggerhead turtle nesting activity and water temperature, Hutchinson Island, 1990.
30 5 15AUG
30 5 15SEP
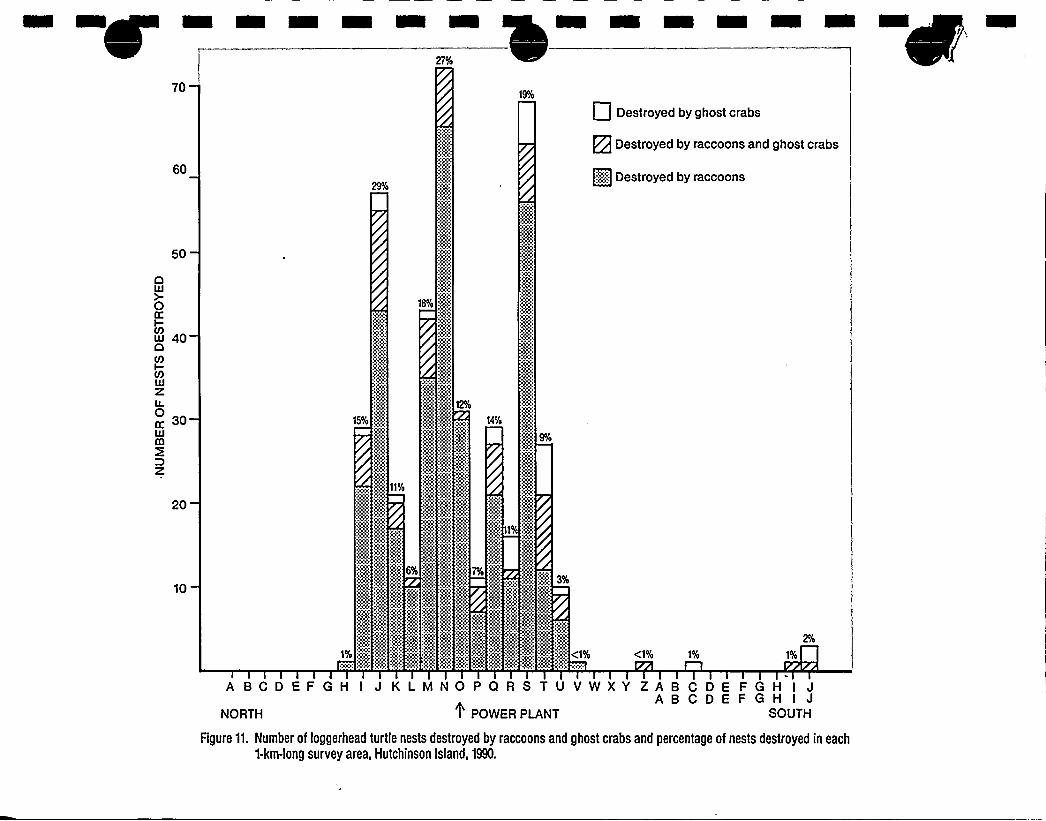
27%
70
60
Destroyed by ghost crabs
g Destroyed by raccoons and ghost crabs
Q Destroyed by raccoons
50
O0-0KI-Uj 40O
(0I-(0
z
rt- 30
Dz
20
10
15%
.? ~V
xm:('?iAMh((
.:9X'~e
gZps:K(:N<:e.'.
gg.r,'(?
Fp
?'m
~$+
11%
Y??
r','m
y~?(
m,:(
g~
18%
r'(
I(
pj
mr~'r'.
.vÃ
r'.
rg~
b;
s(:r.
ggC
i(5'$
.:
:$p~.?s?
:.'$p
$j~
g>?~PI
5%?.
'A'(iM:
'A?
g(;@A;
('(?
g(??.:
N~??jPAQsE(g?gr.m(mi
14%
Wg'k
g$ .
$yg?g
mme
E(.:VP8:.
:~a??
::,g:)>%
!4~
?>?:'(pY,
~4'.
($NScYA(
Ã~(??
AP
g.(g'.
?'.s
pi'g~
Q4?ih
(1%rr:.
(1% 1%
2'/o
A BCD EF GH I J KLMNOPQRS TU VWXY ZAB CDE FGH I JABCDEFGH I JNORTH 0 POWER PLANT SOUTH
Figure 11. Number of loggerhead turtle nests destroyed by raccoons and ghost crabs and percentage of nests destroyed in each1-km-long survey area, Hutchinson Island, 1990.
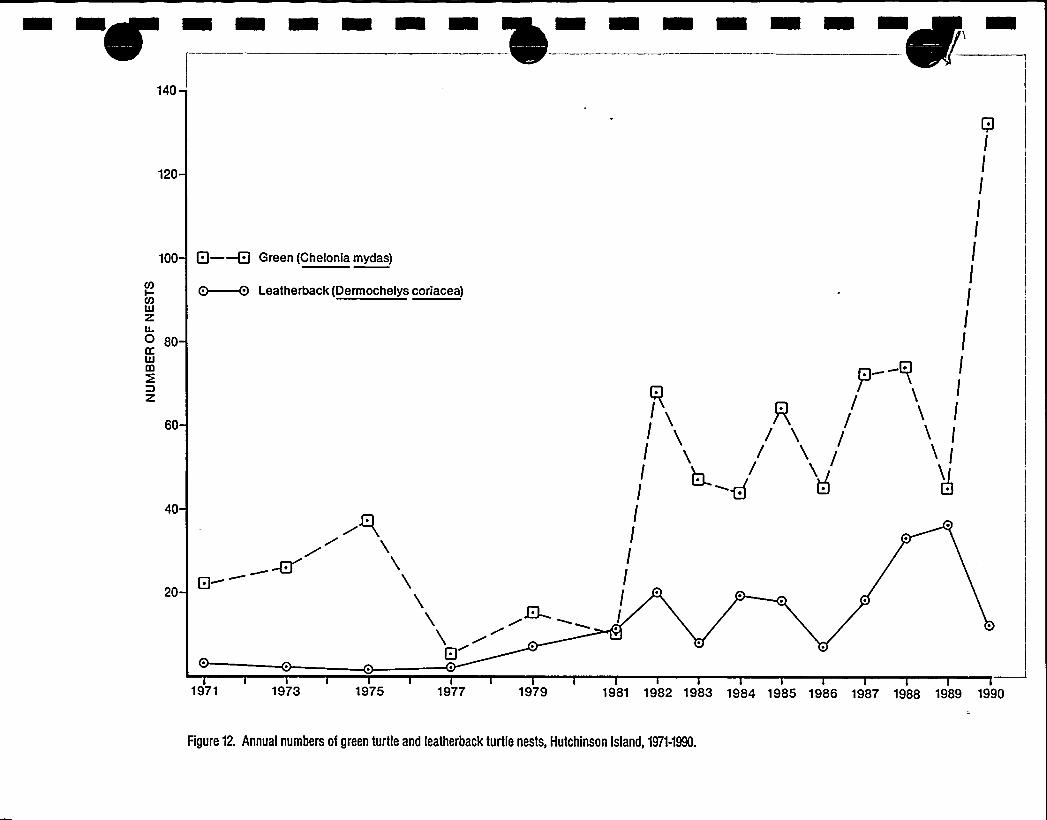
140
120
100
COI
zO 80
z
60
40
20
Q——Q Green (Chelonia mydas)
O—~ Leatherback (Dermochelys coriacea)
pQ
pH
go
I
I
I
I
I
I
lI
I
I
p q I
I
/ x II iI y / X
g
IIIIII
1971 1973 1975 1977 1979 1981 1982 1983 1984 1985 1986 1987 1988 1989 1990
Figure 12. Annual numbers of green turtle and leatherback turtle nests, Hutchinson Island, 1971-1990.
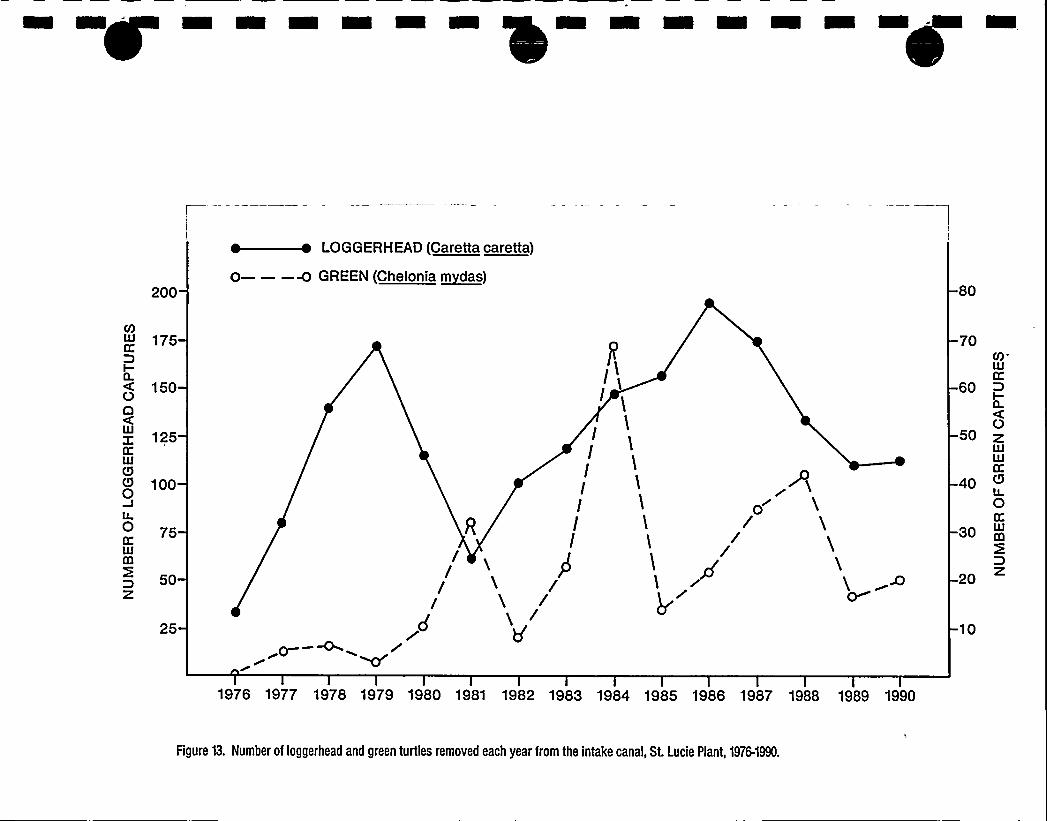
200
~—e LOGGERHEAD (Caretta caretta)
0——-w GREEN (Chelccia m~das)80
175
150
O
125K
100
75
50z
25
//
//
r0
II
IIII
pi\
'I
708
60
O50 z
40 (9
30 mm
D20
10
1976 1977 1978 1979 1980 1981 1982 1983 1984 1985 1986 1987 1988 1989 1990
Figure 13. Number of loggerhead and green turtles removed each year from the intake canal, St. Lucie Plant, 19764990.

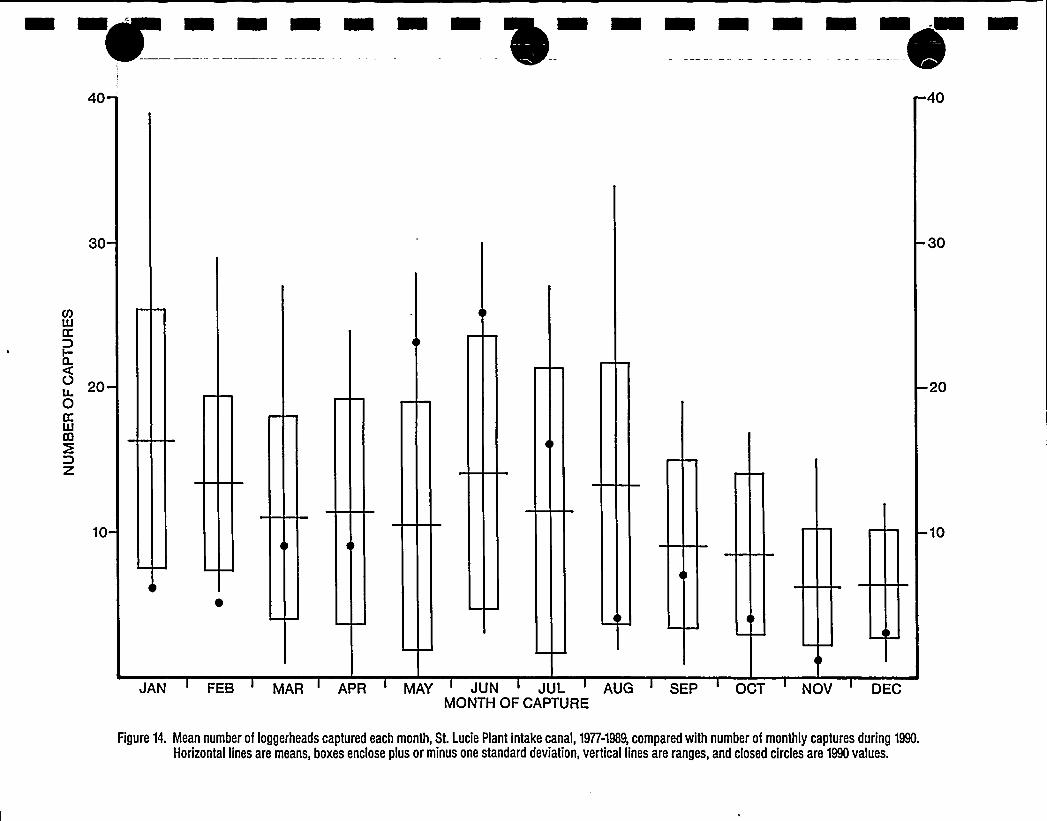
40 40
30 30
I-
20
z
20
10 10
JAN FEB MAR APR MAY JUN JUL AUG SEP OCT NOV DECMONTH OF CAPTURE
Figure 14. Mean number of loggerheads captured each month, St. Lucie Plant intake canal, 1977-1989, compared with number of monthly captures during 1990.
Horizontal lines are means, boxes enclose plus or minus one standard deviation, vertical lines are ranges, and closed circles are 1990 values.

I
I
I
I
I
II
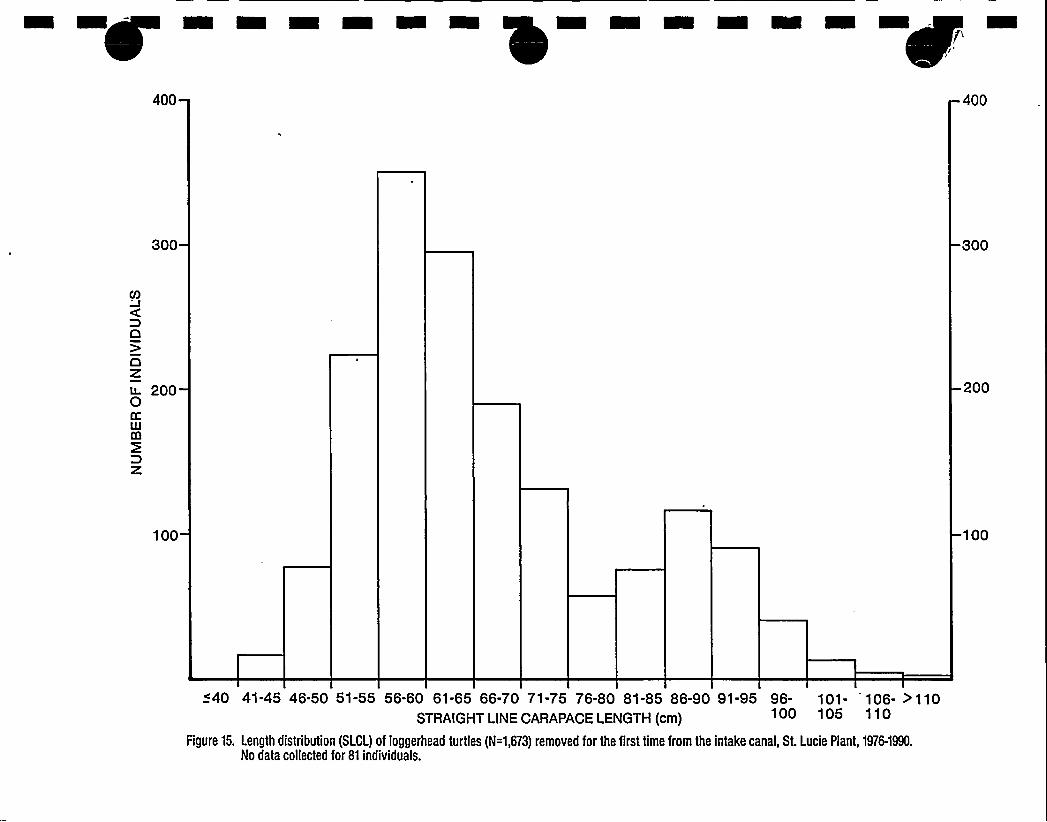
400 400
300 300
(0
DO)0zu- 2000KUJlZl
Dz
200
100 100
~40 41-45 46-50 51-55 56-60 61-65 66-70 71-75 76-80 81-85 86-90 91-95 96- 101- 106- >110STRAIGHT LINE CARAPACE LENGTH (cm) 100 105 110
Figure 15. Length distribution (SLCL) of loggerhead turtles (N=1,673) removed for the first time from the intake canal, St. Lucie Plant, 1976-1990.
No data collected for 81 individuals.
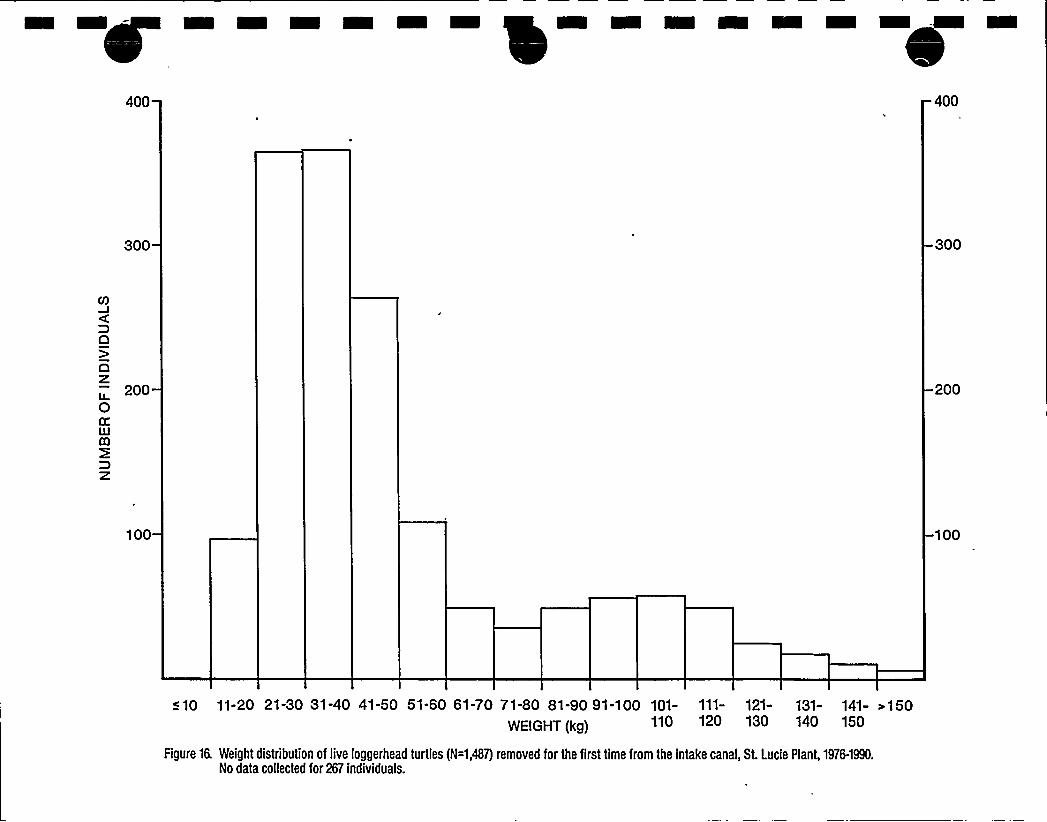
400 400
300 300
(0
DO)DZ
2000KIllCO
DZ
200
100 100
+10 11-20 21-30 31-40 41-50 51-60 61-70 71-80 81-90 91-100 101- 111- 121- 131- 141- i150'I/EiGHT (kg) 110 120 130 140 150
Figure 1L Weight distribution of live loggerhead turtles (¹1,487) removed for the first time from the intake canal, St. Lucie Plant, 1976-1990.No data collected for 267 individuals.
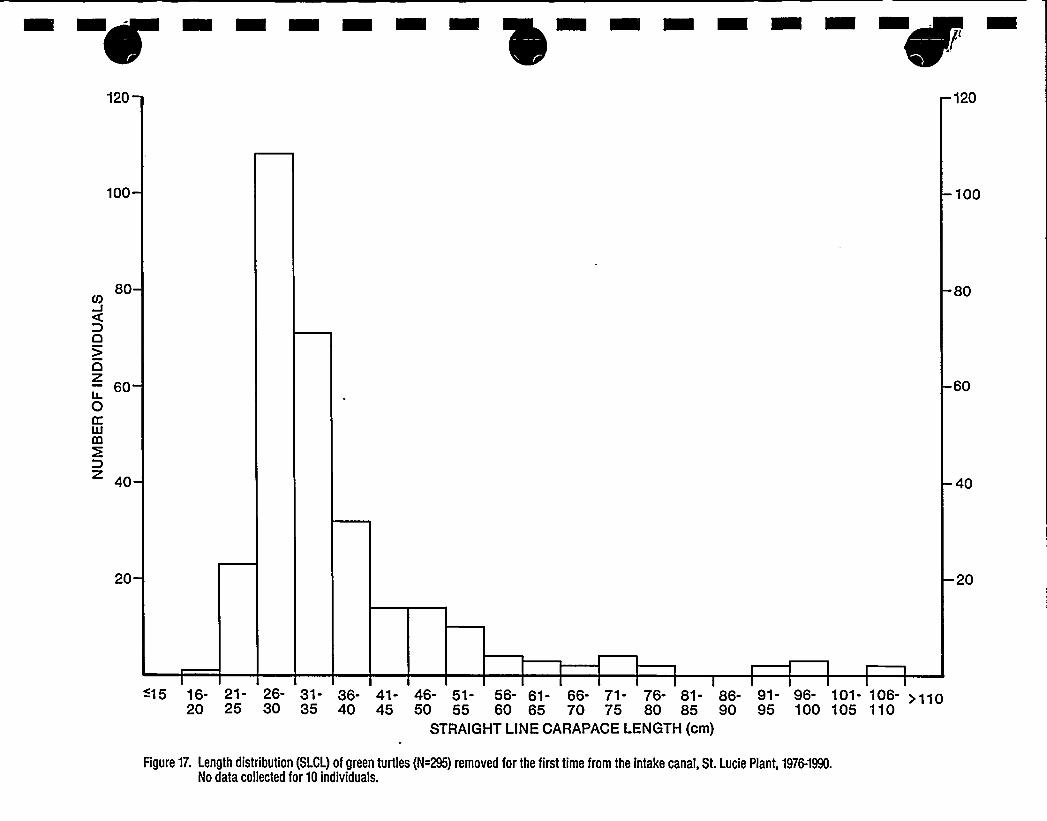
120 120
100 100
80CO
D0)0
600K(9
40
80
60
40
20 20
-15 16- 21- 26- 31- 36- 41- 46- 51- 56- 61- 66- 71- 76- 81- 86- 91- 96- 101- 106- > 11020 25 30 35 40 45 50 55 60 65 70 75 80 85 90 95 100 105 110
STRAIGHT LINE CARAPACE LENGTH (cm)
Figure 17. Length distribution (SLCL) of green turtles (N=295) removed for the first time from the intake canal, St. Lucie Plant, 1976-1990.No data collected for 10 individuals.
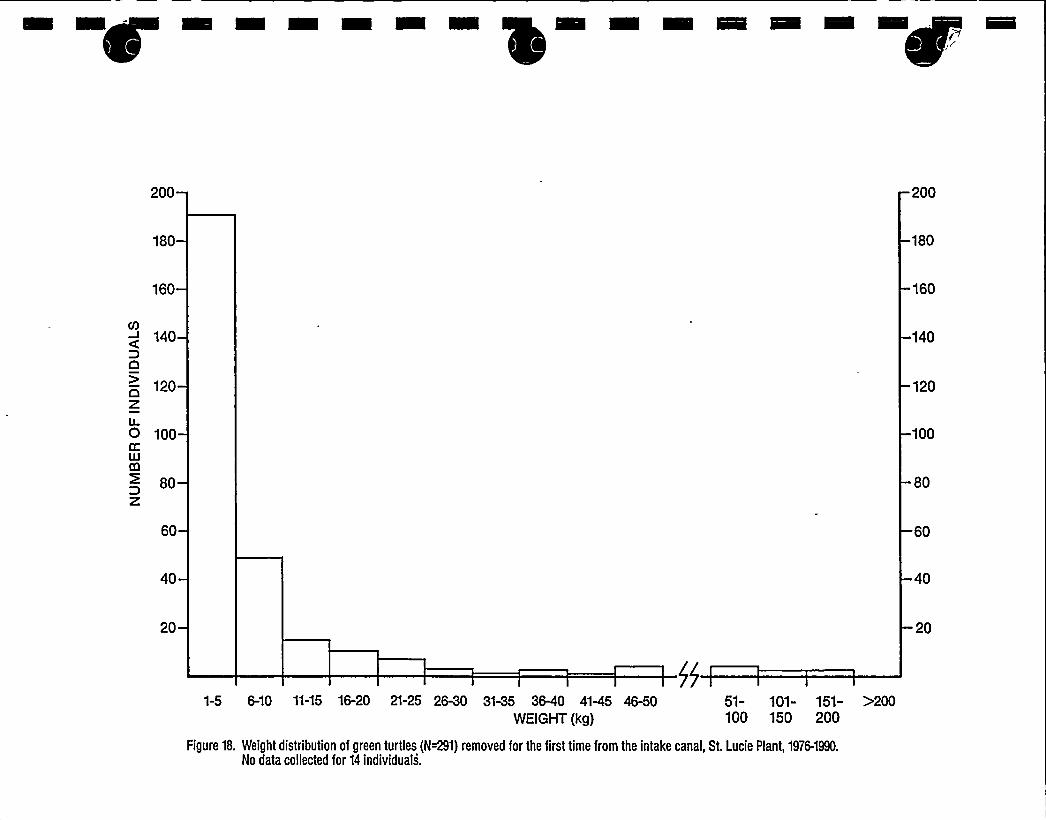
200 200
180 180
160 160
(D140
D9
120Dz0 100
80z
60
140
120
100
80
60
40 40
20 20
1-5 6-10 11-15 16-20 21-25 26-30 31-35 36-40 41-45 46-50 51- 101- 151- )200WEIGHT (kg) 100 150 200
Figure 18. Weight distribution of green turtles (N=291) removed for the first time from the intake canal, St. Lucie Plant, 1976-1990.
No data collected for 14 individuals.
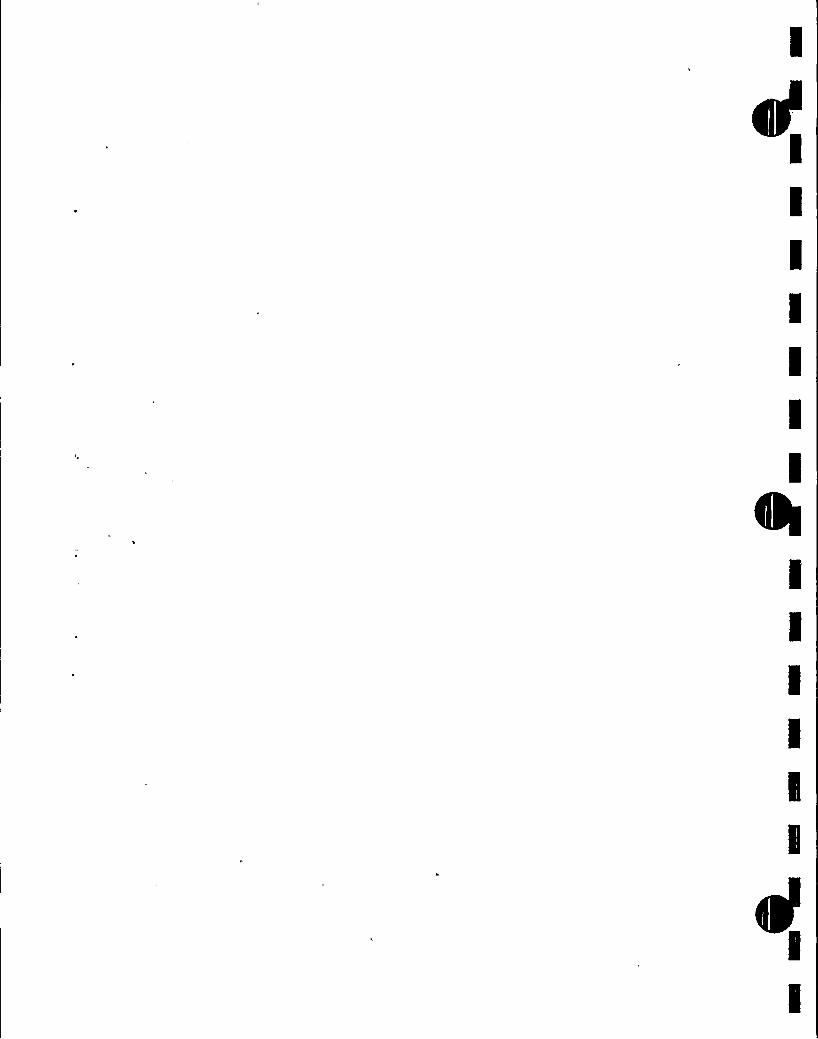
I
II
I
I
I
II
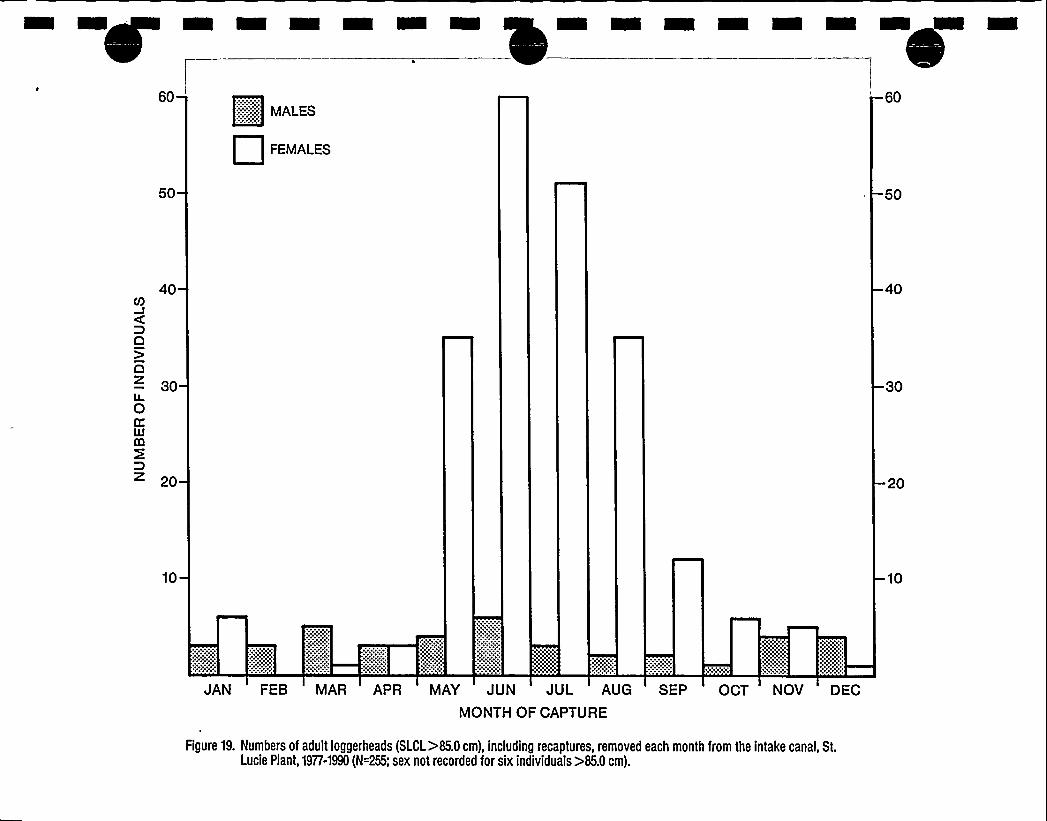
MALES
FEMALES
60
50 50
40V)
DCI
030
0KILJK
Dz 20
40
30
20
10 10
JAN FEB MAR APR MAY JUN JUL AUG SEP OCT NOV DEC
MONTH OF CAPTURE
Figure 19. Numbers of adult loggerheads (SLCL)85.0 cm), including recaptures, removed each month from the intake canal, St.Lucie Plant, 1977-1990 (N=255; sex not recorded for six individuals)85.0 cm).
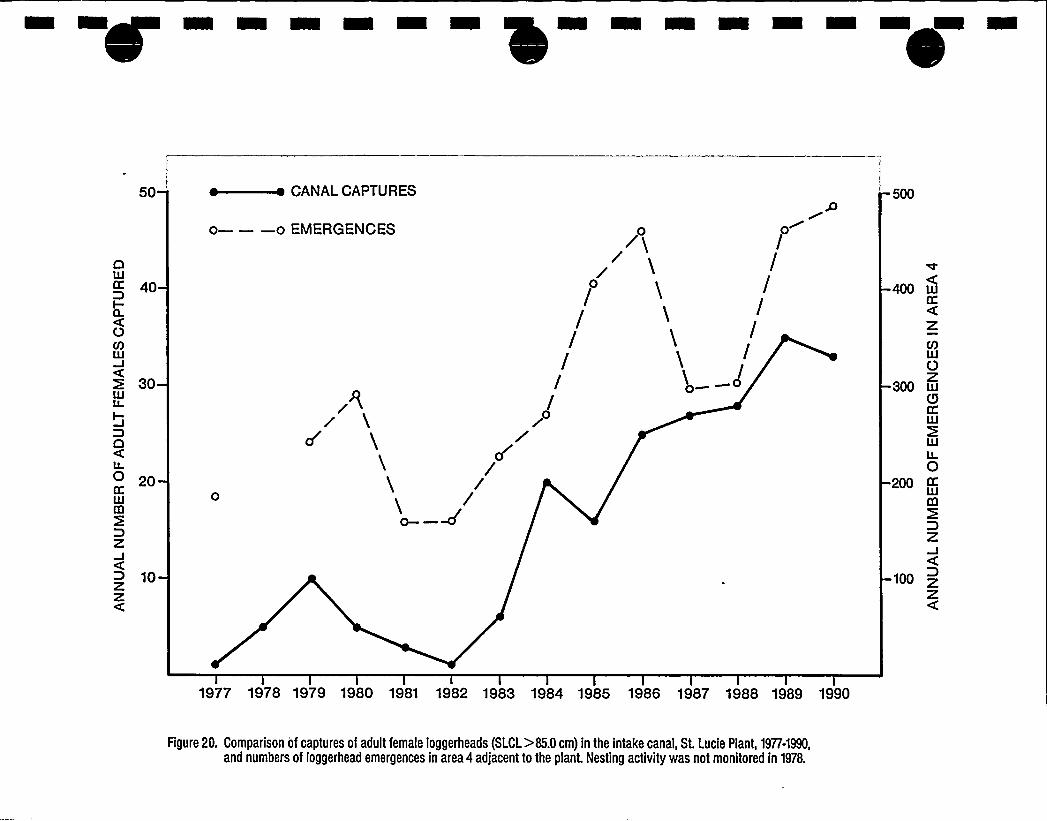
50 ~—e CANALCAPTURES 500
40
30
20
10
o———o EMERGENCES 0 0//
/// /
] y/
/ /
/r
/
400
300
200
100
ZV)
OzGK
0
z
zz
1977 1978 1979 1980 1981 1982 1983 1984 1985 1986 1987 1988 1989 1990
Figure 20. Comparison of captures of adult female loggerheads (SLCL >85.0 cm) in the intake canal, St. Lucie Plant, 1977-1990,and numbers of loggerhead emergences in area 4 adjacent to the plant. Nesting activity was not monitored in 1978.

JLJ
CC
I-CL
OCIJ
CJ
CIZ
0I-ZILJOIZILJQ.ILJ
I-
O
100
80
60
40
20'
100
80
60
40
20
10 20 30 40 50
DAYS BETWEEN FIRST SIGHTING AND CAPTURE
Figure 21. Capture efficiency, expressed as days between first sighting and capture, for loggerhead turtles entrapped in the intake canal, St. LuciePlant, April-December, 1990 (N=90).
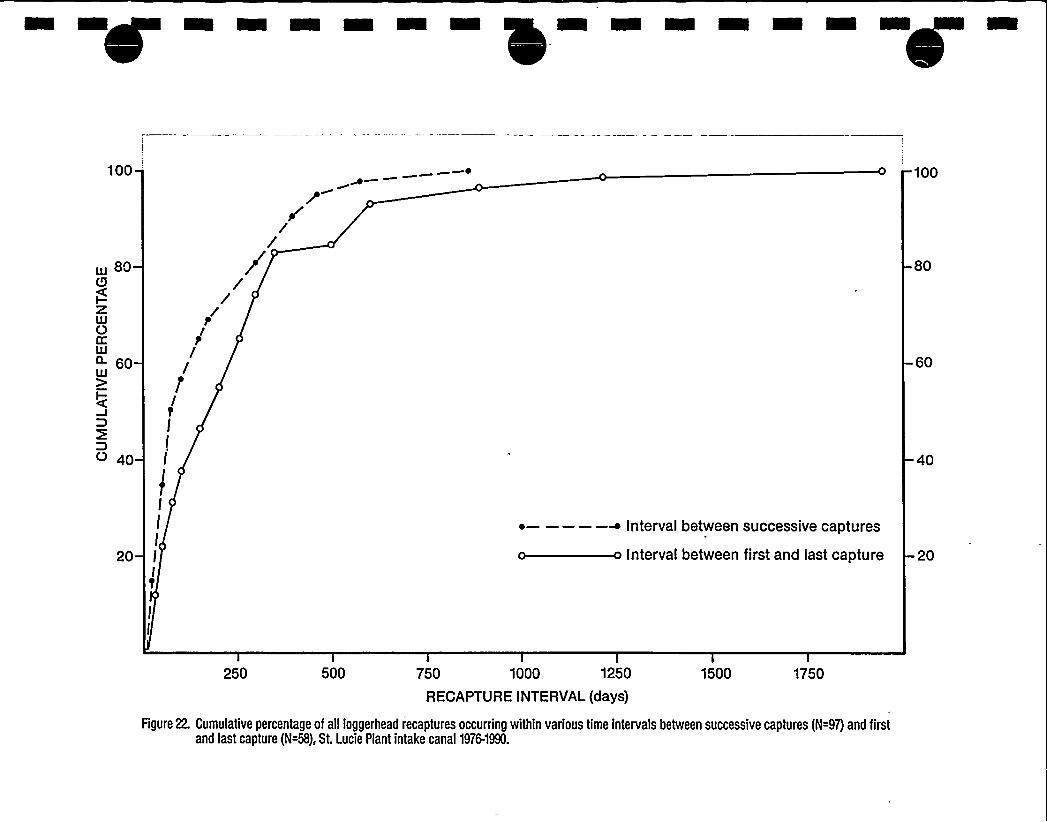
100 100
~ 80(9
z
a- 60
I-
D
D< 40
fIt//
/
80
60
40
20
I
I
IIIt
~—————~ Interval between successive captures
Interval between first and last capture 20
500250 1750750 1000 1250
RECAPTURE INTERVAL(days)
Figure 22. Cumulative percentage of all loggerhead recaptures occurring within various time intervals between successive captures (¹97j and firstand last capture (¹58), St. Lucie Plant intake canal 1976-1990.
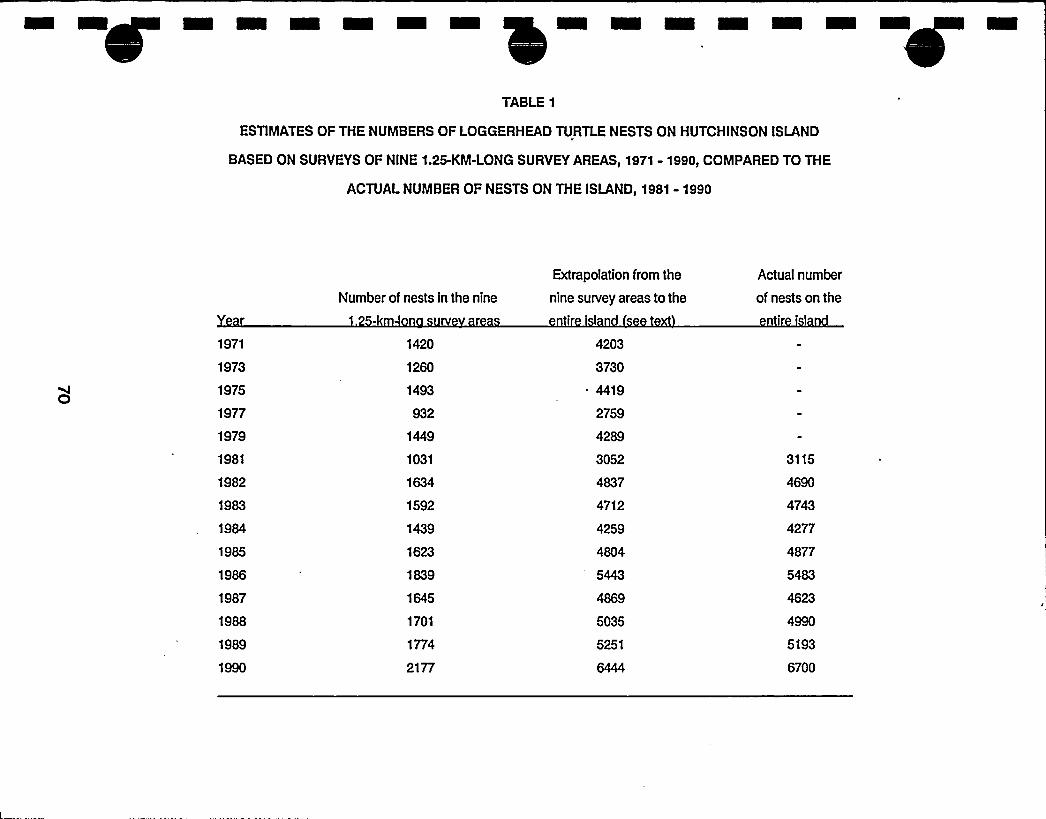
W
TABLE 1
ESTIMATES OF THE NUMBERS OF LOGGERHEAD TURTLE NESTS ON HUTCHINSON ISLAND
BASED ON SURVEYS OF NINE 1.25-KM-LONG SURVEY AREAS, 1971 - 1990, COMPARED TO THE
ACTUALNUMBER OF NESTS ON THE ISLAND, 1981 - 1990
1971
1973
1975
1977
1979
1981
1982
1983
1984
1985
1986
1987
1988
1989
1990
Number of nests in the nine
1420
1260
1493
932
1449
1031
1592
1439
1623
1839
1645
1701
1774
2177
Extrapolation from the
nine survey areas to the
i I
4203
3730
4419
2759
4289
3052
4837
4712
4259
4804
4869
5035
5251
Actual number
of nests on the
3115
4690
4743
4277
4877
5483
4623
5193
6700
I
I
I
II
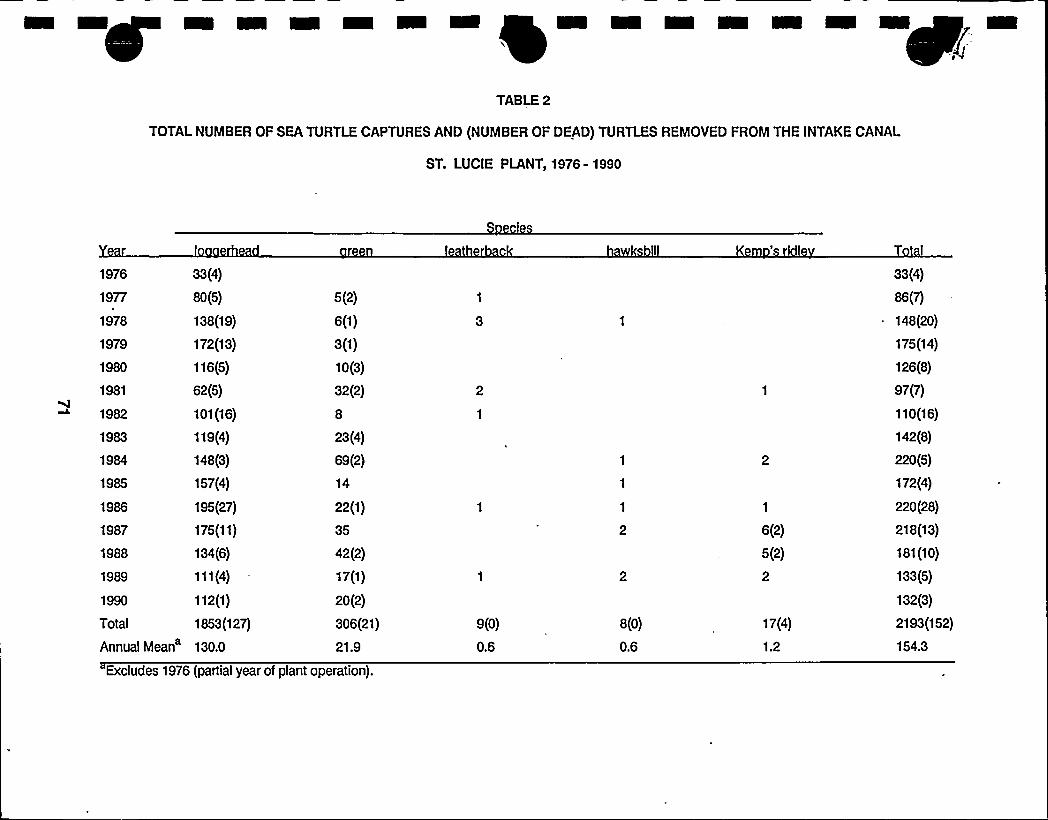
TABLE2
TOTALNUMBER OF SEA TURTLE CAPTURES AND (NUMBER OF DEAD) TURTLES REMOVED FROM THE INTAKECANAL
ST. LUCIE PLANT, 1976-1990
1976
1977
1978
1979
1980
1981
1982
1983
1984
1985
1986
1987
1988
1989
Total
Annual
Mean's(4)
80(5)
138(19)
172(13)
116(5)
62(5)
101(16)
119(4)
148(3)
157(4)
195(27)
175(11)
134(6)
111(4)
112(1)
1853(1 27)
130.0
5(2)
6(1)
3(1)
10(3)
32(2)
8
23(4)
69(2)
14
22(1)
35
42(2)
17(1)
20(2)
306(21)
21.9
9(0)
0.6
w ill
8(0)
0.6
Km'l
1
6(2)
5(2)
2
17(4)
1.2
ss(4)
86(7)
148(20)
175(14)
126(8)
97(7)
110(16)
142(8)
220(5)
172(4)
220(28)
218(13)
181 (10)
133(5)
1s2(s)
2193(1 52)
154.3
Excludes 1976 (partial year of plant operation).
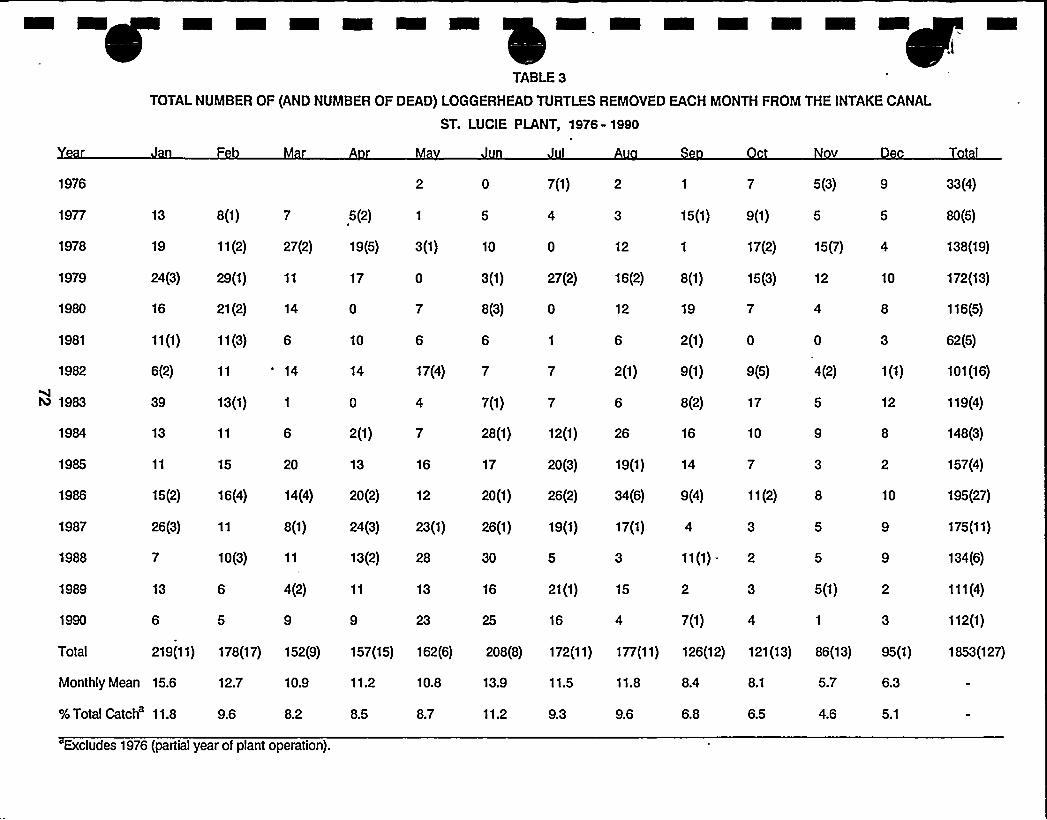
TABLE3
TOTALNUMBER OF (AND NUMBER OF DEAD) LOGGERHEAD TURTLES REMOVED EACH MONTH FROM THE INTAKECANAL
ST. LUCIE PLANT, 1976-1990
1976
1977 13 s(1)
2 0
7 5(2) 1 5
7(1) 7 5(3)
15(1) 9(1) 5
9 33(4)
5 80(5)
1978 19 11(2) 27(2) 19(5) 3(1) 10 12 17(2) 15(7) 4 138(19)
1979
1980
1981
1982
4& 1983
1984
1985
1986
1987
1988
1989
1990
24(3) 29(1) 11 17 0 3(1)
16 21(2) 14 0 7 8(3)
11(1) 11(3) 6 10 6 6
27(2) 16(2) 8(1)
12 19
2(1)
15(3) 12
7 4
0 0
6(2) 14 14 17(4) 7 2(1) 9(1) 9(5) 4(2)
39
13
13(1) 0 4 7(1)
6 2(1) 7 28(1) 12(1) 26
s(2)
16
15 20 13 16 17 20(3) 19(1) 14
26(3) 8(1) 24(3) 23(1) 26(1) 19(1) 17(1)
17 5
10 9
7 3
11(2) 8
3 5
10(3) 11 13(2) 28 30 11(1) - 2 5
4(2) 11 13 16
9 9 23 25
21(1) 15
16 7(1)
3 5(1)
4 1
15(2) 16(4) 14(4) 20(2) 12 20(1) 26(2) 34(6) 9(4)
10 172(13)
8 116(5)
3 62(5)
1(1) 101(16)
12 119(4)
8 148(3)
2 157(4)
10 195(27)
9 175(11)
9 134(6)
2 111(4)
3 112(1)
Total 219(11) 178(17) 152(9) 157(15) 162(6) 208(8) 172(11) 177(11) 126(12) 121 (13) 86(13) 95(1) 1853(127)
Monthly Mean 15.6
%Total Catch 11.8
12.7
9.6
11.5
8.2 8.5 8.7 11.2 9.3
10.9 1 1.2 10.8 13.9 11.8
9.6
8.4
6.8 6.5 4.6
8.1 5.7 6.3
5.1
eludes 1976 (partial year of plant operation).
I
I
II
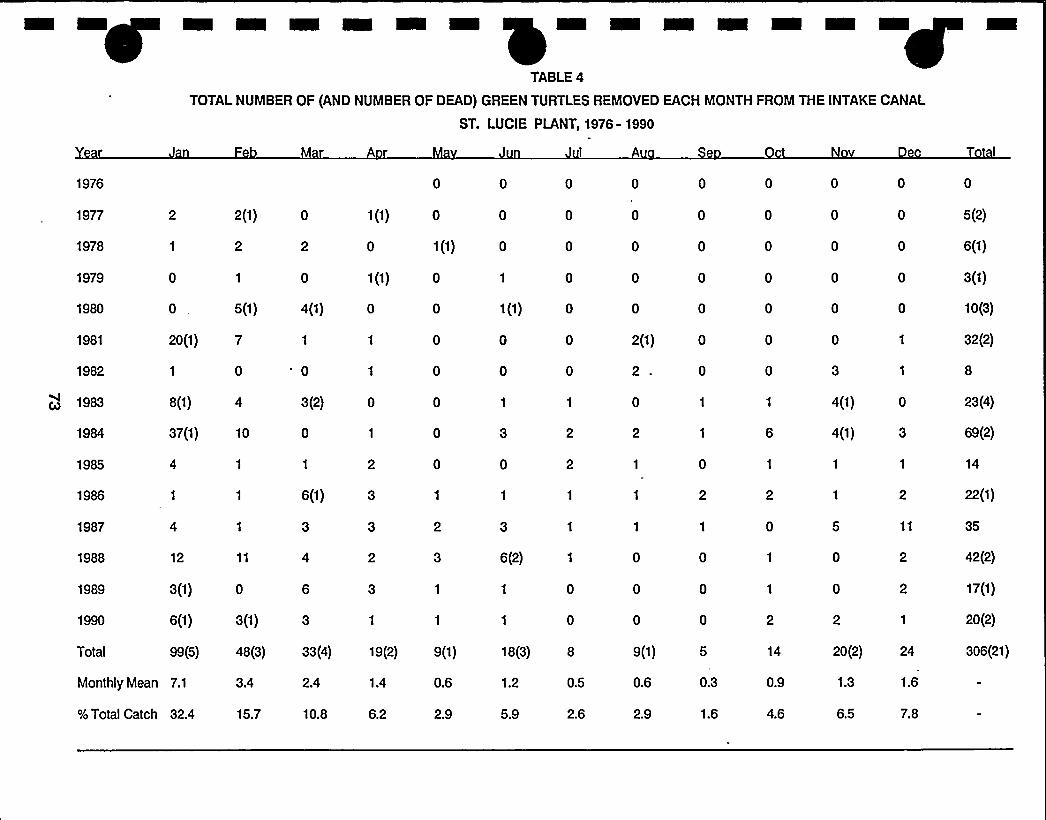
TABLE4
TOTALNUMBER OF (AND NUMBER OF DEAD) GREEN TURTLES REMOVED EACH MONTH FROM THE INTAKECANAL
ST. LUCIE PIANT, 1976-1990
1976
1977
1978
1979
1980
1981
1982
1983
1 0 0 1
8(1) 4 3(2)
2 2(1) 0 1(1) 0
1 2 2 0 1(1)
0 1 0 1(1) 0
0, 5(1) 4(1) 0 0
20(1) 7 1 1 0
0 0
0 0
0 0
1 0
1(1) 0
0 0
0 0
0 0
0 0
0 0
2(1) 0
2 . 0
4(1)
5(2)
6(1)
3(1)
10(3)
32(2)
23(4)
1984
1985
37(1) 10
4 1 1 2
1986 1 1 6(1) 3 1
1987 4 1 3 3 2
1988
1989
1990
Total
12 11 4 2 3
3(1) 0 6 3 1
6(1) 3(1) 3 1 1
99(5) 48(3) 33(4) 19(2) 9(1)
Monthly Mean 7.1 3.4 2.4 1.4 0.6
2.9% Total Catch 32.4 15.7 10.8 6.2 5.9 2.6
0 2
1 1
3 1
6(2) 1
1 0
1 0
18(3) 8
1.2 0.5
9(1)
0.6
2.9
0.3
1.6
14
0.9
4.6
4(1)
5 11
0 2
0 2
2 1
20(2) 24
1.3 1.6
6.5 7.8
69(2)
14
22(1)
35
42(2)
17(1)
20(2)
306(21)
I
III
II
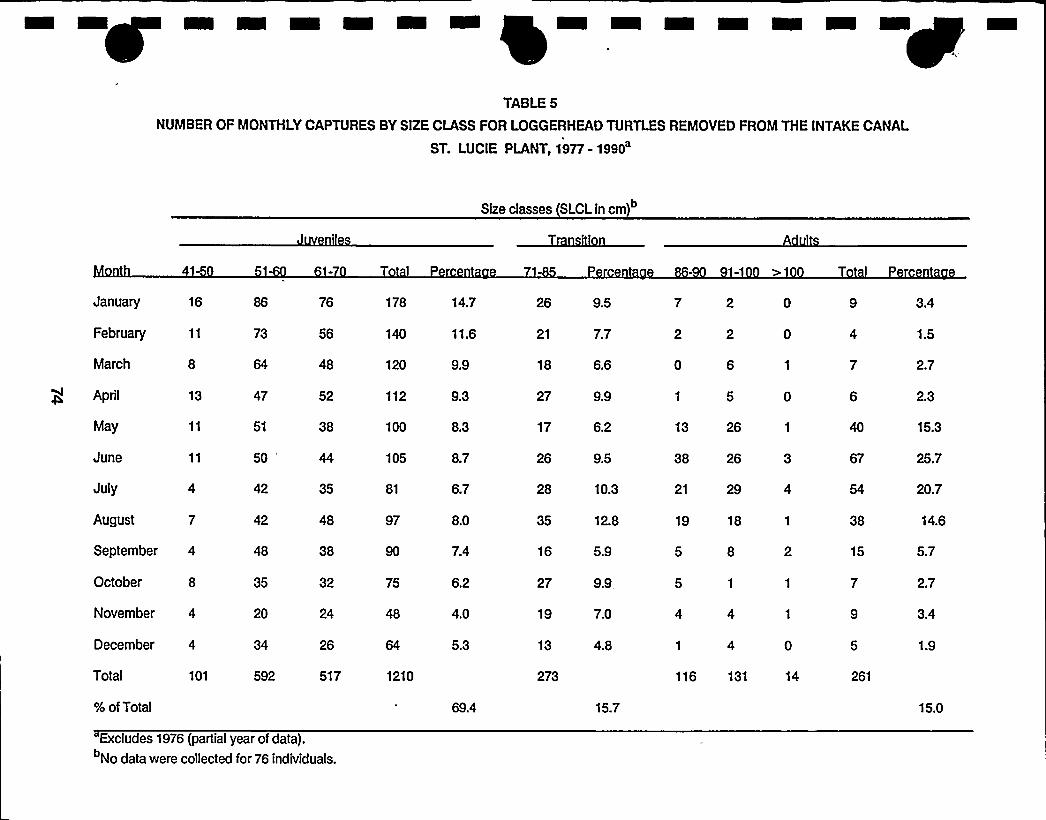
TABLE5
NUMBER OF MONTHLYCAPTURES BY SIZE CLASS FOR LOGGERHEAD TURTLES REMOVED FROM THE INTAKECANAL
ST. LUCIE PLANT, 1977-1990
Size classes SLCL in cm)
January
February
March
16
April
May
June
13
Total 101
% of Total
July
August
September 4
October 8
November 4
December 4
73
47
51
50'2
42
48
35
20
34
592
76
56
48
52
38
35
48
38
32
24
26
517
178
120
112
100
105
81
97
75
48
1210
14.7
11.6
9.9
9.3
8.3
8.7
6.7
8.0
7.4
6.2
4.0
5.3
69.4
26
21
18
27
17
26
28
35
16
2?
19
13
273
9.5
7.7
6.6
99
6.2
9.5
10.3
12.8
5.9
99
7.0
4.8
15.7
7 2 0
2 2 0
0 6 1
5 0
13 26 1
38 26 3
21 29 4
19 18 1
5 8 2
5 1 1
4 4
1 4 0
116 131 14
40
67
38
15
261
3.4
1.5
2.7
2.3
15.3
25.7
20.7
14.6
5.7
2.7
3.4
1.9
15.0
Excludes 1976 (partial year of data).
No data were collected for 76 individuals.
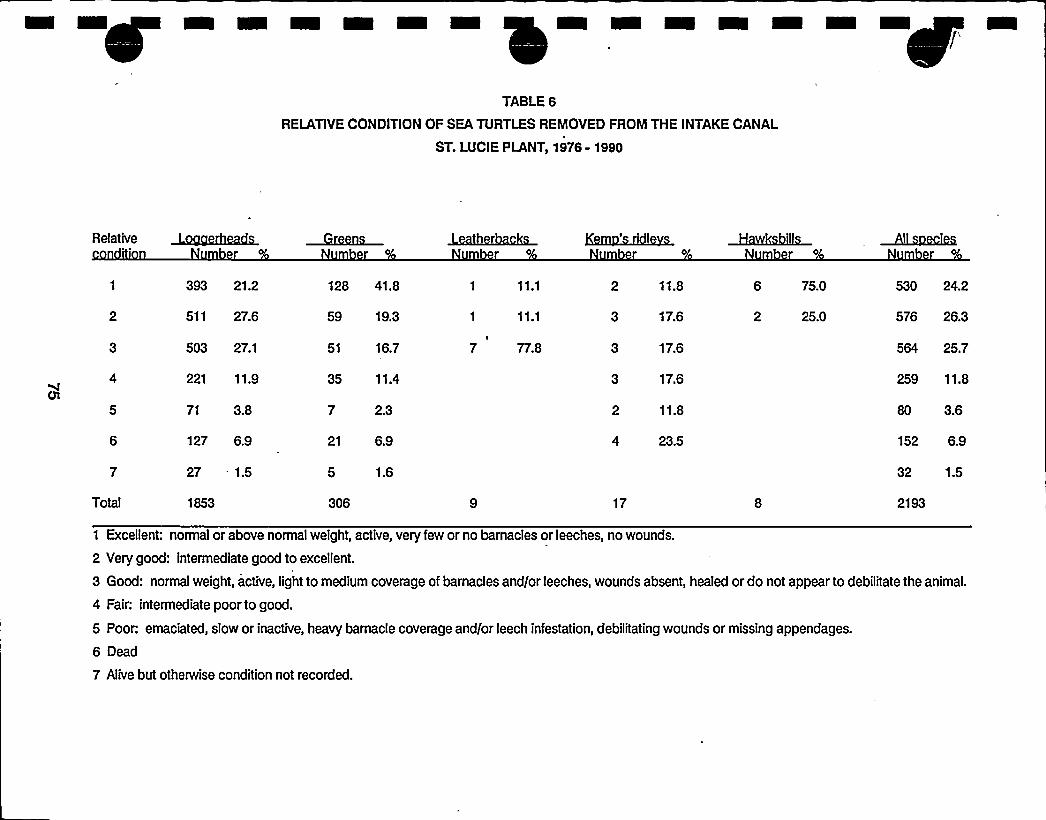
TABLE6
RELATIVECONDITION OF SEA TURTLES REMOVED FROM THE INTAKECANAL
ST. LUCIE PLANT, 1976- 1990
Relative
Total
393 21.2
511 27.6
503 27.1
221 11.9
71 3.8
127 6.9
27 1.5
1853
128 41.8
59 19.3
51 16.7
35 11.4
7 2.3
21 6.9
5 1.6
306
1 11.1
1 11.1
7 77.8
2 11.8
3 176
3 176
3 176
2 11.8
4 23.5
17
75.0
25.0
530 24.2
576 26.3
564 25.7
259 11.8
80 3.6
152 6.9
32 1.5
2193
1 Excellent: normal or above normal weight, active, very few or no barnacles or leeches, no wounds.
2 Very good: intermediate good to excellent.
3 Good: normal weight, active, light to medium coverage of barnacles and/or leeches, wounds absent, healed or do not appear to debilitate the animal.
4 Fair: intermediate poor to good.
5 Poor: emaciated, slow or inactive, heavy barnacle coverage and/or leech infestation, debilitating wounds or missing appendages.
6 Dead
7 Alive but otherwise condition not recorded.
I
I
II