International Conference on Emerging Technology Trends on Advanced Engineering Research (ICETT’12)
Proceedings published by International Journal of Computer Applications® (IJCA)
38
Statnamic Test on Piles
Swaroopa Sail
Post-graduate Student Goa College of Engineering
Farmagudi, Ponda-Goa
C.S. Gokhale Head of Department
Goa College of Engineering Farmagudi, Ponda-Goa
Manasi S. Mungi Post-graduate Student
Goa College of Engineering Farmagudi, Ponda-Goa
ABSTRACT
The statnamic pile load test combines the advantages of both
static and dynamic load tests. It is performed to test a pile’s
capacity and uses a rapid compressive loading method. The
applied load, acceleration, and displacements are measured
using load cells, accelerometers, and displacement transducers
with a stationary laser reference. The statnamic device
consists of a large mass, combustion chamber, and a catch
system of some sort. The force applied to the pile is produced
by accelerating a mass upward. This is done by firing a rapid-
burning propellant fuel within the combustion chamber, which
applies equal force to the mass and to the pile. After the fuel is
burned the gas port is opened, this allows the duration of the
load pulse to be long enough to keep the pile in compression
throughout the test (maintains rigid body). During the loading
cycle, which is only a fraction of a second, over 2000 readings
are taken of the load and displacement and the data are stored
in a data-acquisition unit. The mass is caught as it falls by a
gravel catch or mechanical tooth catch before it impacts the
pile. The load–displacement curves generated are used to
determine the equivalent static force from the measured
statnamic force using the unloading point method.
Keywords
Static load test, Statnamic load test, Dynamic load test, Rapid
load test.
1. INTRODUCTION Statnamic Test on Piles is a new method of testing piles.
Statnamic load testing has been used extensively all over the
world on bridges, high rise structures, office towers, military
facilities, Corps of Engineers, flood control structures, water
and wastewater facilities and various other commercial
structures. Statnamic is a combination of 2 words "static &
dynamic”, which is a new way to test pile capacity of deep
foundations with loading period of around 200 milliseconds.
2. LOAD TESTS
2.1 Static Load Test Static compressive load testing involves the placement of a
large, stationary load on top of a foundation element. It is then
left for a specified length of time and settlement is recorded.
The Static load test is administered following ASTM D1143-
81, and these guidelines inherently create restrictions on the
testable size and capacity. One major limitation of the static
test is the proximity restrictions of reaction piles or anchors
which is determined by the diameter of the test pile.
According to the test standard, the reaction anchors should be
placed no closer than five diameters of the test pile to
minimize the interference in zones of influence. As a result,
larger shafts would require very long clear span reaction
beams. For example, a 6´ diameter drilled shaft would require
a 60´ reaction beam (five diameters away on either side).
Further, the reaction beam would need to resist even larger
loads. A 1500 ton static load is a practical upper limit with
extreme cases of up to 3500 tons. Supplying and placing such
a beam and load combination increases the cost of the test.
Such tests would require weeks of preparation, which further
increases the cost.
2.2 Dynamic Load Test Dynamic testing is usually associated with driving piles
(ASTM D4945-00). When it is applied to drilled shafts, it is
termed a drop hammer test. Therein, a steel mass is dropped
from a prescribed distance in order to impart a sufficient
force. The impact induces tensile stresses that are not well
tolerated by drilled shafts constructed of reinforced concrete.
This type of test is best when applied to driven piles made of
steel, wood, or prestressed concrete. Concrete piles have not
always used prestressed concrete, however, the reinforced
concrete counterparts were heavily reinforced (2% steel), far
exceeding the reinforcement of typical drilled shafts (1%
steel). A dynamic load test has a very short duration, lasting
as little as 5 milliseconds as defined by ASTM. In order to use
the results, there must be a visible return of the stress wave to
the surface in the recorded data (Middendorp and Van Foeken
2000).
2.3 Rapid Load Test Rapid load tests do not induce tensile stresses and have
minimal to no wave effects due to the duration of the load
test. However, rapid tests do induce an acceleration to the
entire foundation mass, which in turn requires proper
evaluation techniques. The statnamic load test is a type of
rapid load test based on its duration, usually lasting 100-250
milliseconds (Lewis, 1999). The ASTM standard for this test
is still in the drafting process; it will be similar to the test
standard proposed by the Japanese Geotechnical Society. It is
developed jointly by Birmingham Foundation Solutions of
Canada and TNO Building and Construction Research of the
Netherlands in 1989.
3. STATNAMIC TEST METHOD
3.1 The Principle of Statnamic Method The main principle of statnamic load testing is based on
launching reaction masses from top of pile. It is accelerated
upward by combustion of fast burning solid fuel (Rock fuel).
As force of burning fuel accelerates the reaction mass (at 20
times the acceleration of gravity), an equal & opposite
force (m x a of reaction mass) pushes test pile downward.
Using Newton´s II law of acceleration, the reaction masses are
accelerated upward at 20g where a force acts downward onto
the pile will be 20 times the reaction masses assembly.
Loading of the pile is monitored using a calibrated load cell
and displacement is monitored using a photo voltaic cell laser
sensor. All data recorded are digitized and stored in a portable
computer connected to the assembly. Figure 1 presents the
International Conference on Emerging Technology Trends on Advanced Engineering Research (ICETT’12)
Proceedings published by International Journal of Computer Applications® (IJCA)
39
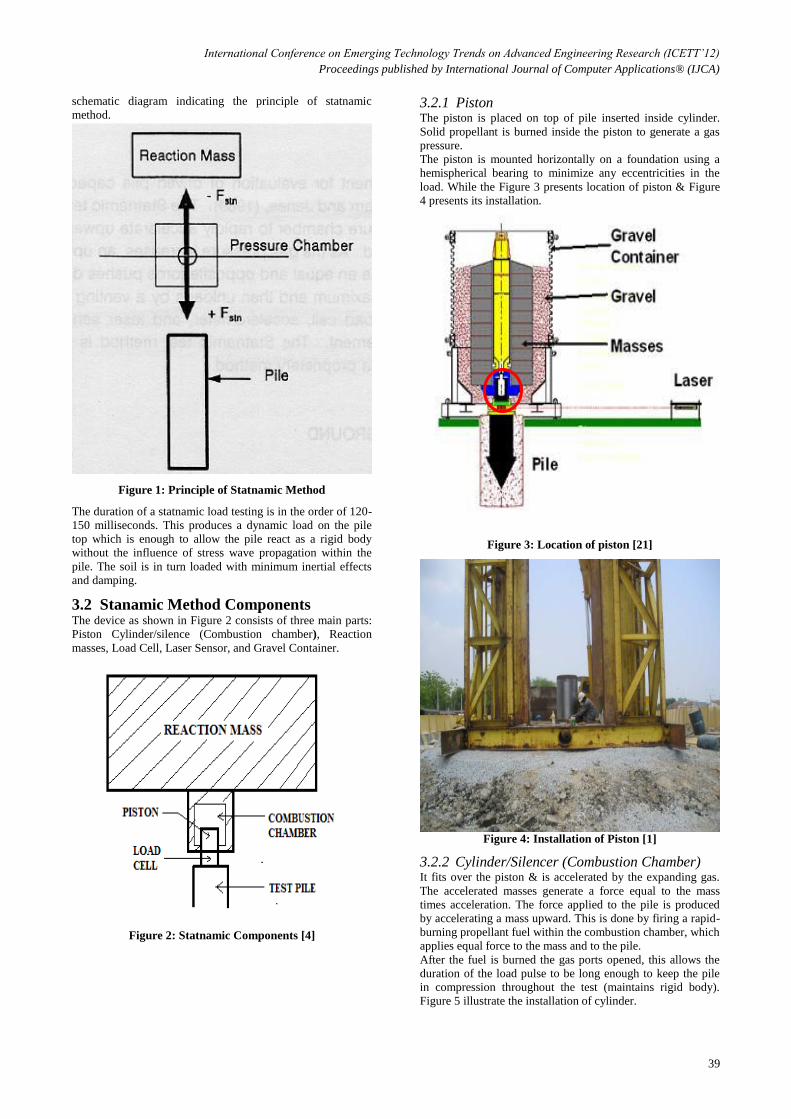
schematic diagram indicating the principle of statnamic
method.
Figure 1: Principle of Statnamic Method
The duration of a statnamic load testing is in the order of 120-
150 milliseconds. This produces a dynamic load on the pile
top which is enough to allow the pile react as a rigid body
without the influence of stress wave propagation within the
pile. The soil is in turn loaded with minimum inertial effects
and damping.
3.2 Stanamic Method Components The device as shown in Figure 2 consists of three main parts:
Piston Cylinder/silence (Combustion chamber), Reaction
masses, Load Cell, Laser Sensor, and Gravel Container.
Figure 2: Statnamic Components [4]
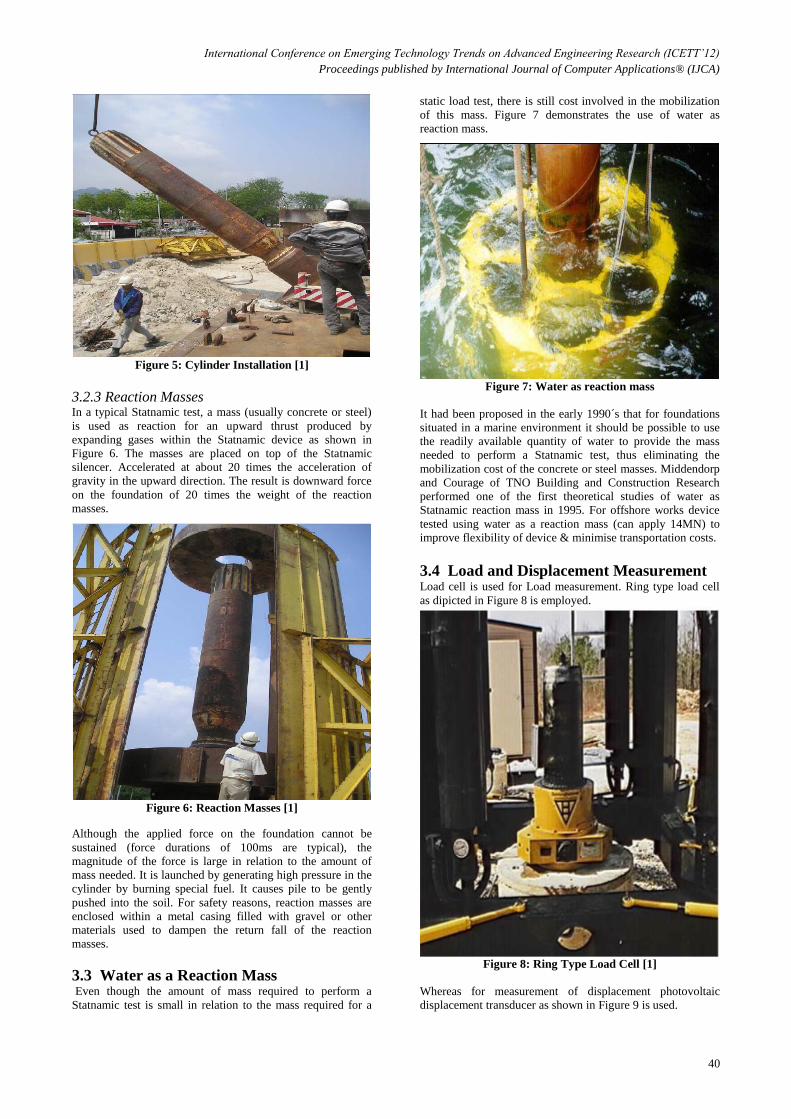
3.2.1 Piston The piston is placed on top of pile inserted inside cylinder.
Solid propellant is burned inside the piston to generate a gas
pressure.
The piston is mounted horizontally on a foundation using a
hemispherical bearing to minimize any eccentricities in the
load. While the Figure 3 presents location of piston & Figure
4 presents its installation.
Figure 3: Location of piston [21]
Figure 4: Installation of Piston [1]
3.2.2 Cylinder/Silencer (Combustion Chamber)
It fits over the piston & is accelerated by the expanding gas.
The accelerated masses generate a force equal to the mass
times acceleration. The force applied to the pile is produced
by accelerating a mass upward. This is done by firing a rapid-
burning propellant fuel within the combustion chamber, which
applies equal force to the mass and to the pile.
After the fuel is burned the gas ports opened, this allows the
duration of the load pulse to be long enough to keep the pile
in compression throughout the test (maintains rigid body).
Figure 5 illustrate the installation of cylinder.
International Conference on Emerging Technology Trends on Advanced Engineering Research (ICETT’12)
Proceedings published by International Journal of Computer Applications® (IJCA)
40
Figure 5: Cylinder Installation [1]
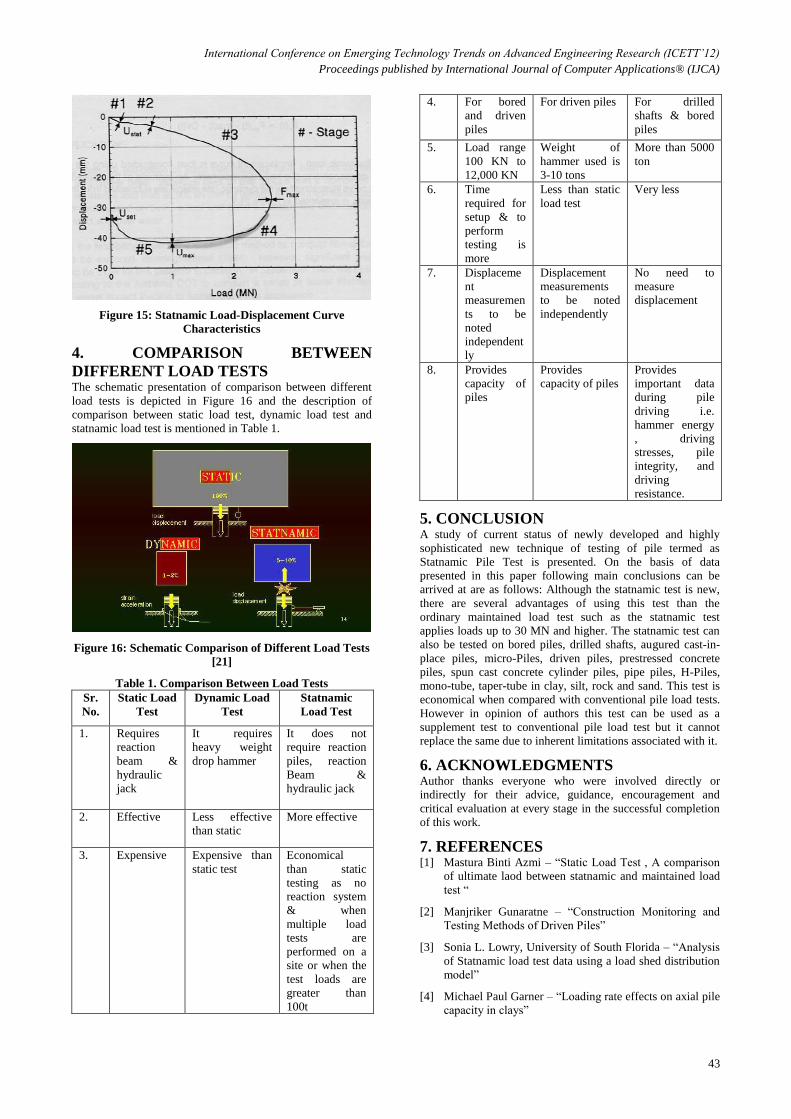
3.2.3 Reaction Masses In a typical Statnamic test, a mass (usually concrete or steel)
is used as reaction for an upward thrust produced by
expanding gases within the Statnamic device as shown in
Figure 6. The masses are placed on top of the Statnamic
silencer. Accelerated at about 20 times the acceleration of
gravity in the upward direction. The result is downward force
on the foundation of 20 times the weight of the reaction
masses.
Figure 6: Reaction Masses [1]
Although the applied force on the foundation cannot be
sustained (force durations of 100ms are typical), the
magnitude of the force is large in relation to the amount of
mass needed. It is launched by generating high pressure in the
cylinder by burning special fuel. It causes pile to be gently
pushed into the soil. For safety reasons, reaction masses are
enclosed within a metal casing filled with gravel or other
materials used to dampen the return fall of the reaction
masses.
3.3 Water as a Reaction Mass Even though the amount of mass required to perform a
Statnamic test is small in relation to the mass required for a
static load test, there is still cost involved in the mobilization
of this mass. Figure 7 demonstrates the use of water as
reaction mass.
Figure 7: Water as reaction mass
It had been proposed in the early 1990´s that for foundations
situated in a marine environment it should be possible to use
the readily available quantity of water to provide the mass
needed to perform a Statnamic test, thus eliminating the
mobilization cost of the concrete or steel masses. Middendorp
and Courage of TNO Building and Construction Research
performed one of the first theoretical studies of water as
Statnamic reaction mass in 1995. For offshore works device
tested using water as a reaction mass (can apply 14MN) to
improve flexibility of device & minimise transportation costs.
3.4 Load and Displacement Measurement Load cell is used for Load measurement. Ring type load cell
as dipicted in Figure 8 is employed.
Figure 8: Ring Type Load Cell [1]
Whereas for measurement of displacement photovoltaic
displacement transducer as shown in Figure 9 is used.

International Conference on Emerging Technology Trends on Advanced Engineering Research (ICETT’12)
Proceedings published by International Journal of Computer Applications® (IJCA)
41
Figure 9: Photovoltaic Displacement Transducer [1]
Other deives used for displacement is laser sensor activated
via laser projector as presented in Figure 10. Laser reference
placed at 10m-20m from the test pile to minimize ground
vibration (Brown & Hyde, 2006). It moves with the pile.
Figure 10: Remote Laser Projector [1]
3.5 Methodology The Figure 11 presents schematic details of device assembly
which is self explanatory. All components are handled with a
hoisting machine. Reaction masses are sectional and made of
concrete, lead, steel and others. Concrete reaction masses can
be cast on-site and reused.
Figure 11: Statnamic Devices Assembly [1]
The statnamic test consists of four stages (refer Figure 12).
Firstly placement of reaction mass on top of pile. Secondly
burning of solid fuel. Thirdly exertion of upward force on
reaction masses and finally felled reaction masses turn back
on the pile.
At first solid fuel is burned within a pressure chamber
(cylinder & ram) to generate gas pressure. As the pressure
increases, an upward force is exerted on a set of reaction
masses (from 1-3m) while an equal and opposite force pushes
downward on the pile (from 10-100mm).
Then loads ranging from 5 tons up to 5,000 tons are generated
(axially or laterally) by propelling a reaction mass upward off
the foundation. The load is applied & removed smoothly
resulting in load application of 100 to 200 milliseconds. This
is 30 to 40 times the duration of dynamic pile load testing.
Slow application of axial load & release of compressive
forces eliminates tensile stresses, compressing soil & pile as
single unit, allowing an accurate measurement of the load-
displacement behaviour.
Figure 12: Stages of Statnamic test
Controlled venting of the pressure produces a soft unloading.
The duration of load, loading rate & max. load applied is
controlled with the piston & cylinder size, mass of fuel, total
reaction mass & venting of gases. As the duration of the
loading is long, piles less than 40m in length remain in
compression throughout, resulting in negligible stress wave
effects. Equivalent static pile response (static load-settlement
curve) is obtained by Unloading Point Method (UPM). The
UPM analysis method was conceived to be simple and based
on measured results alone (Middendorp et al, 1992).
3.6 LOAD DURATION
3.6.1 Static Loading Since velocity and acceleration are near zero throughout a
static load test, damping and inertial effects are minimal.
However, as the load duration decreases for quick static load
tests, results can differ from conventional static tests due to
the strain rate dependent nature of soil. Low permeability soils
(soft silty or clayey soils) are most susceptible to quick load
rates.
3.6.2 High Rate Dynamic Loading (Dynamic
Load Tests) Here the duration of pile loading is of the order of 4
milliseconds. The short duration of loading introduces stress
waves to the pile and will unduly affect pile/soil behavior.
3.6.3 Low Rate Dynamic Loading (Statnamic) The duration of pile loading here is of the order of 120
milliseconds. The load duration, while not of the order of
static testing, is still relatively long compared to high rate
dynamic testing. Dynamic rate effects are present only in low
permeability, cohesive soils and can be measured using
existing pile/soil models.

International Conference on Emerging Technology Trends on Advanced Engineering Research (ICETT’12)
Proceedings published by International Journal of Computer Applications® (IJCA)
42
3.6.4 Stress Wave Mechanics In conventional static loading, the pile compresses as a whole
throughout loading and can be considered as a rigid body. As
the load duration decreases, however, stress waves are
introduced to the pile, effecting pile/soil behaviour. Stress
waves propagate along the pile at the speed of sound within
the pile. C = (E/ρ)½ C = stress wave velocity E = pile/soil
system modulus ρ = pile/soil density C is about 3500 – 4000
m/s for reinforced concrete piles and 5000 m/s for steel piles.
For long piles(nearly 30m) an initial stress at the pile top will
reach the pile toe in approximately 6 milliseconds,
corresponding to the pile’s nature period, (30/5000 = .006).
As said earlier Statnamic loading is on the order of 120
milliseconds, well above the natural period of even the stiffest
pile and as stress wave effects are minimized, the pile can be
considered as a rigid body and conventional static analytical
methods are applied. Although results from Statnamic load
tests have shown that rate effects are negligible for piles in
very stiff soils and piles end-bearing in rock, rate effects for
piles in soft soils have been relatively large and have
significantly influenced load-displacement behaviour. The
Unloading Point model shown in Figure 13 is a simple
method of analysis for determining the static resistance from a
Statnamic test. As well, rate effects present during a
Statnamic test can be quantified with the Unloading-Point
model.
Figure 13: The Unloading Point Model
The rate of increase in pressurized gas production is therefore
cubic, characteristic of solid propellant fuel. The Statnamic
fuel consists of a number of small, perforated solid pellets.
The burn rate depends on several parameters: Chemical
composition, Pellet geometry, Temperature, Pressure.
Chemical composition is chosen from factory burn trials.
Perforated cylindrical pellets are preferred to solid pellets or
flat plates because they increase in surface area throughout
burning desired for statnamic. Furthermore, using many small
pellets instead of one large fuel charge reduces a consistent
burn and averages out any imperfections in a single pellet. As
expected, the natural burn rate increases as temperature and
pressure increases in pressure chamber. Under normal
operating conditions, burning will not begin until the fuel
temperature reaches 1000°C. The statnamic propellant can be
safely handled and will not ignite under spark, friction, or
agitation. When under atmospheric conditions, the burn is
slow and easily controlled. The fuel can be extinguished with
water. Propellant can be transported with minimum
preparation stored for long periods of time without concern.
3.7 Data Acquisition and Record Load and displacement data are measured at the pile top with
a calibrated load cell and laser sensor and analyzed by TNO´s
Foundation Pile Diagnostic System (FPDS). The load
measurements are accurate to within 0.1 % and the
displacement measurements are accurate to 0.1mm. A total of
2000 data points are recorded at a sampling rate of 250
microseconds for a total time 0.3 seconds, suitable to record
the entire event. The sampling time and total measuring time
are variable and can be changed in FPDS. The ignition
triggering is also controlled by FPDS.
3.7.1 Load Cell The statnamic load is measured by a circular load cell, located
between the piston and the pile top. A number of strain gauge
transducers, mounted on the load cell circumference, reduce
the effects if any uneven loading. Loads signal from each
transducers are averaged and amplified within the laod cell to
reduce error and are further amplified by FPDS.
3.7.2 Load Sensor Pile displacement is measured with photovoltaic laser sensor
(located at the center of the piston base) and a remote
reference laser source. During the statnamic event, the change
in position of the laser sensor is measured relative to the
stationary laser source. Throughout loading, load and
displacement signals are digitized and written to a raw data
file. After the event, the raw signal voltages are converted to
load and displacement values using factory calibration values.
Load-displacement graphs are presented immediately on-site.
Supplementary graphs, including graphs of velocity and
acceleration, are also generated by FPDS. Velocity and
acceleration data are to be used for Unloading-Point Analysis
to determine static load settlement behavior. During the
Statnamic test, several measurements are taken; including the
applied load pile head displacement toe accelerometer
readings, MUP strains, SUP etc. The typical data acquisition
system used to have such test record is shown in Figure 14.
Data capture is undertaken using a data acquisition system
connected to a PC to automatically produce a Load-
Displacement curve (see Figure 15). During application of
explosive force, pile moves into ground, generating both static
& dynamic resistance. Pile downward movement stops & it
rebounds upward to a final position. At point of zero velocity
assumption is made that dynamic resistance is zero & that all
of the resistance is, therefore, static. This concept is based on
assumption that the pile is rigid.
Figure 14: Data Acquisition System [14]
International Conference on Emerging Technology Trends on Advanced Engineering Research (ICETT’12)
Proceedings published by International Journal of Computer Applications® (IJCA)
43
Figure 15: Statnamic Load-Displacement Curve
Characteristics
4. COMPARISON BETWEEN
DIFFERENT LOAD TESTS The schematic presentation of comparison between different
load tests is depicted in Figure 16 and the description of
comparison between static load test, dynamic load test and
statnamic load test is mentioned in Table 1.
Figure 16: Schematic Comparison of Different Load Tests
[21]
Table 1. Comparison Between Load Tests
Sr.
No.
Static Load
Test
Dynamic Load
Test
Statnamic
Load Test
1. Requires
reaction
beam &
hydraulic
jack
It requires
heavy weight
drop hammer
It does not
require reaction
piles, reaction
Beam &
hydraulic jack
2. Effective Less effective
than static
More effective
3. Expensive Expensive than
static test
Economical
than static
testing as no
reaction system
& when
multiple load
tests are
performed on a
site or when the
test loads are
greater than
100t
4. For bored
and driven
piles
For driven piles For drilled
shafts & bored
piles
5. Load range
100 KN to
12,000 KN
Weight of
hammer used is
3-10 tons
More than 5000
ton
6. Time
required for
setup & to
perform
testing is
more
Less than static
load test
Very less
7. Displaceme
nt
measuremen
ts to be
noted
independent
ly
Displacement
measurements
to be noted
independently
No need to
measure
displacement
8. Provides
capacity of
piles
Provides
capacity of piles
Provides
important data
during pile
driving i.e.
hammer energy
, driving
stresses, pile
integrity, and
driving
resistance.
5. CONCLUSION A study of current status of newly developed and highly
sophisticated new technique of testing of pile termed as
Statnamic Pile Test is presented. On the basis of data
presented in this paper following main conclusions can be
arrived at are as follows: Although the statnamic test is new,
there are several advantages of using this test than the
ordinary maintained load test such as the statnamic test
applies loads up to 30 MN and higher. The statnamic test can
also be tested on bored piles, drilled shafts, augured cast-in-
place piles, micro-Piles, driven piles, prestressed concrete
piles, spun cast concrete cylinder piles, pipe piles, H-Piles,
mono-tube, taper-tube in clay, silt, rock and sand. This test is
economical when compared with conventional pile load tests.
However in opinion of authors this test can be used as a
supplement test to conventional pile load test but it cannot
replace the same due to inherent limitations associated with it.
6. ACKNOWLEDGMENTS Author thanks everyone who were involved directly or
indirectly for their advice, guidance, encouragement and
critical evaluation at every stage in the successful completion
of this work.
7. REFERENCES [1] Mastura Binti Azmi – “Static Load Test , A comparison
of ultimate laod between statnamic and maintained load
test “
[2] Manjriker Gunaratne – “Construction Monitoring and
Testing Methods of Driven Piles”
[3] Sonia L. Lowry, University of South Florida – “Analysis
of Statnamic load test data using a load shed distribution
model”
[4] Michael Paul Garner – “Loading rate effects on axial pile
capacity in clays”

International Conference on Emerging Technology Trends on Advanced Engineering Research (ICETT’12)
Proceedings published by International Journal of Computer Applications® (IJCA)
44
[5] M. Janes, A. Sy and R. G. Campanella – “A comparison
of statnamic and static load tests on steel pipe piles in the
Fraser Delta”
[6] D. Justason, M. C. Janes, P. Middendorp, A. G. Mullins
– “Statnamic load testing using water as reaction mass”,
Sixth International Conference on the Application of
Stress-Wave Theory To Piles, Orlando, Sao Paulo, 2000.
[7] Garland Likins, Mohamad Hussein, Frank Rausche –
“Design and Testing of Pile Foundations”
[8] US Department of Transportation, Federal Highway
Administration, Chapter 5. Field load tests at the route 40
bridge
[9] M. J. Brown PhD, BEng and A. F. L. Hyde PhD, BSc,
CEng, MICE – “Some observations on Statnamic pile
testing”, Proceedings of the ICE - Geotechnical
Engineering, Volume 159, Issue 4, pages 269 –273 ,
ISSN: 1353-2618, E-ISSN: 1751-8563
[10] Michael Jeffrey Stokes, University of South Florida –
“Laboratory statnamic testing”
[11] Michael. John. Brown – “The rapid load testing of piles
in fine grained soils”
[12] Paul Hölscher, Frits van Tol – “Rapid Load Testing on
Piles”
[13] N.Q.Huy, Quasi - “Static and Dynamic pile load tests”
[14] Jean-Louis Briaud, Fellow, ASCE, Marc Ballouz, and
George Nasr, Members, ASCE – “Static capacity
prediction by dynamic methods for three bored piles”,
Journal of geotechnical and geoenvironmental
engineering/July 2000
[15] P. Middendorp, B.Daniels – “The Influence of Stress
Wave Phenomena during Statnamic Load Testing”, Fifth
International Conference on the Application of Stress-
Wave Theory To Piles, Orlando, Florida, 1996
[16] P.Middendorp, Profound BV, www.profound.nl, R.J. van
Foeken, TNO Building and Construction Research –
“When to Apply Dynamic Load Testing and Statnamic
Testing”, 2nd Statnamic Seminat, Tokyo, 1998
[17] http://esvc000701.wic052u.serverweb.com/PDF/Static_L
oad_Test.pdf
[18] www.profound.nl
[19] www.berminghammer.com
[20] Gray Mullins1, Christopher L. Lewis2, Michael D.
Justason3, “Advancements in statnamic data regression
techniques”
[21] www.geolab-sdn-bhd.com
[22] Manjriker Gunaratne , “The Foundation Engineering
Handbook”
[23] Chris Nickel, P. E., Rigolets pass bridge test pile
program.
[24] Sonia L. Lowry, University of South Florida,
“Construction Monitoring and Testing Methods of
Driven Piles “
[25] Manjriker Gunaratne, “Analysis of Statnamic load test
data using a load shed distribution model”
[26] http://farm4.static.flickr.com/3248/2439433876_0c03f44
355.jpg
[27] W.F.Anderson, D.H.Nguyen, A.F.L.Hyde, University of
Sheffield, United Kingdom, Interpretation of statnamic
load tests on piles in clay
[28] Geotechnical Engineering Circular (GEC) No. 8, Design
And Construction of Continuous Flight Auger Piles,
April 2007
[29] www.vulcanhammer.org
[30] George G. Goble and Mohamad H. Hussein, Capacity
evaluation methods of deep foundations, A critical
review.
[31] J.G. de Gijt, The Netherlands, J. H. Van Dalen, Public
Works Rotterdam, P. Middendorp, TNO Profound BV,
The Netherlands, Comparison of Statnamic load test and
Static load tests at the Rotterdam harbour.


![Statnamic Pile Load Testing - Accueil | CFMS · · 2012-01-19Disadvantages: Difficult to ... STN Cyclic Load Displacement Diagram Displacement [mm] Load ... preparation European](https://static.cupdf.com/doc/110x72/5ac3e0eb7f8b9a333d8cae17/statnamic-pile-load-testing-accueil-difficult-to-stn-cyclic-load-displacement.jpg)