Statistics on quench locations of 1.3 GHz cavities at DESY
Felix SchlanderTTC Meeting, Nov 6, 2012
Statistics on quench locations of 1.3 GHz cavities at DESY | Nov. 6th, 2012 Felix Schlander | Page 2
Motivation
> Up to now: correlations of single quench locations with surface irregularities, no statistical analysis of quench locations
> Second sound @ DESY allowed about 30 cavity tests with quench localisation from 2010 to 2012:
Different surface treatments
Large grain and fine grain material
> 189 quenches detected for all 9 passband modes
> 121 different quench locations

Statistics on quench locations of 1.3 GHz cavities at DESY | Nov. 6th, 2012 Felix Schlander | Page 3
All quench locations

Statistics on quench locations of 1.3 GHz cavities at DESY | Nov. 6th, 2012 Felix Schlander | Page 4
All quench locations, observations

Statistics on quench locations of 1.3 GHz cavities at DESY | Nov. 6th, 2012 Felix Schlander | Page 5
Angular distribution of quench locations

Statistics on quench locations of 1.3 GHz cavities at DESY | Nov. 6th, 2012 Felix Schlander | Page 6
Quench fields in cells

Statistics on quench locations of 1.3 GHz cavities at DESY | Nov. 6th, 2012 Felix Schlander | Page 7
Quench fields in cells
Wrong cell assignment
Statistics on quench locations of 1.3 GHz cavities at DESY | Nov. 6th, 2012 Felix Schlander | Page 8
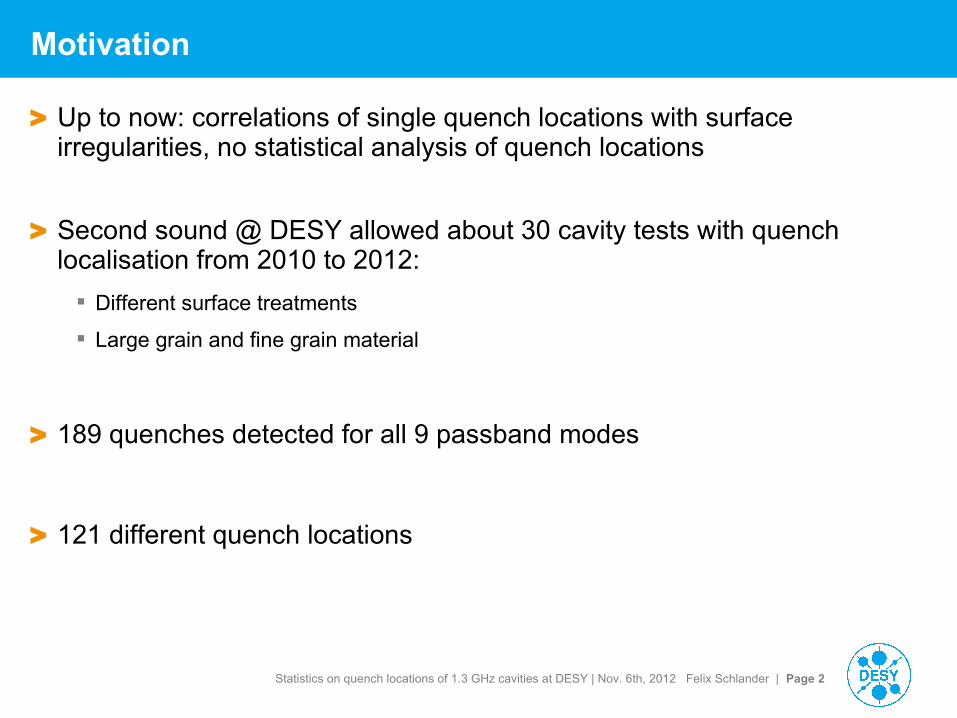
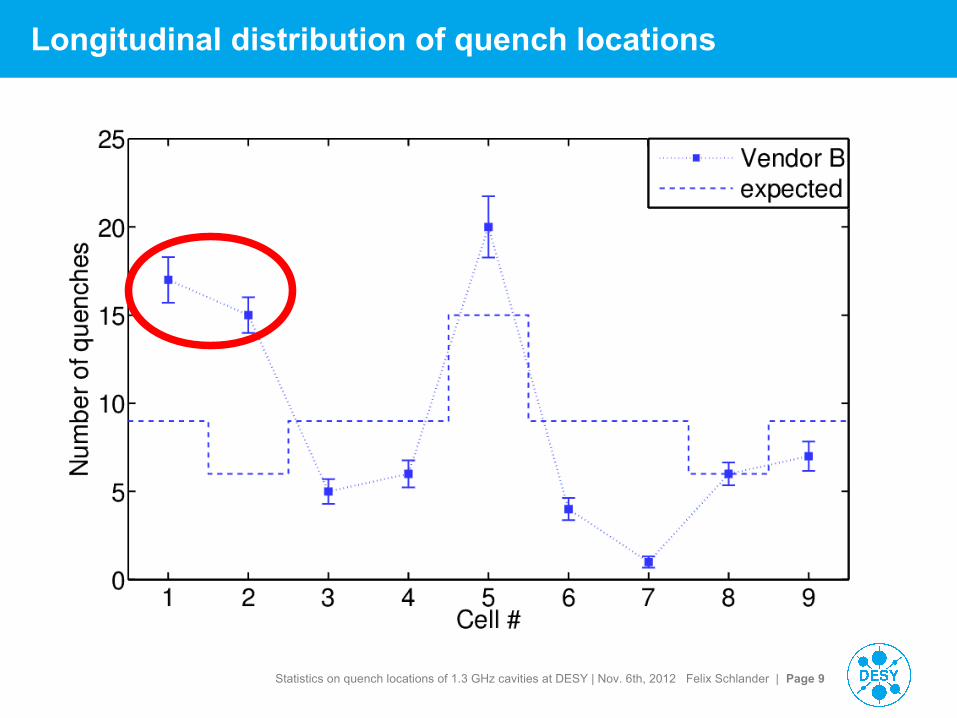
Longitudinal distribution of quench locations
Statistics on quench locations of 1.3 GHz cavities at DESY | Nov. 6th, 2012 Felix Schlander | Page 9
Longitudinal distribution of quench locations
Statistics on quench locations of 1.3 GHz cavities at DESY | Nov. 6th, 2012 Felix Schlander | Page 10
Summary/Outlook
> Statistic analysis of quench locations revealed pattern
> Angular distribution shows excess in quenches at certain angular orientation (+/- 90° from the main coupler port)
No vendor dependence
No suspicious work step during cavity treatment at DESY
> Longitudinal orientation shows quenches at low fields in cells #1 and #2
> Quench distribution in cells also shows an excess of quenches in cell #1 and #2
For cell #2 an excess at both vendors is seen
For cell #1, only one vendor shows more quenches than expected
> More cavity tests and data required!
24 ILC-HiGrade cavities will be extracted from the European XFEL series production
Question: Statistics from other labs and cavity vendors?
Statistics on quench locations of 1.3 GHz cavities at DESY | Nov. 6th, 2012 Felix Schlander | Page 11
Acknowledgements
! Thank you for your attention !
More details:
F. Schlander, “Statistical analysis of quench locations of 1.3 GHz superconducting rf cavities at DESY”, ILC-HiGrade-Report-2012-002, http://www.ilc-higrade.eu
F. Schlander, Dissertation, to be published …
Special thanks to all people involved in the 1.3 GHz 'cavity business' at Hall III at DESY