State-of-Health (SoH) and State-of-Charge
(SoC) Determination in Electrochemical
Batteries and Cells Using Designed
Perturbation Signals
By
Andrew James Fairweather
A thesis submitted for the Degree of Doctor of Philosophy in the department of
Electronic and Electrical Engineering, University of Sheffield
June 2015

1
Dedicated to Donna, William, Poppy and Adam

2
Summary
Optimisation of battery use and lifecycle is an important aspect of the application of
batteries, as the environmental benefits of energy storage schemes can be negated by
the carbon footprint of batteries being discarded due to perceived failure. Accurate
battery state evaluation helps to reduce the quantity of these batteries entering the
recycling chain before the end of their useful life, as in many cases equipment can
operate with a reduced battery capabilities if this performance can be accurately
reported.
The body of work presented here investigates novel methods of battery state
evaluation utilising band-limited white noise in the form of Pseudo Random Binary
Sequences. The work includes the building of dedicated test systems, the
development of applied battery models, and the realisation of the developed
techniques through deployable technology within an embedded environment.
A novel series of experiments were developed utilising a load based test scheme to
demonstrate the applicability of the test technique, and batteries were profiled over
a full operating temperature range and State-of-Charge (SoC), with equivalent circuit
parameters obtained from the tests. New battery types (Ultrabatteries) were
examined using these techniques, and compared with battery-supercapacitor parallel
networks to investigate the parameters obtained for these systems, and their
applicability to EV/HEV usage.
A charger based system was subsequently investigated which allowed the
perturbation signal to be applied on line to the power stage in a conventional battery
3
charger. The benefits of this system were clearly demonstrated in that transitions in
multi stage charge regimes could be detected, and clear indications of 100% SoC and
indeed 0% SoC were obtained. Furthermore, no energy was wasted in this testing
mode, as the test was integral to the charging process.
Combining the load and charge based systems led to a multimode/bipolar PRBS
testing scheme which allowed analysis of the battery parameters outside of the
frequency range of the previous tests. Using the bipolar test signal, the net effect on
SoC was negligible and this therefore facilitated longer duration, with the lower
frequency tests giving some insight into the values of the bulk capacity of the battery.
Combined mode tests were developed, which, when used in conjunction with mean
DC voltage acquisition during bipolar tests, facilitated indicators of battery SoC,
State-of-Health (SoH), State-of-Function (SoF) and battery efficiency.

4
Acknowledgements
I would like to thank:
Professor David A. Stone and Dr. Martin P. Foster for their supervision of this work
and their continual support.
Grant Ashley and Tim McCann, owners of VxI Power Ltd for their support and
funding during the research, and allowing flexibility in my day job to facilitate the
investigations and the presentation of the published work.
The Engineering and Physical Sciences Research Council for their funding over the
course of this research.
My colleagues and friends at the University of Sheffield over the course of the PhD,
James Holmes, Dan Rogers, Dan Schofield, Dan Gladwin, Huw Price and of course,
Chi Tsang.
David Willey, my HND course tutor, who allowed me to step onto the first rung of
the ladder.
My parents, Edgar and Rita Fairweather for instilling a work ethic without which the
undertaking of this endeavour would have been impossible.
And finally, to my wife, Donna, and my children, William, Poppy and Adam for their
support and eternal belief, even in my lowest moments.

5
“If you’re going through hell, keep going.”- Sir Winston Churchill

6
List of publications
1. Fairweather, A.J., M.P. Foster, and D.A. Stone, VRLA battery parameter
identification using pseudo random binary sequences (PRBS), in IET Conference
Publications. 2010. p. TU244.
2. Fairweather, A.J., M.P. Foster, and D.A. Stone, MLS Testing of VRLA Batteries
using Pseudo Random Binary Sequences (PRBS), in EVS 25. 2010: Shenzhen, China.
p. 405.
3. Fairweather, A.J., M.P. Foster, and D.A. Stone, Battery parameter
identification with Pseudo Random Binary Sequence excitation (PRBS). Journal of
Power Sources, 2011. 196(22): p. 9398-9406.
4. Fairweather, A.J., M.P. Foster, and D.A. Stone, State-of-Charge Indicators for
VRLA Batteries Utilising Pseudo Random Binary Sequences (PRBS), in PCIM Europe
2011. 2011: Nuremberg, Germany.
5. Fairweather, A.J., M.P. Foster, and D.A. Stone, Modelling of VRLA batteries
over operational temperature range using Pseudo Random Binary Sequences. Journal
of Power Sources, 2012. 207(0): p. 56-59.
6. Fairweather, A.J., M.P. Foster, and D.A. Stone, MLS Testing of VRLA Batteries
using Pseudo Random Binary Sequences (PRBS). World Electric Vehicle Association
Journal, 2012. Vol 4: p. 405-412.

7
7. Fairweather, A.J., M.P. Foster, and D.A. Stone, State indicators for lead acid
batteries utilising Pseudo Random Binary Sequences (PRBS) in All Energy 2012. 2012:
Aberdeen, Scotland.
8. Fairweather, A.J., D.A. Stone, and M.P. Foster, Evaluation of UltraBattery™
performance in comparison with a battery-supercapacitor parallel network. Journal
of Power Sources, 2013. 226(0): p. 191-201.
9. Fairweather, A.J., M.P. Foster, and D.A. Stone, Application of Maximum
Length Sequences to Battery Charge Programming for Parameter Estimation in Lead-
Acid Batteries, in PCIM Europe 2013. 2013: Nuremberg, Germany.
10. Fairweather, A.J., M.P. Foster, and D.A. Stone, Bipolar Mode Pseudo Random
Binary Sequence Excitation for Parameter Estimation in Lead-Acid Batteries, in PCIM
Asia. 2013: Shanghai, China.

8
Contents
Table of figures .................................................................................................................... 19
List of Symbols .................................................................................................................... 28
Chapter 1. Introduction ..................................................................................................... 30
1.1 Introduction ............................................................................................. 30
1.2 Motivation ................................................................................................ 34
1.3 Literature search and background reading ......................................... 35
1.4 Outstanding technical challenges ......................................................... 37
1.5 Contribution ............................................................................................. 40
Chapter 2. The current state of energy storage technologies ............................... 42
2.1 Introduction ............................................................................................. 42
2.2 Voltage limits and charging terminology ............................................ 43
2.3 Lead-Acid ................................................................................................. 48
2.3.1 Flooded Lead-Acid ......................................................................................... 51
2.3.2 Valve Regulated Lead-Acid (VRLA) ............................................................ 52
2.3.3 Spiral wound VRLA ....................................................................................... 54
2.3.4 Lead-Acid Ultrabatteries ................................................................................ 55
2.4 Nickel Cadmium (NiCd) ........................................................................ 56
2.5 Nickel Metal Hydride (NiMH) .............................................................. 59

9
2.6 Lithium Chemistries ............................................................................... 60
2.6.1 Lithium Cobalt Oxide (LCO) (LiCoO2) ....................................................... 64
2.6.2 Lithium Nickel Manganese Cobalt Oxide (NMC) ...................................... 65
2.6.3 Lithium Manganese Oxide (LMO) ............................................................... 65
2.6.4 Lithium Iron Phosphate ................................................................................. 66
2.6.5 Lithium Polymer (LiPo) ................................................................................. 67
2.7 Supercapacitors ....................................................................................... 68
2.8 Fuel cells ................................................................................................... 71
2.9 Flow batteries ........................................................................................... 71
2.10 Competing electrochemistries – summary of performance and
applications .............................................................................................. 73
2.11 Conclusion................................................................................................ 76
Chapter 3. Performance characteristics and limitations of batteries ................... 77
3.1 Introduction ............................................................................................. 77
3.2 Electrochemical reaction rates and battery performance .................. 77
3.3 Mass transport processes and chemical inertia................................... 78
3.4 Coupe de fouet and the effect of load application to batteries ......... 80
3.5 Mass transport over potential ............................................................... 82
3.6 Discharge rate issues .............................................................................. 82
3.6.1 Loss of capacity with discharge rate ............................................................ 82

10
3.7 Effect of temperature on battery and cell performance ..................... 84
3.7.1 Terminal Voltage variations with State-of-Charge and temperature ...... 85
3.7.2 Temperature effects on cell capacity ............................................................ 88
3.7.3 Undesirable reactions with increased temperature.................................... 89
3.8 Conclusion................................................................................................ 91
Chapter 4. Battery characterisation .......................................................................... 93
4.1 Introduction ............................................................................................. 93
4.2 Specific gravity of electrolyte ................................................................ 93
4.3 Terminal voltage measurement ............................................................ 95
4.4 Load testing .............................................................................................. 96
4.4.1 Constant current long duration discharge tests .......................................... 97
4.4.2 Short duration pulse load testing ................................................................. 98
4.4.3 Charger margin test ...................................................................................... 100
4.5 Coulomb counting ................................................................................ 101
4.6 AC impedance measurement .............................................................. 102
4.7 Battery management integrated circuits ............................................ 104
4.8.1 Swept sinusoids ............................................................................................. 106
4.8.2 Digital signals ................................................................................................ 107
4.8.3 Pseudo Random Binary Sequences as a perturbation signal .................. 107
11
4.8.4 Monopolar Pseudo Random Binary Sequence excitation (discharge
mode) .............................................................................................................. 113
4.8.5 Monopolar Pseudo Random Binary Sequence excitation (charge mode) ...
.......................................................................................................................... 114
4.8.6 Bipolar Pseudo Random Binary Sequence excitation .............................. 114
4.9 Conclusion.............................................................................................. 115
Chapter 5. Discharge mode Pseudo Random Binary Sequence battery testing ....
.................................................................................................................. 117
5.1 Introduction ........................................................................................... 117
5.2 Battery Models ....................................................................................... 117
5.3 Cell parameter estimation by conventional methods ...................... 120
5.3.1 Determination of CBulk ................................................................................... 120
5.3.2 Determination of CSurface, Ri, Rt ..................................................................... 123
5.3.3 Determination of Rd ...................................................................................... 126
5.3.4 Experimental results ..................................................................................... 126
5.4 Pseudo Random Binary Sequence (PRBS) battery analysis ............ 127
5.4.1 Sampled data model analysis ...................................................................... 127
5.5 Experimental PRBS investigation ....................................................... 130
5.5.1 Temperature considerations ........................................................................ 130
5.5.2 Test system description ................................................................................ 130
5.5.3 Test procedure ............................................................................................... 133

12
5.5.4 Test results ..................................................................................................... 133
5.6 Conclusion.............................................................................................. 139
Chapter 6. Charge mode Pseudo Random Binary Sequence battery testing ... 141
6.1 Introduction ........................................................................................... 141
6.2 Selection of test parameters ................................................................. 142
6.2.1 PRBS bandwidth ................................................................................... 142
6.2.2 Test current amplitude and voltage thresholds ................................ 143
6.3 Battery model development ................................................................ 145
6.4 PRBS charge test investigation-experimental set up description ... 150
6.5 Test procedure ....................................................................................... 154
6.6 Test results ............................................................................................. 155
6.7 Conclusion.............................................................................................. 161
Chapter 7. Bipolar mode (Charge/Discharge) Pseudo Random Binary Sequence
battery testing ........................................................................................ 164
7.1 Introduction ........................................................................................... 164
7.2 Battery efficiency ................................................................................... 164
7.3 Hardware modifications ...................................................................... 167
7.4 Test procedure ....................................................................................... 169
7.5 Test results ............................................................................................. 171
7.5.1 Impedance results ......................................................................................... 172

13
7.5.1.1 Battery parameters ........................................................................................ 174
7.5.2 Battery efficiency results .............................................................................. 176
7.5.3 Mean DC terminal voltage as a SoC indicator .......................................... 177
7.6 Conclusion.............................................................................................. 179
Chapter 8. Variations in battery parameters with state of charge ..................... 181
8.1 Introduction ........................................................................................... 181
8.2 Correlations between SoC and processes within the battery.......... 181
8.3 PRBS test procedure .............................................................................. 182
8.4 Discharge PRBS test results ................................................................. 183
8.5 Bipolar PRBS test results ...................................................................... 185
8.5.1 Developed battery model ............................................................................. 186
8.5.2 Bipolar investigation test results ................................................................. 189
8.5.3 Mean DC terminal voltage ........................................................................... 194
8.6 Conclusion.............................................................................................. 195
Chapter 9. Effects of temperature on parameters within batteries ................... 197
9.1 Introduction ........................................................................................... 197
9.2 Test setup and schedule ....................................................................... 197
9.3 Test results ............................................................................................. 201
9.3.1 Discharge PRBS tests .................................................................................... 201
9.3.2 Bipolar PRBS test results .............................................................................. 203

14
9.3.3 Mean PRBS DC terminal voltage ................................................................ 206
9.4 Conclusion.............................................................................................. 207
Chapter 10. PRBS analysis of Ultra batteries and battery/supercapacitor energy
storage networks ..................................................................................... 208
10.1 Introduction ........................................................................................... 208
10.1.1 Capacitor and battery parallel networks ................................................... 208
10.2 Conventional battery tests ................................................................... 209
10.2.1 Discharge capacity tests ............................................................................... 210
10.2.2 Static parameter evaluation ......................................................................... 213
10.2.3 Battery mass ................................................................................................... 215
10.3 Testing of parallel energy storage networks ................................................... 215
10.3.1 Test configuration - Supercapacitor Bank 1............................................... 215
10.3.2 Test configuration - Supercapacitor Bank 2............................................... 216
10.3.3 Capacitance tests ........................................................................................... 216
10.3.4 Test system description – parallel network PRBS tests ........................... 217
10.3.5 PRBS application to the energy storage networks .................................... 219
10.3.6 Analysis of the complementary energy stores .......................................... 220
10.3.7 Battery and capacitor bank test waveforms .............................................. 221
10.3.8 PRBS battery test results............................................................................... 226
10.3.9 Results summary ........................................................................................... 228
15
10.4 Conclusion.............................................................................................. 231
Chapter 11. Accelerated failure analysis of lead acid batteries ............................ 233
11.1 Introduction ........................................................................................... 233
11.2 Cycle tests at elevated temperature .................................................... 234
11.3 Battery test schedule ............................................................................. 238
11.4 Test results ............................................................................................. 241
11.4.1 Battery capacity results ................................................................................ 242
11.4.2 Battery impedance over accelerated life cycle .......................................... 243
11.4.3 Battery parameters over accelerated life cycle .......................................... 244
11.4.4 Observed trends over states of charge during battery lifetime .............. 246
11.4.5 Mean DC terminal voltage ........................................................................... 250
11.4.6 Examination of internal battery condition ................................................. 252
11.5 Conclusion.............................................................................................. 256
Chapter 12. PRBS battery state evaluation using an embedded processor ........ 259
12.1 Introduction ........................................................................................... 259
12.2 Embedded processor selection ............................................................ 260
12.3 Limitations associated with embedded devices ............................... 261
12.4 Development and testing ..................................................................... 261
12.5 Test results ............................................................................................. 267
12.6 Conclusion.............................................................................................. 270

16
Chapter 13. Conclusions and further work ............................................................ 272
13.1 Conclusions ............................................................................................ 272
13.2 Further work .......................................................................................... 281
14. References............................................................................................... 284
15. Appendices ............................................................................................ 298
15.1 AM-1 Combined mode battery test system ................................................... 298
15.1.1 AM-1 system block diagram ........................................................................ 299
15.1.2 AMM-1 Battery cycler and system controller ........................................... 307
15.1.2.1 AMM-1 Battery cycler and controller block diagram ...................... 309
15.1.2.2 VxI Power Oracle 200E power supply block diagram (system
controller) .................................................................................................................. 310
15.1.2.3 AMM-1 Battery cycler and controller schematic .............................. 311
15.1.3 AMM-2 12V 35A Battery charger ............................................................... 312
15.1.3.1 AMM-2 12V 35A Battery charger block diagram ............................. 313
15.2 AMM-3 Tri-mode PRBS battery test module .................................... 314
15.2.1 AMM-3 Tri-mode PRBS battery test module block diagram .................. 315
15.2.2 AMM-3 Tri-mode PRBS battery test module schematic .......................... 316
15.3 Environmental chambers ..................................................................... 319
15.3.1 Heat/cool temperature chamber ................................................................. 319
15.3.1.1 Heat/cool temperature chamber specification .................................. 319

17
15.3.2 Long duration low temperature test chamber .......................................... 320
15.3.2.1 Extended low temperature chamber specification ........................... 321
15.4 Peripheral test hardware ...................................................................... 323
15.4.1 Timed discharge apparatus ................................................................. 323
15.4.1.1 Timed discharge apparatus block diagram ....................................... 324
15.5 Embedded PRBS battery test system .................................................. 325
15.5.1 Embedded PRBS test system circuit diagram ........................................... 326
15.6 IoTech Daqbook 200 data acquisition system specification ............ 327
15.7 Battery and capacitor datasheets ........................................................ 329
15.7.1 Yuasa NPL65-12i datasheet ................................................................. 329
15.7.2 Maxwell PC2500 Ultracapacitor datasheet ........................................ 330
15.7.3 Wima Supercap R datasheet ................................................................ 331
15.7.4 Furukawa FTZ12-HEV UltraBattery data .......................................... 332
15.7.5 Continental batteries CTX-9 battery data .......................................... 332
15.8 MATLAB code ....................................................................................... 333
15.8.1 sdm1a.m ................................................................................................. 333
15.8.2 mls.m ....................................................................................................... 335
15.8.3 four.m...................................................................................................... 338
15.8.4 fourseq.m ................................................................................................ 339
15.8.5 evalprbs.m .............................................................................................. 341

18
15.8.6 find_datastart.m .................................................................................... 343
15.8.7 crunch1.m ............................................................................................... 345
15.8.8 multiprbs.m ............................................................................................ 348
15.8.9 evalprbs2.m ............................................................................................ 351
15.8.10 curve_fit.m ............................................................................................. 353
15.9 Embedded PRBS code ..................................................................... 355
15.9.1 prbs3.c ..................................................................................................... 355

19
Table of figures
Figure 1. Published research activity within battery and energy storage, 1999-2012 .............. 36
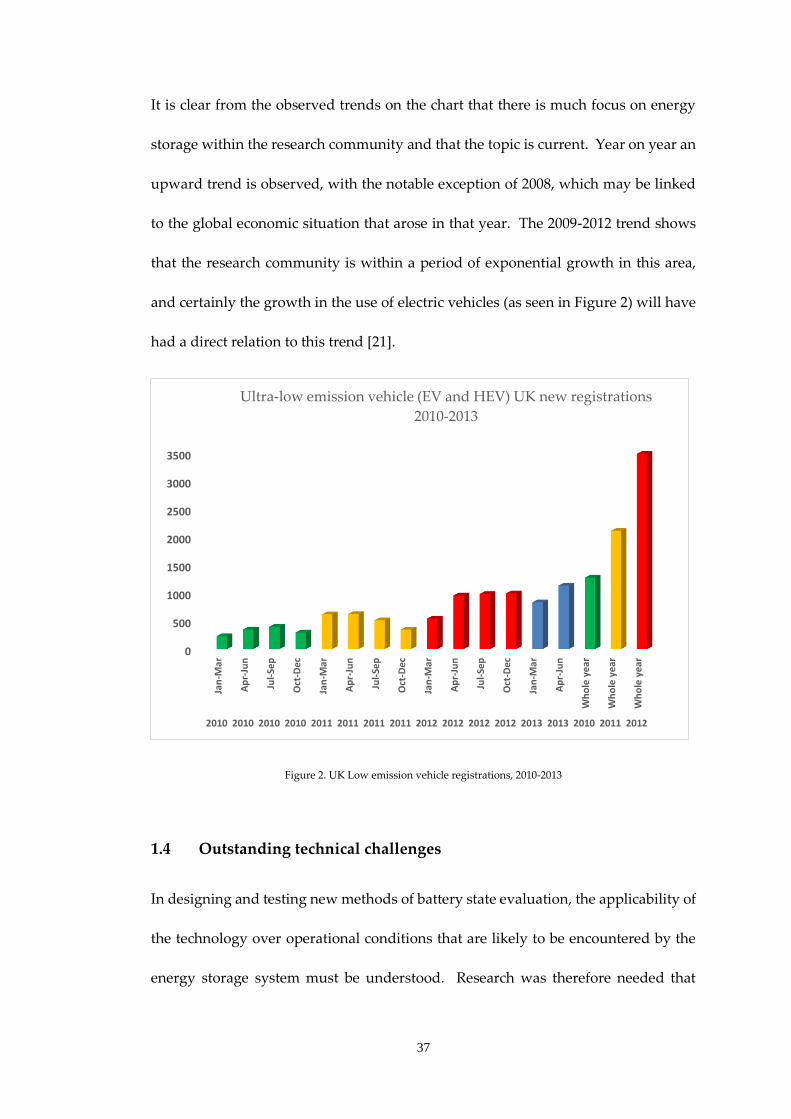
Figure 2. UK Low emission vehicle registrations, 2010-2013 ...................................................... 37
Figure 3. Summary of thesis structure with contribution to the research community ............ 41
Figure 4. Three-stage charge profile used in Lead-Acid battery charging ............................... 44
Figure 5. Lead-Acid battery charge profile with equalisation ................................................... 45
Figure 6. NiMh charge characteristics showing charge end point (20°C) ................................. 47
Figure 7. An unused radio 2V 70Ah “accumulator”, manufactured by Exide circa 1930-1940
(photograph by author) .................................................................................................................... 48
Figure 8(a) Flooded cyclic Lead-Acid battery and (b) Typical VRLA battery for standby
applications (Photographs courtesy Trojan batteries and Yuasa Europe respectively) .......... 50
Figure 9. Spiral wound Lead-Acid SLI battery for motorsport applications (image courtesy
Optima batteries) ............................................................................................................................... 54
Figure 10. Lead-Acid “UltraBatteryTM” manufactured by Furukawa for HEV applications
(photograph by author) .................................................................................................................... 56
Figure 11. Flooded NiCd stationary cell (image courtesy of Storage Battery Systems Inc.) .. 58
Figure 12. Honda Insight NiMH battery pack (image courtesy Bumblebee Batteries LLC) ... 59
Figure 13(a) Dell laptop battery with cover removed showing 18650 cells and (b) close up of
protection circuit and on board “fuel gauge” (photograph by author). .................................... 61
Figure 14. 12V 12Ah LiFePO4 battery for SLI applications in the automotive marketplace
(image courtesy of Super-B batteries) ............................................................................................. 66
Figure 15. Lithium Polymer radio controlled model battery (photograph by author) ........... 68
Figure 16. Maxwell Technologies 2500F 2.7V supercapacitor used in peak power buffer
applications (photograph by author) .............................................................................................. 69
Figure 17. Vanadium Redox battery block diagram (image courtesy of REDT Ltd) .............. 72

20
Figure 18. 30kWh Vanadium Redox battery system (image courtesy of REDT Ltd.) .............. 73
Figure 19. Battery terminal Voltage on application of load showing “Coupe de Fouet” ....... 81
Figure 20. Lead-Acid battery capacity with discharge rate (100Ah at 20 hr discharge rate,
20°C) .................................................................................................................................................... 84
Figure 21. Steady state open circuit terminal voltage with State-of-Charge (Image by kind
permission of Yuasa Battery Sales UK) .......................................................................................... 85
Figure 22. Battery terminal voltage response to an applied load step ...................................... 87
Figure 23. VRLA Lead-Acid battery capacity with temperature and discharge rate (image
reproduced with kind permission of Yuasa Battery sales UK) ................................................... 89
Figure 24. Lead-Acid battery service life with ambient temperature ....................................... 90
Figure 25. Comparative terminal voltage of Lead-Acid batteries post-charge (20°C) ............ 95
Figure 26. Typical discharge curve for 65Ah VRLA battery at 20°C ......................................... 97
Figure 27. Variation of battery capacity with discharge rate showing EoD Voltage (Image
courtesy Yuasa battery Sales Europe) ............................................................................................ 98
Figure 28. Two pulse battery test as applied to a 24Ah VRLA battery as part of on board
SoH testing ......................................................................................................................................... 99
Figure 29. Hioki 3354 hand held battery test instrument using AC impedance to establish
battery health (Image courtesy Hioki UK) ................................................................................... 102
Figure 30. Electrode equivalent circuit and typical EIS plot with parameter identification 103
Figure 31. Lithium Ion Cobalt pack used in one of the author’s current projects (photograph
by author) ......................................................................................................................................... 104
Figure 32. Close up of PCM board (photograph by author) .................................................... 105
Figure 33 4-bit PRBS generator constructed from shift registers with determined “tap”
positions and XNOR feedback ...................................................................................................... 108
Figure 34. Example PRBS sequence and autocorrelation response ......................................... 109
Figure 35. Power spectrum (FFT) of a PRBS showing usable frequency band ....................... 111

21
Figure 36. Randles equivalent circuit .......................................................................................... 118
Figure 37. Actual discharge curves for the batteries tested, cr/20 discharge rate, 20°C. ....... 121
Figure 38. Discharge curves for the test batteries at discharge rates of 0.25cr, 0.5cr and 1cr
(20°C)................................................................................................................................................. 123
Figure 39. Off-load step response used in calculation of model parameters ......................... 124
Figure 40. Off-load step response zoomed to show detail ......................................................... 125
Figure 41. Simulated current FFT plots using experimental battery data ............................... 128
Figure 42. Corresponding Voltage FFT with the PRBS applied to the Randle’s model ....... 128
Figure 43. Impedance plot resulting from the experimental data ........................................... 129
Figure 44. Test system block diagram ......................................................................................... 131
Figure 45. Photograph of test rig .................................................................................................. 131
Figure 46. Power stage schematic, PRBS discharge tests .......................................................... 132
Figure 47. Extract from the PRBS current perturbation signal .................................................. 134
Figure 48. Battery terminal voltage during PRBS test ............................................................... 135
Figure 49. 10Hz-300Hz, Impedance responses, showing effect of CSurface and Rt in parallel, in
series with Ri .................................................................................................................................... 137
Figure 50. 300Hz-1000Hz Impedance responses showing response tending to the value of Ri
............................................................................................................................................................ 138
Figure 51. Overall voltage envelope during PRBS discharge testing ...................................... 143
Figure 52. Terminal voltage over first 100 seconds of test ........................................................ 144
Figure 53. Ri broken out into its component impedances ......................................................... 146
Figure 54. Ri broken out as separate models for charge and discharge .................................. 146
Figure 55. Combined model for Ri separating electrolyte resistance into charge and
discharge elements .......................................................................................................................... 147
Figure 56. Modified Randle's model incorporating active charge and discharge resistance
elements ............................................................................................................................................ 147

22
Figure 57. Developed model .......................................................................................................... 148
Figure 58. Equivalent circuit broken into branches for analysis .............................................. 149
Figure 59. Overall test system block diagram ............................................................................ 151
Figure 60. PRBS discharge system photograph .......................................................................... 152
Figure 61. PRBS charge system photograph ............................................................................... 153
Figure 62. Controlled charge/discharge system photograph .................................................... 154
Figure 63. Charge test procedure flowchart ............................................................................... 155
Figure 64. Current waveform, 85% SoC, charge test ................................................................. 156
Figure 65. Voltage response, 85% SoC charge test ..................................................................... 156
Figure 66. 100% SoC, discharge mode PRBS .............................................................................. 157
Figure 67. 100% SoC, charge mode PRBS .................................................................................... 157
Figure 68. 85% SoC, discharge mode PRBS ................................................................................ 158
Figure 69. 85% SoC, charge mode PRBS ...................................................................................... 159
Figure 70. 0% SoC, discharge mode PRBS .................................................................................. 159
Figure 71. 0% SoC, charge mode PRBS ........................................................................................ 160
Figure 72. Comparative impedance results, PRBS discharge and charge tests. .................... 160
Figure 73. Current waveform “clipping” 100% SoC, charge test ............................................. 162
Figure 74. Charging efficiency with SoC from manufacturers data (image reproduced by
permission of Yuasa Batteries Europe)......................................................................................... 165
Figure 75. Charging efficiency with charge current from manufacturer’s data (image
reproduced by permission of Yuasa Batteries Europe). ............................................................. 166
Figure 76. Bipolar PRBS test system block diagram .................................................................. 168
Figure 77. Bipolar PRBS test system photograph ....................................................................... 169
Figure 78. Bipolar test procedure flowchart ............................................................................... 170
Figure 79. Bipolar PRBS test current waveform, 85% SoC. ...................................................... 171
Figure 80. PRBS test voltage response, 85% SoC ........................................................................ 171

23
Figure 81. Test results and curve fitting, 100% SoC ................................................................... 173
Figure 82. Test results and curve fitting, 85% SoC..................................................................... 173
Figure 83. Test results and curve fitting, 0% SoC....................................................................... 174
Figure 84. Voltage envelope, 85% SoC ........................................................................................ 177
Figure 85. SoC in relation to terminal voltage from manufacturer’s data (image courtesy
Yuasa Batteries Europe). ................................................................................................................ 178
Figure 86. Mean DC terminal voltage clusters obtained during the bipolar PRBS tests plotted
against battery data for SoC with terminal voltage (20°C). ....................................................... 179
Figure 87. Test schedule flowchart, SoC tests ............................................................................. 183
Figure 88. Battery impedance against SoC for the test battery, (discharge PRBS tests) ....... 184
Figure 89. Surface capacitance over SoC (CSurface normalised=14F) .......................................... 185
Figure 90. Developed battery model for the Bipolar PRBS SoC investigation ....................... 186
Figure 91. Equivalent circuit broken into branches for analysis ............................................... 188
Figure 92. Impedance over SoC - Bipolar tests ........................................................................... 189
Figure 93. Impedance over SoC - Bipolar tests, expanded to show more detail (0 -90% SoC)
............................................................................................................................................................ 190
Figure 94. Impedance over SoC - Bipolar tests, expanded to show more detail (20% -90%
SoC) ................................................................................................................................................... 191
Figure 95. Major controlling impedance over SoC ..................................................................... 193
Figure 96. Cx1 over SoC .................................................................................................................. 193
Figure 97. Mean PRBS DC terminal voltage over SoC ............................................................... 194
Figure 98. Battery SoH/SoC system ............................................................................................. 196
Figure 99. Test battery in Montford environmental chamber .................................................. 198
Figure 100. Test schedule flowchart, temperature tests ............................................................ 199
Figure 101. Test battery in low temperature chamber .............................................................. 200
24
Figure 102. Normalised surface capacitance over temperature, discharge PRBS tests (CSurface
= 14F at 20°C). .................................................................................................................................. 201
Figure 103. Available battery capacity with temperature from manufacturer’s data (image
courtesy Yuasa Batteries Europe).................................................................................................. 202
Figure 104. Impedance over -20 to 10°C temperature range - bipolar tests. .......................... 204
Figure 105. Impedance over 20-50°C temperature range - bipolar tests. ................................ 204
Figure 106. High frequency impedance (Ri+ Re) over temperature .......................................... 205
Figure 107. Mean DC terminal voltage over battery temperature ........................................... 206
Figure 108. Controlled charge/discharge system photograph .................................................. 210
Figure 109. 1cr discharge, 20° Celsius, both batteries ................................................................. 211
Figure 110. 1cr discharge, - 20° Celsius, both batteries ............................................................... 212
Figure 111. CTX-9 static parameter test, 8A off load transient (20°C) .................................... 213
Figure 112. FTZ-12 Ultrabattery static parameter test, 8A off load transient (20°C) ............. 214
Figure 113. Test system block diagram ........................................................................................ 217
Figure 114. Test system photograph, battery/supercapacitor bank 2 ...................................... 218
Figure 115. Battery/supercapacitor test setup, bank 1 ................................................................ 218
Figure 116. Battery/supercapacitor test setup, bank 2 ................................................................ 219
Figure 117. Relationship between battery and capacitor current over full test – bank 1. ..... 221
Figure 118. Relationship between battery and capacitor current over full test – bank 2. ..... 222
Figure 119. Overall terminal voltage during test for both capacitor banks. ............................ 222
Figure 120. Capacitor, battery and total test current, 0-100s, bank 1 ....................................... 224
Figure 121. Capacitor, battery and total test current, 0-100s, bank 2 ...................................... 224
Figure 122. Terminal voltage of both parallel networks, 0-100s .............................................. 224
Figure 123. Capacitor, battery and total test current, 100-200s, bank 1 .................................. 224
Figure 124. Capacitor, battery and total test current, 800-900s, bank 2................................... 225
Figure 125. Capacitor, battery and total test current, 1000-1100s bank 1................................ 225

25
Figure 126. Capacitor, battery and total test current, 1000-1100s bank 2................................. 225
Figure 127. Terminal voltage of both parallel networks, 100-200s .......................................... 225
Figure 128. Impedance response (experimental) for Lead-Acid battery compared to
simulation. ........................................................................................................................................ 226
Figure 129. Modified Randles’ model for the UltraBattery ...................................................... 227
Figure 130. UltraBattery experimental response and simulation using modified model. ... 227
Figure 131. Lead-Acid experimental response and improved fit to modified model. .......... 228
Figure 132. Respective impedances of the battery and parallel networks. ............................ 230
Figure 133. Battery cycler user interface showing available measurement and control ...... 236
Figure 134. Test battery within the environmental chamber (door removed) ....................... 237
Figure 135. Close up of battery terminal showing temperature sensing arrangement ........ 238
Figure 136. Overall test schedule flowchart, accelerated failure tests ...................................... 239
Figure 137. Battery cycler flowchart ............................................................................................. 240
Figure 138. Battery cycler data log temperature and voltage data over complete cycle period
between PRBS tests ......................................................................................................................... 241
Figure 139. Battery capacity over accelerated life cycle tests ................................................... 242
Figure 140. Battery impedance over accelerated life cycle testing, bipolar test, 85% SoC ... 243
Figure 141. Major series impedance over test period ................................................................ 244
Figure 142. 100% SoC cycle group 1 ............................................................................................. 246
Figure 143. 100% SoC cycle group 13 ........................................................................................... 247
Figure 144. 85% SoC, cycle group 1 .............................................................................................. 248
Figure 145. 85% SoC, cycle group 13 ............................................................................................ 248
Figure 146. 0% SoC cycle group 1 ................................................................................................. 249
Figure 147. 0% SoC, cycle group 13 ............................................................................................. 249
Figure 148. DC mean terminal voltage over the cycle test period (85% SoC). ....................... 250
Figure 149. Changes in Mean DC voltage during bipolar tests (battery efficiency) ............. 251

26
Figure 150. Battery at end of testing within containing "bund" in case of electrolyte leakage
............................................................................................................................................................ 252
Figure 151. Case distortion of the battery during the elevated temperature tests ................ 253
Figure 152. Test battery with case top removed exposing the individual cells ..................... 254
Figure 153. Plate condition of one of the failed cells ................................................................. 255
Figure 154. Improving battery test measurement resolution by introducing a stable DC
offset .................................................................................................................................................. 263
Figure 155. dsPIC test system flowchart ..................................................................................... 264
Figure 156. PRBS system block diagram ..................................................................................... 265
Figure 157. Photograph of prototype test apparatus ................................................................. 266
Figure 158. Close up of microcontroller card and signal processing hardware .................... 267
Figure 159. New and aged battery voltage profiles acquired by the dsPIC ........................... 268
Figure 160. Raw normalised impedance results, new and aged battery ................................. 269
Figure 161. Normalised impedance results, both test batteries, 8 point moving average filter
............................................................................................................................................................ 269
Figure 162. General impedance trends for the 3 modes of test at 100% SoC .......................... 277
Figure 163. General impedance trends for the 3 modes of test at 85% SoC ............................ 278
Figure 164. General impedance trends for the 3 modes of test at 0% SoC .............................. 278
Figure 165. SoH/SoC evaluation system ..................................................................................... 282
Figure 166. Overall system block diagram, AM-1 battery test system.................................... 299
Figure 167. Battery cycler interface screen .................................................................................. 302
Figure 168. IOTech Daqbook 200 data acquisition system used for the high frequency tests
............................................................................................................................................................ 303
Figure 169. AM-1 test system photograph showing installed modules and rear
interconnectivity .............................................................................................................................. 304
Figure 170. AM-1 AC distribution, circuit protection and emergency stop wiring .............. 305

27
Figure 171. Wider shot of the test system showing the high speed data acquisition, control
PC and battery under test .............................................................................................................. 306
Figure 172. AMM-1 battery cycler and controller ...................................................................... 307
Figure 173. Rear of AMM-1 battery cycler showing connections to other modules ............. 308
Figure 174. AMM-1 Battery cycler and controller block diagram ............................................ 309
Figure 175. Block diagram – VxI Oracle 200E psu (system controller) ................................... 310
Figure 176. AMM-1 Battery cycler and controller schematic ................................................... 311
Figure 177. AMM-3 bulk battery charge module internal view .............................................. 312
Figure 178. AMM-4 12V 35A Battery charger block diagram ................................................... 313
Figure 179. AMM-3 Tri-mode PRBS battery test module block diagram ............................... 315
Figure 180. AMM-3 microcontroller board schematic (digital board) .................................... 316
Figure 181. AMM-3 Tri-mode PRBS battery test module schematic (power stage, discharge)
............................................................................................................................................................ 317
Figure 182. AMM-3 Tri-mode PRBS battery test module schematic (power stage, charge) 318
Figure 183. Photograph of Heat/Cool temperature chamber .................................................... 320
Figure 184. (a) Photograph of extended low temperature chamber, and (b) battery in situ
within the chamber with thermocouple attached ....................................................................... 322
Figure 185. Timed discharge apparatus photograph ................................................................ 323
Figure 186. Timed discharge apparatus block diagram ............................................................ 324
Figure 187. Embedded PRBS test system photograph (power stage not shown) ................... 325
Figure 188. Embedded PRBS test system circuit diagram ........................................................ 326

28
List of Symbols
∆t PRBS clock period s
AhCharged Capacity used to charge the battery Ah
AhDischarged Capacity of battery during discharge Ah
C electric capacitance F
cav available capacity Ah
cAS Capacity, Ampere-seconds As
CBulk Bulk capacitance F
cp capacity according to Peukert equation Ah
cr rated capacity of battery Ah
CSurface Surface capacitance F
E electromotive force V
f excitation frequency Hz
F Faraday constant 9.64853 x 10⁴ Cmol-1
fc PRBS clock frequency Hz
fmax maximum frequency in PRBS bandwidth Hz
fmin minimum frequency in PRBS bandwidth Hz
fp frequency of clock pulse Hz
I current A
k cell capacity constant for Peukert’s equation -
n PRBS bit order -
N PRBS sequence length -
R gas constant 8.31441 JK-1mol-1

29
Rd self-discharge resistance Ω
REC electrolyte resistance (charge) Ω
RED electrolyte resistance (discharge) Ω
Ri Ohmic internal resistance Ω
Rt charge transfer resistance Ω
t time s
T absolute temperature K
td discharge time hrs
tr rated discharge time hrs
Ts overall time period of PRBS sequence s
V voltage V
VEoD End of discharge voltage V
VOCT Open circuit terminal voltage V
WCbulk Energy stored within bulk capacitor J
α activity of component -
ηBatt Battery efficiency -
τ Time constant s

30
Chapter 1. Introduction
1.1 Introduction
Electrochemical batteries and cells are a key enabling technology. The developments
in mobile telephony, electric vehicles and portable computing would have been
impossible without the complementary development of energy storage devices.
Energy storage technology has however experienced somewhat of a coming of age in
recent years as our energy demands and usage evolve and change, and we seek to
address the energy needs within transport and power generation. Whilst lateral
technologies such as flywheel energy storage [1] and pumped electrolyte (Vanadium
Redox Batteries) [2, 3] are investigated, there remains a heavy focus on the
development of electrochemical cells, and it is indeed an exciting time for those
individuals involved in applied battery research.
The application of energy storage technologies is becoming increasingly diverse, and
multiple charge sources (PV, Wind turbine, regenerative braking etc.) may present
themselves to the energy storage system being used. Dynamic charge and discharge
cycles, and wide operating temperature range generate the need for battery testing
schemes which evaluate performance somewhat independent of any knowledge of
the application. Furthermore, the domestic market for power generation is
transitioning from grid tied inverters to self-consumption, with large growth seen in
this market within Germany [4]. Self-consumption relies on an element of energy
storage, unlike grid tie, and as such the battery system represents significant
component of the ongoing cost of ownership of such systems [5]. As we enter this

31
next phase of distributed home generation, there will be much focus on the State-of-
Function (SoF) of batteries – the ability of the battery to deliver performance in line
with its design window of operation, as it is apparent that with accurate state
reporting, the useful life of a battery pack can be extended, or as a minimum, the end-
of-life of such a pack could be more accurately predicted, informing the financial and
environmental costs of a battery system over its lifetime.
Electric vehicles are regarded as a recent innovation, but the Lohner Porsche with its
hub wheel mounted motors was unveiled in 1900[6], and a year later a version was
unveiled at the Paris motor show with a complementary internal combustion engine
– the world’s first hybrid vehicle [7]. This technology has had a recent revival with
the moves to reduce emissions from vehicles, leading to growth in the EV/HEV
marketplace we see today. This in turn has led to the development of large capacity
(10 - 30kWh) Lithium Ion batteries [8], and the market for these batteries within the
hybrid and electric vehicle market alone is predicted to be worth $8 billion by 2015
[9]. Government targets for renewable energy adoption [10] have driven the
emergence of distributed power generation leading to requirements for large
capacity energy storage to buffer Photo Voltaic (PV) installations. 1MW + Lithium Ion
systems are already being built [11] to address this need, and a current project under
development by the University of Sheffield is concerned with a 2MW system for grid
reinforcement [12]. Energy storage is therefore being more widely applied than ever
before, and batteries and cells of all chemistries present ongoing problems in terms
of measurement of State-of-Function (SoF), State-of-Health and State-of-Charge (SoC)
of the battery or cell. These parameters are interrelated, with State-of-Function being

32
affected by State-of-Health, temperature and State-of-Charge. State-of-Health
describes the absolute health of the battery within standard operating conditions, and
declining SoH is characterised by loss of capacity or inability to deliver current. State-
of-Charge relates to the available battery capacity at any time and is only affected by
the level of charge or discharge applied to the battery or cell, and equates to the “fuel
tank” of the battery.
The electrochemical “fuel gauge” is notoriously difficult to realise, due to the largely
non-linear nature of cell behaviour, with the complex processes within batteries
leading to differences in available capacity dependent on magnitude of load, ambient
temperature and age of the batteries themselves. Measuring and modelling of these
contributing factors is complex, and any method which can obtain a direct value for
the energy remaining in a given cell or battery at a specific time is therefore very
attractive. Methods of SoC reporting have been used which employ measurement of
terminal voltage [13], and this can be effective if the load is constant, but typically the
terminal voltage related SoC characteristic requires implementation of an algorithm
to allow for cell degradation, and is difficult to implement with a dynamic
load/charge profile, (such as is the case in EV/HEV applications). Existing methods
involving Coulomb counting have been successful in consumer electronics , but are
often subject to periodic recalibration to maintain accuracy [14]. Again, these
methods can become ineffective with declining SoH, as the battery degradation can
manifest itself in different ways dependent on the nature of the application, and how
the powered device has been used during the lifetime of the battery (elevated
temperature, high number of cycles, depth of discharge etc.). The cost of large

33
capacity (10-30kWh) battery packs is driving the need for near 100% utilisation, and
an aged battery pack with a 30% capacity reduction is still usable if the SoF can be
accurately reported.
Environmental concerns will continually be a focus within applied battery
technology, and the potential environmental benefits of EVs and distributed micro
generation and storage, will need to be weighed against the consumption of raw
materials in battery production and the consequential waste introduced into the
recycling loop. The recycling infrastructure for Lithium based chemistries is
immature and open loop, with much of the recycled material being used for other
purposes (e.g. construction feed material). Research into worldwide lithium reserves
indicates that at the projected rate of consumption these reserves could be expended
by the year 2100 [15]. It therefore follows that, in conjunction with establishing a
closed loop recycling process, the prudent use of batteries to end of life – generally a
reduction in capacity to 80% or less [16, 17], is clearly important. As such, new
industries are being developed to support the increased reuse of batteries, and much
of this activity will concentrate on the EV marketplace, and the reuse of these batteries
either in EVs, or in identified opportunities to utilise the remaining function in the
batteries for a different application. Already, ABB and General motors are
collaborating on a project to reuse EV battery packs in smart grid applications [18],
whilst BMW and Vattenfall have a research partnership for similar reuse in power
cache applications for fast charge stations and grid stabilisation [19].
The challenges therefore which face the efficient use of batteries and cells throughout
their useful life centre on improved methods for establishing battery state, and
34
developing methods which can dynamically assess the battery condition accurately,
irrespective of ambient temperature, rate of charge and rate of discharge.
The “holy grail” in terms of battery testing is a system which can conduct a
measurement whilst online to accurately report the overall state of the battery or cell
without prior knowledge of its use or age. This work seeks to answer questions
regarding measurement of SoH, SoC and SoF for batteries and cells using non-
intrusive methods of analysis, in order to develop cross-chemistry techniques which
can be used to develop on-line battery fuel-gauge systems.
1.2 Motivation
The motivation for this work was focussed on investigating novel battery state
evaluation and testing requirements that may fall outside of the capabilities of
existing schemes.
Specifically, the developed technology must add to the pool of knowledge, bringing
a new approach to the problem of examining battery state, which may be used alone,
or within a hybrid system in conjunction with existing schemes.
Further to this the developed tests should be demonstrated to be useful over a range
of battery operating conditions likely to be encountered in application.
The research undertaken within this work was partnered with industry, and as such
sufficient development of the techniques examined to allow a first generation
implementation of the technology within a commercial product would be a desired
output from the research.

35
1.3 Literature search and background reading
A review of published work was carried out which focused on the current state of
battery technology, which follows in chapter 2, and concentrated on the main
commercially available chemistries, and those under development. Secondly, current
research into methods for SoC, SoH and SoF of these chemistries was examined, with
a view to establishing the novelty of the proposed research, and its potential
contribution to the pool of knowledge. Investigation of commercially available
battery management systems further informed the current state of the technology. In
addition to this, as areas of novelty emerged, these were examined for previous
research, notably frequency domain analysis of batteries and cells. Library resources
within the University of Sheffield, and its affiliated libraries were used for both
hardcopy and electronic sources. Further on-line resources were used, notably
IEEExplore, Elsevier (Journal of Power Sources), electronic resources from battery
manufacturers, and those of organisations researching and developing new battery
technologies.

36
Figure 1. Published research activity within battery and energy storage, 1999-2012
The chart shown in Figure 1 illustrates the timeliness and validity of the research.
Using Scopus as a search tool for published work in the subject area [20], searches
were carried out using the following keywords:
Battery, storage battery, lithium ion, lithium ion battery, lithium electrode, energy
storage system, storage system, charging, electrochemical, battery system, electrolyte,
battery storage, cycle life, fuel cell, storage technology, wind power, energy storage
li ion battery, lithium battery, battery, cell, electric, grid electrodes, lead acid battery,
rechargeable battery, battery systems, cathode, discharging, electric vehicle.
Within the disciplines:
Materials Science, Energy, Engineering, Chemistry, Chemical Engineering and
Environmental Science.
0
5000
10000
15000
20000
25000
30000
35000
40000
45000
1999 2000 2001 2002 2003 2004 2005 2006 2007 2008 2009 2010 2011 2012
Published research in the subject area 1999-2012
Total publications Journal publications
37
It is clear from the observed trends on the chart that there is much focus on energy
storage within the research community and that the topic is current. Year on year an
upward trend is observed, with the notable exception of 2008, which may be linked
to the global economic situation that arose in that year. The 2009-2012 trend shows
that the research community is within a period of exponential growth in this area,
and certainly the growth in the use of electric vehicles (as seen in Figure 2) will have
had a direct relation to this trend [21].
Figure 2. UK Low emission vehicle registrations, 2010-2013
1.4 Outstanding technical challenges
In designing and testing new methods of battery state evaluation, the applicability of
the technology over operational conditions that are likely to be encountered by the
energy storage system must be understood. Research was therefore needed that
0
500
1000
1500
2000
2500
3000
3500
Jan
-Mar
Ap
r-Ju
n
Jul-
Sep
Oct
-Dec
Jan
-Mar
Ap
r-Ju
n
Jul-
Sep
Oct
-Dec
Jan
-Mar
Ap
r-Ju
n
Jul-
Sep
Oct
-Dec
Jan
-Mar
Ap
r-Ju
n
Wh
ole
yea
r
Wh
ole
yea
r
Wh
ole
yea
r
2010 2010 2010 2010 2011 2011 2011 2011 2012 2012 2012 2012 2013 2013 2010 2011 2012
Ultra-low emission vehicle (EV and HEV) UK new registrations
2010-2013

38
characterised the test batteries against existing test methods, and developed models
which could be used to report battery state.
The predominant chemistry that was examined in the body of this work was Lead-
Acid. The rationale behind this is that an extensive body of prior research relating to
Lead-Acid batteries and cells is available, allowing techniques to be developed, to be
subsequently applied to other chemistries. Furthermore the author’s prior experience
within industry is within the field of Lead-Acid battery charging and testing
methods, and therefore existing testing schemes are well understood.
The objective of this work was to develop systems to investigate SoH, SoC and SoF
independent of prevailing conditions, and without any need for prior knowledge of
the battery state. Therefore the thesis is concerned with:
Exploring the use of Pseudo Random Binary Sequences as a perturbation
signal for battery characterisation.
The development of test systems which investigate battery state evaluation
methods over the operational envelope of the test batteries.
The establishing of models for the test batteries based on these experiments
allowing correlations to be made between battery state and equivalent circuit
components.
The examination of different modes of test for the developed technology, and
trends across these methods that facilitate state identification.
The realisation of this technology in a deployable format which could either
be incorporated in a charging system, test instrument or intelligent battery.
39
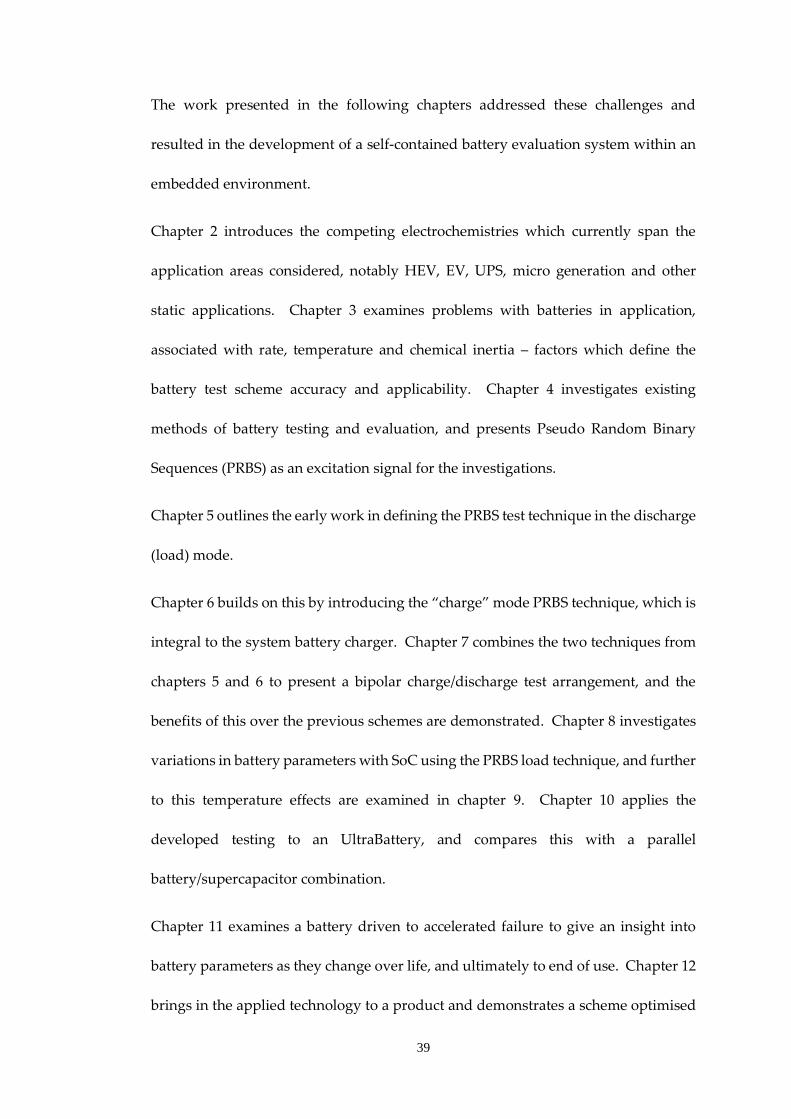
The work presented in the following chapters addressed these challenges and
resulted in the development of a self-contained battery evaluation system within an
embedded environment.
Chapter 2 introduces the competing electrochemistries which currently span the
application areas considered, notably HEV, EV, UPS, micro generation and other
static applications. Chapter 3 examines problems with batteries in application,
associated with rate, temperature and chemical inertia – factors which define the
battery test scheme accuracy and applicability. Chapter 4 investigates existing
methods of battery testing and evaluation, and presents Pseudo Random Binary
Sequences (PRBS) as an excitation signal for the investigations.
Chapter 5 outlines the early work in defining the PRBS test technique in the discharge
(load) mode.
Chapter 6 builds on this by introducing the “charge” mode PRBS technique, which is
integral to the system battery charger. Chapter 7 combines the two techniques from
chapters 5 and 6 to present a bipolar charge/discharge test arrangement, and the
benefits of this over the previous schemes are demonstrated. Chapter 8 investigates
variations in battery parameters with SoC using the PRBS load technique, and further
to this temperature effects are examined in chapter 9. Chapter 10 applies the
developed testing to an UltraBattery, and compares this with a parallel
battery/supercapacitor combination.
Chapter 11 examines a battery driven to accelerated failure to give an insight into
battery parameters as they change over life, and ultimately to end of use. Chapter 12
brings in the applied technology to a product and demonstrates a scheme optimised

40
for a Microchip dsPIC within an embedded environment. Chapter 13 draws
conclusions from the research and suggests opportunities for further work.
1.5 Contribution
The majority of the work presented in this thesis has been presented internationally
within learned journals and international conferences, with a further chapter being
the subject of a commercial development project, partnered with industry. As such
the work has been subject to extensive peer review throughout, and has been
demonstrated as a commercially viable technology.
The specific investigations carried out have led to characterisation of energy storage
networks using Pseudo Random Binary Sequences, encompassing Lead-Acid,
batteries, hybridised batteries (Ultrabatteries) and parallel battery-supercapacitor
networks.
The PRBS battery test technique has been explored by examining the charge,
discharge and bipolar PRBS test techniques for batteries, and showing that each
technique has applicability in identifying SoC, SoH and SoF.
The PRBS charge technique has been developed in the voltage mode to detect SoC
and propose its operation as a means for charge stage transition in multi-stage battery
chargers.
An overview of the chapters within the thesis, the output from the research, and the
connection with the published work are shown in Figure 3.

41
Chapter 1Introduction
Chapter 2The current state of energy storage
technologies
Chapter 3Problems with
batteries
Chapter 4Testing of batteries
Chapter 5Discharge mode Pseudo Random Binary sequence battery testing
Chapter 6Charge mode
Pseudo Random Binary sequence battery testing
Chapter 7Bipolar mode
Pseudo Random Binary sequence battery testing
Chapter 8Variations in
battery parameters with State-of-Charge
Chapter 9Effects of
temperature on parameters
within batteries
Chapter 10UltraBatteries and Battery/
Capacitor energy storage networks
Chapter 11Accelerated
failure analysis of Lead-Acid
batteries
Chapter 12An embedded
implementation of the PRBS battery state evaluation technique
Contribution
Conference Publication
Fairweather, A.J., M.P. Foster, and
D.A. Stone, VRLA battery parameter
identification using pseudo
random binary sequences
(PRBS),PEMD, Brighton, 2010
Journal publication
Fairweather, A.J., M.P. Foster, and
D.A. Stone, Battery parameter
identification with Pseudo
Random Binary Sequence
excitation (PRBS). Journal of Power
Sources, 2011. 196(22): p. 9398-
9406.
Conference Publication
Fairweather, A.J., M.P. Foster, and D.A. Stone, State
indicators for lead acid batteries
utilising Pseudo Random Binary
Sequences (PRBS) in All Energy
2012. 2012: Aberdeen, Scotland.
Journal publication
Fairweather, A.J., M.P. Foster, and D.A. Stone, MLS Testing of VRLA Batteries using
Pseudo Random Binary Sequences
(PRBS). World Electric Vehicle
Association Journal, 2012. Vol
4: p. 405-412.
Conference publication
Fairweather, A.J., M.P. Foster, and D.A. Stone, MLS Testing of VRLA Batteries using
Pseudo Random Binary Sequences (PRBS), in EVS 25. 2010: Shenzhen,
China. p. 405.
Conference publication
Fairweather, A.J., M.P. Foster, and
D.A. Stone, State-of-Charge
Indicators for VRLA Batteries Utilising Pseudo Random Binary
Sequences (PRBS), in PCIM
Europe 2011. 2011: Nuremberg,
Germany.
Conference publication
Fairweather, A.J., M.P. Foster, and
D.A. Stone, Modelling of
VRLA batteries over operational
temperature range using
Pseudo Random Binary Sequences. Journal of Power
Sources, 2012. 207(0): p. 56-59.
Journal publication
Fairweather, A.J., D.A. Stone, and
M.P. Foster, Evaluation of
UltraBattery™ performance in
comparison with a battery-
supercapacitor parallel network. Journal of Power
Sources, 2013. 226(0): p. 191-201.
Conference publication
Fairweather, A.J., M.P. Foster, and
D.A. Stone, Application of
Maximum Length Sequences to
Battery Charge Programming for
Parameter Estimation in
Lead-Acid Batteries, in PCIM
Europe 2013. 2013: Nuremberg,
Germany.
Conference publication
Fairweather, A.J., M.P. Foster, and
D.A. Stone, Bipolar Mode
Pseudo Random Binary Sequence
Excitation for Parameter
Estimation in Lead-Acid
Batteries, in PCIM Asia. 2013:
Shanghai, China.
Implementation of research within
a commercial product via industrial sponsor
Demonstrated the PRBS technique and identified
batteries in differing SoH
Examined charge mode PRBS as an
online system within a charger. Identifies charge stage transition
using Voltage mode PRBS
Investigated a net zero energy
method of PRBS battery test.
Examined mean terminal voltage as
an indicator
Identified correlations
between CSurface and SoC using PRBS
Battery parameters reported over
operating temperature range
using PRBS
Examined UltraBattery in
comparison with SLA/supercapacitor
parallel network
Identified trends in battery failure over
service life using discharge, charge and bipolar PRBS. Development of
widely applicable SoC/SoH indicators
Complete PRBS
battery test system with FFT within
embedded device
Published work
Novel work
Figure 3. Summary of thesis structure with contribution to the research community

42
Chapter 2. The current state of energy storage technologies
2.1 Introduction
A review of published work was carried out which focused on the current state of
energy storage technology, across commercially available chemistries and those
under development.
Library resources within the University of Sheffield, and its affiliated libraries were
used for both hardcopy and electronic sources. Further on-line resources were used,
notably IEEExplore, Elsevier (Journal of Power Sources), electronic resources from
battery manufacturers, and those of organisations researching and developing new
battery technologies.
The following section outlines in a concise manner the state of cell and battery
technology at the time of this report. The content is based on research into
commercially available technologies, experience of the author in using the
technologies within a career in research and development, international
environmental directives affecting the future of chemistry types, and the pool of
current research into new energy storage technologies. Fine detail regarding the
chemical composition of the cell types is avoided except where relevant to the
application of the cell types, or where classifying the cell family.

43
2.2 Voltage limits and charging terminology
All battery and cell types have voltage windows of operation for both charge and
discharge, and End-of-Discharge (EoD) voltages will be provide by the battery or cell
manufacturer. Discharging beyond these limits can permanently damage the battery,
and for example, a 12V VRLA battery that has been discharged beyond 1.3 Volts per
cell/7.8V (20°C) will experience sulphation and may become unrecoverable [16, 17].
Upper voltage limits for charging are defined by individual chemistry, and are
related to the active material in the cell. Similarly charge current recommendations
will be provided and generally these are stated as a multiple of the rated capacity (cr)
in Ah.
Constant voltage, float and trickle charging are often used as interchangeable terms,
but differ in some aspect. Constant voltage charging can be used for all battery
chemistries, but may not be the optimum method for energy transfer into the battery
for all types, and may have lifetime limiting effects with some chemistries. The
“float” voltage for a lead acid battery is the voltage at which the battery can accept
charge, at the defined temperature, and this charge can be applied indefinitely
without damage to the battery. A “float” charge is therefore a constant voltage charge
profile, and this is often used in UPS systems and battery backed equipment. The
charger will be current limited, so initially the charger may be operating in a constant
current mode, dependent on the initial battery state. Trickle charge generally refers
to a float charge voltage being applied to a battery at low charge current – typically
maintaining the battery in a charged state, and by default occurs at the end of a float
charge.
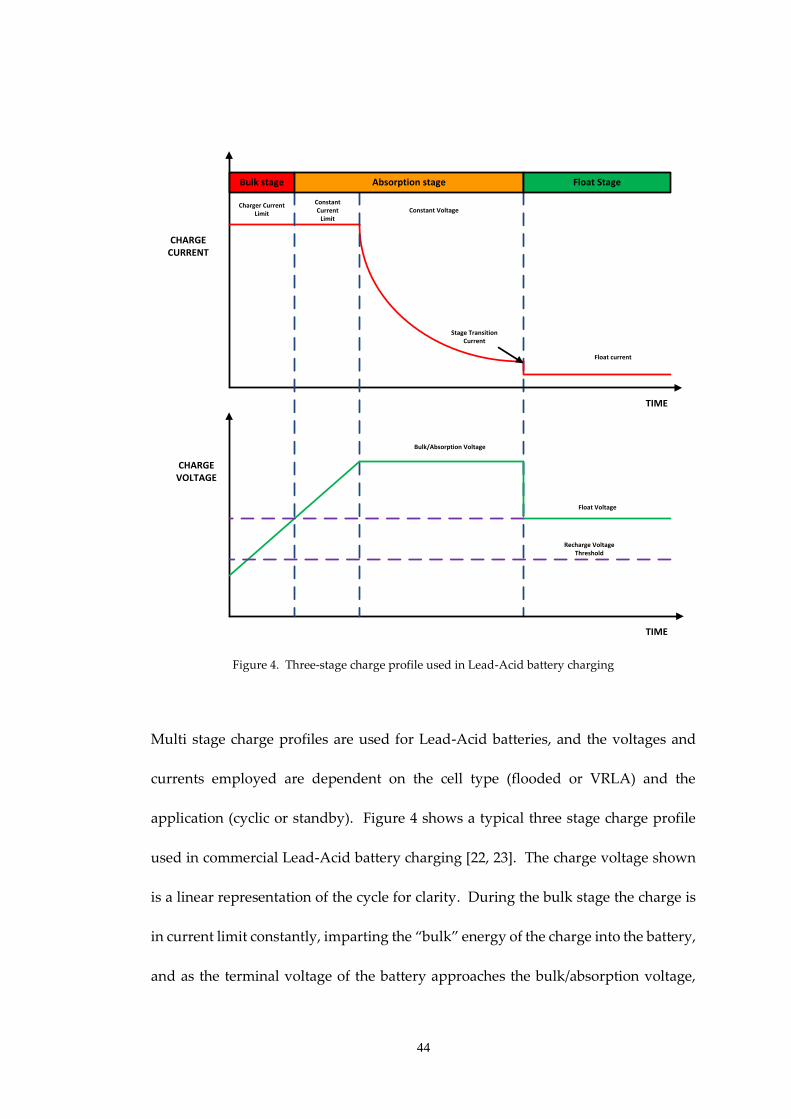
44
TIME
TIME
Bulk stage Absorption stage Float Stage
CHARGE CURRENT
CHARGE VOLTAGE
Constant VoltageConstant Current
Limit
Charger CurrentLimit
Stage Transition Current
Bulk/Absorption Voltage
Float Voltage
Recharge VoltageThreshold
Float current
Figure 4. Three-stage charge profile used in Lead-Acid battery charging
Multi stage charge profiles are used for Lead-Acid batteries, and the voltages and
currents employed are dependent on the cell type (flooded or VRLA) and the
application (cyclic or standby). Figure 4 shows a typical three stage charge profile
used in commercial Lead-Acid battery charging [22, 23]. The charge voltage shown
is a linear representation of the cycle for clarity. During the bulk stage the charge is
in current limit constantly, imparting the “bulk” energy of the charge into the battery,
and as the terminal voltage of the battery approaches the bulk/absorption voltage,

45
the charge current reduces accordingly. As the charge current continues to fall, the
stage transition current limit will be met – this is the point at which the majority of
charge has been accepted by the battery or cell, and at this point the charger output
voltage reverts to the float level, which can be applied indefinitely to the battery.
Batteries used in cyclic applications will generally be charged at a higher voltage than
those used in standby systems, and flooded batteries may have a periodic
equalisation charge to improve battery performance and prevent stratification of the
electrolyte.
TIME
TIME
Bulk stage Absorption stage Float Stage
CHARGE CURRENT
CHARGE VOLTAGE
Stage Transition Current
Constant VoltageConstant CurrentCharger CurrentLimit
Float Voltage
Bulk/Absorption Voltage
Equalisation Voltage
Equalisation stage
Recharge VoltageThreshold
Constant VoltageCharger Current
Limit
Float Current
Equalisation
Figure 5. Lead-Acid battery charge profile with equalisation

46
Figure 5 shows a 4 stage charge profile with equalisation [22, 23]. The stages used
are the same as for a three stage charge profile, with an additional, elevated voltage
charge phase used in cell balancing. During the equalisation phase, the cells are
subject to this increased voltage, which leads to gassing and agitation of the
electrolyte. The stage is usually timed, or alternatively, where individual cell
voltages can be measured, the end point can be defined by balance being attained
using this measurement, or specific gravity measurements can be used. Cell balance
is defined when cells are within a 0.4% voltage window or 0.005 points in specific
gravity [22, 23].
Equalisation stages are not generally used on every charge cycle and applied
periodically dependent on the application. Cells outside of an overall 300mV
window within a 12V battery, or have a range of specific gravity measurement of
greater than 0.030 points require an equalisation to be carried out [22, 23].
Table 1. Summarises typical voltage limits for Lead-Acid battery charge at 20°C [16,
17, 22-24], along with bulk charge current rates and stage transition currents.
Table 1. Typical Voltage and current levels for Lead-Acid battery and cell charge at 20°C
(Voltages per cell with corresponding 12V battery voltage in brackets)
Technology Recharge
voltage
threshold*
V
Float Voltage
V
Bulk/
Absorption
Voltage
V
Equalisation
Voltage
V
Bulk charge current
(fraction of rated capacity)
A
Stage transition
current (fraction of
rated capacity)
A
Flooded [16, 22, 23]
1.920
(11.52)
2.25
(13.50)
2.470
(14.82)
2.700
(16.20)
0.35 0.03
VRLA [16, 17]
1.920
(11.52)
2.275 (13.65) 2.450
(14.70)
- 0.25 0.05
Spiral
Wound [16, 24]
2.00
(12.0)
2.275 (13.65) 2.450
(14.70)
- 0.4 0.05
*open circuit voltage, initial, or steady-state after discharge. Specific Gravity* (SG)

47
Constant current charging with end point detection is most often used with NiCd,
NiMH and Lithium chemistries, and under these conditions a constant current is
applied to the battery or cell until an end of charge event is detected, commonly an
increase in cell temperature, or for NiMh specifically, a characteristic drop in cell
voltage (Figure 6) [25].
0% State-of-Charge 100%
Ch
arg
e V
olt
age/
Cel
l (V
)
1.6
1.4
1.2
1.0
0.8
Figure 6. NiMh charge characteristics showing charge end point (20°C)
Temperature compensated charging is used across several battery chemistries, but
came to the fore with the invention of Valve Regulated Lead-Acid (VRLA) batteries,
where the internal gas recombination processes required that the charging be closely
controlled, in order that overcharge does not occur (consuming the electrolyte) and
ensuring that full capacity is reached at low temperature. This charging method is
equally applicable to flooded cells, despite them being more tolerant of overcharge.
Typically, the charge voltage will be specified at 20°C and deviations from this
ambient temperature require a 3mV/°C adjustment in the charger voltage with a
negative coefficient [17, 24]. The type of charging scheme employed will depend to

48
some extent on the application, and the Depth of Discharge (DoD) experienced by the
battery or cell during each cycle in use.
.
2.3 Lead-Acid
Lead-Acid batteries are a mature technology, which have been in widespread use for
many years. The technology was developed by Gaston Planté in 1859 [16], and since
that time the chemistry has become extremely widespread in use. Predominately
used in starting, lighting and ignition (SLI) for internal combustions engines, the
batteries also find widespread employment in electric vehicles, renewable energy,
and battery supported systems such as uninterruptible power supplies.
Figure 7. An unused radio 2V 70Ah “accumulator”, manufactured by Exide circa 1930-1940
(photograph by author)

49
Lead-Acid batteries first delivered electricity to the populous when the early
electrical appliances became available to the consumer. Lead-Acid “accumulators”
(Figure 7) were delivered to domestic premises in order to power the valve radio sets,
and the “Accumulator man” would take away the used battery for recharging,
exchanging it with a charged unit. This early electric distribution method allowed
the first steps in growth within consumer electronics, and this fuelled demand for
other electrical appliances, which in turn led to the growth of the electrical
distribution network to domestic customers.
The chemistry benefits from a widespread and mature recycling network, which
leads to efficient reuse of the constituent materials, predominantly the lead itself.
With more than 98% of all battery lead being recycled [26] Lead-Acid batteries
arguably represent the most sustainable incarnation of energy storage within existing
technologies. Where the batteries score highly, apart from the mature recycling
infrastructure, is that they still represent the best value for money in terms of cost of
ownership of all of the current battery technologies, with a well understood cost per
Kwh and life cycle cost [5]. Where the technology suffers is energy density as
compared to the recent developments in the lithium based chemistries, and as such
Lead-Acid batteries have been designed out of the majority of portable equipment.
The technology is split fundamentally between the traditional flooded cells (Figure
8a) [23], and the Valve Regulated Lead-Acid (VRLA) battery (Figure 8b) [27], often
incorrectly termed “sealed lead-acid”.

50
Figure 8(a) Flooded cyclic Lead-Acid battery and (b) Typical VRLA battery for standby applications
(Photographs courtesy Trojan batteries and Yuasa Europe respectively)
Flooded cells are still in widespread used in Starting, Lighting and Ignition (SLI),
traction, and stationary energy storage applications, and offer tolerance to high
charge and discharge rates.
For all types of Lead-Acid batteries, available capacity is subject to prevailing
conditions and this is demonstrated in the way the batteries are specified, with VRLA
types typically having rated capacity quoted for a 20 Hr discharge rate [17]. Similarly,
reduced temperature effects capacity, and most Lead-Acid batteries are almost
unusable at -20°C. This and other problems associated with application of batteries
and their performance are given a thorough treatment in chapter 3.
Charging of Lead-Acid batteries is fairly straightforward, and particularly so for
flooded cells. Three-stage charging regimes are generally used for these batteries,
using an elevated voltage per cell (equalisation) periodically applied to mitigate
stratification of the electrolyte.
The charging process for VRLA batteries is slightly different, with similar charge
voltages, although requiring closer control, and without an elevated charge voltage
phase. The internal recombination processes involved in these batteries mean that
temperature compensated battery charging is generally employed to attain this close

51
control, and although rapid charging can be carried out, these batteries are intolerant
of overcharge, and some form of end-point-detection, or timed charge must be used
for increased charge rates.
2.3.1 Flooded Lead-Acid
Flooded Lead-Acid batteries have dominated the automotive SLI marketplace
from its inception. The ability of these batteries to deliver very high currents
and their tolerance of rapid charge aligns them very well with electric traction
applications and they have experienced widespread use in the first generation
of widely adopted EVs (mainly utility vehicles) [28]. The main areas of current
research within flooded batteries have concentrated on improved plate (grid)
construction, seeking to maximise active area with the batteries and reduce
corrosion [29]. Traditionally the lead in the plates have been alloyed with
antimony by 5 to 12% to reduce brittleness, but modern alloys reduce this
content to 1.5 to 2%, which improves water consumption and therefore reduces
maintenance of the batteries in service. Other elements have been introduced,
such as tin, to mitigate the reduction in antimony, and fractions of silver, cobalt
and selenium have been introduced to improve resistance to corrosion [16].
“Calcium grid” is an often used term in modern day Lead-Acid batteries and
this umbrella covers several alloys used in grid production with varying
percentages of calcium metal. These alloys have improved manufacturability,
which in itself facilitates more elaborate plate design, improved overall
performance and extended life. Further research is being carried to address the
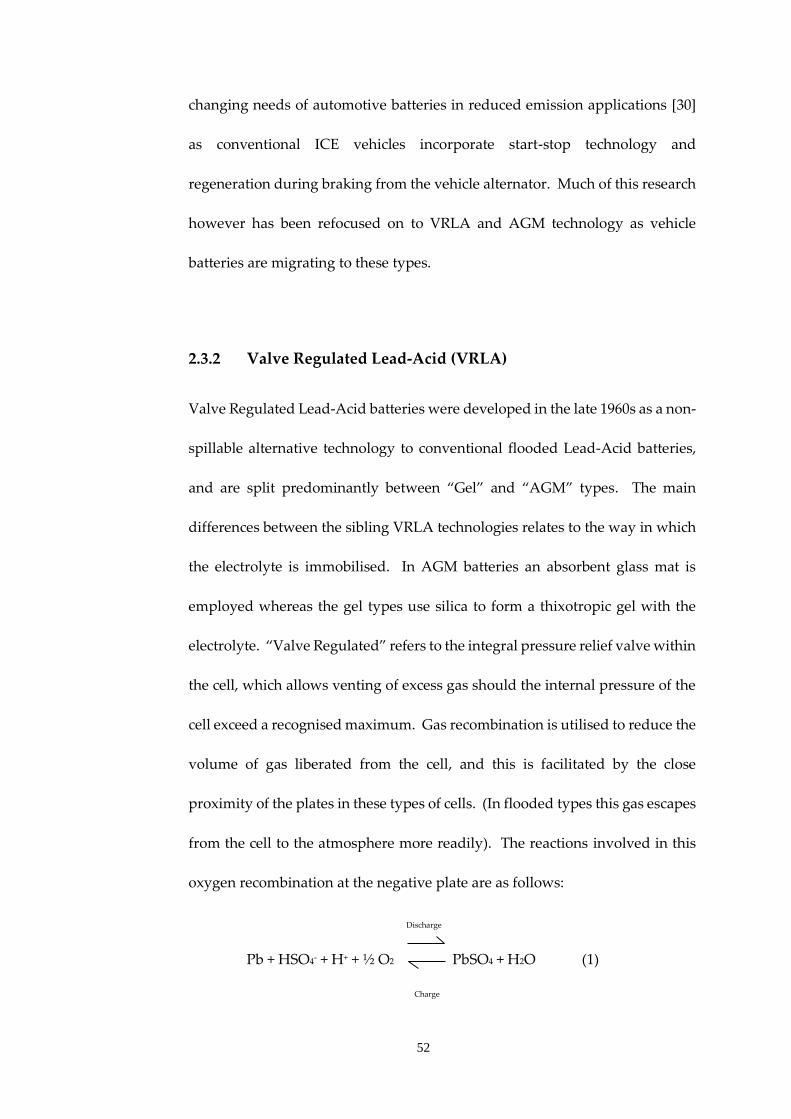
52
changing needs of automotive batteries in reduced emission applications [30]
as conventional ICE vehicles incorporate start-stop technology and
regeneration during braking from the vehicle alternator. Much of this research
however has been refocused on to VRLA and AGM technology as vehicle
batteries are migrating to these types.
2.3.2 Valve Regulated Lead-Acid (VRLA)
Valve Regulated Lead-Acid batteries were developed in the late 1960s as a non-
spillable alternative technology to conventional flooded Lead-Acid batteries,
and are split predominantly between “Gel” and “AGM” types. The main
differences between the sibling VRLA technologies relates to the way in which
the electrolyte is immobilised. In AGM batteries an absorbent glass mat is
employed whereas the gel types use silica to form a thixotropic gel with the
electrolyte. “Valve Regulated” refers to the integral pressure relief valve within
the cell, which allows venting of excess gas should the internal pressure of the
cell exceed a recognised maximum. Gas recombination is utilised to reduce the
volume of gas liberated from the cell, and this is facilitated by the close
proximity of the plates in these types of cells. (In flooded types this gas escapes
from the cell to the atmosphere more readily). The reactions involved in this
oxygen recombination at the negative plate are as follows:
Discharge
Pb + HSO4- + H+ + ½ O2 PbSO4 + H2O (1)
Charge

53
When the cell is recharged, particles of lead sulphate are converted to sponge
lead at the negative electrode and lead oxide at the positive electrode. As the
cell approaches complete recharge, the majority of these conversion reactions
have occurred and overcharge reactions begin. For conventional flooded cells
this results in the production of hydrogen and oxygen gas, and virtually all of
the evolved gas escapes from the cell. In VRLA batteries, the closely spaced
plates are separated by a glass mat. This mat allows the cell to be filled with an
optimal quantity of electrolyte, which coupled with the proximity to the plate
itself facilitates recombination of the majority of evolved gases, if charged at
recommended rates [31].
Commercially available VRLA batteries are available in a range of industry
standard form factors, in the sub 100Ah capacity range, being used for
applications ranging from uninterruptible power supplies to low level EV (golf
carts etc.). Power density in VRLA batteries is similar to flooded types, leading
to them appearing less attractive to the Lithium chemistries for many
applications.
Despite this current focus on the Lithium chemistries, research in VRLA
batteries remains popular as they displace flooded batteries in SLI use [32], and
offer potential as a cost competitive alternative to Lithium chemistries in
HEV/EV applications [33, 34]. Atraverda have developed a bipolar VRLA
technology, which offers an increased energy density, reduced internal
impedance, and due to the plate design, uniform current distribution over the
plate [35]. The addition of carbon in the negative plate has also led to

54
performance improvements in VRLA batteries and several investigations are
ongoing in this area [36-38].
2.3.3 Spiral wound VRLA
Spiral wound VRLA cells offer an alternative approach to conventional VRLA
batteries in that the “plates” comprise spiral wound lead foils separated by an
AGM suspended electrolyte. It is interesting to note that spiral wound cells
represent the first generation in AGM technology, with conventional plate
designs following afterwards [39]. This construction leads to the cells having a
high effective area allowing high discharge rates. As such batteries constructed
from spiral wound cells (Figure 9) find applications in motorsport, in starting
of high compression engines [40].
Figure 9. Spiral wound Lead-Acid SLI battery for motorsport applications (image courtesy
Optima batteries)
This high effective area also offers advantages with low temperature operation,
and typically spiral wound cells outperform conventional VRLA batteries

55
under these conditions [17, 24]. The technology has been evaluated for HEV
use, and enhanced spiral wound cells were developed in conjunction with
Enersys, employing terminals duplicated at both ends of the cell plates,
allowing an even distribution of temperature in the cell during high rate charge
and discharge. The cells were demonstrated as a viable alternative to NiMh
cells in a Honda Insight HEV test vehicle [41].
2.3.4 Lead-Acid Ultrabatteries
“Ultrabatteries” relate to a VRLA technology that has been developed to
address the application of Lead-Acid batteries to HEVs. It is widely recognised
that a Lead-Acid cell in parallel with a supercapacitor offers benefits in
applications where rapid changes from charge to discharge are made, such as
during regenerative braking and acceleration [33]. The use of this peak power
buffer overcomes some of the issues associated with Lead-Acid batteries in
HEV use, and this requirement has led to the technology pioneered by the
Commonwealth Scientific and Industrial Research Organisation (CSIRO),
Australia's national science agency. CSIRO have developed a “hybridised”
lead-acid battery technology which integrates a Lead-Acid battery and a super
capacitor in one unit [42], addressing these HEV applications requiring a peak
power buffer [33, 37]. Lead-Acid cells comprise a positive and negative plate,
consisting of lead-dioxide and sponge lead respectively. The CSIRO
investigation developed asymmetric supercapacitors using the conventional
positive plate with a carbon based negative plate. Connecting these different

56
cell configurations in parallel leads to a battery with integral capacitance which
is suitable for HEV duty [42].
Figure 10. Lead-Acid “UltraBatteryTM” manufactured by Furukawa for HEV applications
(photograph by author)
These batteries are now being manufactured under licence by the Furukawa
Battery Co Ltd in Japan [43] (Figure 10), and East Penn Manufacturing Co Inc.
[44] in the United States.
2.4 Nickel Cadmium (NiCd)
Nickel Cadmium cells were first developed by Waldemar Jungner of Sweden in 1899
[45] and have been in widespread use since that time. Until recently NiCd cells were
widely used as rechargeable power sources for consumer electronics, offering around
500 to 2000 cycles and hence a usable power source for a cyclic device, compared to
200-700 cycles for Lead-Acid [16, 46]. However, heavy metals such as Cadmium are
damaging to the environment, and are a known human carcinogen. As such a

57
European directive [47] has led to the use of small NiCd cells being banned in
consumer goods, however exemptions in the directive still allow the use of this
chemistry in emergency and alarm systems and emergency lighting (where limited
alternatives are available for the specified high temperature operation). The cells are
still permitted for use in medical equipment (due to issues with approving
replacement technologies) and cordless power tools, as the cells exhibit good
performance under high current pulse discharge, although Lithium chemistries are
advancing on this marketplace and have gained significant ground. Finally, the cells
are still permitted in military applications, and this will be due to a combination of
upper temperature range performance, pulse current capability, and the fact that
military equipment has a requirement for a long maintainable life (flooded NiCd cells
can have a service life in excess of 20 years, whereas Lead-Acid batteries have a
service life of 5 years for commodity batteries, and 10-12 years for high quality
standby batteries) [24, 48].
Manufacturers such as Saft are still extremely active in the production of large NiCd
cells and flooded NiCd cells (Figure 11.) also remain readily available, with
manufacturers such as Alcad and Storage Battery Systems producing these cells in
capacities ranging from 10Ah to over 1500Ah [48]. In spite of the “memory effect”
exhibited by this chemistry [49] – the effective loss of capacity due to repeated partial
discharge - the cells still find applications where wide temperature range and long
service life (particularly the flooded cells) are desirable attributes. The low
temperature performance of NiCd cells eclipses Lead-Acid, with the cells remaining
operable at -20°C, and whilst lead-acid batteries experience a steep reduction in

58
service life at temperatures over 30°C, NiCd are more resilient, with some cells
operating to 70°C [17, 50]. In terms of charging, a constant current regime is
employed, and for longevity of the cells themselves a charge rate of 10% of rated
capacity (cr) in amps (cr/10), or ideally cr/20 should be used, effectively a “float”
charge, with a factor applied for cell efficiency (typically 120-140% of capacity) [16].
Figure 11. Flooded NiCd stationary cell (image courtesy of Storage Battery Systems Inc.)
Higher charge rates can be used, and have been essential in the widespread use of
cordless power tools, with the trade-off of service life being reduced. Research
activity with NiCd has been somewhat impacted by the environmental concerns in
using the chemistry, and is regarded as a dying technology by many in the research
community. The wholesale replacement of NiCd cells by NiMH in consumer
products, and the success in Lithium chemistries in subsequently replacing NiMH
means that NiCd cells have a less than bright future.

59
2.5 Nickel Metal Hydride (NiMH)
Nickel Metal Hydride (NiMH) cells were developed in the in the 1960s originally as
a potential power source for electric vehicles [51]. This was not fully realised until
the late 1990s, and predominantly the cells have served as an alternative chemistry to
Nickel Cadmium in consumer electronic applications. Because of the desire to
replace cadmium, the technology has largely displaced NiCd in the consumer
marketplace, which has been further progressed due to the inception of the battery
directive mentioned above. In terms of power density (90-110Wh/kg) they offer an
improvement of up to 50% over their predecessor [52], whilst retaining a similar
charging regime, allowing NiMH chargers to be generally designed as backwardly
compatible with NiCd batteries used in the same application. Chargers tend to
incorporate end point detection, which can be achieved by terminal voltage
measurement, as a characteristic of the chemistry is a reduction in terminal voltage
at the transition into overcharge. Alternatively cell temperature sensing is used to
detect overcharge, as the cell temperature increases as the energy absorbed by the
charge process diminishes [25]. NiMH cells were the chemistry of choice for the first
wave of widespread commercially available HEV vehicles, and were utilised in the
first generation Honda Insight (Figure 12) [53] and now familiar Toyota Prius battery
packs [54].
Figure 12. Honda Insight NiMH battery pack (image courtesy Bumblebee Batteries LLC)
60
Research in NiMH batteries and cells has been somewhat eclipsed by the focus on
lithium technology, but their adoption in the early EVs and HEVs has a legacy, and
latterly there is much interest in the recycling of the cells [55, 56].
2.6 Lithium Chemistries
Lithium based cells are perhaps the chemistry which currently attracts most attention
in the area of energy storage research. From initially finding applications in
consumer products such as mobile telephones, lithium based cells and batteries are
now becoming commonplace throughout the wider marketplace. The technology is
characterised by high energy density (>200 Wh/kg) as compared with other
chemistries, and high voltage-per-cell (3.7V) [16]. There are several sub chemistries
of “Lithium Ion” cell, but generally these are descriptively lumped together, with
Lithium Polymer being generally regarded as a separate technology using a solid
polymer electrolyte unlike the liquid organic electrolyte used in Lithium Ion cells
[16].
“Lithium Ion” has become a generic term for a family of cells which share a basic
chemical make-up which comprises an anode, cathode and electrolyte in which the
cathode and electrolyte contain Lithium compounds. The Lithium-Ion chemistry for
secondary cells was first proposed in the 1970s, but came to commercial prominence
in 1991 when the Sony Corporation of Japan started to market the cells in consumer
electronics [57].

61
Virtually all portable computing relies on the technology, and increasingly markets
previously dominated by NiCd and NiMH, portable power tools a notable example,
have been taken over by Lithium Ion cells. In contrast to NiCd and NiMH cells and
batteries, which tend to derive their dimensions from IEC 60086 [58], many Lithium
Ion cells have specific form factors which are separate from those adopted by other
secondary cells. Dominant is the 18650 cell, which is used in laptop batteries, and
many consumer applications use this cell type, and as a result pricing has rapidly
dropped - in 2009 laptop battery pricing was around $1200 per kWh, which had
dropped to $500 per kWh in 2013 [59]. The cells are used in packs with an overall
protection and safety circuit (Figure 13), but more recently this protection circuit has
been incorporated into loose cells allowing use in consumer products. The
electrochemical processes are different to other cell types, and during discharge the
Li+ ions transfer charge from the negative to positive electrode, through the
electrolyte, and during charge the reverse reaction occurs. Li+ ions bury themselves
in the porous electrode of the cathode - a process known as “intercalation” [16].
Figure 13(a) Dell laptop battery with cover removed showing 18650 cells and (b) close up of
protection circuit and on board “fuel gauge” (photograph by author).
Due to the highly reactive nature of lithium metal, there are hazards associated with
misuse of Lithium Ion cells. If the cells are overcharged, they can experience thermal

62
runaway if the electrolyte begins to react with the carbon anode, which further heats
the cell and allows these reactions to continue otherwise unaided. Similarly, this
process can be initiated outside of charging if the cells are sufficiently overheated [60,
61].
Amongst the battery manufacturers, A123 systems have a large presence in the
emerging EV marketplace, and have the largest Lithium Ion battery manufacturing
plant in North America manufacturing their advanced nanophosphate cells [62]. The
rapid progress within lithium technology has not come without some growing pains,
and despite supplying cells to the major automotive manufacturers (among them GM
and BMW) A123 systems filed for bankruptcy in November 2012. The company, now
under Chinese ownership is viable and continues to be a market leader in supplying
to the EV/HEV sector.
The drive for increased energy density centres on increasing the effective surface area
within the cell, and reducing the nano-scale “bottlenecks” in the reaction processes
[63]. Altair Nanotechnologies research and manufacture cells and batteries
exploiting these techniques and they are active in markets ranging from EV to smart
grid energy storage. Their cells feature nano-structured lithium titanate instead of
carbon as an anode material leading to improvements in cycle life, with 16,000 cycles
reported from experimental cells which will ultimately reduce the life-cost of EV
battery packs [64].
Researchers from MIT have reported improvements in power density in Lithium Ion
cells using carbon nanotubes which could see increases in energy density of an order
of magnitude (200 W h/kgelectrode) [65]. Other current research reflects the focus on
63
carbon nanostructures in the formation of Lithium based secondary cells [66, 67], and
this technology tends to lead the way in attempts to increase power density.
The use of Lithium Ion batteries in stationary applications was initially hindered by
the comparatively high price of the chemistry as compared to Lead-Acid (with
Lithium Ion having at least twice the cost per kWh [59]). However, reductions in this
cost have led to growth in this area. Exide now offer a range of medium capacity
stationary packs with on board battery management. Sanyo [68], Enerdel [69],
Electrovaya [70], Mitsubishi Heavy industries [71], and Valance [72] have all
developed large capacity batteries which have arisen due to application crossovers
from HEV/PHEV to stationary, and these batteries have been specified for backup
UPS, generator start, switchgear, renewable energy and spun off technologies like
hybrid generator sets.
Despite the Lithium chemistries showing the greatest potential currently for HEV
and EV applications, the environmental impact of the cells themselves in the waste
stream shows some concern [73]. The rapid evolution of the technology is currently
one of the obstacles to the development of an efficient and ecological recycling
infrastructure, and specific problems exist in the process which relate to disposal of
harmful waste removed from the cells and prevention of cell explosion due to radical
oxidation of lithium metal during the recycling process [74]. Additionally, much of
the mineral extraction processes associated with Lithium chemistries occur on the
African sub-continent, which itself is subject to environmental scrutiny due to
extensive deforestation, and the area is plagued with political unrest and human
rights violations.

64
The differences in the Lithium Ion chemistries are predominantly characterised in the
cathode materials, each presenting trade-offs in application over alternative
materials. The following sections give a brief overview of the main Lithium cell types
with application examples.
2.6.1 Lithium Cobalt Oxide (LCO) (LiCoO2)
Lithium Cobalt Oxide (LiCoO2) is a positive electrode material with a layered
structure, developed in the 1980s [75], which has gone on to become the most
predominate Lithium Ion cell type on the market at the time of writing. LCO
is the de-facto cell material used in 18650 cells for laptop computer batteries
and the chemistry is used generally for applications where discharge currents
up to 1C, which falls within the bounds of most portable computing, and digital
still and video cameras.
LiCoO2 cells are generally manufactured in the Far East, and the process for
designing a battery using these cells involves enlisting a pack builder who
configures the packs in the correct voltage and capacity arrangement before
connecting the within-pack protection circuit module (PCM). This has made
the incorporation of Lithium Ion technology a reasonably straightforward
undertaking for an Original Equipment Manufacturer (OEM).
Research continues in these cells, and there is much interest in thin film
batteries utilising processes allied to semiconductor manufacture [76], as moves
towards solid-state batteries progress [77].

65
2.6.2 Lithium Nickel Manganese Cobalt Oxide (NMC)
Lithium Nickel Manganese Cobalt Oxide (LiNiMnCoO2) cells are less
expensive than Lithium Cobalt Oxide, but this differential is somewhat eroded
by the large numbers of LCO cells which are manufactured. With a slightly
lower energy density than LCO (100-150 Wh/kg against 150-250 Wh/kg) [16],
but being slightly safer, use in application is based on trade-offs in these
properties. NMC cells have been adopted in EV applications, with the Zero
motorcycle company using cells from Molicel (Canada) providing energy
storage within the vehicles. The bikes battery packs range from 8.5 kWh to
14.2kWh capacity with a claimed battery life equating to between 231,000 and
385,000 miles [78].
2.6.3 Lithium Manganese Oxide (LMO)
Lithium Manganese Oxide (LiMn2O4) cells complement Lithium Cobalt Oxide
in that they are available in the same form factors (18560 cells predominantly)
and approximate voltage, but are more suitable for discharge rates > 10C. As
such they find wide application within power tools and EVs, notably the GM
Volt (Compact Power/LG Chem battery option), Nissan Leaf and Renault
Fluence [79].
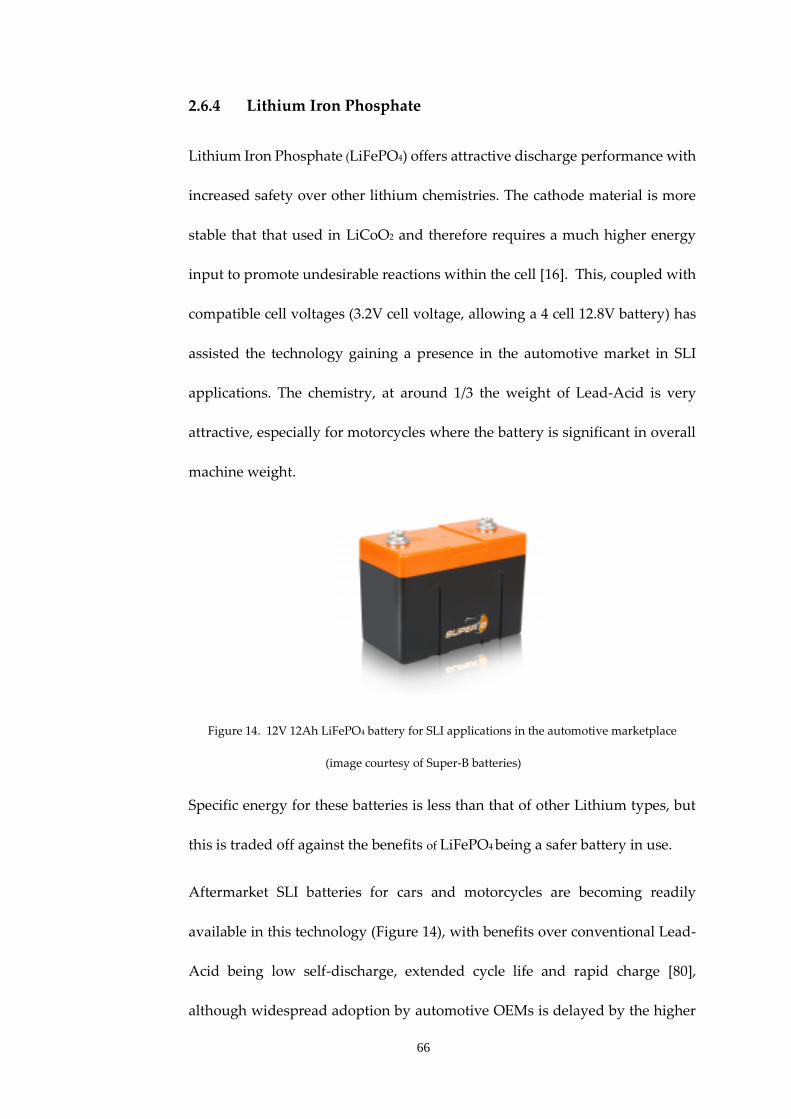
66
2.6.4 Lithium Iron Phosphate
Lithium Iron Phosphate (LiFePO4) offers attractive discharge performance with
increased safety over other lithium chemistries. The cathode material is more
stable that that used in LiCoO2 and therefore requires a much higher energy
input to promote undesirable reactions within the cell [16]. This, coupled with
compatible cell voltages (3.2V cell voltage, allowing a 4 cell 12.8V battery) has
assisted the technology gaining a presence in the automotive market in SLI
applications. The chemistry, at around 1/3 the weight of Lead-Acid is very
attractive, especially for motorcycles where the battery is significant in overall
machine weight.
Figure 14. 12V 12Ah LiFePO4 battery for SLI applications in the automotive marketplace
(image courtesy of Super-B batteries)
Specific energy for these batteries is less than that of other Lithium types, but
this is traded off against the benefits of LiFePO4 being a safer battery in use.
Aftermarket SLI batteries for cars and motorcycles are becoming readily
available in this technology (Figure 14), with benefits over conventional Lead-
Acid being low self-discharge, extended cycle life and rapid charge [80],
although widespread adoption by automotive OEMs is delayed by the higher

67
comparative cost. LiFePO4 batteries have been demonstrated to have very good
life cycle performance as compared to other chemistries in applications such as
renewable energy [81]. LiFePO4 cells also find applications in EV usage, with
the A123 systems offering for the GM Volt employing the technology.
2.6.5 Lithium Polymer (LiPo)
Lithium polymer batteries are a development of Lithium Ion technology in
which the organic electrolyte is replaced with a polymer. During the 1970s
polymer electrolytes were invented by a research team within the University of
Sheffield, Department of Chemistry, which led to the development of the
technology [82]. The energy density of these batteries is demonstrated by their
widespread adoption in radio controlled aircraft, but they take a large share of
the mobile telephony and computing battery market due to this energy density.
Although intolerant of overcharge as other lithium chemistries, (decomposition
of the electrolyte and liberation of gas can result) [83], the cells tend to be
manufactured in unconstrained packaging, allowing some expansion without
explosion - a feature which has led them to be used most readily in the
consumer marketplace. Lithium Polymer batteries look set to replace the bulk
of applications traditionally dominated by initially NiCd and latterly NiMH,
with the batteries being capable of very high discharge rates. Figure 15 shows
a 2 cell 7.4V pack with 2200mAh capacity, 40cr discharge rate, weighing only
143g.

68
Figure 15. Lithium Polymer radio controlled model battery (photograph by author)
The safety issues associated with Lithium Polymer (cell expansion, thermal
runaway and possibly fire) [83] are tolerated as a trade off against the desirable
performance attributes, and low rate applications such as mobile telephony and
tablet computing offer little risk with closely controlled charge and discharge.
Model vehicle batteries however used at high rate are known to self-heat, and
expand within their packaging, and “charging pouches” made of fireproof
material are supplied with battery/charger sets to mitigate fire risks in the event
of a catastrophic battery failure.
2.7 Supercapacitors
Capacitors traditionally have found applications in short term energy storage
applications, with capacitance values rarely surpassing 1 Farad. High value
capacitors were subsequently developed and used as alternatives to small lithium
cells in memory retention applications. Further development in this area has led to
the high value supercapacitors (Figure 16) [84] we see today being employed in a

69
range of applications from wind turbines [85] to uninterruptible power supplies [86].
Supercapacitors, or electrochemical capacitors differ in some respects from
traditional capacitors in that they do not employ a conventional dielectric. High-area
porous materials are used in a very thin layer that facilitates a large double layer
capacitance at the electrode-electrolyte interface where the energy is stored – leading
to very high capacitance [87]. The thin dielectric does however lead to the low
working voltage (mostly below 3V) [84, 87, 88] of these capacitors generally, often
requiring series connection in application.
Figure 16. Maxwell Technologies 2500F 2.7V supercapacitor used in peak power buffer applications
(photograph by author)
The technology is expensive when compared to other energy storage technologies
($10,000 - $20,000/kWh) [89], but does offer some clear advantages over conventional
batteries and cells. The way in which batteries and capacitors store energy is
fundamentally different. Batteries store electrical energy indirectly as potential
chemical energy. To release this energy oxidation and reduction reactions occur
which allows charges to be released facilitating electrical work when these flow

70
between two electrodes at different potentials. In contrast, capacitors store energy
directly in an electrostatic way, as negative and positive charges on the plates of a
capacitor, a process known as non-Faradaic energy storage. Electrochemical
capacitors operate in a similar way, but store the electrical energy in an
electrochemical double layer within the electrolyte [87]. This facilitates high rate
charge and discharge performance which is characteristic of capacitors generally.
Furthermore, within batteries, the chemical interconversions of the anode and
cathode materials in the cell take place with phase changes, and some irreversibility
of the conversion of the anode and cathode reactive materials occurs. This leads to
the limitations on cycle life experienced by batteries (1000-1500 cycles typically). As
these chemical processes do not exist within capacitors, 105-106 cycles are
commonplace [87].
The main disadvantage with capacitors however is energy density. At the molecular
level, limitations exist which restrict this energy in capacitors to 20% of that of
batteries of similar active area [87], and conventional capacitor technologies use only
a small proportion of this. However, with the development of electrochemical
supercapacitors active area utilisation has improved, allowing the complementary
characteristics of the two energy storage technologies to be more adequately
exploited.

71
2.8 Fuel cells
“Fuel cells” describe a group of galvanic devices that convert the chemical energy of
a fuel and corresponding oxidant to electrical energy. This process is carried out
electrochemically, so very high efficiencies can be attained (>80%) [90], and as long at
the fuel and oxidant are supplied to the electrodes, electrical energy is produced.
Typically the active materials are gaseous or liquid fuels and are either hydrogen or
hydrocarbons. Energy density is high when compared to conventional batteries, with
very high theoretical energy densities possible for hydrogen in particular (200-500
Wh/kg for small cells with 800+ Wh/kg possible for larger designs [16, 91]. Hydrogen
fuels cells present the most potential for use within vehicular applications [92], due
to their ability to rapidly re fuelled, and have made some progress within
applications involving public transport [93, 94]. Major obstacles exist in the adoption
of fuel cells in that the fuelling infrastructure does not yet comprehensively exist [93,
94]. A detailed examination of these storage devices is available in many texts, and
is outside of the scope of this work [95, 96].
2.9 Flow batteries
Flow batteries are regarded a relatively recent innovation, with the technology of the
zinc/chlorine battery in being patented 1973 [97], however use of the technology
predates this patent, and the French military Engineer, Charles Renard, developed
the airship “La France” which was powered by a zinc/chlorine flow battery in 1884
[98]. Applications of the batteries include hybrid power systems with renewable
energy, micro grids, smart grid power shaving and UPS. The technology

72
encompasses various chemistries, with Vanadium Redox (Figure 17) being one of the
most popular and successfully implemented. All flow batteries employ a pumped
electrolyte which is introduced into a cell with an ion exchange membrane. During
both charging and discharging the electrolytes are pumped through the cell stack,
facilitating the ion exchange processes, but remain separated by the ion exchange
membrane. As such the electrolytes do not “mix” chemically, which to some extent
avoids the undesirable reactions in conventional batteries, and does not directly
expend the electrolyte, leading to a long life.
Figure 17. Vanadium Redox battery block diagram (image courtesy of REDT Ltd)
The cell stack size therefore controls the rate at which the “battery” can deliver
current, with the capacity based on the volume of the external electrolyte storage
tanks. The systems tend to be in the tens to hundreds of kWh range, with systems as
larger as 1MW in existence [99]. Figure 18 shows a 30kWh Vanadium Redox battery
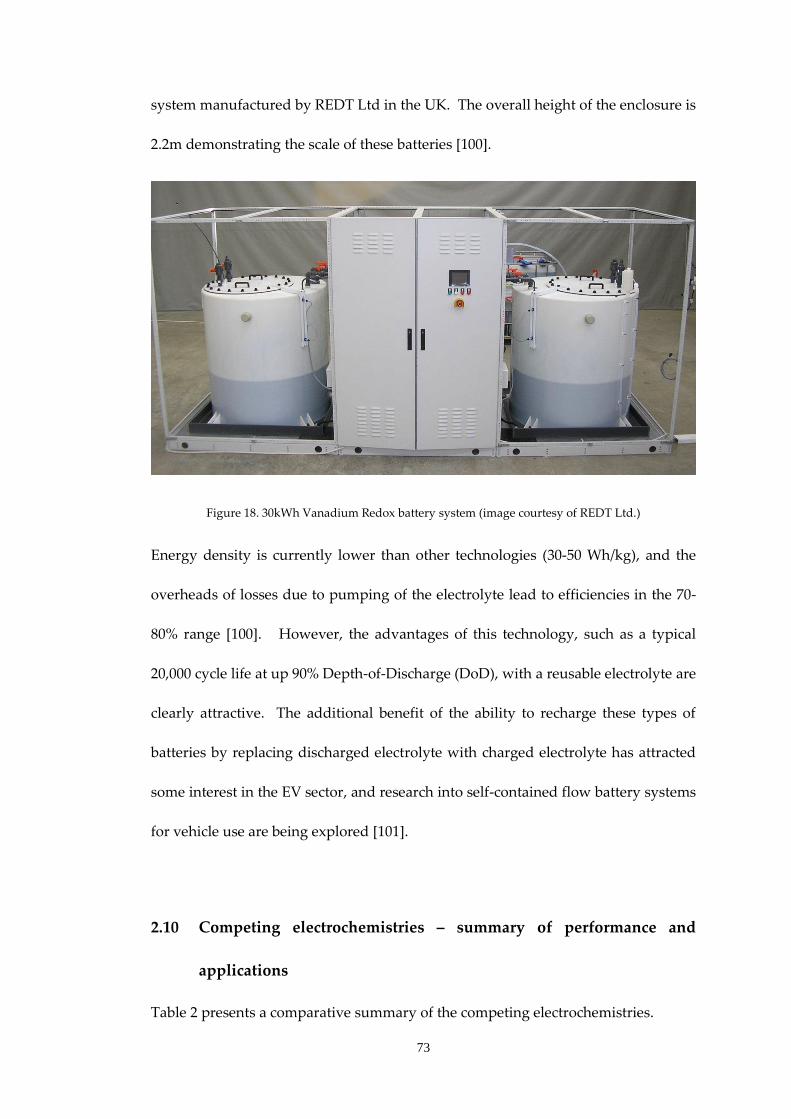
73
system manufactured by REDT Ltd in the UK. The overall height of the enclosure is
2.2m demonstrating the scale of these batteries [100].
Figure 18. 30kWh Vanadium Redox battery system (image courtesy of REDT Ltd.)
Energy density is currently lower than other technologies (30-50 Wh/kg), and the
overheads of losses due to pumping of the electrolyte lead to efficiencies in the 70-
80% range [100]. However, the advantages of this technology, such as a typical
20,000 cycle life at up 90% Depth-of-Discharge (DoD), with a reusable electrolyte are
clearly attractive. The additional benefit of the ability to recharge these types of
batteries by replacing discharged electrolyte with charged electrolyte has attracted
some interest in the EV sector, and research into self-contained flow battery systems
for vehicle use are being explored [101].
2.10 Competing electrochemistries – summary of performance and
applications
Table 2 presents a comparative summary of the competing electrochemistries.

74
Table 2. Performance comparisons for competing energy storage technologies
Chemistry Typical
Applications
Advantages Disadvantages Cycle life (100%
DoD)
Specific
energy
Cell
Voltage Temp
range
Lead-Acid
(flooded) [16, 22, 23, 102]
SLI (Automotive),
stationary applications,
UPS, micro renewables.
Good high-rate
performance. Low cost.
Mature recycling
infrastructure.
Risk of acid spill. Lower energy
density than other technologies.
Capacity affected by discharge
rate. Hydrogen liberated during
operation.
200-700 cycles 30-50 Wh/kg 2.0V -40°C to
+55°C (SLI)
Lead-Acid (VRLA) [16, 17]
SLI (Automotive),
stationary applications,
UPS, micro renewables,
portable equipment.
Maintenance free, no acid
spill risk. Mature recycling
infrastructure.
Intolerant of deep discharge.
Charging more closely
controlled than flooded.
Capacity affected by discharge
rate.
200-700 cycles 30-50 Wh/kg 2.0V -40°C to
+55°C (SLI)
-10°C to
+40°C
(Stationary)
Lead-Acid (VRLA
spiral wound) [16, 24, 40]
Specialist SLI
(Automotive), Stationary
applications, UPS,
portable equipment.
High rate. Better low
temperature operation than
conventional Lead-Acid.
Long relative calendar life.
More expensive than other
types. Single cell types can need
cycling to establish working
capacity.
200-700 cycles ~30 Wh/kg 2.0V -10°C to
+40°C
Lead-Acid
(Ultrabattery) [16, 44, 103-105]
HEVs Performance of a Lead-
Acid battery with parallel
capacitance.
Lower energy density than
conventional Lead-Acid
Tests ongoing – expected to
have twice the cycle life of
conventional Lead-Acid
~25 Wh/kg 2.0V -20°C to
+40°C
Super capacitors [16, 84, 87]
Peak power buffers,
regenerative braking
(HEV). Complementary
technology for batteries.
Rapid charge and
discharge. No minimum
EoD voltage.
Very high cycle life.
Low energy density and
expensive when compared to
batteries. Low working voltage.
Up to 106 cycles. Short
calendar life.
Up to
12 Wh/kg
2.3-2.85V -30°C to
+65°C
NiCd [16, 106, 107]
Portable equipment,
power tools.
Tolerant of rapid charge
and discharge, low cost.
Memory effect. Environmental
issues (largely removed from
consumer products for this
reason)
500 + cycles 10-40 Wh/kg 1.2V -20°C to
+70°C
NiCd (flooded) [16, 48]
Stationary applications
(particularly in the rail
industry)
Long service life (up to 30
years). Wide operating
temperature range.
Expensive when compared to
Lead-Acid. Sintered plate types
exhibit memory effect.
2000+ cycles 30-80 Wh/kg 1.2V -50°C to
+60°C
NiMH [16, 25, 46]
Portable equipment,
power tools
Direct replacement for
NiCd in most applications,
with higher energy density.
Some memory effect, although
better than NiCD. Charging at
moderate temperatures
preferred.
Up to 1000 cycles. (300000
cycles are possible for
HEV specific cells).
90-110 Wh/kg 1.2V -20°C to
+65°C

75
Chemistry Typical Applications Advantages Disadvantages Cycle life (100%
DoD)
Specific
energy
Cell
Voltage
Temp
range
Lithium Cobalt
Oxide LiCoO2 [16, 46, 108]
Portable consumer products
(laptop batteries). Portable
power tools, EV batteries,
Lead-Acid replacement
applications.
High energy density,
high cell voltage.
Not tolerant of fault
conditions in charge or
discharge. (Requires external
protection circuit.)
Mechanical damage can
result in overheating/fire.
500 typical, 1000+ cycles
possible
150-250 Wh/kg 3.7V -20°C to +50°C
Lithium Nickel
Manganese Cobalt
Oxide (NMC) LiNiMnCoO2 [16, 108, 109]
Portable power tools, EV
batteries, Electric bicycles,
Lead-Acid replacement
applications.
High energy density,
high cell voltage.
Safer than LiCoO2.
Energy density not as high as
LiCoO2.
500 typical, 1000+ cycles
possible
100-150 Wh/kg 3.7V -20°C to +50°C
Lithium Manganese
Oxide (LMO)
LiMn2O4 [16, 110]
Portable power tools, EV
batteries, Electric bicycles,
Lead-Acid replacement
applications.
High energy density,
high cell voltage.
Safer than LiCoO2.
Poor high temperature
stability. Energy density not
as high as LiCoO2.
500 typical, 1000+ cycles
possible
100-150 Wh/kg 3.7V -20°C to +50°C
Lithium Iron
Phosphate LiFePO4
[16, 80]
SLI batteries, replacement for
Lead-Acid generally, power
tools, EVs.
High cycle life/
energy density. Safer
than LiCoO2.
Initial energy density lower
than LiCoO2. Discharge rate
lower than Lead-Acid.
1000+ cycles, with 2000-
7000 cycles developed for
HEV applications.
100-120 Wh/kg
3.2V -20°C to +50°C
Lithium Polymer [16, 111]
Cellphone batteries, tablet
computing power, mobile
devices generally, toys and
RC models. Electric bicycles,
Some EVs.
High energy density,
high cell voltage.
May explode if overcharged.
Requires similar care to
Lithium Ion. Chargers
should incorporate thermal
sensing/end point detection.
500 typical, 1000+ cycles
possible
250-300 Wh/kg 3.7V -20°C to +50°C
Fuel cells (general) [16, 112]
Backup power, portable
power, micro renewables,
speciality vehicles
Fuel based- rapid
energy
replenishment. Scale-
able technology.
Relatively expensive. Very
little fuelling infrastructure.
Mainly measured in
cycling service hours.
5000-20000 hrs dependent
on technology.
200-500 Wh/kg
(small cells)
800+ Wh/kg
larger designs
1V Self-heating
Flow batteries [2, 3, 101, 113]
Stationary applications (peak
power shaving, UPS)
Long life, capacity
theoretically
unlimited (tens of
kWh to MWh range).
Can be charged by
replacing electrolyte.
Physically large. Low relative
energy density (similar to
Lead-Acid).
Difficult to implement in
mobile/vehicle applications.
10000 – 20000 cycles 30-50 Wh/kg 1.3-
1.4V
-0°C to +40°C
(temperature
control of the
electrolyte can
be employed
to widen
range)
76
2.11 Conclusion
The competing storage mediums discussed within this chapter give a snapshot of
electrochemical energy storage at the time of writing. These technologies are
complementary, although there are some migrations in progress which will become
pronounced in the near future. Lead-Acid batteries in particular have had a long
reign and maintain their firm hold within the marketplace, particular in conventional
vehicles with Internal Combustion Engines (ICE), however LiFePO4 is positioned to
compliment Lead-Acid batteries in these applications somewhat as prices fall.
Lithium chemistries have a strong ongoing presence in EV and HEV energy storage,
whilst mild hybrid ICE using turbo generators and/or starter generators may see
UltraBattery technology taking a share of this market.
NiCd batteries have a limited future due to their heavy metal content, and the
advance of Lithium chemistries also threatens NiMH. It is likely that all portable
equipment and power tools will adopt some form of Lithium technology within the
next five years, which may overlap with supercapacitors with further improvements
through research.
Developments in flow batteries are likely to see this technology start to displace Lead-
Acid in large stationary applications, but for the immediate future electrochemical
batteries and cells will retain a firm hold on the portable device and EV marketplaces.

77
Chapter 3. Performance characteristics and limitations of batteries
3.1 Introduction
An ideal battery would exhibit a shallow, linear discharge curve, with performance
independent of temperature or rate of discharge. Unfortunately, this is not the case,
and this leads to issues associated with use of batteries in application, and in turn
establishing State-of-Charge and State-of Health of the batteries. Electrochemical
cells and batteries employ chemical reactions in order to affect charge storage and
delivery of current. It therefore follows that batteries will have response times and
performance based on the basic controlling criteria for speed of chemical reactions,
(concentration of reactant, temperature, and addition of catalysts).
The following chapter gives an overview of the problems associated with the use of
batteries, and gives some treatment to the chemical processes at work from an applied
perspective. The issues described apply generally across all chemistries, but where
specific examples are described, Lead-Acid examples will be used.
3.2 Electrochemical reaction rates and battery performance
In seeking to understand the limitations of the performance of batteries some
understanding of reaction processes within the battery must be made. There are
several well-known phenomena attached to battery performance which have
implications for direct modelling of batteries and cells under operational conditions.
The change in reaction rates with temperature can be directly related to two known

78
battery behaviours. Firstly, the observed loss of capacity of batteries at low
temperature, and secondly, the reduction in service life of batteries with increased
operational ambient temperatures. It can be appreciated that plate corrosion and
other degrading reactions will increase with temperature, but there are other
mechanisms at work generally in the battery which require consideration for a
complete picture. Additionally, batteries suffer performance limitations when used
in applications where rapid transitions from charge and discharge exist. Moving
from a state of charge to discharge in electrochemical batteries and cells requires
opposing chemical processes to occur which in themselves give rise to voltage drops
as these reactions proceed.
3.3 Mass transport processes and chemical inertia
Within electrochemistry, three basic modes of mass transport exist, and some
understanding of these, without detailed reference to chemistry, is required in order
to explain the observed performance metrics of the battery under prevailing
conditions. Mass transport to and from an electrode can occur by three processes -
convection and stirring, electrical migration in an electric potential gradient, and
diffusion in a concentration gradient [16]. These mechanisms control the
performance of the cell, and in conjunction with temperature acting as a catalyst,
define the predominate behaviour of the electrochemical system.

79
3.3.1 Diffusion
Diffusion is well known and occurs in all solutions, arising from the natural
tendency towards high entropy in all systems. Work carried out by Fick [87] in
1855 defined laws describing diffusion which are applicable to the processes
within batteries. The rate of diffusion within the electrolyte of the battery or
cell will be a limiting factor in performance, as concentration gradients arise
during charge and discharge. Stratification in flooded batteries, and some of
the requirements for closely controlled charging in VRLA batteries (which have
suspended electrolytes) are in part due to diffusion. Mitigation of these effects
can be effected in flooded batteries by equalisation charge rates – elevated
charge causes hydrodynamic effects and therefore assisted diffusion of the
electrolyte.
Additionally, reduction in capacity with both temperature and discharge rate
is also attributed to diffusion and is discussed in the following sections.
3.3.2 Convection
Convection occurs due to forces acting on the electrolyte, caused by density or
thermal differences within the solution. Convection will help reduce
stratification in flooded batteries, but the effects of convection are reduced in a
suspended electrolyte. Increasingly, the active area within cells is increasing,
with the separation of plates and the effective depth of electrolyte between the

80
plates being reduced. As such convection effects represent less of an issue in
spiral wound cells typical of current designs.
3.3.3 Migration
Migration is the third and final form of mass transport. This is the process that
occurs during charge and discharge of the battery and is the actual movement
of ions within the electrolyte. Electrical migration occurs due to an electric
potential gradient within the cell and is limited by the available charge carriers
at any time.
3.4 Coupe de fouet and the effect of load application to batteries
In addition to the chemical processes outlined above, a phenomenon exists with
Lead-Acid batteries particularly which effects terminal voltage on application of load.
“Coupe de fouet” is a phenomenon observed in Lead-Acid batteries and the term
derives from the French for the “crack of the whip” [114, 115]. Figure 19 shows a
discharge curve for a lead-acid battery at 20°C carried out during this work, and the
temporary reduction in terminal voltage can be seen at the application of load.

81
Figure 19. Battery terminal Voltage on application of load showing “Coupe de Fouet”
The phenomenon has been variously described electrochemically, with Berndt and
Voss first proposing crystallisation overvoltage as the mechanism for the voltage
reduction 50 years ago [116]. Subsequently several theories have been investigated
[115, 117, 118], and whilst the mechanism of the phenomenon is of interest to the
electrochemist, the manifestation of the terminal voltage drop is the main concern of
the battery engineer. The author, in the course of his professional career has
developed several battery testing schemes for Lead-Acid batteries, incorporating
methods to remove coupe de fouet from the measurement system. These techniques
have been incorporated into this body of work, and are described in the following
chapter.
0 1 2 3 4 5 6 7 810.5
11
11.5
12
12.5
13
13.5
Discharge time (Hrs)
Ba
tte
ry V
olt
ag
e (
V)
"coupe defouet"

82
3.5 Mass transport over potential
Mass transport over potential controls the performance of batteries at high rates of
charge and discharge. Under these conditions, the region around the electrode is
subject to a depletion of reactants, and further reactants diffuse towards the electrode.
If the discharge rate causes these reactants to be depleted at a rate greater than they
can arrive at the electrode the battery voltage decreases.
In simple terms a concentration gradient exists in the electrolyte, which is caused by
a high rate of charge or discharge. The result of this is that the battery terminal
voltage reduces to the minimum voltage earlier than expected, and some of the
reactants are not used.
This supports the findings of Maneti [119], in that after a high rate discharge, a period
of rest allows the battery to recover to a point where the remaining energy is
accessible, and one would assume that an equalisation has occurred within the
electrolyte at this time. During charging similar processes occur, which therefore
explains somewhat why elevated charge voltages are required for increased charge
rates [16].
3.6 Discharge rate issues
3.6.1 Loss of capacity with discharge rate
Electrochemical batteries and cells generally exhibit a reduced capacity with
increased discharge current. This phenomena is well known from the work of

83
Peukert [120] who described the reduction in effective capacity of Lead-Acid
cells with discharge rate at constant temperature:
𝐶𝑝 = 𝐼𝑘𝑡𝑑 (2)
Where Cp is capacity according to Peukert, at the specified discharge
rate.
I is discharge current in Amperes
k is the Peukert constant for the battery
td is the time of discharge in hours
The relationship can more usefully be expressed in the following way:
1k
rr
r
cIt c
It
(3)
Where I = Actual discharge current (A)
cr = rated battery capacity (Ah)
tr = rated discharge time
therefore
It = available Ah capacity (cav)
1k
av r
r
rcc c
It
(4)

84
Plotting this for a 100Ah battery with a rated 20 Hr capacity, with a Peukert
coefficient of 1.3 gives rise to the graph shown in Figure 20.
Figure 20. Lead-Acid battery capacity with discharge rate (100Ah at 20 hr discharge rate,
20°C)
This is demonstrated in the way Lead-Acid batteries are specified, with VRLA
typically having rated capacity quoted for a 20Hr discharge rate. Similarly,
reduced temperature effects capacity, and most Lead-Acid batteries are
almost unusable at -20°C. Peukert’s equation has been also demonstrated to
be applicable to Lithium Ion batteries [121].
3.7 Effect of temperature on battery and cell performance
For most battery and cell types, optimum operating conditions exist at around 20-
25°C, offering the best mix of operational life expectancy and performance generally.
0
20
40
60
80
100
120
0 20 40 60 80 100 120 140 160
Cap
acit
y (A
h)
Discharge current (A)
Available capacity (Ah)

85
It is well known within chemistry that heat is a catalyst, and this applies equally to
energy storage technologies. As temperature falls, reactions within the battery
become less active, the manifested effects being a reduction in terminal voltage, a
corresponding loss in capacity, and a reduced capacity to deliver high currents. This
is demonstrated in the way that SLI batteries are specified, being quoted in Cold
Cranking Amps (CCA) as a measure of their performance at low temperatures. These
effects can in turn be correlated to the equivalent circuit developed for the subject
battery, and it therefore follows that identifying these parameters allows some
establishing of predicted battery performance under these conditions.
3.7.1 Terminal Voltage variations with State-of-Charge and
temperature
Figure 21 shows the variation in terminal voltage for a VRLA battery at 20°C
over State-of-Charge [17]. This terminal voltage varies with prevailing
conditions (recent load or charge) and also with temperature.
Figure 21. Steady state open circuit terminal voltage with State-of-Charge (Image by kind
permission of Yuasa Battery Sales UK)

86
The equilibrium voltage of a Lead-Acid battery with temperature is a linear
relationship described by the Nernst equation:
𝐸 = 2.047 +𝑅𝑇
𝐹𝑙𝑛 (
𝛼𝐻2𝑆𝑂4
𝛼𝐻2𝑂) (5)
Where E is the voltage across the cell, R is the gas constant, T is the temperature
in Kelvin, F is the Faraday constant and α is the chemical activity of the relevant
species.
An experiment was carried to investigate this change in terminal voltage with
temperature. Two new 65Ah batteries in good SoH at close to 100% SoC were
used for the investigation, and the initial steady-state OCV measured.
Subsequently one of the batteries remained in a 25⁰C ambient as a “control”
sample whilst the other was cooled to -10⁰C, and the terminal voltages were
measured again after 2 weeks. It is known from previous work by the author
that application of a small load pulse will remove overvoltage due to recent
charge or change in temperature, so identical load pulses were applied to both
batteries in order to obtain a more representative steady state voltage for the
test batteries. The response to the load steps can be seen for battery 1 and
battery 2 in Figure 22.

87
Figure 22. Battery terminal voltage response to an applied load step
It can be seen that battery 1 (25°C) responds well to the load step and recovers
to close to the original OCV quickly. Battery 2 at -10°C clearly undergoes a
much larger voltage deviation when subject to the same load step, but recovers
in a way that tends towards a lower steady-state voltage.
The batteries were left for 1 hour to establish a steady state and the terminal
voltages measured. The recorded results are shown in table 3.
Table 3 - battery terminal voltage at ambient and reduced temperatures
Initial OCV OCV after 2
weeks
OCV after
load pulse
Overall change in
terminal Voltage
Battery 1 12.973V
(25°C)
12.953V
(25°C)
12.952V
(25°C)
21mV
Battery 2 12.982V
(25°C)
12.945V
(-10°C)
12.936V
(-10°C)
46mV
The results in table 3 for the battery at -10°C in particular are not completely as
expected if we consider the Nernst equation shown in (5). Using a normalised
0 2 4 6 8 10 12 14 16 1812.82
12.84
12.86
12.88
12.9
12.92
12.94
12.96
12.98
13
Time (s)
Ba
tte
ry V
olt
ag
e (
V)
Battery 1 (25°C)
Battery 2 (-10°C)Load applied
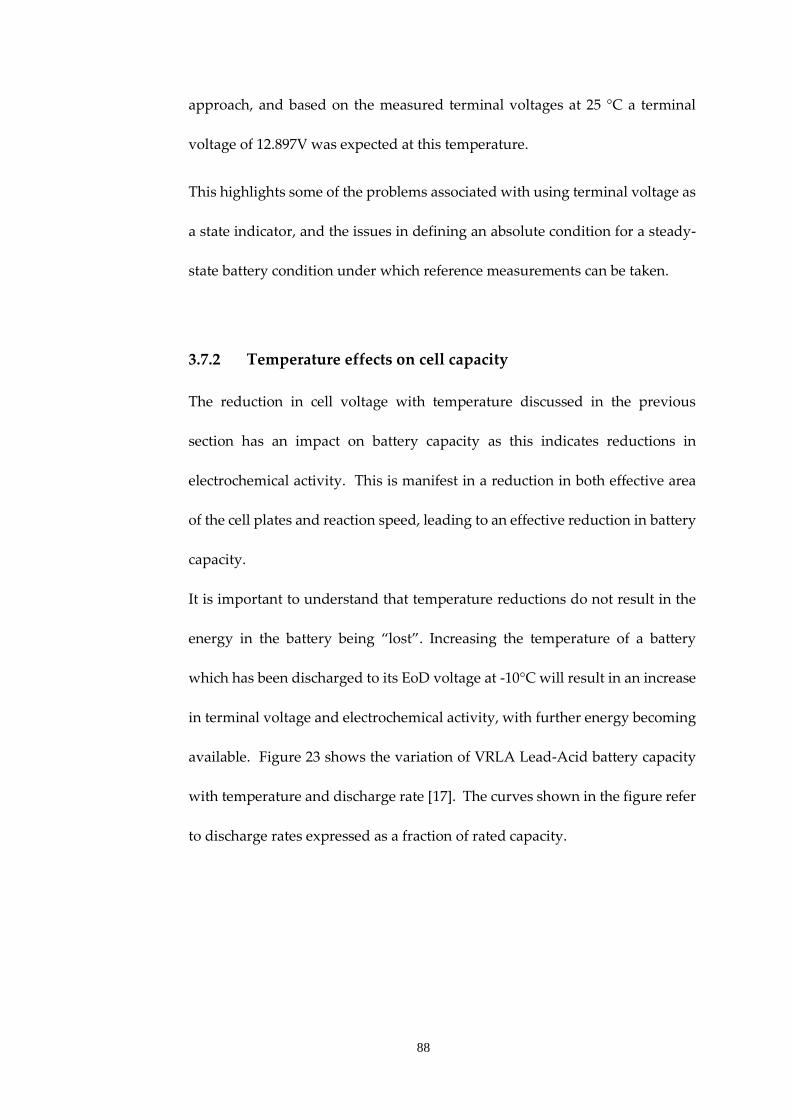
88
approach, and based on the measured terminal voltages at 25 °C a terminal
voltage of 12.897V was expected at this temperature.
This highlights some of the problems associated with using terminal voltage as
a state indicator, and the issues in defining an absolute condition for a steady-
state battery condition under which reference measurements can be taken.
3.7.2 Temperature effects on cell capacity
The reduction in cell voltage with temperature discussed in the previous
section has an impact on battery capacity as this indicates reductions in
electrochemical activity. This is manifest in a reduction in both effective area
of the cell plates and reaction speed, leading to an effective reduction in battery
capacity.
It is important to understand that temperature reductions do not result in the
energy in the battery being “lost”. Increasing the temperature of a battery
which has been discharged to its EoD voltage at -10°C will result in an increase
in terminal voltage and electrochemical activity, with further energy becoming
available. Figure 23 shows the variation of VRLA Lead-Acid battery capacity
with temperature and discharge rate [17]. The curves shown in the figure refer
to discharge rates expressed as a fraction of rated capacity.

89
Figure 23. VRLA Lead-Acid battery capacity with temperature and discharge rate (image
reproduced with kind permission of Yuasa Battery sales UK)
As can be seen, typically, a lead-acid battery discharged at a moderate rate will
see a reduction in capacity to around 60% at -10°C, compared to the published
Ah rating, being specified at 25°C. At temperatures above 25°C the battery
capacity will exceed 100% levelling off towards 110%. This is not “free” energy,
but a result of increased terminal voltage and reaction efficiency increase with
temperature, thus allowing energy supplied during the charging process to be
released more readily.
3.7.3 Undesirable reactions with increased temperature
The desirable effects of increased ambient temperature in battery and cell
performance are offset by the degenerative process which occurs due to the

90
undesirable reactions which also proceed at an accelerated rate at elevated
temperatures.
Plate corrosion, electrolyte depletion and increased self-discharge are some of
the issues associated with increased ambient temperature, but from an applied
perspective all of these mechanisms result in reduced service life.
Manufacturer’s data regarding service life with temperature [17] (Figure 24.)
tends to support the general statement of the Arrhenius equation (6), in that for
common chemical reactions, reaction rate doubles for every 10 °C increase in
temperature [122].
E
RTk A
(6)
Where k is the reaction rate constant, A and E are constants characteristic of
the reactants, R is the gas constant and T is absolute temperature.
Figure 24. Lead-Acid battery service life with ambient temperature
20 25 30 35 40 45 50 55 60
3%
7%
33%
75%
100%
Temperature (°C)
Ye
ars
of
de
sig
n l
ife

91
This reduction in service life with increased temperature can be exploited to
provide accelerated testing of batteries and cells over lifetime (to 80% of rated
capacity). This characteristic is used in chapter 11 in order to provide lifetime
parameters for the developed tests by accelerating failure of the test battery.
3.8 Conclusion
The non-linear nature of batteries and cells, within their operating environment
highlights the problems associated with establishing SoH and SoC. Mass transport
processes (diffusion, convection and migration) are controlling factors in battery or
cell operation, and with this, other phenomena affecting available charge carriers
within the battery further govern the way batteries can supply energy.
As has been discussed, most battery types experience optimum operating conditions
at around 20-25°C, but it is very rare that these conditions can be guaranteed, and as
such any battery state evaluation scheme must factor in temperature. Additionally
discharge rate presents issues with available capacity, and the test system developed
must be able to accommodate such factors. As such characterisation of test batteries
must be carried out over a range of operational conditions in order to prove any
developed test techniques.
The values of the preliminary experiments carried out within this section have shown
that caution must be observed in collecting test data from batteries, as the Nernst
equation applies only when residual overvoltage is removed from the battery, and
all terminal voltage measurements need to be taken in a controlled fashion with a
steady-state being established. This highlights the problems with using terminal

92
voltage as an indicator of SoC, and this is clearly not possible without prior
knowledge of battery state, which somewhat negates the value of the technique.
Additionally, the application of current pulses to batteries as part of developed test
schemes must consider the effects on the battery terminal voltage, in order that false
reporting is not encountered.

93
Chapter 4. Battery characterisation
4.1 Introduction
Battery characterisation has been very much in the forefront of the application of
batteries and cells from the inception of the technology. The need to establish the
SoC of batteries in use has led to a number of schemes being adopted to monitor
battery status. As part of the literature review for the research, a review of current
methods for establishing SoC, SoH and SoF was carried out, and as areas of novelty
emerged, these were further examined for previous research, notably frequency
domain analysis of batteries and cells. This chapter reviews a number of widely used
techniques and equipment before discussing pseudo-random binary sequences and
their application to battery technologies in detail.
4.2 Specific gravity of electrolyte
Traditionally, early batteries or accumulators were largely flooded Lead-Acid types,
and with access to the electrolyte a measurement of specific gravity was carried out
to establish battery state. This type of testing provides an accurate means of
establishing State-of-Charge, and State-of-Health can be established somewhat by
inspection of the electrolyte condition. This technique is however only applicable to
flooded cells, and requires an operator to carry out the test with a glass bodied
hydrometer. This involves removing a sample of the fluid from the cell in order to
measure the density of the electrolyte. Most instruments use a scaled, weighted float
which is factory calibrated using water as the relative medium.

94
Table 4 shows specific gravity over a range of states-of-charge for flooded lead-acid
batteries [22, 23].
Table 4. Specific gravity with SoC for flooded Lead-Acid batteries
State-of-Charge (%) Specific gravity
100 1.255 – 1.275
75 1.215 – 1.235
50 1.180 - 1.200
25 1.155 - 1.165
0 1.110 - 1.130
Specific Gravity is dependent on the electrolyte temperature. The values in table 5 are
taken from manufacturer’s data and are valid for a temperature of 27°C. Correction
for other temperatures can be achieved by adjusting the above figures by 0.003 for
every 5°C (negative coefficient).
The test method has become somewhat redundant with VRLA batteries superseding
conventional flooded types, as this is not a viable test for cells having anything other
than a pure, unsuspended electrolyte.
Much of the research around using specific gravity as a state indicator has concerned
measurement using ultrasonic or optical methods [123, 124], but tends to date from
the 1980-1990 period, reflecting that the techniques have somewhat become
redundant.

95
4.3 Terminal voltage measurement
Terminal voltage measurement as a means of battery state evaluation can be applied,
but should be used within a controlled environment. As discussed in chapter 3, there
are problems associated with the history of the battery before the measurement is
made, and unlike capacitors which offer direct SoC evaluation from voltage
measurements, batteries are non-linear in this respect and therefore these
measurements need to be carefully considered.
An example of the problems encountered is shown in Figure 25. The graph illustrates
an experiment where four different new batteries manufactured by Yuasa were
charged to 100% SoC and then open circuit terminal voltage measured over time
using a high-impedance instrument.
Figure 25. Comparative terminal voltage of Lead-Acid batteries post-charge (20°C)
The REL-B15 is a long design life 12V 15Ah battery, and shares a case design with the
NP17-12 and NP18-12 which are 17Ah and 18Ah capacity respectively. To the
untrained observer these batteries are superficially the same, but the off charge
0 0.2 0.4 0.6 0.8 1
13
13.2
13.4
13.6
13.8
Time (Hours)
Ba
tte
ry v
olt
ag
e (
V)
REL-B15
NP17-12
NP18-12
NP12-12

96
characteristics are clearly different. The NP12-12 is a 12V, 12Ah battery, but has an
off charge voltage profile similar to the 18Ah battery.
This clearly shows that the use of terminal voltage as an indicator requires some
controlled conditions, and as an isolated test technique, can only offer rudimentary
indications. The method is therefore employed mainly in hybrid test schemes as one
of several parameters used to assess battery state, with some understanding of the
current flow in or out of the battery prior to the test.
4.4 Load testing
Load testing has a long history in SLI batteries and gives a reasonable indication of
battery performance. Traditionally, load testing has been known as a “drop test”
where a low resistance load is applied to the battery, with a test current of at least 1cr.
A voltmeter integral to the test apparatus indicates the voltage drop over the test
period, with distinct pass/fall limits. This type of testing, in conjunction with
measurements of specific gravity were the only tests of SoH and SoC that were
available for Lead-Acid batteries in their early application and is still commonly used
today in car repair workshop where there is a need for robust and easy-to-use
equipment. Load testing has developed somewhat, and has facilitated battery
analysis in diverse excitation schemes, developing on straightforward discharge
testing and simple load pulses. Testing of batteries using a suitable load is therefore
subdivided into several test schemes, which are described in the following sections.

97
4.4.1 Constant current long duration discharge tests
Long duration constant current discharge remains the definitive method for
establishing the capacity of a battery or cell. The test generally comprises
discharging the fully charged battery into a constant current load and
measuring the elapsed time to the End of Discharge (EoD) Voltage. Figure 26
shows a typical discharge curve for a 65Ah VRLA battery at 20°C.
Figure 26. Typical discharge curve for 65Ah VRLA battery at 20°C
The EoD Voltage is established from manufacturer’s data and will correspond
to the prevailing discharge rate during the test. Figure 27 shows the EoD
Voltage (dotted line) for a range of discharge currents [17]. Additionally, the
temperature at which the test is carried out must also be taken into account,
as discussed in chapter 3. The major disadvantage of this type of test is the
duration of the discharge, and the fact a charge-discharge-charge cycle is
expended during the process. As such the use of this test is generally limited
to research, and verification of new evaluation methods.
0 5 10 15 209
9.5
10
10.5
11
11.5
12
12.5
13
Discharge Time (Hours)
Batt
ery
Vo
ltag
e (
V)
Terminal Voltage
End of Discharge
98
Figure 27. Variation of battery capacity with discharge rate showing EoD Voltage (Image
courtesy Yuasa battery Sales Europe)
4.4.2 Short duration pulse load testing
Pulse load tests can be used as means for establishing SoH and to some extent
SoC, but in many cases the technique is used to report the battery health alone,
and operational restrictions on when such tests are applied can be implemented
in order to avoid false test results. Applying a single load pulse can report
battery SoH, but a false result can be reported if the battery has recently been
charging, or the ambient temperature in which it has been stored has changed
significantly. Furthermore, the problems associated with terminal voltage
measurement discussed in the previous sections prevail with simple tests. A
two pulse test was developed by the author in 2001 within Bulgin Power Source
Plc, which has been in use commercially since that date by VxI Power Ltd [125].

99
This testing scheme has also appeared independently in published work by
Coleman et al in 2008 [126].
Figure 28. Two pulse battery test as applied to a 24Ah VRLA battery as part of on board SoH
testing
Referring to Figure 28, as the charger is turned off, the battery remains at the
charge voltage, which over time would decay towards a steady-state in a
similar fashion to the characteristics shown in Figure 25. To accelerate this
process the battery is given an initial load pulse (preload pulse) which arrests
the terminal voltage and “clips” the overvoltage due to recent charge. There
follows a relaxation period under which the battery terminal voltage is falling
towards a steady-state value, which is followed by the actual test pulse. At V1,
the battery voltage is measured before the test pulse is turned off. The battery
is then allowed to recover for 5 seconds before V2 is measured and V1-V2 is the
test voltage deviation. Durations for pulses and measurement intervals are
based on bench characterisation of the battery types used at constant
temperature. Voltage deviations during the test can be compared to historical
0 5 10 15 20 25 30 35 4012.5
13
13.5
14
Batt
ery
Vo
ltag
e (
V)
Time (s)0 5 10 15 20 25 30 35 40
0
2
4
Test
pu
lse c
urr
en
t (A
)
preload pulse
chargerreconnected
charger disconnectedV1 V2
Voltage deviation
test pulse
100
results or absolute limits. Limitations of the technique relate to the level of
interpretation placed upon the data, and the most effective implementation of
this type of testing scheme is in conjunction with historic data from previous
tests where degradation of the battery has been observed as an increase of the
test voltage deviation.
4.4.3 Charger margin test
“Margin” test refers to a type of discharge testing that can be implemented
within equipment with battery backup during a defined charge period and was
developed for high availability DC UPS systems for utilities applications [127].
The testing is most applicable to uninterruptible power supplies, and other
equipment with regular, long charge cycles. IEE standards for testing batteries
rely on disconnection from the supported equipment followed by controlled
discharges of the system batteries [128, 129]. This may be undesirable for high
availability systems so an alternative approach is required which does not
compromised the equipment in use. During a margin test the charger voltage
is reduced to a level below the open circuit terminal voltage of the connected
battery, and as a result the battery takes up supply of the load. The load
discharges the battery during this period, and the voltage measurements are
taken throughout the test to develop a discharge curve. The test may not
encompass a full discharge, but will be carried out over a time period deemed
suitable based on load and battery pack capacity. The charger voltage is
digitally controlled and kept just below the battery voltage, in order that a

101
faulty battery does not jeopardise the operation of the equipment. The test is
terminated either at a pre-set time or when the battery has reached a specified
voltage threshold. If the application facilitates a long test, and the load is well
understood (stable, constant loads are preferred), performance of the battery
can be evaluated. Over time a history can be built, and in turn, predictions
made for end of life of the battery.
An alternative approach is to provide an on board constant current load within
the equipment which undertakes a partial discharge of the connected battery
periodically. This offers benefits where load is unpredictable, but has the
downside in that the energy is dissipated, which can be unattractive thermally,
and is undesirable in terms of environmental impact.
4.5 Coulomb counting
Coulomb counting methods employ measurement of the current flowing and out of
the battery in order to establish the state-of-charge [14]. This technique is relatively
successful, and has been widely adopted in portable computing, but it does suffer
from some drawbacks as a stand-alone battery test scheme. Cumulative errors can
be introduced and these may be due to varying efficiency of the battery being
evaluated, deteriorating SoH and inaccuracies in the measurement acquisition
system. These shortcomings were manifest in early implementations of the technique
where a healthy SoC could be indicated for a battery in poor SoH, leading to
unpredictable shutdown of the powered equipment. Coulomb counting can be
improved by periodic recalibration, which involves a charge and discharge cycle of
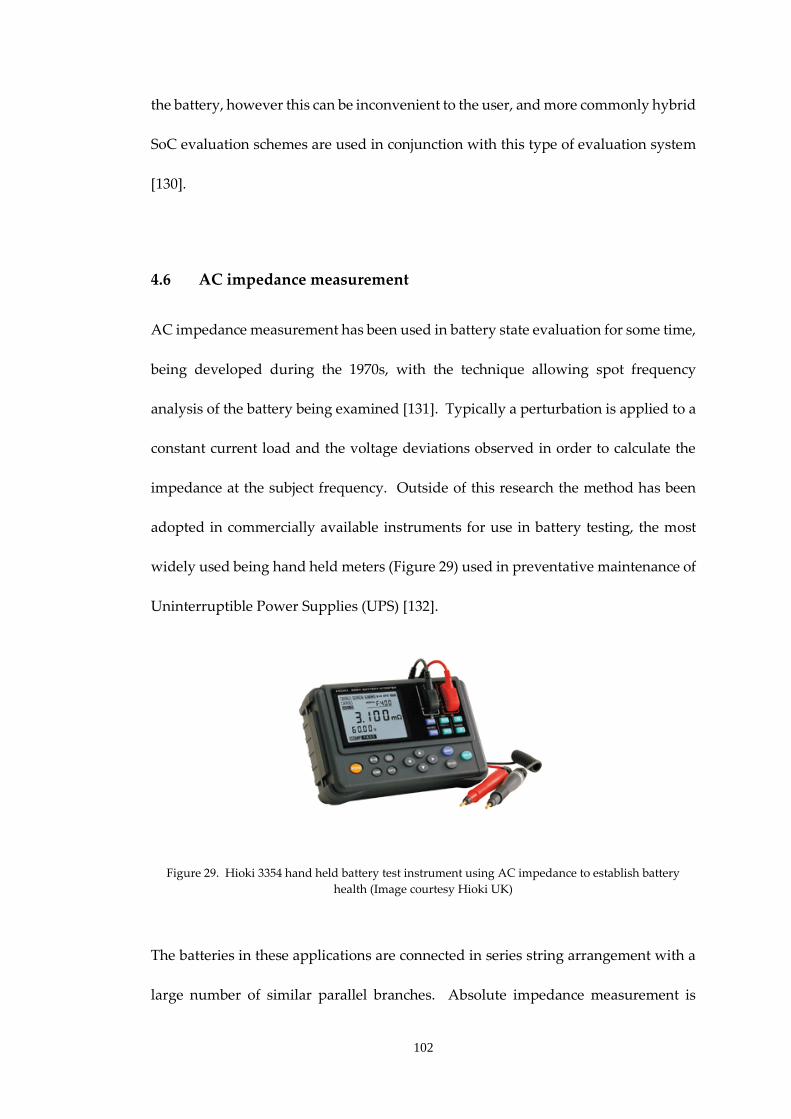
102
the battery, however this can be inconvenient to the user, and more commonly hybrid
SoC evaluation schemes are used in conjunction with this type of evaluation system
[130].
4.6 AC impedance measurement
AC impedance measurement has been used in battery state evaluation for some time,
being developed during the 1970s, with the technique allowing spot frequency
analysis of the battery being examined [131]. Typically a perturbation is applied to a
constant current load and the voltage deviations observed in order to calculate the
impedance at the subject frequency. Outside of this research the method has been
adopted in commercially available instruments for use in battery testing, the most
widely used being hand held meters (Figure 29) used in preventative maintenance of
Uninterruptible Power Supplies (UPS) [132].
Figure 29. Hioki 3354 hand held battery test instrument using AC impedance to establish battery
health (Image courtesy Hioki UK)
The batteries in these applications are connected in series string arrangement with a
large number of similar parallel branches. Absolute impedance measurement is

103
possible with these instruments but rarely used, a comparative approach using SPC
being preferred. Typically cell or battery impedances are recorded at the service
interval and retained for historical analysis. Any cell or battery that has moved away
from the median impedance value by a defined percentage will be subject to further
examination, usually requiring replacement of that battery string. AC impedance is
used widely within research for battery characterisation [133, 134], and some
embedded battery testing schemes exist within commercial products. The primary
limitations of the AC impedance technique, is that is does require a frequency sweep
to examine the equivalent circuit components, and where spot frequency schemes are
used, only limited parameter information becomes available. SoC and SoH reporting
can be carried out, but this is dependent on the excitation frequencies selected.
R1
R2
C1
ω→0-Zim
agin
ary (Ω
)
Zreal (Ω)0
0
ω→∞
ωmax= 1/R2C1
R1+R2R1
Figure 30. Electrode equivalent circuit and typical EIS plot with parameter identification
AC impedance is most commonly implemented in electrochemical cells as
Electrochemical Impedance Spectroscopy (EIS) [131], and Figure 30 shows a typical
equivalent circuit for the electrode-electrolyte interface, and the corresponding EIS
plot [16].

104
4.7 Battery management integrated circuits
The growth in the adoption of battery packs manufactured specifically for portable
equipment and computing has led to the development of a range of “battery
management” integrated circuits. Initially used in NiCD and NiMH packs the
technology has expanded to encompass the requirements of Lithium chemistries and
the safety in use of these cells. These ICs are the destination for many of the
developed battery test technologies, and they employ elements of coulomb counting,
terminal voltage measurement, load testing and AC impedance measurement.
Figure 31 shows a LCO battery in its raw, uncased form, showing the Protection
Circuit Module (PCM).
Figure 31. Lithium Ion Cobalt pack used in one of the author’s current projects (photograph by
author)
Figure 32 shows the circuit in more detail with the main control and protection ICs
highlighted. The bq77pl900 cell protection IC provides the safety control functions
within the pack, controlling the output MOSFETs, sensing temperature and cell to

105
cell balance [135]. The fuel gauge IC is particular relevance to this research, as it
incorporates the commercialisation of existing SoC and SoH technologies.
Figure 32. Close up of PCM board (photograph by author)
The bq34z100 is a Texas Instruments device and predominantly incorporates an
historically calibrated coulomb counting scheme to establish SoC, using the load to
derive calibration factors for the algorithms used [136]. Typical of such schemes, and
battery state evaluation generally, it employs historic data to improve the accuracy
of the reporting. A microcontroller implementation of this type of device could
potentially employ the novel methods of state evaluation developed during this
work.
Cell voltage measurement
MOSFET switches
bq34z100 fuel gauge IC bq77pl900 cell protection IC

106
4.8 Frequency domain (spectrum) analysis
Many of the battery test schemes discussed here operate at fixed frequency points
giving either response to low frequency pulses, DC loads or spot frequency AC
impedance.
An alternative approach is to employ a range of frequencies, or frequency rich signals
in order that impedance spectra may be obtained for the batteries under test. Using
Fast Fourier Transformations (FFT) frequency responses can be obtained, and in turn
models for the batteries and cells under test can be developed using curve fitting or
other methods to arrive at a satisfactory approximation to the test battery or cell. The
following sections outline some of the competing methods for examining batteries in
this way, and offers the PRBS technique as an alternative approach for experimental
analysis of batteries.
4.8.1 Swept sinusoids
Traditionally, frequency response analysis techniques have relied on the
application of a swept sinusoid to establish the response of the system being
examined [137, 138]. This technique remains valid, but the use of sine waves to
analyse frequency response requires analogue generation of the perturbation
signal, or a filtered pulse width modulated representation of an appropriate
sinusoid. The hardware and software overhead in generating this perturbation
digitally (if it is considered that the resultant response will be processed
digitally also) is greater than that required to generate a comparable digital

107
signal, which can in itself be swept and analysed at the individual frequency
steps.
4.8.2 Digital signals
Applying digital signals for frequency domain analysis offers clear benefits for
equipment with some computing component, either embedded or otherwise.
Generating square waves as perturbation signals is straightforward, but as with
swept sinusoids, appropriate frequency steps need to be selected and this can
lead to a long test, dependent on the resolution of the frequency steps. An
alternative approach was proposed employing designed digital signals which
are frequency rich to battery analysis [139]. Periodic signals which exhibit this
property are widely used and are introduced in the following section.
4.8.3 Pseudo Random Binary Sequences as a perturbation signal
It is conveniently straightforward to generate signals which use deterministic
logic to create signals with properties of randomness. Pseudo Random Binary
Sequences offer a digitally generated signal which on inspection appears
random in nature, but is actually periodic, and therefore has properties which
are extremely useful in several application areas. There are a class of PRBSs
termed Maximum Length Sequence (MLS) that exhibit properties similar to
white-noise and this apparent randomness of a signal, which actually repeats
finds applications in communications cryptography [140] using the PRBS

108
modulate the signal. From here on the term PRBS refers to MLS. The sequences
have extensively been used to establish audio frequency response [141], and
system frequency response analysis generally [142]. Integrated circuits such as
the Texas Instruments MM5437 [143] were marketed as noise generators for
these applications, being essentially within-a-chip implementations of the
PRBS generator seen in Figure 33, using shift registers with modulo 2 (XNOR)
feedback at predetermined “tap” positions.
Q
QSET
CLR
D
Q
QSET
CLR
D
Q
QSET
CLR
D
Q
QSET
CLR
D
CLOCK
PRBS OUT
Figure 33 4-bit PRBS generator constructed from shift registers with determined “tap”
positions and XNOR feedback
Within a PRBS generator the number of shift registers defines the bit order, n.
Considering that all states apart from “all zeros” are represented, the number
of terms, N in the sequence is defined by:
𝑁 = (2𝑛 − 1) (7)
Figure 34 shows the output from the 4 bit PRBS generator in Figure 33. The total
number of terms at which the sequence repeats (N) is 15 and the PRBS
amplitude is +/- a. The autocorrelation function is also shown, where Δt is the
period of the PRBS clock and Ts is the time before the PRBS repeats.

109
+a
-a
a2
-a2/N
-Δt +Δt
1 1 1 1 0 0 0 1 0 0 1 1 0 1 0
time
time
Ts0
Ts=(2n-1)Δt
Figure 34. Example PRBS sequence and autocorrelation response
The autocorrelation function is continuous, with the waveform totally
uncorrelated with itself if shifted more than one clock period in either
direction [107, 144].
The “tap” positions for the shift registers have been defined mathematically
in various texts [107, 144], and their derivation is outside the scope of this
work, however, common taps are shown in table 5 [145].
Table 5. Feedback tap positions for PRBS bit sequences up to 16 bit
n Feedback taps N n Feedback taps N
3 3,2 7 10 10,7 1023
4 4,3 15 11 11,9 2047
5 5,3 31 12 12,6,4,1 4095
6 6,5 63 13 13,4,3,1 8191
7 7,6 127 14 14,5,3,1 16383
8 8,6,5,4 255 15 15,14 32767
9 9,5 511 16 16,15,13,4 65535

110
Alternative tap positions can be used for some bit sequences, with n = 7 for
example also having valid taps at 7, 6. Hardware shift registers however,
along with dedicated ICs for PRBS implementation have largely been
rendered obsolete, with the general adoption of embedded processing within
electronic equipment. Within this environment, either memory registers, or a
look up table for the sequence may be used.
The power spectral density of a PRBS, as shown by Davies [144] is a line
spectrum, having an envelope described by the sinc function (sinx)/x,
reaching its first value of zero at the frequency of the clock pulse (fp). This
spectrum has been further described in other work [146, 147] giving rise to
the following equation:
2
2
s n1
i
xx
p
p
pNaf
f
f
ff
f
N
(8)
Where a is the amplitude of the PRBS (Figure 34) and N is as in equation (7).
The minimum frequency step being defined by the number of terms in the
sequence and the frequency of the clock pulse. The minimum frequency step
is shown in equation (9).
min
pff
N (9)
The PRBS is bandwidth limited at a frequency which is less than the clock
frequency, and Davies [144] derives this as the half power point:
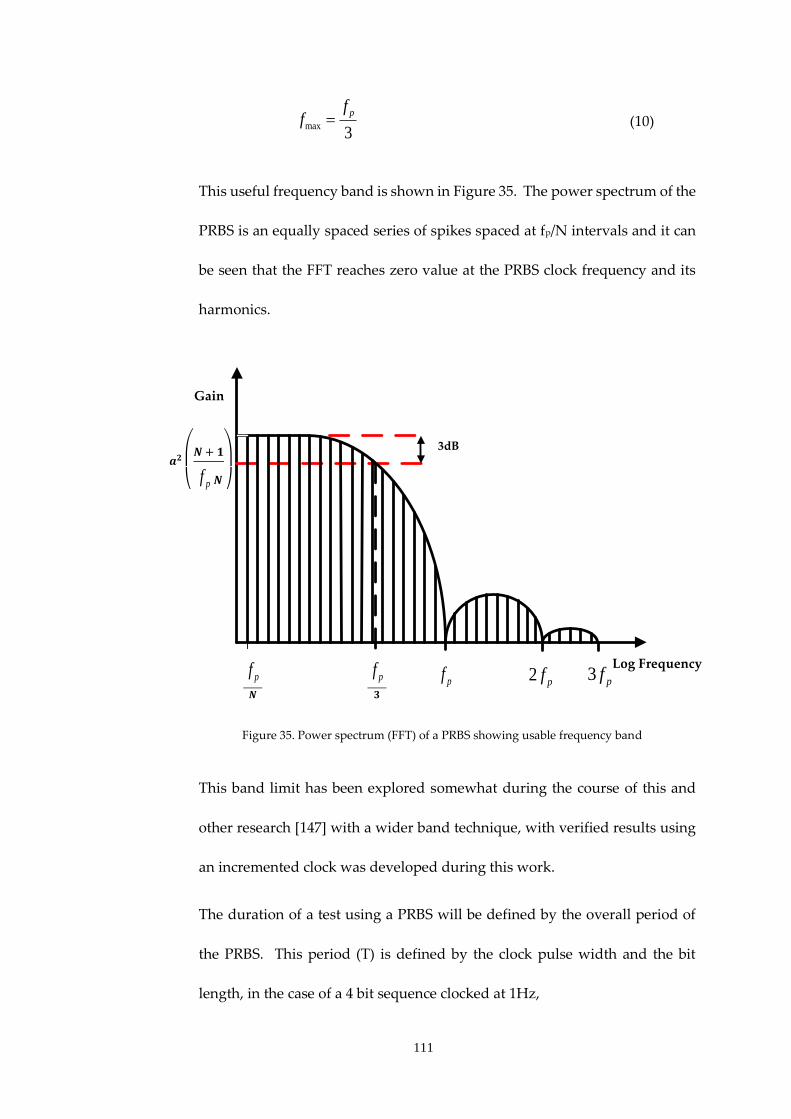
111
max3
pff (10)
This useful frequency band is shown in Figure 35. The power spectrum of the
PRBS is an equally spaced series of spikes spaced at fp/N intervals and it can
be seen that the FFT reaches zero value at the PRBS clock frequency and its
harmonics.
Figure 35. Power spectrum (FFT) of a PRBS showing usable frequency band
This band limit has been explored somewhat during the course of this and
other research [147] with a wider band technique, with verified results using
an incremented clock was developed during this work.
The duration of a test using a PRBS will be defined by the overall period of
the PRBS. This period (T) is defined by the clock pulse width and the bit
length, in the case of a 4 bit sequence clocked at 1Hz,
𝒂𝟐
(
𝑵+ 𝟏
pf 𝑵)
3dB
pf
pf
𝟑
pf
𝑵
Gain
Log Frequency
2 pf
3 pf

112
N = (2n - 1) = 15 terms
Therefore T=15 seconds.
It therefore follows that using a high bit sequence with a low frequency clock
leads to a long duration test. The design of the PRBS should therefore
consider usable bandwidth, frequency of interest and the resulting test
duration. The relationship between these three key parameters can be seen in
Table 6.
Table 6. Relationship between bandwidth, bit length (n) and test duration for a PRBS clocked
at 1kHz.
PRBS bit
length (n)
PRBS sequence
length (N)
Clock frequency
(Hz)
Test duration
(s)
Bandwidth
(Hz)
4 15 1000 0.015 66.6-333
6 63 1000 0.063 15.9-333
8 255 1000 0.255 3.92-333
10 1023 1000 1.023 0.98-333
12 4095 1000 4.095 0.24-333
14 16383 1000 16.383 0.06-333
16 65535 1000 65.535 0.015-333
18 262143 1000 262.143 0.0038-333
20 1048575 1000 1048.575 0.00095-333
As the bit length of the PRBS increases, there are diminishing returns with the
increase in usable bandwidth. The disadvantage of the use of excessively long
sequences can therefore be seen with the increase in required test duration to
capture a complete sequence.
The developed approach to utilising the PRBS as an excitation signal required
examination of how that signal could be applied to a battery or cell under test.
Clearly a battery presents itself as a low impedance, and as such applying a
voltage perturbation requires a low impedance source. As such it was decided
that a current mode approach would be developed where constant current

113
pulses would be applied to the battery in either charge or discharge mode
during the tests, and three modes of test were devised for the investigation.
4.8.4 Monopolar Pseudo Random Binary Sequence excitation
(discharge mode)
Monopolar excitation was examined as a test type for the research and the
operation of this testing concerns application of a load to the battery under
control of the designed PRBS excitation. The motivation for adoption of this
test mode was based on the hardware being relatively easy to develop, and
limiting the operational criteria for the test battery. Under a test load, the
battery would not experience any charge to discharge transient conditions,
there is no possibility of overcharge, and the mode would be used as the first
method for proving the technique.
It was accepted that the actual test does discharge the battery to some degree,
so short test durations were devised. Additionally, the current perturbation
test signal should not be designed to unnecessarily provoke Peukert effects, but
should have an appropriate current level to provide a meaningful and noise
immune result.
The amount of energy removed from the battery is clearly relevant in that any
correlations sought to be made between the test results and the battery SoC will
be compromised by the test itself. Peukert’s effect [120] – loss of capacity with
increase discharge rate, can be avoided by using a test load at or around the cr/tr
discharge rate.

114
“Coup de fouet” can be significant in battery testing results, so the test load was
selected to ensure the effect is not excessively pronounced, and the data
examined for the characteristic drop in terminal voltage followed by a partial
recovery. The initial investigations with this test mode are explored in chapter
5, and the technique is used extensively throughout the work.
4.8.5 Monopolar Pseudo Random Binary Sequence excitation
(charge mode)
The charge mode testing was devised in order to explore any differences in
applying a charge pulse to a test battery, in comparison with the discharge
mode testing. Furthermore, the effect of adjusting the charge ceiling voltage
was of interest as a means for SoC evaluation in this mode. The method is
explored in chapter 6, and yielded valuable comparative results to the
discharge mode tests.
4.8.6 Bipolar Pseudo Random Binary Sequence excitation
Bipolar mode PRBS battery excitation offers the least intrusive test to the
battery, in that the net energy applied by the test is zero, and only the battery
efficiency at the perturbation current amplitude should apply. The test mode
requires complementary power stages delivering and removing current under
influence of the PRBS. The technique is given a thorough treatment in chapter
7, and demonstrated the envisaged benefits of a net-zero energy test.

115
4.9 Conclusion
In reviewing the existing battery testing technologies it becomes clear that no single
battery test scheme offers “all things to all men”, and as such various methods are
employed to establish battery state. Table 7 shows a summary of the technologies
examined, and their limitations and applicability. With the exception of specific
gravity, the commercial battery management integrated circuits commercially
available exploit the majority of the test techniques and implement a hybrid scheme.
The areas of novelty identified for investigation were concerned with the detailed
examination of frequency-rich perturbation signals for a battery parameter
estimation scheme in the frequency domain.
Further to this, an examination of three specific modes of PRBS application (load,
charge and load/charge) were to be carried out to establish if there were discernible
differences in the respective test modes.
The development of on-line hybrid battery testing schemes in one or more of the
described modes, allowing the battery to be continuously evaluated without
disconnection from the host equipment, using current and voltage responses to
provide indicators of battery state.
And finally, development of the PRBS technique into a software based embedded
solution allowing low cost implementation of the technology and possible
incorporation into hybrid schemes such as commercially available battery
management ICs.
An investigation of these techniques using PRBS is detailed in the following chapters.
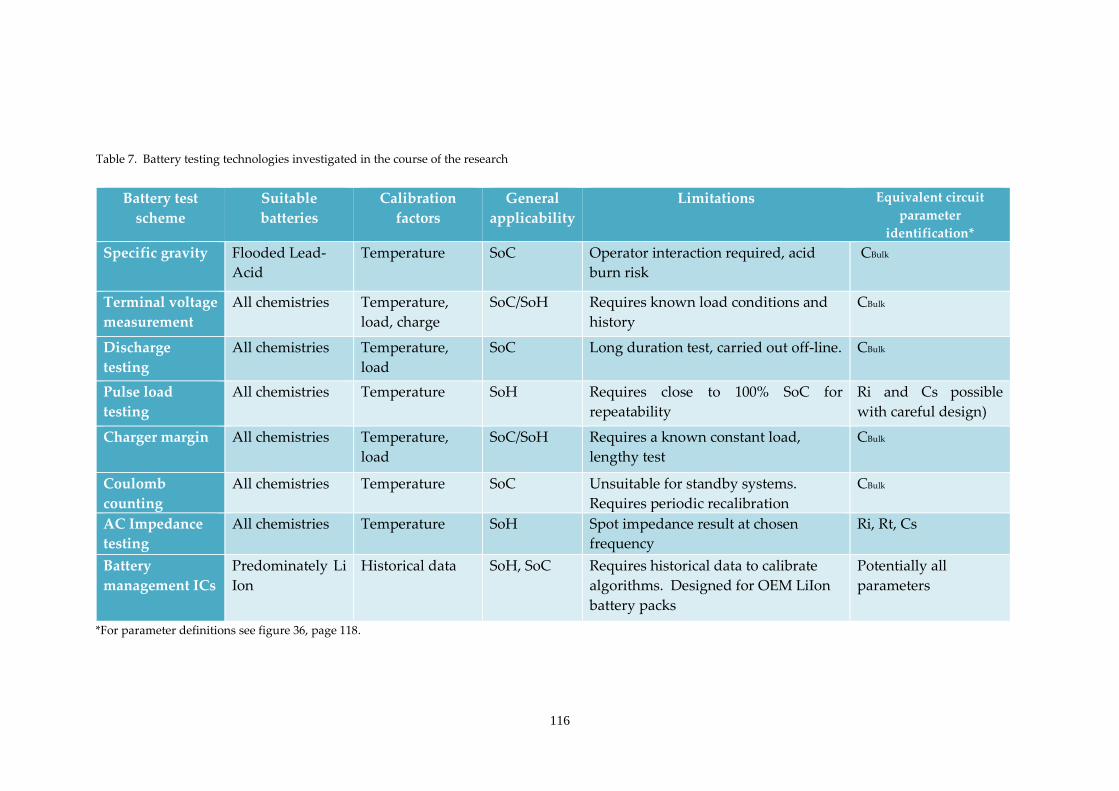
116
Table 7. Battery testing technologies investigated in the course of the research
*For parameter definitions see figure 36, page 118.
Battery test
scheme
Suitable
batteries
Calibration
factors
General
applicability
Limitations Equivalent circuit
parameter
identification*
Specific gravity Flooded Lead-
Acid
Temperature SoC Operator interaction required, acid
burn risk
CBulk
Terminal voltage
measurement
All chemistries Temperature,
load, charge
SoC/SoH Requires known load conditions and
history
CBulk
Discharge
testing
All chemistries Temperature,
load
SoC Long duration test, carried out off-line. CBulk
Pulse load
testing
All chemistries Temperature SoH Requires close to 100% SoC for
repeatability
Ri and Cs possible
with careful design)
Charger margin All chemistries Temperature,
load
SoC/SoH Requires a known constant load,
lengthy test
CBulk
Coulomb
counting
All chemistries Temperature SoC Unsuitable for standby systems.
Requires periodic recalibration
CBulk
AC Impedance
testing
All chemistries Temperature SoH Spot impedance result at chosen
frequency
Ri, Rt, Cs
Battery
management ICs
Predominately Li
Ion
Historical data SoH, SoC Requires historical data to calibrate
algorithms. Designed for OEM LiIon
battery packs
Potentially all
parameters

117
Chapter 5. Discharge mode Pseudo Random Binary Sequence battery
testing
5.1 Introduction
The following chapter examines the PRBS technique for evaluating battery state using
a constant current load being excited by the designed sequence. The work was
carried out early in the body of research and the motivation for the investigation was
concerned with proving the technique in terms of its ability to identify impedance for
the test batteries, and indeed to be able to differentiate between batteries in different
states-of-health (SoH). This chapter introduces the test method, and seeks to make
initial comparisons between the results obtained and those obtained through
conventional testing. Further to this observations are made in relation to a standard
model for batteries and cells, and the foundations laid for further model
development.
5.2 Battery Models
Basic electrical models for electrochemical cells are widely employed to aid the
analysis of energy storage systems, and in the analysis of batteries, several models
are in widespread use. These models may be borrowed from their usage in analysis
of electrochemical cells which may not specifically be electrical energy storage
devices, and this is demonstrated with the diverse application of the models, with

118
examples ranging from DNA analysis [148] to modelling of reinforced concrete
corrosion [149].
In the general approach to battery modelling an R-C linear equivalent circuit model
is employed, which in its most simplistic form, comprises a capacitor, representing
the bulk energy store, and a series resistor. This model, however, is limited in use, as
it does not fully describe the chemical processes within the battery. It therefore
follows that an improved model, with representation of the predominant chemical
phenomena, should be used as the basis for further evolution of the described system.
Detailed models have been developed for secondary cells using this approach [52],
which generally evolve from the familiar Randles’ model [150] which is used for the
work described in this chapter. The model is a straight forward electrical
representation of the complex electrochemical processes, with lumped parameters
representing dominant battery behaviour. The model assumes the cell behaviours
under both charge and discharge conditions are identical, and charge transfer is
achieved with 100% efficiency.
V
Ri
Rt
CSurface
CBulkRd
II
V
Figure 36. Randles equivalent circuit
Figure 36 shows the Randles’ model which was used for the basis of the initial model
development. Ri is the lumped resistance for the electrolyte and cell interconnections

119
and represents the major series resistance for the cell. CSurface is a double layer
capacitance, which is a result of the charge separation at the interface between the
electrolyte and the cell plate [13, 16]. Rt, connected in parallel with the double layer
capacitance is the charge transfer polarisation, and this parallel branch controls
transient behaviour of the battery.
CBulk represents the dominant capacitive element of the cell and Rd is the self-
discharge resistance of the cell. Rd is typically high for a healthy cell, and is most
commonly quoted by the manufacturer in terms of a percentage discharge in a
specified time. Yuasa provide a figure of 3% per month self-discharge at 20ºC for
their NP battery range, which translates into a value for Rd of approximately 5kΩ,
for the 65Ah batteries used in the experiments [12].
Calculation of Rd can be carried out as follows:
3% per month self-discharge at 20°C
3% of 65Ah = 1.95Ah capacity loss in the first month
One month = 30 days at 24 hours, 720 hours total
Therefore 1.95Ah/720 hours = 2.71 x 10⁻³ A discharge current
Assuming a fully charged battery, terminal voltage will be approximately 13V
Using Ohm’s law, V= I x R
13 = 2.71 x 10⁻³ x Rd
Therefore, Rd = 4.797kΩ
So the general formula for evaluating Rd:
100
720
OCTd
r
VR
SDc
(11)

120
720
100
OCTd
r
VR
SDc
(12)
Where VOCT = battery open circuit terminal voltage
SD = self-discharge rate (%/month)
cr = rated battery capacity in Ah
5.3 Cell parameter estimation by conventional methods
Analysis of cells and batteries by conventional means is well understood, and a
number of methods can be employed to determine appropriate vales for the
equivalent circuit components. In order to validate the results of the PRBS testing, it
was necessary first to establish the equivalent circuit parameters using conventional
tests employing step load pulses, and controlled constant-current discharges.
5.3.1 Determination of CBulk
Establishing the overall capacity, and from that the bulk capacitance, of a test
battery employs a straightforward, albeit lengthy, discharge test. The test
battery had a specified capacity at a 20 hour discharge rate, and as such a
constant current load of 0.05cr was applied. Manufacturers data for the battery
[17] was consulted for the End-of Discharge voltage (VEoD). This VEoD (10.5V for
this battery @ 20°C) allows direct calculation of CBulk from the published
capacity and the initial terminal voltage at 100% SoC. Therefore, these initial
estimates of the bulk capacitance value of a battery can be made before
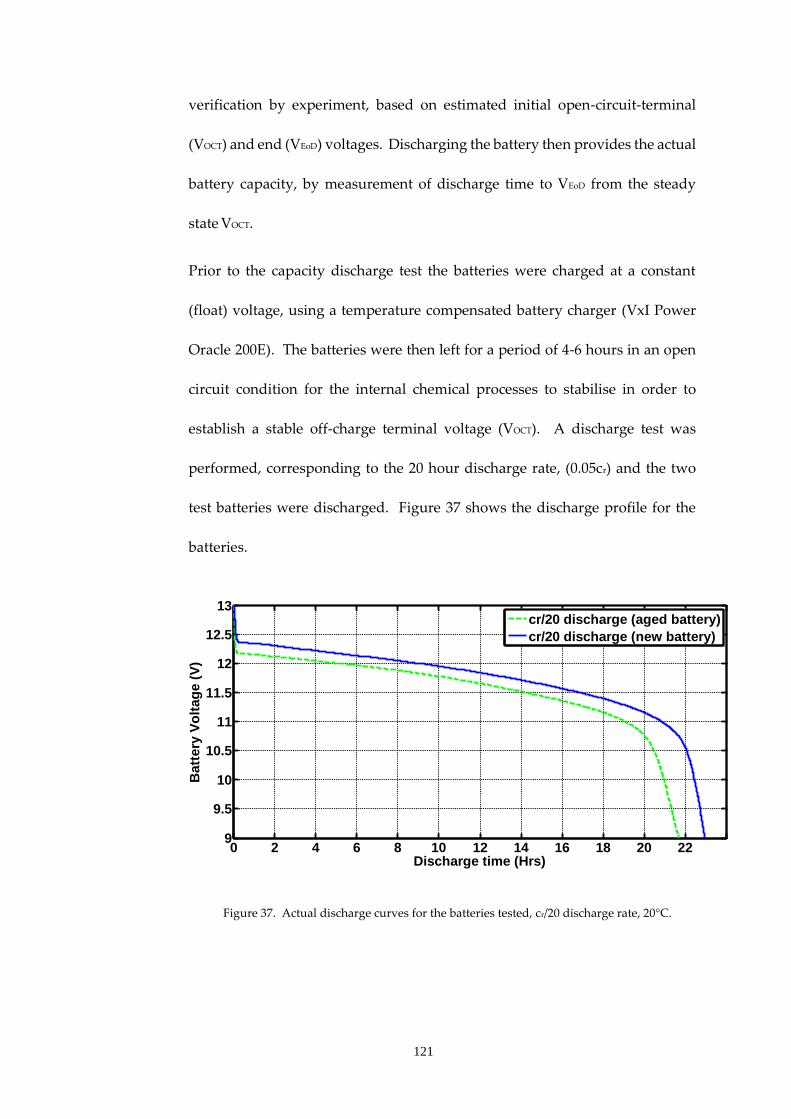
121
verification by experiment, based on estimated initial open-circuit-terminal
(VOCT) and end (VEoD) voltages. Discharging the battery then provides the actual
battery capacity, by measurement of discharge time to VEoD from the steady
state VOCT.
Prior to the capacity discharge test the batteries were charged at a constant
(float) voltage, using a temperature compensated battery charger (VxI Power
Oracle 200E). The batteries were then left for a period of 4-6 hours in an open
circuit condition for the internal chemical processes to stabilise in order to
establish a stable off-charge terminal voltage (VOCT). A discharge test was
performed, corresponding to the 20 hour discharge rate, (0.05cr) and the two
test batteries were discharged. Figure 37 shows the discharge profile for the
batteries.
Figure 37. Actual discharge curves for the batteries tested, cr/20 discharge rate, 20°C.
0 2 4 6 8 10 12 14 16 18 20 229
9.5
10
10.5
11
11.5
12
12.5
13
Discharge time (Hrs)
Batt
ery
Vo
ltag
e (
V)
cr/20 discharge (aged battery)
cr/20 discharge (new battery)

122
The capacity in Ah is calculated, from which the energy transferred from the
battery to the load, WCBulk, can be determined. A value for the bulk capacitor
is obtained by equating from the capacitor energy equation.
𝑊𝐶𝐵𝑢𝑙𝑘 = 1
2𝐶𝐵𝑢𝑙𝑘(𝑉
2) (13)
= 1
2𝐶𝐵𝑢𝑙𝑘(𝑉
2𝑂𝐶𝑇 − 𝑉
2𝐸𝑜𝐷) (14)
Capacity in Ampere-seconds:
cAS = discharge current (A) x time (s) (15)
Therefore,
𝐶𝐵𝑢𝑙𝑘 𝐼𝑛𝑖𝑡𝑖𝑎𝑙 = 𝐶𝐴𝑆 ⨉ 𝑉𝑂𝐶𝑇
1
2(𝑉𝑂𝐶𝑇2 −𝑉𝐸𝑜𝐷
2 ) (16)
Analysis of the discharge curves for the new and aged batteries revealed a difference
in capacity of 7% as shown in table 8.
Further tests were therefore carried out to establish the variation in CBulk with
increased discharge. As discussed in chapter 3, Peukert’s equation describes how
Lead-Acid cells and batteries vary in available capacity for different rates of
discharge, and it is known from the authors work in industry that the Peukert
coefficient of a battery can be affected be declining SoH. The batteries were subjected
to cr/4, cr/2 and 1cr discharges, and the results from the discharge tests for both
batteries can be seen in Figure 38. With increased discharge rates deviations from
expected performance were observed. For the higher rate discharge tests capacity
differences between the two batteries increased, rising to around 20% for the 1c test
on the aged battery, with a characteristic steep fall in terminal voltage seen on
application of the load. This further indicated the degrading SoH of the aged battery
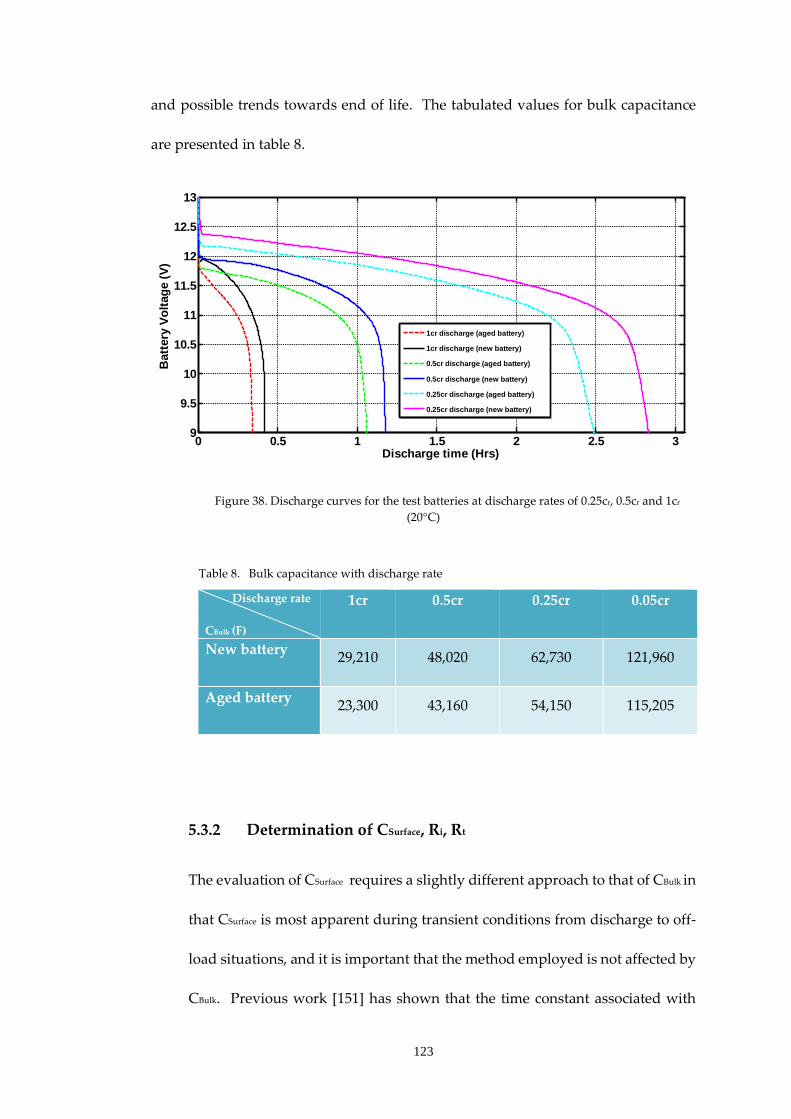
123
and possible trends towards end of life. The tabulated values for bulk capacitance
are presented in table 8.
Figure 38. Discharge curves for the test batteries at discharge rates of 0.25cr, 0.5cr and 1cr
(20°C)
Table 8. Bulk capacitance with discharge rate
Discharge rate
CBulk (F)
1cr 0.5cr 0.25cr 0.05cr
New battery 29,210 48,020 62,730 121,960
Aged battery 23,300 43,160 54,150 115,205
5.3.2 Determination of CSurface, Ri, Rt
The evaluation of CSurface requires a slightly different approach to that of CBulk in
that CSurface is most apparent during transient conditions from discharge to off-
load situations, and it is important that the method employed is not affected by
CBulk. Previous work [151] has shown that the time constant associated with
0 0.5 1 1.5 2 2.5 39
9.5
10
10.5
11
11.5
12
12.5
13
Discharge time (Hrs)
Batt
ery
Vo
ltag
e (
V)
1cr discharge (aged battery)
1cr discharge (new battery)
0.5cr discharge (aged battery)
0.5cr discharge (new battery)
0.25cr discharge (aged battery)
0.25cr discharge (new battery)

124
CBulk is very much larger than that associated with CSurface, and therefore a test
pulse duration of short duration compared to the time constant associated with
CBulk can be easily selected to reveal CSurface. Typical pulse widths of 500mS (2Hz)
have been quoted in previous work for small capacity cells [41].
The test employed a constant current discharge of 20A from a fully charged
state, during which, short interruptions to the load were made in order to
observe the transient terminal voltage of the batteries. Figure 39 shows the
terminal voltage of one of the batteries, observed during the test, with figure 40
showing the response zoomed to show more detail.
Figure 39. Off-load step response used in calculation of model parameters
Prior to time t0 the battery has been discharging to some time at a constant
current and the terminal voltage is considered to be in a time-limited pseudo
steady-state. During this time it can be assumed that the decay in terminal
voltage is completely attributable to the discharge of the bulk capacitor. As
the load is removed (t=t1), a step change in the terminal voltage occurs,
which is predominantly due to the series impedance, Ri. Following the step
0 1 2 3 4 5 612.5
12.55
12.6
12.65
12.7
12.75
Time (s)
Batt
ery
Vo
ltag
e (
V) ∆V1= I × Ri
∆V2 = 0.67(I × Rt) ∆V3= (I × Rt)
τ τ = Rt ×CSurface
t1
t2

125
change CSurface begins to charge (previously discharged during the load
period).
Figure 40. Off-load step response zoomed to show detail
The load is re applied (t=t2), and again the effect of Ri is seen, followed by the
discharge of CSurface (time duration τ). As previously discussed the value of
CSurface is several orders of magnitude smaller than CBulk allowing a reasonable
degree of clarity regarding measuring the time constant.
From the responses obtained, the equations below were used to obtain the
parameters of interest, shown in table 9.
𝑅𝑖 = ∆V1
𝐼 (17)
𝑅𝑡 = 0.67𝐼
∆V2 (18)
𝐶𝑆𝑢𝑟𝑓𝑎𝑐𝑒 = 𝜏
𝑅𝑡 (19)
0.95 1 1.05 1.1 1.15 1.212.5
12.55
12.6
12.65
12.7
12.75
Time (s)
Ba
tte
ry V
olt
ag
e (
V)
V2 = 0.67(I × R
t)
V1=(IxR
i)
V2=0.67(IxR
t)
= Rt x C
Surface

126
5.3.3 Determination of Rd
The measurement of Rd is carried out by observing the decay of VOCT for a fully
charged battery that has been allowed to achieve a steady-state terminal voltage
subsequent to the charging process. The test batteries were fully charged and
connected to a data acquisition system of sufficiently high input impedance
(>1MΩ) as not to effect the self-discharge caused by Rd. The decay in terminal
voltage was measured over several weeks in order that the value of Rd could
therefore be calculated using equation 11 in section 5.2.
5.3.4 Experimental results
The parameters obtained from the conventional tests can be seen in table 9.
Table 9. Parameters obtained from the test batteries using the conventional tests
New battery Aged battery
VOCT (V) 12.846 12.807
VEOD (V) 10.5 10.5
Capacity (As) 259,992 241,839
CBulk (F) 121,960 115,205
CSurface (F) 14.81 5.59
Ri (mΩ) 5.08 5.6
Rt (mΩ) 5.18 6.5
Rd (Ω) 5,034 4,955

127
5.4 Pseudo Random Binary Sequence (PRBS) battery analysis
In order to design the PRBS tests, the conventional test data was used to make
predictions regarding the PRBS design parameters. Simulations were carried out
using a sampled data model, which informed the PRBS design.
5.4.1 Sampled data model analysis
The parameters obtained from the conventional tests (Table 9) allowed an
examination of the impedance response for the battery using computational
techniques. The results of this approach were used to inform the PRBS design
process, in presenting the frequencies of interest, and therefore facilitating the
choice of clock frequency, and the required bandwidth.
Throughout this work the magnitude of complex impedance is used, and based
on the selected Randle’s model, the overall battery impedance can be expressed
in complex form, assuming constant temperature:
1 1
1 1 1 1Batt i
d Bulk t Surface
Z R
R XC R XC
(20)
A sampled data model was created in MATLAB, with a PRBS sequence
generated and applied to the Randles’ model, with values for the equivalent
circuit established earlier (Table 9). For completeness the sampled data model
(sdm1a.m) is included in the appendices in 15.8.1. FFTs of both the input
current waveform and the corresponding battery terminal voltage were

128
evaluated (Figures 41 and 42), with the evaluated impedance over the usable
frequency band shown in Figure 43.
Figure 41. Simulated current FFT plots using experimental battery data
Figure 42. Corresponding Voltage FFT with the PRBS applied to the Randle’s model
10-1
100
101
102
103
104
105
0
0.005
0.01
0.015
0.02
0.025
0.03
0.035
Frequency (Hz)
FF
T o
f P
RB
S t
est
cu
rren
t
10-1
100
101
102
103
104
105
0
0.5
1
1.5
2
2.5
3
3.5x 10
-4
Frequency (Hz)
FF
T o
f B
att
ery
Vo
ltag
e

129
Figure 43. Impedance plot resulting from the experimental data
A number of simulations were carried out, and it became apparent that exciting
CBulk would prove a problem due to the high value of this component leading
to an extremely long test. For example, if we consider CBulk to be in the order of
120,000F for the new battery at the 0.05cr discharge rate (table 9), the frequency
response range over which the impedance is of interest is in the order of 10-7 Hz
and lower. Hence the clock frequency for the PRBS would need to be in the
same order and 1/10-7 Hz = 165 days - for the clock pulse alone.
Applying similar analysis to the other circuit parameters from table 9, a clock
frequency of 1200Hz was chosen, in conjunction with a 12 bit PRBS sequence,
giving a sequence length of 4095 (2n-1 where n=12). This would excite the
remaining components in the equivalent circuit and give a test duration of
around 3.4 seconds (4095/1200Hz). This investigation is expanded in later
chapters to provide correlations between the readily examinable parameters to
CBulk.
100
101
102
0
5
10
15
Frequency (Hz)
Imp
ed
an
ce (
mil
liO
hm
s)

130
5.5 Experimental PRBS investigation
Tests were devised to explore the PRBS test technique in comparison to the
conventional tests. The objective of these tests were to form a basis for the work in
later chapters.
5.5.1 Temperature considerations
Tests were carried out at constant temperature, with consideration given to self-
heating of the battery during the test. An estimate for self-heating was made
based on overall battery impedance of tens of milliohms and a PRBS current
amplitude of 10A at 50% duty cycle.
Power = I2R = (10/2)2A x 20mΩ (approximately)
= 0.5 Watts, or 0.5 Joules for every second of test
Specific heat capacity of Lead = 112 J/kg°C [152]
If the test battery mass = 23kg and we assume 70% of the battery mass is lead:
112 J/kg°C x 16.1kg = 1803.2J to raise the battery temperature by 1°C
It was therefore decided the PRBS tests would not significantly affect the
battery temperature.
5.5.2 Test system description
A high-power battery cell characterisation apparatus, (Figures 44 and 45), was
developed featuring data acquisition, high-bandwidth current amplifier and

131
PRBS generator. The test rig was developed in a modular format allowing later
expansion, and eventual incorporation into a combined-mode test system.
Data acquisition
Battery Current
Battery under test
Battery Voltage
Signal 0V
Power 0V
Power 0V
IBatt
PRBS current sink
Microcontroller development board (PRBS
signal)
High speed constant current load module
Figure 44. Test system block diagram
Figure 45. Photograph of test rig
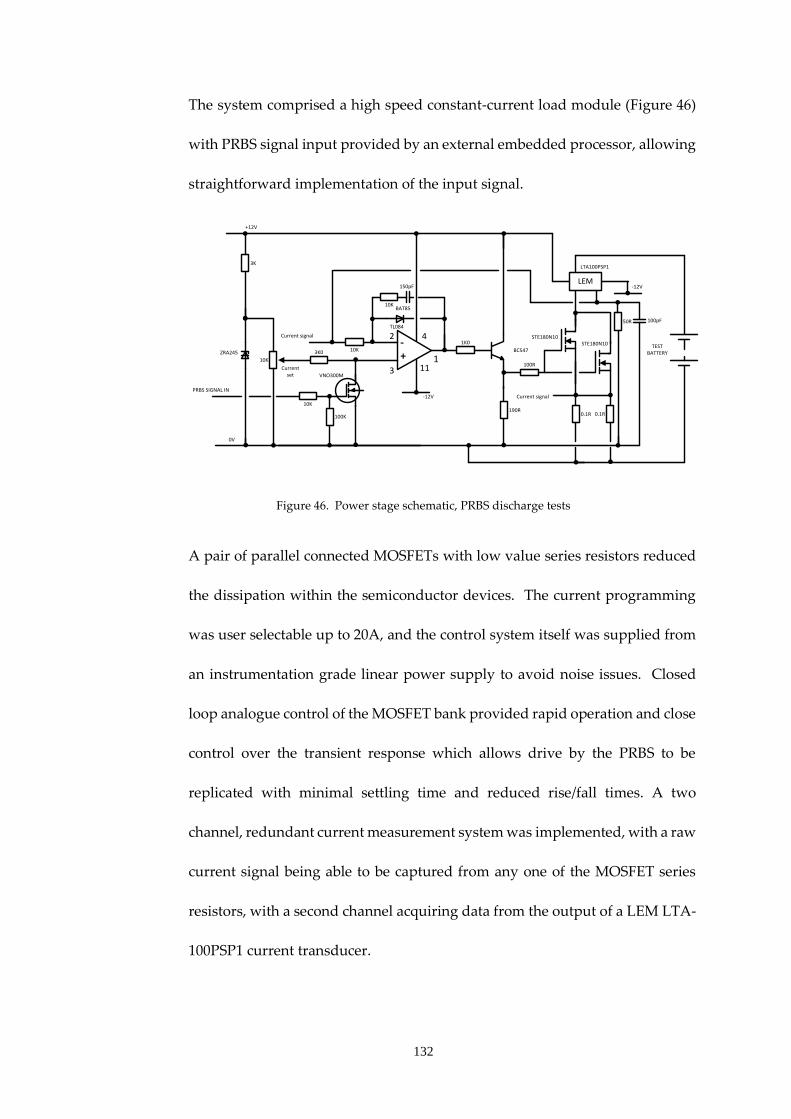
132
The system comprised a high speed constant-current load module (Figure 46)
with PRBS signal input provided by an external embedded processor, allowing
straightforward implementation of the input signal.
1K02
3
- +
LEM
1 11
4
BAT85
10K
3K
+12V
TL084
ZRA245
10K
100K
3K0TEST
BATTERY
PRBS SIGNAL IN
100R
BC547
190R
-12V
150pF
10K
10K
VNO300M
50R 100pF
-12V
0V
LTA100PSP1
STE180N10
0.1R
STE180N10
0.1R
Current signal
Current signal
Current set
Figure 46. Power stage schematic, PRBS discharge tests
A pair of parallel connected MOSFETs with low value series resistors reduced
the dissipation within the semiconductor devices. The current programming
was user selectable up to 20A, and the control system itself was supplied from
an instrumentation grade linear power supply to avoid noise issues. Closed
loop analogue control of the MOSFET bank provided rapid operation and close
control over the transient response which allows drive by the PRBS to be
replicated with minimal settling time and reduced rise/fall times. A two
channel, redundant current measurement system was implemented, with a raw
current signal being able to be captured from any one of the MOSFET series
resistors, with a second channel acquiring data from the output of a LEM LTA-
100PSP1 current transducer.
133
Data acquisition was provided by a proprietary system from IOTech (full
specification can be found in appendices, 15.6) at sampling rates of up to 32kHz
available with 16 bit resolution. Initial charge is provided by a closely
controlled battery charger manufactured by VxI Power Ltd [153].
5.5.3 Test procedure
The battery was fully charged, and allowed to establish a steady-state terminal
voltage over four hours, before the tests were carried out. The current pulse
amplitude was selected in order to provide good signal to noise ratio, without
producing a significant discharge (PRBS pulse amplitude set to 10A, 0.15 cr).
The excitation signal was applied to the test system using a Microchip
development board, running a simple routine in C. The PRBS sequence was
generated by a software implemented 12 bit shift register, with a clock
frequency in the order of 1.2 kHz allowing a good combination of test duration,
bandwidth and resolution.
5.5.4 Test results
Examples of the acquired data can be seen in Figures 47 and 48. The evaluation
of impedance from battery test results was carried out using MATLAB code
written to evaluate FFTs of both the PRBS current and voltage waveforms, then
evaluate these using Ohm’s law. In the literature it is well acknowledged, [144,
154, 155] that to minimise the effects of spectral leakage and other artefacts,

134
complete PRBS sequences must be processed. This was demonstrated during
the off line processing, in that the capture of non-exact sequences gave rise to
considerable signal spectral content degradation. Correspondingly the analysis
routines written in MATLAB extracted exact sequences of acquired data to be
processed. Initially, using inspection, the data start of the PRBS was
established, and from that the sequence length was calculated by a MATLAB
function (fourseq.m), based on sampling rate, bit length and clock frequency.
The code also provided a check of data integrity, by plotting the current FFT,
which easily confirms the data sample by inspection, providing a clean PRBS
FFT. The routine is included in section 15.7.4 of the appendices. Once the data
start and sequence length were verified, the data was processed using
evalprbs.m which carried out the impedance calculation using the FFTs of PRBS
terminal voltage and excitation current. The routine is included in the
appendices (15.7.5).
Figure 47. Extract from the PRBS current perturbation signal
0 0.05 0.1 0.15 0.2 0.250
2
4
6
8
10
Time (s)
Test
Cu
rren
t (A
)
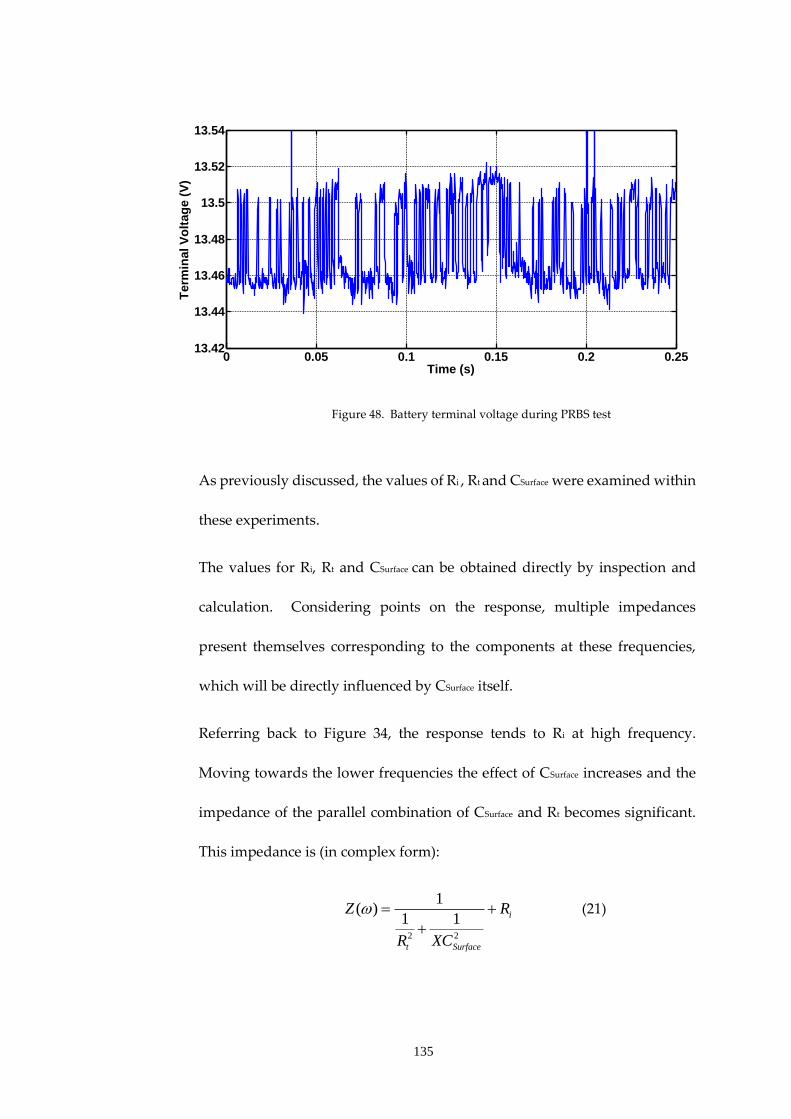
135
Figure 48. Battery terminal voltage during PRBS test
As previously discussed, the values of Ri , Rt and CSurface were examined within
these experiments.
The values for Ri, Rt and CSurface can be obtained directly by inspection and
calculation. Considering points on the response, multiple impedances
present themselves corresponding to the components at these frequencies,
which will be directly influenced by CSurface itself.
Referring back to Figure 34, the response tends to Ri at high frequency.
Moving towards the lower frequencies the effect of CSurface increases and the
impedance of the parallel combination of CSurface and Rt becomes significant.
This impedance is (in complex form):
2 2
1( )
1 1 i
t Surface
Z R
R XC
(21)
0 0.05 0.1 0.15 0.2 0.2513.42
13.44
13.46
13.48
13.5
13.52
13.54
Time (s)
Term
inal V
olt
ag
e (
V)

136
Calculating a value for CSurface without Rt can be carried out by taking more
than one point from the impedance results, and solving simultaneous
equations at frequencies ω1 and ω2. Therefore, if Zt1 and Zt2 are two complex
impedances at frequencies ω1 and ω2 respectively, the impedance of the
parallel combination of Rt and CSurface at these frequencies will be:
(XCSurface1 and XCSurface2 are the reactance of CSurface at ω1 and ω2 respectively).
1
1
1
1 1t i
t Surface
Z R
R XC
(22)
Therefore:
1 1
1 1 1
t t i SurfaceR Z R XC
(23)
And
2 2
1 1 1
t t i SurfaceR Z R XC
(24)
Equating:
1 1 2 2
1 1 1 1
t i Surface t i SurfaceZ R XC Z R XC
(25)
Solving for CSurface:
1 2 2 1
1 1 1 1
t i t i Surface SurfaceZ R Z R XC XC
(26)
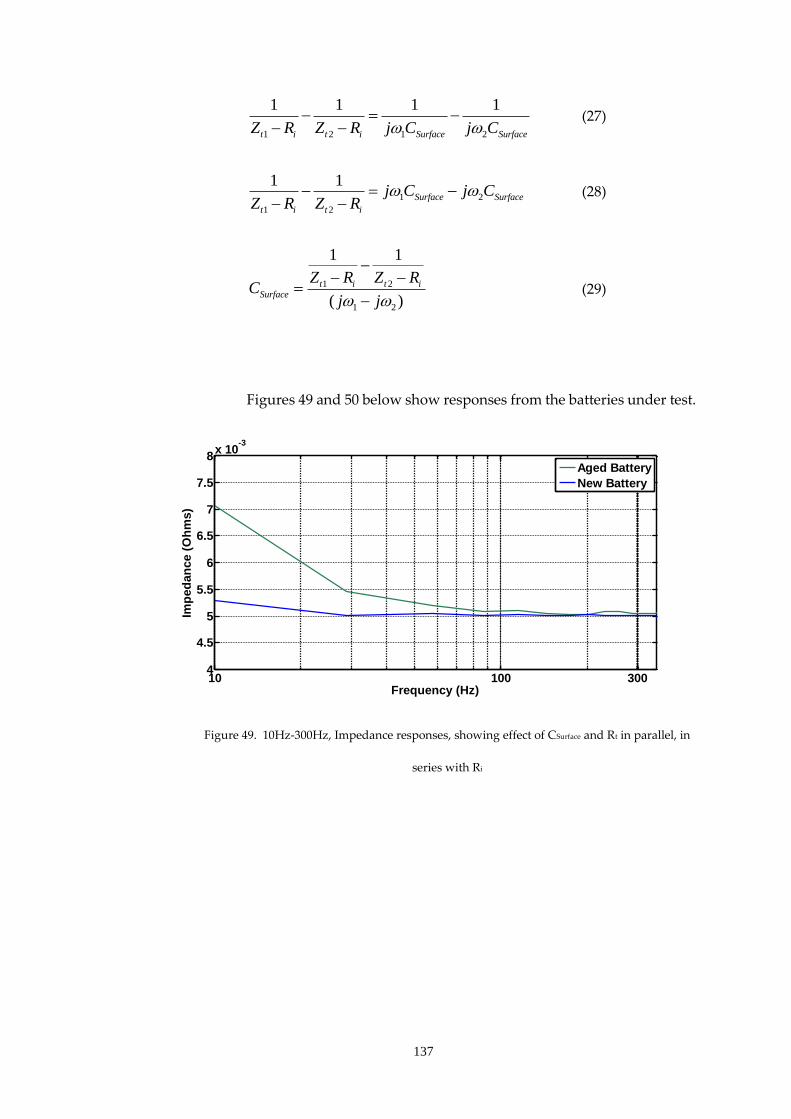
137
1 2 1 2
1 1 1 1
t i t i Surface SurfaceZ R Z R j C j C
(27)
1 2
1 2
1 1Surface Surface
t i t i
j C j CZ R Z R
(28)
1 2
1 2
1 1
( )
t i t iSurface
Z R Z RC
j j
(29)
Figures 49 and 50 below show responses from the batteries under test.
Figure 49. 10Hz-300Hz, Impedance responses, showing effect of CSurface and Rt in parallel, in
series with Ri
10 100 3004
4.5
5
5.5
6
6.5
7
7.5
8x 10
-3
Imp
ed
an
ce (
Oh
ms)
Frequency (Hz)
Aged Battery
New Battery

138
Figure 50. 300Hz-1000Hz Impedance responses showing response tending to the
value of Ri
Using equation 29 above CSurface was evaluated in MATLAB using two
frequency points at 10Hz and 300Hz, This was carried out within evalprbs.m
(15.8.5, do_z_calc) allowing phase to be taken into account from the
impedance results. The value for CSurface was then subsituted back in to
equation 23 within the same MATLAB routine to obtain Rt. A summary of
the results are found in table 10.
The PRBS analysis of the two batteries yielded some interesting results in that
the values obtained for Ri for the load-step test in section 5.3.2 and frequency
domain tests were in the healthy range expected for both batteries. The
manufacturer’s data sheet is included in 15.7.1 indicates an impedance of 5mΩ
at 1 kHz, (which corresponds to Ri) and an internal resistance of 10.51mΩ (Ri
+ Rt). This is interesting in that the aged battery was expected to be more
obviously degraded, yet measurement of CBulk revealed a reduction in rated
1,000300 500 2
3
4
5
6
7
8x 10
-3
Frequency (Hz)
Imp
ed
an
ce (
Oh
ms)
Aged Battery
New Battery

139
capacity of only 7%. The value of CSurface yielded the most information, the
aged battery showing a considerable reduction in this value. Despite
appearing relatively healthy this hinted at the underlying age of the battery
and therefore a potential indicator of SoH.
This confirmed the earlier findings of the higher rate discharge capacity tests
in section 5.3.1 where the differences in capacity between the aged and new
batteries increased (Figure 37). The tests indicated the aged battery tending
towards 20% reduction in capacity at the 1cr discharge rate, further indicating
the degradation of the aged battery (table 10).
Table 10. Experimental results, pulse test results from table 9 in parentheses.
New
battery
Aged battery
CBulk (F)
(static test) 121,960 115,205
CSurface (F) 16.4 (14.8) 4.5 (5.6)
Ri (mΩ) 5.0 (5.1) 5.1 (5.6)
Rt (mΩ) 4.0 (5.2) 4.2 (6.5)
5.6 Conclusion
The work within this chapter demonstrated the PRBS parameter identification
technique as applicable to the test batteries. The PRBS tests were successfully verified

140
through experimental comparison to results obtained by the conventional established
testing methods. Comparisons to conventional current pulse and discharge test
methods showed clear advantages of the PRBS technique. The parameters were
identified with short duration tests, and it was shown that battery in declining SoH
could be identified by differences in the frequency response and in turn equivalent
circuit parameters.
Commercial battery test equipment generally operates at singular frequencies in the
1 kHz range [132], only Ri can be examined, and in the case of the test batteries the
comparative conventional tests showed this value to be in a healthy range.
Similarly, the PRBS tests showed these indications for Ri, however, in the older
battery, the value of CSurface had reduced by some margin, and CBulk, although not
measurable directly using the PRBS was established via controlled long duration
discharge tests and was found to be reduced, albeit to a lesser extent.
The observed frequency range in the PRBS tests therefore allowed deeper analysis of
the battery than the conventional testing methods, but was not sufficiently broad to
facilitate curve fitting, which is required to observe more subtle changes in battery
equivalent circuit parameters over operational conditions of temperature, load and
charge. Additionally the test time required to explore the excitation of CBulk,
prohibited direct identification, and as such, seeking to find correlations between SoC
and other, more readily identified, equivalent circuit elements was identified as a
relevant body of work for investigation.
The identified limitations of the PRBS techniques were therefore found to be
bandwidth and test time leading to the work which is explored in later chapters.

141
Chapter 6. Charge mode Pseudo Random Binary Sequence battery
testing
6.1 Introduction
This chapter builds on the work carried out in the previous chapter to establish the
PRBS battery evaluation technique, and introduces a current source (charge)
approach.
The motivation for the work was to investigate the application of PRBS perturbation
using positive current injection into the battery. Specifically, the investigation was
concerned with exploring the use of charge current injection as a battery evaluation
technique, with the obvious advantage that this can be applied to battery charger
designs with minimal additional hardware.
Furthermore, comparisons to the discharge technique were of interest, as it is known
that batteries exhibit different characteristics during charge and discharge [16].
The investigations carried out in chapter 5 were able to distinguish between batteries
in differing states of health, but the bandwidth of the test results did not facilitate the
use of curve fitting. As such further specific goals within this work were to expand
the bandwidth of the test results, and develop characteristic responses in order that
more subtle effects can be observed.
Furthermore, during the work carried out in chapter 5, it was observed that the
overall effect on the battery state by the test itself required further investigation. This
is explored by using a reduced test current, with comparative tests for the two
techniques at specific states of charge.

142
6.2 Selection of test parameters
In addition to examining the effects of reducing the test current to limit the
invasiveness of the test, alternative MLS lengths and clock frequencies for the PRBS
required investigation to explore the wider behaviour of the test battery. Finally, the
upper voltage threshold for the PRBS charge test required some attention, as the
selection of this level should not be arbitrary, and with control could potentially yield
useful state information.
6.2.1 PRBS bandwidth
During the investigation in chapter 5 it became apparent that a high bit order
PRBS sequence could not be used with a low frequency clock in these tests
without a prohibitively long test. In order to investigate a wider band of
frequencies a PRBS test was developed allowing a quantized bandwidth
approached to be used. This was implemented by running a 6 bit PRBS
sequence with a specific clock frequency, applying a step change to the
frequency and repeating the sequence. A number of frequency steps allowed
generation of a sequence which able to cover the required test bandwidth for
curve fitting, without introducing excessively long test times. The embedded
code also had dual clock range control by selection of the pre-scaler value of the
in-built timer. The clock frequency range spanned 0.5Hz to 1250Hz with eight
frequency steps, with a divide by eight option for lower frequency tests. The
embedded hardware comprised a Microchip Technology Explorer 16
development board (Figure 60), with a dsPIC 33FJ256GP10 microcontroller
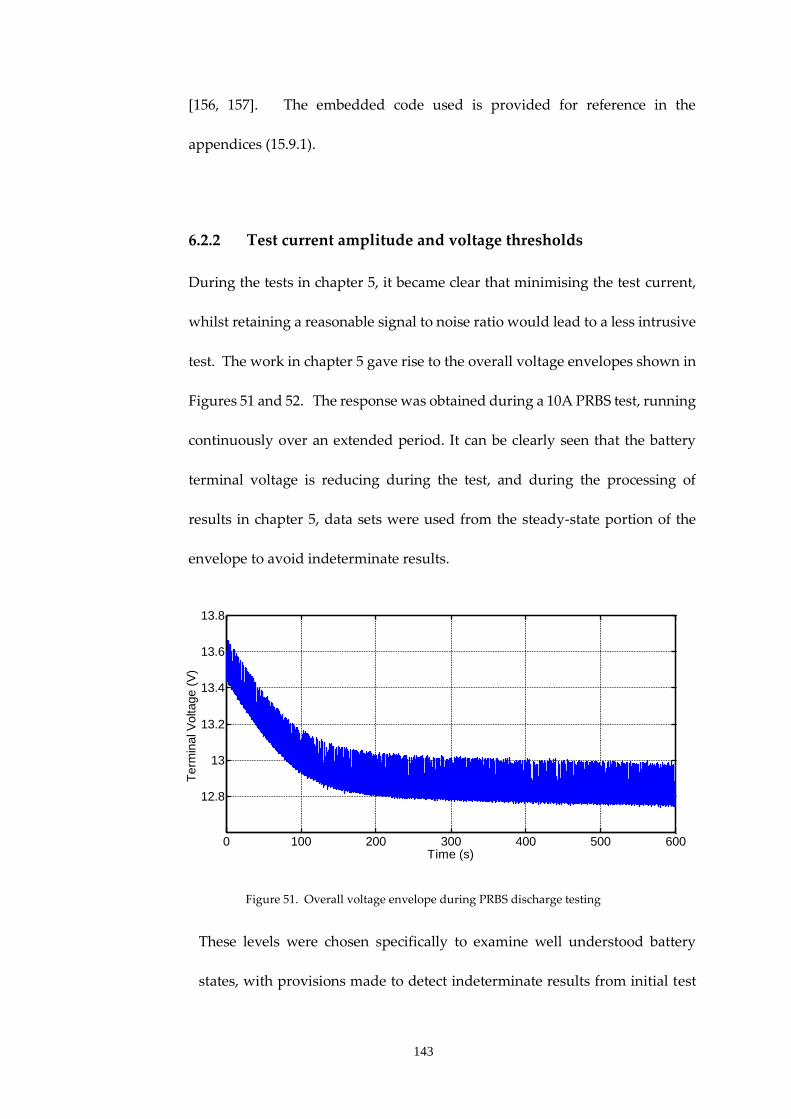
143
[156, 157]. The embedded code used is provided for reference in the
appendices (15.9.1).
6.2.2 Test current amplitude and voltage thresholds
During the tests in chapter 5, it became clear that minimising the test current,
whilst retaining a reasonable signal to noise ratio would lead to a less intrusive
test. The work in chapter 5 gave rise to the overall voltage envelopes shown in
Figures 51 and 52. The response was obtained during a 10A PRBS test, running
continuously over an extended period. It can be clearly seen that the battery
terminal voltage is reducing during the test, and during the processing of
results in chapter 5, data sets were used from the steady-state portion of the
envelope to avoid indeterminate results.
Figure 51. Overall voltage envelope during PRBS discharge testing
These levels were chosen specifically to examine well understood battery
states, with provisions made to detect indeterminate results from initial test
0 100 200 300 400 500 600
12.8
13
13.2
13.4
13.6
13.8
Time (s)
Term
inal V
oltage (
V)

144
data taken from the PRBS perturbation tests. As such the duration of tests
carried out at all States-of-Charge was again designed to allow examination
of several consecutive data sets in order to identify any such data.
Figure 52. Terminal voltage over first 100 seconds of test
The test at 85% SoC was chosen as a stable battery state and finally the 0% SoC
test was selected again as a known state with stable terminal voltage.
The discharge PRBS tests were also re-evaluated at the 85% SoC test condition
and with a reduction in current amplitude used in order to reduce effects of the
test, and a corresponding charge current used for the charge investigation.
The amplitude for the test current were therefore revised, and current
amplitudes close to the rated discharge current were chosen. In the case of the
Yuasa batteries used, this current was 0.05 cr (20 hour rate, 3.25A for the 65Ah
battery). A 4A test amplitude was therefore chosen for the work in this chapter.
As the experimental set up was based on a constant current charger, the upper
charge voltage limit for this system was very relevant to the battery under test.
0 10 20 30 40 50 60 70 80 90 100
12.8
13
13.2
13.4
13.6
13.8
Time (s)
Term
inal V
oltage (
V)

145
Charge voltages for the test battery from manufacturer’s data were taken into
consideration, as it was important that the battery should not be overcharged.
It was decided also that by using the manufacturer’s recommended voltage
levels further information could potentially be gleaned at near to 100% state of
charge. Table 11 shows the thresholds devised for the charge PRBS tests over
the range of temperatures likely to be encountered during the tests.
Table 11. Voltage thresholds for the PRBS charge stage used in the tests
Battery
temperature
(°C)
Voltage
threshold
(V)
20 13.65
21 13.632
22 13.614
23 13.596
24 13.578
25 13.56
It was important that temperature compensated voltages be used for the
voltage thresholds, if the results were going to be used to indicate battery state.
Additionally, the thresholds used in table 11 are based on float charge limits
suitable for batteries used in standby applications [17], as this was deemed
generally applicable for the batteries under test.
6.3 Battery model development
During the work carried out in chapter 5, the Randles’ model was used, and for the
work described in this chapter this model required modification to encompass both
the charge and discharge behaviour of the test battery.

146
As discussed in chapter 5, Ri from the Randles’ model (Figure 36, page 118) comprises
the resistance of the cell interconnections (Rint) and the electrolyte resistance (Re)
within the cell itself.
Rint
Re
Ri
Figure 53. Ri broken out into its component impedances
Figure 53 shows the series Rint and Re which are in real terms impossible to separate.
However, it is know that different processes occur within the battery during charge
and discharge, and this is shown in the work of Salameh et al [158] in developing
models for lead-acid batteries. As such the values for electrolyte resistance were
separated into parameters that describe charge and discharge processes (Figure 54).
Rint
Rec
Ri
Rint
Red
Ri
Charge Discharge
Figure 54. Ri broken out as separate models for charge and discharge
Therefore, during charge: inti ecR R R (30)
And discharge: inti edR R R (31)

147
This leads to a separate model being required for charge and discharge, so to
incorporate both of the circuit legs shown in Figure 54 into one model it is necessary
to observe the respective current flows during the charge and discharge processes.
This is achieved in a non-linear model by the addition of theoretical ideal diodes with
zero volt drop and recovery time as shown in Figure 55 [159].
Rint
Rec Red
DdischargeDcharge Ri
Figure 55. Combined model for Ri separating electrolyte resistance into charge and discharge
elements
The modified Randles’ model incorporating the electrolyte resistance for charge and
discharge is shown in Figure 56.
CSurfaceRt
CBulk
Ri
Rd
Rint
I
V
Dcharge
Rec Red
Ddischarge
Figure 56. Modified Randle's model incorporating active charge and discharge resistance elements

148
It was found during investigations into complementary energy stores, that the
addition of a parallel branch element to the Randles’ model could facilitate an
improved curve fit to VRLA batteries when tested using the PRBS technique. These
findings were presented at the 13th European Lead Battery Conference (Paris, 2012)
and were subsequently published in the Journal of Power Sources [160]. Examination
of other published work indicated that this parallel branch may be related to mass
transport effects, due to the reservoir of electrolyte at the electrode boundary [161],
supporting justification of the addition to the model of Rx and Cx (Figure 57). It was
intended that an investigation into electrochemical mechanisms associated with the
parallel branch would be a subject of further work, encompassing both VRLA and
flooded Lead-Acid batteries.
CSurfaceRt
CBulk
Rx
Rd
Rint
Cx
I
V
Dcharge
Rec Red
Ddischarge
Figure 57. Developed model

149
Transfer function analysis was carried out to allow curve fitting using MATLAB. The
series combination of electrolyte resistance and cell interconnections in Figure 56
reverts to Ri in the transfer function (as the components cannot be separated out).
This therefore retains a Randle’s model for the major branch of the circuit with a
parallel RC network (Figure 58):
CSurfaceRt
CBulk
Rx
Rd
Rint
Cx
I
V
Dcharge
Rec Red
Ddischarge Z1
Z2
Z3
Z4
Figure 58. Equivalent circuit broken into branches for analysis
Referring to Figure 58, the respective impedances of the branches leads to the
relationship in equation 32.
1 2 3 4( ) / /BattZ Z Z Z Z (32)
(Individual impedances, in complex form)
1 iZ R (33)

150
2
1
1 1( )
t Surface
Z
R XC
(34)
3
1
1 1( )
d Bulk
Z
R XC
(35)
2 2
4 x xZ R XC (36)
The derivations above were incorporated into a MATLAB routine which is included
in the appendices (curve_fit.m, 15.8.10) used in establishing the battery parameters
in section 7.5.1.1.
6.4 PRBS charge test investigation-experimental set up description
The experimental test system was devised as a module for the AM-1 battery test
system. Figure 59 shows an overall system block diagram for the complete hardware
used in this chapter.

151
Data acquisition
Battery Current
Battery under test
Battery Voltage
Signal 0V
Power 0V
Battery
Temp
erature sen
sor
VxI Oracle 200E Battery backed power supply
Power 0V
300W Electronic
load
DC power
supply
High speed constant current charger
Microcontroller development board (PRBS
signal)
High speed constant current load module
Digital timer
Power 0V
Timed loaddisconnect
charge
Power 0V
Power 0V
discharge
PRBS mode select
Figure 59. Overall test system block diagram

152
Figure 60. PRBS discharge system photograph
The system comprised a revised PRBS discharge system (Figure 60), to be used for
the comparative tests to the charge technique. The hardware consisted of a high
speed constant current load with integral current sensing.
The developed charge PRBS hardware (Figure 61) comprised a constant current
charge module, driven by an adjustable 500W power supply. Downstream of the
charge circuitry a switching FET was provided in order to apply PRBS charge to the
battery.
Both of the hardware modules were driven using a Microchip development board
programmed to provide a PRBS demand signal to the active current sink/source
modules. The hardware developed in this chapter would later be used to develop
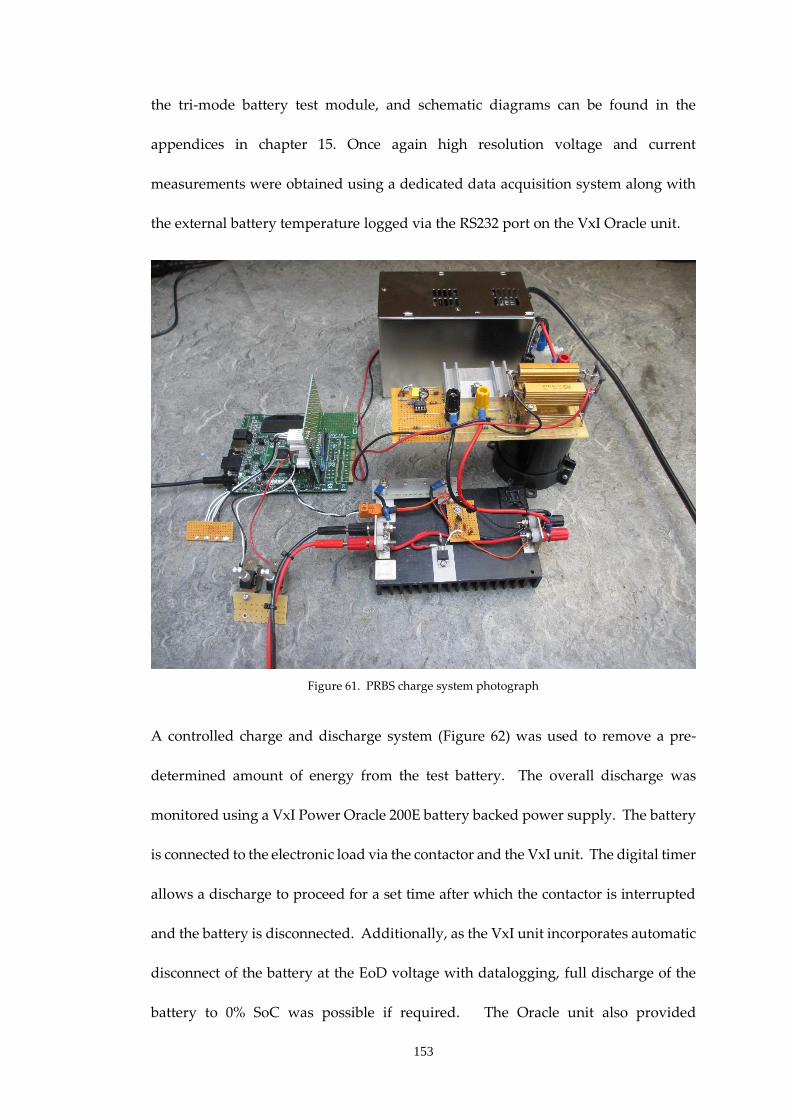
153
the tri-mode battery test module, and schematic diagrams can be found in the
appendices in chapter 15. Once again high resolution voltage and current
measurements were obtained using a dedicated data acquisition system along with
the external battery temperature logged via the RS232 port on the VxI Oracle unit.
Figure 61. PRBS charge system photograph
A controlled charge and discharge system (Figure 62) was used to remove a pre-
determined amount of energy from the test battery. The overall discharge was
monitored using a VxI Power Oracle 200E battery backed power supply. The battery
is connected to the electronic load via the contactor and the VxI unit. The digital timer
allows a discharge to proceed for a set time after which the contactor is interrupted
and the battery is disconnected. Additionally, as the VxI unit incorporates automatic
disconnect of the battery at the EoD voltage with datalogging, full discharge of the
battery to 0% SoC was possible if required. The Oracle unit also provided
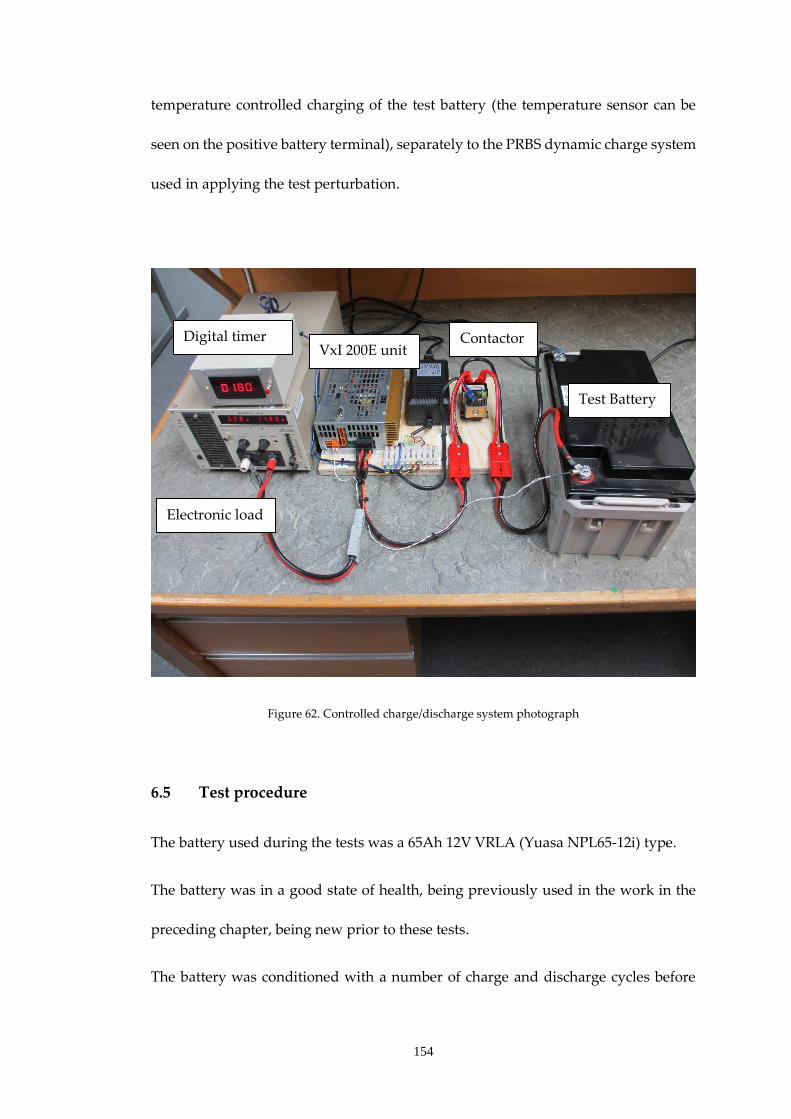
154
temperature controlled charging of the test battery (the temperature sensor can be
seen on the positive battery terminal), separately to the PRBS dynamic charge system
used in applying the test perturbation.
Figure 62. Controlled charge/discharge system photograph
6.5 Test procedure
The battery used during the tests was a 65Ah 12V VRLA (Yuasa NPL65-12i) type.
The battery was in a good state of health, being previously used in the work in the
preceding chapter, being new prior to these tests.
The battery was conditioned with a number of charge and discharge cycles before
Electronic load
Digital timer VxI 200E unit
Test Battery
Contactor

155
being charged to 100% SoC using the temperature controlled charger (VxI Oracle
200E unit).
PRBS tests (charge, and comparative discharge) were then carried out on the
batteries. Subsequent to this test the batteries were discharged at 5 amps for 2 hours
to remove around 15% of the rated capacity before carrying out the next test. The
third stage was to discharge the battery at a 20 hour discharge rate to the
manufactures specified End-of-Discharge (EoD) Voltage before carrying out the final
test. A summary of the tests is shown in the flowchart in Figure 63.
PRBS Discharge test
PRBS Charge test
Apply 5A constant current load for
2hrs
PRBS Discharge test
PRBS Charge test
Discharge at cr/20 to EoD voltage
PRBS Discharge test
PRBS Charge test
START
100% SoC 85% SoC 0% SoC
Charge battery to 100% SoC
END
Figure 63. Charge test procedure flowchart
6.6 Test results
Example current and voltage data are seen in Figures 64 and 65 at 85% SoC during
one of the dynamic charge (PRBS) tests.

156
Figure 64. Current waveform, 85% SoC, charge test
Figure 65. Voltage response, 85% SoC charge test
The impedance information obtained from the tests is shown in Figures 66 to 71.
Transfer function analysis of the adopted model (Figure 57) was employed to obtain
a curve fit for each of the results using curvefit.m in appendix 15.8.1. The curve fits
were obtained by inspection of the responses to obtain initial values for Ri (as the
response tends to Ri at high frequencies (towards 1kHz). An initial value for Rt is
obtained by inspection for the low frequency area of the response. These start
0 10 20 30 40 50 60 70-2
0
2
4
6
Time (s)
Ch
arg
e c
urr
en
t (A
)
0 10 20 30 40 50 60 7012.7
12.75
12.8
12.85
12.9
12.95
13
Time (s)
Term
inal
vo
ltag
e (
V)

157
parameters are then used with initial values for CBulk and Rd (using methods from
5.3.1 and 5.3.3) to iteratively establish the battery parameters.
Figure 66. 100% SoC, discharge mode PRBS
Figure 67. 100% SoC, charge mode PRBS
Figures 66 and 67 illustrate the comparative results at 100% SoC. As mentioned,
testing at this state of charge can lead to an indeterminate result, as the battery may
not be at a steady state terminal voltage. This has been addressed previously in
battery pulse testing by applying a preload to the battery [126], and in PRBS discharge
10-2
10-1
100
101
102
103
6
8
10
12
14
16
18
Frequency (Hz)
Imp
ed
an
ce (
mil
lio
hm
s)
PRBS test
Model simulation
10-2
10-1
100
101
102
103
0
50
100
150
200
250
300
Frequency (Hz)
Imp
ed
an
ce (
mil
lio
hm
s)
PRBS test
Model simulation
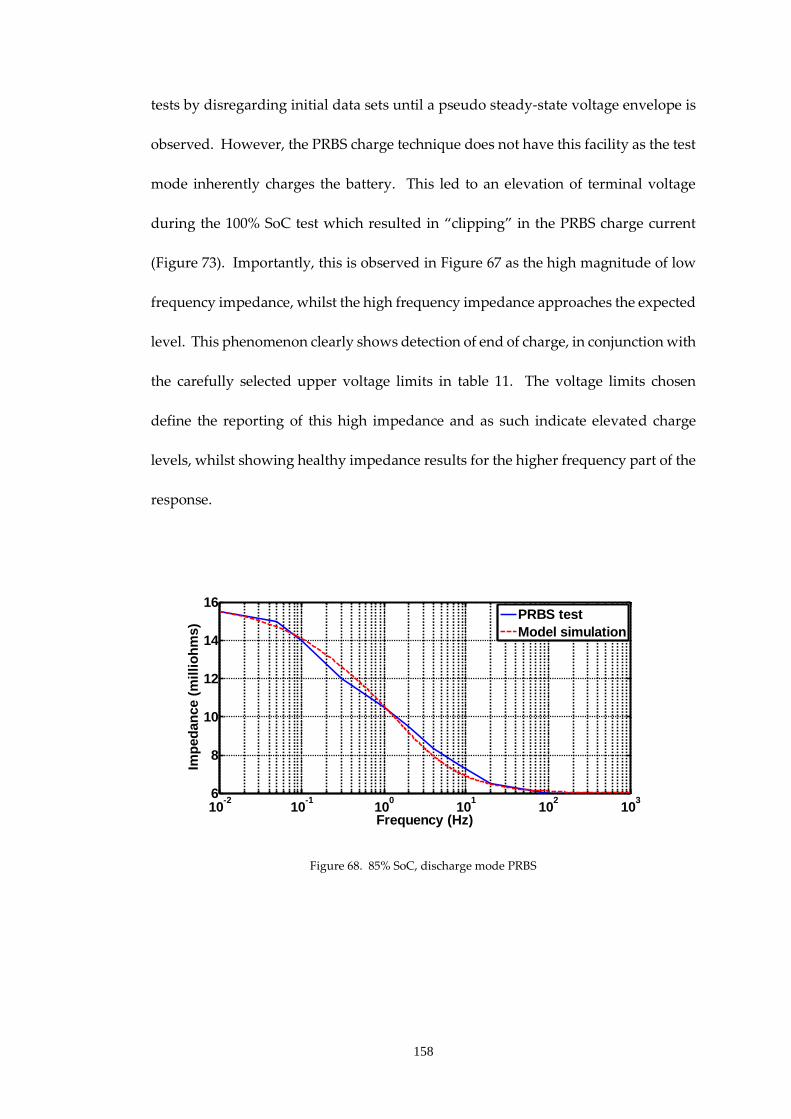
158
tests by disregarding initial data sets until a pseudo steady-state voltage envelope is
observed. However, the PRBS charge technique does not have this facility as the test
mode inherently charges the battery. This led to an elevation of terminal voltage
during the 100% SoC test which resulted in “clipping” in the PRBS charge current
(Figure 73). Importantly, this is observed in Figure 67 as the high magnitude of low
frequency impedance, whilst the high frequency impedance approaches the expected
level. This phenomenon clearly shows detection of end of charge, in conjunction with
the carefully selected upper voltage limits in table 11. The voltage limits chosen
define the reporting of this high impedance and as such indicate elevated charge
levels, whilst showing healthy impedance results for the higher frequency part of the
response.
Figure 68. 85% SoC, discharge mode PRBS
10-2
10-1
100
101
102
103
6
8
10
12
14
16
Frequency (Hz)
Imp
ed
an
ce (
mil
lio
hm
s)
PRBS test
Model simulation

159
Figure 69. 85% SoC, charge mode PRBS
Figures 68 and 69 show the test results at 85% SoC for both test modes. Both results
show similar results but the differences in the charge and discharge processes are
apparent in elements of the curve fitting.
Figure 70. 0% SoC, discharge mode PRBS
10-2
10-1
100
101
102
103
6
8
10
12
14
16
18
Frequency (Hz)
Imp
ed
an
ce (
mil
lio
hm
s)
PRBS test
Model simulation
10-2
10-1
100
101
102
103
20
25
30
35
Frequency (Hz)
Imp
ed
an
ce (
mil
lio
hm
s)
PRBS test
Model simulation

160
Figure 71. 0% SoC, charge mode PRBS
Figures 70 and 71 show the results for 0% SoC. The battery shows an elevation in
impedance across the test frequency range which shows two test modes which shows
both charge and discharge PRBS tests exhibit similar results but with some
differences for the two test methods over the frequency range, with the discharge
mode showing lower impedance over the frequency range. Figure 72 shows the
comparative impedance results for the PRBS discharge and charge tests.
Figure 72. Comparative impedance results, PRBS discharge and charge tests.
10-2
10-1
100
101
102
103
20
25
30
35
40
Frequency (Hz)
Imp
ed
an
ce (
mil
lio
hm
s)
PRBS test
Model simulation
10-2
10-1
100
101
102
103
0
50
100
150
200
250
300
Frequency (Hz)
Imp
ed
an
ce
(m
illi
oh
ms
)
100% SoC (Discharge test)
100% SoC (Charge test)
85% SoC (Discharge test)
85% SoC (Charge test)
0% SoC (Discharge test)
0% SoC (Charge test)

161
The analysis yielded the model parameters shown in table 12.
Table 12. Obtained model parameters
Battery
state and
test mode
Rint+Rec
(Ri)
Rint+Red
(Ri) Rt CSurface Cx Rx
100% SoC
(discharge) - 6mΩ 12mΩ 6F 34F 4mΩ
100% SoC
(charge) 6mΩ - 300mΩ 4F 2F 9mΩ
85% SoC
(discharge) - 6mΩ 9.5mΩ 16F 35F 9mΩ
85% SoC
(charge) 6mΩ - 10.75mΩ 20F 60F 9mΩ
0% SoC
(discharge) - 21mΩ 13.8mΩ 2.5F 16F 9mΩ
0% SoC
(charge) 22.5mΩ - 14.6mΩ 2.5F 22F 9mΩ
The results in the table show the differences between the charge and discharge
technique mainly related to the elements of CSurface. This demonstrates somewhat the
different reactions involved in the charge and discharge processes [16] and overall
observations on the validity of the charge technique are satisfied in that clear results
are observed for the various charge states as compared to the discharge technique
with trends that are recognisable for both methods.
6.7 Conclusion
The work within this chapter demonstrated the benefits of a charge based excitation
signal as a means for parameter estimation within batteries.
Specifically:

162
Able to identify a battery at 100% SoC by increased low frequency impedance
Gave comparable results to discharge mode PRBS at other states of charge
Potentially can be implemented in a battery charger as part of the charge
hardware
Does not consume energy during the test
The system was able to identify a battery at 100% SoC by showing a significant
increase in the overall magnitude of the impedance spectrum. This could further be
observed by examining the PRBS current waveform (Figure 73) which shows the
transition from current mode to voltage mode charge during the test.
Figure 73. Current waveform “clipping” 100% SoC, charge test
In spite of this observed increase in low frequency impedance, the higher frequency
impedance for the battery appears healthy, allowing both SoC and SoH to be
reported, provided the upper voltage threshold for the PRBS charge is carefully
selected with reference to manufacturer’s data for charge voltage, compensated for
ambient temperature [17]. Choice of voltage thresholds that are too high could lead
100 110 120 130 140 150-2
0
2
4
6
Time (s)
Ch
arg
e c
urr
en
t (A
)

163
to overcharge of the battery during the test, and impedance reporting which is
outside of the operational envelope of the battery.
This behaviour has potential for examination within further work, beyond pure
indication of 100% SoC, having potential applications in multi-stage charge profiles
as a facilitator for stage transition.

164
Chapter 7. Bipolar mode (Charge/Discharge) Pseudo Random Binary
Sequence battery testing
7.1 Introduction
The work carried out within this chapter builds on the investigations carried out in
chapters 5 and 6, developing a bipolar method of applying the PRBS perturbation to
the test battery.
In applying this test mode, it was anticipated that the observation of the battery state
would be less-intrusive than the techniques already explored, thus offering
advantages over the discharge and charge techniques.
Additionally, the specific motivation for the work extended to investigating the
applicability of the test at 100% SoC - an area that is open to indeterminate results
using the discharge test method, but was however shown to be a valuable state
indicator using the charge test technique.
Finally, since the bipolar signal should present a net-zero energy exchange from the
battery, there was interest in the actual effects of the test itself, as observed changes
in terminal voltage of the battery during the test could potentially be employed in
indicating battery efficiency.
7.2 Battery efficiency
The importance of battery efficiency can be overlooked in SoC and SoH evaluation
systems, or its effects placed outside of the scope of the predictive algorithms used.
During earlier chapters the behaviour of the battery during charge and discharge
conditions has been discussed, and it is well understood that a battery does not
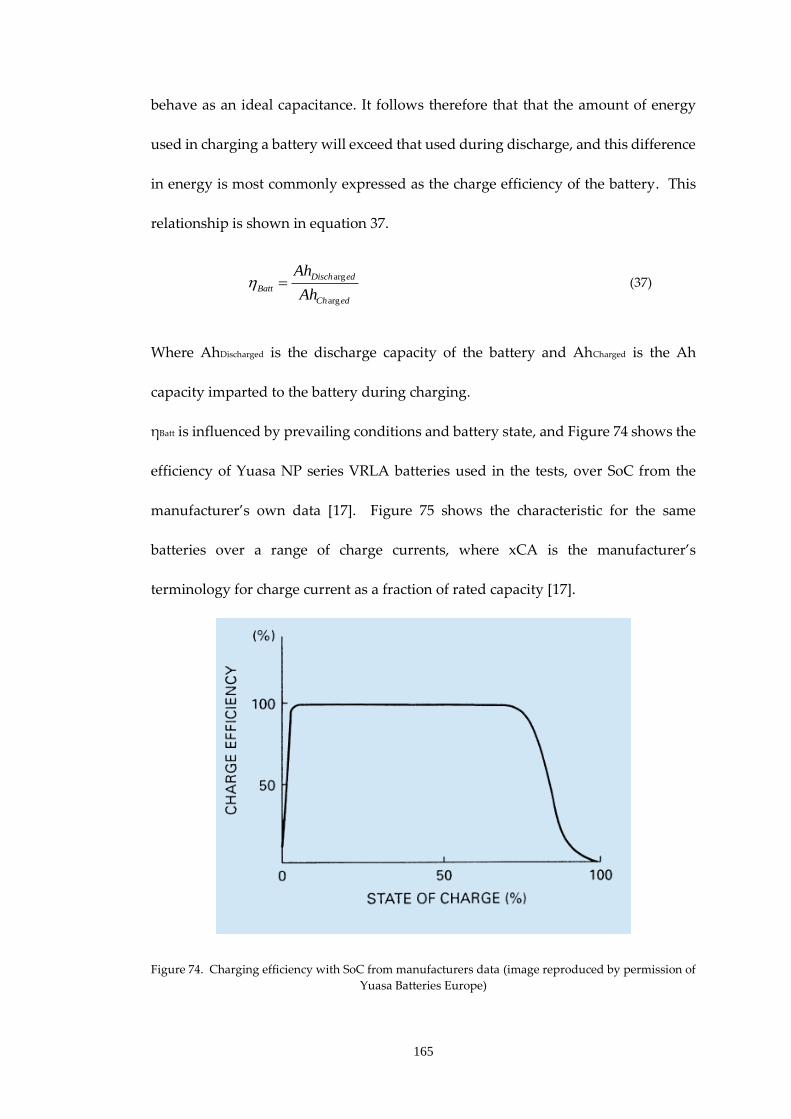
165
behave as an ideal capacitance. It follows therefore that that the amount of energy
used in charging a battery will exceed that used during discharge, and this difference
in energy is most commonly expressed as the charge efficiency of the battery. This
relationship is shown in equation 37.
arg
arg
Disch ed
Batt
Ch ed
Ah
Ah (37)
Where AhDischarged is the discharge capacity of the battery and AhCharged is the Ah
capacity imparted to the battery during charging.
ηBatt is influenced by prevailing conditions and battery state, and Figure 74 shows the
efficiency of Yuasa NP series VRLA batteries used in the tests, over SoC from the
manufacturer’s own data [17]. Figure 75 shows the characteristic for the same
batteries over a range of charge currents, where xCA is the manufacturer’s
terminology for charge current as a fraction of rated capacity [17].
Figure 74. Charging efficiency with SoC from manufacturers data (image reproduced by permission of
Yuasa Batteries Europe)

166
This behaviour has implications in optimised energy use, notably renewable energy,
EV/HEV and electric traction. Within photovoltaic systems Maximum Power Point
Tracking (MPPT) charge controllers have been developed, allowing the PV panels to
be used at the optimum operating point. This technology is only partially utilised if
the batteries within the system are operating at low efficiency, potentially at or near
to 100% SoC during periods of peak irradiation [162, 163]. Similarly, systems using
regenerative braking can also suffer the same inefficiencies.
Figure 75. Charging efficiency with charge current from manufacturer’s data (image reproduced by
permission of Yuasa Batteries Europe).
Battery efficiency also declines with declining SoH, so it therefore follows that battery
efficiency is a parameter of interest. As such it was decided to investigate this effect
by performing the tests over a longer duration and examine the mean terminal
voltage within the PRBS voltage envelope.
The findings from these experiments are presented in section 5 of this chapter.

167
7.3 Hardware modifications
The power stages developed in the previous discharge and charge PRBS tests were
combined using an amplitude offset drive circuit to the power stages in order to
generate a PRBS perturbation signal centred around zero current (Figure 76.) The
hardware was configured in order that switching between the 3 modes of test (charge,
discharge and bipolar) could be carried out easily, and via digital control from the
test system if required. This allowed consecutive tests for each of the three modes to
be carried out, in order that direct comparisons could be made between the results.
The controlled discharge apparatus, was as introduced in section 6.4, comprising the
VxI charger, Kikusui 300W load and the digital timer controlling the timed battery
disconnection.
A photograph of the bipolar PRBS test apparatus is shown in Figure 77. The
completed hardware forms the basis of the tri-mode PRBS test apparatus and is
discussed in detail in chapter 15.

168
Data acquisition
(IoTech)
Battery Current
Battery under test
Battery Voltage
Signal 0V
Power 0V
Battery
Temp
erature sen
sor
VxI Oracle 200E Battery backed power supply
Power 0V
Kikusui PLZ300 300W
Electronic load
DC power supply
High speed constant current charger
Microcontroller development board (PRBS
signal)
High speed constant current load module
Digital timer
Power 0V
Timed loaddisconnect
charge
Power 0V
Power 0V
discharge
PRBS mode select
IBatt
Complimentary drive control
and logic
Integrated tri-mode PRBS test system
DischargeChargeBipolar
Figure 76. Bipolar PRBS test system block diagram

169
Figure 77. Bipolar PRBS test system photograph
7.4 Test procedure
The battery used during the tests was a 65Ah 12V Valve Regulated Lead Acid (VRLA)
(Yuasa NP65-12i) type, which was used for the previous investigations using the
charge and discharge tests.
The battery was conditioned with five charge and discharge cycles before being
charged to 100% SoC using the temperature compensated Lead-Acid charger within
the test controlled charge/discharge apparatus used in the previous chapter (Figure
60).
To allow direct comparisons with the previous experiments, the tests were again
carried out at 100%, 85% and 0% SoC. The flowchart shown in Figure 78 outlines the
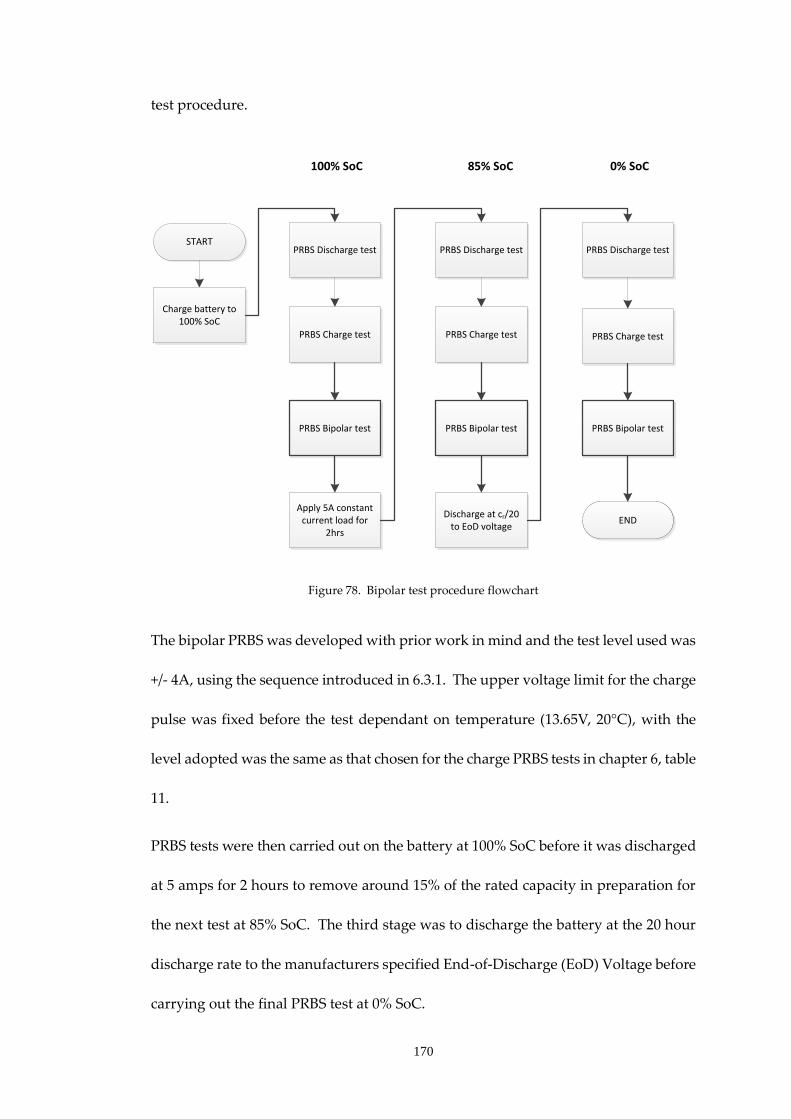
170
test procedure.
PRBS Discharge test
PRBS Charge test
Apply 5A constant current load for
2hrs
PRBS Discharge test
PRBS Charge test
Discharge at cr/20 to EoD voltage
PRBS Discharge test
PRBS Charge test
START
100% SoC 85% SoC 0% SoC
Charge battery to 100% SoC
END
PRBS Bipolar test PRBS Bipolar test PRBS Bipolar test
Figure 78. Bipolar test procedure flowchart
The bipolar PRBS was developed with prior work in mind and the test level used was
+/- 4A, using the sequence introduced in 6.3.1. The upper voltage limit for the charge
pulse was fixed before the test dependant on temperature (13.65V, 20°C), with the
level adopted was the same as that chosen for the charge PRBS tests in chapter 6, table
11.
PRBS tests were then carried out on the battery at 100% SoC before it was discharged
at 5 amps for 2 hours to remove around 15% of the rated capacity in preparation for
the next test at 85% SoC. The third stage was to discharge the battery at the 20 hour
discharge rate to the manufacturers specified End-of-Discharge (EoD) Voltage before
carrying out the final PRBS test at 0% SoC.

171
7.5 Test results
Example current and voltage waveforms are seen in Figures 79 and 80 for the test at
85% SoC.
Figure 79. Bipolar PRBS test current waveform, 85% SoC.
The test voltage response shown in Figure 80 illustrates the difference between the
Bipolar PRBS and the Charge and Discharge PRBS tests. The voltage envelope shows
a much reduced net change to the average level, especially for the higher frequency
Figure 80. PRBS test voltage response, 85% SoC
0 10 20 30 40 50 60 70-5
-4
-3
-2
-1
0
1
2
3
4
5
Time (s)
PR
BS
cu
rren
t (A
)
0 10 20 30 40 50 60 7012.5
12.55
12.6
12.65
12.7
12.75
Time (s)
Batt
ery
Vo
ltag
e (
V)

172
PRBS content. Due to this reduced effect on battery state it becomes possible to carry
out PRBS tests with a lower clock frequency or higher bit order, without significantly
affecting the battery SoC during the observations. It was therefore considered that
any observed changes in the average terminal voltage of the battery during the PRBS
test could be an indicator of battery efficiency at the prevailing States-of-Charge.
7.5.1 Impedance results
The voltage and current data was processed using MATLAB (evalprbs.m,
appendix 15.8.5) leading to the impedance information shown in Figures 81 to
83. Transfer function analysis of the adopted model as (Figure 57, page 148) as
carried out in chapter 6 was employed to obtain a curve fit for each of the results
using curvefit.m (15.8.10) as previously described in chapter 6. This analysis
yielded the model parameters shown in table 13.
Figure 81 shows the impedance results at 100% SoC. Using the bipolar PRBS it
was possible to carry out a test at this state, where previously the discharge
mode PRBS could show indeterminate data, if the initial data sets were not
carefully selected by inspection of the overall test envelope. The test shows an
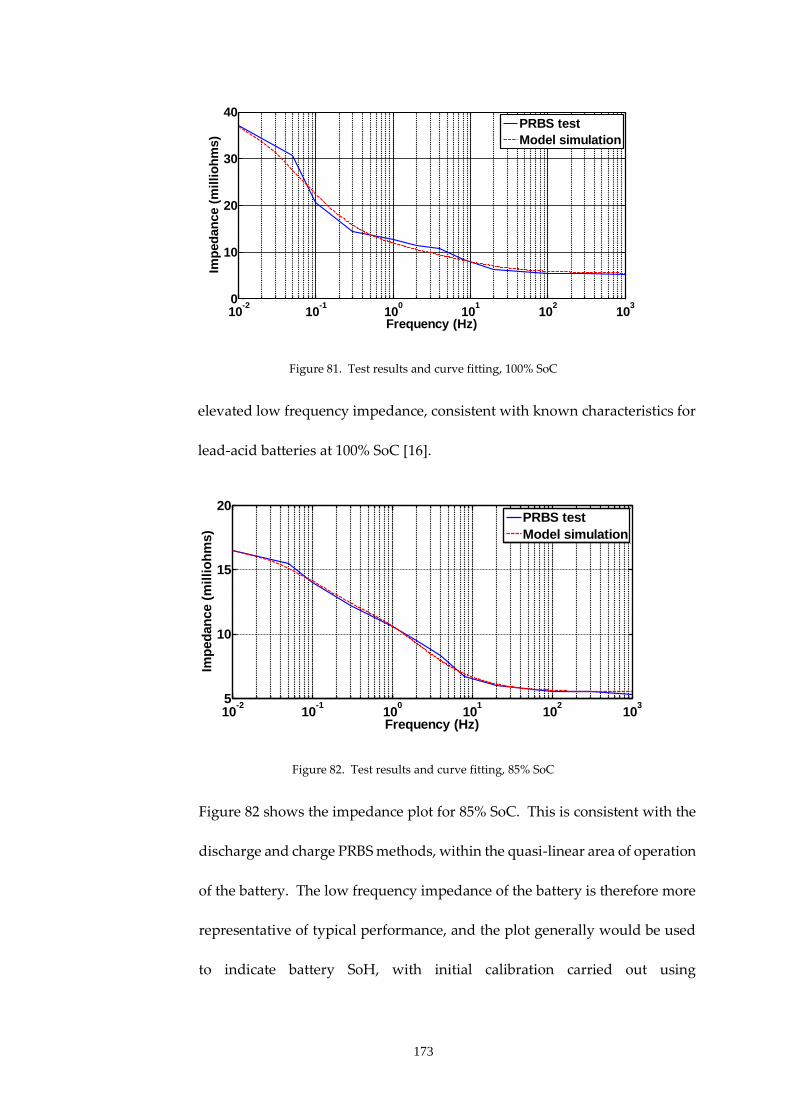
173
Figure 81. Test results and curve fitting, 100% SoC
elevated low frequency impedance, consistent with known characteristics for
lead-acid batteries at 100% SoC [16].
Figure 82. Test results and curve fitting, 85% SoC
Figure 82 shows the impedance plot for 85% SoC. This is consistent with the
discharge and charge PRBS methods, within the quasi-linear area of operation
of the battery. The low frequency impedance of the battery is therefore more
representative of typical performance, and the plot generally would be used
to indicate battery SoH, with initial calibration carried out using
10-2
10-1
100
101
102
103
0
10
20
30
40
Frequency (Hz)
Imp
ed
an
ce (
mil
lio
hm
s)
PRBS test
Model simulation
10-2
10-1
100
101
102
103
5
10
15
20
Frequency (Hz)
Imp
ed
an
ce (
mil
lio
hm
s)
PRBS test
Model simulation

174
manufacturer’s data if available or profiling of new batteries. A thorough
treatment is given to battery parameters over lifetime in chapter 11.
Figure 83. Test results and curve fitting, 0% SoC
Figure 83 shows the impedance plot for the test at 0% SoC. The battery in this
state shows an elevation in impedance across the test frequency range. This
gives a distinct indication of a discharged battery and can be compared to the
100% SoC results (Figure 81) which show similarly the increased LF
impedance, but preserve the healthy HF result.
7.5.1.1 Battery parameters
Table 13 shows the parameters obtained during the curve fitting using the
bipolar tests, with the corresponding discharge and charge test parameters.
Rint, Rec and Red are combined parameters for the bipolar tests as no distinction
can be made between the individual components, and are therefore compared
to Rint+Rec for the charge mode tests and Rint+Red for the discharge mode tests.
10-2
10-1
100
101
102
103
10
15
20
25
30
35
Frequency (Hz)
Imp
ed
an
ce (
mil
lio
hm
s)
PRBS test
Model simulation
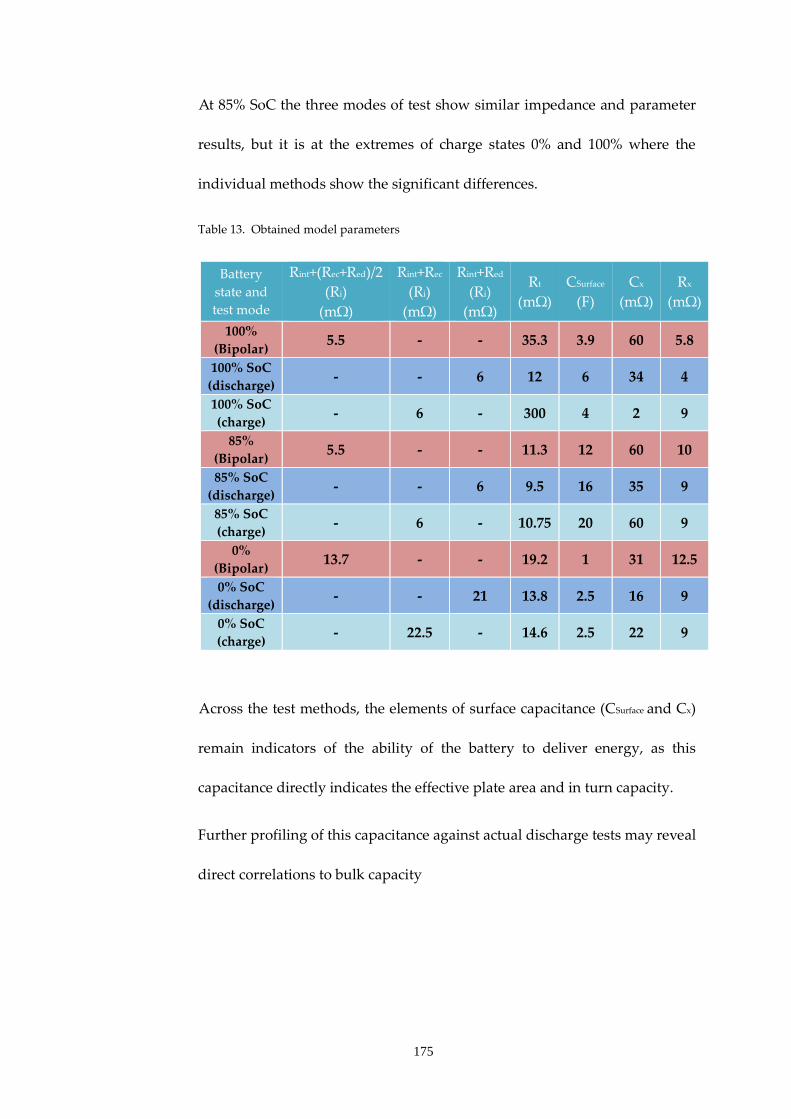
175
At 85% SoC the three modes of test show similar impedance and parameter
results, but it is at the extremes of charge states 0% and 100% where the
individual methods show the significant differences.
Table 13. Obtained model parameters
Battery
state and
test mode
Rint+(Rec+Red)/2
(Ri)
(mΩ)
Rint+Rec
(Ri)
(mΩ)
Rint+Red
(Ri)
(mΩ)
Rt
(mΩ)
CSurface
(F)
Cx
(mΩ)
Rx
(mΩ)
100%
(Bipolar) 5.5 - - 35.3 3.9 60 5.8
100% SoC
(discharge) - - 6 12 6 34 4
100% SoC
(charge) - 6 - 300 4 2 9
85%
(Bipolar) 5.5 - - 11.3 12 60 10
85% SoC
(discharge) - - 6 9.5 16 35 9
85% SoC
(charge) - 6 - 10.75 20 60 9
0%
(Bipolar) 13.7 - - 19.2 1 31 12.5
0% SoC
(discharge) - - 21 13.8 2.5 16 9
0% SoC
(charge) - 22.5 - 14.6 2.5 22 9
Across the test methods, the elements of surface capacitance (CSurface and Cx)
remain indicators of the ability of the battery to deliver energy, as this
capacitance directly indicates the effective plate area and in turn capacity.
Further profiling of this capacitance against actual discharge tests may reveal
direct correlations to bulk capacity

176
7.5.2 Battery efficiency results
Examining the voltage envelopes using low frequency PRBS tests revealed a
net change in terminal voltage that could be attributed to battery efficiency. As
discussed in chapter 4, using battery terminal voltage as a state indicator can
only be used in controlled conditions, and the bipolar PRBS facilitated this in
that the alternating current applied to the battery served to remove the
electrode overpotential [164], and move the battery into a pseudo steady-state
terminal voltage.
The mean DC terminal gradients observed for each state (Table 14) are
normalised representations of the battery efficiency, which can be compared to
manufacturer’s data in Figure 74. The manufacturer’s graph is deliberately
vague, and in the literature battery efficiency has not been extensively
researched, however, the correlations between the battery data and the PRBS
tests do show interesting results.
Table 14. Mean DC voltage gradient during PRBS tests (20°C)
State of Charge Overall change in mean terminal
voltage over test duration (mV)
Mean DC Voltage
gradient (mV/minute)
0% 148.6 6.85
85% 11.1 0.51
100% 439.5 20.28
Examining the gradient at 100% SoC this is clearly the area of the tests where
the battery charge efficiency is the lowest. This ties in with the Yuasa data

177
indicating a sharp fall in efficiency at 100% SoC. At 85% SoC (Figure 84) the
gradient of the average voltage has reduced dramatically indicating the
battery has moved into a more efficient area. The almost flat DC terminal
voltage at this point of high efficiency for the battery verifies the net-zero
energy exchange of the Bipolar PRBS, at this state, under these conditions.
Figure 84. Voltage envelope, 85% SoC
The gradient at 0% SoC (Table 14) clearly indicates a reduction in efficiency in
line with manufacturers data (Figure 74) falling off dramatically below 4-5%
SoC.
7.5.3 Mean DC terminal voltage as a SoC indicator
The data from the efficiency analysis was used to examine the possibility of
using the mean DC terminal voltage to inform SoC prediction. Figure 85 shows
the manufacturers data for SoC in relation to terminal voltage [17].
0 200 400 600 800 1000 1200 140012.5
12.6
12.7
12.8
12.9
13
Time (s)
Term
inal V
olt
ag
e (
V)
V1=12.7315V V2=12.7199V
PRBS voltage
mean terminal voltage

178
Figure 85. SoC in relation to terminal voltage from manufacturer’s data (image courtesy
Yuasa Batteries Europe).
The relationship assumes prior control over battery state, in that the battery
would have been allowed to reach a steady-state terminal voltage over some
hours. It therefore does not immediately follow that the test procedure
carried out during this chapter should produce terminal voltage based state
information, as at each of the three state-of-charge values chosen the PRBS test
was carried out directly after the prior test step (charge for the 100% test, and
controlled discharges for the 85% and 0% states of charge.) The observations
in Figure 86 however show interesting correlations at these charge states.

179
Figure 86. Mean DC terminal voltage clusters obtained during the bipolar PRBS tests plotted
against battery data for SoC with terminal voltage (20°C).
Unsurprisingly the battery terminal voltage at 100% SoC is elevated, but the
application of the bipolar PRBS arrests this overvoltage and it then remains in
the ranges for that state. The 85% and 0% results show mean DC voltage
levels which are reflective of the manufacturer’s data, albeit over a wide band
with the limited results obtained in this chapter.
7.6 Conclusion
The effect of applying a bipolar PRBS perturbation signal with an average value of
zero was observed to have several characteristic benefits. Examining the overall
voltage envelope for the battery during the test showed the average DC terminal
voltage is much less affected than by using the discharge and charge PRBS
techniques. The test is designed to have a net energy exchange between the test
system and the battery of zero, with the only losses being efficiency of the battery
during the charge and discharge pulses of the PRBS. It followed, therefore, that the
0 10 20 30 40 50 60 70 80 90 10011
11.5
12
12.5
13
13.5
Battery capacity (%)
Term
inal V
olt
ag
e (
V)
Upper limit, SoC from O/C terminal voltage, battery data
Lower limit, SoC from O/C terminal voltage, battery data
0% SoC mean term voltage from PRBS test
85% SoC mean term voltage from PRBS test
100% SoC mean term voltage from PRBS test

180
excitation signal facilitates long duration tests which can be used on line, which may
lead to a broader understanding of the battery parameters at lower frequencies. The
test system did consume energy, so its use would be most suitable to battery test
instruments rather than on board tests in portable equipment, however this could be
mitigated somewhat by storing the discharged energy and reusing it. The bipolar
system was applicable at 100% SoC, and showed repeatable results at this state, with
a characteristic, elevated low frequency impedance at the fully charged state.
Similarly this elevated low frequency impedance was seen at 0% SoC, but an increase
in the high frequency impedance was also present, allowing identification of the
respective states.
Further analysing the overall voltage envelope of the PRBS, the average DC level of
the PRBS voltage was used to make approximations to battery efficiency at the
selected test states-of-charge, by using the gradient of this DC level as an indicator.
The intention was that this gradient could be used to report battery charge efficiency
and could, historically inform SoH of the batteries over time. This indicator is
revisited in chapter 11 in testing a battery to accelerated failure.
The mean DC voltage was observed to tie in with the manufacturer’s data for SoC,
for the tests carried out. This was interesting as the battery had been subject to either
charge or discharge before these measurements were made, suggesting that
application of the bipolar signal assists the battery in moving towards a steady-state
terminal voltage.
This data therefore has potential for being useful in informing a combined mode SoC
evaluation system and is explored further in the work within the following chapters.

181
Chapter 8. Variations in battery parameters with state of charge
8.1 Introduction
It is known that over a charge and discharge cycle a battery will undergo changes in
the rate at which energy is exchanged [16], and this can be characterised by examining
the battery parameters using an appropriate model. The most easily observed areas
for these parameters are at low and high states-of-charge (SoC), where the battery has
characteristic behaviours which are reflective of these states. This is of use, but the
SoC at other times represents the predominate areas of interest in most applications
– a fuel gauge which only indicates full or empty has limitations.
The motivation for this work was to build on the findings of chapter 7 and investigate
the applicability of the PRBS technique in indicating state of charge over a full range
of charge states. The work encompasses early investigations during the body of this
research investigating battery parameters over SoC using a discharge based
PRBS[165], and was expanded to encompass the later work using the bipolar PRBS
method, which had demonstrated applicability over the full range of SoC, with the
additional ability to report mean terminal voltage of the battery during the test itself.
The mean terminal voltage is further examined to establish if these measurements
can be used as an indicator in informing the SoC evaluation process.
8.2 Correlations between SoC and processes within the battery
The SoC of battery or cell can be equated to the voltage across the bulk capacitance,
but this voltage is not always directly accessible, or completely reflective of the

182
battery state. The effective capacity of the battery is also subject to the dynamic
behaviour of the processes controlling transport within the battery, leading to the
need for analysis of other equivalent circuit components within the battery model.
The ability of the battery to accept charge and deliver current can be related to the
CSurface and Rt from the standard Randles’ model [16], and the effective value of these
components, and others, can change over a discharge cycle at constant temperature.
Understanding these changes can therefore facilitate SoC indications if the prevailing
conditions are well understood.
8.3 PRBS test procedure
Tests were designed to allow the parameters for the batteries (Yuasa NPL65-12i) to
be obtained after periodic discharge steps. The battery was initially charged to 100%
SoC using the temperature compensated charger within the test equipment, and the
PRBS perturbation was then applied before a timed discharge to the next test step.
The flowchart in Figure 87 shows the test procedure.
The test equipment used comprised the discharge mode apparatus developed in
chapter 5 for the early work, and the combined mode bipolar test apparatus described
in chapter 7 for the later tests, which is detailed in the appendices.
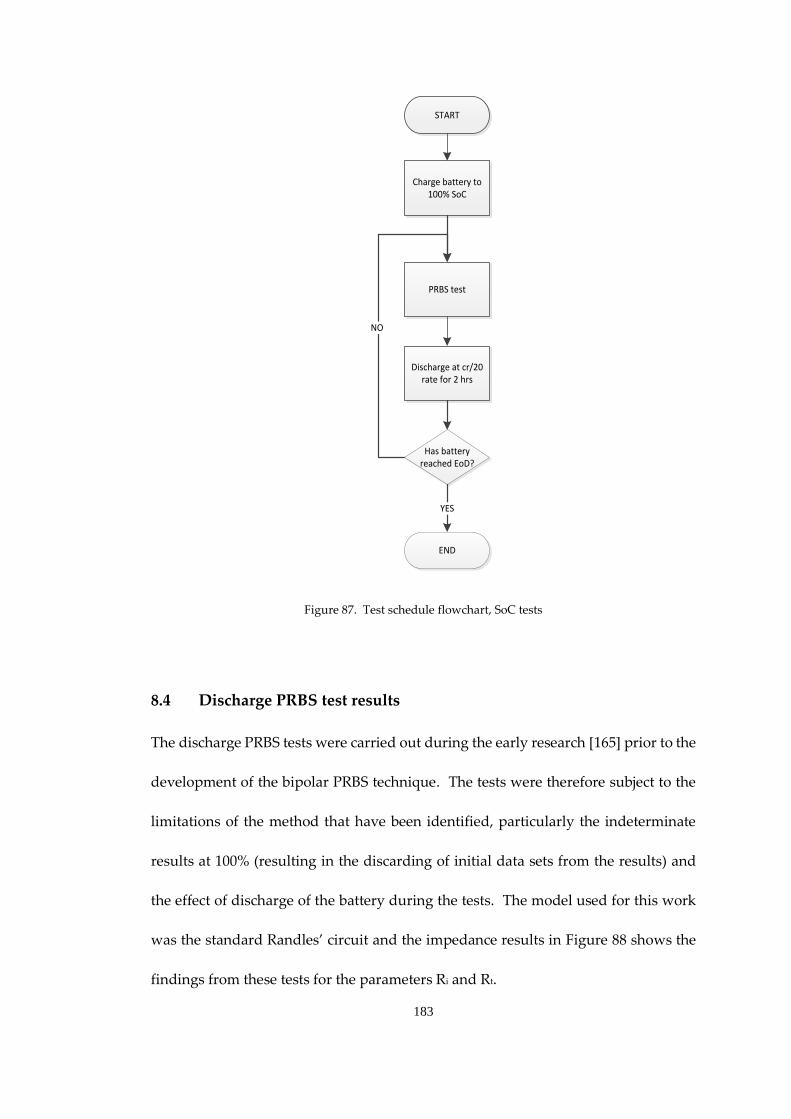
183
PRBS test
Discharge at cr/20 rate for 2 hrs
START
Charge battery to 100% SoC
END
Has battery reached EoD?
YES
NO
Figure 87. Test schedule flowchart, SoC tests
8.4 Discharge PRBS test results
The discharge PRBS tests were carried out during the early research [165] prior to the
development of the bipolar PRBS technique. The tests were therefore subject to the
limitations of the method that have been identified, particularly the indeterminate
results at 100% (resulting in the discarding of initial data sets from the results) and
the effect of discharge of the battery during the tests. The model used for this work
was the standard Randles’ circuit and the impedance results in Figure 88 shows the
findings from these tests for the parameters Ri and Rt.
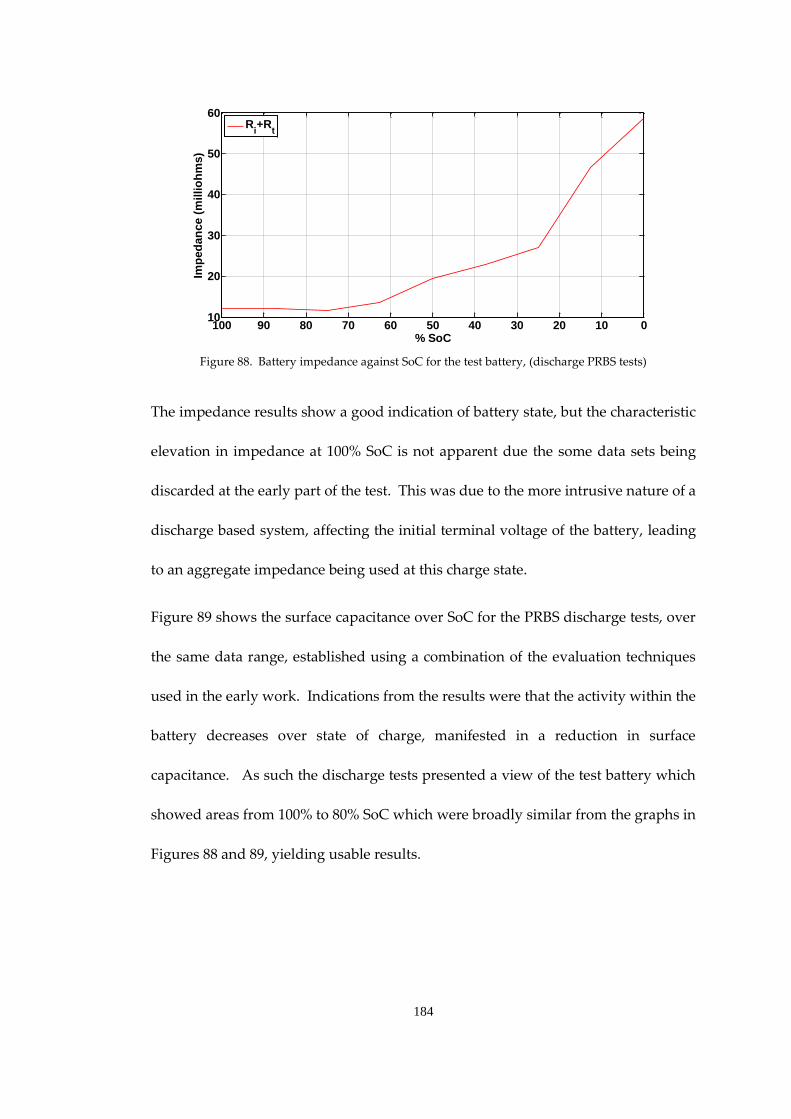
184
Figure 88. Battery impedance against SoC for the test battery, (discharge PRBS tests)
The impedance results show a good indication of battery state, but the characteristic
elevation in impedance at 100% SoC is not apparent due the some data sets being
discarded at the early part of the test. This was due to the more intrusive nature of a
discharge based system, affecting the initial terminal voltage of the battery, leading
to an aggregate impedance being used at this charge state.
Figure 89 shows the surface capacitance over SoC for the PRBS discharge tests, over
the same data range, established using a combination of the evaluation techniques
used in the early work. Indications from the results were that the activity within the
battery decreases over state of charge, manifested in a reduction in surface
capacitance. As such the discharge tests presented a view of the test battery which
showed areas from 100% to 80% SoC which were broadly similar from the graphs in
Figures 88 and 89, yielding usable results.
010203040506070809010010
20
30
40
50
60
% SoC
Imp
ed
an
ce (
millio
hm
s)
R
i+R
t

185
Figure 89. Surface capacitance over SoC (CSurface normalised=14F)
However the knowledge gained later in the research led to revisiting the tests with
the bipolar PRBS, as it was imagined that more detailed results could be obtained
using these techniques.
8.5 Bipolar PRBS test results
Subsequent to the work carried in chapter 7, the tests were repeated using the bipolar
method, using the 6 bit PRBS with the frequency step as introduced in chapter 6. The
impedance analysis was carried out using multiprbs.m (appendices, 15.8.8) which
was devised to process the frequency step PRBS automatically, calling evalprbs2.m
to calculate the impedance of the PRBS test. The battery model was also revisited
from Figure 54, section 6.2 with modifications for clarity in its application, with
consideration to known battery characteristics [161, 164].
01020304050607080901000.004
0.25
0.5
0.75
1
% SoC
No
rmalised
CS
urf
ac
e
C
Surface
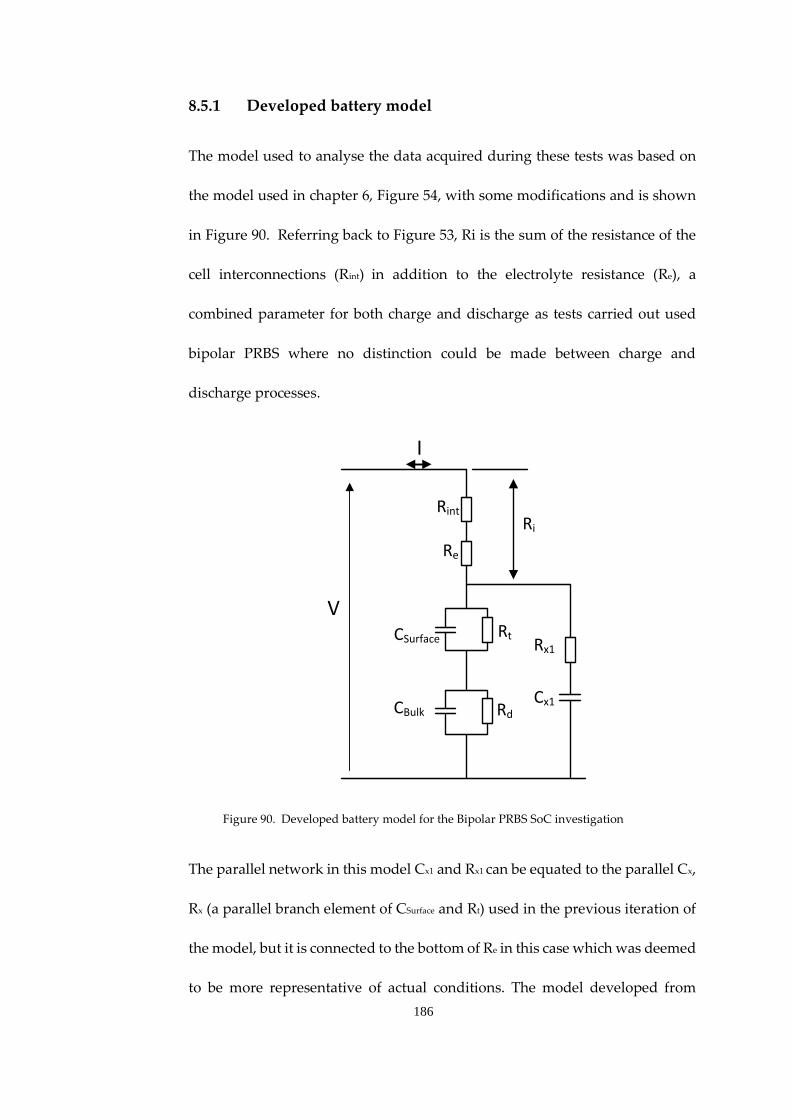
186
8.5.1 Developed battery model
The model used to analyse the data acquired during these tests was based on
the model used in chapter 6, Figure 54, with some modifications and is shown
in Figure 90. Referring back to Figure 53, Ri is the sum of the resistance of the
cell interconnections (Rint) in addition to the electrolyte resistance (Re), a
combined parameter for both charge and discharge as tests carried out used
bipolar PRBS where no distinction could be made between charge and
discharge processes.
CSurface Rt
CBulk
Rx1
Rd
Rint
Cx1
I
V
Re
Ri
Figure 90. Developed battery model for the Bipolar PRBS SoC investigation
The parallel network in this model Cx1 and Rx1 can be equated to the parallel Cx,
Rx (a parallel branch element of CSurface and Rt) used in the previous iteration of
the model, but it is connected to the bottom of Re in this case which was deemed
to be more representative of actual conditions. The model developed from

187
previous investigations [160], and with consideration to work of Armenta-Deu
[164] and Jossen [161] whose work in dynamic battery behaviour and the
transition from charge to discharge informed the positioning of Ri outside of
the parallel circuit branch. The impedances of a battery or cell which contribute
to the overall impedance are split into three main groups, those related to the
structure and electrodes (Rint), electrolyte resistance (Re) and impedance due to
reactions at the electrode double layer [16, 161, 164]. It made sense therefore at
this fairly mature stage of the model development to place these parameters
accordingly in the equivalent circuit. As such Re and Rint were placed outside
of the parallel branch with all of the parameters associated with CSurface in the
lower circuit branch. CBulk is very low impedance at the perturbation
frequencies used (0.5 to 1250Hz), therefore Rx1 and Cx1 sit effectively in parallel
with CSurface providing the improved curve fit.
Impedance analysis of the circuit branches was carried out to allow
incorporation into the MATLAB routine curvefit.m within the appendices
(15.8.10) for later analysis of the PRBS impedance results. The analysis is shown
below in equations 38 to 43.

188
CSurface Rt
CBulk
Rx1
Rd
Rint
Cx1
I
V
Re
Z1
Z2
Z3
Z4
Figure 91. Equivalent circuit broken into branches for analysis
inti eR R R (38)
1 2 3 4( ) / /BattZ Z Z Z Z (39)
1 iZ R (40)
2
1
1 1( )
t Surface
Z
R XC
(41)
3
1
1 1( )
d Bulk
Z
R XC
(42)
2 2
4 1 1x xZ R XC (43)
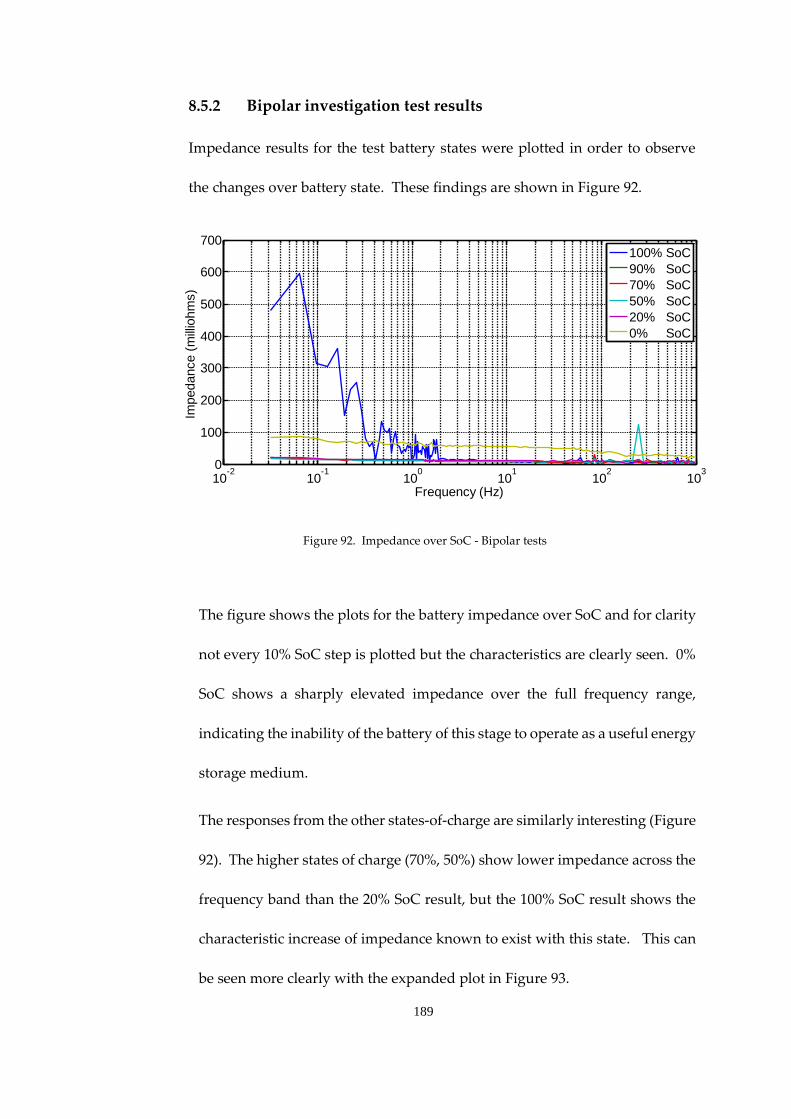
189
8.5.2 Bipolar investigation test results
Impedance results for the test battery states were plotted in order to observe
the changes over battery state. These findings are shown in Figure 92.
Figure 92. Impedance over SoC - Bipolar tests
The figure shows the plots for the battery impedance over SoC and for clarity
not every 10% SoC step is plotted but the characteristics are clearly seen. 0%
SoC shows a sharply elevated impedance over the full frequency range,
indicating the inability of the battery of this stage to operate as a useful energy
storage medium.
The responses from the other states-of-charge are similarly interesting (Figure
92). The higher states of charge (70%, 50%) show lower impedance across the
frequency band than the 20% SoC result, but the 100% SoC result shows the
characteristic increase of impedance known to exist with this state. This can
be seen more clearly with the expanded plot in Figure 93.
10-2
10-1
100
101
102
103
0
100
200
300
400
500
600
700
Frequency (Hz)
Impedance (
mill
iohm
s)
100% SoC
90% SoC
70% SoC
50% SoC
20% SoC
0% SoC

190
Figure 93. Impedance over SoC - Bipolar tests, expanded to show more detail (0 -
90% SoC)
From the responses seen in Figure 93, it can be seen that the impedance/SoC
relationship has a crossover point around 50% SoC, which corresponds to the
quasi-linear area of discharge for a VRLA battery at a 20 hour rate (Figure 26,
page 97). Since increased impedance is seen at both high and low states of
charge the PRBS alone is not sufficient to fully characterise SoC and so some
further tests would need to be applied to inform a SoC evaluation system to
allow blind tests of batteries.
10-2
10-1
100
101
102
103
0
10
20
30
40
50
60
70
80
90
Frequency (Hz)
Impedance (
mill
iohm
s)
90% SoC
70% SoC
50% SoC
20% SoC
0% SoC
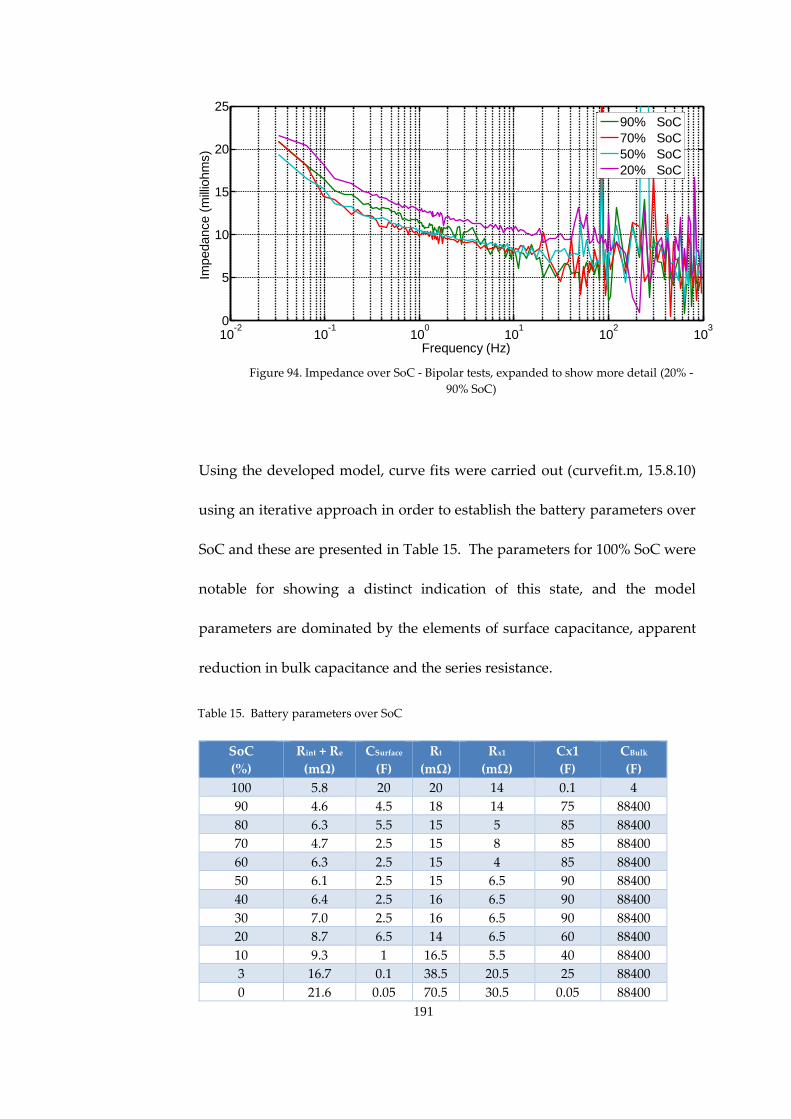
191
Figure 94. Impedance over SoC - Bipolar tests, expanded to show more detail (20% -
90% SoC)
Using the developed model, curve fits were carried out (curvefit.m, 15.8.10)
using an iterative approach in order to establish the battery parameters over
SoC and these are presented in Table 15. The parameters for 100% SoC were
notable for showing a distinct indication of this state, and the model
parameters are dominated by the elements of surface capacitance, apparent
reduction in bulk capacitance and the series resistance.
Table 15. Battery parameters over SoC
10-2
10-1
100
101
102
103
0
5
10
15
20
25
Frequency (Hz)
Impedance (
mill
iohm
s)
90% SoC
70% SoC
50% SoC
20% SoC
SoC
(%)
Rint + Re
(mΩ)
CSurface
(F)
Rt
(mΩ)
Rx1
(mΩ)
Cx1
(F)
CBulk
(F)
100 5.8 20 20 14 0.1 4
90 4.6 4.5 18 14 75 88400
80 6.3 5.5 15 5 85 88400
70 4.7 2.5 15 8 85 88400
60 6.3 2.5 15 4 85 88400
50 6.1 2.5 15 6.5 90 88400
40 6.4 2.5 16 6.5 90 88400
30 7.0 2.5 16 6.5 90 88400
20 8.7 6.5 14 6.5 60 88400
10 9.3 1 16.5 5.5 40 88400
3 16.7 0.1 38.5 20.5 25 88400
0 21.6 0.05 70.5 30.5 0.05 88400

192
Towards 100% SoC the chemical reactions facilitating charge slow down, and
this is indicated by the characteristic reduction in charge current as a battery
is float charged. The battery no longer accepts current significantly and any
attempt to charge it further, up to the upper charge (cyclic) voltage limits only
result in this excess voltage being developed across the surface capacitor.
At 100% SoC therefore the model is not completely applicable into the low
frequency area of the response, and an indicated value of 4F for the bulk
capacitance demonstrates this. This is clearly an apparent capacitance due to
the high SoC, as during the remainder of the tests the battery delivers the
rated capacity. The response at 100% SoC however remains significant in that
despite the low frequency impedance being high, the high frequency
impedance is in the healthy range. From these indications alone it could be
established that the battery is in a fully charged state.
The key indicators from the testing are presented in the following graphs,
with Figure 95 showing the values of the major impedances of the battery over
SoC.

193
Figure 95. Major controlling impedance over SoC
Figure 96 shows the value of Cx1 over SoC.
Figure 96. Cx1 over SoC
The findings from the tests indicated that observation of battery status can be
made from battery impedance and model parameters, however, the increased
impedance at high and low charge states required some examination of
additional indicators in order that the states could be differentiated. As such
01020304050607080901000
10
20
30
40
50
60
70
% SoC
Imp
ed
an
ce (
millio
hm
s)
Ri + R
e
Rt
01020304050607080901000
10
20
30
40
50
60
70
80
90
% SoC
Cap
acit
an
ce (
Fara
ds)
C
x1

194
the mean DC terminal voltage was extracted from the test data in order that
this could be evaluated for such use.
8.5.3 Mean DC terminal voltage
The elevated impedances at both low and high states of charge could lead to
some confusion over actual battery state during a blind test. As such, the
findings of chapter 7 in regard to mean DC terminal were re-examined to
establish whether these results could further inform a SoC indication system.
Figure 97 shows the results obtained from the bipolar tests, bounded by the
limits from manufacturer’s data for the battery terminal voltage over SoC.
Figure 97. Mean PRBS DC terminal voltage over SoC
The findings are clearly useful in providing additional information for the state
prediction process. The voltages V1 and V2 are the mean DC terminal voltages
at the start and end of each PRBS test. As can be seen the voltages fall within
010203040506070809010011
11.5
12
12.5
13
13.5
14
%SoC
Term
inal vo
ltag
e (
V)
Upper limit, SoC from O/C terminal voltage, battery data
Lower limit, SoC from O/C terminal voltage, battery data
Mean PRBS voltage V1
Mean PRBS voltage V2

195
the manufacturers band for open circuit terminal voltage at 20°C for the
indicated state, apart from 0% and 100% SoC where the experimental results
deviate, but the deviations are such they confirm the status reporting. This
means, referring back to Figure 94, that the impedance responses for each state
can be indexed with the PRBS mean terminal voltage.
8.6 Conclusion
The investigation within this chapter demonstrated that bipolar PRBS battery testing
facilitates SoC evaluation within batteries and cells, and allows very clear
identification of 100% and 0% charge states. The elevated low frequency impedance
at 100% SoC was accompanied by high frequency impedance indicating a healthy
battery, which clearly indicated the 100% charged state. In contrast, the test results
from the early work [165] using the discharge method showed trends which could be
correlated to battery state, but the test data at 100% SoC required some indeterminate
data to be rejected, thus not showing the elevated battery impedance at this point.
The discovery that the bipolar test facilitated useful mean terminal voltage
measurement was important in that it allowed further identification of the charge
state, particularly in intermediate states-of-charge, and this additional indicator,
could therefore find application as part of a combined mode SoC indication system.
This investigation therefore led to opportunities for expanding the work, based on
the concept shown diagrammatically in Figure 98.

196
Decision engine
Battery impedance
Battery temperature
Mean Terminal Voltage
State of Charge
State of Health
Historical data
Figure 98. Battery SoH/SoC system
Figure 97 shows a proposed state evaluation system based on the work up to this
point and sets out the work which follows. Based on the results of this chapter, the
PRBS analysis could be used to inform a battery SoH/SoC system, based on a fixed
temperature and with either initial data from a battery in a known good state-of-
health, or a sufficiently comprehensive manufacturer’s datasheet.
As such it remained to examine these system inputs in more detail, thus requiring
examination of batteries over operating temperature range and lifecycle.

197
Chapter 9. Effects of temperature on parameters within batteries
9.1 Introduction
The previous chapters showed how PRBS testing coupled with suitable analysis
could be used to provide useful SoC and SoH indicators should the battery and load
conditions be known, and this chapter further explores these ideas by examining the
temperature dependence of the equivalent circuit parameters in an effort to develop
a more comprehensive battery monitoring system.
As discussed in chapter 3, Lead-Acid batteries suffer considerable performance
reductions at low temperature, with both the ability to deliver high discharge
currents and the effective capacity being impacted by reduced temperature.
Performance increases with higher temperatures, but this is accompanied by
undesirable degradations in battery health.
This chapter examines the parameters of test batteries over operating temperature
range, and encompasses early work using the discharge based PRBS technique [166],
reinforcing this work by again revisiting the experiments with the less intrusive
bipolar PRBS.
9.2 Test setup and schedule
The test batteries used were again Yuasa NPL65-12i, as used in previous tests in a
good SoH (new condition). Tests were devised to examined the batteries over a
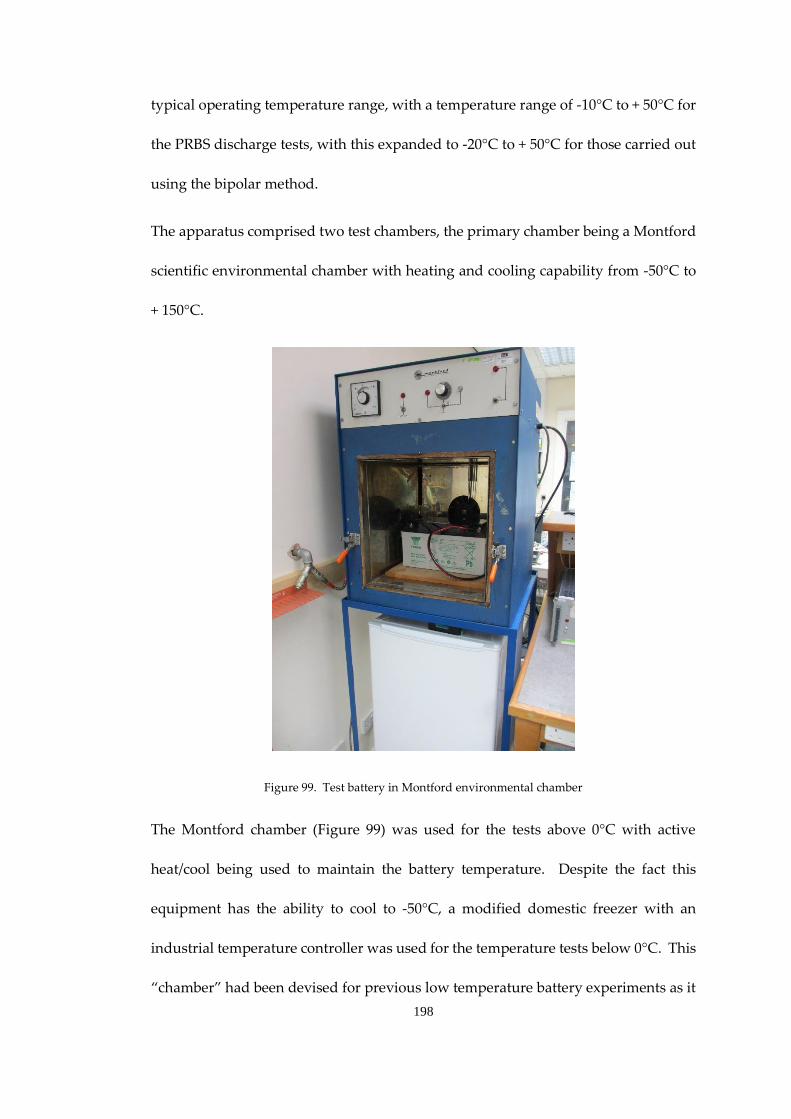
198
typical operating temperature range, with a temperature range of -10°C to + 50°C for
the PRBS discharge tests, with this expanded to -20°C to + 50°C for those carried out
using the bipolar method.
The apparatus comprised two test chambers, the primary chamber being a Montford
scientific environmental chamber with heating and cooling capability from -50°C to
+ 150°C.
Figure 99. Test battery in Montford environmental chamber
The Montford chamber (Figure 99) was used for the tests above 0°C with active
heat/cool being used to maintain the battery temperature. Despite the fact this
equipment has the ability to cool to -50°C, a modified domestic freezer with an
industrial temperature controller was used for the temperature tests below 0°C. This
“chamber” had been devised for previous low temperature battery experiments as it

199
proved more cost effective to run over long periods of time, as the Montford chamber
employed a total loss refrigerant system in the form of liquid CO2. The chambers,
including their specifications, are described in more detail in the appendices.
In order to evaluate the battery performance over operating temperature range it was
necessary to ensure the subject batteries were stable at the test temperatures before
any testing was carried out. To achieve this at each test increment the battery was
allowed several hours at each temperature step in order to reach a thermal
equilibrium before carrying out the PRBS test. The flowchart in Figure 1 shows the
test procedure.
Increment temperature by
10°C
START
disharge battery to 85% SoC
END
End of tests?
YES
NO
Stabilise at temp temperature for 6
hrs
PRBS test
Cool battery to -20°C
Figure 100. Test schedule flowchart, temperature tests

200
As can be seen in the flowchart, the battery was discharged to 85% SoC before the
tests, and remained in this state throughout the tests. 85% was chosen as a SoC where
the battery is in a stable state, and it was prudent to avoid very high and very low
states-of-charge, where other dynamics may have inadvertently affected the results.
Figure 101. Test battery in low temperature chamber
Figure 101 shows the test battery in the low temperature chamber prior to being
cooled to -20°C. The temperature sensing thermocouple can be seen connected
directly to the battery terminal, which is the most effective method of sensing the
plate temperature without actually opening the battery case. As such the controller
shows the “warm” battery at 22°C, rather than the temperature of the surrounding

201
ice. This chamber has no direct heating only insulation losses, so the autotune
function of the controller was used initially on a dummy cool cycle in order to
optimise the system.
9.3 Test results
The test results for the work carried out in examining the test batteries over
temperature are found in the following sections. The test results for the early work
carried out using the discharge PRBS is included, with the detailed analysis being
carried out on the bipolar PRBS, providing more comprehensive results.
9.3.1 Discharge PRBS tests
Figure 102. Normalised surface capacitance over temperature, discharge PRBS tests (CSurface =
14F at 20°C).
The discharge PRBS tests (Figure 102) were originally devised to explore
correlations between surface capacitance and temperature using Randles’
-10 0 10 20 30 40 500.2
0.4
0.6
0.8
1
1.2
1.4
1.6
Battery Temperature (°C)
No
rmalised
CS
urf
ac
e

202
model (Figure 36, page 118), as a potential indicator for effective capacity.
Using the analysis in chapter 5 the value of CSurface over temperature was
established, with the battery being maintained at a known SoC (95%). The work
was presented at LABAT 2011 and published in the Journal of Power Sources
[166].
Figure 103. Available battery capacity with temperature from manufacturer’s data (image
courtesy Yuasa Batteries Europe)
The tests show satisfactory results, when compared with figure 103, which
shows manufacturer’s data for available capacity over temperatures. The value
of CSurface reduces with decreases in temperature, albeit following a steeper
gradient than that for the capacity values from Figure 103. The work was
revisited later in the research, and it was imagined that a developed test system

203
from this work may ultimately use the bipolar PRBS test, so the investigation
was refocused on this method, which is detailed in the following sections.
9.3.2 Bipolar PRBS test results
The bipolar tests carried out on the test battery were able to expand on the work
carried out using the discharge PRBS by providing a less intrusive test to the
battery, particularly as the battery was cooled, and using the model developed
for the SoC tests in chapter 8 (Figure 90, page 186). Figure 103 indicates the
battery has a severe loss of capacity at -20°C, so therefore further discharging
the battery with the test itself is undesirable.
Considerations had to be made for the upper voltage limit of the bipolar PRBS
on the positive going “charge” section of the PRBS waveform. The battery
would, at low temperature, require an increased charge voltage, and the
headroom on the test apparatus had to be set in order that this would not
become an issue during the lower temperature tests. The voltage levels for
cyclic charge at -10°C indicated the voltage should be around 15.3V and the
Yuasa data stopped at this temperature. The majority of VRLA batteries, with
the exception of some spiral wound types [24], are effectively unusable at
temperatures below -10°C, however, the charge voltage limits were
extrapolated to allow the tests at -20°C.
The tests results were examined and curve fitting applied using MATLAB,
using the model developed for the SoC tests in chapter 8.5.1, and the plotted
results are presented in Figures 104, 105 and 106.

204
Figure 104. Impedance over -20 to 10°C temperature range - bipolar tests.
Figure 104 shows a spread of the results obtained for the test battery. The
tests between 0°C and -20°C show the elevated impedance in this area due to
the decreased ability of the battery to accept charge. Responses for 20°C to
50°C are shown in Figure 105.
Figure 105. Impedance over 20-50°C temperature range - bipolar tests.
10-2
10-1
100
101
102
103
0
0.2
0.4
0.6
0.8
1
1.2
1.4
Frequency (Hz)
Imp
ed
an
ce (
oh
ms)
-20C
-10C
0C
10C
10-2
10-1
100
101
102
0
5
10
15
20
25
Frequency (Hz)
Imp
ed
an
ce (
millio
hm
s)
20°C
30°C
40°C
50°C

205
The results in figure 105 show more predictable area of operation for the test
battery. High frequency impedance (Rint +Re) is representative of battery state
across the range of tests, and this relationship is shown in Figure 106.
Figure 106. High frequency impedance (Ri+ Re) over temperature
Curve fitting was carried out using the MATLAB routine curvefit.m,
comparing impedance plots to iteratively derived responses in order to
establish parameters. The complete results are shown in Table 16.
Table 16. Test battery parameters over temperature
Temp (°C) Rint + Re
(mΩ)
CSurface
(F)
Rt
(mΩ)
Rx1
(mΩ)
Cx1
(F)
CBulk
(F)
-20 11.42 1 5 5 1 1.5*
-10 7.44 1 5 5 1 2*
0 6.77 1 5 5 1 3*
10 5.09 2 15 8 5 88400
20 5.04 5.0 20 11 50 88400
30 4.63 5.5 20 14 75 88400
40 4.94 6.5 18 5 95 88400
50 5.03 6.5 14 3 105 88400
-20 -10 0 10 20 30 40 504
5
6
7
8
9
10
11
12
Imp
ed
an
ce (
millio
hm
s)
Temperature (°C)
Ri + R
e

206
*The values for CBulk at the lower temperatures are representative of the
impedance response, and the actual capacity of the battery is much higher
than this.
9.3.3 Mean PRBS DC terminal voltage
For completeness, the mean terminal voltage of the PRBS at the battery
terminals was again examined for each test carried out during the investigation.
Figure 107. Mean DC terminal voltage over battery temperature
The results seen in Figure 107 are interesting in that the mean terminal voltage
at lower temperature is shown as elevated. As the battery cools the mobility
of the electrolyte due to diffusion naturally decreases. It is known that
electrolyte circulation reduces overvoltage – a common phenomenon known
in batteries dependant on current density during normal operation at normal
ambient temperatures [164]. At low temperatures the reduction in electrolyte
-20 -10 0 10 20 30 40 5012.8
13
13.2
13.4
13.6
13.8
Battery Temperature °C
Term
inal vo
ltag
e (
V)
Mean PRBS voltage
207
mobility therefore reduces the ability of the battery to deliver current, tending
to promote an overvoltage on the positive going portions of the PRBS
waveform. If the battery was discharged at this temperature however, this
voltage would immediately collapse before recovering to a level more
representative of the activity within the battery.
9.4 Conclusion
The findings for the investigation revealed useful indicators of battery performance
at the test temperatures. The battery, when tested at -20°C indicated a severe drop in
performance in line with general characteristics with low temperature operation of
Lead-Acid batteries [16]. The electrochemical activity within the battery at this
temperature, and the effective capacity, were clearly shown in the values obtained in
the model capacitances and the charge transfer resistance. Towards 0°C the
performance of the battery improved somewhat, but the suppressed performance
was still indicated by the model parameters. Significant improvements began to be
seen beyond this point with the familiar range of parameters seen at 20°C.
Towards 50°C the indication were that the performance of the battery was further
improved, but as is known and discussed in chapter 3, increasing battery temperature
to this level brings with it the undesirable degrading reactions within the battery
which reduce operational life.
The tests carried out therefore demonstrated characterising the battery against its
prevailing SoC, and are useful in providing an input to the battery state evaluation
system proposed in chapter 8.
208
Chapter 10. PRBS analysis of Ultra batteries and battery/supercapacitor
energy storage networks
10.1 Introduction
The work carried out in this chapter concerns the examination of parallel energy
storage networks using the PRBS tests developed in earlier chapters. The motivation
for this study was to examine the applicability of the developed test techniques to
parallel energy storage networks, as these find applications in electric vehicles [167]
and renewable energy systems [168]. The work was carried out early in the overall
body of research leading to the parallel branch battery model used in chapter 6
(Figure 56, page 149) and its later iterations in other chapters.
Within the work, it was of interest to gain an understanding of the benefits of a lead-
acid battery/supercapacitor parallel network, examining the respective roles of the
battery and capacitor by applying the spread frequency PRBS perturbation, and
obtaining parameters for the networks tested.
Going further, examination of an UltraBatteryTM using the same techniques in order
to make comparisons to the parallel networks, and their respective parameters would
allow the advantages of each energy storage system to be assessed.
10.1.1 Capacitor and battery parallel networks
In chapter 2 the differences in the way energy is stored in batteries and
capacitors were discussed. As batteries store electrical energy indirectly as
209
potential chemical energy and capacitors store energy directly in an
electrostatic way, this presents opportunities for complementary energy stores
operating at differing rates of charge and discharge.
The response times of batteries led to the technology being inefficient during
rapid charge/discharge cycles, such as those observed in regenerative braking
and subsequent acceleration in electric vehicles. These types of current profile
are more suited to capacitors, but their overall energy density generally
precludes capacitors being used alone in these applications, with the
technology available at the time of writing. As such a parallel
supercapacitor/battery network can offer advantages for use in EV and HEV
duty [33].
10.2 Conventional battery tests
The investigation was focused on examining a conventional VRLA battery in
comparison to an UltraBattery. Further to this two different super capacitor banks
were assembled to be assessed as parallel, complementary storage elements with the
conventional VRLA battery. The intention of these experiments was then to compare
the performance of the parallel capacitor/battery networks against the UltraBattery,
and also to use the parallel battery/capacitor combinations to give some insight into
the respective roles of the parallel storage elements.
The batteries used were a Furukawa FTZ12-HEV UltraBatteryTM as discussed in the
review of current energy storage technologies in chapter 2. The battery is housed

210
within a generic 8-9Ah case size for commodity automotive SLI batteries, so a
comparable capacity/case size motorcycle battery (Continental Batteries CTX-9) was
chosen as the test subject for the conventional technology. A schedule of comparative
tests was devised, and these are described in the following sections.
10.2.1 Discharge capacity tests
Initially, discharge tests were carried out on the two batteries, at a rate around
1cr (8A) to compare capacity, using the apparatus in Figure 108.
Figure 108. Controlled charge/discharge system photograph
The overall control was implemented by using a VxI Power Oracle 200E battery
backed power supply with custom firmware. This allowed controlled
discharge of the battery to 0% SoC with automatic cut-off of the connected load

211
at the EoD voltage. As detailed manufacturer’s data was not available for the
batteries under test generic guidelines for VRLA batteries from Yuasa were
used to establish appropriate EoD voltage levels for the discharge rates selected
(9.6V for a 1cr rate at 20°C) [17]. The system was also used for the temperature
controlled charging of the test battery. Figure 109 shows the discharge curves
for the batteries at the 1cr rate, 20° Celsius.
Figure 109. 1cr discharge, 20° Celsius, both batteries
A further test at the same discharge rate in a -20° Celsius ambient was carried
out to examine the low temperature discharge performance of the test
samples (Figure 110). The calculated capacities for both batteries (using
equation 16, page 122) during the tests, along with values for CBulk at 20°C are
shown in Table 17.
0 500 1000 1500 2000 2500 3000 3500 40009
10
11
12
13
14
Time (s)
Batt
ery
Vo
ltag
e (
V)
Lead-Acid (CTX9)
UltraBattery (FTZ12)
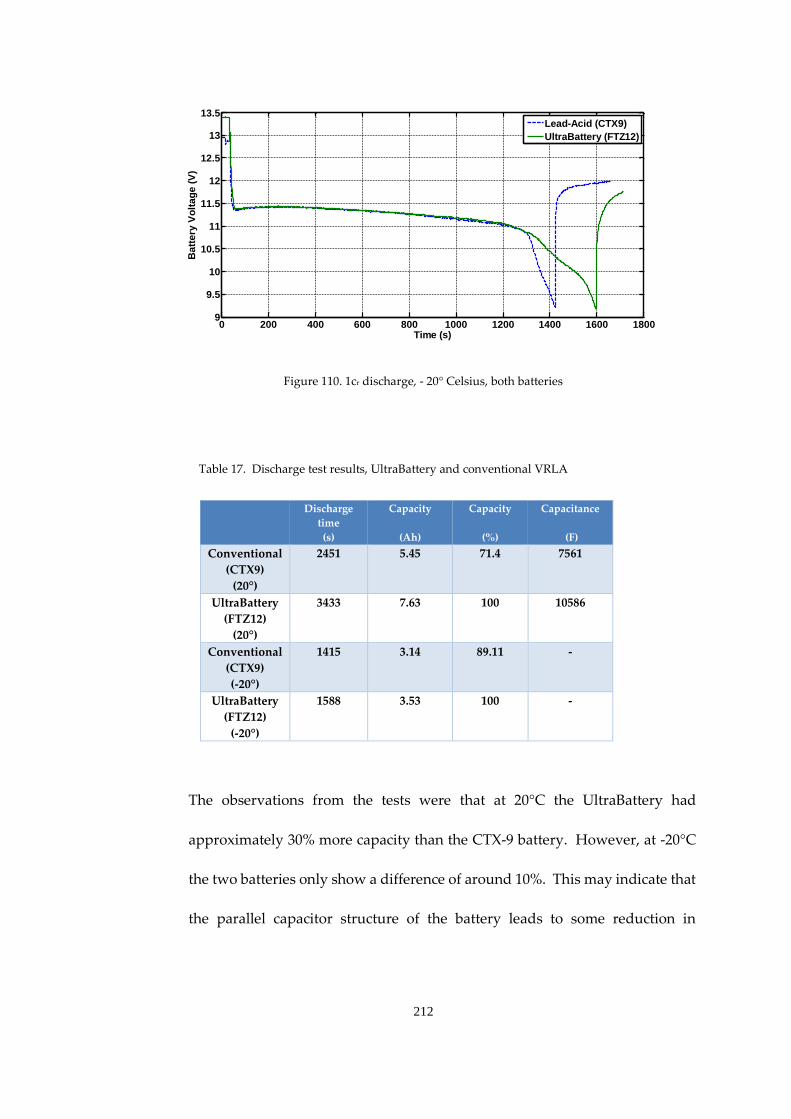
212
Figure 110. 1cr discharge, - 20° Celsius, both batteries
Table 17. Discharge test results, UltraBattery and conventional VRLA
Discharge
time
(s)
Capacity
(Ah)
Capacity
(%)
Capacitance
(F)
Conventional
(CTX9)
(20°)
2451 5.45 71.4 7561
UltraBattery
(FTZ12)
(20°)
3433 7.63 100 10586
Conventional
(CTX9)
(-20°)
1415 3.14 89.11 -
UltraBattery
(FTZ12)
(-20°)
1588 3.53 100 -
The observations from the tests were that at 20°C the UltraBattery had
approximately 30% more capacity than the CTX-9 battery. However, at -20°C
the two batteries only show a difference of around 10%. This may indicate that
the parallel capacitor structure of the battery leads to some reduction in
0 200 400 600 800 1000 1200 1400 1600 18009
9.5
10
10.5
11
11.5
12
12.5
13
13.5
Time (s)
Batt
ery
Vo
ltag
e (
V)
Lead-Acid (CTX9)
UltraBattery (FTZ12)

213
capacity at low temperature, although further testing would be required to
verify this.
10.2.2 Static parameter evaluation
The batteries were subject to short duration pulse load tests in order to establish
the parameters for the Randles’ circuit. (Figure 36, page 118). The batteries were
subjected to an 8A constant current load (approximately 1cr discharge rate)
which was interrupted to provide parameter information. The results for the
Lead-Acid battery (CTX9) and UltraBattery (FTZ12) are shown in Figures 111
and 112 respectively.
Figure 111. CTX-9 static parameter test, 8A off load transient (20°C)
On inspection of the responses distinguishing Ri from Rt proved difficult,
precluding accurate evaluation of CSurface. As such the total of Ri + Rt was
recorded as a reference for the later PRBS tests:
0 0.5 1.0 1.5 2.0 2.5 3.0 3.5 4.0 4.512
12.05
12.1
12.15
12.2
12.25
12.3
Time (s)
Batt
ery
Vo
ltag
e (
V)
CTX
I(Rt+R
i)

214
Figure 112. FTZ-12 Ultrabattery static parameter test, 8A off load transient (20°C)
Lead- Acid (CTX9)
Voltage deviation = 248mV
I(Rt +Ri) = 0.248
I=8A, therefore Rt +Ri = 31mΩ
UltraBatttery (FTZ12)
Voltage deviation = 168mV
I(Rt +Ri) = 0.168
I=8A, therefore Rt +Ri = 21mΩ
The results are presented in table 18 below.
Table 18. Randles’ parameters (from static tests)
Battery Ri+Rt (mΩ)
Lead-Acid (CTX9) 31
UltraBattery (FTZ12) 21
0 0.5 1.0 1.5 2.0 2.5 3.5 3.5 4.0 4.512.1
12.15
12.2
12.25
12.3
Time (s)
Batt
ery
Vo
ltag
e (
V)
FTZ
I(Rt+R
i)

215
The static tests gave rise to results which were as expected generally, with the
UltraBattery battery being lower in overall impedance by around 30%.
10.2.3 Battery mass
The batteries were weighed for completeness, bearing in mind the UltraBattery
is designed for HEV usage and it was found to be significantly heavier than the
conventional Lead-Acid (table 19).
Table 19. Battery mass
Battery Mass (kg)
Conventional 2.85
UltraBattery 3.75
10.3 Testing of parallel energy storage networks
The following section concerns tests developed using the conventional battery with
parallel capacitance. The capacitor banks chosen were significantly different in order
to inform the model already developed for the UltraBattery.
10.3.1 Test configuration - Supercapacitor Bank 1
The super capacitors used were Wima DS-C-09-01-C200-XB-M-SS rated at 200F,
2.5V DC [88]. In order to achieve the terminal voltage of the battery, capacitors
in series were used to increase the working voltage. This in turn reduced the

216
overall capacitance by the same factor, resulting in a pack 1/6 of the rated
capacitance value per capacitor (33F).
10.3.2 Test configuration - Supercapacitor Bank 2
The second capacitor bank again used 6 capacitors connected in series, but of
higher capacitance. The capacitors used were Maxwell Energy Products Inc PC
2500, of value 2500F, 2.7V [84]. The total capacitance of the 6 capacitors in series
was therefore (calculated) 417F.
10.3.3 Capacitance tests
Capacitors are manufactured with a wide capacitance tolerance, so charge and
discharge tests of the bank were carried out in order to establish the actual
capacitance experimentally.
The capacitors were charged from 1V to a terminal voltage of 15V using a
constant current of 2A. Subsequently the pack was discharged using a constant
current 2A load to 1V (1V being used as it allowed headroom for the constant
current load). Calculations of stored charge (Coulombs) were then carried out
in order to establish capacitance values (Table 20).

217
Table 20. Capacitance test results
Bank 1
charge
Bank 1
discharge
Bank 2
charge
Bank 2
discharge
Charge
(coulombs)
658 652 8418 7152
Capacitance (F) 47 46.6 601.3 510.9
10.3.4 Test system description – parallel network PRBS tests
The test system used in the earlier tests was modified with the addition of
further input from a total of five channels of measurement (Figure 113). The
channels comprised battery terminal Voltage and offset measurement to
determine any voltage dropped in the system wiring, and 3 channels of current
measurement (capacitor current, battery current and total current).
Data acquisition
Capacitor Current
Battery Current
VxI Intelligent charger
PRBS generator
High speed load bank
Battery under test
Battery Voltage
Signal 0V Supercapacitorbank
Power 0V
Power 0V
Battery temperature sense
Figure 113. Test system block diagram

218
Figure 114. Test system photograph, battery/supercapacitor bank 2
Figure 114 shows the test system photograph. To the left of the picture the
data acquisition system is seen, and referring to the aerial view in Figure 115
we can see the parallel connection of the battery and the smaller
supercapacitor bank.
Figure 115. Battery/supercapacitor test setup, bank 1
Test
battery
Super
capacitor
bank

219
Figure 116 shows more detail of the test system with capacitor bank 2. (The twisted
wires from the charger to battery are the temperature sensor for the battery
temperature compensation).
Figure 116. Battery/supercapacitor test setup, bank 2
10.3.5 PRBS application to the energy storage networks
Tests on the capacitor/battery parallel combination were carried out in the same
way as the tests discussed in the previous chapters, with additional information
gathered regarding the current profiles. Current measurement was carried out
on each parallel branch, in addition to total current flowing in the PRBS load.
Analysis of these current responses was carried out in order to gain insight into
Super capacitor
bank
High-speed load PRBS
generator
Test battery
VxI Intelligent charger

220
the range of frequencies over which the supercapacitor offers performance
improvements over the battery alone.
10.3.6 Analysis of the complementary energy stores
Prior to carrying out frequency domain analysis of the acquired data, the data
was plotted in the time domain to allow inspection of the waveforms.
Analysis of the current flows during the tests gave an insight into the
interaction of the capacitor and battery. The capacitor/battery combination is
intended to address the issues associated with rapid changes of current
direction, and as such the PRBS test allows some examination of this
performance.
Prior to the test the battery/capacitor combination was charged at a cyclic
charge level [17], (2.4 Volts per Cell (VpC) at 20 °C), as this was considered to
be closer to the conditions under which the parallel combination would be used
in application. The discharge PRBS perturbations as applied to the test
configurations were used not only to establish impedances, but the voltage and
current waveforms were inspected to attempt to gain information regarding the
respective roles of the two energy stores. The following section examines the
plotted results for the parallel networks.

221
10.3.7 Battery and capacitor bank test waveforms
Figure 117 shows the overall current envelope for the parallel 33 Farad
capacitor and the CTX-9 test battery. As can be seen the current sharing
between the two elements reaches a pseudo steady state at just over 200
seconds.
Figure 117. Relationship between battery and capacitor current over full test – bank 1.
Examination of the current envelopes for the larger capacitor bank, (Figure 118)
show clear differences to the smaller capacitor bank (Figure 117). The capacitor
delivers the majority of the current to the load over most of the test period.
0 200 400 600 800 1000 1200-3
-2
-1
0
1
2
3
4
5
Dis
ch
arg
e c
urr
en
t (A
)
Time (s)
Battery current
Capacitor current
Lead-Acid/33F
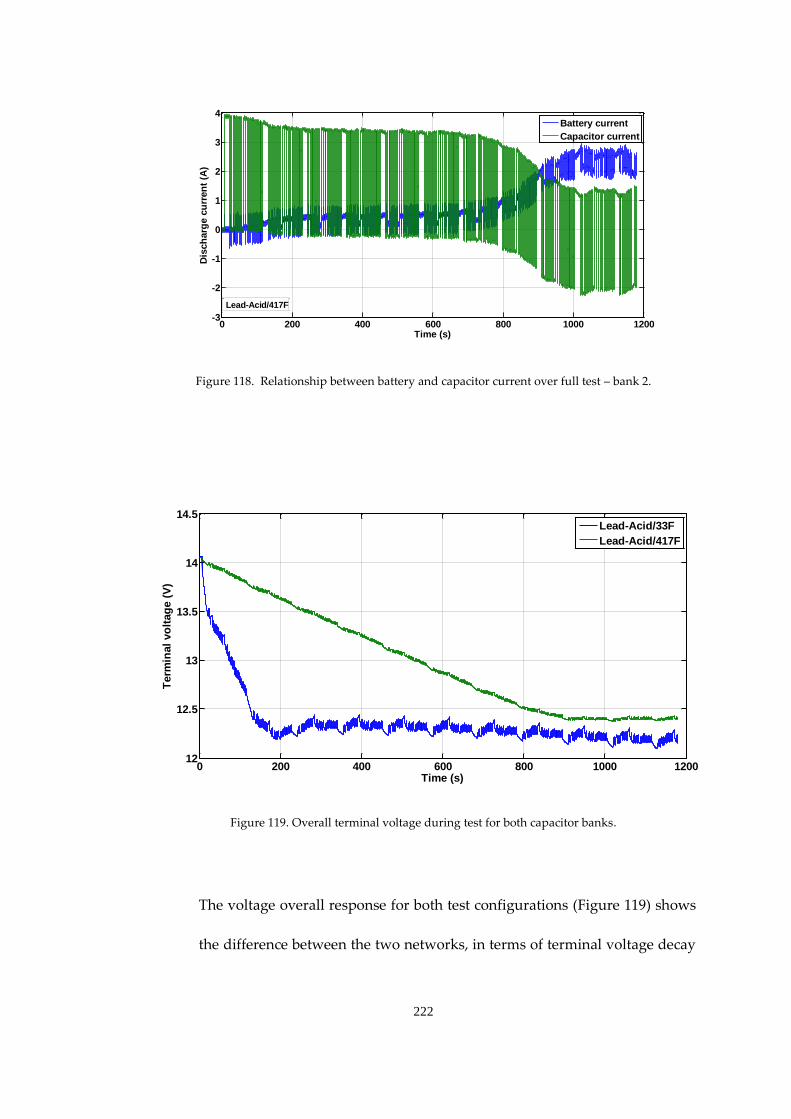
222
Figure 118. Relationship between battery and capacitor current over full test – bank 2.
Figure 119. Overall terminal voltage during test for both capacitor banks.
The voltage overall response for both test configurations (Figure 119) shows
the difference between the two networks, in terms of terminal voltage decay
0 200 400 600 800 1000 1200-3
-2
-1
0
1
2
3
4
Time (s)
Dis
ch
arg
e c
urr
en
t (A
)
Battery current
Capacitor current
Lead-Acid/417F
0 200 400 600 800 1000 120012
12.5
13
13.5
14
14.5
Time (s)
Term
inal
vo
ltag
e (
V)
Lead-Acid/33F
Lead-Acid/417F

223
and voltage amplitudes for the PRBS test pulses. Comparative current
waveforms for the networks under test are shown in Figures 120 and 121.
Referring to Figure 120 the capacitor delivers the majority of the current over
the course of the 100 second plot and this reduces as the capacitor discharges
relative to the battery. The larger capacitor bank in Figure 121 has the effect
that the capacitors are totally dominant in delivery of current over the 100
second window. Terminal voltage for the two banks can be seen in Figure
122. Figure 123 shows the transition of energy delivery from the capacitors to
the battery for the bank 1 test configuration, which can be directly compared
to Figure 124, which shows the similar behaviour for bank 2, in this case 800-
900s into the test.
Later in the test, (1000-1100 seconds, Figures 125, 126), the battery is now
supplying the bulk of the current, whilst charging the capacitor in the PRBS
off period. However, the average level of ripple current seen by the battery is
still much reduced by the addition of the capacitors.
The voltage response in Figure 127 now appears relatively flat as compared
with the earlier plots, with the overall voltage deviations being controlled by
the value of the parallel capacitance.
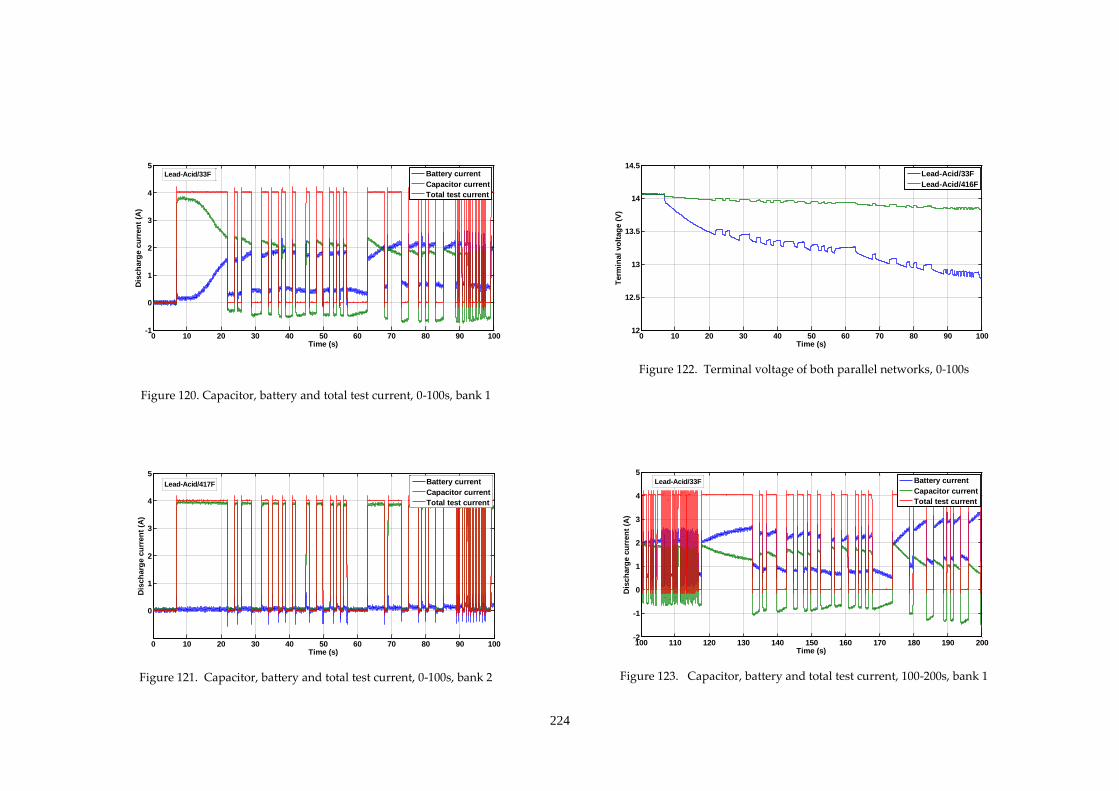
224
Figure 120. Capacitor, battery and total test current, 0-100s, bank 1
Figure 121. Capacitor, battery and total test current, 0-100s, bank 2
Figure 122. Terminal voltage of both parallel networks, 0-100s
Figure 123. Capacitor, battery and total test current, 100-200s, bank 1
0 10 20 30 40 50 60 70 80 90 100-1
0
1
2
3
4
5
Time (s)
Dis
ch
arg
e c
urr
en
t (A
)
Battery current
Capacitor current
Total test current
Lead-Acid/33F
0 10 20 30 40 50 60 70 80 90 100
0
1
2
3
4
5
Time (s)
Dis
ch
arg
e c
urr
en
t (A
)
Battery current
Capacitor current
Total test current
Lead-Acid/417F
0 10 20 30 40 50 60 70 80 90 10012
12.5
13
13.5
14
14.5
Time (s)
Term
inal
vo
ltag
e (
V)
Lead-Acid/33F
Lead-Acid/416F
100 110 120 130 140 150 160 170 180 190 200-2
-1
0
1
2
3
4
5
Time (s)
Dis
ch
arg
e c
urr
en
t (A
)
Battery current
Capacitor current
Total test current
Lead-Acid/33F

225
Figure 124. Capacitor, battery and total test current, 800-900s, bank 2
Figure 125. Capacitor, battery and total test current, 1000-1100s bank 1
Figure 126. Capacitor, battery and total test current, 1000-1100s bank 2
Figure 127. Terminal voltage of both parallel networks, 100-200s
800 810 820 830 840 850 860 870 880 890 900
0
1
2
3
4
5
Time (s)
Dis
ch
arg
e c
urr
en
t (A
)
Battery current
Capacitor current
Total test current
Lead-Acid/417F
1000 1010 1020 1030 1040 1050 1060 1070 1080 1090 1100-2
-1
0
1
2
3
4
5
Time (s)
Dis
ch
arg
e c
urr
en
t (A
)
Battery current
Capacitor current
Total test current
Lead-Acid/33F
1000 1010 1020 1030 1040 1050 1060 1070 1080 1090 1100
-2
-1
0
1
2
3
4
Time (s)
Dis
ch
arg
e c
urr
en
t (A
)
Battery current
Capacitor current
Total test current
Lead-Acid/417F
1000 1010 1020 1030 1040 1050 1060 1070 1080 1090 110012.1
12.15
12.2
12.25
12.3
12.35
12.4
12.45
Time (s)
Term
inal
vo
ltag
e (
V)
Lead-Acid/33F
Lead-Acid/416F
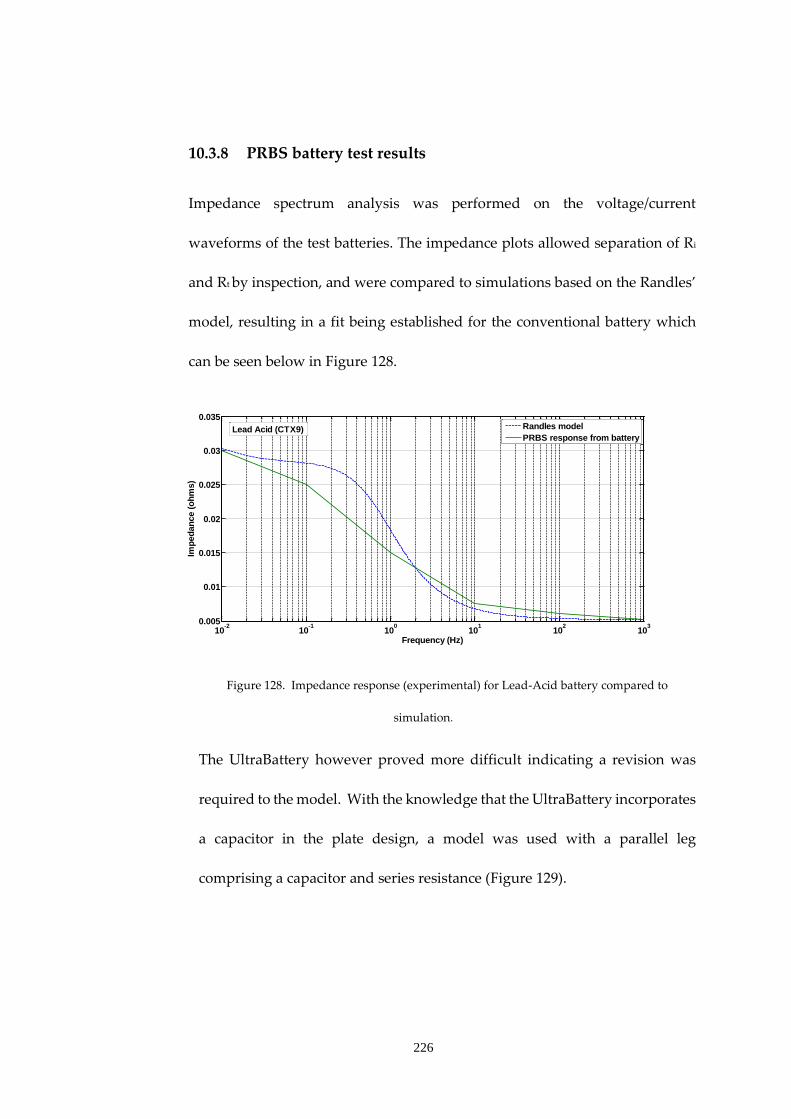
226
10.3.8 PRBS battery test results
Impedance spectrum analysis was performed on the voltage/current
waveforms of the test batteries. The impedance plots allowed separation of Ri
and Rt by inspection, and were compared to simulations based on the Randles’
model, resulting in a fit being established for the conventional battery which
can be seen below in Figure 128.
Figure 128. Impedance response (experimental) for Lead-Acid battery compared to
simulation.
The UltraBattery however proved more difficult indicating a revision was
required to the model. With the knowledge that the UltraBattery incorporates
a capacitor in the plate design, a model was used with a parallel leg
comprising a capacitor and series resistance (Figure 129).
10-2
10-1
100
101
102
103
0.005
0.01
0.015
0.02
0.025
0.03
0.035
Frequency (Hz)
Imp
ed
an
ce (
oh
ms)
Randles model
PRBS response from batteryLead Acid (CTX9)

227
CSurfaceRt
CBulk
Rx
Rd
Ri
Cx
I
V
Figure 129. Modified Randles’ model for the UltraBattery
The derivation for this model was previously shown on page 149 in equations
32 to 36. Parameters were then established iteratively for the simulation using
the transfer function which provided a good fit to the experimental results,
shown below in Figure 130.
Figure 130. UltraBattery experimental response and simulation using modified model.
10-2
10-1
100
101
102
103
0.004
0.006
0.008
0.01
0.012
0.014
0.016
0.018
0.02
Frequency (Hz)
Imp
ed
an
ce (
oh
ms)
Randles model
PRBS response from battery
Modified model
UltraBattery (FTZ12)

228
The modified model was then applied to the conventional battery, to see if
the model predictions could be improved. Using approximate values as a
starting point, an improved fit was established, which can be seen in Figure
131.
Figure 131. Lead-Acid experimental response and improved fit to modified model.
It was therefore concluded that the revised model offered benefits to
establishing parameters for both batteries. Parameters established from the test
results are shown in tables 21 and 22.
10.3.9 Results summary
Table 21. Battery parameters – Randles’ model
Randles’model Ri (mΩ) Rt (mΩ) CSurface (F) CBulk (F)
Conventional
5.2 23 2 7561
UltraBattery
4.9 11.9 3 10586
10-2
10-1
100
101
102
103
0.005
0.01
0.015
0.02
0.025
0.03
0.035
Frequency (Hz)
Imp
ed
an
ce (
oh
ms)
Randles model
PRBS response from battery
Modified model
Lead-Acid (CTX9)

229
Table 22. Battery parameters – modified model
Modified
model
Ri (mΩ) Rt (mΩ) CSurface (F) CBulk (F) Cx (F) Rx (mΩ)
Conventional
5.2 23 2 7561.3 10 6
UltraBattery
4.9 11.9 2.5 10586 100 6
The datasheet for the CTX-9 does not specify impedance directly, and states
the more commonly used Cold Cranking Amps (CCA) for Starting, Lighting
and Ignition (SLI) batteries. This figure is provided as 120A, which when
applied to Ohm’s law with Ri + Rt:
Voltage drop during starting = 120A x 28.2mΩ = 3.4V
This gives a battery voltage of 9.6V under start conditions at 20°C for a fully
charged battery with a terminal voltage o 13V, which follows expectations.
The Ultrabattery data was evolving as part of this work, but similarly the
values of Ri and Rt reflected the intended use of the batteries, with the
combined Ri + Rt being 40% less than the conventional battery, which in turn
with the increased parallel capacitance lends itself to applications where rapid
energy exchange is required (such as regenerative braking).
PRBS impedance results were obtained for the batteries and parallel
combinations in pseudo steady-state conditions, and are shown in Figure 132.

230
Figure 132. Respective impedances of the battery and parallel networks.
Examination of the results (Figure 132), supports the predictions of the earlier
tests with the batteries alone, and the presence of the additional capacitance
lowers the effective impedance response of the energy storage system,
improving the transient behaviour.
The conventional battery was shown to have significantly larger impedance
than the UltraBattery over the frequency range and in addition to this the
response was observed to be significantly flattened by the shunting effect of
the parallel capacitance. The predictions for the UltraBattery using curve
fitting suggested a parallel capacitance of circa 100F. The responses in Figure
132 support the earlier calculations, with the UltraBattery response lying
between the two parallel configurations, (33F and 416F).
10-2
10-1
100
101
102
103
0
5
10
15
20
25
30
Frequency (Hz)
Imp
ed
an
ce (
mil
liO
hm
s)
CTX (Lead Acid)
CTX and parallel 33F
CTX and parallel 416F
FTZ (UltraBattery)

231
10.4 Conclusion
The work carried out in this chapter verified the applicability of the discharge PRBS
tests in establishing impedance responses and parameters for energy storage devices
suitable for EV/HEV applications.
Tests carried out using the UltraBattery against the conventional Lead-Acid SLI
battery showed that former was more responsive to rapid application of load, and
this was demonstrated in the impedance results. Using equivalent circuit modelling
it was shown that Randles’ model alone is not capable of fully predicting UltraBattery
behaviour. The proposed model (Randles’ + parallel RC branch) provides a better fit
to the experimental data. Moreover, a 10:1 difference in the capacitance value Cx
which was the significant performance indicator.
Testing the conventional battery with parallel capacitances of 33F (47F measured) and
416F (510F measured) were shown to produce responses which when compared to
the 100F calculated parallel capacitance of the UltraBattery, confirmed the earlier
results.
Observing the PRBS current waveforms for the respective parallel battery and
supercapacitor configurations allowed some insight into the benefits of using a
capacitor in conjunction with a battery. It was shown clearly that during the early
stages of PRBS test sequence, the supercapacitor delivers current, whilst the battery
begins to undertake the chemical processes that allow discharge. The relationship
between the current delivered by each energy store is dependent on the magnitude

232
of the parallel capacitance and prevailing dynamic loading, and changes as time
progresses.
Ripple currents experienced by the battery are significantly reduced using the
parallel arrangement throughout the discharge, leading to extended service life in
this configuration.
Examination of the voltage responses, respective current flows and ripple currents
offered opportunities for further work in defining criteria for selecting parallel
capacitors in applications where transient conditions are the norm.

233
Chapter 11. Accelerated failure analysis of lead acid batteries
11.1 Introduction
State of Health for batteries and cells is the most difficult of the state indicators to
obtain results for, as the inherent nature of the testing process requires that the battery
should be assessed over its life to failure. VRLA batteries typically have a design life
of 5 or 10 years, and a cycle life (typically) of around 1000 – 1500 cycles. As such, the
minimum period over which a test could be carried out to cycle a battery to failure at
room temperature would be in the order of 2-3 years. This is feasible within the
timeframe of a research degree, but this would require all of the designed tests and
test equipment to be defined at the inception of the research. Additionally, this
design life is quoted to a capacity level of 80%, and as part of the investigation the
remaining function beyond this defined end of life was to be assessed, extending the
test period significantly. Lead–Acid batteries, do however have a characteristic
behaviour that can be exploited to accelerate the test process. Battery life degrades
significantly with increased temperature, and manufacturers data [17] for service life
over operating temperature range presents a linear reduction of operational service
above 20°C, with around 5% service life being typical for 60°C operation – 6 months
for a new battery with 10 year design life. Using this as a basis, one of the original
test batteries with a known history was selected, as this was already 4 years into its
life cycle. It was therefore estimated that cycling the battery at 60°C under a high rate
discharge and charge cycle would show significant SoH indicators over a 3 month
timeframe. The motivation for this work was to examine the three PRBS tests modes

234
over the whole life of the battery, to examine the applicability of the charge, discharge
and bipolar PRBS tests over SoH and where each method showed advantages. It was
hoped that the study would provide base parameters for a statistical process
controlled system, which gathers historical data from in service battery systems and
modifies the predictive data to inform SoH which becomes available to the system
for end-of-life battery estimation.
11.2 Cycle tests at elevated temperature
Long duration tests using batteries require automated test systems, and in order to
implement the testing process to be described, a significant hardware set was
developed. The battery under test was required to be cycled (charged and
discharged) at elevated temperature and tests carried out to establish battery state at
these intervals. Due to the long duration of the overall investigation several
charge/discharge cycles (10-12) were carried out between each test and this was
defined as a “cycle group”.
A Montford environmental chamber was used to heat the battery to the cycling
temperature, which operated under closed loop control, although active cooling was
not employed – thermal runaway protection for the battery was provided for in the
temperature sensing arrangement, and the control system itself.
The chamber supply was turned on and off at the beginning and end of each cycle
group by the cycler controller which formed the basis of the AMM-1 test system,
described in detail in the appendices. The accelerated lifetime test system evolved

235
naturally out of test rigs used through the research presented here, leading to an
overall battery testing system facilitating long term tests using the developed
techniques.
The equipment is based around a VxI Power Oracle 200E DC UPS with custom
firmware, as the unit lends itself to discharge and cycling tests. The device itself is
designed to run from the connected batteries in an AC fail situation and power a
connected load, with inherent, adjustable low voltage disconnect for battery
protection at EoD. The unit operates autonomously, but is also a Modbus slave
device, allowing interaction from an external control system. On-board 12 bit A-D
converters allow measurement of amongst other parameters, battery voltage and
current. External TTL I/O allowed control of the peripheral equipment required, and
a custom data logging user interface was developed which simply placed information
obtained over the serial port into an Excel spreadsheet. Visual Basic macros were
employed to allow digital control of the cycler, and the data logging functionality.
The cycler interface screen can be seen in Figure 133.
The limits for the cycler can be seen on the right hand side of the interface (analogue
settings). The system provides two sources of charge to the battery under test, firstly
from the 200W Oracle unit (which is the charge level of 5A on the interface) and
secondly, because the VxI unit is primarily being used as a control platform and the
cycling needs to be more rapid than a 5A charge current would allow, an external
35A charger is enabled by the control unit.

236
Figure 133. Battery cycler user interface showing available measurement and control

237
Battery limits can be seen in the analogue group - the most important being the Under
Voltage Lock Out (UVLO) limits. These voltages define the point at where the battery
will be disconnected from the load thereby preventing permanent damage. The
9.99V limit is a time delayed threshold, and this limit needs to be breached for circa
10 seconds before the battery is disconnected from the load and the cycle resets. The
lower threshold (9.35V) is immediate, and provides for the battery terminal voltage
“crashing” – typical of a battery in depleted state of health.
Figure 134. Test battery within the environmental chamber (door removed)
The test system incorporated battery terminal voltage sensing at the battery,
independent of the load cables (Figure 134), with temperature sensing of the battery
being implemented primarily to ensure correct charging voltage levels (Figure 135),
whilst additionally reporting any elevations in battery temperature beyond the
programmed chamber temperature, allowing the system to shut down automatically.

238
Figure 135. Close up of battery terminal showing temperature sensing arrangement
11.3 Battery test schedule
The test schedule for the accelerated failure testing of the battery was designed to
take advantage of all of the techniques investigated up to this point. As such all three
modes (discharge, charge and bipolar) were used to evaluate the battery performance
at each group of ten cycles.
The tests were carried out 100% SoC, 85% and 0% SoC, reflecting the tests carried out
in the earlier experimental investigations. Discharge, charge and bipolar PRBS tests
were carried out at each test interval, along with a full discharge at the cr/20 rate with
data logging. The flow chart shown in Figure 136 shows the test procedure in more
detail.
Temperature sense thermistor
within a ring terminal,
encapsulated in epoxy resin

239
PRBS Discharge test
PRBS Charge test
PRBS Bipolar test
Apply constant current load for
2hrs
PRBS Discharge test
PRBS Charge test
PRBS Bipolar test
Float charge until charge current less
than 100mA
Discharge at cr/20 to establish capacity
PRBS Discharge test
PRBS Charge test
PRBS Bipolar test
START
Does n=0
100% SoC 85% SoC 0% SoC
YES
NO
Cycle battery at elevated
temperature
Decrement cycle counter (n)
Figure 136. Overall test schedule flowchart, accelerated failure tests

240
Figure 137 shows the cycler block (cycle battery at elevated temperature) from Figure
136 broken out into its component processes:
START
Turn on environmental
chamber and ramp to 60°C
Open AC relay to 200E unit (discharge
mode)
Disconnect load
Is battery at end of discharge Voltage?
Is cycler enabled?
YES
NO
YES
NO
Enable bulk charger
Decrement cycle count
Is cycle count at zero?
Turn off environmental
chamber
Reset cycle counter
Has charger timer
timed out?
Disable bulk charger
Enable external load
Clear cycler enable bit
Close AC relay to 200E unit (charge
mode)
Figure 137. Battery cycler flowchart

241
11.4 Test results
The test battery was subjected to close to 200 cycles, at a rate approaching 1C and at
a temperature of 55-60°C, with the complete test period covering 314 days.
The cycler data log in Figure 138 shows the low speed acquisition data from the AM-
1 battery test system, which was used to acquire the capacity results - note the Figure
shows an overall cycle group. The initial ramping up of the battery temperature can
be seen at the early part of the data, and despite the thermal capacity of the oven
(3kW heating) the internal battery temperature took 4 hours to reach the programmed
temperature of 60°C.
Figure 138. Battery cycler data log temperature and voltage data over complete cycle period between
PRBS tests
The charge and discharge profiles for the battery can also be seen from the figure.
The battery undergoes an initial “bulk” charge (constant current, 30A transitioning
0 5 10 15 20 25 30 35
10
12
14
Time (Hours)
Batt
ery
Vo
ltag
e (
V)
0 5 10 15 20 25 30 3520
40
60
80
Batt
ery
tem
pera
ture
°C
)
Temperature
Terminal voltage
Bulk
charge
Float
charge
Discharge

242
to constant voltage 14.4V/20°C) from the charger module, and the transition to “float”
charge (constant voltage, 13.65V/20°C).
The PRBS tests were carried periodically after each cycle group, with the developed
tests envisaged to collect more data than necessarily required for the investigation,
bearing in mind the difficulty in repeating the experiments. It was decided from the
outset that the base parameters over battery life would be derived from the bipolar
tests at a stable SoC, with the other modes examined to reinforce the findings.
11.4.1 Battery capacity results
The battery capacity over the test period is shown in Figure 139, and as
expected, battery capacity generally reduced over the course of the experiment.
Figure 139. Battery capacity over accelerated life cycle tests
The results obtained were used to calculate CBulk, and these values can be found
in table 23. The capacity reduction of the battery follows a reasonably
0 2 4 6 8 10 12 14 16 18 200
10
20
30
40
50
60
cycle group
Cap
acit
y (
Ah
)
Battery capacity

243
predictable pattern until cycle group 14, where the onset of the final decline
occurs.
11.4.2 Battery impedance over accelerated life cycle
The impedance results in Figure 140 show the general trends that were obtained
by using the bipolar results at 85% SoC for the battery. The rationale for using
these results this was that the bipolar test method was the least intrusive and
the 85% state avoided the elevated impedances at high and low states-of-
charge, which can be confused with declining health. The results from the final
test group were not presented in the impedance responses as the severe
changes in impedance offered little more information than the battery was now
unusable.
Figure 140. Battery impedance over accelerated life cycle testing, bipolar test, 85% SoC
The impedance plots demonstrate the declining health of the battery over the
accelerated tests. The battery continues to be useful beyond the normal end of
life point, but experiences a step decline at cycle group 12. As such, observing
10-2
10-1
100
101
102
103 0
5
10
15
200
20
40
50
60
Cycle group
Frequency (Hz)
Imp
ed
an
ce (
mil
lio
hm
s)

244
the behaviour of the battery up to this point is crucial in determining when this
failure occurs, and this is discussed in the following sections.
11.4.3 Battery parameters over accelerated life cycle
The parameters over the battery life cycle were obtained by iterative curve
fitting to the models developed in chapter 8 (Figure 90, page 186) using the
impedance results from the bipolar tests at 85% SoC. At this stage of the
research many of the MATLAB processing routines were combined to assist in
processing the large amounts of data automatically. An example of this is
crunch1.m (appendices 15.8.7) which was created to load the data from saved
MATLAB workspaces relating to the tests carried out. The routine then
processed the multiple PRBS sequences to produce an impedance plot, which
was then used for the iterative curve fit. Figure 141 shows the trends in Ri and
Re (electrolyte resistance) which clearly show the step change as the battery
fails.
Figure 141. Major series impedance over test period
0 10 20 30 40 50 60 70 80 90 1000
10
20
30
40
50
60
Test period (%)
Imp
ed
an
ce (
millio
hm
s)
R
i + R
e

245
The parameters for the battery are shown in Table 23. Examining the results
it the onset of terminal failure of the battery can be seen from cycle group 9
(45% into the test period).
Table 23 – Battery parameters, bipolar tests, 85% SoC
Cycle Group
CBulk (F)
Ri (mΩ)
Rt (mΩ)
CSurface
(F) Rx1 (mΩ)
Cx1 (F)
1 92516 4.9 10 4.5 11 50
2 83722 5 14 4.5 17 45
3 76282 5.1 14 4.5 13 45
4 71486 5.5 16 4.5 7 45
5 70857 5.5 16 4.5 7 45
6 83005 5.5 15 4.5 7 40
7 77220 5.9 15 4.5 7 40
8 79500 6.1 16 4 7 40
9 75915 6.5 16 2 7 30
10 57655 8.7 16 0.9 6 25
11 67742 10.5 16 0.8 6 15
12 53945 12.5 20 0.4 6 12
13 54805 33.4 20 0.4 5.5 12
14 61433 33.5 20 0.4 5 12
15 55251 35.5 20 0.4 5 10
16 30621 37.7 20 0.4 7 12
17 30270 38.9 20 0.4 7 35
18 27434 40 20 0.4 7 35
19 21189 43.6 300 0.4 7 2
20 6229 542.2 85 0.06 25 5
The manufacturer’s data sheet for the battery (shown in appendices, 15.7.1),
offers impedance at 1 kHz (5mΩ) which equates to Ri, and 10.51mΩ internal
resistance which equates to Ri+Rt for a new battery at 20°C. The parameters in
red are in the terminal phase of the battery life. As is seen with other modes of

246
reduced SoF of batteries and cells the general trends include a reduction in
effective capacitance, and increases in series impedance.
11.4.4 Observed trends over states of charge during battery lifetime
Further to the observations from the parameter estimation, the results for the
charge, discharge and bipolar tests were examined for trends at the test charge
states. It had been noted previously that the bipolar testing provides an overall
picture of the battery impedance for charge and discharge, however,
comparative results for the three modes of test at each test step, yield some
interesting trends. The test data was examined for all three modes of test at the
test states of charge (100%, 85% and 0%). The cycle groups chosen were 1 and
13, 1 being the healthiest state at the start of the test, with cycle group 13 clearly
into the terminal phase of the battery performance.
Figure 142. 100% SoC cycle group 1
10-2
10-1
100
101
102
103
0
50
100
150
200
250
300
350
Frequency (Hz)
Imp
ed
an
ce (
millio
hm
s)
Discharge PRBS
Charge PRBS
Bipolar PRBS

247
Figure 142 shows the comparative plots at 100% SoC at the start of the life test.
Work in previous chapters has identified the charge PRBS as a charge stage
transition indicator, and that the discharge PRBS can give indeterminate
results. It is only when the three modes are observed together that a trend
emerges for indicating battery state. The general trend for 100% SOC is that the
overall impedance of the charge based PRBS is greatest at this state, whilst the
three methods tend to converge at high frequency. Figure 143 shows the same
plot for cycle group 13, and the trend remains valid, although the overall
magnitudes have increased.
Figure 143. 100% SoC cycle group 13
The change by 85% SoC (Figure 144) is clear and the 3 modes of test largely
converge at this battery state. There is some divergence at low frequency, and
this is due to the charge and discharge test modes having some effect on the
battery, but it is clear the battery is in a different SoC solely by inspection.
10-2
10-1
100
101
102
103
0
100
200
300
400
500
600
Frequency (Hz)
Imp
ed
an
ce (
millio
hm
s)
Discharge PRBS
Charge PRBS
Bipolar PRBS
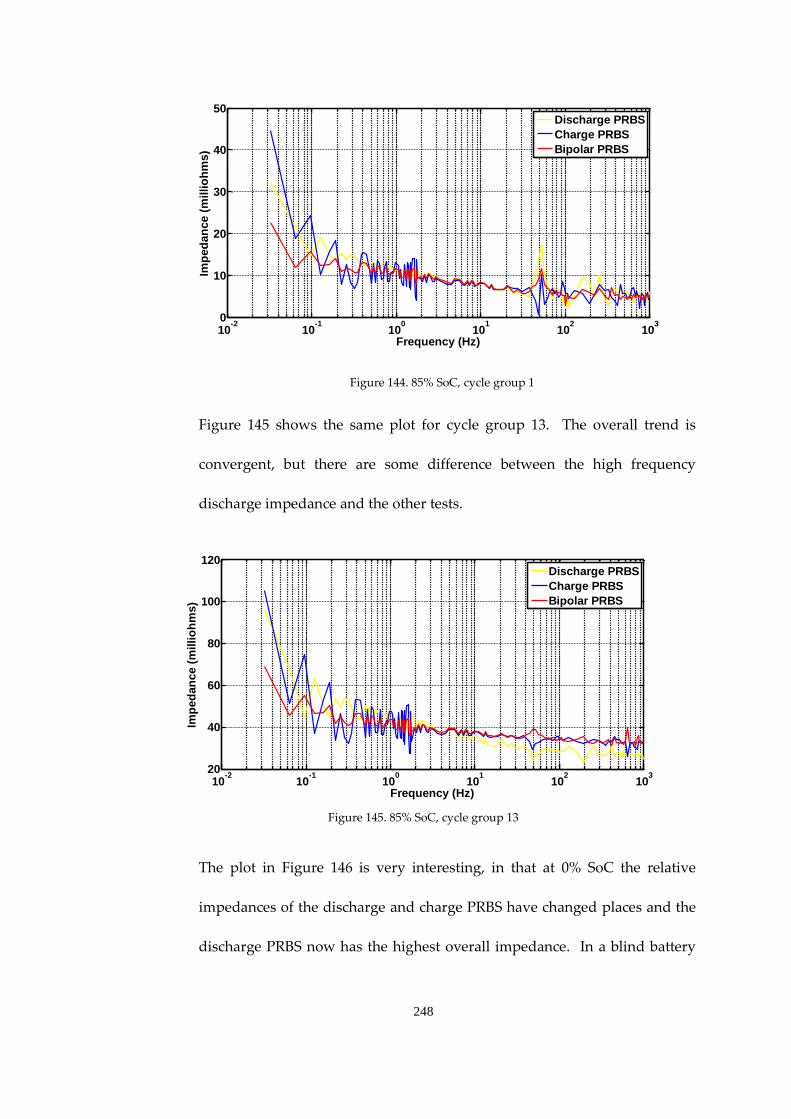
248
Figure 144. 85% SoC, cycle group 1
Figure 145 shows the same plot for cycle group 13. The overall trend is
convergent, but there are some difference between the high frequency
discharge impedance and the other tests.
Figure 145. 85% SoC, cycle group 13
The plot in Figure 146 is very interesting, in that at 0% SoC the relative
impedances of the discharge and charge PRBS have changed places and the
discharge PRBS now has the highest overall impedance. In a blind battery
10-2
10-1
100
101
102
103
0
10
20
30
40
50
Frequency (Hz)
Imp
ed
an
ce (
millio
hm
s)
Discharge PRBS
Charge PRBS
Bipolar PRBS
10-2
10-1
100
101
102
103
20
40
60
80
100
120
Frequency (Hz)
Imp
ed
an
ce (
millio
hm
s)
Discharge PRBS
Charge PRBS
Bipolar PRBS

249
test it would therefore be possible to establish the SoC just by the relationship
of the three test mode impedances.
Figure 146. 0% SoC cycle group 1
The findings are further reinforced with the results show in Figure 147, which
show impedance plots in the same order as for the healthy battery, but the
characteristic impedances have further diverged. The information contained in
this plot is a clear indicator of battery SoC and SoH.
Figure 147. 0% SoC, cycle group 13
10-2
10-1
100
101
102
103
0
10
20
30
40
50
60
Frequency (Hz)
Imp
ed
an
ce (
millio
hm
s)
Discharge PRBS
Charge PRBS
Bipolar PRBS
10-2
10-1
100
101
102
103
0
100
200
300
400
500
Frequency (Hz)
Imp
ed
an
ce (
millio
hm
s)
Discharge PRBS
Charge PRBS
Bipolar PRBS
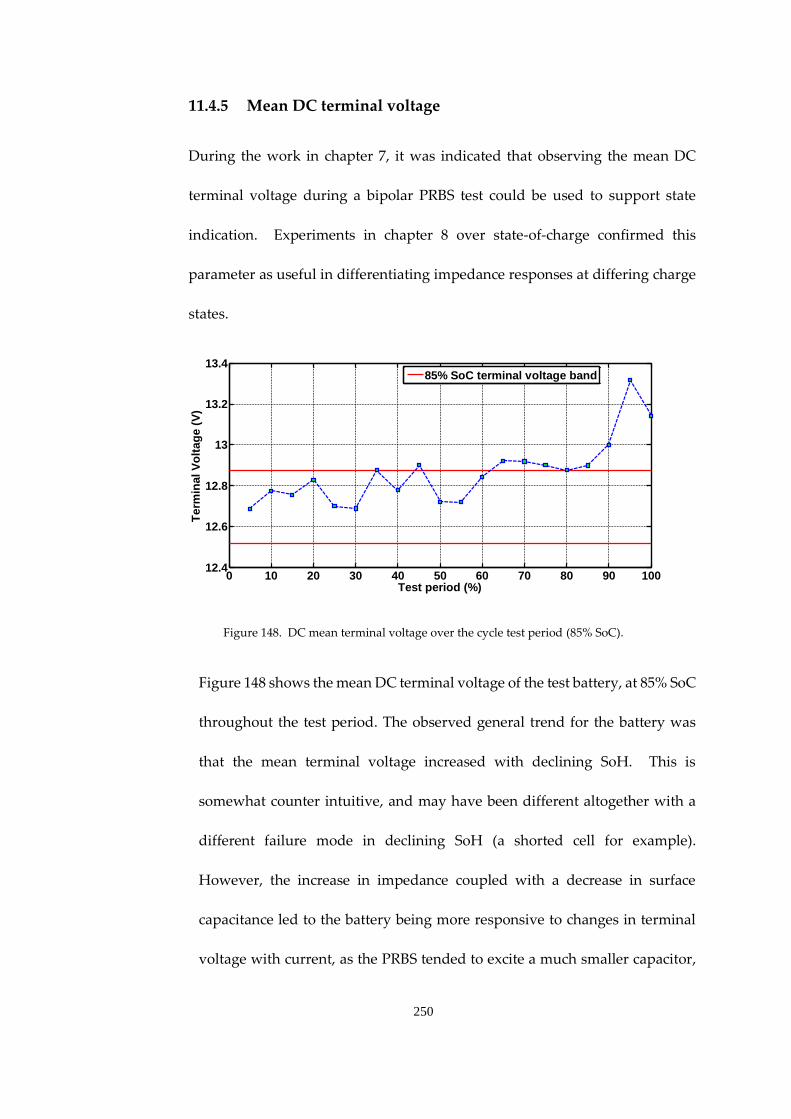
250
11.4.5 Mean DC terminal voltage
During the work in chapter 7, it was indicated that observing the mean DC
terminal voltage during a bipolar PRBS test could be used to support state
indication. Experiments in chapter 8 over state-of-charge confirmed this
parameter as useful in differentiating impedance responses at differing charge
states.
Figure 148. DC mean terminal voltage over the cycle test period (85% SoC).
Figure 148 shows the mean DC terminal voltage of the test battery, at 85% SoC
throughout the test period. The observed general trend for the battery was
that the mean terminal voltage increased with declining SoH. This is
somewhat counter intuitive, and may have been different altogether with a
different failure mode in declining SoH (a shorted cell for example).
However, the increase in impedance coupled with a decrease in surface
capacitance led to the battery being more responsive to changes in terminal
voltage with current, as the PRBS tended to excite a much smaller capacitor,
0 10 20 30 40 50 60 70 80 90 10012.4
12.6
12.8
13
13.2
13.4
Test period (%)
Term
inal V
olt
ag
e (
V)
85% SoC terminal voltage band

251
in addition to the ability of the battery to transition between charge and
discharge states being affected by the reduction in battery function.
The overall peak to peak voltage deviations at the battery terminals were
significantly increased as reported in the impedance results. The mean
voltage gradient over a bipolar PRBS test is linked to battery efficiency, and
this in itself is a useful indicator in measuring SoH. Further batteries would
need to be tested to validate these findings, with different modes of failure
examined to characterise the observations made in these tests.
Figure 149. Changes in Mean DC voltage during bipolar tests (battery efficiency)
Figure 149 shows the progression of mean terminal voltage reduction over the
test period to cycle group 15 (to 75% of the overall test period), during the
bipolar tests at 85% SoC. The bipolar test presents a net zero energy exchange
with the battery, so in ideal conditions the mean DC terminal voltage at the
start of the test compared to that at the end of any bipolar PRBS test period,
should be the same. Any deviations from this can be attributed to battery
0 25 50 75
0
20
40
60
80
100
120
140
Mean
DC
term
inal vo
ltag
e
ch
an
ge d
uri
ng
bip
ola
r te
st
(mV
)
Test period %
Mean DC voltage
linear fit

252
efficiency. The trend in Figure 149 is generally that this change in voltage
increases with time and declining SoH. The linear fit is not wholly appropriate
but the trend is clear that as the battery ages the efficiency decreases.
11.4.6 Examination of internal battery condition
The opportunity arose to inspect the internal condition of the battery at the end
of the testing. The battery was weighed prior to the inspection and was found
to have a mass of 21.2kg compared to 22kg when new, indicating significant
loss of electrolyte, which indicated that battery mass could possibly support
SoH indication.
The battery case also suffered significantly during the tests and was distorted
during the high temperature cycling (Figures 150, 151).
Figure 150. Battery at end of testing within containing "bund" in case of electrolyte
leakage

253
Figure 151. Case distortion of the battery during the elevated temperature tests
The top of the battery case was cut away to expose the individual cells, allowing
individual cell voltages to be measured and the general condition of the battery
to be examined. Figure 152 shows the battery with the case top removed.
Significant corrosion can be seen on the inter-cell links, indicative that such
undesirable reactions have occurred elsewhere within the battery. The cells
appeared almost dry of electrolyte, and using a non-metallic “dip stick” in the
void at the end of the cells, it was found that the electrolyte was completely
expended apart from that remaining in the absorbent material between the
plates.

254
Figure 152. Test battery with case top removed exposing the individual cells
Refering to Figure 152 the cells were numbered 1 to 6, left to right and the
individual cell voltages measured. The findings are shown in table 24.
Table 24. Individual cell voltages for subject battery at the end of the test.
Cell number Voltage (V)
1 2.0764
2 1.4714
3 1.2593
4 1.1709
5 1.1348
6 1.9200
The outer cells in the battery appear to have retained terminal voltages
approaching that of healthy cells where cells 2-5 have significantly reduced
cell voltages.
The battery had, prior to the measurements, been charged to its prevailing
100% capacity, and left for a period of several months in order that an estimate

255
for Rd could be made. Surprisingly, the self discharge of the battery remained
in a healthy state, bearing in mind the measured residual capacity was 3.91Ah.
Based on the period elapsed between the end of the tests and the battery
dissection, the self discharge resistance was estimated at still being in excess
of 15 KΩ based on a linear interpolation.
Figure 153. Plate condition of one of the failed cells
The photograph in Figure 153 shows the condition of the cell plates. The
upper area of the cell plate appears from inspection to be in a good condition,
but the lower part of the plate is covered with a salty deposit which appears
to be sulphation. The separators and absorbent mats in which the electrolyte
were suspended remained damp but no significant quantity of electrolyte was
in evidence.

256
11.5 Conclusion
Accelerated lifetime tests on the subject battery revealed insights into the process of
degradation with electrochemical cells as a result of undesirable reactions between
the electrolyte and the cell plates. As expected, reductions in available capacity were
manifest, and these reductions in performance were found to correspond to specific
parameter indications using PRBS testing to establish frequency response. The
modes of reduction in performance observed showed a gradual change in key
parameters, with a sharp increase in loss of performance at end of life.
The reduction in CSurface could be seen as the battery degraded, which is envisaged to
relate to a loss in available plate area and active material as the battery tends towards
end of life. In conjunction to this an increasing in electrolyte resistance for both
charge and discharge conditions was shown to be apparent. As the battery degraded
the suitability of a single model is diminished, and at this point the reporting of
parameters is somewhat diluted. The value of reporting parameters when the battery
has a significant loss of function is dominated by overall increases in impedance, or
in individual cell failure.
Importantly, characteristics of the PRBS tests were identified which could directly be
applied to a SoH/SoC evaluation system, specifically:
Comparison of PRBS test modes (charge, discharge and bipolar) can be used to
identify SoC as the observed trend was that at high state-of-charge the charge PRBS
would give a generally increased impedance with the discharge PRBS reporting the
257
lowest result. The bipolar tests, as previously observed fall between these two test
modes.
Specific findings from the tests:
The results converge at medium states of charge.
The trend reverses at low states of charge.
The trend is valid over SoH, and is amplified.
Again the examination of mean DC terminal voltage over the test period yielded
some interesting results. The findings from the bipolar tests at 85% SoC shows a
mean DC terminal voltage that increased over time with declining SoH. This was
mainly attributed to the increased impedance of the battery and reduced capacitive
elements, resulting in overall time constants that were much reduced. The battery
therefore was able to change in terminal voltage more rapidly as health declined,
with, for these tests, a characteristic upswing in the mean DC terminal voltage at the
onset of irreversible failure (Figure 148).
DC terminal voltage was also used to establish some measure of battery efficiency at
the test conditions above. The observed trend for a generally increasing differential
between the mean DC terminal voltage at the start and end of a bipolar test showed
clear indications that the bipolar PRBS was increasingly responsible for energy
removal from the battery, and as such could be correlated to the battery charge
efficiency.
It is expected that batteries cycled to end of life during more conventional durations
(several years) may experience slightly different failure characteristics, and these

258
characteristics will also be tied in with whole-life average temperature, and rate of
charge and discharge.
However, the value in the testing is the ability to inform prediction of end of life
through parameter analysis using the following metrics:
observations of increased overall impedance (Ri and Rt)
corresponding changes in mean terminal voltage
reduction in elements of surface capacitance
Which have been demonstrated during the accelerated failure tests.
259
Chapter 12. PRBS battery state evaluation using an embedded processor
12.1 Introduction
The research within this thesis was carried out in conjunction with a sponsoring
industrial partner (VxI Power Ltd), and as such a deployable version of the developed
hardware was one of the desirable objectives of the investigations.
This chapter therefore explores the implementation of the PRBS tests devised during
the body of this research within an embedded processor, with the PRBS generation,
signal acquisition and data processing using FFT all carried out in software within
the chosen embedded processor. The project was directed by the author of this thesis,
with the embedded software development carried out as the focus of an MSc final
year project by a member of staff from the sponsoring industrial partner [169].
Development of the test hardware, analysis of the batteries using the developed
embedded solution, and the verification against the test systems developed for the
larger body of work were carried out by the author of this thesis.
In implementing the technology some trade-offs in the capability of the measurement
and state evaluation process were anticipated, and would be subject to some
boundaries, specifically the computational capability of the microcontroller itself.
The motivation for this short study was therefore to explore the suitability of
commercially available microcontrollers for this type of battery analysis, and to
provide a proof of concept which could be used in an evolving on-board battery test
system within larger electrical equipment such as a battery charger or industrial UPS.

260
12.2 Embedded processor selection
In selecting the processor for the test system, perhaps the largest constraints of the
whole body of work came into play. The processor chosen needed to be reflective of
a device which could feasibly be incorporated into a product costing $500. It was
required to have a digital signal processing “engine”, and library functions should be
available from the manufacturer in order that robust, efficient code could be
developed in a short time frame. Since both the author and the sponsor had
considerable experience with Microchip embedded processors the devices examined
were members from the Microchip dsPIC family, and the 16 bit 33fJ256GP710A [157]
was chosen as the target processor. These devices have a price around $6 in quantity
at the time of writing.
It was recognised that the timing of the acquisition was important in maintaining the
integrity of the PRBS, and this required some element of parallel processing.
The chosen microcontroller was able to transfer data from the ADC to memory
outside of the CPU operation by using the on-board Direct Memory Access (DMA)
data bus. This was an important factor in the selection of the device, as the PRBS
generation, and the acquisition of the battery data would need to be carried out as
concurrent events.

261
12.3 Limitations associated with embedded devices
Embedded processors have become powerful devices over the 20 years or so of their
existence, and embedded digital signal processing is a feature of many consumer
audio devices. That being said, there are limitations in the computational capability
of microcontrollers in mathematically intense applications. Despite having a high
“million instructions per second” (MIPS) rating operations like FFT require that a
large number of instructions be carried out, requiring efficient implementation of the
software and its execution.
As mentioned, the dsPIC33fJ256GP710A has (DMA) allowing data transfer between
on board RAM and a peripheral independently of the CPU execution, and further to
optimise this operation the Microchip FFT libraries are written in assembly language
to be more code efficient. However, limitations on memory and fixed point
arithmetic lead to the device being only able to process 1024 FFT samples, restricting
the resolution of the impedance results.
12.4 Development and testing
A basic specification was devised for the system it was very much considered that
this was a proof of concept and within the limitations of the microcontroller the
system should perform the following tasks:
Concurrent actions
a. Generate a 6 bit PRBS sequence at a selected frequency to drive an
off-board power stage.

262
b. Acquire PRBS current and voltage PRBS data synchronised with (a)
c. Store the data externally to the main processor.
d. Processed the acquired data using an on board maths engine (FFT)
e. Store the data as an impedance response for the test battery.
In order to optimise the acquisition of the data within the constraints of the device, it
was necessary to address the problems of capturing data from battery tests. The data
of interest within the acquired voltage signal from the battery is typically 200 mV-1V
on a DC level of circa 12.5V. The resolution of the dsPIC33fJ256GP710A ADC is up
to 12 bits dependent on the number of channels used, so for the two channels required
the available resolution available was 10-bit. As such, acquiring the DC part of the
terminal voltage would reduce the effective resolution, so a hardware solution was
adopted to improve the quality of the acquired data.
As part of the signal conditioning, a differential amplifier was used with a stable DC
voltage set at one input to the amplifier. This effectively “dialled out” the DC offset
of the battery, facilitating measurement of the resulting PRBS perturbation with a
FSD of 3.3V rather than a scaled 15V FSD (Figure 154).

263
Battery as stable DC reference
0V
Test battery input
Output to microcontroller A/D
Figure 154. Improving battery test measurement resolution by introducing a stable DC offset
The DC reference was a small VRLA battery that was in a steady stage condition
(previously charge several weeks before). The potentiometer used for dividing down
the battery voltage was of a sufficiently high resistance that during the test the battery
voltage should not be affected. It was envisaged that in the commercialisation of the
techniques that this arrangement would be replaced with a precision reference and
digital potentiometer, controlled by the dsPIC.
The test system block diagram is shown in Figure 155. The 16 Hz, 6 bit PRBS is
generated from an array, and a single digital pin (RB1) changes state on a timer
interrupt. Clearly, the acquisition needs to proceed at the same time and this is
facilitated by the DMA. The ADC acquisition uses multiple sample and hold
channels to sample the inputs at the same time, with the conversion subsequently
performed sequentially. The addressing scheme used by the DMA module allows
storage of the acquired data in separate blocks addressed by the channels as sampled,
rather than in the order of conversion.

264
START
Generate PRBS demand signal
END
Test complete?
YES
Acquire Current and Voltage waveforms
Export data to off chip memory
Import data from off chip memory
Perform FFTs on data
Evaluate impedance from V and I FFT
magnitudes
Export results via RS232 port
Parallel processes supported by DMA
Figure 155. dsPIC test system flowchart
During this part of the process, the acquired data is being exported to the external
flash (Amic A25L032), and the speed at which this occurs and the amount of available
memory control the rate at which the dsPIC can acquire.
Subsequent to the data acquisition operation, the data is imported back into the
microcontroller and the data processed using the Microchip DSP library FFT
function.

265
Signal conditioning and DC offset
Battery Current
Battery under test
Battery Voltage
Signal 0V
Power 0V
DC power supply
High speed constant current charger
High speed constant current load module
Power 0V
Power 0V
IBatt
Complimentary drive control
and logic
Bipolar PRBS power stage
PRBS drive signal
External flash
memory
RS2
32
exp
ort
of
test
re
sult
s to
PC
Microchip dSPic Explorer 16 development board
Data Acquistion
Processing and FFT
Figure 156. PRBS system block diagram
Figure 156 shows the system block diagram. (Full schematics are included in the
appendices). The test equipment uses the power stage developed for the larger work,
being driven by the dsPIC development board, and acquiring to it (Figure 157).

266
Figure 157. Photograph of prototype test apparatus
As such the board is autonomous with a single button press to start the test. Test
results are exported via RS 232 to a local computer, but equally, these could be stored
in RAM for historical trend analysis of batteries in application. A close up of the
system board is shown in Figure 158. The essential digital components, along with
the analogue signal processing could be shrunk to a much smaller board area, and
the power stage used for the testing carries the dimensional overhead of multi-
functional test hardware. It was estimated that the complete hardware including
power devices but excluding power supplies could be accommodated on a double
sided printed circuit board of dimensions 50mm x 75mm.
Test
battery
bank
Embedded PRBS
test module
Power stage from
existing test setup

267
Figure 158. Close up of microcontroller card and signal processing hardware
12.5 Test results
The tests carried out were initially intended to verify the system could identify
battery health, and as such the selected test batteries which were chosen for their very
different SoH. Both of the batteries were Yuasa NP65-12 types, both with known
histories. The better of the two batteries was less than 6 months old, and had been
used for some of the PRBS tests in other chapters. The charging and discharging of
this battery had been carefully controlled, and it had completed few cycles. As such
it was deemed to be in a good SoH. The second battery was a similar type, but had
been a “lab” battery for over ten years, and used in battery test profiling and general
dsPIC microcontroller
board
DC measurement
offset
Signal
conditioning
card

268
duty in testing battery chargers during this time. In terms of SoH, the battery retained
around only 20% of its original capacity, so was beyond the defined end of life for
lead-acid batteries generally. Both batteries were in a fully charged state at the start
of the tests.
The batteries are referred to as ‘New Battery’ and ‘Aged Battery’ in the test results.
Figure 159 shows the respective voltage profiles for the test batteries when subjected
to the PRBS perturbation. The results shown in the figure are captured results from
the microcontroller.
Figure 159. New and aged battery voltage profiles acquired by the dsPIC
The impedance results from the test, delivered by the microcontroller are shown in
Figure 160. The responses are noisy but show the clear trends, and this can be
observed more clearly in the filtered response in Figure 161.
0 1 2 3 40
0.2
0.4
0.6
0.8
1
Time (s)
Vo
lta
ge
de
via
tio
n (
V)
New battery
Aged battery

269
Figure 160. Raw normalised impedance results, new and aged battery
Figure 161 shows the raw FFT results after application of an 8 point moving
average filter. It is clear from the results that the aged battery has a
significantly increased impedance over the new battery indicating the known,
poor SoH.
Figure 161. Normalised impedance results, both test batteries, 8 point moving average filter
2 4 6 8 12 160.1
0.2
0.3
0.4
0.5
0.6
0.7
0.8
0.9
1
Frequency (Hz)
No
rmalised
im
ped
an
ce
New battery
Aged battery
0 2 4 6 8 10 12 14 160.1
0.2
0.3
0.4
0.5
0.6
0.7
0.8
0.9
1
Frequency (Hz)
No
rmalised
im
ped
an
ce
New battery
Aged battery
270
12.6 Conclusion
This chapter has summarised initial attempts to embody the previously discussed
battery characterisation tests within an early stage proof of concept commercial
product prototype. The systematic design of an embedded processor was described
and the compromise design choices in terms of cost and performance were given.
Ideally the chosen processor would have more than the 1024 data samples of the
dsPIC used, however experimental test results obtained from the prototype system
show impedance responses indicating SoH can be extracted using a low-cost PRBS
test module based on such a device. The tests were concluded at the proof of concept
stage, as the system itself is to be developed further for incorporation into a deployed
product. With the information gathered from this study the use of the dsPIC in
evaluating battery performance using PRBS was demonstrated, and even with the
limitations of the microcontroller, the SoH evaluation system developed could be
used directly within a product to report this state. The system has benefits over the
pulse battery testing used at present within these products in that even over the
narrow band frequency spectrum used in the study, more information can be
gathered than by single frequency analysis alone.
Comparatively, the PRBS test is fast, with the test time being just over 4 seconds for
the clock frequency chosen, to capture an impedance spectrum, compared to 15-30
seconds for a two pulse battery test, which only yields a single result at the chosen
step duration.

271
The embedded implementation of the PRBS battery evaluation technique involved
overcoming some challenges in measurement resolution, and those of the FFT itself.
The maximum number of samples for the FFT (1024) reduced the overall resolution
of the result, but it was shown to be adequate to produce comparative results for test
batteries of diverse states and effective capacities. The system was not used to
produce models at this stage in development, as further work is required in
characterising the results against known states.
It is intended that this characterisation of batteries will be part of the ongoing
research, and with the technology incorporated into a commercial battery charger
with Ethernet connectivity, potential exists for data collection from many deployed
units operating with batteries over the lifecycle of the equipment. Periodic battery
testing from the cradle to the grave for deployed batteries could provide a basis for a
SoH/SoC measurement system. This in-field data could then be used as an input to
the state prediction system introduced in chapter 8.

272
Chapter 13. Conclusions and further work
13.1 Conclusions
This thesis has described a novel series of experiments using PRBS perturbation
signals in discrete and mixed modes to obtain state indicators and equivalent circuit
parameters for Lead-Acid batteries, hybridised Lead-Acid, and
battery/supercapacitor parallel networks.
Chapter 1 introduced the motivation for the study and the outstanding technical
challenges to be addressed, in developing test systems to investigate battery state
evaluation using a range of test modes over life and performance envelopes for the
test batteries, and examining trends in and across the test modes.
The need to establish models for the test batteries based on these experiments was
identified allowing correlations to be made between battery state and equivalent
circuit components.
Furthermore, the partnering of the research with industry, required the realisation of
this technology in a deployable format which could be incorporated in a battery
connected device.
Within chapter 2 the current state of energy storage technologies was reviewed, and
this combined with the research carried out in chapter 3 in examining performance
characteristics and limitations of batteries, were used to inform the design of battery
tests during the main study.

273
Battery test methods themselves were examined in chapter 4, culminating in the
adoption of frequency rich signals examined in the frequency domain as the testing
scheme for the work.
The work carried out within chapter 5 examined the discharge mode PRBS,
developing techniques that would be used throughout the research. This early work
examined batteries in differing SoH and formed the basis for much of the
investigations that followed.
Chapter 6 was concerned with investigating the charge mode PRBS, and opened up
applications for the technique with the results obtained. Using the charge mode
technique it was discovered that by control of the charge voltage headroom high
states of charge were clearly identified, and by using the prevailing charge voltage
threshold, charge stage transition could be detected in multi-stage charge profiles.
Whilst reporting this SoC, the charge based PRBS was also suitable for reporting SoH,
indicating via high frequency impedance the series impedance of the battery. The
charge PRBS could be used to measure impedance over the full range of charge and
therefore finds application as a state evaluation system that can be incorporated with
a battery charger with minimal additional hardware, predominantly requiring an
embedded processor to carry out the analysis.
Specific findings:
Charge PRBS reports SoC
At high SoC charge stage transitions can be detected
Can be incorporated with minimal hardware into a battery charger

274
The investigations carried out in chapter 7 looked at the bipolar mode PRBS and the
specific advantages of applying a net-zero perturbation signal to the battery. It
transpired that the technique was not only the least intrusive, it brought with this
additional indicators in the form of mean DC terminal voltage as an indicator.
Specific findings:
Bipolar PRBS net zero energy perturbation signal facilitating longer tests
Allows examination of mean DC terminal voltage as an addition SoC
indicator
Mean terminal voltage can also be used to indicate battery efficiency over a
bipolar test period
The study in chapter 8 was concerned with examining the test battery parameters
over SoC and encompassed some early work using the discharge PRBS along with
the later developed bipolar tests. The investigation demonstrated that bipolar PRBS
battery testing could be used for SoC indication and gave very clear identification of
100% and 0% charge states.
At intermediate charge states, state indications could further be observed, but as in
all SoC indication techniques the observations are more subtle and benefit from being
supported by additional indicators or historic state information.
The use of `mean terminal voltage measurement was further explored subsequent to
the discoveries in chapter 7, and mapping this parameter over the full range of charge
states confirmed that the parameter could be used at an input to a state evaluation
system.
275
Specific findings:
Bipolar PRBS most representative of battery impedance at 100% SoC
Able to identify SoC through parameter identification
Facilitates bipolar mean terminal voltage SoC indication
Chapter 9 investigated the effect of temperature on battery parameters and led on
directly from the work in chapter 8. Again early work using the discharge PRBS was
examined in conjunction with a later study using the bipolar PRBS. The testing
obtained parameters for the test battery and further investigation of the bipolar
testing was carried out.
Specific findings:
Low temperature performance reduction observed by parameter
identification
Mean DC voltage from bipolar tests could be correlated to series impedance
Within the work carried out in Chapter 10 novel experiments were developed to
examine the performance of a hybridised battery with integral supercapacitor. Tests
using parallel networks comprising conventional batteries and supercapacitors
allowed some insight into the respective roles of the capacitor and battery. Analysis
of the current waveforms for each component allowed some estimations regarding
the effectiveness of the Ultrabattery in EV/HEV duty showing the battery was more

276
responsive to rapid application of load, than its conventional counterparts and this
was further shown in the impedance results. Using the PRBS tests, parameter
estimation was carried out, and the battery was discovered to exhibit increased
equivalent circuit surface capacitance to the conventional type by a factor 10:1.
Testing the conventional battery with parallel capacitances were shown to produce
responses which when compared to the calculated parallel capacitance of the
UltraBattery, confirmed the PRBS results.
The work was presented at the 13th European Lead Battery Conference (Paris, 2012)
and was published in the Journal of Power Sources [160].
Specific findings:
PRBS discharge testing applicable to parallel energy storage networks
Parameter identification indication of 10:1 surface capacitance of hybridised
battery compared to conventional Lead-Acid
Results verified by testing comparable capacitor- battery parallel storage
networks
The work carried out in chapter 11 comprised the most comprehensive series of tests
running for over 120 days, and generating some 65 GByte of test data. A test battery
was driven to accelerated failure, and all of the developed test modes were applied
to the battery periodically during this time.

277
Lead-Acid Batteries are rated generally in terms of their lifetime to 80% capacity. It
was clear from the tests that battery remained in a usable state beyond this capacity,
and it was possible to observe the onset of total functional failure of the battery when
reviewing the results.
This had implications in that if SoH and in turn the impact on SoF of the subject
battery is fully understood, the useful life of the battery can be extended. It is vital
that the end of life of the battery is predictable in these conditions, but the impact of
being able to extend useful life of batteries is far reaching in terms of cost and
environmental impact of the production of batteries.
It was observed that evaluating three test modes together in consecutive tests led to
a deeper understanding of the prevailing state of the battery.
The following figures show with linear representations the observed trends.
Impedance
Frequency
Discharge
Charge
Bipolar
Figure 162. General impedance trends for the 3 modes of test at 100% SoC

278
At 100% SoC (figure 162) the discharge PRBS has a higher average impedance than
the Charge PRBS. As charge state declines the three modes of test largely converge
(Figure 163).
Impedance
Frequency
Discharge
Charge
Bipolar
Figure 163. General impedance trends for the 3 modes of test at 85% SoC
Impedance
Frequency
Discharge
Charge
Bipolar
Figure 164. General impedance trends for the 3 modes of test at 0% SoC
Finally as the battery progresses to 0% SoC (Figure 164) the trend reverses and the
discharge PRBS has the highest overall impedance. The trends were verified over
battery SoH, with the observation that the impedance of a healthy battery generally
converges at all states-of-charge at high frequency for all test modes. A battery in

279
poor state of health followed the trends observed in the figures, but overall
amplitudes for impedance were increased.
It should be noted that only one mode of failure was examined in these tests, and
other types of premature failure would require investigation to further inform the
evaluation of SoH. Further investigation of the use of historic mean terminal voltage
measurements under bipolar PRBS testing would also be desirable in order to further
characterise this promising performance measure.
Specific findings:
Parameter identification observations identify battery failure
Mean bipolar DC terminal voltage identified declining battery health
Mean bipolar DC terminal voltage identified declining battery efficiency
Comparison of the three modes of test identified direct identification of
battery SoC
The work carried out in chapter 12 proved the commercial viability of the developed
tests by incorporating the PRBS generation, measurement, acquisition and FFT
processing into a Microchip dsPIC. The exercise was a proof of concept, and the
system itself will be developed further for incorporation into a deployed product.
The developed hardware and software facilitated identification of batteries in
differing states of health. The types of low cost test hardware at which the study was
targeted would typically employ pulse tests to carry out the battery evaluation and
would generally report SoH only. The system showed benefits over this type of

280
testing in that even over the narrow band frequency spectrum used in the study, more
information can be gathered than by single frequency analysis alone.
Specific benefits of the embedded system were identified:
Comparatively, the PRBS test was fast, with the test time being just over 4
seconds, compared to 15-30 seconds for a two pulse battery test, which only
yields a single result at the chosen step duration.
The test system can be incorporated at minimal cost into a product which
already employs pulse testing
The investigations into the charge based technique would allow the
embedded hardware to be used within a battery charger, modulating the
charge current
Data export allows historic trends to be identified
Comparison and applications of the PRBS test modes
The PRBS test schemes described in the previous sections have attributes that make
them more suitable for some test modes than others. Table 25 summarises the relative
benefits of each test type.

281
Table 25. Comparison of PRBS test modes
PRBS test method Discharge Charge Bipolar Mode Current Current/Voltage Current
Advantages Low hardware count Can be implemented as
part of the charge
process. Can be run
continuously in this
mode.
Close to zero net effect on
battery state. Long
duration tests are
possible.
Facilitates mean DC
terminal voltage
measurement.
Disadvantages Consumes energy,
discharges battery to
some extent. Long
duration tests not
possible.
Can only be used while a
charge source is
available.
Most complex to
implement.
Indicators SoC, SoH, SoF less
effective at 100% SoC
SoC, SoH, SoF, charge
phase endpoint detection
SoC, SoH, SoF, battery
efficiency
Applications Portable equipment,
hand held battery test
apparatus.
Battery chargers, UPS
systems
Battery chargers, UPS
systems, standalone
battery evaluation
systems.
13.2 Further work
The work carried out within this research has yielded much information regarding
the application of diverse modes of frequency rich signals to test batteries.
Opportunities for further work now exist in expanding and refining these techniques
with in application test data. The developed commercial module as discussed in
chapter 13 will form a basis for pushing the work further, as despite the limitations
on the processing capability of commodity microcontrollers the deployment of a
mass produced unit with the ability of returning field data represents a massive
opportunity for system refinement. Referring to the block diagram in Figure 165,
improvement of the existing developed hardware is required, and algorithms

282
developed to exploit the discoveries relating to mean terminal voltage, impedance
trends over the test methods with SoC, and the effects of temperature.
Decision engine
Battery impedance
Battery temperature
Mean Terminal Voltage
State of Charge
State of Health
Figure 165. SoH/SoC evaluation system
The development of genetic algorithms for this system improvement itself would
form the basis of a body of work which could be expanded to encompass increasing
data as the hardware evolves with falling costs of processing and memory.
Opportunities for further work exist in repeating the experiment with a lower
chamber temperature (over a longer period) to reinforce the results and inform
further analysis of the battery types. Using automated testing gives opportunities for
driving batteries to failure at rated ambient temperatures, as the cycle life of the
subject batteries may only be in the 1200-1500 range for these types. As such it is
feasible to drive a battery to failure at 20°C ambient in under a year. Furthermore,
realisation of the developed tests within a marketable product could inform these

283
techniques with the use of SPC and data collection from the field. The features unique
to each of the load, charge and bipolar techniques when combined form a powerful
addition to the pre-existing battery testing technologies, and further work in
exploiting the charge end point detection capability of the charge technique shows
great promise.
The increased capability of microprocessors generally has facilitated the growth of
the “internet of things” and this in turn opens up opportunities for more accurate
methods of battery testing. The ability to export historical data to a host system now
allows evolution of battery test algorithms based on this data. Additionally, the
ability to upload new firmware into these systems not only allows the evolution of
the data interpretation, but enables the testing schemes themselves to evolve
throughout the life of their operation.
.

284
14. References
1. Ribeiro, P.F., et al., Energy storage systems for advanced power applications. Proceedings
of the IEEE, 2001. 89(12): p. 1744-1756.
2. Skyllas-Kazacos, M. and C. Menictas. The vanadium redox battery for emergency back-up
applications. in Telecommunications Energy Conference, 1997. INTELEC 97., 19th
International. 1997.
3. Williams, B.R. and T. Hennessy, Energy oasis [vanadium redox battery system in power
distribution application]. Power Engineer, 2005. 19(1): p. 28-31.
4. European Photovoltaic Industry Association. Self consumption of PV electricity.
Updated: 2013 [cited 2013 27/09/2013]; Available from:
http://www.epia.org/fileadmin/user_upload/Position_Papers/Self_and_direct_consu
mption_-_position_paper_-_final_version.pdf.
5. Poonpun, P. and W.T. Jewell, Analysis of the Cost per Kilowatt Hour to Store Electricity.
Energy Conversion, IEEE Transactions on, 2008. 23(2): p. 529-534. DOI:
10.1109/tec.2007.914157.
6. Porsche. Ferdinand Porsche. Updated: 2013 [cited 2013 27/09/2013]; History of
Porsche]. Available from:
http://www.porsche.com/uk/accessoriesandservice/classic/philosophyandclassicwor
ld/world/tradition/ferdinand/.
7. Porsche Cars North America. Prof. Ferdinand Porsche created the first functional hybrid
car. Updated: 2013 [cited 2013 26/10/2013]; Available from:
http://press.porsche.com/news/release.php?id=642.
8. Nissan USA. Nissan Leaf webpage. Updated: 2015 [cited 2015 19/03/2015]; Available
from: http://www.nissanusa.com/electric-cars/leaf/charging-range/battery/.
9. J Gartner, C.W. Electric Vehicle Batteries - Lithium Ion Batteries for Plug-in Hybrid and
Battery Electric Vehicles: Market Analysis and Forecasts. Updated: 2009 26th November
2010; Available from: https://www.pikeresearch.com/wp-
content/uploads/2009/12/EVB-09-Executive-Summary.pdf.
10. House of Lords European Union committee. "The EU’s Target for Renewable Energy:
20% by 2020". Updated: 2008 10/12/2010; Available from:
http://www.publications.parliament.uk/pa/ld200708/ldselect/ldeucom/175/175.pdf.
11. Evonik Industries AG. "Evonik developing the world's largest lithium ceramic battery".
Updated: 2010 10/12/2010; Available from:
http://corporate.evonik.com/en/media/press_releases/pages/news-
details.aspx?newsid=10312.
12. Bush, S. (2014) More on: Toshiba supplies UK with 1MW smart grid battery. Electronics
Weekly, Available from:
http://www.electronicsweekly.com/news/design/power/toshiba-supplies-uk-1mw-
smart-grid-battery-2-2014-07/.

285
13. Coleman, M., et al., State-of-Charge Determination From EMF Voltage Estimation: Using
Impedance, Terminal Voltage, and Current for Lead-Acid and Lithium-Ion Batteries.
Industrial Electronics, IEEE Transactions on, 2007. 54(5): p. 2550-2557. DOI:
doi:10.1016/j.apenergy.2008.11.021.
14. Nguyen, K.S., et al., Enhanced coulomb counting method for estimating state-of-charge and
state-of-health of lithium-ion batteries. Applied Energy, 2009. 86(9): p. 1506-1511.
15. Gruber, P.W., et al., Global Lithium Availability. Journal of Industrial Ecology, 2011.
15(5): p. 760-775. DOI: 10.1111/j.1530-9290.2011.00359.x.
16. Linden, D. and T.B. Reddy, Handbook of batteries. 4th ed. McGraw-Hill handbooks.
2010, New York: McGraw-Hill. 1 v. (various pagings).007162421-X
17. Yuasa Battery Europe. Yuasa NP Valve Regulated Lead Acid Battery Manual. NP VRLA
Application Manual [Application Manual] Updated: 1999 1/12/99; 1:[1, 2, 5, 6, 7, 8, 9,
12, 22, 24, 27, 29]. Available from: http://www.yuasa-
battery.co.uk/industrial/downloads.html.
18. ABB. GM and ABB demonstrate Chevrolet Volt Battery Reuse – world’s first use of electric
vehicle batteries for homes Updated: 2012 [cited 2013 27/09/2013]; Available from:
http://www.abb.co.uk/cawp/seitp202/8cb38a9d23816174c1257ab500497848.aspx.
19. BMW group. BMW Group and Vattenfall start a new research project for the secondary use
of high-voltage storage from electric vehicle. Enlarging the global test program under real
application conditions - batteries from the MINI E and the BMW ActiveE will be used as a
stationary power storage. Updated: 2013 [cited 2013 27/9/2013]; BMW Group press
release]. Available from:
https://www.press.bmwgroup.com/pressclub/p/de/pressDetail.html?title=bmw-
group-und-vattenfall-starten-neues-forschungsprojekt-zur-zweitverwendung-von-
hochvoltspeichern&outputChannelId=7&id=T0145187DE&left_menu_item=node__2
367.
20. Elsevier. Scopus website. Updated: 2013 [cited 2013 14th June 2013]; Available from:
www.scopus.com.
21. UK Government Department for Transport. Number of newly registered ultra low
emissions vehicles. Updated: 2013 [cited 2013 27/09/2013]; Available from:
https://www.gov.uk/government/publications/number-of-newly-registered-ultra-
low-emissions-vehicles.
22. Rolls Battery Engineering. Rolls Battery Engineering Battery User Manual. Updated:
2014 [cited 2015 16/03/15]; Available from:
http://rollsbattery.com/public/docs/user_manual/Rolls_Battery_Manual.pdf.
23. Trojan Battery Company. Trojan Battery Company website. Updated: 2013 [cited 2013
17/8/2013]; Available from: http://www.trojanbattery.com/Tech-
Support/TechSupport.aspx.
24. EnerSys Reserve Power. Cyclon Application Manual. Updated: 2004 [cited 2013
24/08/2013]; 5th Edition:[US-CYC-AM-005]. Available from:
286
http://www.enersysreservepower.com/pdfs/US-CYC-AM-
005_0604%20Application%20Manual.pdf.
25. Ma, H., F. Cheng, and J. Chen, Nickel-Metal Hydride (Ni-MH) Rechargeable Batteries, in
Electrochemical Technologies for Energy Storage and Conversion. 2011, Wiley-VCH Verlag
GmbH & Co. KGaA. p. 175-237.9783527639496
26. Battery Council International. Battery Council website. Updated: 2013 [cited 2013
05/07/2013]; Available from: http://batterycouncil.org/?page=Battery_Recycling.
27. Yuasa Battery, E. Yuasa Battery Europe Web site. Updated: 2014 [cited 2015 08/03/2015];
Available from: http://www.yuasaeurope.com/en-gb/.
28. Westbrook, M.H., The electric car : development and future of battery, hybrid and fuel-cell
cars. 2001, London: Institution of Electrical Engineers.0852960131 : ¹36.00
29. Ji, K., et al., Electrodeposited lead-foam grids on copper-foam substrates as positive current
collectors for lead-acid batteries. Journal of Power Sources, 2014. 248(0): p. 307-316. DOI:
http://dx.doi.org/10.1016/j.jpowsour.2013.09.112.
30. Moseley, P.T., D.A.J. Rand, and B. Monahov, Designing lead–acid batteries to meet energy
and power requirements of future automobiles. Journal of Power Sources, 2012. 219(0): p.
75-79. DOI: http://dx.doi.org/10.1016/j.jpowsour.2012.07.040.
31. Rand, D.A.J., Valve-regulated lead-acid batteries. 1st ed. 2004, Amsterdam ; Boston:
Elsevier. xxv, 575 p.0444507469
32. Ohmae, T., et al., Advanced technologies in VRLA batteries for automotive applications.
Journal of Power Sources, 2006. 154(2): p. 523-529. DOI:
http://dx.doi.org/10.1016/j.jpowsour.2005.10.049.
33. Bentley, P. and D.A. Stone. The parallel combination of a valve regulated lead acid cell and
supercapacitor for use as a hybrid vehicle peak power buffer. in Power Electronics and
Applications, 2005 European Conference on. 2005. DOI:
http://dx.doi.org/10.1109/EPE.2005.219586.
34. Bentley, P., The use of Valve Regulated Sealed Lead Acid Batteries in Hybrid Electric
Vehicles, in Department of Electrical Machines and Drives. 2004, University of Sheffield:
Sheffield
35. Ebonex Technologies Ltd. Atraverda Batteries website. Updated: 2010 [cited 2010
29/11/2010]; Available from: http://www.atraverda.co.uk.
36. Bullock, K.R., Carbon reactions and effects on valve-regulated lead-acid (VRLA) battery cycle
life in high-rate, partial state-of-charge cycling. Journal of Power Sources, 2010. 195(14):
p. 4513-4519. DOI: http://dx.doi.org/10.1016/j.jpowsour.2009.10.027.
37. Moseley, P.T., R.F. Nelson, and A.F. Hollenkamp, The role of carbon in valve-regulated
lead–acid battery technology. Journal of Power Sources, 2006. 157(1): p. 3-10. DOI:
http://dx.doi.org/10.1016/j.jpowsour.2006.02.031.

287
38. Pavlov, D. and P. Nikolov, Capacitive carbon and electrochemical lead electrode systems at
the negative plates of lead–acid batteries and elementary processes on cycling. Journal of
Power Sources, 2013. 242(0): p. 380-399. DOI:
http://dx.doi.org/10.1016/j.jpowsour.2013.05.065.
39. Devitt, J., An account of the development of the first valve-regulated lead/acid cell. Journal
of Power Sources, 1997. 64(1–2): p. 153-156. DOI: http://dx.doi.org/10.1016/S0378-
7753(96)02516-5.
40. Optima Batteries. Optima batteries website. Updated: 2013 [cited 2013 14/11/13];
Available from: http://www.optimabatteries.com/us/en/technology/spiralcell-
technology/.
41. Bhangu, B.S., et al. Observer techniques for estimating the state-of-charge and state-of-health
of VRLABs for hybrid electric vehicles. in Vehicle Power and Propulsion, 2005 IEEE
Conference. 2005.
42. Lam, L.T. and R. Louey, Development of ultra-battery for hybrid-electric vehicle
applications. Journal of Power Sources, 2006. 158(2): p. 1140-1148. DOI:
10.1016/j.jpowsour.2006.03.022.
43. Furukawa Electric. Furukawa review no. 43. Updated: 2013 [cited 2015 8/3/2015];
Available from: http://www.furukawa.co.jp/review/fr043/fr43_02.htm#searchform.
44. East Penn Manufacturing. East Penn Manufacturing, UltraBattery. Updated: 2014 [cited
2015 8/3/2015]; Available from: http://www.eastpennmanufacturing.com/tag/deka-
ultrabattery/.
45. Jungner, E.W., Process of making active material for accumulator-plates. 1901, Google
Patents
46. Panasonic Industrial Batteries. Panasonic Industrial Batteries website. Updated: 2013
[cited 2013 17/08/2013]; Available from:
http://www.panasonic.com/industrial/batteries-oem/oem/lithium-ion.aspx.
47. EUROPEAN, T.E.P.A.T.C.O.T. and UNION, DIRECTIVE 2006/66/EC OF THE
EUROPEAN PARLIAMENT AND OF THE COUNCIL on batteries and accumulators and
waste batteries and accumulators and repealing Directive 91/157/EEC, E. Union, Editor.
2006: Strasbourg DOI: 6th September 2006.
48. Alcad Ltd. Alcad Batteries website. Updated: 2013 17/08/13]; Available from:
http://www.alcad.com/Products/Nickel-Cadmium-single-cell-batteries.
49. Sato, Y., et al., Possible Cause of the Memory Effect Observed in Nickel‐Cadmium Secondary
Batteries. Journal of The Electrochemical Society, 1996. 143(10): p. L225-L228. DOI:
10.1149/1.1837152.
50. Power-Sonic Inc. Power-Sonic Inc NiCd & NiMH Batteries and chargers. Updated: 2015
[cited 2015 21/03/15]; Available from: http://www.power-
sonic.com/nickel_cadmium_n_nimh.php.

288
51. K.D. Beccu, B.-G., Elektrode zur Speicherung und Aktivierung von Wasserstoff". 1973:
Switzerland
52. Bergveld, H.J., W.S. Kruijt, and P.H.L. Notten, Battery management systems : design by
modelling. Philips Research v. 1. 2002, Dordrecht ; Boston: Kluwer Academic. xxv, 295
p.1402008325 (hb alk. paper)
53. Bumblebee Batteries LLC. Bumblebee Batteries LLC website. Updated: 2015 [cited 2015
13/03/2015]; Bumblebee Batteries - Honda Insight]. Available from:
http://bumblebeebatteries.com/honda-hybrid-batteries/.
54. Toyota Motor Sales, U.S.A.I. Toyota Safety and Quality communications webpage -
batteries. Updated: 2015; Available from:
http://www.toyota.com/esq/vehicles/batteries/nickel-metal-hydride.html.
55. Al-Thyabat, S., et al., Adaptation of minerals processing operations for lithium-ion (LiBs)
and nickel metal hydride (NiMH) batteries recycling: Critical review. Minerals Engineering,
2013. 45(0): p. 4-17. DOI: http://dx.doi.org/10.1016/j.mineng.2012.12.005.
56. Larsson, K., C. Ekberg, and A. Ødegaard-Jensen, Dissolution and characterization of
HEV NiMH batteries. Waste Management, 2013. 33(3): p. 689-698. DOI:
http://dx.doi.org/10.1016/j.wasman.2012.06.001.
57. Sony Corporation. Expanding from the Development of Olivine-Type Lithium-Ion Iron
Phosphate Storage Batteries to Include Other Peripheral Devices. Updated: 2014 [cited 2015
21/03/2015]; Available from:
http://www.sony.net/SonyInfo/csr_report/environment/climate/ghg/products/index
4.html.
58. Commission, I.E., IEC 60086-2 Primary batteries: Physical and Electrical specifications.
2006, IEC: Geneva
59. Jaffe, S. (2013) The Lithium Ion Inflection point. Battery Power Magazine, Available
from: http://www.batterypoweronline.com/main/articles/the-lithium-ion-inflection-
point/.
60. Wang, Q., et al., Thermal runaway caused fire and explosion of lithium ion battery. Journal
of Power Sources, 2012. 208(0): p. 210-224. DOI:
http://dx.doi.org/10.1016/j.jpowsour.2012.02.038.
61. Yufei, C., S. Li, and J.W. Evans. Modeling studies on battery thermal behaviour, thermal
runaway, thermal management, and energy efficiency. in Energy Conversion Engineering
Conference, 1996. IECEC 96., Proceedings of the 31st Intersociety. 1996. DOI:
10.1109/iecec.1996.553943.
62. A123 systems LLC. "A123 Systems Opens the Largest Lithium Ion Automotive Battery
Manufacturing Plant in North America". Updated: [cited 2010 7/12/10]; Available from:
http://ir.a123systems.com/releasedetail.cfm?ReleaseID=506787.

289
63. Ying, W. and C. Guozhong, Nanostructured materials for advanced Li-Ion rechargeable
batteries. Nanotechnology Magazine, IEEE, 2009. 3(2): p. 14-20.
64. Altair Nanotechnologies. Altairnano’s advanced energy storage systems provide
fundamental advantages over existing, traditional lithium-ion battery designs. Updated:
2010 [cited 2015 22/03/2015]; Available from:
http://www.altairnano.com/products/performance/.
65. Lee, S.W., et al., High-power lithium batteries from functionalized carbon-nanotube
electrodes. Nat Nano, 2010. 5(7): p. 531-537. DOI:
http://www.nature.com/nnano/journal/v5/n7/abs/nnano.2010.116.html#supplementa
ry-information.
66. Mirzaeian, M. and P.J. Hall. Nano structure carbons for energy storage in lithium oxygen
batteries. in Sustainable Power Generation and Supply, 2009. SUPERGEN '09. International
Conference on. 2009.
67. Moriguchi, K., et al., Nano-tube-like surface structure in graphite particles and its formation
mechanism: A role in anodes of lithium-ion secondary batteries. Journal of Applied Physics,
2000. 88(11): p. 6369-6377.
68. Hanafusa, H., SANYO’s SMART ENERGY SYSTEM CONSISTS OF 1.5 MWh Li-ion
BATTERY AND 1 MW PV SOLAR SYSTEM, in Electrical Energy Storage Applications &
Technologies (EESAT) Conference 2011. 2011: San Diego, CA
69. Lombardi, C. (2009) Mazda, Think, EnerDel partner on electric rentals. CNET, Available
from: http://www.cnet.com/uk/news/mazda-think-enerdel-partner-on-electric-
rentals/.
70. Graber, K. (2012) Electrovaya Delivers 1.5 MWH Lithium Ion Battery-Based Energy Storage
System to Arizona Public Service Company. Available from:
http://www.electrovaya.com/pdf/PR/2012/PR20120223.pdf.
71. Mitsubishi Heavy Industries. MHI to Introduce Large-capacity Lithium-ion Battery
Energy Storage System To Power Grid of Orkney Islands in UK, Jointly with SSE. Updated:
2012 [cited 2015 22/03/2015]; Available from: https://www.mhi-
global.com/news/story/1211221593.html.
72. Valence advanced energy storage solutions. Backup Power for UPS and Micro Grid.
Updated: 2014 [cited 2015 22/03/2015]; Available from:
https://www.valence.com/solutions/backup/.
73. Kang, D.H.P., M. Chen, and O.A. Ogunseitan, Potential Environmental and Human
Health Impacts of Rechargeable Lithium Batteries in Electronic Waste. Environmental
Science & Technology, 2013. 47(10): p. 5495-5503. DOI: 10.1021/es400614y.
74. Xu, J., et al., A review of processes and technologies for the recycling of lithium-ion secondary
batteries. Journal of Power Sources, 2008. 177(2): p. 512-527. DOI:
http://dx.doi.org/10.1016/j.jpowsour.2007.11.074.

290
75. Mizushima, K., et al., LixCoO2 (0<x<-1): A new cathode material for batteries of high
energy density. Materials Research Bulletin, 1980. 15(6): p. 783-789. DOI:
http://dx.doi.org/10.1016/0025-5408(80)90012-4.
76. Yoon, Y., et al., Lattice orientation control of lithium cobalt oxide cathode film for all-solid-
state thin film batteries. Journal of Power Sources, 2013. 226(0): p. 186-190. DOI:
http://dx.doi.org/10.1016/j.jpowsour.2012.10.094.
77. Sakuda, A., A. Hayashi, and M. Tatsumisago, Electrochemical performance of all-solid-
state lithium secondary batteries improved by the coating of Li2O–TiO2 films on LiCoO2
electrode. Journal of Power Sources, 2010. 195(2): p. 599-603. DOI:
http://dx.doi.org/10.1016/j.jpowsour.2009.07.037.
78. Zero Motorcycles Specification. Zero motorcycles product specification. [Manufacturers
web page] Updated: 2013 [cited 2013 22/11/2013]; Available from:
http://www.zeromotorcycles.com/zero-s/specs.php.
79. Lu, L., et al., A review on the key issues for lithium-ion battery management in electric
vehicles. Journal of Power Sources, 2013. 226(0): p. 272-288. DOI:
http://dx.doi.org/10.1016/j.jpowsour.2012.10.060.
80. Super B Batteries. Super B Batteries. Updated: 2013 [cited 2013 4/10/2013]; Available
from: http://www.super-b.com.
81. Krieger, E.M., J. Cannarella, and C.B. Arnold, A comparison of lead-acid and lithium-
based battery behavior and capacity fade in off-grid renewable charging applications. Energy,
2013. 60(0): p. 492-500. DOI: http://dx.doi.org/10.1016/j.energy.2013.08.029.
82. Fenton, D.E., J.M. Parker, and P.V. Wright, Complexes of alkali metal ions with
poly(ethylene oxide). Polymer, 1973. 14(11): p. 589. DOI: http://dx.doi.org/10.1016/0032-
3861(73)90146-8.
83. Tobishima, S.I. and J.I. Yamaki, A consideration of lithium cell safety. Journal of Power
Sources, 1999. 81-82: p. 882-886.
84. Maxwell Technologies. Maxwell Technologies website. Updated: 2015 [cited 2015
8/03/2015]; Available from: http://www.maxwell.com/products/ultracapacitors.
85. Liyan, Q. and Q. Wei, Constant Power Control of DFIG Wind Turbines With
Supercapacitor Energy Storage. Industry Applications, IEEE Transactions on, 2011.
47(1): p. 359-367. DOI: 10.1109/tia.2010.2090932.
86. Miller, J.M. Energy storage technology markets and application’s: ultracapacitors
in combination with lithium-ion. in Power Electronics, 2007. ICPE '07. 7th Internatonal
Conference on. 2007. DOI: 10.1109/icpe.2007.4692343.
87. Conway, B.E., Electrochemical supercapacitors : scientific fundamentals and technological
applications. 1999, New York: Plenum Press. xxviii, 698 p.0306457369

291
88. Wima Spezialvertrieb elektronischer Bauelemente GmbH & Co.KG. Wima SuperCap
R product webpage. Updated: 2015 [cited 2015 8/03/2015]; Available from:
http://www.wima.cn/EN/supercap_r_1.htm.
89. Burke, J.R.M.a.A.F., Electrochemical Capacitors: Challenges and Opportunities for Real-
World Applications. The Electrochemical Society's Interface, 2008. 17(1).
90. Ellis, M.W., M.R. von Spakovsky, and D.J. Nelson, Fuel cell systems: efficient, flexible
energy conversion for the 21st century. Proceedings of the IEEE, 2001. 89(12): p. 1808-
1818. DOI: 10.1109/5.975914.
91. Burke, K.A., High energy density regenerative fuel cell systems for terrestrial applications.
Aerospace and Electronic Systems Magazine, IEEE, 1999. 14(12): p. 23-34. DOI:
10.1109/62.811091.
92. Aso, S., M. Kizaki, and Y. Nonobe. Development of Fuel Cell Hybrid Vehicles in TOYOTA.
in Power Conversion Conference - Nagoya, 2007. PCC '07. 2007. DOI:
10.1109/pccon.2007.373179.
93. Hua, T., et al., Status of hydrogen fuel cell electric buses worldwide. Journal of Power
Sources, 2014. 269(0): p. 975-993. DOI:
http://dx.doi.org/10.1016/j.jpowsour.2014.06.055.
94. Kohler, J., et al. Infrastructure investment for a transition to hydrogen road vehicles. in
Infrastructure Systems and Services: Building Networks for a Brighter Future (INFRA), 2008
First International Conference on. 2008. DOI: 10.1109/infra.2008.5439664.
95. Stolten, D. and B. Emonts, Fuel cell science and engineering : materials, processes, systems
and technology. 2012, Weinheim: Wiley-VCH ; [Chichester : John Wiley,
distributor].9783527330126
96. Srinivasan, S., Fuel cells : from fundamentals to applications. 2006, New York, N.Y.:
Springer.9780387251165 (hbk.) : ¹59.00
97. Symons, P.C., Process for electrical energy using solid halogen hydrate, U.S.P. Office,
Editor. 1973: United States of America
98. Garche, J., Encyclopedia of electrochemical power sources. 2009, Boston, MA:
Elsevier.9780444520937
99. Sumitomo Electric Industries Ltd. Sumitomo Electric Commences the Demonstration of
Megawatt-Class Power Generation/Storage System at Yokohama Works Updated: 2012
[cited 2013 09/08/2013]; Press release, Sumitomo Electric Industries Ltd]. Available
from: http://global-sei.com/news/press/12/prs069_s.html.
100. Renewable Energy Dynamics Technology Ltd. REDT Website. Updated: 2013 [cited
2013 17/08/2013]; REDT company website]. Available from:
http://www.poweringnow.com/.

292
101. Mohamed, M.R., S.M. Sharkh, and F.C. Walsh. Redox flow batteries for hybrid electric
vehicles: Progress and challenges. in Vehicle Power and Propulsion Conference, 2009. VPPC
'09. IEEE. 2009. DOI: 10.1109/vppc.2009.5289801.
102. Smith, G., Storage batteries; including operation, charging, maintenance and repair. 2nd ed.
1971, London,: Pitman. xiii, 231 p.0273360876
103. Lam, L.T., et al., VRLA Ultrabattery for high-rate partial-state-of-charge operation. Journal
of Power Sources, 2007. 174(1): p. 16-29. DOI: 10.1016/j.jpowsour.2007.05.047.
104. Cooper, A., et al., The UltraBattery—A new battery design for a new beginning in hybrid
electric vehicle energy storage. Journal of Power Sources, 2009. 188(2): p. 642-649. DOI:
10.1016/j.jpowsour.2008.11.119.
105. Csiro. Csiro website - Ultrabattery FAQs. Updated: 2013 [cited 2013 24/08/13]; Available
from: http://www.csiro.au/en/Outcomes/Energy/Renewables-and-Smart-
Systems/Ultra-Battery-FAQs.aspx.
106. Saft Battery Group. Saft Battery Website. Updated: 2015 [cited 2015 18/03/2015];
Available from: http://www.saftbatteries.com/.
107. Horowitz, P. and W. Hill, The art of electronics. 1989: Cambridge University Press
108. Samsung SDI. Samsung Lithium Ion battery products websit. Updated: 2015 [cited 2015
17/03/2015]; Available from: http://www.samsungsdi.com/lithium-ion-
battery/overview.
109. Amperex Technology Ltd. Amperex Technology Ltd Website. Updated: 2015 [cited 2015
17/03/2015]; Available from: http://www.atlbattery.com/products/en/product-1.htm.
110. E-One Moli Energy. Molicel Rechargeable Lithium-Ion Batteries. Updated: 2008 [cited
2010 29/10/10]; Available from: http://www.molicel.com/ca/products.html.
111. Varta Microbattery GmbH. Varta Microbattery Products Website. Updated: 2015 [cited
2015 17/03/2015]; Available from: http://www2.varta-
microbattery.com/en/oempages/product_data/poductdata_types.php?output=typed
ata&segment=RechLiFlatPoly.
112. Elmer, T., et al., Fuel cell technology for domestic built environment applications: State of-
the-art review. Renewable and Sustainable Energy Reviews, 2015. 42(0): p. 913-931.
DOI: http://dx.doi.org/10.1016/j.rser.2014.10.080.
113. Joerissen, L., et al., Possible use of vanadium redox-flow batteries for energy storage in small
grids and stand-alone photovoltaic systems. Journal of Power Sources, 2004. 127(1–2): p.
98-104. DOI: http://dx.doi.org/10.1016/j.jpowsour.2003.09.066.
114. Pascoe, P.E. and A.H. Anbuky, The behaviour of the coup de fouet of valve-regulated lead–
acid batteries. Journal of Power Sources, 2002. 111(2): p. 304-319. DOI:
http://dx.doi.org/10.1016/S0378-7753(02)00316-6.

293
115. de Oliveira, C.P. and M.C. Lopes, Early stages of the lead-acid battery discharge. Journal
of Power Sources, 2004. 138(1–2): p. 294-300. DOI:
http://dx.doi.org/10.1016/j.jpowsour.2004.06.009.
116. Berndt, D. and E. Voss. Proceedings of the Fourth International Symposium. 1964.
Brighton.
117. Pavlov, D., et al., Hydration and Amorphization of Active Mass PbO2 Particles and Their
Influence on the Electrical Properties of the Lead‐Acid Battery Positive Plate. Journal of The
Electrochemical Society, 1989. 136(11): p. 3189-3197. DOI: 10.1149/1.2096424.
118. Pavlov, D., The Lead‐Acid Battery Lead Dioxide Active Mass: A Gel‐Crystal System with
Proton and Electron Conductivity. Journal of The Electrochemical Society, 1992. 139(11):
p. 3075-3080. DOI: 10.1149/1.2069034.
119. Manenti, A., S. Onori, and Y. Guezennec. A new modeling approach to predict 'Peukert
effect' for lead acid batteries. in IFAC Proceedings Volumes (IFAC-PapersOnline). 2011.
DOI: 10.3182/20110828-6-it-1002.03659.
120. Peukert, W., Über die Abhängigkeit der Kapazität von der Entladestromstärke bei
Bleiakkumulatoren. Elektrotechnische Zeitschrift 20, 1897.
121. Doerffel, D. and S.A. Sharkh, A critical review of using the Peukert equation for
determining the remaining capacity of lead-acid and lithium-ion batteries. Journal of Power
Sources, 2006. 155(2): p. 395-400.
122. Serrao, L., et al. An aging model of Ni-MH batteries for hybrid electric vehicles. in Vehicle
Power and Propulsion, 2005 IEEE Conference. 2005. DOI: 10.1109/vppc.2005.1554536.
123. Swoboda, C.A., et al., Development of an Ultrasonic Technique to Measure Specific Gravity
in Lead-Acid Battery Electrolyte. Sonics and Ultrasonics, IEEE Transactions on, 1983.
30(2): p. 69-77. DOI: 10.1109/t-su.1983.31389.
124. Nagai, Y., Y. Tomokuni, and T. Matsui. Optical-Type Hydrometer for Lead-Acid Batteries
and its Applications. in Telecommunications Energy Conference, 1987. INTELEC '87. The
Ninth International. 1987. DOI: 10.1109/intlec.1987.4794631.
125. Fairweather, A.J., Analysis of false battery failure reporting in single load pulse battery test
schemes. 2000, Bulgin Power Source PLC: Lincoln, UK
126. Coleman, M., W.G. Hurley, and L. Chin Kwan, An Improved Battery Characterization
Method Using a Two-Pulse Load Test. Energy Conversion, IEEE Transactions on, 2008.
23(2): p. 708-713.
127. Ashley, G.H., Proposed battery testing methods for the Ulyssees project 1999, Bulgin Power
Source: Lincoln
128. Bolgeo, R.T., IEEE Recommended Practice for Maintenance, Testing, and Replacement of
Vented Lead-Acid Batteries for Stationary Applications. IEEE Std 450-1995, 1995: p. 1-32.
DOI: 10.1109/ieeestd.1995.79541.

294
129. Cantor, W.P., IEEE Recommended Practice for Maintenance, Testing, and Replacement of
Valve-Regulated Lead-Acid (VRLA) Batteries for Stationary Applications. IEEE Std 1188-
1996, 1996: p. i. DOI: 10.1109/ieeestd.1996.81039.
130. Leksono, E., et al. State of charge (SoC) estimation on LiFePO<inf>4</inf> battery module
using Coulomb counting methods with modified Peukert. in Rural Information &
Communication Technology and Electric-Vehicle Technology (rICT & ICeV-T), 2013 Joint
International Conference on. 2013. DOI: 10.1109/rICT-ICeVT.2013.6741545.
131. Barsoukov, E. and J.R. Macdonald, Impedance spectroscopy : theory, experiment, and
applications. 2nd ed. 2005, Hoboken, N.J. [Chichester]: Wiley-Interscience. xvii, 595
p.0471647497 (hbk.)
132. Hioki EE Corporation. BATTERY HiTESTER 3554. Updated: 2009 [cited 2015
13/03/2015]; Hioki EE Website]. Available from:
https://www.hioki.com/products/lcr_resistance_signal/lcr_resistance_meters/544.
133. J.L. Jespersen, A.E.T., K. Nørregaard, L. Overgaard, F. Elefsen. Capacity Measurements
of Li-Ion Batteries using AC Impedance Spectroscopy. in EVS24. 2009. Stavanger, Norway.
134. Yi-Feng, L., et al. AC impedance technique for dynamic and static state of charge analysis for
Li-ion battery. in Consumer Electronics (ISCE), 2013 IEEE 17th International Symposium
on. 2013. DOI: 10.1109/isce.2013.6570268.
135. Texas Instruments. bq77PL900 Five to Ten Series Cell Lithium-Ion or Lithium-Polymer
Battery Protector and Analog Front End. Updated: 2008 [cited 2015 19/03/2015];
Available from: http://www.ti.com/lit/ds/symlink/bq77pl900.pdf.
136. Texas Instruments. bq34z100 Wide range fuel gauge with impedance track technology.
Updated: 2012 [cited 2015 19/03/2015]; Available from:
http://www.ti.com/lit/ds/symlink/bq34z100.pdf.
137. Taylor, H.O., Telephone Receivers and Radio Telegraphy. Radio Engineers, Proceedings
of the Institute of, 1918. 6(1): p. 37-58. DOI: 10.1109/jrproc.1918.217354.
138. Suwarno and F. Donald. Frequency response analysis (FRA) for diagnosis of power
transformers. in Electrical Engineering/Electronics Computer Telecommunications and
Information Technology (ECTI-CON), 2010 International Conference on. 2010.
139. Bingham, C.M. and A.J. Fairweather, PhD Project meeting, use of PRBS in frequency
domain analysis of batteries. 2009: Sheffield
140. Cedric, T.M.M., R.W. Adi, and I. McLoughlin. Data concealment in audio using a
nonlinear frequency distribution of PRBS coded data and frequency-domain LSB insertion. in
TENCON 2000. Proceedings. 2000.
141. Jamieson, D.G. and T. Schneider, Electroacoustic evaluation of assistive hearing devices.
Engineering in Medicine and Biology Magazine, IEEE, 1994. 13(2): p. 249-254.

295
142. Vermeulen, H.J., J.M. Strauss, and V. Shikoana. On-line estimation of synchronous
generator parameters using PRBS perturbations. in Power Engineering Society General
Meeting, 2003, IEEE. 2003.
143. Melkonian, L. Improving A/D Converter Performance Using Dither. Updated: 1992 [cited
2015 11/04/2015]; Available from: http://www.ti.com/lit/an/snoa232/snoa232.pdf.
144. Davies, W.D.T., System identification for self-adaptive control. 1970, London, New York,:
Wiley-Interscience. xiv, 380 p.0471198854
145. Alfke, P. (1996) Efficient Shift Registers, LFSR, Counters, and Long Pseudo-Random
Sequence Generators. Available from:
http://www.xilinx.com/support/documentation/application_notes/xapp052.pdf.
146. Hampton, R.L.T., A hybrid analog-digital pseudo-random noise generator, in Proceedings of
the April 21-23, 1964, spring joint computer conference. 1964, ACM: Washington, D.C. p.
287-301 DOI: 10.1145/1464122.1464152.
147. Davidson, J.N., et al., Improved bandwidth and noise resilience in thermal impedance
spectroscopy by mixing PRBS signals. Power Electronics, IEEE Transactions on, 2013.
PP(99): p. 1-1. DOI: 10.1109/tpel.2013.2288936.
148. Tlili, C., et al., Electrochemical impedance probing of DNA hybridisation on oligonucleotide-
functionalised polypyrrole. Talanta, 2005. 68(1): p. 131-137.
149. Feliu, S., et al., The determination of the corrosion rate of steel in concrete by a non-stationary
method. Corrosion Science, 1986. 26(11): p. 961-965, 967-970.
150. Randles., J.E., Kinetics of rapid electrode reactions. Discuss. Faraday Soc. , 1947(1): p. 11.
151. Bhangu, B.S., et al., Nonlinear observers for predicting state-of-charge and state-of-health of
lead-acid batteries for hybrid-electric vehicles. Vehicular Technology, IEEE Transactions
on, 2005. 54(3): p. 783-794.
152. Cverna, F., ASM ready reference. Thermal properties of metals. 2002, Materials Park, Ohio:
ASM International.0871707683
153. VxI Power Ltd. Oracle 200E product webpage. Updated: 2012 [cited 2012 20/07/2012];
Oracle 200E product webpage]. Available from:
http://www.vxipower.com/product_pdetail_200-Watt---Oracle-III-200e_140.htm.
154. Pintelon, R. and J. Schoukens, System identification : a frequency domain approach. 2001,
New York: IEEE Press. xxxviii, 605 p.0780360001
155. Schwarzenbach, J. and K.F. Gill, System modelling and control. 2nd ed. 1984, London ;
Baltimore, Md.: E. Arnold. xi, 322 p.0713135182 (pbk.)
156. Microchip Technology Inc. Explorer 16 Development Board User’s Guide. Updated: 2005
[cited 2010 20/6/2010]; Available from:
http://ww1.microchip.com/downloads/en/DeviceDoc/51589a.pdf.

296
157. Microchip Technology Inc. dsPIC33F Family Data Sheet. [Manufacturer's datasheet]
Updated: 2005 23/06/14; DS70165A:[Available from:
http://ww1.microchip.com/downloads/en/DeviceDoc/70165a.pdf.
158. Salameh, Z.M., M.A. Casacca, and W.A. Lynch, A mathematical model for lead-acid
batteries. Energy Conversion, IEEE Transactions on, 1992. 7(1): p. 93-98. DOI:
10.1109/60.124547.
159. Bingjun, X., S. Yiyu, and H. Lei. A universal state-of-charge algorithm for batteries. in
Design Automation Conference (DAC), 2010 47th ACM/IEEE. 2010.
160. Fairweather, A.J., D.A. Stone, and M.P. Foster, Evaluation of UltraBattery™ performance
in comparison with a battery-supercapacitor parallel network. Journal of Power Sources,
2013. 226(0): p. 191-201. DOI: http://dx.doi.org/10.1016/j.jpowsour.2012.10.095.
161. Jossen, A., Fundamentals of battery dynamics. Journal of Power Sources, 2006. 154(2): p.
530-538. DOI: http://dx.doi.org/10.1016/j.jpowsour.2005.10.041.
162. Li, J. and M.A. Danzer, Optimal charge control strategies for stationary photovoltaic battery
systems. Journal of Power Sources, 2014. 258(0): p. 365-373. DOI:
http://dx.doi.org/10.1016/j.jpowsour.2014.02.066.
163. Stevens, J.W. and G.P. Corey. A study of lead-acid battery efficiency near top-of-charge and
the impact on PV system design. in Photovoltaic Specialists Conference, 1996., Conference
Record of the Twenty Fifth IEEE. 1996. DOI: 10.1109/pvsc.1996.564417.
164. Armenta-Deu, C. and M.V. Calvo-Baza, The initial voltage drop in lead–acid cells: the
influence of the overvoltage. Journal of Power Sources, 1998. 72(2): p. 194-202. DOI:
http://dx.doi.org/10.1016/S0378-7753(97)02733-X.
165. Fairweather, A.J., M.P. Foster, and D.A. Stone, State-of-Charge Indicators for VRLA
Batteries Utilising Pseudo Random Binary Sequences (PRBS), in PCIM Europe 2011. 2011:
Nuremberg, Germany
166. Fairweather, A.J., M.P. Foster, and D.A. Stone, Modelling of VRLA batteries over
operational temperature range using Pseudo Random Binary Sequences. Journal of Power
Sources, 2012. 207(0): p. 56-59. DOI: 10.1016/j.jpowsour.2012.02.024.
167. Sangyoung, P., K. Younghyun, and C. Naehyuck. Hybrid energy storage systems and
battery management for electric vehicles. in Design Automation Conference (DAC), 2013
50th ACM / EDAC / IEEE. 2013.
168. Jayasinghe, S.D.G., D.M. Vilathgamuwa, and U.K. Madawala. A direct integration
scheme for battery-supercapacitor hybrid energy storage systems with the use of grid side
inverter. in Applied Power Electronics Conference and Exposition (APEC), 2011 Twenty-
Sixth Annual IEEE. 2011. DOI: 10.1109/apec.2011.5744773.
169. Purvis, L., Frequency Domain Analysis of Batteries in an Embedded Systems Environment,
in Department of computer Science. 2013, University of Leicester: Leicester

297
170. Continental Batteries. Continental Batteries products website. Updated: 2012 [cited 2015
15/04/2015]; Available from: http://www.continentalbattery.com/products/87?q=ctx.

298
15. Appendices
15.1 AM-1 Combined mode battery test system
During the course of the research, several hardware and software based experimental
test systems were developed, which progressively evolved into the AM-1 combined
mode battery test system. The test system comprises battery charging and cycling
systems which operate autonomously, with the opportunity for external real time
control via a pc running an appropriate software control system, such as National
Instruments LabViewTM. The block diagram for the system can be seen in Figure 166.
The control system with the AM-1 is centred on a VxI Power Oracle 200E intelligent
power supply using custom firmware to autonomously control the system operation
from within the AMM-1 battery cycler module.
The firmware was written in assembly language to the on-board Microchip 16F877
microcontroller. The microcontroller card has external A-D conversion allowing 12
bit resolution measurements of voltage and current from within the power supply
itself and the connected batteries. D-A conversion is also available within the unit
which allows control of the internal battery charger. Within the VxI unit, a constant
current load module is provided for pulse battery testing, driven by digital I/O from
the microcontroller. A serial port is provided, allowing external control and
monitoring of the system parameters. Running the Modbus protocol, digital status
indications, digital inputs and analogue I/O are available via this port.

299
15.1.1 AM-1 system block diagram
EXTERNAL EQUIPMENT
ON/OFF
INTERLOCKING/SHUTDOWN
AMM1 BATTERY CYCLER WITH ON BOARD DATALOGGING
AMM3 TRI-MODE PRBS TEST SYSTEM
STATIC LOAD BANK (CYCLER AND CAPACITY
TESTS)
AMM2 BATTERY CHARGER
EXTERNAL EQUIPMENT ON/OFF
PO
WER
AN
D C
ON
TRO
L
PO
WER
AN
D C
ON
TRO
L
TEST BATTERY PERTURBATION
RS232/ETHERNET
HIGH SPEED DATA ACQUISITION
VOLTAGE/CURRENT
CH
AR
GE/
DIS
CH
AR
GE
TEM
PER
ATU
RE/
VO
LTA
GE/
CU
RR
ENT
Figure 166. Overall system block diagram, AM-1 battery test system
300
The firmware written for the cycler uses the Oracle 200E digital outputs and analogue
inputs to control the cycler itself. User input from the connected pc allows setting of
the number of cycles, enabling of the cycle mode, battery charge current, battery
disconnect point among other parameters.
In cycler mode the control from the Oracle unit controls the overall rack using 4
digital outputs which control the external loads and battery charger.
The cycler operates in 3 primary modes:
Mode 1 - Battery cycler with pre-set number of cycles
In the battery cycler mode the on board charger within the VxI unit is supplemented
with an external charger, controlled by the firmware. An external load, again
controlled by the firmware is used for the discharge portion of the cycle.
On initiation of a battery cycling test, the software enables the charging system for a
period of three hours. Additionally, if the test uses the external environmental
chamber this is also switch on by the firmware. After the charge timer has elapsed,
the chargers are disabled and the system enters discharge mode by connecting the
external load. The voltage of the battery is monitored via a 4 wire measurement
system during the discharge process, and is disconnected from the load at the EoD
voltage (an analogue setting within the user interface). At this point the charge cycle
begins again and the cycler counter is decremented. Once the cycler counter reaches
zero, the cycle count resets and the systems prepares the battery for the PRBS testing.
This comprises of turning the environmental chamber off, enabling the bulk and float

301
chargers, and recharging the battery. The bulk charge is enabled for three hours, and
then the system reverts to the float charger where it remains, charging the battery to
100% SoC.
Mode 2 - Single shot battery capacity measurement with deep discharge protection
In this mode the user sets the “charge disable” via the PC interface and enables the
discharge test. The software then enables the external load and the battery discharges
to the EoD Voltage at which point the load is disconnected. Optionally the equipment
can be set to automatically recharge the battery to 100% SoC, or remain at the EoD
state.
Mode 3 -Temperature compensated battery charger
This is the default mode of the system on power up. The system will charge the
connected battery via the on board charger to the float voltage level, which can be set
by the user, along with the magnitude of battery charge current.
The interface used for the system was based on Microsoft Excel with a third party
software package carrying out the Dynamic Data Exchange (DDE) between the
spreadsheet and the serial port communicating with the equipment. The interface
can be seen in figure 167.

302
Figure 167. Battery cycler interface screen
The interface incorporates a data log function allowing recording of any desired
group of analogue or digital parameters available on the RS232 port. The sampling
rate of the acquisition is typically in the 1 – 10 second range in line with recording
data during cycling and discharge tests of long duration. High speed acquisition is
carried out by the external IOTech data aquisition system (figure 168). Full
specifications for the system are found in appendix 15.6.
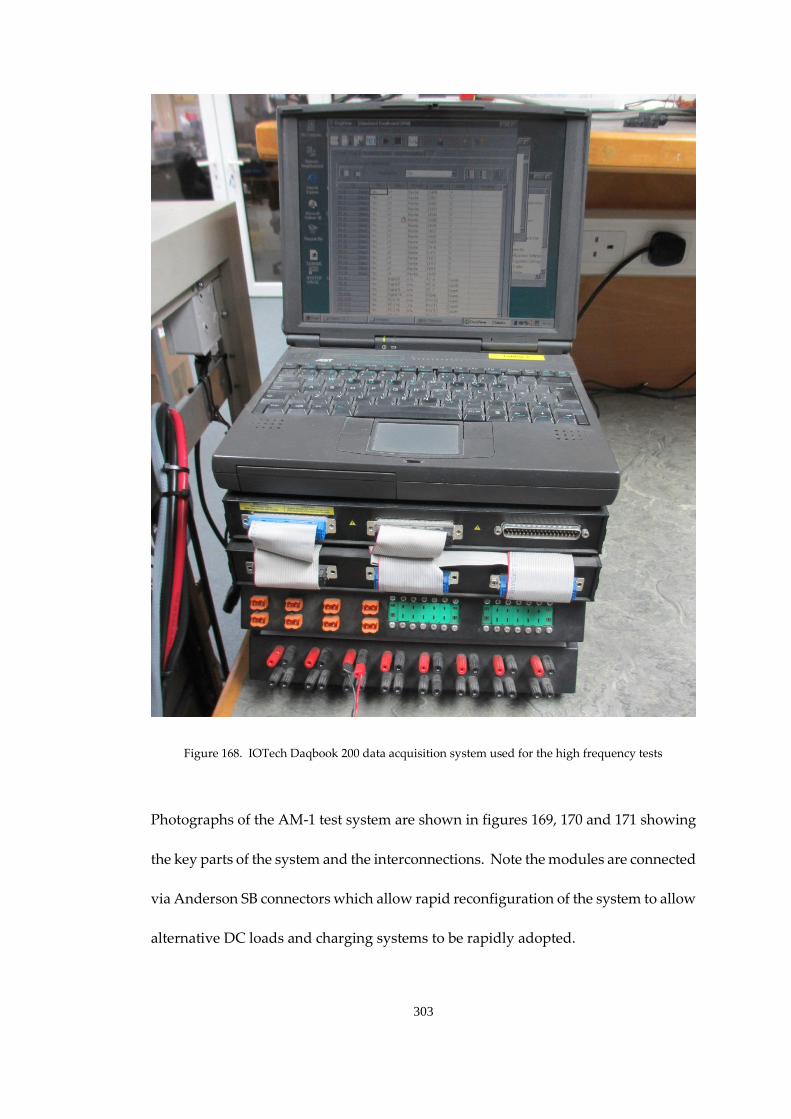
303
Figure 168. IOTech Daqbook 200 data acquisition system used for the high frequency tests
Photographs of the AM-1 test system are shown in figures 169, 170 and 171 showing
the key parts of the system and the interconnections. Note the modules are connected
via Anderson SB connectors which allow rapid reconfiguration of the system to allow
alternative DC loads and charging systems to be rapidly adopted.

304
Figure 169. AM-1 test system photograph showing installed modules and rear interconnectivity
a
b
c
d
e
f
g
h
i

305
Key to figure 169.
a. Emergency stop and power distribution panel.
b. Battery and charger status panel (charger panel to the left, overall battery
current and battery terminal voltage indicated by the panel meters on the
right).
c. AMM-2 battery charge module.
d. AMM-1 battery cycling system
e. AMM-3 PRBS battery test system
f. Electronic loads for long duration discharge and cycling tests.
g. Ethernet port (from RS232 system communication port).
h. Controlled AC mains outlet (for external oven control or similar. (A
controlled 24V output is also provided.)
i. Battery current measurement (low speed) this measurement is fed to the
front panel meter and also the low speed acquisition of the VxI Oracle unit).
Figure 170. AM-1 AC distribution, circuit protection and emergency stop wiring

306
Figure 171. Wider shot of the test system showing the high speed data acquisition, control PC and
battery under test

307
15.1.2 AMM-1 Battery cycler and system controller
Figure 172 shows the internal view of the AMM-1 cycler controller. Under
control of the VxI unit the module marshals the battery current to the connected
loads and chargers whilst being capable of charging the battery itself at a
digitally controlled charge current of up to 10A.
Controlled discharges are carried out again via the control and monitoring of
the VxI unit with battery disconnect voltage (EoD voltage) being
programmable via the RS232 port. Figure 173 shows the rear connections that
are made to the unit.
Figure 172. AMM-1 battery cycler and controller
j
i
k
l
m
n
o
p

308
Key to figure 172.
j. VxI Power Oracle 200E unit (system controller)
k. Relay control and logic (driven from system controller)
l. Housekeeping DC power supply
m. External charger contactor
n. External load contactor
o. Battery contactor
p. Battery breaker (100A DC curve)
Figure 173. Rear of AMM-1 battery cycler showing connections to other modules
Key to figure 173.
q. Battery temperature sense thermistor connector
r. External equipment control (switched 24V DC)
s. RS232 port
t. Battery voltage sense
u. Main battery connector (charge and load)
v. External charger connector
w. External load connector
x. Battery breaker (100A DC)
Figure 174 show shows the block diagram of the cycler module, figure 175 the block
diagram of the VxI Oracle 200E unit with the cycler schematic in figure 176.
q
i r
i
s
i
t
i
u
i
v
i
w
i
x
i

309
15.1.2.1 AMM-1 Battery cycler and controller block diagram
Battery
therm
istor
VxI Oracle 200E intelligent power
supply
Digital relay
control
Battery contactor
DC supply
Housekeeping DC supply
AC mains supply
0
External load contactor
External charger contactor
Battery temperature
To external load
To AMM2 charger module
Battery circuit breaker
Battery Current
Battery Voltage
To test battery
RS232 Digital I/O
Analogue inputsVoltage sense
Current sense
Charger output
To test battery
Figure 174. AMM-1 Battery cycler and controller block diagram

310
15.1.2.2 VxI Power Oracle 200E power supply block diagram (system controller)
Figure 175. Block diagram – VxI Oracle 200E psu (system controller)
Aux Output
Mains input filtering and rectification
Half bridge switchmode
front end
HV DC
BUS
90 - 264V AC
input
Primary Secondary
Isolation barrier
Rectification and filtering
Narrow range Linear
regulator
Narrow range Linear
regulator (charge)
Analogue control
Digital control (microcontroller)
I/O + SPI
A-D conversion
D-A conversion
15V DC Rail
(switch mode
controlled)
Main
Output
Battery
Output/
Input
Output voltage measure
Auxiliary output
Communications interface
Driver
Battery Voltage measure
Aux Voltage measure
Volt free relays
Serial comms to user
Control/Enable
On/Off control
Opto isolation
Control
feedback
Control/Enable
Current
sense
Current
sense
Backfeed diode
To A/D
From main current sense
Under Voltage
Lockout (battery
protection)

311
15.1.2.3 AMM-1 Battery cycler and controller schematic
PSU 2System controller
TTL/Open collector digital I/O
+12V
-12V
5V
0V
L
N
PL1:1
PL2:1
PL3:1
PL1:2
PL2:2
PL3:2
PL4:1
PL4:2
PL5:1PL5:2PL5:3PL5:4
PL6:1PL6:2PL6:3PL6:4PL6:5PL6:6PL6:7PL6:8
PL9:1PL9:2
Main output
Battery
Aux + -
Power 0V Busbar
F2A
PLAC:1
PLAC:3
PLAC:2
L
NPL11:1
PL11:3
PL11:2
PL6
:6
CB1
-12V
-12V
PL12:1PL12:2
PL8:1PL8:2
PL13:1PL13:2
PL1
0:2
PL1
0:3
PL1
0:5
RS232
PL15:3PL15:4PL15:1PL15:2
PSU 1
RLC1
RLC2
RLC3
RL1
RL3
RL4
PL1
4:2
(Rx)
PL1
4:3
(Tx)P
L14
:5 (G
ND
)
PL15:7PL15:6
PL15:5
Thermistor
PL7:1PL7:2
+12V
EXT LOAD INHIBIT
EXTERNAL LOAD
EXTERNAL CHARGER
BATTERY
LED2 EXTERNAL CHARGER
LED3 EXTERNAL LOAD
LED1 BATTERY CONNECTED
LED5 CYCLER ENABLED
LED
4 D
ISC
HA
RG
E M
OD
E
TR1 MJE 340
R1 10K
PL7:2
PL8:4PL8:3PL8:2PL8:1
EXTERNAL EQUIPMENT
CONTROL
-12V
PL6
:6
PL6
:7
RL2
RLC1,2,3 80A 50V contactorAll diodes 1N4007LED resistors 1KΩ
LED6 POWER ON
0V
230V AC coil
Figure 176. AMM-1 Battery cycler and controller schematic
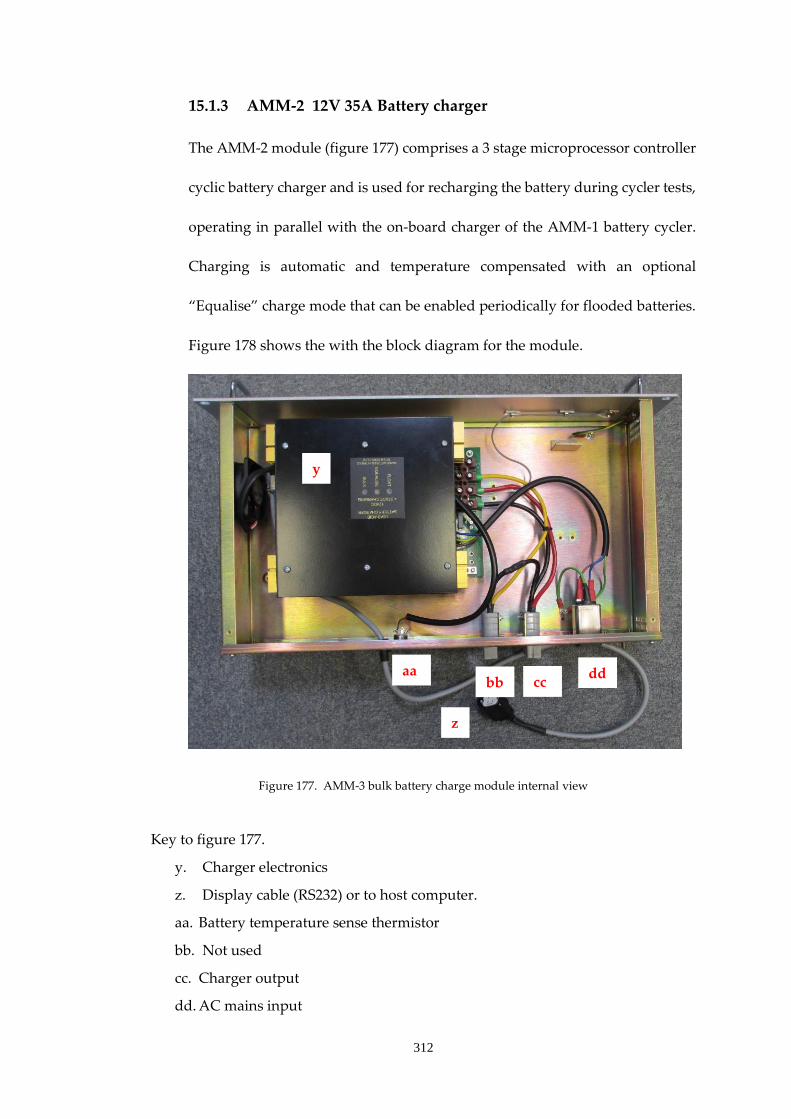
312
15.1.3 AMM-2 12V 35A Battery charger
The AMM-2 module (figure 177) comprises a 3 stage microprocessor controller
cyclic battery charger and is used for recharging the battery during cycler tests,
operating in parallel with the on-board charger of the AMM-1 battery cycler.
Charging is automatic and temperature compensated with an optional
“Equalise” charge mode that can be enabled periodically for flooded batteries.
Figure 178 shows the with the block diagram for the module.
Figure 177. AMM-3 bulk battery charge module internal view
Key to figure 177.
y. Charger electronics
z. Display cable (RS232) or to host computer.
aa. Battery temperature sense thermistor
bb. Not used
cc. Charger output
dd. AC mains input
y
z
aa bb cc
dd
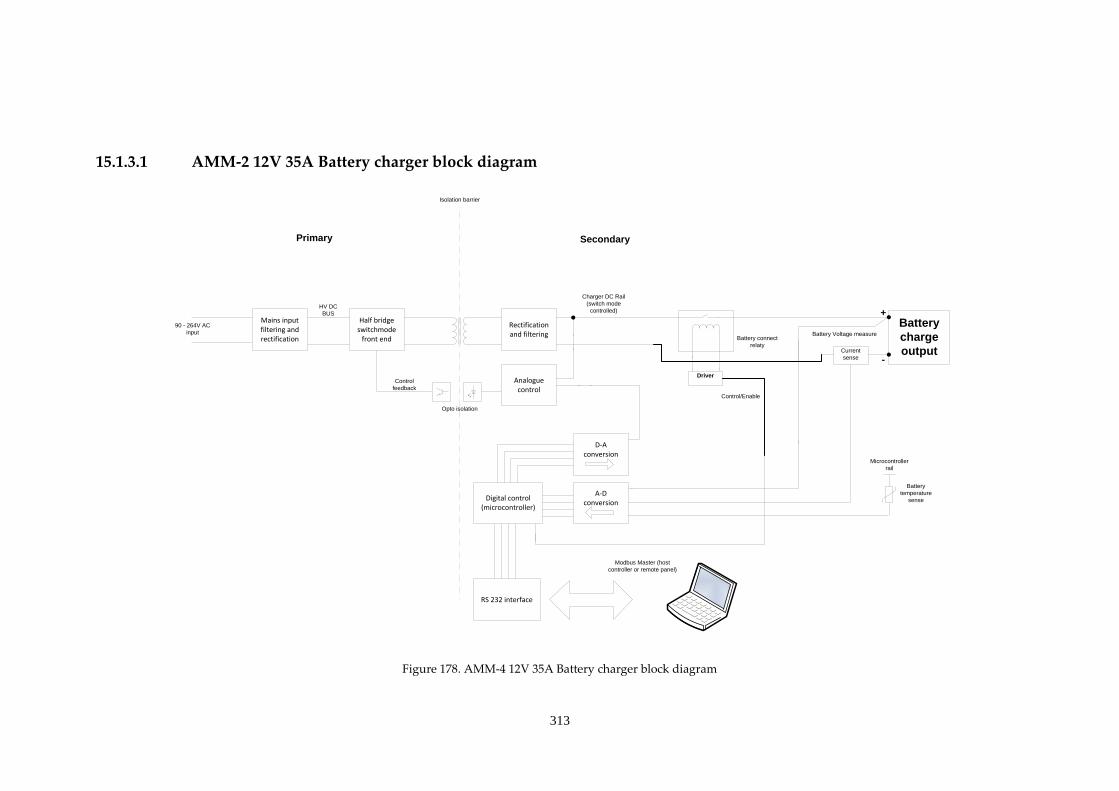
313
15.1.3.1 AMM-2 12V 35A Battery charger block diagram
Mains input filtering and rectification
Half bridge switchmode
front end
HV DC
BUS
90 - 264V AC
input
Primary Secondary
Isolation barrier
Rectification and filtering
Analogue control
Digital control (microcontroller)
A-D conversion
D-A conversion
Charger DC Rail
(switch mode
controlled)
Battery
charge
output
RS 232 interface
Driver
Battery Voltage measure
Modbus Master (host
controller or remote panel)
Control/Enable
Opto isolation
Control
feedback
Current
sense
Battery connect
relaty
Microcontroller
rail
Battery
temperature
sense
+
-
Figure 178. AMM-4 12V 35A Battery charger block diagram

314
15.2 AMM-3 Tri-mode PRBS battery test module
The AMM-3 module comprises the perturbation and power stages of the PRBS
test equipment. Complementary charge and load power stages are provided
which nominally provide +/-4A current source/sink to the test battery, but are
further programmable up to +/-10A. The power stage can operate in charge,
discharge or bipolar modes, at frequencies up to 5 kHz.
Perturbation signal is provided by either external signal input, or via internal
microcontroller.
Figure 179 shows the block diagram for the module with schematics in figures
180-182.

315
15.2.1 AMM-3 Tri-mode PRBS battery test module block diagram
Data acquisition
Battery Current
Battery under test
Battery Voltage
Signal 0V
Power 0V
Power 0V
IBatt
Bipolar current source/sink
DC power supply
Charge power stage
Discharge power stage
MODEdsPIC explorer 16 development
board
Bipolar drive circuit
Demand signal
Figure 179. AMM-3 Tri-mode PRBS battery test module block diagram

316
15.2.2 AMM-3 Tri-mode PRBS battery test module schematic
Microchip dsPIC Explorer 16
development board
PRBS OUT
PL3:1
PL3:2
RA3
RA4
PL1:1
PL1:3
PL1:2PL1:4
RA1
RA0
D7
0V
FREQUENCY SELECT
ENABLEMCLR
CLOCK
MODE 1
MODE 2
PRBS
PRBS
10K
10K
7400
14
7
12
45
910 8
6
3
+5V
All LED resistors 1KΩ
Figure 180. AMM-3 microcontroller board schematic (digital board)
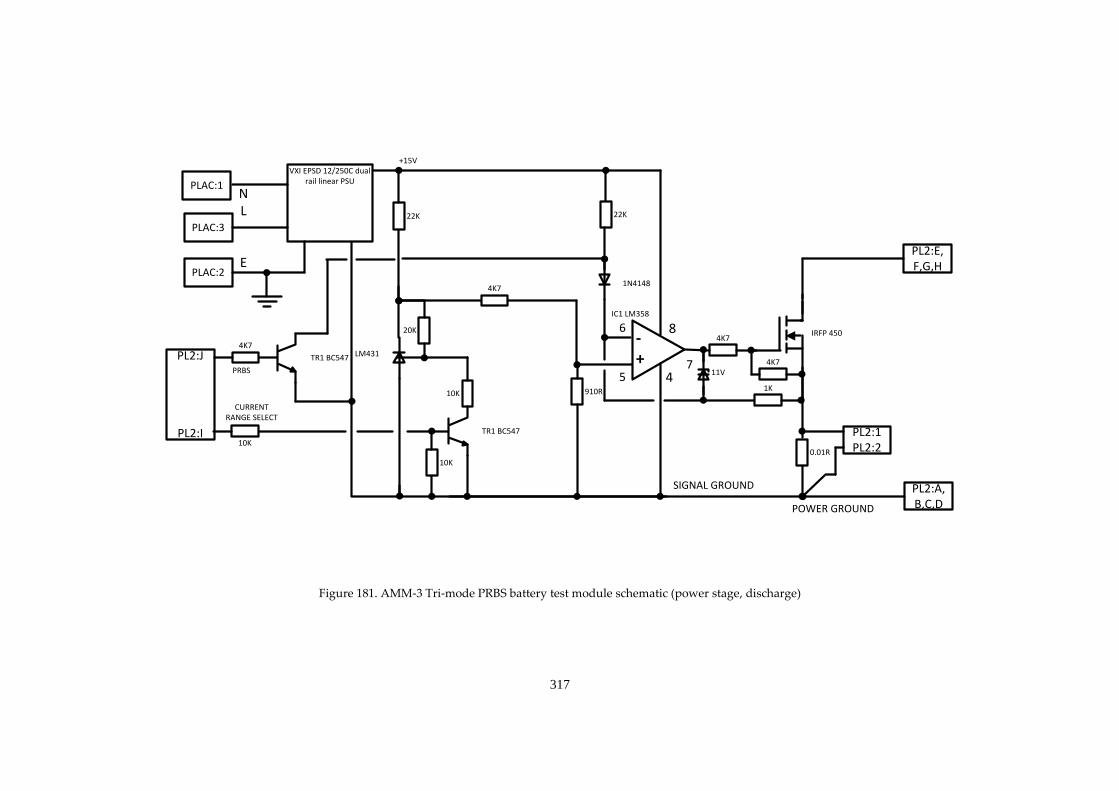
317
TR1 BC547
4K7
910R10K
6
5
- +
POWER GROUND
VXI EPSD 12/250C dual rail linear PSU
SIGNAL GROUND
PL2:E,F,G,H
PL2:A,B,C,D
PL2:1PL2:2
7
4
8
PLAC:1
PLAC:3
PLAC:2
NL
E
1K
0.01R
1N4148
22K22K
+15V
IC1 LM358
TR1 BC547
LM431
20K
10K
4K7
10K
CURRENT RANGE SELECT
4K7
PRBS
PL2:J
PL2:I
4K711V
IRFP 450
Figure 181. AMM-3 Tri-mode PRBS battery test module schematic (power stage, discharge)

318
TR1 BC547
10K
2K7
TR2 BC557
2K7
2K7 100K
33K10nF210K
18K
10K
+Supply
6
5
- +
Q1 IRFP4905
C2
33
00
uF
16
V
POWER GROUND
PSU3, 12-16.5V, 500W
IC1 ZRA 245
Q2 IRFP4905
1K3
TR1 BC547
44K
2K7
SIGNAL GROUND
Vref
PL1:1
PL1:2
PL2
:1P
L2:2
CURRENT PROGRAM
PL2:1PL2:2
7
4
8
PRBS in
PLAC:1
PLAC:3
PLAC:2
NL
E
Figure 182. AMM-3 Tri-mode PRBS battery test module schematic (power stage, charge)

319
15.3 Environmental chambers
The system comprised two environmental chambers, used for long duration
heating and cooling tests.
15.3.1 Heat/cool temperature chamber
The environmental chamber (figure 183) used for these tests is a combined
heat/cool device with a closed loop PID controller with the ability to be
controlled with an external program or profile via LabViewTM . The heating of
the chamber is effected by conventional electrical means, with a fan in the rear
of the chamber to distribute the heated or cooled air. Cooling occurs by
evaporation of carbon dioxide delivered from pressurised cylinders with
internal syphon tubes which ensure that liquid CO2 is delivered to the pressure
reduction matrix within the delivery system.
15.3.1.1 Heat/cool temperature chamber specification
Chamber type Montford
Controller type Anglicon
Thermal capacity (Heating) 3kW
Thermal capacity (cooling) 500W (approx.)

320
Maximum temperature 150°C
Minimum temperature -50°C
Figure 183. Photograph of Heat/Cool temperature chamber
15.3.2 Long duration low temperature test chamber
The long duration low temperature test chamber (figure 184) was used for
longer duration tests at low temperature. The downside of the conventional
environmental chamber is that a gaseous refrigerant is consumed. The issues
with this are two fold, in that the tests become expensive, and secondly the

321
refrigerant may not last for the duration of the test. An alternative approach
was developed using a domestic freezer and an industrial PID temperature
controller. Employing a solid state relay as the switching element, the
controller interrupts the supply to the freezer to effect temperature control.
During the initial cooling phase a thermocouple connected to the controller
hangs in free air within the freezer compartment. After the batteries are
introduced to the chamber the thermocouple can be attached to the negative
battery terminal in order to improve the response of the system.
Although this chamber provides no positive heating, the differential between
the internal and external temperatures allows the necessary control to be
maintained by relying on thermal losses of the appliance insulating material.
15.3.2.1 Extended low temperature chamber specification
Chamber type
VxI Power design using domestic freezer with external PID controller
Thermal capacity (cooling)
60W
Internal volume
60 litres
Controller
CAL 9900 PID controller with solid state relay control of chamber compressor.
RS232 port for data logging and cool profile
Maximum temperature 0°C

322
Minimum temperature -30°C
Figure 184. (a) Photograph of extended low temperature chamber, and (b) battery in situ within the
chamber with thermocouple attached

323
15.4 Peripheral test hardware
15.4.1 Timed discharge apparatus
The timed discharge apparatus was built to increase the capacity of the test
hardware, in that it was used to carry out controlled discharges from test
batteries whilst the AM-1 system was otherwise engaged with longer
duration tests. The overall simplicity of the equipment was a design
requirement, in that setup would be minimal, and a battery could be
connected and the discharge started from a single button without interaction
of a host computer or control system. The system photograph is shown in
figure 185, with the block diagram shown in figure 186.
Figure 185. Timed discharge apparatus photograph

324
15.4.1.1 Timed discharge apparatus block diagram
VxI Oracle 200E intelligent power
supply
Battery contactor
Test battery
AC mains supply
300W Electronic load
Digital timer
START
Battery discharges into load via the VxI unit, allowing monitoring of discharge voltage and deep discharge
protection
Figure 186. Timed discharge apparatus block diagram
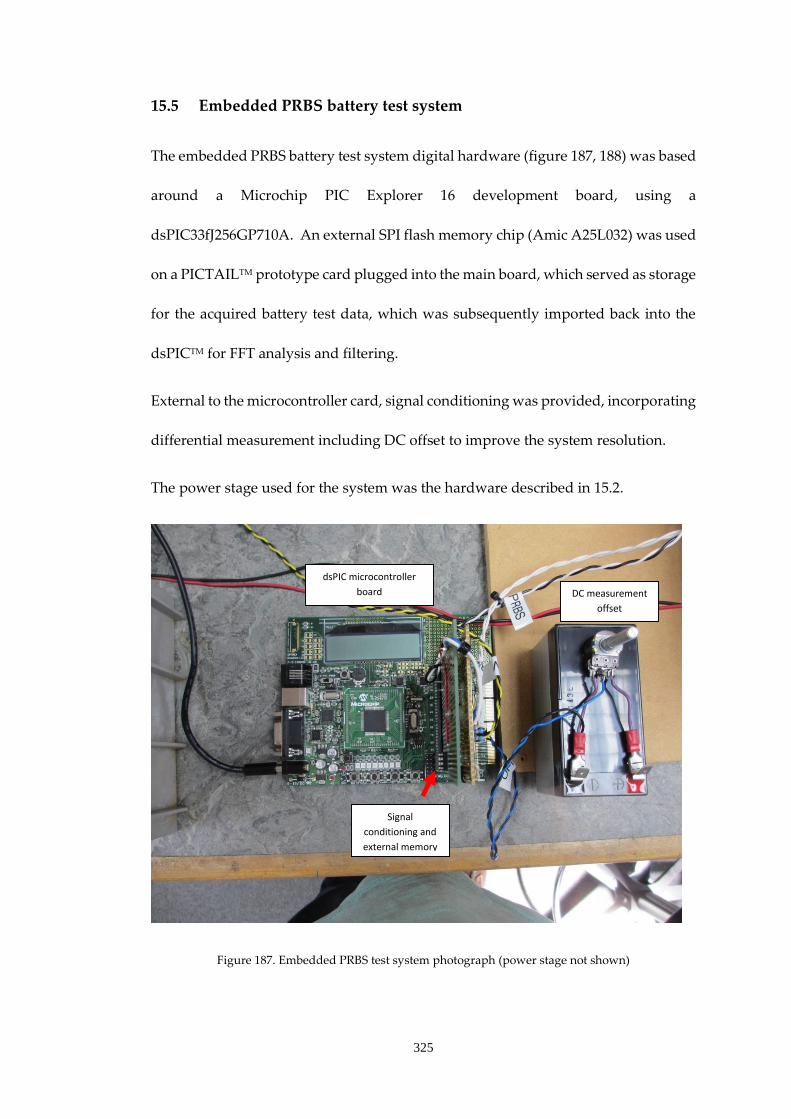
325
15.5 Embedded PRBS battery test system
The embedded PRBS battery test system digital hardware (figure 187, 188) was based
around a Microchip PIC Explorer 16 development board, using a
dsPIC33fJ256GP710A. An external SPI flash memory chip (Amic A25L032) was used
on a PICTAILTM prototype card plugged into the main board, which served as storage
for the acquired battery test data, which was subsequently imported back into the
dsPICTM for FFT analysis and filtering.
External to the microcontroller card, signal conditioning was provided, incorporating
differential measurement including DC offset to improve the system resolution.
The power stage used for the system was the hardware described in 15.2.
Figure 187. Embedded PRBS test system photograph (power stage not shown)
DC measurement
offset
dsPIC microcontroller
board
Signal
conditioning and
external memory
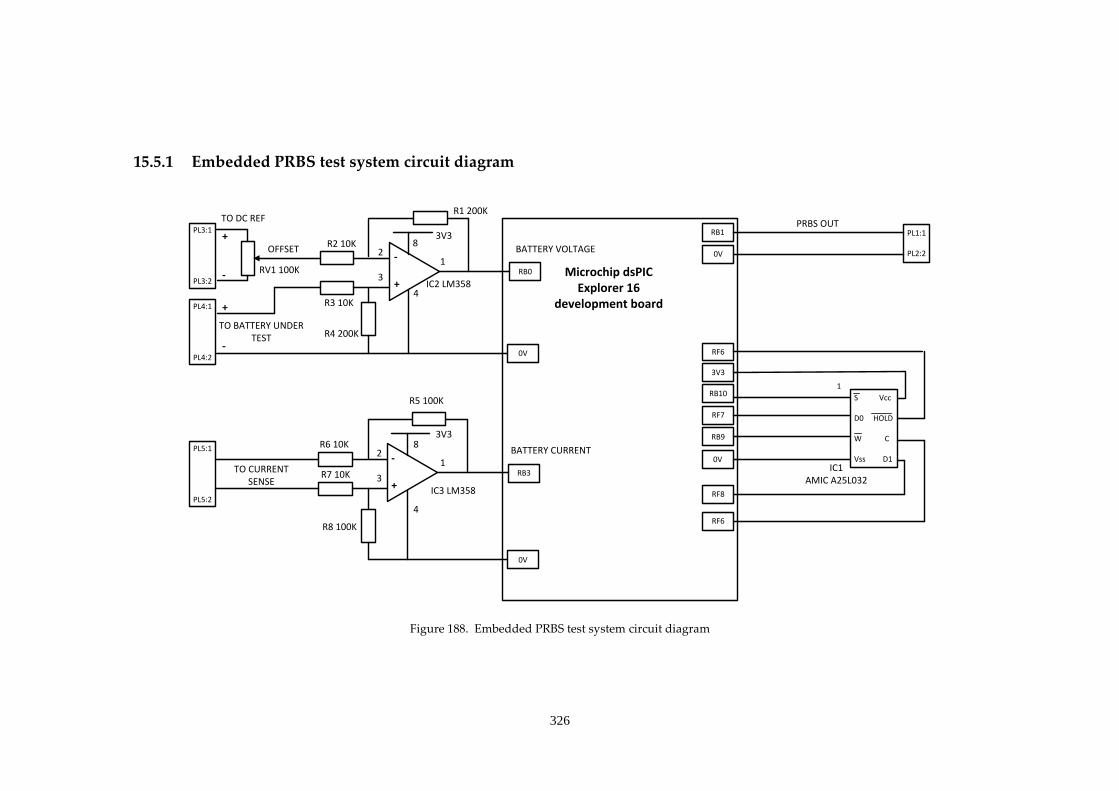
326
15.5.1 Embedded PRBS test system circuit diagram
RB0
BATTERY VOLTAGE
Microchip dsPIC Explorer 16
development board
PRBS OUTPL1:1
PL2:2
RB1
0V
0V
RB9
IC1AMIC A25L032
1
S Vcc
D0 HOLD
W C
Vss D1
RF7
RB10
RF6
RF8
RF6
3V3
R1 200K
IC2 LM358
2 3
1
8
4
2 3 IC3 LM358
1 RB3
8
4
- +
- +
BATTERY CURRENT
3V3
3V3
R2 10K
R3 10K
R4 200K
OFFSET
PL3:1
PL3:2
RV1 100K
PL4:1
PL4:20V
0V
TO BATTERY UNDER TEST
+
-
+
-
TO DC REF
R7 10K
R6 10K
R8 100K
R5 100K
PL5:1
PL5:2
TO CURRENT SENSE
Figure 188. Embedded PRBS test system circuit diagram

327
15.6 IoTech Daqbook 200 data acquisition system specification
General Power Consumption 620 mA @ 12 VDC Operating Temperature: 0° to 50°C Storage Temperature: 0° to 70°C Humidity: 0 to 95% RH, non-condensing Dimensions: 285 mm W x 220 mm D x 35 mm H (11” x 8.5” x 1.375”) Weight: 2.2 kg (5 lbs)
A/D Specifications Type: Successive approximation Resolution: 16 bit Conversion Time: 8 μs Monotonicity: No missing codes Linearity: ±1 bit Zero Drift: ±10 ppm/°C max Gain Drift: ±30 ppm/°C max
Sample & Hold Amplifier Acquisition Time: 2 μs Aperture Uncertainty: 100 ps
Analog Inputs Channels: 16 single-ended, 8 differential, expandable up to 256 differential; single-ended/differential operation is software programmable per system Connector: DB37 male, P1 Resolution: 16 bits Accuracy: ±0.025% FS Ranges Unipolar/bipolar operation is software programmable on a per-channel basis Unipolar: 0 to +10V, 0 to +5V, 0 to +2.5V, 0 to +1.25V Bipolar: ±5V, ±2.5V, ±1.25V, ±0.625V Maximum Overvoltage: 30 VDC Input Current Differential: 150 pA typ; 0.2 μA max Single-Ended: 250 pA typ; 0.4 μA max Input Impedance: 100M Ohm in parallel with 100 pF Gain Temp. Coefficient: 3 ppm/°C typ Offset Temp. Coefficient: 12 μV/°C max
Triggering Analog Trigger Programmable Level Range: 0 to ±5V Trigger to A/D Latency: 10 μs max Digital Trigger Logic Level Range: 0.8V low/2.2V high Trigger to A/D Latency: 10 μs max Software Trigger Trigger to A/D Latency: Dependent on PC Pre-Trigger: Up to 65,536 scans
Sequencer Randomly programmable for channel and gain on unipolar/bipolar ranges Depth: 512 location Channel to Channel Rate: 10 μs/channel, fixed Maximum Repeat Rate: 100 kHz Minimum Repeat Rate: 10 hours Expansion Channel Sample Rate: Same as on-board channels, 10 μs/channel
Analog Outputs Channels: 2 Connector: DB37 male, P1 Resolution: 12 bits

328
Voltage Ranges: 0 to 5 VDC with built-in reference; 0 up to ±10 VDC with external reference Maximum Output Current: 10 mA
General Purpose Digital I/O 24 I/O channels, expandable up to 192 Connector: DB37 male, P2 Device: 82C55 Output Voltage Levels Minimum “1” Voltage: 3.0 @ 2.5 mA sourcing Maximum “0” Voltage: 0.4 @ 2.5 mA sinking Output Current Maximum Source Current: 2.5 mA Maximum Sink Current: -2.5 mA Input Voltage Levels Minimum Required “1” Voltage Level: 2V Maximum Allowed “0” Voltage Level: 0.8V Output Float Leakage Current: 10 μA
High-Speed Digital Inputs 16 input lines Connector: DB37 male, P3 Maximum Sampling Rate: 100 Kwords/s Input Low Voltage: 0.8V max Input High Voltage: 2V min Input Low Current: 10 nA Input High Current: -10 μA
Counter/Timer 5 counter/timer channels Connector: DB37 male, P3 Frequency/Pulse Counting Mode: Up or down, binary or BCD Maximum Pulse Count: 80-bit binary (5 channels cascaded) Maximum Input Rate: 7 MHz Minimum High Pulse Width: 70 ns Minimum Low Pulse Width: 70 ns On-board Time Base: 1 MHz

329
15.7 Battery and capacitor datasheets
15.7.1 Yuasa NPL65-12i datasheet
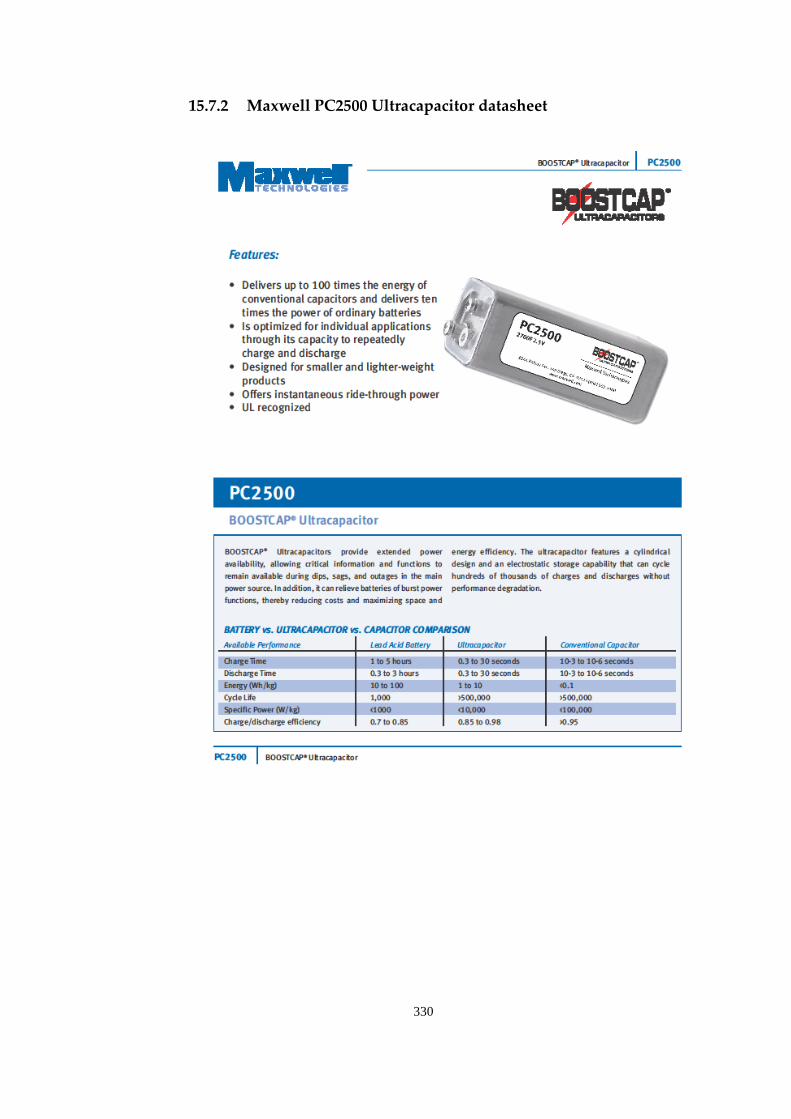
330
15.7.2 Maxwell PC2500 Ultracapacitor datasheet
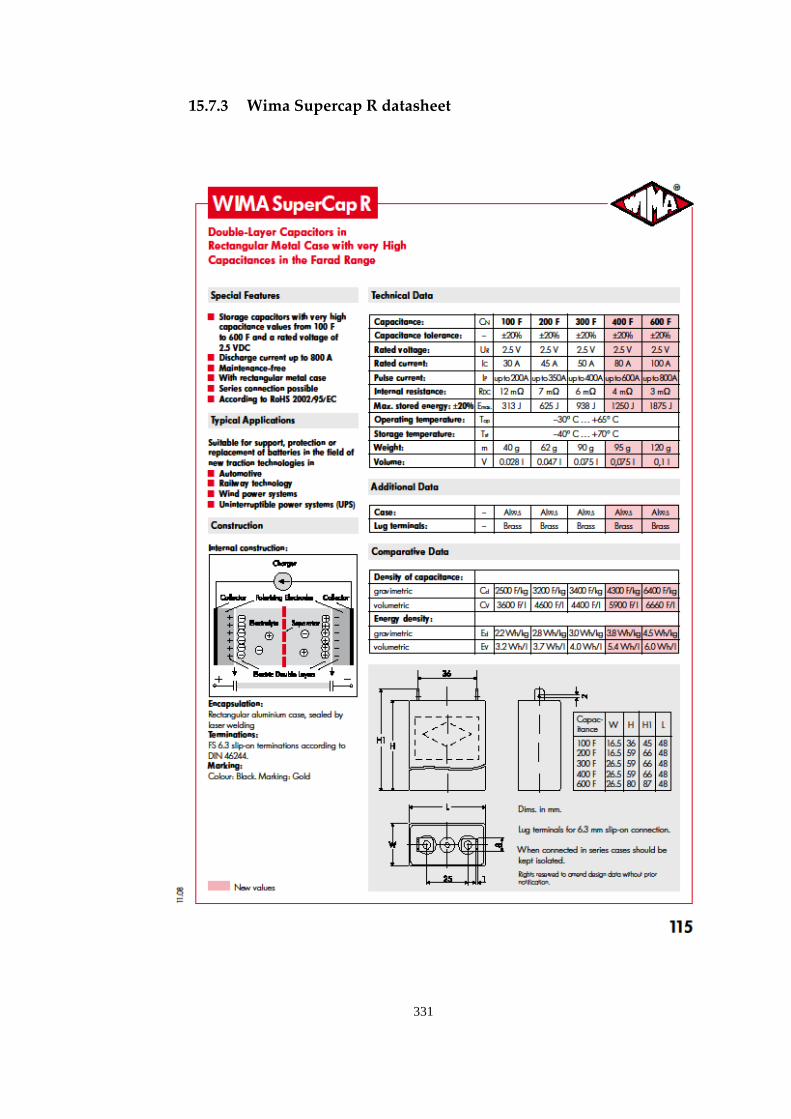
331
15.7.3 Wima Supercap R datasheet
332
15.7.4 Furukawa FTZ12-HEV UltraBattery data
Operating voltage window 14.7 to 10.5V
Max voltage 16V
Discharge end voltage at 1C rate 10.02V (@ 20°C)
Float Voltage 13.62 V (@ 20°C)
Float Current, after 24 hr at 13.62V 9.3 mA
Charge Regulation Voltage 14.7 V
Maximum Charge Current 20 A
Maximum Pulse Current 80 A
Maximum Constant Current 20 A
DC Ohmic resistance 20 mΩ (@ 25°C)
Capacity, 1C rate to 10.5V 7.8 Ah
Energy density 30 Wh/kg 77Wh/L
Dimensions, (mm) 110 x 87 x 150
Mass 3.787 kg
15.7.5 Continental batteries CTX-9 battery data
Battery type AGM maintenance free battery
Voltage 12V
Dimensions 150mm x 87mm x 105 mm
Capacity rating 8Ah
Cold-start performance CCA (EN) 120A
Information obtained from manufacturer’s website [170].

333
15.8 MATLAB code
15.8.1 sdm1a.m
%%%%%%%%%%%%%%%%%%%%%% % Filename sdm1a.m % Date 03/07/09 % Sampled data model of Randle's battery model % used to rapidly generate PRBS data % Randle's model is represented in state-variable format %%%%%%%%%%%%%%%%%%%%%% % Generates a PRBS and applies it to the battery model %%%%%%%%%%%%%%%%%%% %%%%%%%%%%%%%%%%%%%
%Ri Randles model parameter %Rt Randles model parameter %Cs Randles model parameter %Cb Randles model parameter %Rd Randles model parameter %N PRBS bit length %t_prbs PRBS time clock pulse period
function sdm_1a(Ri,Rt,Cs,Rd,Cb,N,t_prbs); %number of samples per pulse period n_sam=60
%actual simulation time step t_step=t_prbs/n_sam
%total number of samples n_tot=(2^N-1)*n_sam
%initial prbs sequence disp('Generating PRBS') %call mls - generates the PRBS sequence prbs1=mls(N);
%generate actual sequence taking sampling into account %prbs2 is the prbs input to the model prbs2(1:n_tot)=0; for ind1=0:(2^N-2) for ind2=1:n_sam prbs2(n_sam*ind1+ind2)=prbs1(ind1+1); end end
%%%%%%%%%%%%%%%%%%% %model matrices %state vector is x=[vcs,vcb]
A=[-1/(Cs*Rt),0;0,-1/(Cb*Rd)] B=[1/Cs;1/Cb] C=[1 1]

334
D=Ri
I=expm(A*t_step) R=inv(A)*(I-eye(2))*B
%%%%%%%%%%%%%%%%%%% %sampled data loop to generate data %initialise voltage vector Vbat(1:n_tot)=0;
%initial conditions x_prev=[0;0]
%perform voltage calculation for ind=2:n_tot x_next=I*x_prev+R*prbs2(ind); Vbat(ind)=C*x_next+D*prbs2(ind); x_prev=x_next; end
time=(0:n_tot)*t_step;
%%%%%%%%%%%%%%%%%%%%%%%%%%%%%%%%%%%% % Analyse data
%plot time waveform and fft of vbat %plot(time,Vbat) %xlabel('Time (s)') %ylabel('Battery terminal voltage (V)')
%extract impedance response from data using ffts figure [in]=four(time,prbs2',0); xlabel('Frequency (Hz)') %ylabel('FFT of Iin') set(gca,'XScale','log')
figure [out]=four(time,Vbat',0); xlabel('Frequency (Hz)') %ylabel('FFT of VBat') set(gca,'XScale','log')
in=in'; out=out'; w=in(:,1); min=in(:,2); mout=out(:,2); mag=mout./min; figure plot(w/2/pi,mag) xlabel('Frequency (Hz)') %ylabel('Z') set(gca,'XScale','log') axis([0,1000,0,0.015]); grid

335
15.8.2 mls.m
%Generates a Maximum Length Sequence of n bits by utilizing a %linear feedback shift register with an XOR gate on the tap
bits % %Function can accept bit lengths of between 2 and 24 % %y is a vector of 1's & -1's that is (2^n)-1 in length. % %optional flag is:
% 1 for an initial sequence of all ones (repeatable) % 0 for an initial sequence that is random (default) % % %reference: % Davies, W.D.T. (June, July, August, 1966). Generation and %properties of maximum-length sequences. Control, 302-4, 364-
5,431-3. % %Spring 2001, Christopher Brown, [email protected]
%n=bit length of PRBS function y = mls(n,flag) flag=0;
switch n %assign taps which will yield a maximum case 2 %length sequence for a given bit length taps=2; tap1=1; %there’s a list of appropriate tap values in tap2=2; %Vanderkooy, JAES, 42(4), 1994. case 3 taps=2; tap1=1; tap2=3; case 4 taps=2; tap1=1; tap2=4; case 5 taps=2; tap1=2; tap2=5; case 6 taps=2; tap1=1; tap2=6; case 7 taps=2; tap1=1; tap2=7; case 8 taps=4; tap1=2; tap2=3; tap3=4;

336
tap4=8; case 9 taps=2; tap1=4; tap2=9; case 10 taps=2; tap1=3; tap2=10; case 11 taps=2; tap1=2; tap2=11; case 12 taps=4; tap1=1; tap2=4; tap3=6; tap4=12; case 13 taps=4; tap1=1; tap2=3; tap3=4; tap4=13; case 14 taps=4; tap1=1; tap2=3; tap3=5; tap4=14; case 15 taps=2; tap1=1; tap2=15; case 16 taps=4; tap1=2; tap2=3; tap3=5; tap4=16; case 17 taps=2; tap1=3; tap2=17; case 18 taps=2; tap1=7; tap2=18; case 19 taps=4; tap1=1; tap2=2; tap3=5; tap4=19; case 20 taps=2; tap1=3; tap2=20; case 21

337
taps=2; tap1=2; tap2=21; case 22 taps=2; tap1=1; tap2=22; case 23 taps=2; tap1=5; tap2=23; case 24 taps=4; tap1=1; tap2=3; tap3=4; tap4=24;
otherwise disp(' '); disp('input bits must be between 2 and 24'); return end if (nargin == 1) flag = 0; end if flag == 1 abuff = ones(1,n); else rand('state',sum(100*clock)) while 1 abuff = round(rand(1,n)); %make sure not all bits are zero if find(abuff==1) break end end end
for i = (2^n)-1:-1:1 i ; xorbit = xor(abuff(tap1),abuff(tap2)); %feedback bit if taps==4 xorbit2 = xor(abuff(tap3),abuff(tap4));
%4 taps = 3 xor gates & 2 levels of logic xorbit = xor(xorbit,xorbit2);
%second logic level end abuff = [xorbit abuff(1:n-1)]; y(i) = (-2 .* xorbit) + 1;
%yields one's and negative one's (0 -> 1; 1 -> -1) xnum=numel(y); x=(1:xnum); stairs(x,y); axis([0,250,-2,2]); time=(0:(2^n-2))*(1/500); simin.signals.values=y'; simin.time=time'; end

338
15.8.3 four.m
%four.m %performs FFT on an input signal %with the specific window function below %time = time data %inp = input data %winder = select window function or not function out=four(time,inp,winder) global amp freqout mag [m,n]=size(inp); tsam=(time(2)-time(1)); %tsam=time(10)-time(1) if winder %window function (hanning) k=-m/2:m/2-1; wind=0.5+0.5*cos(2*pi*k/m); %window function (hamming) %wind=0.54+0.46*cos(2*pi*k/m); %window function (blackman) %wind=0.42-0.6*cos(2*pi*k/(m-1))+0.08*cos(4*pi*k/(m-1)); size(wind); size(inp);
%performs fft freqs=fft(wind'.*inp,m)/m; else freqs=fft(inp,m)/m; %extract only positive frequencies end if mod(m,2)==0 n=m/2; else n=(m+1)/2; end
%magnitude mag=2*abs(freqs(1:n)); mag(1)=mag(1)/2;
%fundamental frequency of fft or frequency step w1=2*pi/(tsam*m); w=0:n-1; w=w*w1; freqout=w/2/pi; amp=20*log10(mag); figure plot(freqout,mag); grid set(gca,'XScale','log')
%phase ph=180/pi*unwrap(angle(freqs(1:n))); size(w); size(mag); size(ph); out=[w;mag';ph'];

339
15.8.4 fourseq.m
% fourseq – modified from four.m % Andrew Fairweather 2008-2014 % checks a selected data set for a clean current FFT % which in turn checks PRBS is correct % sampling and clock have no jitter % a textbook PRBS FFT should be evident % ref WDT Davies system identification for self adaptive
control
% note plots are for inspection only and are unscaled
function out=fourseq(time,inp,winder,start,sample,N,trim) length=(N*sample) start=start+trim; global indplt1 indplt2 pltnum finish=start+length prb=inp(start:finish); tt=time(start:finish); ttt=time(start:finish)*25000; subplot(indplt1,indplt2,pltnum),plot(ttt,prb); pltnum=pltnum+1 grid time=time(start:finish); inp=inp(start:finish); [m,n]=size(inp); tsam=(time(2)-time(1)); if winder %window function k=-m/2:m/2-1; wind=0.5+0.5*cos(2*pi*k/m); figure plot(wind) size(wind); size(inp);
%performs fft freqs=fft(wind'.*inp,m)/m; else freqs=fft(inp,m)/m; %extract only positive frequencies end if mod(m,2)==0
n=m/2; else
n=(m+1)/2; end
%magnitude mag=2*abs(freqs(1:n)); mag(1)=mag(1)/2;
%fundamental frequency of fft or frequency step w1=2*pi/(tsam*m); w=0:n-1; w=w*w1; freqout=w/2/pi; amp=20*log10(mag);

340
%figure subplot(indplt1,indplt2,pltnum),plot(freqout,mag); pltnum=pltnum+1 grid set(gca,'XScale','log') finish %phase ph=180/pi*unwrap(angle(freqs(1:n))); size(w); size(mag); size(ph);

341
15.8.5 evalprbs.m
%%evalprbs1-5 - Andrew Fairweather 17th July 2009 %% this routine evaluates the results of imported data from a
PRBS battery %% experiment - the length below is used to specify how much
data is used, %% and should be set to a data set that corresponds to 1
complete PRBS sequence
%V voltage data %I current data %time time %winder FFT window select %ylim ylimit on outplut plot %start data start %N PRBS 'N' (N=2^n-1) %sample data sample rate %trim data trim
function
result=evalprbs5(V,I,time,winder,ylim,start,N,sample,trim,dozca
lc); start=start+trim; finish=((N*sample)+start)
close all;
iin=I(start:finish);
vout=V(start:finish); tout=time(start:finish); vin=iin; tin=time(start:finish);
four(tin,vin,winder);
figure; four(tout,vout,winder); grid; axis([0,100,-10,10]); [infft]=four(tin,vin,winder); [outfft]=four(tout,vout,winder); incomp=infft(2,:).*(cos(infft(3,:))+i*sin(infft(3,:))); outcomp=outfft(2,:).*(cos(outfft(3,:))+i*sin(outfft(3,:))); tfcomp=outcomp./incomp;
figure; xxxx=(infft(1,:)/2/pi); yyyy=(abs(tfcomp)); semilogx(xxxx,yyyy);
axis([0,1000,0,ylim]);

342
grid; xlabel('Hz'); ylabel('Z');
%% Do Z Calc - this calculates CSurface and Rt from two points
in the results %% %% needs complex impedance so embedded in evalprbs
while dozcalc==1 %option to select this bit of code %% frequency points in response %freq1 freq1=10 %freq2 freq2=300 %Find these freqs in the data n1=find(xxxx>freq1) n=n1(1)-1 n2=find(xxxx>freq2) nn=n2(1)-1 % and the corresponding impedance Zt1=yyyy(n) Zt2=yyyy(nn) Znum=(1/(Zt1-Ri))-(1/(Zt2-Ri)) w1=xxxx(n)*2*pi w2=xxxx(nn)*2*pi %Csurface Csurf=Znum/(i*w1-i*w2) %Rt
XCs1=1/(i*w1*Csurf) denom=(1/(Zt1-Ri))-1/(XCs1) Rt=1/denom
else end

343
15.8.6 find_datastart.m
%% find_datastart %% this finds the start of the PRBS waveform %% in the acquired test data to allow accurate processesing %% for all modes of test used in the thesis
%sample = 25000 freq=2 samp = input('Sampling freq khz? '); mode = input('1=discharge, 2=charge, 3=bipolar, 4=bipolar LF
'); trim = input('at a trim value in single pulses ');
sample=samp*1000; header_length=0
%*****************************
a=data(:,1); b=data(:,2); c=data(:,3); numel(c) time=(1:ans)/sample; close all
%***************************** if mode==1 x=a; else end if mode==2 x=-c+0.15; else end if mode==3 x=a; else end if mode==4 x=a; freq=0.5 else end trim1=trim*sample/freq header=(header_length*sample/freq)+trim1
fin=numel(x) % find the rising edge d=find(x>0.15);
rising=d(2)
% find the falling edge - offset by "header" pushes it into
the %middle of the header bit so the next transition is -ve - the
start XXX=x(header:fin); e=find(XXX<0.05);
344
falling=e(2)+header
pulsewidth=falling-rising
yfalling=[-0.1 0 0.1 0.2 0.3] xfalling=[falling falling falling falling falling] xs=(1:(numel(x))); start=falling
figure plot(xs(start:fin/10),x(start:fin/10),xfalling,yfalling) %plot(xs,x,xfalling,yfalling) grid hold on %%%%%%%%%%%%%%%%%%%%%%%%%%%%%%%
start=falling clear yfalling xs xfalling t2 t1 pulsewidth header rising XXX
fin falling
345
15.8.7 crunch1.m
% crunch1
% this routine loads matlab workspaces that have been created % to process battery test data then calls multiprbs which % processes them to provide impedance responses % the workspaces contain the raw acquired current and voltage % data for the PRBS tests time data for the waveforms % and data start sample point % workspaces are set up using laterresultssetup.m % and find_datastart.m % this code can be modified to process other data workspaces
close all clear time clear data clear a clear b clear c clear ans testnum = input('Which test to evaluate? '); global testnum if testnum==1 load('2105141.mat') %load 2105141 else end if testnum==2 load('2105142.mat') else end if testnum==3 load('2105143.mat') else end if testnum==4 load('2105144.mat') %load 2105141 else end if testnum==5 load('2105145.mat') else end if testnum==6 load('2105146.mat') else end if testnum==7 load('2105147.mat') %load 2105141 else end if testnum==8 load('2105148.mat')
346
else end if testnum==9 load('2105149.mat') else end if testnum==10 load('21051410.mat') else end if testnum==11 load('21051411.mat') else end if testnum==12 load('21051412.mat') else end if testnum==13 load('21051413.mat') else end if testnum==14 load('21051414.mat') else end if testnum==15 load('21051415.mat') else end if testnum==16 load('21051416.mat') else end if testnum==17 load('21051417.mat') else end if testnum==18 load('21051418.mat') else end if testnum==19 load('21051419.mat') else end if testnum==20 load('21051420.mat') else end if testnum==21 load('21051421.mat') else end if testnum==22 load('21051422.mat') else end if testnum==23 load('21051423.mat')

347
else end if testnum==24 load('21051424.mat') else end if mod(testnum,2) disp('odd') multiprbs(a,b,c,time,start,0.1,1,1,0,0) else disp('even') multiprbs(a,b,c,time,start,0.1,0,1,0,0) end stitchprbs(0.05,0)

348
15.8.8 multiprbs.m
%%multiprbs - Andrew Fairweather 29th May 2014 %% this uses evalprbs 2 to process a batch of results and plot
the graphs %% it is written for a frequency changing prbs with no header % a is discharge current +ve % b is prbs terminal voltage % c is charge current -ve % range selects the samples for HF or LF results (1=HF) % evaluate does the impedance fftss and calcs if selected function
result=multiprbs(a,b,c,time,start,ylim,range,bipolar,charge,dis
charge); ylim1=0.05 ylim2=0.05 ylim3=0.05 ylim4=0.05 ylim5=0.05 ylim6=0.05 ylim7=0.05 ylim8=0.05 indplt1=3 indplt2=3 global indplt1 indplt2 pltnum graphnum v=b; N=63; graphnum=1 winder=0 if range samp1=2501 samp2=626.2 samp3=196.44 samp4=100.1 samp5=46.39 samp6=23.2 samp7=18.08+0.66 samp8=2.6
else samp1=2501*8 samp2=625*16 samp3=5000 samp4=2500 samp5=1250 samp6=625 samp7=312.5 samp8=156.25/50
end
%starts s1=start s2=s1+(N*samp1) s3=s2+(N*samp2) s4=s3+(N*samp3) s5=s4+(N*samp4) s6=s5+(N*samp5) s7=s6+(N*samp6)

349
s8=s7+(N*samp7)
%finishes f1=s2 f2=s3 f3=s4 f4=s5 f5=s6 f6=s7 f7=s8 f8=s8+(N*samp8)
dischargei=a*20; chargei=c*30.77; bipolar_i=-1*(dischargei+chargei); pltnum=1; figure subplot(indplt1,indplt2,pltnum),plot(time,v) grid pltnum=pltnum+1; subplot(indplt1,indplt2,pltnum),plot(time,bipolar_i) grid pltnum=pltnum+1; %fourseq(time,dischargei,0,start,2501,63,0) fourseq(time,dischargei,0,start,samp1,63,0) %pltnum=pltnum+1; fourseq(time,chargei,0,start,samp1,63,0) %pltnum=pltnum+1; fourseq(time,bipolar_i,0,start,samp1,63,0)
pltnum=pltnum+1;
if bipolar evalprbs2(v,bipolar_i,time,ylim1,s1,samp1,N,winder); legend('bipolar PRBS') evalprbs2(v,bipolar_i,time,ylim2,s2,samp2,N,winder); legend('bipolar PRBS') evalprbs2(v,bipolar_i,time,ylim3,s3,samp3,N,winder); legend('bipolar PRBS') evalprbs2(v,bipolar_i,time,ylim4,s4,samp4,N,winder); legend('bipolar PRBS') evalprbs2(v,bipolar_i,time,ylim5,s5,samp5,N,winder); legend('bipolar PRBS') evalprbs2(v,bipolar_i,time,ylim6,s6,samp6,N,winder); legend('bipolar PRBS') evalprbs2(v,bipolar_i,time,ylim7,s7,samp7,N,winder); legend('bipolar PRBS') evalprbs2(v,bipolar_i,time,ylim8,s8,samp8,N,winder); legend('bipolar PRBS') %%%fft full results
%evalprbs2(v,bipolar_i,time,1,s1,(f8/N),N,winder); f8
else end
if charge evalprbs2(v,chargei,time,1,s1,samp1,N,winder); evalprbs2(v,chargei,time,ylim,s2,samp2,N,winder); evalprbs2(v,chargei,time,ylim,s3,samp3,N,winder);
350
evalprbs2(v,chargei,time,ylim,s4,samp4,N,winder); evalprbs2(v,chargei,time,ylim,s5,samp5,N,winder); evalprbs2(v,chargei,time,ylim,s6,samp6,N,winder); evalprbs2(v,chargei,time,ylim,s7,samp7,N,winder); evalprbs2(v,chargei,time,ylim,s8,samp8,N,winder);
else end
if discharge evalprbs2(v,dischargei,time,1,s1,samp1,N,winder); evalprbs2(v,dischargei,time,ylim,s2,samp2,N,winder); evalprbs2(v,dischargei,time,ylim,s3,samp3,N,winder); evalprbs2(v,dischargei,time,ylim,s4,samp4,N,winder); evalprbs2(v,dischargei,time,ylim,s5,samp5,N,winder); evalprbs2(v,dischargei,time,ylim,s6,samp6,N,winder); evalprbs2(v,dischargei,time,ylim,s7,samp7,N,winder); evalprbs2(v,dischargei,time,ylim,s8,samp8,N,winder); else
end

351
15.8.9 evalprbs2.m
%% evalprbs1 - Andrew Fairweather 17th July 2009 %% evalprbs2 - 2010 - 2014 modified to process later test data %% 2014 called by multi PRBS %% this routine evaluates the results of imported data from a
PRBS battery %% experiment – data starts are pre defined in the test data
%% workspace
function result=evalprbs2(V,I,time,ylim,start,sample,N,winder); %close all; finish=((N*sample)+start) xlim=(1/sample)*10000; global graphnum iin=I(start:finish)*1; %% scaling for LEM 50mV/Amp vout=V(start:finish); tout=time(start:finish); vin=iin; tin=time(start:finish); [infft]=four(tin,vin,winder); [outfft]=four(tout,vout,winder); incomp=infft(2,:).*(cos(infft(3,:))+i*sin(infft(3,:))); outcomp=outfft(2,:).*(cos(outfft(3,:))+i*sin(outfft(3,:))); tfcomp=outcomp./incomp;
xxxx=(infft(1,:)/2/pi); yyyy=(abs(tfcomp)); infftmag=infft(2,:); outfftmag=outfft(2,:); ifreqw=infft(1,:); ifr=ifreqw/2/pi; ofreqw=outfft(1,:); ofr=ofreqw/2/pi;
figure subplot(6,2,1),plot(vin) grid subplot(6,2,2),plot(vout) grid subplot(6,2,3),semilogx(ifr,infftmag) grid subplot(6,2,4),semilogx(ofr,outfftmag) grid subplot(6,2,5),semilogx(xxxx,yyyy); axis([0,xlim,0,ylim]); grid; title([' start ' num2str(start) ' Sample size ' num2str(sample)
]); xlabel('Hz'); ylabel('Z'); tightfig
%% this bit stores the variables for use in plotting the %% graphs

352
%% graphnum is a counter which increments each time the %% evalprbs is called
global xout1 xout2 xout3 xout4 xout5 xout6 xout7 xout8 global yout1 yout2 yout3 yout4 yout5 yout6 yout7 yout8 if graphnum==1 xout1=xxxx yout1=yyyy else end if graphnum==2 xout2=xxxx yout2=yyyy else end if graphnum==3 xout3=xxxx yout3=yyyy else end if graphnum==4 xout4=xxxx yout4=yyyy else end if graphnum==5 xout5=xxxx yout5=yyyy else end if graphnum==6 xout6=xxxx yout6=yyyy else end if graphnum==7 xout7=xxxx yout7=yyyy else end if graphnum==8 xout8=xxxx yout8=yyyy else en graphnum=graphnum+1

353
15.8.10 curve_fit.m
%%%%%%%%%%%%%%%%%%%%%% % Filename curve_fit.m % Loads a previously saved impedance response % then compares to the chosen model % with parameters chosen by the user % to provide an iterative curve fit % by inspection
%Models %1 = Randles %2 = Parallel model developed during Ultrabattery work %3 = Parallel branch model with Ri outside of the parallel
branch
%notes added 16/05/2015 reference Thesis chapters and models
used %Chapter 5 - Model 1 (no specific curve fits used in text) %Chapter 6 - Model 2 (with Ri = Rec + Rint OR Ri = Red + Rint) %Chapter 7 - Model 2 (with Ri = Rec + Rint OR Ri = Red + Rint) %Chapter 8 - Model 3 (with Ri = Re + Ri) %Chapter 9 - Model 3 (with Ri = Re + Ri) %Chapter 10 - Model 2 (with Ri = Rec + Rint OR Ri = Red + Rint) %Chapter 11 - Model 3 (with Ri = Re + Ri)
impplot = input('Input filename of impedance plot '); modelno = input('Which model to use? 1=Randles, 2=Parallel
model (Ultrabattery), 3=Parallel branch model ') modelparams=input('Input model parameters in brackets separated
by a space in order Ri,Rt,Cs,Rd,Cb,Cparallel,Rparallel '); % use a zero for Cparallel, Rparallel if not used %C1=Cparallel; %R1=Rparallel;
Ri=modelparams(1) Rt=modelparams(2) Cs=modelparams(3) Rd=modelparams(4) Cb=modelparams(5) C1=modelparams(6) R1=modelparams(7) %example array = [5e-3 6e-3 15 5000 88400 1 5e-3] %example array = [5e-3 5e-3 15 5000 88000 0.1e-6 5e-3]
H = HGLOAD(impplot)
hold on% allow figure to overlay on impedance plot
f=logspace(-6,4,500); for ind=1:500
if modelno==1
354
% Randles s=2*pi*f(ind)*i; Xs=1/(s*Cs); Zs=1/(1/Rt+1/Xs); Xb=1/(s*Cb); Zb=1/(1/Rd+1/Xb); Z(ind)=Ri+Zs+Zb; else end
if modelno==2 % Ultrabattery model
s=2*pi*f(ind)*i; Xs=1/(s*Cs); Zs=1/(1/Rt+1/Xs); Xb=1/(s*Cb); Zb=1/(1/Rd+1/Xb); Zr=Ri+Zs+Zb; %parallel branch Xc1=1/(s*C1); Zp=R1+Xc1;
Z(ind)=(Zp*Zr/Zp+Zr); else end
if modelno==3 %additional series network between cbulk and csurface %zx is the impedance of c1 and r1 in the new network
s=2*pi*f(ind)*i; Xs=1/(s*Cs); Zs=1/(1/Rt+1/Xs); Xb=1/(s*Cb); Zb=1/(1/Rd+1/Xb); %addition of parallel cx rx Xc1=1/(s*C1); Zp=R1+Xc1;
Zr1=Zs+Zb Zt=Ri+(Zr1*Zp)/(Zr1+Zp);
% Z(ind)=Zt; Z(ind)=Ri+(Zr1*Zp)/(Zr1+Zp); else end end

355
15.9 Embedded PRBS code
15.9.1 prbs3.c
//*****************************************************************************
// PRBS gen with frequency change
// Hardware: Microchip DSpic explorer 16 development board
// Andrew Fairweather
// 26/02/2010
//*****************************************************************************
//*****************************************************************************
//modified to run with /8 prescale in timer 1 init allowing lower frequency PRBS
// multi_prbs3.c - modified to remove header
// multi_prbs4.c - comments added for clarity
//#include <p30f6014.h> //processor include
#include <p33FJ256GP710.h>
#include "lcd.h"
#include "common.h"
_FOSCSEL(FNOSC_PRIPLL);
_FOSC(FCKSM_CSDCMD & OSCIOFNC_OFF & POSCMD_XT);
_FWDT(FWDTEN_OFF);
// program start
int main(void)
//****** initialise and setup port **********
int loop_1;
int n;
int nn;
int nnn;
int nnnn;
int seq_len;
int freq;
int tt;
int a;
int b;
int c;
int d;
int e;
int f;
int g;
int h;
int switch_flag1;
int switch_flag2;
int debounce;
int z;
a=0x0001;
b=0x0001;
c=0x0001;
d=0x0001;
e=0x0001;
f=0x0001;
g=0x0001;
h=0x0001;
z = 0;
rtc_lcd_update = 0;
timer_2_flg = 0;
switch_flag1=0;

356
switch_flag2=0;
//PRBS Arrays
//******************************4 bit PRBS array************************************
// unsigned char
prbs_out_1[15]=1,1,1,0,1,1,0,0,1,0,1,0,0,0,0;
//******************************6 bit sequence with 16 bit header*******************
// unsigned char
prbs_out_1[80]=1,1,1,1,1,1,1,1,1,1,1,1,1,1,1,1,0,0,1,0,1,1,1,0,0,0,1,1,0,1,1,0,1,0,0
,1,0,0,0,1,0,0,1,1,0,0,1,0,1,0,1,0,0,0,0,0,0,1,1,1,1,1,0,1,1,1,1,0,0,1,1,1,0,1,0,1,1,
0,0,0;//1 bit added because the seqence terminates early
//**************************6 bit sequence with no header (Bipolar)******************
unsigned char
prbs_out_1[64]=0,0,1,0,1,1,1,0,0,0,1,1,0,1,1,0,1,0,0,1,0,0,0,1,0,0,1,1,0,0,1,0,1,0,1
,0,0,0,0,0,0,1,1,1,1,1,0,1,1,1,1,0,0,1,1,1,0,1,0,1,1,0,0,0;//1 bit added because the
seqence terminates early
//TRISD=0x00; //set the port as outputs
loop_1=10;
// seq_len=80; //actual sequence is 15 but loop
adds 1
seq_len=64; //actual sequence is 15 but loop
adds 1
n=1;
nn=1;
nnn=1;
nnnn=1;
freq=0;
debounce=0;
TRISA=0x00; //set the port as outputs
TRISD=0XFF; //set port D as inputs
PORTA=0x00; // clear port B
//PORTAbits.RA6=1;
Init_Timer1();
Init_Timer2();
while(1) //run forever
//Switch1 code
*************************************************************************
if (PORTDbits.RD6==0)
PR1= 0x0800;
PORTA=0x00;
else
if (PORTDbits.RD7==1) //switch code (PRBS mode set, HF/LF)
if (PORTDbits.RD7&&switch_flag1==1)
switch_flag1=0;
// debounce=0;
else
switch_flag1=1;
//debounce=0;

357
else
if (switch_flag1==1)
PORTAbits.RA2=1;
else
PORTAbits.RA2=0;
//Switch2 code
*************************************************************************
if (PORTDbits.RD6==1) //switch code (ON/OFF)
if (PORTDbits.RD6&&switch_flag2==1)
switch_flag2=0;
else
switch_flag2=1;
else
if (switch_flag2==1)
//PORTAbits.RA3=1;
else
//PORTAbits.RA3=0;
//***********************************************************************************
**
//Frequency select
********************************************************************
//if (switch_flag1)
//if (z)
if (PORTDbits.RD7)
PORTAbits.RA3=1;
PORTAbits.RA4=0;
a=0x4000;
b=0x2000;
c=0x1000;
d=0x0800;
e=0x0400;
f=0x0200;
g=0x0100;
h=0x0001;
else
PORTAbits.RA4=1;
PORTAbits.RA3=0;
a=0x0800;
b=0x0200;
c=0x00A0;
d=0x0051;
e=0x0025;
f=0x0012;
g=0x00E;
h=0x0001;
358
//PRBS section
***********************************************************************
if (rtc_lcd_update)
if (PORTAbits.RA1==1) //clock indicator
PORTAbits.RA1=0;
else
PORTAbits.RA1=1;
PORTAbits.RA0=prbs_out_1[n];
// PORTA=prbs_out_1[n]; //porta loaded with variable
n from array
n++;
rtc_lcd_update = 0;
timer_2_flg =0;
if (n==seq_len)
// PORTA=0;
n=1;
nn=1;
nnn=1;
nnnn=1;
if (PR1==h)
PR1 = a;
else if(PR1==a)
PR1 = b;
else if(PR1==b)
PR1 = c;
else if(PR1==c)
PR1= d;
else if(PR1==d)
PR1= e;
else if(PR1==e)
PR1= f;
else if(PR1==f)
PR1= g;
else if (PR1==g)
PR1= h;


![Adaptive PDE Observer for Battery SOC/SOH Estimation via an …faculty.ce.berkeley.edu/moura/pubs/JDSMC-AdaptObsSOCSOH.pdf · Electrolyte Li Concentration, [kmol/m 3] 3Space, x ce(x;](https://static.cupdf.com/doc/110x72/5eb81ec83edb16212c219145/adaptive-pde-observer-for-battery-socsoh-estimation-via-an-electrolyte-li-concentration.jpg)


![Méthodologie de conception State-of-the-art SoC atpeople.rennes.inria.fr/Olivier.Sentieys/teach/HLS_chap1_transfo.pdf · [L. Ducousso, ST, GDR SoC] State-of-the-art SoC at •HDTV](https://static.cupdf.com/doc/110x72/6045f661cf8aa06fef29998b/mthodologie-de-conception-state-of-the-art-soc-l-ducousso-st-gdr-soc-state-of-the-art.jpg)